Introductory Statistical Concepts

Introductory Statistical Concepts. Disclaimer – I am not an expert SAS programmer. – Nothing that I say is confirmed or denied by Texas A&M University.
Dec 26, 2015
Welcome message from author
This document is posted to help you gain knowledge. Please leave a comment to let me know what you think about it! Share it to your friends and learn new things together.
Transcript
Introductory Statistical Concepts
Disclaimer
– I am not an expert SAS programmer.– Nothing that I say is confirmed or denied by Texas
A&M University.
2

Why Are We Here?
• Deming– To Learn– To Have Fun
Question: Who was Deming?
3

Poll: What type of organization do you Poll: What type of organization do you work for?work for?
• [PlaceWare Multiple Choice Poll. Use PlaceWare > Edit Slide Properties... to edit.]
• Business• Government• Education• Nonprofit• Other
4

Purpose of These Lectures
• A review of the statistical concepts used in most of the SAS Analytics Lecture Series.
• We will look at questions such as the following:
– What is the nature of statistical analyses?– Why are population parameters so important?– What is really being tested when you see a p-value?– Why does regression handle missing data so well?– What are residual analyses?
5
Descriptive Statistics

7
The Population
(Very important concepts)
Variable of Interest
The DistributionParameters
Mean Mode RangeMedian Variance
Etc
Learning Outcomes• You will learn
– basic statistical concepts– the definition of mean, median, mode and standard deviation– the difference between populations and samples– the difference between parameters and estimates– about confidence intervals– how to test a statistical hypothesis– how to run a regression analysis
8

Parameters
• Characteristics of the variable of interest
• It is how we describe the variable of interest
• Parameters are unknown
9
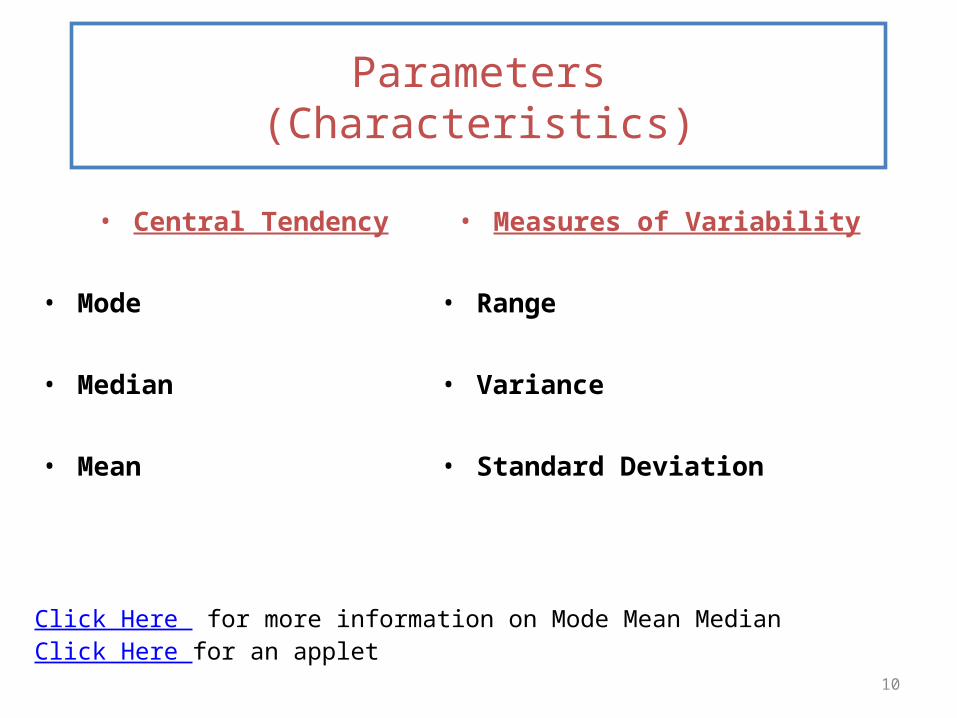
Parameters(Characteristics)
• Central Tendency
• Mode
• Median
• Mean
• Measures of Variability
• Range
• Variance
• Standard Deviation
10
Click Here for more information on Mode Mean MedianClick Here for an applet

Variability
Change in the Data
12
What is an Index ?
How SUNNY is SUNNY?
THE UV Index
Click Here
13
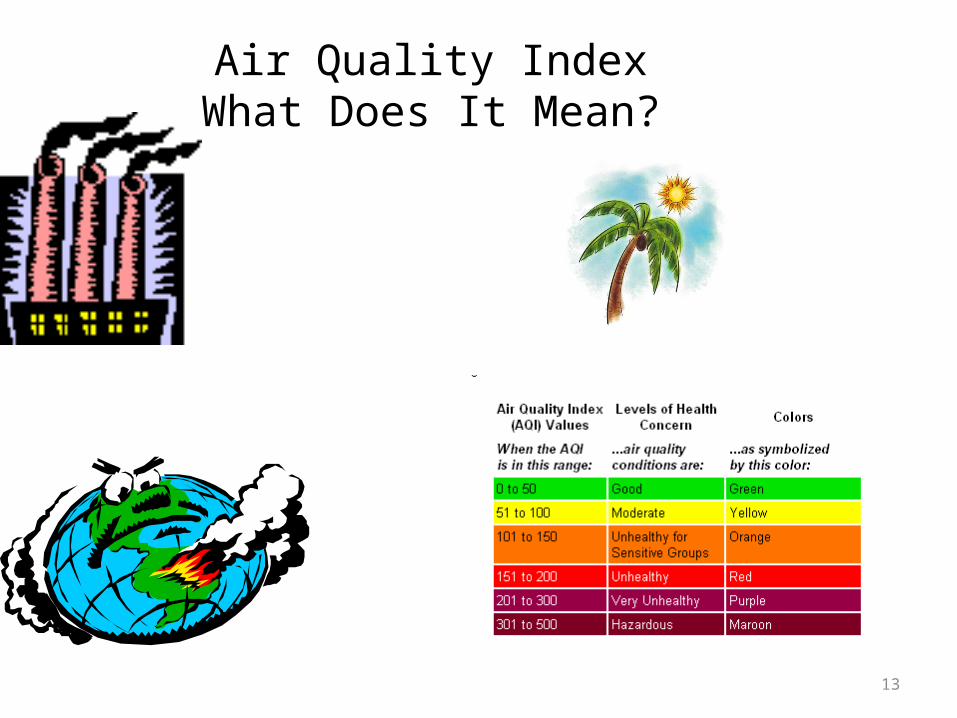
Air Quality IndexWhat Does It Mean?
DOW JONES INDUSTRIAL AVERAGE INDEX
14
What does 10,971.16 really mean?
What is “better” a DJIA of 10,000 Or a DJIA of 12,000?
Variability Index
• A Simple One
• Find the Largest Value
• Find the Smallest Value
• Let Range = R = Largest – Smallest
15

A More Complex Variation Index
• The Standard Deviation
• Statisticians use this index to indicate variability
• You will see it written as
• Widely available from SAS, Excel, and other statistical packages
16
or S or s
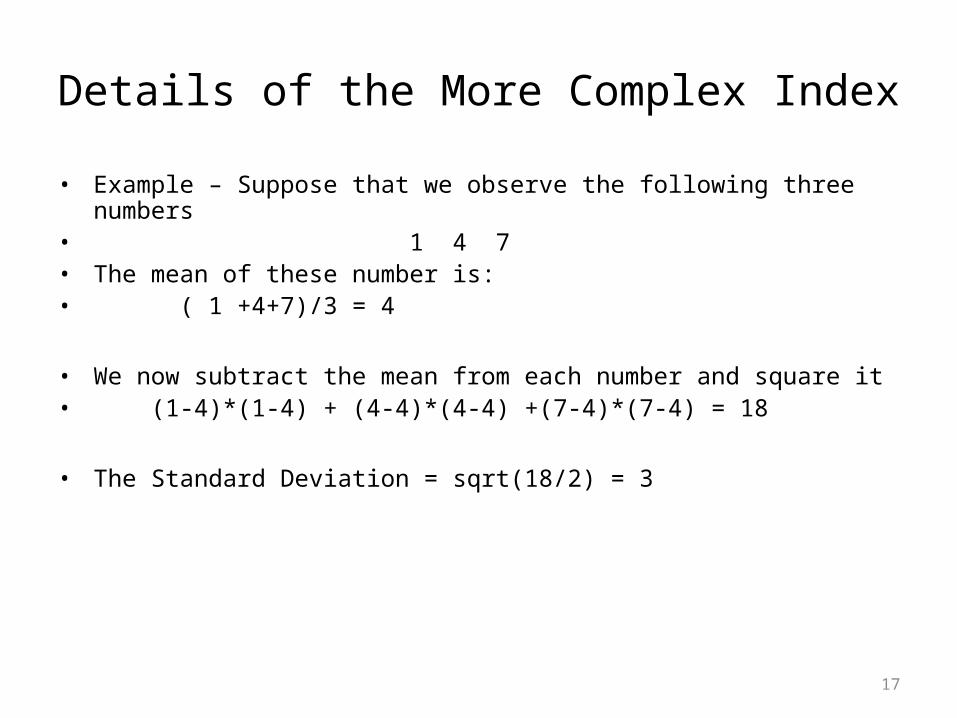
Details of the More Complex Index
• Example – Suppose that we observe the following three numbers• 1 4 7• The mean of these number is:• ( 1 +4+7)/3 = 4
• We now subtract the mean from each number and square it• (1-4)*(1-4) + (4-4)*(4-4) +(7-4)*(7-4) = 18
• The Standard Deviation = sqrt(18/2) = 3
17

What does this Mean?
• By itself , it may be confusing to some.
• Comparing populations, we can use it to say which population varies the most.
• Let us look at an applet – Click Here
18

Using Graphs to Determine Variability• Box Plot• Click Here
3535N =
State
NEW_YORKCALIFORN
To
tal V
iole
nt
Cri
me
400000
300000
200000
100000
0
19

Distributions
Known Distribution
• With a known distribution, we know the following:– the shape– the mean– the variability (standard deviation)– and/or some other information
21

Classical Distributions─Normal
22

Normal─Overlay
23

Classical Distributions─Uniform
24

Survey
• The following are called parameters of the population:– mean, median, mode– variance, standard deviation, range, inter-quartile range
(IQR)
• In general, are these known or unknown?– Known = yes (select using your seat indicator)– Unknown = no (select using your seat indicator)
25
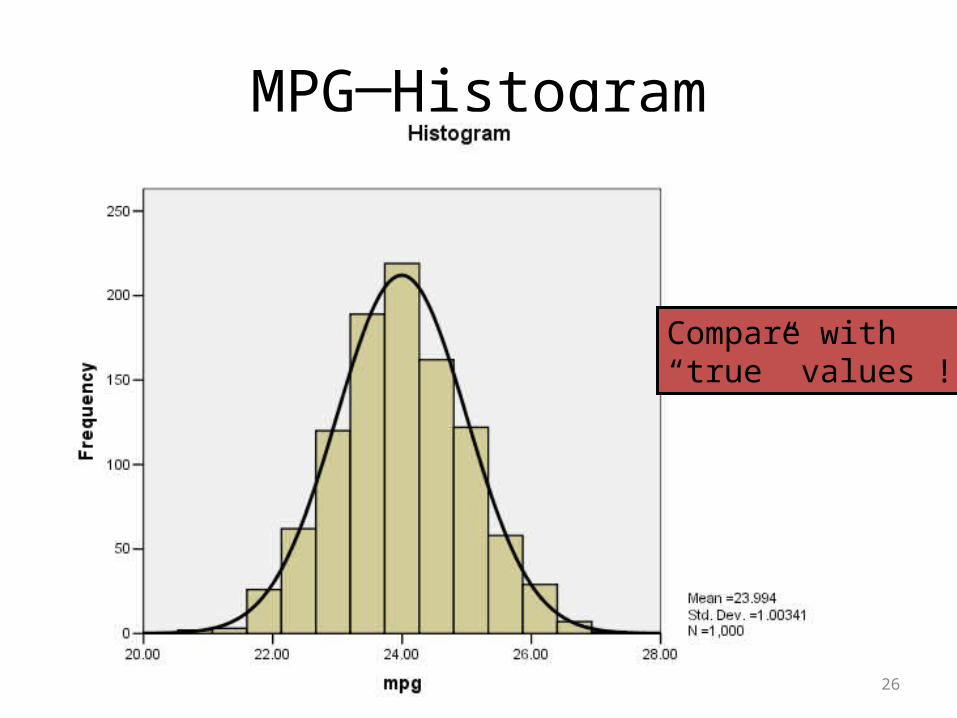
MPG─Histogram
26
Compare with“true” values !
Simulated Sample
• In this example, we simulated taking a sample of size 1000 from one population of cars weighing 3000 pounds with a normal distribution with mean=24 and standard deviation=1.
• You can practice this after class.
27
Section 1.2
Populations and Samples
Objectives
– Understand the relationships between• populations and samples• parameters and estimates.
– Look at an overview of hypotheses testing.
29

Population
30
Mean, Variance, Median, Mode, Distribution, …
Parameters
Example
• Mpg of American-made cars that weigh between 2000 and 3500 pounds and were built in the 1970s.
• Parameters – mean, variance, and so on
• In general, we do not know the parameters.
31
Purpose of Statistical Analyses– Estimate the parameters. (Make guesses.)
• Example: What is the population mean?
– Test hypothesis about the parameters. (Ask questions.)
• Example: Is the population mean=30mpg?
32
Role of Samples
– Taking a sample of the population enables you to• make estimates of the population parameters• answer the questions about the population
parameters.
33
Population and Sample
34
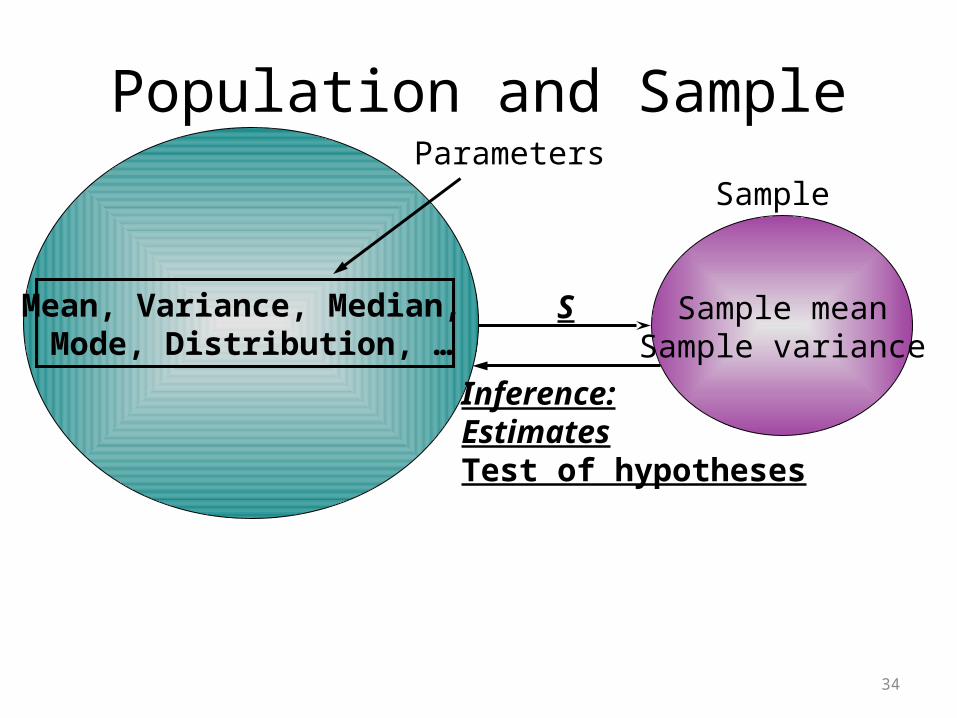
Mean, Variance, Median, Mode, Distribution, …
Parameters
Sample meanSample variance
Sample
S
Inference:EstimatesTest of hypotheses
Example: cars_american
• This is a sample of American-made cars that weigh between 2000 and 3500 pounds and that were built in the 1970s.
• We are interested in the mpg.
• Use summary statistics to analyze the data.
35

Results of Summary Statistics
36
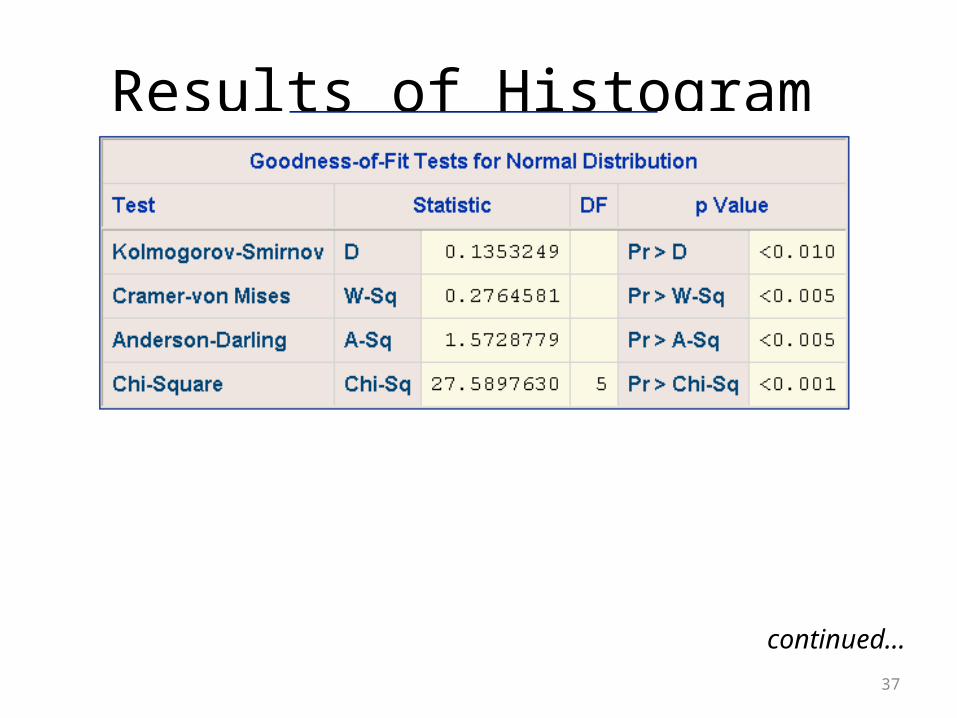
Results of Histogram
37
continued...

Results of Histogram
38

Sampling Distribution Applet sampling_dist
• This demonstration illustrates how to estimate and plot the sampling distribution of various statistics.
39

View/Application Share: Demo: View/Application Share: Demo: Sampling Distributions AppletSampling Distributions Applet
• [PlaceWare View/Application Share. Use PlaceWare > Edit Slide Properties... to edit.]
40
http://www.ruf.rice.edu/~lane/http://www.ruf.rice.edu/~lane/stat_sim/sampling_dist/index.h...stat_sim/sampling_dist/index.h...
• [PlaceWare Web Page. Use PlaceWare > Edit Slide Properties... to edit.]
41

Confidence Intervals on the Population Mean
• Level of Comfort
• 50% {21.57 to 22.21}
• 95% {20.96 to 22.82}
• 99.9% {20.30 to 23.48}
42
What does this mean?

Test That the Population Mean = 30 mpg
• Use t-test One Sample t-test
• Requirements for running this test:– Large n > 35– Or leftovers are normal
• What is the p-value or sig value?
43
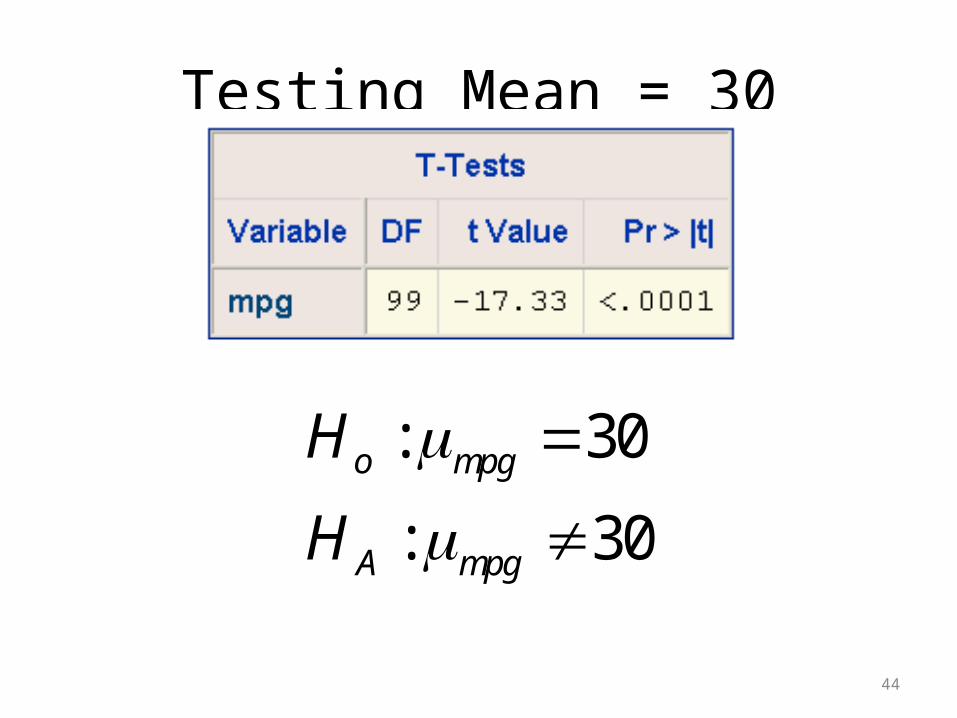
Testing Mean = 30
: 30
: 30
o mpg
A mpg
H
H
44

Conclusions of the Test
• Choose an alpha level, usually alpha=.05.
• If sig<alpha, then reject.
• Otherwise, fail to reject.
45
Sig and p-values• When you see a sig value or p-value:
– You know that some hypothesis is being tested.– You know whether or not the hypothesis is being
rejected.– You probably do not know what the hypothesis
really is.
• Ask yourself these questions:– What are the population parameters being tested?– How is what is being tested related to those
parameters?46
Requirements for Doing This Test
• Large n n > 35
• Or leftovers are normally distributed.
• Use Histogram to test for normality.
47

Populations─Which Ones are Similar?
48
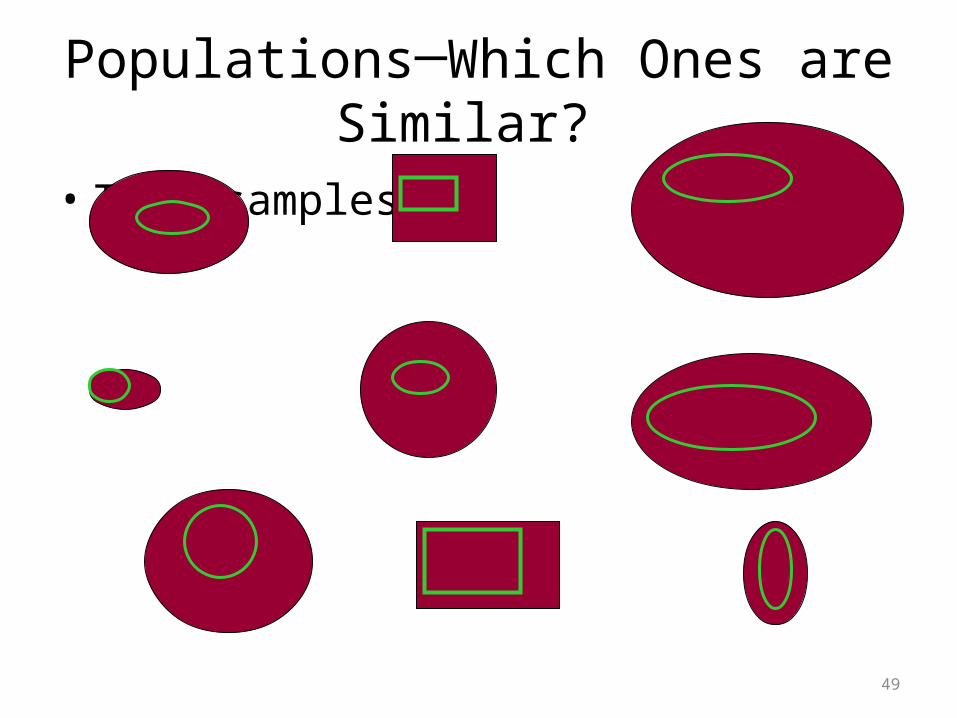
Populations─Which Ones are Similar?
• Take samples.
49

Take Samples• Use the samples to answer this question:• “Which populations are similar?”
• Statistical translations:• “Which populations are similar?” is the same as asking…
• Are the following the same:– distribution?– mean?– variance?
50

Background/Requirements
• Before we jump into the analysis, we must ask the following questions:– How many populations are there?– How many population parameters are we
interested in and what are they?– What tests do we want to do, and what are the
requirements for doing those?– Are we using everything we “know?”
51
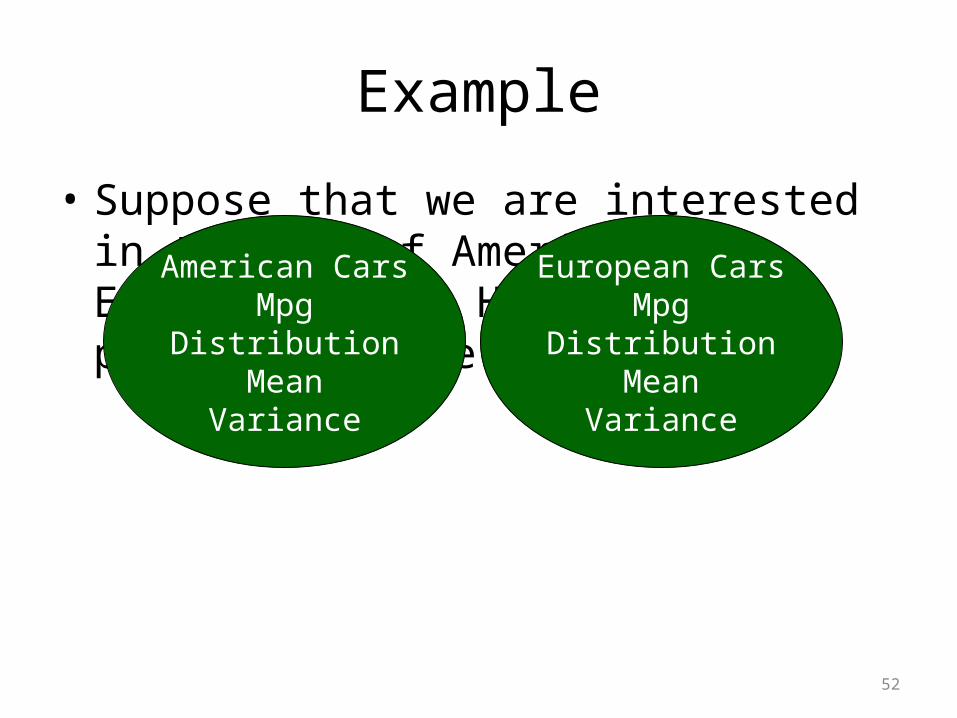
Example
• Suppose that we are interested in the mpg of American and European cars. How many populations are there?
52
American CarsMpg
DistributionMean
Variance
European CarsMpg
DistributionMean
Variance

Poll: How many populations are there?Poll: How many populations are there?• [PlaceWare Multiple Choice Poll. Use PlaceWare > Edit Slide Properties... to edit.]
• One - MPG• Two - American and European• Depends on the sample size
53

ParametersPopulation 1 Population 2
American Cars European Cars
Variable of interest: mpg Variable of interest: mpg
Distribution: Normal? Distribution: Normal?
Mean: Mean:
Variance: Variance:
54
A E2A 2
E
Analyses
1. We want to look at the distributions.2. We want to estimate the parameters.3. We want to answer these questions:
• Are the populations means the same?• Are the population variances the same?
55

Example: Our Data Set car_am_eu
• Suppose that we are interested in the mpg of American and European cars.
56
Sample
American CarsMpg
DistributionMean
Variance
European CarsMpg
DistributionMean
Variance
Sample
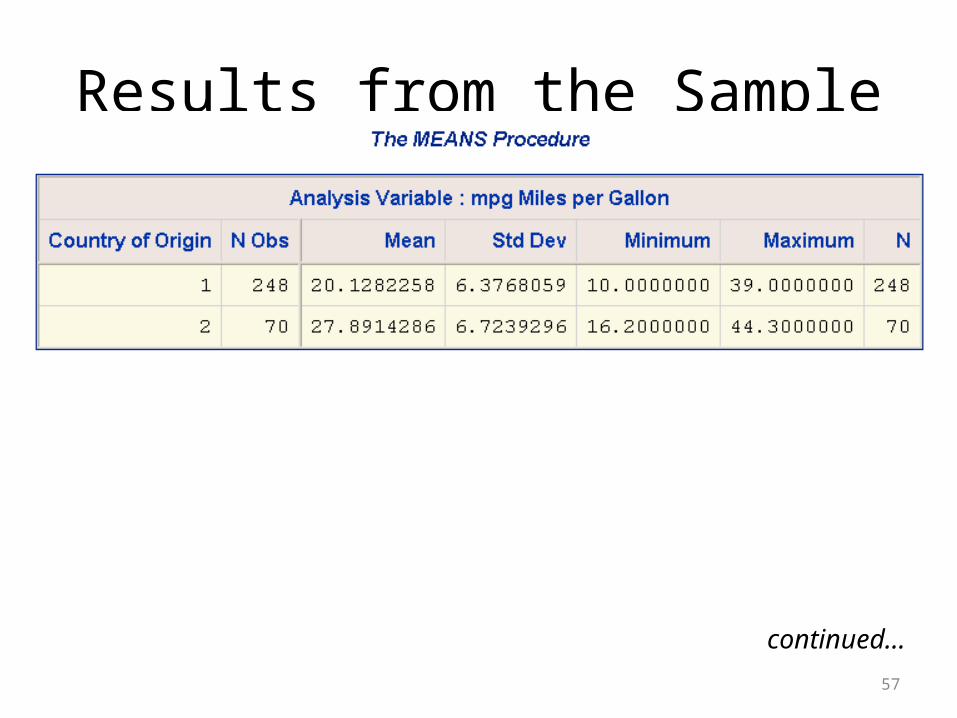
Results from the Sample
57
continued...
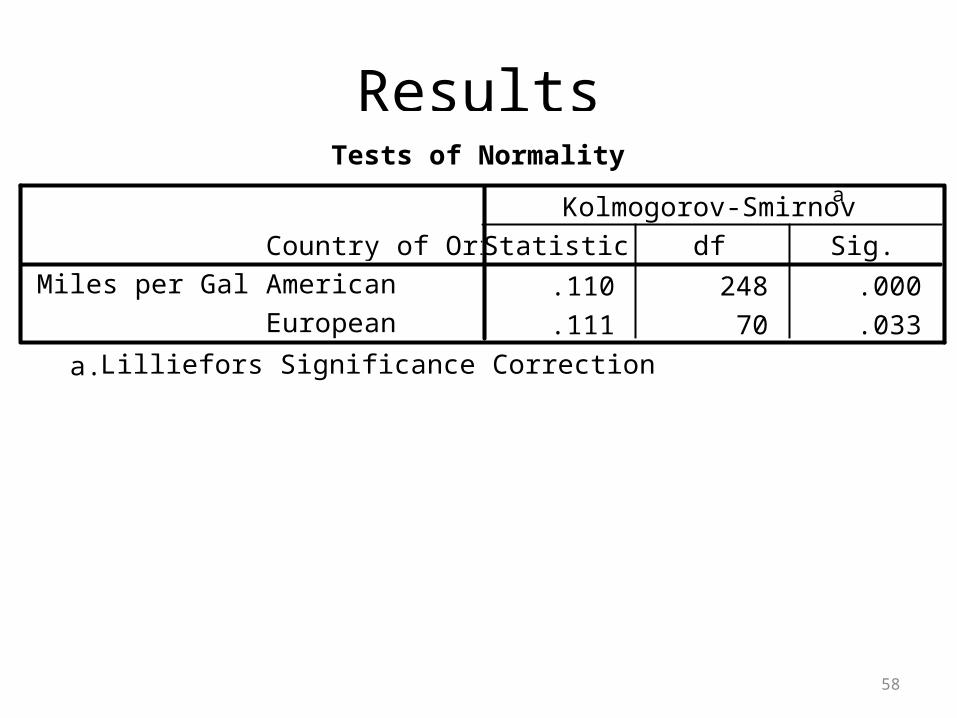
Results
58
Tests of Normality
.110 248 .000
.111 70 .033
Country of OriginAmerican
European
Miles per GallonStatistic df Sig.
Kolmogorov-Smirnova
Lilliefors Significance Correctiona.
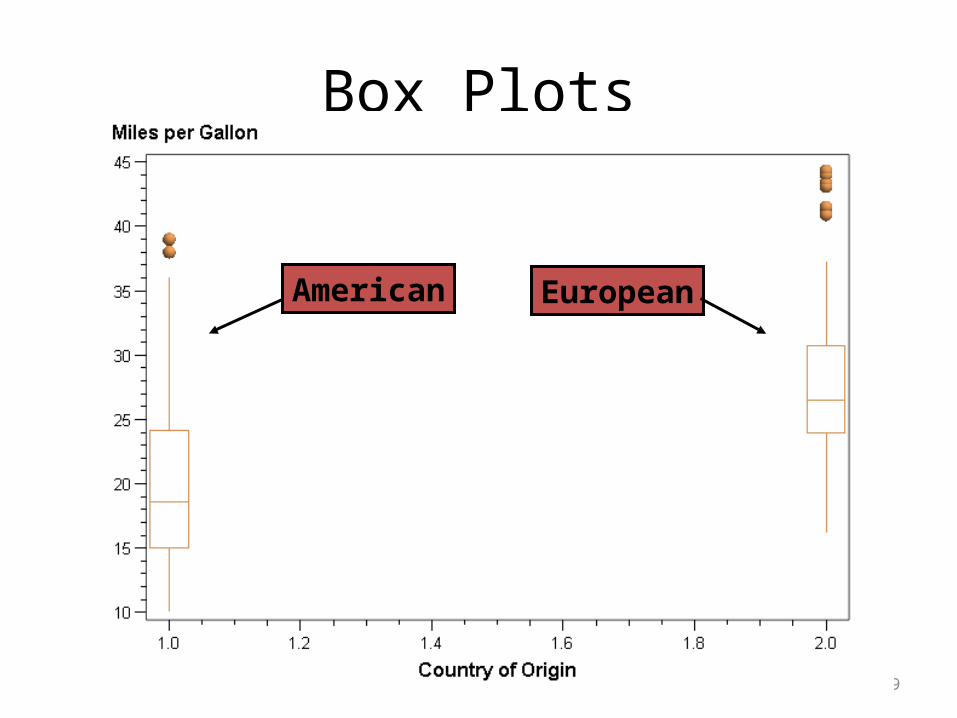
Box Plots
59
American European

Histograms
60
American
European

Poll: Are the populations the same?Poll: Are the populations the same?• [PlaceWare Yes/No Poll. Use PlaceWare > Edit Slide Properties... to edit.]
• Yes• No
61
Conclusion Based on Sample Numbers and Graphs
• Easy -- Based on the samples, the populations are different—no statistical jargon
• But I must have a p-value for my boss, for my paper, and so on.
62

Formal Tests
• The classical approach in determining whether two populations are the same is to test to see whether the two population means are equal.
• But first we check to see whether the two population variances are equal:
•
63
2 2:o A EH :o A EH
continued...
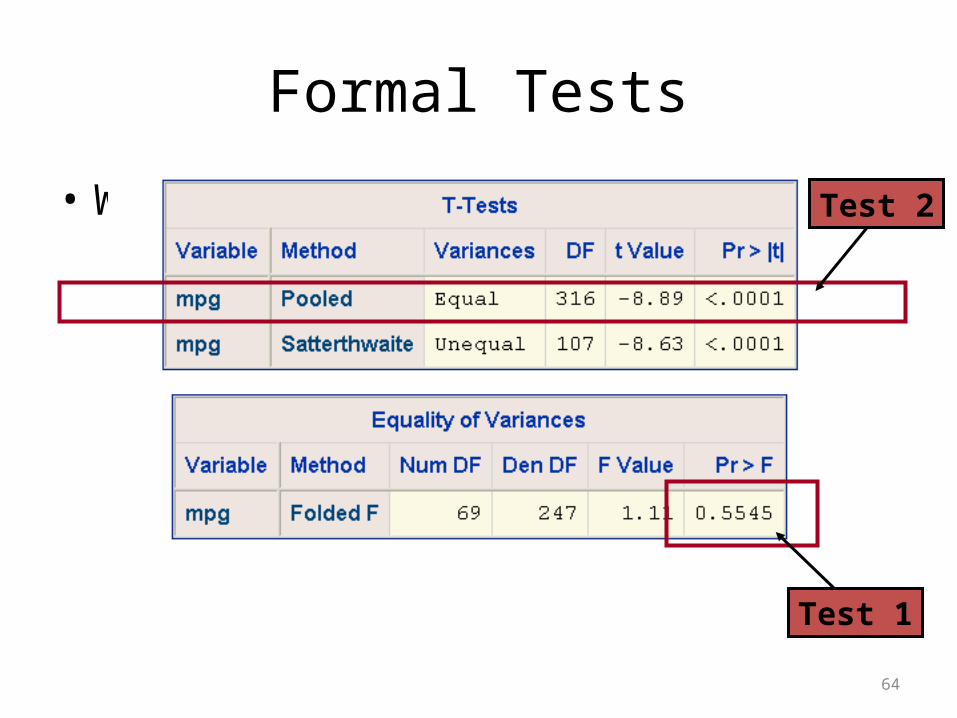
Formal Tests
• We use t-test Two Sample.
64
Test 2
Test 1

Section 1.3
Simple Linear Regression
Objectives
– Identify the following: • the population parameters• the appropriate model• number of populations sampled• the correct hypotheses • what should be tested for normality• what “equal variances” means.
66
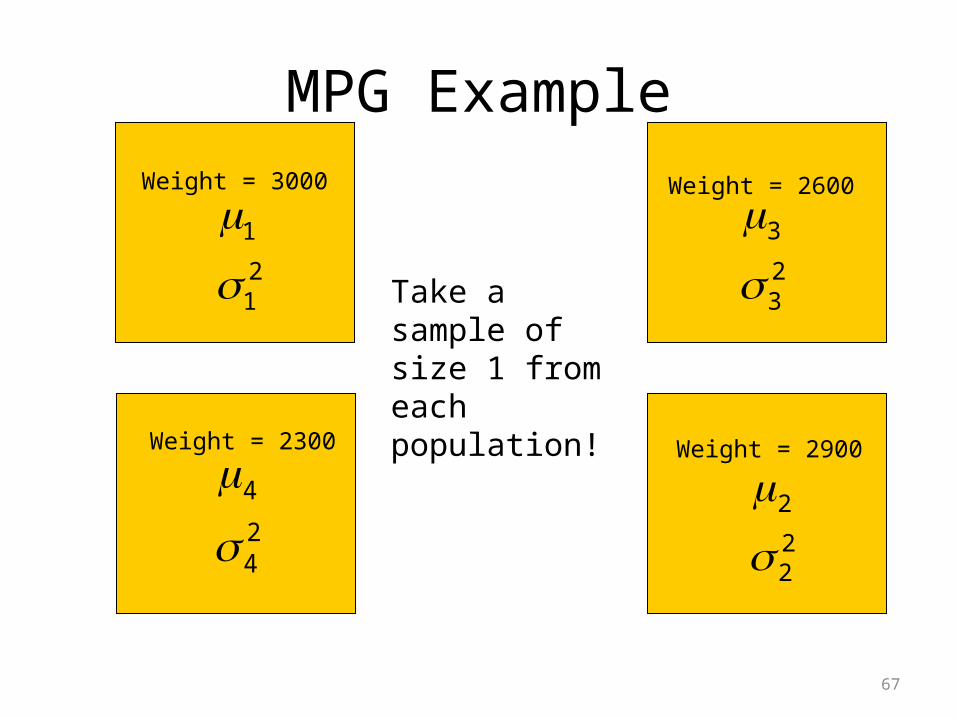
MPG Example
67
Weight = 3000
1
21
3
23
2
22
4
24
Weight = 2600
Weight = 2900Weight = 2300
Take a sample of size 1 from each population!

Data
• We should be in deep trouble with one sample from each population.
• We have eight unknown population parameters.
• Can you name them?
• But what do we “know”?
68
Survey
• Name the population parameters.
69

Essential Part and Leftovers• We want to “model” the data as follows:
• MPG = Essential Part + Leftover• or• MPG = Mean + Leftover
70

“Know” or Assumptions• First, we “know” that
• Second, each population mean is related to weight by the following:
• The population means fall on a straight line!!
• How many unknowns are there now?
71

Poll: How many unknowns are there?Poll: How many unknowns are there?• [PlaceWare Multiple Choice Poll. Use PlaceWare > Edit Slide Properties... to edit.]
• 1• 2• 3• 4• 5• n
72
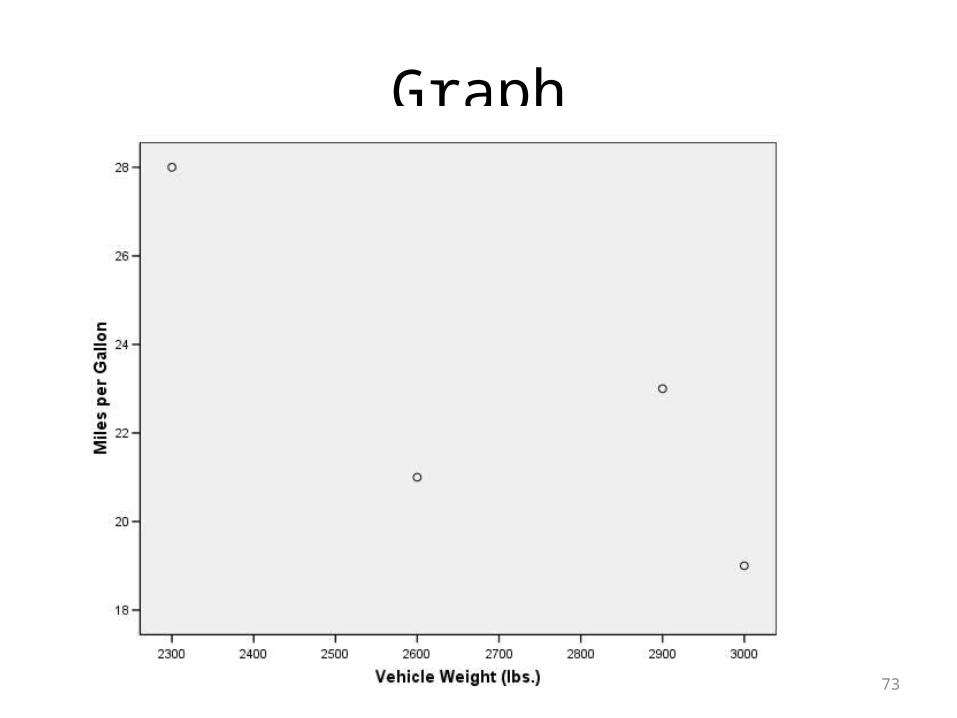
Graph
73
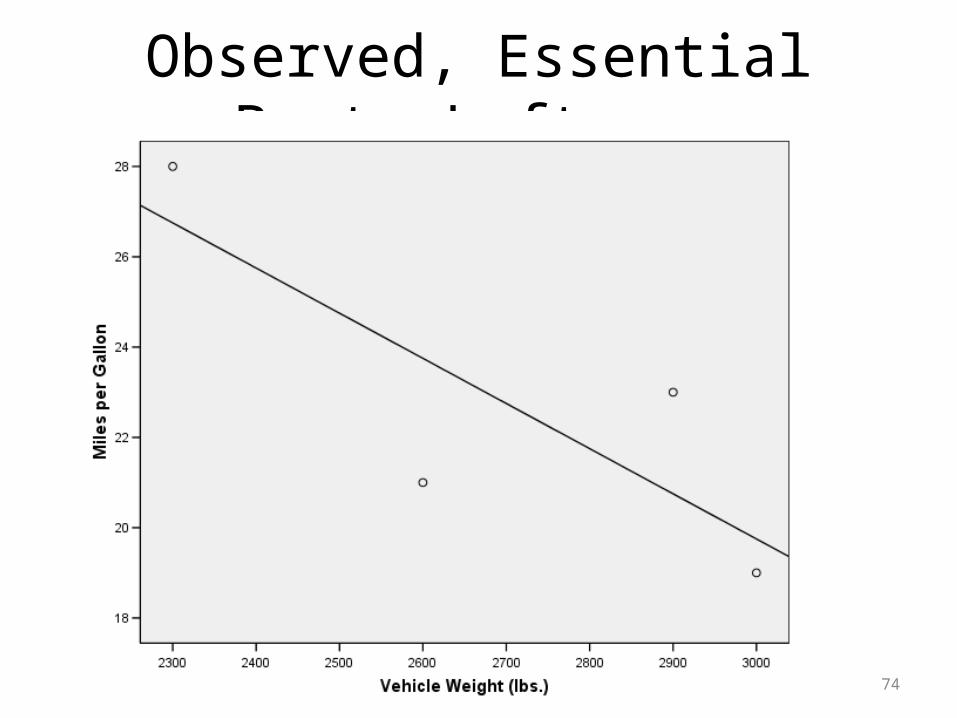
Observed, Essential Part, Leftover
74

The Official Regression Model
• or
• or
• or
75
The errors are “known” to be normal with mean 0 and variance . 2
Main Assumptions
• The means of the populations fall on a straight line.
• All of the variances are equal ( ).
• The errors are “known” to be normal with mean 0 and variance .
76
2
2

Assumptions for Simple Linear Regression
Appendix A
• This demonstration illustrates the fundamental concepts of simple linear regression.
77

View/Application Share: Demo: View/Application Share: Demo: Linear.docLinear.doc
• [PlaceWare View/Application Share. Use PlaceWare > Edit Slide Properties... to edit.]
78

How Can We Estimate the Unknown Parameters?
• The Principle of Least Squares:
• or
• or
• Now, choose a and b so that is as small as possible.
• or• Minimize .
79
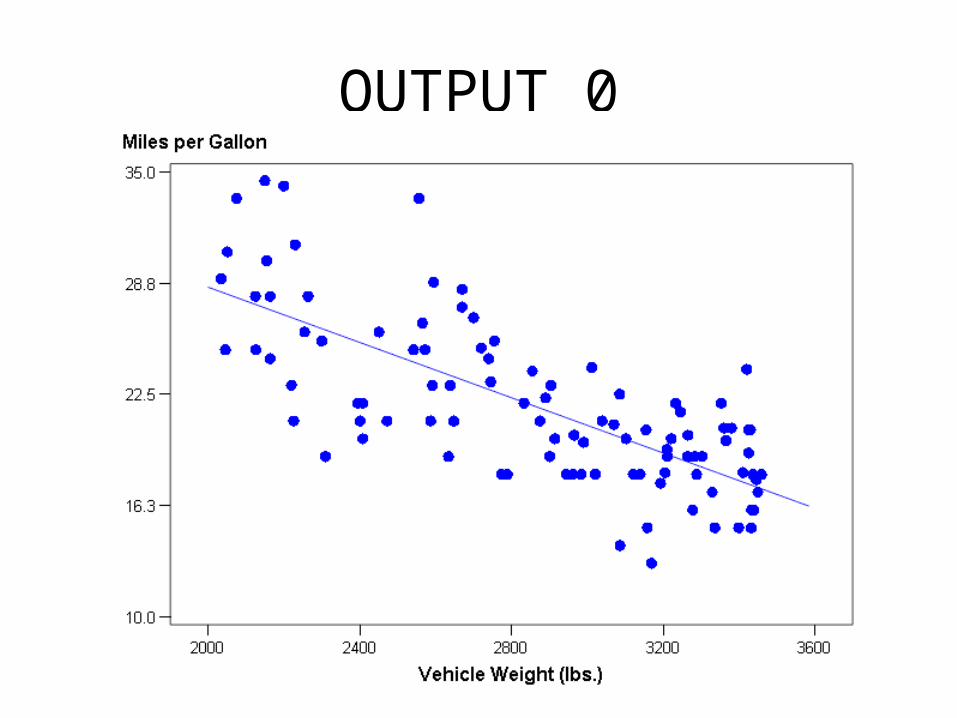
OUTPUT_0
80
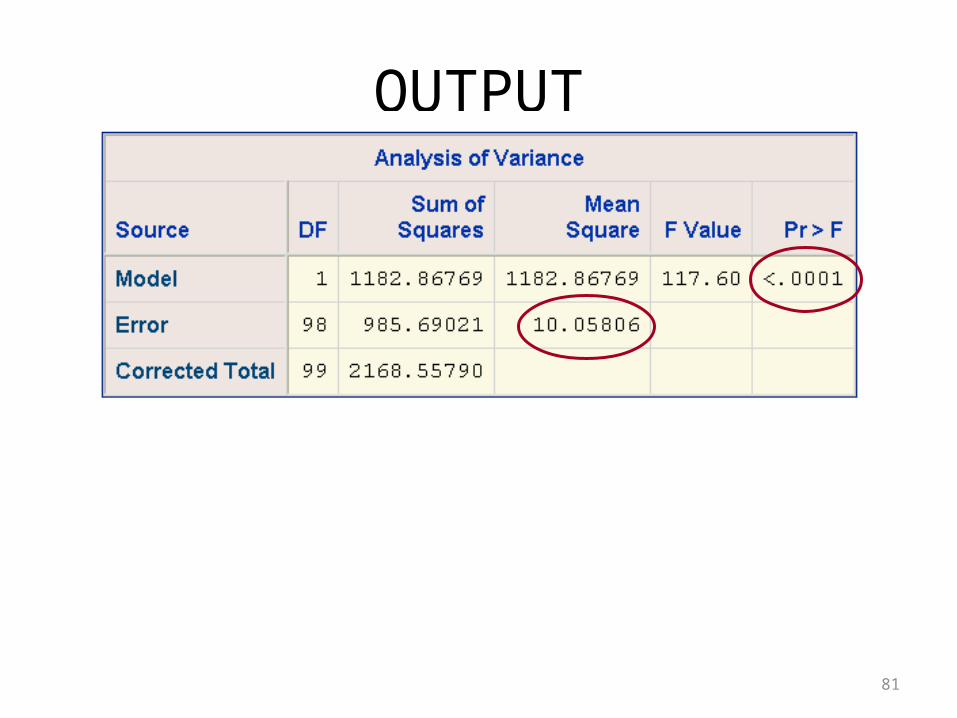
OUTPUT
81
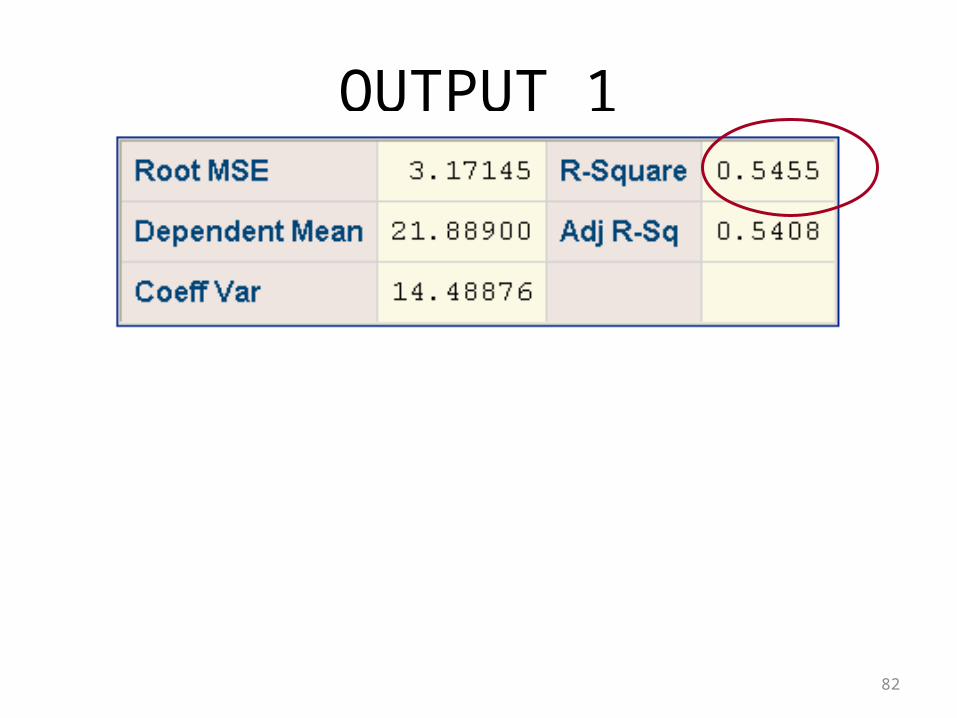
OUTPUT_1
82
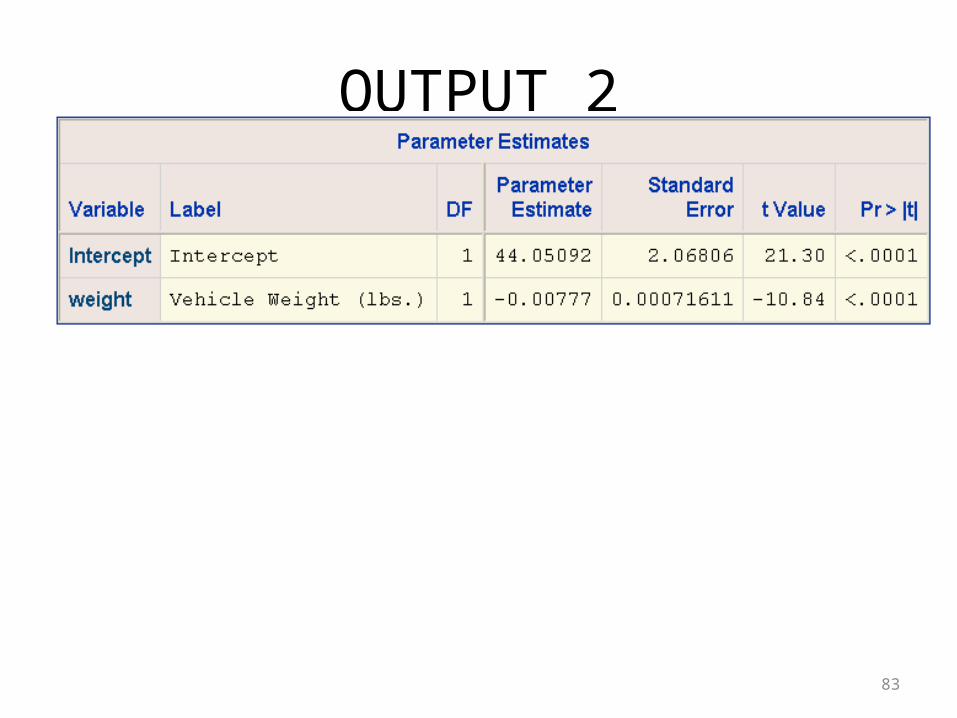
OUTPUT_2
83

OUTPUT_3
84
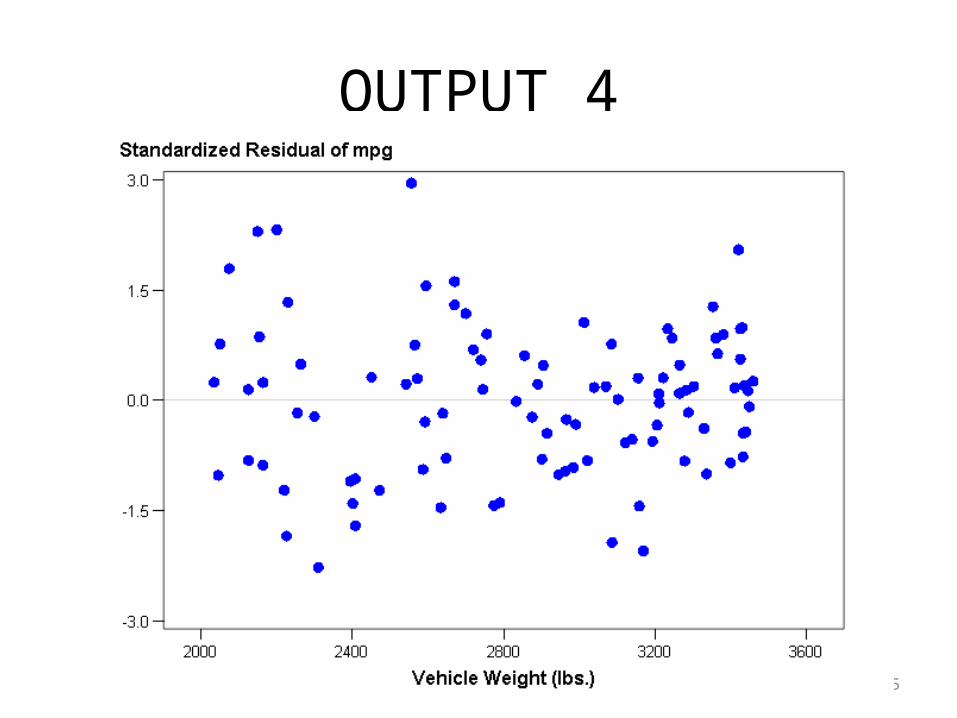
OUTPUT_4
85

Missing Values
• Suppose that we want to estimate the mean mpg when weight=2500.
• Predicted (Estimated) Mean MPG = 44.05 - .0078*weight
• Why does this work?
86

Survey
• Can anyone explain why this works?
87

Conclusion
– Simple linear regression is very powerful.
– But it is based on assumptions (what we “know”).
– We need to check assumptions (residual analyses).
88
Related Documents