WATER RESOURCES DATA FOR WASHINGTON 2001 1 INTRODUCTION The Washington Water Science Center of the U.S. Geological Survey (USGS), in cooperation with State, local, and other Federal agencies, obtains a large amount of data pertaining to the water resources of Washington each water year. These data, accumulated during many water years, constitute a valuable data base for developing an improved understanding of the water resources of the State. To make these data readily available to interested parties outside the Geological Survey, the data are published annually in this report series entitled "Water Resources Data– Washington." This report includes records on both surface and ground water in the State. The report contains discharge records for 239 stream-gaging stations, stage only records for 9 gaging stations, discharge measurements for 449 miscellaneous streamflow stations, and annual maximum discharge for 4 crest-stage partial-record streamflow stations; stage and (or) contents records for 36 lakes and reservoirs; water-quality records for 40 surface-water sites; water-level records for 37 observation wells; and water quality records for 11 observation wells. This series of annual reports for Washington began with the 1961 water year with a report that contained only data relating to the quantities of surface water. For the 1964 water year, a similar report was introduced that contained only data relating to water quality. Beginning with the 1975 water year, the report format was changed to present, in one volume, data on quantities of surface water, quality of surface and ground water, and ground-water levels. Prior to introduction of this series and for several water years concurrent with it, water-resources data for Washington were published in U.S. Geological Survey Water-Supply Papers. Data on stream discharge and stage and on lake or reservoir contents and stage, through September 1960, were published annually under the title "Surface-Water Supply of the United States, Parts 12, 13, and 14." For the 1961 through 1970 water years, the data were published in two 5-year reports. Data on chemical quality, temperature, and suspended sediment for the 1941 through 1970 water years were published annually under the title "Quality of Surface Waters of the United States," and water levels for the 1935 through 1974 water years were published under the title "Ground-Water Levels in the United States." These Water-Supply Papers may be consulted in the libraries of the principal cities of the United States, or if not out of print, may be purchased from the U.S. Geological Survey, Branch of Information Services, Federal Center, Box 25286, Denver, CO 80225. Publications similar to this report are published annually by the USGS for all states. These official Survey reports have an identification number consisting of the two-letter State abbreviation, the last two digits of the water year, and the volume number. For example, this report is identified as "U.S. Geological Survey Water-Data Report WA-01-1." For archiving and general distribution, the reports for 1971-74 water years also are identified as water-data reports. These water-data reports are for sale in paper copy or in microfiche by the National Technical Information Service, U.S. Department of Commerce, Springfield, VA 22161. Additional information, including current prices, for ordering specific reports may be obtained from the Information Specialist at the address given on back of title page or by telephone (253) 428-3600. The USGS is continually updating the availability of its information on the internet. Current streamflow conditions (via satellite) for Washington and other water-resource information can be found at the following Universal Resource Locator (URL): http://wa.water.usgs.gov. Nationwide information on water resources, including real- time and historic streamflow data, water-use data, publications and USGS program activities, can be found at URL: http://water.usgs.gov.

Welcome message from author
This document is posted to help you gain knowledge. Please leave a comment to let me know what you think about it! Share it to your friends and learn new things together.
Transcript
WATER RESOURCES DATA FOR WASHINGTON 2001 1
INTRODUCTION
The Washington Water Science Center of the U.S. Geological Survey (USGS), in cooperation with State, local,and other Federal agencies, obtains a large amount of data pertaining to the water resources of Washington each wateryear. These data, accumulated during many water years, constitute a valuable data base for developing an improvedunderstanding of the water resources of the State. To make these data readily available to interested parties outsidethe Geological Survey, the data are published annually in this report series entitled "Water Resources Data–Washington."
This report includes records on both surface and ground water in the State. The report contains dischargerecords for 239 stream-gaging stations, stage only records for 9 gaging stations, discharge measurements for 449miscellaneous streamflow stations, and annual maximum discharge for 4 crest-stage partial-record streamflowstations; stage and (or) contents records for 36 lakes and reservoirs; water-quality records for 40 surface-water sites;water-level records for 37 observation wells; and water quality records for 11 observation wells.
This series of annual reports for Washington began with the 1961 water year with a report that contained onlydata relating to the quantities of surface water. For the 1964 water year, a similar report was introduced that containedonly data relating to water quality. Beginning with the 1975 water year, the report format was changed to present, inone volume, data on quantities of surface water, quality of surface and ground water, and ground-water levels.
Prior to introduction of this series and for several water years concurrent with it, water-resources data forWashington were published in U.S. Geological Survey Water-Supply Papers. Data on stream discharge and stage andon lake or reservoir contents and stage, through September 1960, were published annually under the title"Surface-Water Supply of the United States, Parts 12, 13, and 14." For the 1961 through 1970 water years, the datawere published in two 5-year reports. Data on chemical quality, temperature, and suspended sediment for the 1941through 1970 water years were published annually under the title "Quality of Surface Waters of the United States," andwater levels for the 1935 through 1974 water years were published under the title "Ground-Water Levels in the UnitedStates." These Water-Supply Papers may be consulted in the libraries of the principal cities of the United States, or ifnot out of print, may be purchased from the U.S. Geological Survey, Branch of Information Services, Federal Center,Box 25286, Denver, CO 80225.
Publications similar to this report are published annually by the USGS for all states. These official Surveyreports have an identification number consisting of the two-letter State abbreviation, the last two digits of the wateryear, and the volume number. For example, this report is identified as "U.S. Geological Survey Water-Data ReportWA-01-1." For archiving and general distribution, the reports for 1971-74 water years also are identified as water-datareports. These water-data reports are for sale in paper copy or in microfiche by the National Technical InformationService, U.S. Department of Commerce, Springfield, VA 22161.
Additional information, including current prices, for ordering specific reports may be obtained from theInformation Specialist at the address given on back of title page or by telephone (253) 428-3600.
The USGS is continually updating the availability of its information on the internet. Current streamflowconditions (via satellite) for Washington and other water-resource information can be found at the following UniversalResource Locator (URL): http://wa.water.usgs.gov. Nationwide information on water resources, including real-time and historic streamflow data, water-use data, publications and USGS program activities, can be found atURL: http://water.usgs.gov.

2 WATER RESOURCES DATA FOR WASHINGTON 2001
COOPERATION
The U.S. Geological Survey, in cooperation with Tribes and State and local agencies within the State ofWashington, have had joint-funding agreements for the systematic collection of surface-water, ground-water, andwater-quality records since 1909. Organizations that supplied data are acknowledged in the station descriptions.Organizations that assisted in collecting data through joint-funding agreements with the Survey are:
Washington State Department of Ecology
Washington State Department of General Administration
Asotin County
Chelan County Conservation District
Chelan County, P.U.D. No. 1
Douglas County, P.U.D. No. 1
King County, Department of Public Works
Kitsap County
Lewis County, Department of Public Works
Mason County
Okanogan County
Pierce County, Department of Public Works
Skagit County Public Works Department
Snohomish County Department of Public Works
Snohomish County, P.U.D. No. 1
Spokane County, WQMP
Spokane County Conservation District
Stevens County Conservation District
Thurston County Department of Water and Waste Management
Whatcom County
City of Bellevue, Department of Public Works, Storm and Surface Water Utility
City of Bellingham
City of Kent
City of Lakewood, Public Works Department
Lakewood Water District
City of Port Townsend
City of Seattle, City Light Department
City of Seattle, Seattle Water Department
City of Spokane, Wastewater Management Division
City of Tacoma, Department of Public Utilities
City of Tacoma, Department of Public Works, Sewer Utility Division
Coeur D’Alene Tribe
Jamestown S’Klallam Tribe
Lummi Tribe
Makah Nation
Nisqually Indian Tribe
Nooksack Tribe
Quileute Tribe
Quinault Indian Nation
Skokomish Tribe of Indians
Spokane Tribe
Tulalip Tribes
Umatilla Tribal Council
Yakama Tribal Council
Assistance in the form of funds or services in collecting records was given by the Corps of Engineers,U.S. Army; U.S. Department of State; Bonneville Power Administration, U.S. Department of Energy; Bureau ofReclamation; Bureau of Indian Affairs; U.S. Department of Interior; U.S. Fish and Wildlife Service; and the U.S.Environmental Protection Agency.
The following organizations aided in collecting records for stations under Federal Energy RegulatoryCommission licenses:
City of Seattle; Lewis County P.U.D.; P.U.D. No. 1 of Chelan County, City of Tacoma Department of PublicUtilities; P.U.D. No. 1 of Pend Oreille County; P.U.D. No. 1 of Grant County; P.U.D. No. 1 of Douglas County; PugetSound Energy; Snohomish County P.U.D. No. 1; Cowlitz County P.U.D.; Avista Corporation; Hydro TechnologySystems, and Pacific Power.
WATER RESOURCES DATA FOR WASHINGTON 2001 3
SUMMARY OF HYDROLOGIC CONDITIONS
Hydrologic Setting
A distinctively varied climate characterizes Washington and results primarily from two features: (1) theCascade Range, and (2) the prevailing marine influence of the Pacific Ocean (fig. 1). The north-south trendingCascade Range divides Washington into two areas: the wet western part and the dry eastern part. Average annualprecipitation west of the Cascade Range is about 70 inches and ranges from about 30 to 40 inches in the Puget SoundBasin to about 150 to 200 inches on the western slopes of the Olympic Mountains, where temperate rain foreststhrive. The Cascade Range acts as a barrier to air masses that move across the State producing 100 to 150 inches ofannual precipitation on the high western slopes of the Cascade Range, leaving much less moisture in the clouds foreastern Washington. Average annual precipitation in eastern Washington is only 7 to 40 inches, with the driest partbeing the Columbia Basin (fig. 1), where sagebrush and grasses grow and irrigation is required for most crops. Abouttwo-thirds of the precipitation in Washington occurs from October to March, either as rain in the lowlands or as snowat high elevations. Occasionally during winter, western Washington receives large amounts of rainfall from Pacificstorms accompanied by mild temperatures. The combination of melting snowpack at high elevations and rainfallduring these storms can produce flooding in the lowlands. Snowpack and glaciers in the Olympic Mountains andCascade Range are sources of water for many rivers in Washington and become the primary source of flow during therelatively dry summer.
Washington’s varied climate and topography results in variable streamflow patterns throughout the State asshown in the graphs of daily mean discharge for selected long-term gaging stations (figs. 1 and 2, table 1). Dailymean discharge at the Chehalis River near Grand Mound (fig. 2A) is representative of the streamflow patterns in thesouthwest lowlands of the State, where seasonal high flow occurs from November to March, coinciding with thetypical winter rainfall. Flow normally decreases through the spring and summer months due to the generally dryweather and absence of snowpack. Daily mean discharge at the Quinault River at Quinault Lake (fig. 2B) isrepresentative of the Olympic Peninsula. Two seasonal peak periods at this gaging station result from winter rainfallfrom November to January and late spring snowmelt from high altitudes in May and June. Winter rainfall and springsnowmelt in the East Fork Lewis River near Heisson in the southern Cascade Range overlap to produce a high-flowseason that generally extends from November to May (fig. 2C). High flow in the Nooksack River at Deming(fig. 2D) is generated by rainfall in winter and again in May and June from a combination of spring rainfall and snow-melt. Daily mean discharge at Puyallup River near Orting (fig. 2E) is representative of the typical winter rainfall ofthe central Cascade Range and a late spring snowmelt sustained by the permanent snowfields and glaciers on the westslope of the Cascade Range.
Peak flows in rivers draining the east side of the Cascade Range, such as the Wenatchee River at Plain(fig. 2F), normally occur in April to July as a result of snowmelt. Streamflow during the winter generally stays lowdue to freezing weather that maintains or contributes to the snowpack; exceptions occur when mild weather andheavy rain combine to cause flooding. Daily mean discharge at Ahtanum Creek at Union Gap (fig. 2G) and theWalla Walla River near Touchet (fig. 2H) are representative of agricultural drainage basins in the lower ColumbiaBasin where irrigation-return flows cause an increase in discharge from August to winter. During winter, high flowsare sustained by a combination of precipitation and return flows. The daily mean discharge at Hangman Creek atSpokane (fig. 2I) is representative of rivers draining the eastern Washington highlands where a combination ofprecipitation and melting snow produces maximum discharge in late winter and early spring.
Hydrologic Conditions for 2001
Precipitation in water year 2001 was about 62 percent of the long-term average in western Washington (westof the Cascade Range). Annual precipitation east of the Cascade Range ranged from about 56 percent of average incentral and northeastern Washington to about 76 percent of average in the southeastern corner of the State. The snow-pack in Washington during water year 2001 generally was near 60 percent of the long-term average with somelocations in southwest Washington, the central Cascade Range, and the Olympic Peninsula recording about 70 ofpercent average. Snowpack was at a maximum for most locations in early May.
4W
AT
ER
RE
SOU
RC
ES D
AT
A FO
R W
ASH
ING
TO
N 2001
Figure 1. Selected stream-gaging stations and drainage basins in Washington.

WATER RESOURCES DATA FOR WASHINGTON 2001 5
Figure 2. Daily mean discharge for water year 2001 compared with the percentile distribution of daily meandischarges for the period of record, for selected stream-gaging stations. Daily mean discharges equal to or greaterthan the 25th percentile and equal to or less than the 75th percentile are within the normal range of flow.

6 WATER RESOURCES DATA FOR WASHINGTON 2001
Figure 2. Continued

WATER RESOURCES DATA FOR WASHINGTON 2001 7
Figure 2. Continued

8 WATER RESOURCES DATA FOR WASHINGTON 2001
Table 1. Selected stream-gaging stations in Washington
Letter infigure 2
Stationnumber
Stream-gaging stationPeriod of
record
Annual mean streamflow,2001 water year
Streamflow,in cubic feetper second
Percentage oflong-term
mean
A 12027500 Chehalis River near Grand Mound 1929-2001 1,166 42
B 12039500 Quinault River at Quinault Lake 1912-2001 1,972 69
C 14222500 East Fork Lewis River near Heisson 1930-2001 411 56
D 12210500 Nooksack River at Deming 1935-2001 2,364 71
E 12093500 Puyallup River near Orting 1932-2001 513 72
F 12457000 Wenatchee River at Plain 1911-1929,1931-79,
1990-2001
1,133 50
G 12502500 Ahtanum Creek at Union Gap 1961-2001 22 28
H 14018500 Walla Walla River near Touchet 1952-2001 409 71
I 12424000 Hangman Creek at Spokane 1948-2001 84 36
Annual mean streamflow in Washington during water year 2001 ranged primarily from below average tosignificantly less than average, as indicated by data collected at selected long-term gaging stations (fig. 1, table 1).Annual mean streamflow for these stations ranged from 28 to 72 percent of the long-term average, and at three of thestations, East Fork Lewis River near Heisson, Puyallup River near Orting and Wenatchee River at Plain (figs. 2C,E and F) new record lows in annual mean streamflow were recorded. The East Fork Lewis River near Heisson andPuyallup River near Orting gages recorded new record low monthly mean discharges in December, January, Februaryand March; and November, June and July also were record low months at the East Fork Lewis River gage.
Daily mean discharge was within or below the normal range of flow during most of water year 2001, thoughperiodically above normal as a result of intermittent precipitation-runoff events (fig. 2A - I). In western Washingtonstreams (fig. 2A-E), daily mean discharge was generally below the normal range of flow during the period ofNovember through March. Daily mean discharge above the normal range of flow occurred in early October, May andlate August, primarily as a result of storm runoff. The maximum daily mean discharge in most western Washingtonstreams occurred between January and March during the typical winter rain season. In two eastern Washingtonstreams, Wenatchee River at Plain and Ahtanum Creek at Union Gap (figs. 2F and G), daily mean discharge wasbelow the normal range for most of the 2001 water year. Conversely, daily mean discharge at Walla Walla Rivernear Touchet and Hangman Creek near Spokane (figs. 2H and I), though lower than average, was generally within thenormal range of flow throughout the year. The maximum daily mean discharge in most eastern Washington streamsoccurred between February and May. A single precipitation-runoff event in early October caused daily meandischarge peaks above normal at most gaging stations in eastern Washington (figs. 2F, G and H).

WATER RESOURCES DATA FOR WASHINGTON 2001 9
Surface-Water Quality
The National Water-Quality Assessment (NAWQA) program was established to assess the current water-quality conditions for a large part of the Nation’s freshwater streams, rivers, and aquifers and to describe how waterquality is changing over time. In 2001, Washington operated eight long-term surface-water-quality NAWQA stationsthroughout the state. Five of the stations are located in eastern Washington (Lind Coulee at State Route 17, PalouseRiver at Hooper, Crab Creek at Rocky Ford Road, Yakima River at Kiona, and Granger Drain at Granger) and arerepresentative of agricultural land use; and three are in western Washington, one which represents urban land use(Thornton Creek near Seattle), one which integrates mixed land use for which the samples are collected at a sitelocally influenced by urban land use (Duwamish River at Tukwila), and one which represents relatively pristineconditions (North Fork Skokomish River near Hoodsport). In addition to these NAWQA stations, the WashingtonWater Science Center also continued operation of two long-term monitoring sites on the middle Columbia River(Columbia River at Richland and Columbia River near Priest Rapids Dam). The Lind Coulee station was discon-tinued in February 2001 and the data are not used in any of the descriptive statistics.
Specific conductance generally has an inverse relation to streamflow. Specific conductance at the surface-water NAWQA and Columbia River stations during 2001 ranged from an average of 87 microsiemens on the NorthFork Skokomish near Hoodsport to an average of 498 microsiemens at Granger Drain. The largest value of specificconductance during 2001 was 709 microsiemens in a sample from Granger Drain during November and the smallestvalue of specific conductance was 67 microsiemens in a sample from both the North Fork Skokomish and theDuwamish River at Tukwila during May. The average specific conductance for all stations sampled was268 microsiemens.
Like specific conductance, dissolved-solids concentration and streamflow generally have an inverse relation.The smallest concentrations of dissolved solids usually occur during the high flows of late fall and winter and earlyspring runoff, when rainfall and snowmelt are the major sources of water. Dissolved solids in western Washington areusually most concentrated during late summer and early fall, when base flow from ground-water sources is thedominant component of flow; but in eastern Washington, dissolved solids may be more concentrated during theirrigation season due to return irrigation flows. The concentrations of dissolved solids during 2001 ranged from anaverage of 53 mg/L at the North Fork Skokomish to an average of 303 mg/L at Granger Drain. The largest concentra-tion of dissolved solids during 2001 was 433 mg/L in a sample from Granger Drain during March and the smallestconcentration of dissolved solids was 44 mg/L in samples from the North Fork Skokomish during both May and June.
Surface waters in Washington generally are classified as clear and carry only small amounts of sedimentexcept where influenced by glaciers, unconsolidated volcanic deposits, or disturbed soils. Water flowing in theColumbia River is very low in sediment, usually less than 10 mg/L, and at times, there is no measurable sediment.The streams east of the Cascades that characteristically carry sediment concentrations greater than 10 mg/L are thosethat carry return flow from heavily irrigated and farmed lands in the semiarid region. Concentrations of suspendedsediment in samples from the Columbia River during 2001 ranged from 1 to 5 mg/L. Concentrations of suspendedsediment in samples from NAWQA stations ranged from an average of 2 mg/L at the North Fork Skokomish to anaverage of 58 mg/L at Palouse River at Hooper. Samples from the Palouse River at Hooper had the largest sedimentconcentrations (ranging from 2 to 348 mg/L, with an average of 58 mg/L).
Twenty-four different pesticides or metabolites (degradation products) were detected in samples collectedfrom the 7 NAWQA surface-water stations during the 2001 water year. The herbicides atrazine and simazine, as wellas the metabolite deethylatrazine, were the pesticides detected most frequently in samples from the NAWQA stationsin eastern and western Washington. Samples collected from the reference station North Fork Skokomish had nodetections of pesticides. Samples collected from the Duwamish River and Thornton Creek, contained 3 and 4 pesti-cides, respectively. Samples from both sites contained the insecticides carbaryl and diazinon; samples from ThorntonCreek also contained the herbicides prometon and simazine, and samples from the Duwamish River containeddeethylatrazine, a metabolite of the herbicide atrazine. Concentrations in samples from these urban sites ranged fromat or near the limit of detection to a maximum of 0.007 micrograms per liter (µg/L) and 0.072 µg/L for the insecticidecarbaryl, respectively.

10 WATER RESOURCES DATA FOR WASHINGTON 2001
Five herbicides, an insecticide, and an herbicide metabolite were detected in samples from Crab Creek atRocky Ford Road, ranging in concentration from at or near the limit of detection to a maximum concentration of0.012 µg/L for the herbicide triallate. Seven herbicides, 2 insecticides, and 1 herbicide metabolite were detected insamples from Palouse River at Hooper, ranging in concentration from at or near the limit of detection to a maximumconcentration of 0.144 µg/L for triallate. Nine herbicides, 4 insecticides, and 1 herbicide metabolite were detected insamples from Yakima River at Kiona, with a maximum concentration of 0.078 µg/L for the herbicide terbacil. Nineherbicides, 6 insecticides, an herbicide metabolite, and an insecticide metabolite were detected in samples fromGranger Drain at Granger, with a maximum concentration of 0.132 µg/L for the insecticide carbaryl.
No concentrations for pesticides detected in samples from NAWQA surface-water stations during the 2001water year exceeded the U.S. Environmental Protection Agency (USEPA) Maximum Contaminant Levels or HealthAdvisories. The USEPA fresh-water chronic criteria for the protection of aquatic life for carbaryl and diazinon are0.02 and 0.009 µg/L, respectively. Concentrations of carbaryl in one sample from Thornton Creek in February andtwo samples from Granger Drain in August and September exceeded the fresh-water chronic criteria for the protec-tion of aquatic life. Concentrations of diazinon in samples from Thornton Creek during January, February, and Aprilalso exceeded the fresh-water chronic criteria for the protection of aquatic life.
Ground Water
In eastern Washington, water levels in water-table wells started the year at above average levels, ranging from+0.3 foot in Benton County (12N/26E-31C01D1) to +5.3 feet in Spokane County (25N/45E-16C01). Water levels inmost of these wells reached below average values between March and June with a maximum deviation of -3.4 feet inColumbia County (10N/37E-23R01). By year’s end, water levels were generally a little above average, except forwell 10N/37E-23R01 which finished the year 2.4 feet below average. Water levels in Spokane County confinedwell 24N/36E-16A06 were substantially above average (6.8 to 10.0 feet) all year, while water levels in confinedwell 24N/36E-16A08 ranged from 8.8 feet above to 8.7 feet below average.
In western Washington, water levels in the water-table well in Pierce County (22N/01W-36H01D11) started(-1.6 feet) and ended the year (-1.9 feet) below average. Water levels in the confined well in Thurston County(16N/02W-29L02P3) started the year a little above average (+0.7 foot), reached a maximum deviation of 15.5 feetbelow average in January and ended the year at 2.6 feet below average.
Departure from long-term average ground-water levels
[All values are in feet; —, no data; *, less than 10 years of record; **, less than 5 years of record, no departure calculated]
Well No. Oct Nov Dec Jan Feb Mar Apr May Jun Jul Aug Sep
10N/37E-23R01 — — — — +1.0* -3.4* — — -0.2* +0.4* — -2.4*
12N/26E-31C01D1 ** — — ** — — ** — +0.9 +0.4* — —
16N/02W-29L02P3 +0.7 +0.2 -10.1* -15.5 -14.9* — -7.4 -6.7 -4.0* -4.0 -3.9 -2.6*
18N/43E-35L01 +3.1 — +1.1 — +0.1 -1.0 -1.3 — — +0.8 — +1.2
22N/01W36H01D11 -1.6* — ** — ** — ** — — ** — -1.9*
24N/36E-16A01 +4.7 +7.5* +4.2 +3.2 +2.7 -0.1 -1.4 +1.6 +1.2 -0.4 +1.6 +0.6
24N/36E-16A06 +8.3 — +10.0 — +6.8 — +7.3* — — +7.0 — +7.1
24N/36E-16A08 +4.0 — -6.4 — -8.7 — -1.6* — — +8.8 — -0.1
25N/45E-16C01 +5.3 +5.0 +2.4 +1.1 -0.1 -1.9 — -0.2 -2.6 -1.8 -1.6 +0.1

WA
TE
R R
ESO
UR
CE
S DA
TA
FOR
WA
SHIN
GT
ON
200111
Figure 3. Surface-water stations with water-quality data collection in Washington.
12 WATER RESOURCES DATA FOR WASHINGTON 2001
SPECIAL NETWORKS AND PROGRAMS
Hydrologic Benchmark Network is a network of 50 sites in small drainage basins around the country whosepurpose is to provide consistent data on the streamflow representative undeveloped watersheds nationwide, and toprovide analyses on a continuing basis to compare and contrast conditions observed in basins more obviouslyaffected by human activities. At 10 of these sites, water-quality information is being gathered on major ions andnutrients, primarily to assess the affects of acid deposition on stream chemistry. Additional information on theHydrologic Benchmark Program can be found at http://water.usgs.gov/hbn/.
National Stream-Quality Accounting Network (NASQAN) monitors the water quality of large rivers withinthe Nation’s largest river basins. From 1995 through 1999, a network of approximately 40 stations were operated inthe Mississippi, Columbia, Colorado, and Rio Grande. From 2000 through 2004, sampling was reduced to a fewindex stations on the Colorado and Columbia so that a network of 5 stations could be implemented on the YukonRiver. Samples are collected with sufficient frequency that the flux of a wide range of constituents can be estimated.The objective of NASQAN is to characterize the water quality of these large rivers by measuring concentration andmass transport of a wide range of dissolved and suspended constituents, including nutrients, major ions, dissolvedand sediment-bound heavy metals, common pesticides, and inorganic and organic forms of carbon. This informationwill be used (1) to describe the long-term trends and changes in concentration and transport of these constituents; (2)to test findings of the National Water-Quality Assessment Program (NAWQA); (3) to characterize processes uniqueto large-river systems such as storage and re-mobilization of sediments and associated contaminants; and (4) to refineexisting estimates of off-continent transport of water, sediment, and chemicals for assessing human effects on theworld’s oceans and for determining global cycles of carbon, nutrients, and other chemicals. Additional informationabout the NASQAN Program can be found at http://water.usgs.gov/nasqan/.
The National Atmospheric Deposition Program/National Trends Network (NADP/NTN) provides continuousmeasurement and assessment of the chemical constituents in precipitation throughout the United States. As the leadfederal agency, the USGS works together with over 100 organizations to provide a long-term, spatial and temporalrecord of atmospheric deposition generated from a network of 225 precipitation chemistry monitoring sites. Thislong-term, nationally consistent monitoring program, coupled with ecosystem research, provides critical informationtoward a national scorecard to evaluate the effectiveness of ongoing and future regulations intended to reduce atmo-spheric emissions and subsequent impacts to the Nation’s land and water resources. Reports and other information onthe NADP/NTN Program, as well as all data from the individual sites, can be found at http://bqs.usgs.gov/acidrain/.
The National Water-Quality Assessment (NAWQA) Program of the U.S. Geological Survey is a long-termprogram with goals to describe the status and trends of water-quality conditions for a large, representative part of theNation’s ground- and surface-water resources; provide an improved understanding of the primary natural and humanfactors affecting these observed conditions and trends; and provide information that supports development and evalu-ation of management, regulatory, and monitoring decisions by other agencies.
Assessment activities are being conducted in 59 study units (major watersheds and aquifer systems) thatrepresent a wide range of environmental settings nationwide and that account for a large percentage of the Nation’swater use. A wide array of chemical constituents will be measured in ground water, surface water, streambedsediments, and fish tissues. The coordinated application of comparative hydrologic studies at a wide range of spatialand temporal scales will provide information for decision making by water-resources managers and a foundation foraggregation and comparison of findings to address water-quality issues of regional and national interest.
Communication and coordination between USGS personnel and other local, State, and federal interests arecritical components of the NAWQA Program. Each study unit has a local liaison committee consisting of representa-tives from key federal, State, and local water resources agencies, Indian nations, and universities in the study unit.Liaison committees typically meet semiannually to discuss their information needs, monitoring plans and progress,desired information products, and opportunities to collaborate efforts among the agencies. Additional informationabout the NAWQA Program can be found at http://water.usgs.gov/nawqa/nawqa_home.html.

WATER RESOURCES DATA FOR WASHINGTON 2001 13
EXPLANATION OF THE RECORDS
The surface-water and ground-water records published in this report are for the 2001 water year that beganOctober 1, 2000, and ended September 30, 2001. A calendar of the water year is provided on the inside of the frontcover. The records contain streamflow data, stage and content data for lakes and reservoirs, water-quality data forsurface water, and ground-water-level data. The following sections of the introductory text are presented to provideusers with a more detailed explanation of how the hydrologic data published in this report were collected, analyzed,computed, and arranged for presentation.
Station Identification Numbers
Each data station, whether streamsite or well, in this report is assigned a unique identification number. Thisnumber is unique in that it applies specifically to a given station and to no other. The number usually is assignedwhen a station is first established and is retained for that station indefinitely. The systems used by the U.S. Geologi-cal Survey to assign identification numbers for surface-water stations and for ground-water well sites differ, but bothare based on geographic location. The "downstream order" system is used for regular surface-water stations and the"latitude-longitude" system is used for wells and, in Washington, for surface-water stations where only miscellaneousmeasurements are made.
Downstream Order System
Since October 1, 1950, the order of listing hydrologic-station records in Survey reports is in a downstreamdirection along the main stream. All stations on a tributary entering upstream from a mainstream station are listedbefore that station. A station on a tributary that enters between two mainstream stations is listed between them. Asimilar order is followed in listing stations on first rank, second rank, and other ranks of tributaries. The rank of anytributary with respect to the stream to which it is immediately tributary is indicated by an indention in the "List ofStations" in the front of this report. Each indention represents one rank. This downstream order and system of inden-tion show which stations are on tributaries between any two stations and the rank of the tributary on which eachstation is situated.
The station-identification number is assigned according to downstream order. In assigning station numbers,no distinction is made between partial-record stations and other stations; therefore, the station number for a partial-record station indicates downstream-order position in a list made up of both types of stations. Gaps are left in theseries of numbers to allow for new stations that may be established; hence, the numbers are not consecutive. Thecomplete eight-digit number for each station, such as 12020000, which appears just to the left of the station name,includes the two-digit Part number "12" plus the six-digit downstream-order number "020000." The Part numberdesignates the major river basin; for example, part "12" refers to the Pacific slope basins in Washington and upperColumbia River basin.
Latitude-Longitude System
The identification numbers for wells and miscellaneous surface-water sites are assigned according to the gridsystem of latitude and longitude. The number consists of 15 digits. The first six digits denote the degrees, minutes,and seconds of latitude, the next seven digits denote degrees, minutes, and seconds of longitude, and the last two dig-its (assigned sequentially) identify the wells or other sites within a one-second grid. This site-identification number,once assigned, is a pure number, and has no locational significance. In the instance where the initial determination oflatitude and longitude are found to be in error, the station will retain its initial identification number; however, its truelatitude and longitude will be listed in the LOCATION paragraph of the station description.
Well-Numbering System
The USGS assigns numbers to wells and springs in Washington that identify their location in a township,range, and section (fig. 4). Well number 12N/26E-31C01 indicates, successively, the township (T. 12 N.) and range(R. 26 E.) north and east of the Willamette base line and meridian. The first number following the hyphen indicatesthe section (31) within the township, and the letter following the section number gives the 40-acre subdivision of thesection, as shown below (fig. 15). The number (01) following the letter is the sequence number of the well within the40-acre subdivision. This number indicates that the well was the second one inventoried by the USGS personnel inthat 40-acre tract. An "S" following the sequence number indicates that the site is a spring, a "D1" after the sequencenumber indicates that the original reported depth of the well has been changed once, and successive numbers indicatethe number of changes in the well depth.

14 WATER RESOURCES DATA FOR WASHINGTON 2001
Figure 4. Well-numbering systems used in the State of Washington.
Records of Stage and Water Discharge
Records of stage and water discharge may be complete or partial. Complete records of discharge are thoseobtained using a continuous stage-recording device through which either instantaneous or mean daily discharges maybe computed for any time, or any period of time, during the period of record. Complete records of lake or reservoircontent, similarly, are those for which stage or content may be computed or estimated with reasonable accuracy forany time, or period of time. They may be obtained using a continuous stage-recording device, but need not be.Because daily mean discharges and end-of-day contents commonly are published for such stations, they are referredto as "daily stations."
By contrast, partial records are obtained through discrete measurements without using a continuousstage-recording device and pertain only to a few flow characteristics, or perhaps only one. The nature of the partialrecord is indicated by table titles such as "Crest-stage partial records," or "Low-flow partial records." Records ofmiscellaneous discharge measurements or of measurements from special studies, such as low-flow seepage studies,may be considered as partial records, but they are presented separately in this report.
WATER RESOURCES DATA FOR WASHINGTON 2001 15
Data Collection and Computation
The data obtained at a complete-record gaging station on a stream or canal consist of a continuous record ofstage, individual measurements of discharge throughout a range of stages, and notations regarding factors that mayaffect the relations between stage and discharge. These data, together with supplemental information, such asweather records, are used to compute daily discharges. The data obtained at a complete-record gaging station on alake or reservoir consist of a record of stage and of notations regarding factors that may affect the relation betweenstage and lake content. These data are used with stage-area and stage-capacity curves or tables to compute water-surface areas and lake storage.
Continuous records of stage are obtained with satellite telemetry data collection platforms that transmit data atselected time intervals via satellite to a direct readout ground station, with electronic recorders that store stage valueson computer chips at selected time intervals, or with analog recorders that trace continuous graphs of stage. Measure-ments of discharge are made with current meters using methods adapted by the Geological Survey as a result ofexperience accumulated since 1880. These methods are described in standard textbooks, in Water-Supply Paper2175, and in U.S. Geological Survey Techniques of Water-Resources Investigations (TWRI), Book 3, Chapter A6.These methods are described in standard textbooks, Water-Supply Paper 2175, and The U.S. Geological SurveyTechniques of Water-Resources Investigations (TWRI’s), Book 3, Chapters A1 through A19 and Book 8, ChaptersA2 and B2. The methods are consistent with The American Society for Testing and Materials (ASTM) standards andgenerally follow the standards of the International Organization for Standards (ISO).
In computing discharge records, results of individual measurements are plotted against the correspondingstages, and stage-discharge relation curves are then constructed. From these curves, rating tables indicating theapproximate discharge for any stage within the range of the measurements are prepared. If it is necessary to defineextremes of discharge outside the range of the current-meter measurements, the curves are extended using:(1) logarithmic plotting; (2) velocity-area studies; (3) results of indirect measurements of peak discharge, such asslope-area or contracted-opening measurements, and computations of flow-over-dams or weirs; or (4) step-backwater techniques.
Daily mean discharges are computed by applying the daily mean stages (gage heights) to the stage-dischargecurves or tables. If the stage-discharge relation is subject to change because of frequent or continual change in thephysical features that form the control, the daily mean discharge is determined by the shifting-control method, inwhich correction factors based on the individual discharge measurements and notes of the personnel making themeasurements are applied to the gage heights before the discharges are determined from the curves or tables. Thisshifting-control method also is used if the stage-discharge relation is changed temporarily because of aquatic growthor debris on the control. For some stations, formation of ice in the winter may so obscure the stage-dischargerelations that daily mean discharges must be estimated from other information such as temperature and precipitationrecords, notes of observations, and records for other stations in the same or nearby basins for comparable periods.
At some stream-gaging stations the stage-discharge relation is affected by the backwater from reservoirs, trib-utary streams, or other sources. This necessitates the use of the slope method in which the slope or fall in a reach ofthe stream is a factor in computing discharge. The slope or fall is obtained by means of an auxiliary gage set at somedistance from the base gage. At some gaging stations, acoustic velocity meter (AVM) systems are used to computedischarge. The AVM system measures the stream’s velocity at one or more paths in the cross section. Coefficientsare developed to relate this path velocity to the mean velocity in the cross section. Because the AVM sensors arefixed in position, the adjustment coefficients generally vary with stage. Cross-sectional area curves are developed torelate stage, recorded as noted above, to cross section area. Discharge is computed by multiplying path velocity bythe appropriate stage related coefficient and area.
In computing records of lake or reservoir contents, it is necessary to have information available from surveys,curves, or tables that define the relation of stage and content. The application of stage to the stage-content curves ortables gives the contents from which daily, monthly, or yearly changes then are determined. If the stage-contentrelation changes because of deposition of sediment in a lake or reservoir, periodic resurveys may be necessary toredefine the relation. Discharges over lake or reservoir spillways are computed from stage-discharge relations muchas other stream discharges are computed.

16 WATER RESOURCES DATA FOR WASHINGTON 2001
For some gaging stations there are periods when no gage-height record is obtained, or the validity of therecorded gage height is so questionable that it cannot be used to compute daily discharge or contents. This happenswhen the data collection platform or recorder stops or otherwise fails to operate properly, intakes are plugged, thefloat is frozen in the well, or for various other reasons. For such periods, the daily discharges are estimated from therecorded range in stage, previous or following record, discharge measurements, weather records, and comparisonwith other station records from the same or nearby basins. Likewise, daily contents may be estimated from operator'slogs, previous or following record, inflow-outflow studies, and other information. Information explaining how esti-mated daily-discharge values are identified in station records is included in the next two sections, "Data Presentation"(REMARKS paragraph) and "Identifying Estimated Daily Discharge."
Data Presentation
Streamflow data in this report are presented in a new format that is considerably different from the format indata reports prior to the 1991 water year. The major changes are that statistical characteristics of discharge nowappear in tabular summaries following the water-year data table and less information is provided in the text or stationmanuscript above the table. These changes represent the results of a pilot program to reformat the annual water-datareport to meet current user needs and data preferences.
The records published for each continuous-record surface-water discharge station (gaging station) now consistof four parts, the manuscript or station description; the data table of daily mean values of discharge for the currentwater year with summary data; a tabular statistical summary of monthly mean flow data for a designated period, bywater year; and a summary statistics table that includes statistical data of annual and daily flows as well as data per-taining to annual runoff, 7-day low-flow minimums, and flow duration. Summary statistics were not included forcertain sites where these data would be misleading. Contact the District Office for information concerning summarystatistics for these sites.
Station manuscript
The manuscript provides, under various headings, descriptive information, such as station location; period of record;historical extremes outside the period of record; record accuracy; and other remarks pertinent to station operation andregulation. The following information, as appropriate, is provided with each continuous record of discharge or lakecontent. Comments to follow clarify information presented under the various headings of the station description.
LOCATION.--Information on locations is obtained from the most accurate maps available. The location ofthe gage with respect to the cultural and physical features in the vicinity and with respect to the reference placementioned in the station name is given. River mileages are based on information developed by the Hydraulics andHydrology Committee of the Pacific Northwest River Basins Commission.
DRAINAGE AREA.--Drainage areas are measured using the most accurate maps available. Because the typeof maps available varies from one drainage basin to another, the accuracy of drainage areas likewise varies. Drainageareas are updated as better maps become available.
PERIOD OF RECORD.--This indicates the period for which there are published records for the station or foran equivalent station. An equivalent station is one that was in operation at a time that the present station was not, andwhose location was such that records from it can reasonably be considered equivalent with records from the presentstation.
REVISED RECORDS.--Published records, because of new information, occasionally are found to be incor-rect, and revisions are printed in later reports. Listed under this heading are all the reports in which revisions havebeen published for the station and the water years to which the revisions apply. If a revision did not include daily,monthly, or annual figures of discharge, that fact is noted after the year dates as follows: "(M)" means the instanta-neous maximum discharge was revised; "(m)" the instantaneous minimum was revised; and "(P)" the peak dischargeswere revised. If the drainage area has been revised, the report in which the most recently revised figure was firstpublished is given.
GAGE.--The type of gage in current use, the datum of the current gage referred to sea level (see "DEFINI-TION OF TERMS"), and a condensed history of the types, location, and datums of previous gages are given underthis heading.
WATER RESOURCES DATA FOR WASHINGTON 2001 17
REMARKS.--All periods of estimated daily-discharge record will either be identified by date in this paragraphof the station description for water-discharge stations or flagged in the daily-discharge table. (See next section,"Identifying Estimated Daily Discharge.") If a remarks statement is used to identify estimated record, the paragraphwill begin with this information presented as the first entry. The paragraph is also used to present information rela-tive to the accuracy of the records, special methods of computation, conditions that affect natural flow at the stationand, possibly, other pertinent items. For reservoir stations, information is given on the dam forming the reservoir, thecapacity, outlet works and spillway, and purpose and use of the reservoir.
COOPERATION.--Records provided by a cooperating organization or obtained for the Geological Survey bya cooperating organization are identified here.
AVERAGE DISCHARGE.--The discharge value given is the arithmetic average of the water-year meandischarges. Average discharge is computed only for stations having at least 2 water years of complete record; wateryears with incomplete record are not included in the computation. The mean-discharge value that uses all publisheddata may differ from that given in the summary statistics data, which is based only on computer-stored data. Thesummary data does not include values of monthly or yearly data that were determined by various methods for theseries of Water-Supply Papers entitled "Compilation of Records of Surface Water of the United States". The aver-age-discharge value is not computed for stations where diversions, storage or other water-use practices cause thevalue to be meaningless. If water projects that significantly alter flow at a station are put into use after the station hasbeen in operation for a period of years, the new average is computed as soon as 2 water years of record have accumu-lated after the project began.
EXTREMES FOR PERIOD OF RECORD.--Extremes may include maximum and minimum stages and maxi-mum and minimum discharges or content. Unless otherwise qualified, the maximum discharge or content is theinstantaneous maximum corresponding to the highest stage that occurred. The highest stage may have been obtainedfrom a data collection platform, graphic or digital recorder, a crest-stage gage, or by direct observation of a nonre-cording gage. If the maximum stage did not occur on the same day as the maximum discharge or content, it is givenseparately. Similarly, the minimum is the instantaneous minimum discharge, unless otherwise qualified, and wasdetermined and is reported in the same manner as the maximum.
EXTREMES OUTSIDE PERIOD OF RECORD.--Included here is information concerning major floods orunusually low flows that occurred outside the stated period of record. The information may or may not have beenobtained by the U.S. Geological Survey.
EXTREMES FOR CURRENT YEAR.--Extremes given here are similar to those for the period of record,except the peak discharge listing may include secondary peaks. For stations meeting certain criteria, all peak dis-charges and stages occurring during the water year and greater than a selected base discharge are presented under thisheading. The peaks greater than the base discharge, excluding the highest one, are referred to as secondary peaks.Peak discharges are not published for canals, ditches, drains, or streams for which the peaks are subject to substantialcontrol by man. The time of occurrence for peaks is expressed in 24-hour local standard time. For example, 12:30a.m. is 0030, and 1:30 p.m. is 1330. The minimum for the current water year appears below the table of peak data.
REVISIONS.--If errors in published water-quality records are discovered after publication, appropriateupdates are made in the U.S. Geological Survey’s distributed data system, NWIS, and subsequently to its web-basedNational data system, NWISWeb [http://water.usgs.gov/nwis/nwis]. Because the usual volume of updates makes itimpractical to document individual changes in the State data-report series or elsewhere, potential users of U.S. Geo-logical Survey water-quality data are encouraged to obtain all required data from NWIS or NWISWeb to ensure themost recent updates. Updates to NWISWeb are currently made on an annual basis.
Although rare, occasionally the records of a discontinued gaging station may need revision. Because, for thesestations, there would be no current or, possibly, future station manuscript published to document the revision in a"Revised Records" entry, users of data for these stations who obtained the record from previously published datareports may wish to contact the Washington office (address given on the back of the title page of this report) to deter-mine if the published records were ever revised after the station was discontinued. Of course, if the data wereobtained by computer retrieval, the data would be current and there would be no need to check because any publishedrevision of data is always accompanied by revision of the corresponding data in computer storage.

18 WATER RESOURCES DATA FOR WASHINGTON 2001
Manuscript information for lake or reservoir stations differs from that for stream stations in the nature of the"Remarks" and in the inclusion of a skeleton stage-capacity table when daily contents are given.
Data table of daily mean values
The daily table of discharge records for stream-gaging stations gives mean discharge for each day of the wateryear. In the monthly summary for the table, the line headed "TOTAL" gives the sum of the daily figures for eachmonth. The line headed "MEAN" gives the average flow in cubic feet per second during the month. The linesheaded "MAX" and "MIN" give the maximum and minimum daily mean discharges, respectively, for the month.Discharge for the month also is usually expressed in cubic feet per second per square mile (line headed "CFSM"), orin inches (line headed "IN."), or in acre-feet (line headed "AC-FT"). Figures for cubic feet per second per square mileand runoff in inches are omitted if there is extensive regulation or diversion or if the drainage area includes largenoncontributing areas. At some stations monthly and (or) yearly observed discharges are adjusted for reservoirstorage or diversion, or diversion data or reservoir contents are given. These figures are identified by a symbol andcorresponding footnote.
Statistics of monthly mean data
A tabular summary of the mean (line headed "MEAN"), maximum (line headed "MAX"), and minimum (lineheaded "MIN") of monthly mean flows for each month for a designated period is provided below the mean valuestable. The water years of the first occurrence of the maximum and minimum monthly flows are provided immedi-ately below those figures. The designated period will be expressed as "FOR WATER YEAR_____-_____, BYWATER YEAR (WY)", and will list the first and last water years of the range of years selected from the PERIOD OFRECORD paragraph in the station manuscript. It will consist of all of the station record within the specified wateryears, inclusive, including complete months of record for partial water years, if any, and may coincide with the periodof record for the station. The water years for which the statistics are computed will be consecutive, unless a break inthe station record is indicated in the manuscript.
Summary statistics
A table titled "SUMMARY STATISTICS" follows the statistics of monthly mean data tabulation. This tableconsists of four columns, with the first column containing the line headings of the statistics being reported. The tableprovides a statistical summary of yearly and daily flows, not only for the current water year but also for the previouscalendar year and for a designated period, as appropriate. The designated period selected, "WATER YEARS_____-_____", will consist of all of the station record within the specified water years, inclusive, including complete monthsof record for partial water years, if any, and may coincide with the period of record for the station. The water yearsfor which the statistics are computed will be consecutive, unless a break in the station record is indicated in themanuscript. All of the calculations for the statistical characteristics designated ANNUAL (See line headings below),except for the "ANNUAL 7-DAY MINIMUM" statistic, are calculated for the designated period using completewater years. The other statistical characteristics may be calculated using partial water years.
The date or water year, as appropriate, of the first occurrence of each statistic reporting extreme values ofdischarge is provided adjacent to the statistic. Repeated occurrences may be noted in the REMARKS paragraph ofthe manuscript or in footnotes. Because the designated period may not be the same as the station period of recordpublished in the manuscript, occasionally the dates of occurrence listed for the daily extremes in the designated-period column may not be within the selected water years listed in the heading. When this occurs, it will be noted inthe REMARKS paragraph or in footnotes. Selected streamflow duration curve statistics and runoff data are alsogiven. Runoff data may be omitted if there is extensive regulation or diversion of flow in the drainage basin.
The following summary statistics data, as appropriate, are provided with each continuous record of discharge.Comments to follow clarify information presented under the various line headings of the summary statistics table.
ANNUAL TOTAL.--The sum of the daily mean values of discharge for the year. At some stationsthe annual total discharge is adjusted for reservoir storage or diversion. The adjusted figures areindentified by a symbol and corresponding footnotes.
ANNUAL MEAN.--The arithmetic mean of the individual daily mean discharges for the yearnoted or for the designated period. At some stations the yearly mean discharge is adjusted for reservoirstorage or diversion. The adjusted figures are identified by a symbol and corresponding footnotes. Atleast 5 complete years of record must be available before this statistic is published for the designatedperiod.
WATER RESOURCES DATA FOR WASHINGTON 2001 19
HIGHEST ANNUAL MEAN.--The maximum annual mean discharge occurring for thedesignated period.
LOWEST ANNUAL MEAN.--The minimum annual mean discharge occurring for the designatedperiod.
HIGHEST DAILY MEAN.--The maximum daily mean discharge for the year or for the designatedperiod.
LOWEST DAILY MEAN.--The minimum daily mean discharge for the year or for the designatedperiod.
ANNUAL 7-DAY MINIMUM.--The lowest mean discharge for 7 consecutive days for a calendaryear or a water year. Note that most low-flow frequency analyses of annual 7-day minimum flows usea climatic year (April 1 - March 31). The date shown in the summary statistics table is the initial dateof the 7-day period. (This value should not be confused with the 7-day 10-year low-flow statistic.)
ANNUAL RUNOFF.--Indicates the total quantity of water in runoff for a drainage area for theyear. Data reports may use any of the following units of measurement in presenting annual runoff data:
Acre-foot (AC-FT) is the quantity of water required to cover 1 acre to a depth of 1 foot and is equal to 43,560 cubicfeet or about 326,000 gallons or 1,233 cubic meters.
Cubic feet per second per square mile (CFSM) is the average number of cubic feet of water flowing per second fromeach square mile area drained, assuming the runoff is distributed uniformly in time and area.
Inches (INCHES) indicates the depth to which the drainage area would be covered if all of the runoff for a giventime period were uniformly distributed on it.
10 PERCENT EXCEEDS.--The discharge that is exceeded 10 percent of the time for thedesignated period.
50 PERCENT EXCEEDS.--The discharge that is exceeded 50 percent of the time for thedesignated period.
90 PERCENT EXCEEDS.--The discharge that is exceeded 90 percent of the time for thedesignated period.
Data collected at partial-record stations follow the information for continuous-record sites. Data for partial-record discharge stations are presented in two tables. The first is a table of annual maximum stage and discharge atcrest-stage stations, and the second is a table of discharge measurements at low-flow partial-record stations. Thetables of partial-record stations are followed by a listing of discharge measurements made at sites other than continu-ous-record or partial-record stations. These measurements are generally made in times of drought or flood to givebetter areal coverage to those events. Those measurements and others collected for some special reason are calledmeasurements at miscellaneous sites.
Identifying Estimated Daily Discharge
Estimated daily-discharge values published in the water-discharge tables of annual state data reports are iden-tified either by flagging individual daily values with the letter symbol "e" and printing a table footnote, "e Estimated,"or by listing the dates of the estimated record in the REMARKS paragraph of the station description.
Accuracy of the Records
The accuracy of streamflow records depends primarily on: (1) The stability of the stage-discharge relation or,if the control is unstable, the frequency of discharge measurements, and (2) the accuracy of measurements of stage,measurements of discharge, and interpretation of records.
The accuracy attributed to the records is indicated under the "REMARKS" paragraph. "Excellent" means thatabout 95 percent of the daily discharges are within 5 percent of the true; "good," within 10 percent; and "fair," within15 percent. Records that do not meet the criteria mentioned, are rated "poor." Different accuracies may be attributedto different parts of a given record.

20 WATER RESOURCES DATA FOR WASHINGTON 2001
Daily mean discharges in this report are given to the nearest hundredth of a cubic foot per second for valuesless than 1 ft3/s; the nearest tenth between 1.0 and 10 ft3/s; whole numbers between 10 and 1,000 ft3/s; and 3 signifi-cant figures for more than 1,000 ft3/s. The number of significant figures used is based solely on the magnitude of thedischarge value. The same rounding rules apply to discharges listed for partial-record stations and miscellaneoussites.
Discharge at many stations, as indicated by the monthly mean, may not reflect natural runoff because of theeffects of diversion, consumption, regulation by storage, increase or decrease in evaporation, or other factors. Forsuch stations, figures of cubic feet per second per square mile and of runoff, in inches, are not published unless satis-factory adjustments can be made for diversions, changes in contents of reservoirs, or other changes incident to useand control. Evaporation from a reservoir is not included in the adjustments for changes in reservoir contents, unlessit is so stated. Even at those stations where adjustments are made, large errors in computed runoff may occur ifadjustments or losses are large in comparison with the observed discharge.
Other Records Available
Monthly records for several ungaged sites are given in a separate section following the gaged sites. Theaccuracy of records for ungaged sites is generally lower than that for gaged sites, depending on the precision of thecomputation method and the accuracy of data used in the computations.
For most gaging stations, unpublished, detailed information, on file in the Washington office, includes dis-charge measurements, gage-height records, and rating tables. Many gaging-station records in Washington through1979 have been analyzed to determine several statistical summaries: (1) The number of days in each year that thedaily discharge was between selected limits (duration tables); (2) the lowest mean discharge for selectednumbers of consecutive days in each year; and (3) the highest mean discharge for selected numbers of consecutivedays in each year.
Other Federal and State agencies have collected discharge data at other sites in Washington during the currentwater year. Although these records have not been published by the U.S. Geological Survey, the National Water DataExchange, NAWDEX, Water Resources Division, U.S. Geological Survey, National Center, Reston, VA 22092,maintains an index of these sites and will furnish information about them.
Records of Surface-Water Quality
Records of surface-water quality ordinarily are obtained at or near stream-gaging stations becauseinterpretation of records of surface-water quality nearly always requires corresponding discharge data. Records ofsurface-water quality in this report may involve a variety of types of data and measurement frequencies.
Classification of Records
Water-quality data for surface-water sites are grouped into one of three classifications. A continuous-recordstation is a site where data are collected on a regularly scheduled basis. Frequency may be one or more times daily,weekly, monthly, or quarterly. A partial-record station is a site where limited water-quality data are collected system-atically over a period of years. Frequency of sampling is usually less than quarterly. A miscellaneous sampling siteis a location other than a continuing or partial-record station, where random samples are collected to give better arealcoverage to define water-quality conditions in the river basin.
A careful distinction needs to be made between "continuous records" as used in this report and "continuousrecordings," which refers to a continuous graph or a series of discrete values punched at short intervals on a papertape or obtained via data collection platform. Some records of water quality, such as temperature and specific con-ductance, may be obtained through continuous recordings; however, because of costs, most data are obtained onlymonthly or less frequently. Locations of stations for which records on the quality of surface water appear in thisreport are shown in figure 3.
Accuracy of the Records
One of four accuracy classifications is applied for measured physical properties at continuous-record stationson a scale ranging from poor to excellent. The accuracy rating is based on data values recorded before any shifts orcorrections are made, as described by Wagner and others (2000). Additional consideration also is given to theamount of publishable record and to the amount of data that have been corrected or shifted.

WATER RESOURCES DATA FOR WASHINGTON 2001 21
Rating continuous water-quality records
[<, less than or equal to; +, plus or minus value shown; oC, degree Celsius; >, greater than; %, percent; mg/L, milli-gram per liter; pH unit, standard pH unit]
Arrangement of Records
Water-quality records collected at a surface-water daily record station are published immediately followingthat record, regardless of the frequency of sample collection. Station number and name are the same for both records.Where a surface-water daily record station is not available or where the water quality differs significantly from that atthe nearby surface-water station, the continuing water-quality record is published with its own station number andname in the regular downstream-order sequence. Water-quality data for partial-record stations and for miscellaneoussampling sites appear in separate tables following the table of discharge measurements at miscellaneous sites.
On-site Measurement and Sample Collection
In obtaining water-quality data, it is important that the data obtained represent the in situ quality of the water.To assure this, certain measurements, such as water temperature, pH, and dissolved oxygen, need to be made onsitewhen the samples are taken. To assure that measurements made in the laboratory also represent the in situ water,carefully prescribed procedures need to be followed in collecting the samples, treating the samples to prevent changesin quality pending analysis, and shipping the samples to the laboratory. Procedures for onsite measurements and forcollecting, treating, and shipping samples are detailed in the TWRI Book 1, Chapter D2; Book 3, Chapter C2;Book 5, Chapter A1, A3, and A4, and Book 9, chapters A1-A9. These references are listed in the PUBLICATIONSON TECHNIQUES OF WATER-RESOURCES INVESTIGATIONS section of this report. These methods are con-sistent with ASTM standards and generally follow ISO standards. Also, detailed information on collecting, treating,and shipping samples may be obtained from the Geological Survey, Water Resources Division office in Tacoma,Washington.
One sample can define adequately the water quality at a given time if the mixture of solutes throughout thestream cross section is homogeneous. However, the concentration of solutes at different locations in the cross sectionmay vary widely with different rates of water discharge, depending on the source of material and the turbulence andmixing of the stream. Some streams must be sampled through several vertical sections to obtain a representativesample needed for an accurate mean concentration and for use in calculating load. All samples obtained for theNational Stream Quality Accounting Network (see "DEFINITION OF TERMS") are obtained from at least fiveverticals. Whether samples are obtained from the centroid of flow or from several verticals, depends on flowconditions and other factors which must be evaluated by the collector.
Chemical-quality data published in this report are considered to be the most representative values available forthe stations listed. The values reported represent water-quality conditions at the time of sampling as much as possi-ble, consistent with available sampling techniques and methods of analysis. In the rare case where an apparentinconsistency exists between a reported pH value and the relative abundance of carbon dioxide species (carbonateand bicarbonate), the inconsistency is the result of a slight uptake of carbon dioxide from the air by the samplebetween measurement of pH in the field and determination of carbonate and bicarbonate in the laboratory.
Measured physical propertyRatings
Excellent Good Fair Poor
Water temperature < + 0.2oC > + 0.2 to 0.5oC > + 0.5 to 0.8oC > + 0.8oC
Specific conductance < + 3% > + 3 to 10% > + 10 to 15% > + 15%
Dissolved oxygen < + 0.3 mg/L > + 0.3 to 0.5 mg/L > + 0.5 to 0.8 mg/L > + 0.8 mg/L
pH < + 0.2 unit > + 0.2 to 0.5 unit > + 0.5 to 0.8 unit > + 0.8 unit
Turbidity < + 5% > + 5 to 10% > + 10 to 15% > + 15%

22 WATER RESOURCES DATA FOR WASHINGTON 2001
For chemical-quality stations equipped with digital monitors, the records consist of daily maximum, mini-mum, and mean or medium values for each constituent measured and are based upon hourly (or more frequent)punches beginning at 0100 hours and ending at 2400 hours for the day of record. More detailed records (hourlyvalues) may be obtained from the U.S. Geological Survey office whose address is given on the back of the title pageof this report.
Water Temperature
Water temperatures are measured at most of the water-quality stations. In addition, water temperatures aretaken at time of discharge measurements for water-discharge stations. For stations where water temperatures aretaken manually once or twice daily, the water temperatures are taken at about the same time each day. Large streamshave a small diurnal temperature change; shallow streams may have a daily range of several degrees and may followclosely the changes in air temperature. Some streams may be affected by waste-heat discharges.
At stations where recording instruments are used, maximum, minimum, and mean temperatures for each dayare published. Water temperatures measured at the time of water-discharge measurements are on file in theWashington office.
Sediment
Suspended-sediment concentrations are determined from samples collected by one of the standard samplingtechniques discussed in TWRI, Book 3, Chapter C2, "Field methods for measurement of fluvial sediment," 1985 revi-sion. Samples are obtained using standard depth- or point-integrating samplers, or by means of an approved pumpingsampler. Mean concentrations for the sampled cross section are in turn determined from these samples.
During periods of rapidly changing flow or rapidly changing suspended-sediment concentration, samples mayhave been collected more frequently (twice daily or, in some instances, hourly). The published sediment dischargesfor days of rapidly changing flow or concentration were computed by the subdivided-day method (time-dischargeweighted average). Therefore, for those days when the published sediment discharge value differs from the valuecomputed as the product of discharge times mean concentration times 0.0027, the reader can assume that thesediment discharge for that day was computed by the subdivided-day method. For periods when no samples werecollected, daily discharges of suspended sediment were estimated on the basis of water discharge, sediment concen-trations observed immediately before and after the periods, and suspended-sediment loads for other periods of similardischarge. Methods used in the computation of sediment records are described in the TWRI Book 3, Chapters C1 andC3. These methods are consistent with ASTM standards and generally follow ISO standards.
At other stations, suspended-sediment samples were collected periodically. Although data collected periodi-cally may represent conditions only at the time of observations, such data are useful in establishing seasonal relationsbetween quality and streamflow and in predicting long-term sediment-discharge characteristics of the stream.
In addition to the records of suspended-sediment discharge, periodic measurements of particle-size distribu-tions for the suspended-sediment, bed-load, and bed-material samples are included for stations where samples wereobtained to measure this parameter.
Laboratory Measurements
Sediment samples, samples for indicator bacteria, and daily samples for specific conductance are analyzedlocally. All other samples are analyzed in the Geological Survey laboratory in Arvada, Colorado. Methods used toanalyze samples and to compute sediment records are given in the TWRI Book 5, Chapter C1. Methods used by theGeological Survey laboratories are given in the TWRI Book 1, Chapter D2; Book 3, Chapter C2; Book 5, ChaptersA1, A3, A4, and A5. These methods are consistent with ASTM standards and generally follow ISO standards.
In March 1989, the National Water-Quality Laboratory discovered a bias in the turbidimetric method forsulfate analysis, indicating that values below 75 mg/L have a median positive bias of 2 mg/L above the true value forthe period between 1982 and 1989. Sulfate values in this report have not been corrected for this bias.
Estimated pesticide concentrations published in this report are identified by flagging individual values with thesymbol "E" and printing a table footnote "E - Estimated". "E" codes (used to define surface-water and water-qualitytable values) are also used to signify estimated values for all detections that are below the lowest calibration standard,above the highest calibration standard, or otherwise less reliable than average because of sample-specific orcompound-specific considerations. All E-coded data are considered to be reliable detections, but with greater thanaverage uncertainity in quantification.

WATER RESOURCES DATA FOR WASHINGTON 2001 23
Data Presentation
For continuous-record stations, information pertinent to the history of station operation is provided in descrip-tive headings preceding the tabular data. These descriptive headings give details regarding location, drainage area,period of record, type of data available, instrumentation, general remarks, cooperation, and extremes for parameterscurrently measured daily. Tables of chemical, physical, biological, radiochemical data, and so forth, obtained at afrequency less than daily are presented first. Tables of "daily values" of specific conductance, pH, water temperature,dissolved oxygen, and suspended sediment then follow in sequence.
In the descriptive headings, if the location is identical to that of the discharge gaging station, neither theLOCATION nor the DRAINAGE AREA statements are repeated. The following information, as appropriate, isprovided with each continuous-record station. Comments that follow clarify information presented under the variousheadings of the station description.
LOCATION.--See Data Presentation under "Records of Stage and Water Discharge;" samecomments apply.
DRAINAGE AREA.--See Data Presentation under "Records of Stage and Water Discharge;" samecomments apply.
PERIOD OF RECORD.--This indicates the periods for which there are published water-qualityrecords for the station. The periods are shown separately for records of parameters measured daily orcontinuously and those measured less than daily. For those measured daily or continuously, periods ofrecord are given for the parameters individually.
INSTRUMENTATION.--Information on instrumentation is given only if a water-quality monitor,sediment pumping sampler, or other sampling device is in operation at a station.
REMARKS.--Remarks provide added information pertinent to the collection, analysis, orcomputation of the records.
COOPERATION.--Records provided by a cooperating organization or obtained for the GeologicalSurvey by a cooperating organization are identified here.
EXTREMES.--Maximums and minimums are given only for parameters measured daily or morefrequently. None are given for parameters measured weekly or less frequently, because the truemaximums or minimums may not have been sampled. Extremes, when given, are provided for both theperiod of record and for the current water year.
REVISIONS.--If errors in published water-quality records are discovered after publication,appropriate updates are made to the Water-Quality File in the U.S. Geological Survey's computerizeddata system, NWIS, and subsequently by monthly transfer of update transactions to the U.S.Environmental Protection Agency's STORET system. Because the usual volume of updates makes itimpractical to document individual changes in the State data-report series or elsewhere, potential usersof U.S. Geological Survey water-quality data are encouraged to obtain all required data from theappropriate computer file.
The surface-water-quality records for partial-record stations and miscellaneous sampling sites are publishedin separate tables following the table of discharge measurements at miscellaneous sites. No descriptive statementsare given for these records. Each station is published with its own station number and name in the regulardownstream-order sequence.
24 WATER RESOURCES DATA FOR WASHINGTON 2001
Remark Codes
The following remark codes may appear with the water-quality data in this section:
PRINT OUTPUT REMARK
E Estimated value.
> Actual value is known to be greater than the value shown.
< Actual value is known to be less than the value shown.
K Results based on colony count outside the acceptance range(non-ideal colony count).
L Biological organism count less than 0.5 percent (organismmay be observed rather than counted).
D Biological organism count equal to or greater than 15 percent (dominant).
V Analyte was detected in both the environmental sample and theassociated blanks
& Biological organism estimated as dominant.
M Presence of material verified, but not quantified.
Quality-Control Data
Data generated from quality-control (QC) samples are a requisite for evaluating the quality of the samplingand processing techniques as well as data from the actual samples themselves. Without QC data, environmentalsample data cannot be adequately interpreted because the errors associated with the sample data are unknown. Thevarious types of QC samples collected by this District are described in the following section. Procedures have beenestablished for the storage of water-quality-control data within the USGS. These procedures allow for storage of allderived QC data and are identified so that they can be related to corresponding environmental samples.
BLANK SAMPLES—Blank samples are collected and analyzed to ensure that environmental samples havenot been contaminated by the overall data-collection process. The blank solution used to develop specific types ofblank samples is a solution that is free of the analytes of interest. Any measured value signal in a blank sample for ananalyte (a specific component measured in a chemical analysis) that was absent in the blank solution is believed to bedue to contamination. There are many types of blank samples possible, each designed to segregate a different part ofthe overall data-collection process. The types of blank samples collected in this District are:
Source solution blank - a blank solution that is transferred to a sample bottle in an area of the officelaboratory with an atmosphere that is relatively clean and protected with respect to target analytes.
Ambient blank - a blank solution that is put in the same type of bottle used for an environmentalsample, kept with the set of sample bottles before sample collection, and opened at the site and exposedto the ambient conditions.
Field blank - a blank solution that is subjected to all aspects of sample collection, field processingpreservation, transportation, and laboratory handling as an environmental sample.
Trip blank - a blank solution that is put in the same type of bottle used for an environmental sampleand kept with the set of sample bottles before and after sample collection.
Equipment blank - a blank solution that is processed through all equipment used for collecting andprocessing an environmental sample (similar to a field blank but normally done in the more controlledconditions of the office).
WATER RESOURCES DATA FOR WASHINGTON 2001 25
Sampler blank - a blank solution that is poured or pumped through the same field sampler usedfor collecting an environmental sample.
Pump blank - a blank solution that is processed through the same pump-and-tubing system usedfor an environmental sample.
Stand-pipe blank - a blank solution that is poured from the containment vessel (stand-pipe) beforethe pump is inserted to obtain the pump blank.
Filter blank - a blank solution that is filtered in the same manner and through the same filterapparatus used for an environmental sample.
Splitter blank - a blank solution that is mixed and separated using a field splitter in the samemanner and through the same apparatus used for an environmental sample.
Preservation blank - a blank solution that is treated with the sampler preservatives used for anenvironmental sample.
Canister blank - a blank solution that is taken directly from a stainless-steel canister just before theVOC sampler is submerged to obtain a field blank sample.
REFERENCE SAMPLES—Reference material is a solution or material prepared by a laboratory whose com-position is certified for one or more properties so that it can be used to assess a measurement method. Samples ofreference material are submitted for analysis to ensure that an analytical method is accurate for the known propertiesof the reference material. Generally, the selected reference material properties are similar to the environmentalsample properties.
REPLICATE SAMPLES—Replicate samples are a set of environmental samples collected in a manner suchthat the samples are thought to be essentially identical in composition. Replicate is the general case for which aduplicate is the special case consisting of two samples. Replicate samples are collected and analyzed to establish theamount of variability in the data contributed by some part of the collection and analytical process. There are manytypes of replicate samples possible, each of which may yield slightly different results in a dynamic hydrologic setting,such as a flowing stream. The types of replicate samples collected in this District are:
Concurrent sample - a type of replicate sample in which the samples are collected simultaneouslywith two or more samplers or by using one sampler and alternating collection of samples into two ormore compositing containers.
Sequential sample - a type of replicate sample in which the samples are collected one after theother, typically over a short time.
Split sample - a type of replicate sample in which a sample is split into subsamplescontemporaneous in time and space.
SPIKE SAMPLES - Spike samples are samples to which known quantities of a solution with one or morewell-established analyte concentrations have been added. These samples are analyzed to determine the extent ofmatrix interference or degradation on the analyte concentration during sample processing and analysis.
Concurrent sample - a type of spike sample that is collected at the same time with the samesampling and compositing devices then spiked with the same spike solution containing laboratory-certified concentrations of selected analytes.
Split sample - a type of spike sample in which a sample is split into subsamples contemporaneousin time and space then spiked with the same spike solution containing laboratory-certifiedconcentrations of selected analytes.
Records of Ground-Water Levels
Water-level data from only a few of the many observation wells in Washington are given in this report.
Ground-water records obtained through cooperative efforts of many Federal, State, and local agencies forseveral thousand observation wells throughout Washington are not included in this report. These records may beplaced in computer storage, published in reports, or kept in files. Information about the availability of ground-waterdata may be obtained from the District Chief, Washington District, U.S. Geological Survey, 1201 Pacific Avenue,Suite 600, Tacoma, Washington 98402.
26 WATER RESOURCES DATA FOR WASHINGTON 2001
Data Collection and Computation
Measurements of water levels are made in many types of wells under varying conditions, but the methods ofmeasurement are standardized to the extent possible. The equipment and measuring techniques used at each observa-tion well ensure that measurements at each well are of consistent accuracy and reliability.
Tables of water-level data are presented by counties arranged in alphabetical order. The prime identificationnumber for a given well is the 15-digit number that appears in the upper left corner of the table. The secondaryidentification number is the local well number, an alphanumeric number, derived from the township-range locationof the well.
Water-level records are obtained from direct measurements with a steel or electrical tape or from the graph orpunched tape of a water-stage recorder. The water-level measurements in this report are given in feet with referenceto land-surface datum (lsd). Land-surface datum is a datum plane that is approximately at land surface at each well.If known, the elevation of the land-surface datum is given in the well description.
Water levels are reported to as many significant figures as can be justified by the local conditions. For exam-ple, in a measurement of a depth to water of several hundred feet, the error of determining the absolute value of thetotal depth to water may be a few tenths of a foot, whereas the error in determining the net change of water levelbetween successive measurements may be only a hundreth or a few hundredths of a foot. For lesser depths to water,the accuracy is greater. Accordingly, most measurements are reported to a hundredth of a foot, but some are given toa tenth of a foot or a larger unit.
Data Presentation
Each well record consists of two parts, the station description and the data table of water levels observedduring the water year. The description of the well is presented first through use of descriptive headings preceding thetabular data. The comments to follow clarify information presented under the various headings.
LOCATION.--This paragraph follows the well-identification number and reports the latitude andlongitude (given in degrees, minutes, and seconds); a landline location designation; the hydrologic unitnumber; the distance and direction from a geographic point of reference; and the owner's name.
AQUIFER.--This entry designates by name (if a name exists) and geologic age the aquifer(s) opento the well.
WELL CHARACTERISTICS.--This entry describes the well in terms of depth, diameter, casingdepth and (or) screened interval, method of construction, use, and additional information such as casingbreaks, collapsed screen, and other changes since construction.
INSTRUMENTATION.--This paragraph provides information on both the frequency ofmeasurement and the collection method used, allowing the user to better evaluate the reportedwater-level extremes by knowing whether they are based on weekly, monthly, or some other frequencyof measurement.
DATUM.--This entry describes the land-surface elevation at the well. The elevation of theland-surface datum is described in feet above (or below) sea level; it is reported with a precisiondepending on the method of determination.
REMARKS.--This entry describes factors that may influence the water level in a well or themeasurement of the water level. It should identify wells that also are water-quality observation wells,and may be used to acknowledge the assistance of local (non-Survey) observers.
PERIOD OF RECORD.--This entry indicates the period for which there are published records forthe well. It reports the month and year of the start of publication of water-level records by the U.S.Geological Survey and the words "to current year" if the records are to be continued into the followingyear. Periods for which water-level records are available, but are not published by the GeologicalSurvey, may be noted.
EXTREMES FOR PERIOD OF RECORD.--This entry contains the highest and lowest waterlevels of the period of published record, with respect to land-surface datum, and the dates of theiroccurrence.

WATER RESOURCES DATA FOR WASHINGTON 2001 27
A table of water levels follows the station description for each well. Water levels are reported in feet belowland-surface datum and all taped measurements of water level are listed. For wells equipped with a recorder, onlyabbreviated tables are published; generally, only water-level lows are listed for every fifth day and at the end of the month(eom). The highest and lowest water levels of the water year and their dates of occurrence are shown on a line below theabbreviated table. Because all values are not published for wells with recorders, the extremes may be values that are notlisted in the table. Missing records are indicated by dashes in place of the water level.
ACCESS TO USGS WATER DATA
The USGS provides near real-time stage and discharge data for many of the gaging stations equipped with the nec-essary telemetry and historic daily-mean and peak-flow discharge data for most current or discontinued gaging stationsthrough the internet. These data may be accessed at:
http://water.usgs.gov
Some water-quality and ground water data also are available through the internet. In addition, data can beprovided in various machine-readable formats on magnetic tape or 3-1/2 inch floppy disk. Information about the avail-ability of specific types of data or products, and user charges, can be obtained locally from each of the USGS WaterResources Program Offices in each state (see address on the back of the title page).
28 WATER RESOURCES DATA FOR WASHINGTON 2001
DEFINITION OF TERMS
Specialized technical terms related to streamflow,water-quality, and other hydrologic data, as used in thisreport, are defined below. Terms such as algae, waterlevel, precipitation are used in their common everydaymeanings, definitions of which are given in standard dic-tionaries. Not all terms defined in this alphabetical listapply to every State. See also table for converting Englishunits to International System (SI) Units on the inside of theback cover.
Acid neutralizing capacity (ANC) is the equivalent sumof all bases or base-producing materials, solutes plusparticulates, in an aqueous system that can be titratedwith acid to an equivalence point. This term designatestitration of an “unfiltered” sample (formerly reported asalkalinity).
Acre-foot (AC-FT, acre-ft) is a unit of volume, commonlyused to measure quantities of water used or stored,equivalent to the volume of water required to cover 1acre to a depth of 1 foot and equivalent to 43,560 cubicfeet, 325,851 gallons, or 1,233 cubic meters. (See also“Annual runoff”)
Adenosine triphosphate (ATP) is an organic, phosphate-rich, compound important in the transfer of energy inorganisms. Its central role in living cells makes ATP anexcellent indicator of the presence of living material inwater. A measurement of ATP therefore provides asensitive and rapid estimate of biomass. ATP is reportedin micrograms per liter.
Algal growth potential (AGP) is the maximum algal dryweight biomass that can be produced in a natural watersample under standardized laboratory conditions. Thegrowth potential is the algal biomass present at stationaryphase and is expressed as milligrams dry weight of algaeproduced per liter of sample.
Alkalinity is the capacity of solutes in an aqueous systemto neutralize acid. This term designates titration of a“filtered” sample.
Annual runoff is the total quantity of water that isdischarged (“runs off”) from a drainage basin in a year.Data reports may present annual runoff data as volumesin acre-feet, as discharges per unit of drainage area incubic feet per second per square mile, or as depths ofwater on the drainage basin in inches.
Annual 7-day minimum is the lowest mean value for any7-consecutive-day period in a year. Annual 7-dayminimum values are reported herein for the calendar yearand the water year (October 1 to September 30). Mostlow-flow frequency analyses use a climatic year (April1-March 31), which tends to prevent the low-flow periodfrom being artificially split between adjacent years. Thedate shown in the summary statistics table is the initialdate of the 7-day period. (This value should not beconfused with the 7-day10-year low-flow statistic.)
Aroclor is the registered trademark for a group ofpolychlorinated biphenyls that were manufactured by theMonsanto Company prior to 1976. Aroclors are assignedspecific 4-digit reference numbers dependent uponmolecular type and degree of substitution of the biphenylring hydrogen atoms by chlorine atoms. The first twodigits of a numbered aroclor represent the molecular typeand the last two digits represent the weight percent of thehydrogen substituted chlorine.
Artificial substrate is a device that is purposely placed ina stream or lake for colonization of organisms. Theartificial substrate simplifies the community structure bystandardizing the substrate from which each sample istaken. Examples of artificial substrates are basketsamplers (made of wire cages filled with cleanstreamside rocks) and multiple-plate samplers (made ofhardboard) for benthic organism collection, andplexiglass strips for periphyton collection. (See also“Substrate”)
Ash mass is the mass or amount of residue present afterthe residue from the dry mass determination has beenashed in a muffle furnace at a temperature of 500 °C for1 hour. Ash mass of zooplankton and phyto-plankton isexpressed in grams per cubic meter (g/m3), andperiphyton and benthic organisms in grams per squaremeter (g/m2). (See also “Biomass”)
Bacteria are microscopic unicellular organisms, typicallyspherical, rodlike, or spiral and threadlike in shape, oftenclumped into colonies. Some bacteria cause disease,while others perform an essential role in nature in therecycling of materials; for example, by decomposingorganic matter into a form available for reuse by plants.
Base discharge (for peak discharge) is a discharge value,determined for selected stations, above which peakdischarge data are published. The base discharge at eachstation is selected so that an average of about three peaksper year will be published.
Base flow is sustained flow of a stream in the absence ofdirect runoff. It includes natural and human-inducedstreamflows. Natural base flow is sustained largely byground-water discharge.
Bedload is material in transport that is supported primarilyby the streambed. In this report, bedload is considered toconsist of particles in transit from the bed to an elevationequal to the top of the bedload sampler nozzle (rangingfrom 0.25 to 0.5 ft) that are retained in the bedloadsampler. A sample collected with a pressure-differentialbedload sampler may also contain a component of thesuspended load.
Bedload discharge (tons per day) is rate of sedimentmoving as bedload, reported as dry weight, that passesthrough a cross section in a given time. NOTE: Bedloaddischarge values in this report may include a componentof the suspended-sediment discharge. A correction maybe necessary when computing the total sedimentdischarge by summing the bedload discharge and thesuspended-sediment discharge. (See also “Bedload” and“Sediment”)
WATER RESOURCES DATA FOR WASHINGTON 2001 29
Bed material is the sediment mixture of which astreambed, lake, pond, reservoir, or estuary bottom iscomposed. (See also “Bedload” and “Sediment”)
Benthic organisms are the group of organisms inhabitingthe bottom of an aquatic environment. They include anumber of types of organisms, such as bacteria, fungi,insect larvae and nymphs, snails, clams, and crayfish.They are useful as indicators of water quality.
Biochemical oxygen demand (BOD) is a measure of thequantity of dissolved oxygen, in milligrams per liter,necessary for the decomposition of organic matter bymicroorganisms, such as bacteria.
Biomass is the amount of living matter present at anygiven time, expressed as mass per unit area or volume ofhabitat.
Biomass pigment ratio is an indicator of the totalproportion of periphyton which are autotrophic (plants).This is also called the Autotrophic Index.
Blue-green algae (Cyanophyta) are a group ofphytoplankton organisms having a blue pigment, inaddition to the green pigment called chlorophyll. Blue-green algae often cause nuisance conditions in water.Concentrations are expressed as a number of cells permilliliter (cells/mL) of sample. (See also“Phytoplankton”)
Bottom material (See “Bed material”)
Cells/volume refers to the number of cells of any organismthat is counted by using a microscope and grid orcounting cell. Many planktonic organisms aremulticelled and are counted according to the number ofcontained cells per sample volume, and are generallyreported as cells or units per milliliter (mL) or liter (L).
Cells volume (biovolume) determination is one of severalcommon methods used to estimate biomass of algae inaquatic systems. Cell members of algae are frequentlyused in aquatic surveys as an indicator of algalproduction. However, cell numbers alone cannotrepresent true biomass because of considerable cell-sizevariation among the algal species. Cell volume (µm3) isdetermined by obtaining critical cell measurements oncell dimensions (for example, length, width, height, orradius) for 20 to 50 cells of each important species toobtain an average biovolume per cell. Cells arecategorized according to the correspondence of theircellular shape to the nearest geometric solid orcombinations of simple solids (for example, spheres,cones, or cylinders). Representative formulae used tocompute biovolume are as follows:
sphere 4/3 πr3 cone 1/3 πr3h cylinder πr3h.
pi is the ratio of the circumference to the diameter of acircle; pi = 3.14159…
From cell volume, total algal biomass expressed asbiovolume (µm3/mL) is thus determined by multiplyingthe number of cells of a given species by its average cellvolume and then summing these volumes over allspecies.
Cfs-day (See “Cubic foot per second-day”)
Chemical oxygen demand (COD) is a measure of thechemically oxidizable material in the water and furnishesan approximation of the amount of organic and reducingmaterial present. The determined value may correlatewith BOD or with carbonaceous organic pollution fromsewage or industrial wastes. [See also “Biochemicaloxygen demand (BOD)”]
Clostridium perfringens (C. perfringens) is a spore-forming bacterium that is common in the feces of humanand other warm-blooded animals. Clostridial spores arebeing used experimentally as an indicator of past fecalcontamination and presence of micro-organisms that areresistant to disinfection and environmental stresses. (Seealso “Bacteria”)
Coliphages are viruses that infect and replicate in coliformbacteria. They are indicative of sewage contamination ofwaters and of the survival and transport of viruses in theenvironment.
Color unit is produced by 1 milligram per liter of platinumin the form of the chloroplatinate ion. Color is expressedin units of the platinum-cobalt scale.
Confined aquifer is a term used to describe an aquifercontaining water between two relatively impermeableboundaries. The water level in a well tapping a confinedaquifer stands above the top of the confined aquifer andcan be higher or lower than the water table that may bepresent in the material above it. In some cases, the waterlevel can rise above the ground surface, yielding aflowing well.
Contents is the volume of water in a reservoir or lake.Unless otherwise indicated, volume is computed on thebasis of a level pool and does not include bank storage.
Continuous-record station is a site where data arecollected with sufficient frequency to define daily meanvalues and variations within a day.
Control designates a feature in the channel downstreamfrom a gaging station that physically influences thewater-surface elevation and thereby determines thestage-discharge relation at the gage. This feature may bea constriction of the channel, a bedrock outcrop, a gravelbar, an artificial structure, or a uniform cross section overa long reach of the channel.
Control structure as used in this report is a structure on astream or canal that is used to regulate the flow or stageof the stream or to prevent the intrusion of saltwater.
Cubic foot per second (CFS, ft3/s) is the rate of dischargerepresenting a volume of 1 cubic foot passing a givenpoint in 1 second. It is equivalent to approximately 7.48gallons per second or approximately 449 gallons perminute, or 0.02832 cubic meters per second. The term“second-feet” sometimes is used synonymously with“cubic feet per second” but is now obsolete.
Cubic foot per second-day (CFS-DAY, Cfs-day,[(ft3/s)/d]) is the volume of water represented by a flowof 1 cubic foot per second for 24 hours. It is equivalent to86,400 cubic feet, 1.98347 acre-feet, 646,317 gallons, or

30 WATER RESOURCES DATA FOR WASHINGTON 2001
2,446.6 cubic meters. The daily-mean dischargesreported in the daily-value data tables are numericallyequal to the daily volumes in cfs-days, and the totals alsorepresent volumes in cfs-days.
Cubic foot per second per square mile [CFSM,(ft3/s)/mi2] is the average number of cubic feet of waterflowing per second from each square mile of areadrained, assuming the runoff is distributed uniformly intime and area. (See also “Annual runoff”)
Daily mean suspended-sediment concentration is thetime-weighted concentration of suspended sedimentpassing a stream cross section during a 24-hour day. (Seealso “Mean concentration of suspended sediment,”“Sediment,” and “Suspended-sediment concentration”)
Daily-record station is a site where data are collectedwith sufficient frequency to develop a record of one ormore data values per day. The frequency of datacollection can range from continuous recording toperiodic sample or data collection on a daily or near-daily basis.
Data Collection Platform (DCP) is an electronicinstrument that collects, processes, and stores data fromvarious sensors, and transmits the data by satellite datarelay, line-of-sight radio, and/or landline telemetry.
Data logger is a microprocessor-based data acquisitionsystem designed specifically to acquire, process, andstore data. Data are usually downloaded from onsite dataloggers for entry into office data systems.
Datum is a surface or point relative to whichmeasurements of height and/or horizontal position arereported. A vertical datum is a horizontal surface used asthe zero point for measurements of gage height, stage, orelevation; a horizontal datum is a reference for positionsgiven in terms of latitude-longitude, State Planecoordinates, or UTM coordinates. (See also “Gagedatum,” “Land-surface datum,” “National GeodeticVertical Datum of 1929,” and “North American VerticalDatum of 1988”)
Diatoms are the unicellular or colonial algae having asiliceous shell. Their concentrations are expressed asnumber of cells per milliliter (cells/mL) of sample. (Seealso “Phytoplankton”)
Diel is of or pertaining to a 24-hour period of time; aregular daily cycle.
Discharge, or flow, is the rate that matter passes through across section of a stream channel or other water body perunit of time. The term commonly refers to the volume ofwater (including, unless otherwise stated, any sedimentsor other constituents suspended or dissolved in the water)that passes a cross section in a stream channel, canal,pipeline, etc., within a given period of time (cubic feetper second). Discharge also can apply to the rate at whichconstituents such as suspended sediment, bedload, anddissolved or suspended chemical constituents, passthrough a cross section, in which cases the quantity isexpressed as the mass of constituent that passes the crosssection in a given period of time (tons per day).
Dissolved refers to that material in a representative watersample that passes through a 0.45-micrometer membranefilter. This is a convenient operational definition used byFederal and State agencies that collect water-qualitydata. Determinations of “dissolved” constituentconcentrations are made on sample water that has beenfiltered.
Dissolved oxygen (DO) is the molecular oxygen (oxygengas) dissolved in water. The concentration in water is afunction of atmospheric pressure, temperature, anddissolved-solids concentration of the water. The abilityof water to retain oxygen decreases with increasingtemperature or dissolved-solids concentration.Photosynthesis and respiration by plants commonlycause diurnal variations in dissolved-oxygenconcentration in water from some streams.
Dissolved-solids concentration in water is the quantity ofdissolved material in a sample of water. It is determinedeither analytically by the “residue-on-evaporation”method, or mathematically by totaling the concentrationsof individual constituents reported in a comprehensivechemical analysis. During the analytical determination,the bicarbonate (generally a major dissolved componentof water) is converted to carbonate. In the mathematicalcalculation, the bicarbonate value, in milligrams per liter,is multiplied by 0.4926 to convert it to carbonate.Alternatively, alkalinity concentration (as mg/L CaCO3)can be converted to carbonate concentration bymultiplying by 0.60.
Diversity index (H) (Shannon Index) is a numericalexpression of evenness of distribution of aquaticorganisms. The formula for diversity index is:
where ni is the number of individuals per taxon, n is thetotal number of individuals, and s is the total number oftaxa in the sample of the community. Index values rangefrom zero, when all the organisms in the sample are thesame, to some positive number, when some or all of theorganisms in the sample are different.
Drainage area of a stream at a specific location is thatarea upstream from the location, measured in ahorizontal plane, that has a common outlet at the site forits surface runoff from precipitation that normally drainsby gravity into a stream. Drainage areas given hereininclude all closed basins, or noncontributing areas,within the area unless otherwise specified.
Drainage basin is a part of the Earth’s surface thatcontains a drainage system with a common outlet for itssurface runoff. (See “Drainage area”)
Dry mass refers to the mass of residue present after dryingin an oven at 105 °C, until the mass remains unchanged.This mass represents the total organic matter, ash andsediment, in the sample. Dry-mass values are expressedin the same units as ash mass. (See also “Ash mass,”“Biomass,” and “Wet mass”)
dni
n----log2
ni
n----
i 1≈
s
∑–=
WATER RESOURCES DATA FOR WASHINGTON 2001 31
Dry weight refers to the weight of animal tissue after it hasbeen dried in an oven at 65 ˚C until a constant weight isachieved. Dry weight represents total organic andinorganic matter in the tissue. (See also “Wet weight”)
Enterococcus bacteria are commonly found in the fecesof humans and other warm-blooded animals. Althoughsome strains are ubiquitous and not related to fecalpollution, the presence of enterococci in water is anindication of fecal pollution and the possible presence ofenteric pathogens. Enterococcus bacteria are thosebacteria that produce pink to red colonies with black orreddish-brown precipitate after incubation at 41 °C onmE agar and subsequent transfer to EIA medium.Enterococci include Streptococcus feacalis,Streptococcus feacium, Streptococcus avium, and theirvariants. (See also “Bacteria”)
EPT Index is the total number of distinct taxa within theinsect orders Ephemeroptera, Plecoptera, andTrichoptera. This index summarizes the taxa richnesswithin the aquatic insects that are generally consideredpollution sensitive, the index usually decreases withpollution.
Escherichia coli (E. coli) are bacteria present in theintestine and feces of warm-blooded animals. E. coli area member species of the fecal coliform group of indicatorbacteria. In the laboratory, they are defined as thosebacteria that produce yellow or yellow-brown colonieson a filter pad saturated with urea substrate broth afterprimary culturing for 22 to 24 hours at44.5 ˚C on mTEC medium. Their concentrations areexpressed as number of colonies per 100 mL of sample.(See also “Bacteria”)
Estimated (E) value of a concentration is reported whenan analyte is detected and all criteria for a positive resultare met. If the concentration is less than the methoddetection limit (MDL), an ‘E’ code will be reported withthe value. If the analyte is qualitatively identified aspresent, but the quantitative determi-nation issubstantially more uncertain, the National Water QualityLaboratory will identify the result with an ‘E’ code eventhough the measured value is greater than the MDL. Avalue reported with an ‘E’ code should be used withcaution. When no analyte is detected in a sample, thedefault reporting value is the MDL preceded by a lessthan sign (<).
Euglenoids (Euglenophyta) are a group of algae that areusually free-swimming and rarely creeping. They havethe ability to grow either photosynthetically in the lightor heterotrophically in the dark. (See also“Phytoplankton”)
Extractable organic halides (EOX) are organiccompounds that contain halogen atoms such as chlorine.These organic compounds are semivolatile andextractable by ethyl acetate from air-dried streambedsediments. The ethyl acetate extract is combusted, andthe concentration is determined by microcoulometricdetermination of the halides formed. The concentration isreported as micrograms of chlorine per gram of the dryweight of the streambed sediments.
Fecal coliform bacteria are present in the intestine orfeces of warm-blooded animals. They are often used asindicators of the sanitary quality of the water. In thelaboratory, they are defined as all organisms that produceblue colonies within 24 hours when incubated at 44.5 °Cplus or minus 0.2 °C on M-FC medium (nutrient mediumfor bacterial growth). Their concentrations are expressedas number of colonies per 100 mL of sample. (See also“Bacteria”)
Fecal streptococcal bacteria are present in the intestine ofwarm-blooded animals and are ubiquitous in theenvironment. They are characterized as gram-positive,cocci bacteria that are capable of growth in brain-heartinfusion broth. In the laboratory, they are defined as allthe organisms that produce red or pink colonies within48 hours at 35 °C plus or minus 1.0 °C on KF-streptococcus medium (nutrient medium for bacterialgrowth). Their concentrations are expressed as numberof colonies per 100 mL of sample. (See also “Bacteria”)
Fire algae (Pyrrhophyta) are free-swimming unicellscharacterized by a red pigment spot. (See also“Phytoplankton”)
Flow-duration percentiles are values on a scale of 100that indicate the percentage of time for which a flow isnot exceeded. For example, the 90th percentile of riverflow is greater than or equal to 90 percent of all recordedflow rates.
Gage datum is a horizontal surface used as a zero pointfor measurement of stage or gage height. This surfaceusually is located slightly below the lowest point of thestream bottom such that the gage height is usuallyslightly larger than the maximum depth of water.Because the gage datum itself is not an actual physicalobject, the datum usually is defined by specifying theelevations of permanent reference marks such as bridgeabutments and survey monuments, and the gage is set toagree with the reference marks. Gage datum is a localdatum that is maintained independently of any Nationalgeodetic datum. However, if the elevation of the gagedatum relative to the National datum (North AmericanVertical Datum of 1988 or National Geodetic VerticalDatum of 1929) has been determined, then the gagereadings can be converted to elevations above theNational datum by adding the elevation of the gagedatum to the gage reading.
Gage height (G.H.) is the water-surface elevation, in feetabove the gage datum. If the water surface is below thegage datum, the gage height is negative. Gage height isoften used interchangeably with the more general term“stage,” although gage height is more appropriate whenused in reference to a reading on a gage.
Gage values are values that are recorded, transmitted and/or computed from a gaging station. Gage values typicallyare collected at 5-, 15-, or 30-minute intervals.
Gaging station is a site on a stream, canal, lake, orreservoir where systematic observations of stage,discharge, or other hydrologic data are obtained. Whenused in connection with a discharge record, the term is
32 WATER RESOURCES DATA FOR WASHINGTON 2001
applied only to those gaging stations where a continuousrecord of discharge is computed.
Gas chromatography/flame ionization detector(GC/FID) is a laboratory analytical method used as ascreening technique for semivolatile organic compoundsthat are extractable from water in methylene chloride.
Green algae have chlorophyll pigments similar in color tothose of higher green plants. Some forms produce algaemats or floating “moss” in lakes. Their concen-trationsare expressed as number of cells per milliliter (cells/mL)of sample. (See also “Phytoplankton”)
Habitat quality index is the qualitative description (level1) of instream habitat and riparian conditionssurrounding the reach sampled. Scores range from 0 to100 percent with higher scores indicative of desirablehabitat conditions for aquatic life. Index only applicableto wadable streams.
Hardness of water is a physical-chemical characteristicthat is commonly recognized by the increased quantity ofsoap required to produce lather. It is computed as thesum of equivalents of polyvalent cations (primarilycalcium and magnesium) and is expressed as theequivalent concentration of calcium carbonate (CaCO3).
High tide is the maximum height reached by each risingtide. The high-high and low-high tides are the higher andlower of the two high tides, respectively, of each tidalday. See NOAA web site:http://www.co-ops.nos.noaa.gov/tideglos.html
Hilsenhoff’s Biotic Index (HBI) is an indicator of organicpollution which uses tolerance values to weight taxaabundances; usually increases with pollution. It iscalculated as follows:
where n is the number of individuals of each taxon, a is thetolerance value of each taxon, and N is the total numberof organisms in the sample.
Horizontal datum (See “Datum”)
Hydrologic benchmark station is one that provideshydrologic data for a basin in which the hydrologicregimen will likely be governed solely by naturalconditions. Data collected at a benchmark station may beused to separate effects of natural from human-inducedchanges in other basins that have been developed and inwhich the physiography, climate, and geology are similarto those in the undeveloped benchmark basin.
Hydrologic index stations referred to in this report arefour continuous-record gaging stations that have beenselected as representative of streamflow patterns for theirrespective regions. Station locations are shown on indexmaps.
Hydrologic unit is a geographic area representing part orall of a surface drainage basin or distinct hydrologicfeature as defined by the former Office of Water Data
Coordination and delineated on the State HydrologicUnit Maps by the USGS. Each hydrologic unit isidentified by an 8-digit number.
Inch (IN., in.), as used in this report, refers to the depth towhich the drainage area would be covered with water ifall of the runoff for a given time period were uniformlydistributed on it. (See also “Annual runoff”)
Instantaneous discharge is the discharge at a particularinstant of time. (See also “Discharge”)
Laboratory Reporting Level (LRL) is generally equal totwice the yearly determined long-term method detectionlevel (LT-MDL). The LRL controls false negative error.The probability of falsely reporting a non-detection for asample that contained an analyte at a concentration equalto or greater than the LRL is predicted to be less than orequal to 1 percent. The value of the LRL will be reportedwith a “less than” (<) remark code for samples in whichthe analyte was not detected. The National Water QualityLaboratory collects quality-control data from selectedanalytical methods on a continuing basis to determineLT-MDLs and to establish LRLs. These values arereevaluated annually based on the most current quality-control data and may, therefore, change. [Note: Inseveral previous NWQL documents (Connor and others,1998; NWQL Technical Memorandum 98.07, 1998), theLRL was called the non-detection value or NDV—a termthat is no longer used.)
Land-surface datum (lsd) is a datum plane that isapproximately at land surface at each ground-waterobservation well.
Light-attenuation coefficient, also known as theextinction coefficient, is a measure of water clarity. Lightis attenuated according to the Lambert-Beer equation
,
where Io is the source light intensity, I is the light intensityat length L (in meters) from the source, λ is the light-attenuation coefficient, and e is the base of the naturallogarithm. The light attenuation coefficient is defined as
.
Lipid is any one of a family of compounds that areinsoluble in water and that make up one of the principalcomponents of living cells. Lipids include fats, oils,waxes, and steroids. Many environmental contaminantssuch as organochlorine pesticides are lipophilic.
Long-Term Method Detection Level (LT–MDL) is adetection level derived by determining the standarddeviation of a minimum of 24 method detection limit(MDL) spike sample measurements over an extendedperiod of time. LT–MDL data are collected on acontinuous basis to assess year-to-year variations in theLT–MDL. The LT–MDL controls false positive error.
HBI sumn( ) a( )
N----------------=
I IoeλL–
=
λ 1L---loge
IIo----–=

WATER RESOURCES DATA FOR WASHINGTON 2001 33
The chance of falsely reporting a concentration at orgreater than the LT–MDL for a sample that did notcontain the analyte is predicted to be less than or equal to1 percent.
Low tide is the minimum height reached by each fallingtide. The high-low and low-low tides are the higher andlower of the two low tides, respectively, of each tidalday. See NOAA web site:http://www.co-ops.nos.noaa.gov/tideglos.html
Macrophytes are the macroscopic plants in the aquaticenvironment. The most common macrophytes are therooted vascular plants that are usually arranged in zonesin aquatic ecosystems and restricted in the area by theextent of illumination through the water and sedimentdeposition along the shoreline.
Mean concentration of suspended sediment (Daily meansuspended-sediment concentration) is the time-weightedconcentration of suspended sediment passing a streamcross section during a given time period. (See also “Dailymean suspended-sediment concentration” and“Suspended-sediment concentration”)
Mean discharge (MEAN) is the arithmetic mean ofindividual daily mean discharges during a specificperiod. (See also “Discharge”)
Mean high or low tide is the average of all high or lowtides, respectively, over a specific period.
Mean sea level is a local tidal datum. It is the arithmeticmean of hourly heights observed over the National TidalDatum Epoch. Shorter series are specified in the name;for example, monthly mean sea level and yearly meansea level. In order that they may be recovered whenneeded, such datums are referenced to fixed pointsknown as benchmarks. (See also “Datum”)
Measuring point (MP) is an arbitrary permanent referencepoint from which the distance to water surface in a wellis measured to obtain water level.
Membrane filter is a thin microporous material of specificpore size used to filter bacteria, algae, and other verysmall particles from water.
Metamorphic stage refers to the stage of developmentthat an organism exhibits during its transformation froman immature form to an adult form. This developmentalprocess exists for most insects, and the degree ofdifference from the immature stage to the adult formvaries from relatively slight to pronounced, with manyintermediates. Examples of metamorphic stages ofinsects are egg-larva-adult or egg-nymph-adult.
Method Detection Limit (MDL) is the minimumconcentration of a substance that can be measured andreported with 99-percent confidence that the analyteconcentration is greater than zero. It is determined fromthe analysis of a sample in a given matrix containing theanalyte. At the MDL concentration, the risk of a falsepositive is predicted to be less than or equal to 1 percent.
Methylene blue active substances (MBAS) are apparentdetergents. The determination depends on the formationof a blue color when methylene blue dye reacts with
synthetic anionic detergent compounds.
Micrograms per gram (UG/G, µg/g) is a unit expressingthe concentration of a chemical constituent as the mass(micrograms) of the element per unit mass (gram) ofmaterial analyzed.
Micrograms per kilogram (UG/KG, µg/kg) is a unitexpressing the concentration of a chemical constituent asthe mass (micrograms) of the constituent per unit mass(kilogram) of the material analyzed. One microgram perkilogram is equivalent to 1 part per billion.
Micrograms per liter (UG/L, µg/L) is a unit expressingthe concentration of chemical constituents in water asmass (micrograms) of constituent per unit volume (liter)of water. One thousand micrograms per liter is equivalentto 1 milligram per liter. One microgram per liter isequivalent to 1 part per billion.
Microsiemens per centimeter (US/CM, µS/cm) is a unitexpressing the amount of electrical conductivity of asolution as measured between opposite faces of acentimeter cube of solution at a specified temperature.Siemens is the International System of Unitsnomenclature. It is synonymous with mhos and is thereciprocal of resistance in ohms.
Milligrams per liter (MG/L, mg/L) is a unit forexpressing the concentration of chemical constituents inwater as the mass (milligrams) of constituent per unitvolume (liter) of water. Concentration of suspendedsediment also is expressed in mg/L and is based on themass of dry sediment per liter of water-sediment mixture.
Minimum Reporting Level (MRL) is the smallestmeasured concentration of a constituent that may bereliably reported by using a given analytical method(Timme, 1995).
Miscellaneous site, miscellaneous station, or miscel-laneous sampling site is a site where streamflow,sediment, and/or water-quality data or water-quality orsediment samples are collected once, or more often on arandom or discontinuous basis to provide better arealcoverage for defining hydrologic and water-qualityconditions over a broad area in a river basin.
Most probable number (MPN) is an index of the numberof coliform bacteria that, more probably than any othernumber, would give the results shown by the laboratoryexamination; it is not an actual enumer-ation. MPN isdetermined from the distribution of gas-positive culturesamong multiple inoculated tubes.
Multiple-plate samplers are artificial substrates of knownsurface area used for obtaining benthic invertebratesamples. They consist of a series of spaced, hardboardplates on an eyebolt.
Nanograms per liter (NG/L, ng/L) is a unit expressing theconcentration of chemical constituents in solution asmass (nanograms) of solute per unit volume (liter) ofwater. One million nanograms per liter is equivalent to 1milligram per liter.
National Geodetic Vertical Datum of 1929 (NGVD of1929) is a fixed reference adopted as a standard geodetic
34 WATER RESOURCES DATA FOR WASHINGTON 2001
datum for elevations determined by leveling. It wasformerly called “Sea Level Datum of 1929” or “mean sealevel.” Although the datum was derived from the meansea level at 26 tide stations, it does not necessarilyrepresent local mean sea level at any particular place. SeeNOAA web site: http://www.ngs.noaa.gov/faq.shtml#WhatVD29VD88 (See “North AmericanVertical Datum of 1988”)
Natural substrate refers to any naturally occurringimmersed or submersed solid surface, such as a rock ortree, upon which an organism lives. (See also“Substrate”)
Nekton are the consumers in the aquatic environment andconsist of large free-swimming organisms that arecapable of sustained, directed mobility.
Nephelometric turbidity unit (NTU) is the measurementfor reporting turbidity that is based on use of a standardsuspension of Formazin. Turbidity measured in NTUuses nephelometric methods that depend on passingspecific light of a specific wave-length through thesample.
North American Vertical Datum of 1988 (NAVD 1988)is a fixed reference adopted as the official civilianvertical datum for elevations determined by Federalsurveying and mapping activities in the U.S. This datumwas established in 1991 by minimum-constraintadjustment of the Canadian, Mexican, and U.S. first-order terrestrial leveling networks.
Open or screened interval is the length of unscreenedopening or of well screen through which water enters awell, in feet below land surface.
Organic carbon (OC) is a measure of organic matterpresent in aqueous solution, suspension, or bottomsediments. May be reported as dissolved organic carbon(DOC), particulate organic carbon (POC), or totalorganic carbon (TOC).
Organic mass or volatile mass of the living substance isthe difference between the dry mass and ash mass andrepresents the actual mass of the living matter. Organicmass is expressed in the same units as for ash mass anddry mass. (See also “Ash mass,” “Biomass,” and “Drymass”)
Organism count/area refers to the number of organismscollected and enumerated in a sample and adjusted to thenumber per area habitat, usually square meter (m2), acre,or hectare. Periphyton, benthic organisms, andmacrophytes are expressed in these terms.
Organism count/volume refers to the number oforganisms collected and enumerated in a sample andadjusted to the number per sample volume, usuallymilliliter (mL) or liter (L). Numbers of planktonicorganisms can be expressed in these terms.
Organochlorine compounds are any chemicals thatcontain carbon and chlorine. Organochlorine compoundsthat are important in investigations of water, sediment,and biological quality include certain pesticides andindustrial compounds.
Parameter Code is a 5-digit number used in theUSGS computerized data system, National WaterInformation System (NWIS), to uniquely identify aspecific constituent or property.
Partial-record station is a site where discretemeasurements of one or more hydrologic parameters areobtained over a period of time without continuous databeing recorded or computed. A common example is acrest-stage gage partial-record station at which only peakstages and flows are recorded.
Particle size is the diameter, in millimeters (mm), of aparticle determined by sieve or sedimentation methods.The sedimentation method utilizes the principle ofStokes Law to calculate sediment particle sizes.Sedimentation methods (pipet, bottom-with-drawal tube,visual-accumulation tube, Sedigraph) determine falldiameter of particles in either distilled water (chemicallydispersed) or in native water (the river water at the timeand point of sampling).
Particle-size classification, as used in this report, agreeswith the recommendation made by the AmericanGeophysical Union Subcommittee on SedimentTerminology. The classification is as follows:
Classification Size (mm) Methodofanalysis
Clay 0.00024 - 0.004 SedimentationSilt 0.004 - 0.062 SedimentationSand 0.062 - 2.0 Sedimentation/
sieveGravel 2.0 - 64.0 Sieve
The particle-size distributions given in this report are notnecessarily representative of all particles in transport inthe stream. Most of the organic matter is removed, andthe sample is subjected to mechanical and chemicaldispersion before analysis in distilled water. Chemicaldispersion is not used for native water analysis.
Peak flow (peak stage) is an instantaneous localmaximum value in the continuous time series ofstreamflows or stages, preceded by a period of increasingvalues and followed by a period of decreasing values.Several peak values ordinarily occur in a year. Themaximum peak value in a year is called the annual peak;peaks lower than the annual peak are called secondarypeaks. Occasionally, the annual peak may not be themaximum value for the year; in such cases, themaximum value occurs at midnight at the beginning orend of the year, on the recession from or rise toward ahigher peak in the adjoining year. If values are recordedat a discrete series of times, the peak recorded value maybe taken as an approximation to the true peak, which mayoccur between the recording instants. If the values arerecorded with finite precision, a sequence of equalrecorded values may occur at the peak; in this case, thefirst value is taken as the peak.
Percent composition or percent of total is a unit forexpressing the ratio of a particular part of a sample or
WATER RESOURCES DATA FOR WASHINGTON 2001 35
population to the total sample or population, in terms oftypes, numbers, weight, mass, or volume.
Percent shading is determined by using a clinometer toestimate left and right bank shading. The values areadded together and divided by 180 to determine percentshading relative to a horizontal surface.
Periodic-record station is a site where stage, discharge,sediment, chemical, physical, or other hydrologicmeasurements are made one or more times during a year,but at a frequency insufficient to develop a daily record.
Periphyton is the assemblage of microorganisms attachedto and living upon submerged solid surfaces. Whileprimarily consisting of algae, they also include bacteria,fungi, protozoa, rotifers, and other small organisms.Periphyton are useful indicators of water quality.
Pesticides are chemical compounds used to controlundesirable organisms. Major categories of pesticidesinclude insecticides, miticides, fungicides, herbicides,and rodenticides.
pH of water is the negative logarithm of the hydrogen-ionactivity. Solutions with pH less than 7 are termed“acidic,” and solutions with a pH greater than 7 aretermed “basic.” Solutions with a pH of 7 are neutral. Thepresence and concentration of many dissolved chemicalconstituents found in water are, in part, influenced by thehydrogen-ion activity of water. Biological processesincluding growth, distribution of organisms, and toxicityof the water to organisms arealso influenced, in part, by the hydrogen-ion activity ofwater.
Phytoplankton is the plant part of the plankton. They areusually microscopic, and their movement is subject to thewater currents. Phytoplankton growth is dependent uponsolar radiation and nutrient substances. Because they areable to incorporate as well as release materials to thesurrounding water, the phytoplankton have a profoundeffect upon the quality of the water. They are the primaryfood producers in the aquatic environment and arecommonly known as algae. (See also “Plankton”)
Picocurie (PC, pCi) is one trillionth (1 x 10-12) of theamount of radioactive nuclide represented by a curie(Ci). A curie is the quantity of radioactive nuclide thatyields 3.7 x 10¹⁰ radioactive disintegrations per second(dps). A picocurie yields 0.037 dps, or 2.22 dpm(disintegrations per minute).
Plankton is the community of suspended, floating, orweakly swimming organisms that live in the open waterof lakes and rivers. Concentrations are expressed as anumber of cells per milliliter (cells/mL of sample).
Polychlorinated biphenyls (PCBs) are industrialchemicals that are mixtures of chlorinated biphenylcompounds having various percentages of chlorine. Theyare similar in structure to organochlorine insecticides.
Polychlorinated naphthalenes (PCNs) are industrialchemicals that are mixtures of chlorinated naphthalenecompounds. They have properties and applicationssimilar to polychlorinated biphenyls (PCBs) and have
been identified in commercial PCB preparations.
Primary productivity is a measure of the rate at whichnew organic matter is formed and accumulated throughphotosynthetic and chemosynthetic activity of producerorganisms (chiefly, green plants). The rate of primaryproduction is estimated by measuring the amount ofoxygen released (oxygen method) or the amount ofcarbon assimilated (carbon method) by the plants.
Primary productivity (carbon method) is expressed asmilligrams of carbon per area per unit time [mg C/(m2/time)] for periphyton and macrophytes or per volume [mgC/(m3/time)] for phytoplankton. Carbon method definesthe amount of carbon dioxide consumed as measured byradioactive carbon (carbon-14). The carbon-14 method isof greater sensitivity than the oxygen light and darkbottle method and is preferred for use in unenrichedwaters. Unit time may be either the hour or day,depending on the incubation period. (See also “Primaryproductivity”)
Primary productivity (oxygen method) is expressed asmilligrams of oxygen per area per unit time[mg O/(m2/time)] for periphyton and macrophytes or pervolume [mg O/(m3/time)] for phytoplankton. Oxygenmethod defines production and respiration rates asestimated from changes in the measured dissolved-oxygen concentration. The oxygen light and dark bottlemethod is preferred if the rate of primary production issufficient for accurate measurements to be made within24 hours. Unit time may be either the hour or day,depending on the incubation period. (See also “Primaryproductivity”)
Radioisotopes are isotopic forms of an element thatexhibit radioactivity. Isotopes are varieties of a chemicalelement that differ in atomic weight, but are very nearlyalike in chemical properties. The difference arisesbecause the atoms of the isotopic forms of an elementdiffer in the number of neutrons in the nucleus; forexample, ordinary chlorine is a mixture of isotopeshaving atomic weights of 35 and 37, and the naturalmixture has an atomic weight of about 35.453. Many ofthe elements similarly exist as mixtures of isotopes, and agreat many new isotopes have been produced in theoperation of nuclear devices such as the cyclotron. Thereare 275 isotopes of the 81 stable elements, in addition tomore than 800 radioactive isotopes.
Recoverable from bed (bottom) material is the amountof a given constituent that is in solution after arepresentative sample of bottom material has beendigested by a method (usually using an acid or mixture ofacids) that results in dissolution of readily solublesubstances. Complete dissolution of all bottom materialis not achieved by the digestion treatment and thus thedetermination represents less than the total amount (thatis, less than 95 percent) of the constituent in the sample.To achieve comparability of analytical data, equivalentdigestion procedures would be required of alllaboratories performing such analyses because differentdigestion procedures are likely to produce differentanalytical results. (See also “Bed material”)
36 WATER RESOURCES DATA FOR WASHINGTON 2001
Recurrence interval, also referred to as return period, isthe average time, usually expressed in years, betweenoccurrences of hydrologic events of a specified type(such as exceedances of a specified high flow or non-exceedance of a specified low flow). The terms “returnperiod” and “recurrence interval” do not imply regularcyclic occurrence. The actual times between occurrencesvary randomly, with most of the times being less than theaverage and a few being substantially greater than theaverage. For example, the 100-year flood is the flow ratethat is exceeded by the annual maximum peak flow atintervals whose average length is 100 years (that is, oncein 100 years, on average); almost two-thirds of allexceedances of the 100-year flood occur less than 100years after the previous exceedance, half occur less than70 years after the previous exceedance, and about one-eighth occur more than 200 years after the previousexceedance. Similarly, the 7-day 10-year low flow (7Q10)is the flow rate below which the annual minimum 7-day-mean flow dips at intervals whose average length is 10years (that is, once in 10 years, on average); almost two-thirds of the non-exceedances of the 7Q10 occur less than10 years after the previous non-exceedance, half occurless than 7 years after, and about one-eighth occur morethan 20 years after the previous non-exceedance. Therecurrence interval for annual events is the reciprocal ofthe annual proba-bility of occurrence. Thus, the 100-yearflood has a 1-percent chance of being exceeded by themaximum peak flow in any year, and there is a 10-percent chance in any year that the annual minimum 7-day-mean flow will be less than the 7Q10.
Replicate samples are a group of samples collected in amanner such that the samples are thought to beessentially identical in composition.
Return period (See “Recurrence interval”)
River mileage is the curvilinear distance, in miles,measured upstream from the mouth along themeandering path of a stream channel in accordance withBulletin No. 14 (October 1968) of the Water ResourcesCouncil, and typically used to denote location along ariver.
Runoff is the quantity of water that is discharged (“runsoff”) from a drainage basin in a given time period.Runoff data may be presented as volumes in acre-feet, asmean discharges per unit of drainage area in cubic feetper second per square mile, or as depths of water on thedrainage basin in inches. (See also “Annual runoff”)
Sea level, as used in this report, refers to one of the twocommonly used national vertical datums, (NGVD 1929or NAVD 1988). See separate entries for definitions ofthese datums. See conversion of units page (inside backcover) for identification of the datum used in this report.
Sediment is solid material that originates mostly fromdisintegrated rocks; when transported by, suspended in,or deposited from water, it is referred to as “fluvialsediment.” Sediment includes chemical and biochem-icalprecipitates and decomposed organic material, such ashumus. The quantity, characteristics, and cause of theoccurrence of sediment in streams are influenced by
environmental and land-use factors. Some major factorsare topography, soil charac-teristics, land cover, anddepth and intensity of precipitation.
Seven-day 10-year low flow (7Q10) is the dischargebelow which the annual 7-day minimum flow falls in1 year out of 10 on the long-run average. The recurrenceinterval of the 7Q10 is 10 years; the chance that theannual 7-day minimum flow will be less than the 7Q10 is10 percent in any given year. (See also “Recurrenceinterval” and “Annual 7-day minimum”)
Sodium adsorption ratio (SAR) is the expression ofrelative activity of sodium ions in exchange reactionswithin soil and is an index of sodium or alkali hazard tothe soil. Sodium hazard in water is an index that can beused to evaluate the suitability of water for irrigatingcrops.
Specific electrical conductance (conductivity) is ameasure of the capacity of water (or other media) toconduct an electrical current. It is expressed inmicrosiemens per centimeter at 25 °C. Specific electricalconductance is a function of the types and quantity ofdissolved substances in water and can be used forapproximating the dissolved-solids content of the water.Commonly, the concentration of dissolved solids (inmilligrams per liter) is from 55 to 75 percent of thespecific conductance (in microsiemens). This relation isnot constant from stream to stream, and it may vary inthe same source with changes in the composition of thewater.
Stable isotope ratio (per MIL/MIL) is a unit expressingthe ratio of the abundance of two radioactive isotopes.Isotope ratios are used in hydrologic studies to deter-mine the age or source of specific waters, to evaluatemixing of different waters, as an aid in determiningreaction rates, and other chemical or hydrologicprocesses.
Stage (See “Gage height”)
Stage-discharge relation is the relation between thewater-surface elevation, termed stage (gage height), andthe volume of water flowing in a channel per unit time.
Streamflow is the discharge that occurs in a naturalchannel. Although the term “discharge” can be applied tothe flow of a canal, the word “streamflow” uniquelydescribes the discharge in a surface stream course. Theterm “streamflow” is more general than “runoff” asstreamflow may be applied to discharge whether or not itis affected by diversion or regulation.
Substrate is the physical surface upon which an organismlives.
Substrate Embeddedness Class is a visual estimate ofriffle streambed substrate larger than gravel that issurrounded or covered by fine sediment (<2mm, sand orfiner). Below are the class categories expressed aspercent covered by fine sediment:
WATER RESOURCES DATA FOR WASHINGTON 2001 37
0 < no gravel or larger substrate1 > 75%2 51-75% 4 5-25%3 26-50% 5 < 5%
Surface area of a lake is that area (acres) encompassed bythe boundary of the lake as shown on USGS topographicmaps, or other available maps or photo-graphs. Becausesurface area changes with lake stage, surface areas listedin this report represent those determined for the stage atthe time the maps or photographs were obtained.
Surficial bed material is the upper surface (0.1 to 0.2 ft)of the bed material such as that material which issampled using U.S. Series Bed-Material Samplers.
Suspended (as used in tables of chemical analyses) refersto the amount (concentration) of undissolved material ina water-sediment mixture. It is opera-tionally defined asthe material retained on a0.45-micrometer filter.
Suspended, recoverable is the amount of a givenconstituent that is in solution after the part of arepresentative suspended water-sediment sample that isretained on a 0.45-micrometer membrane filter has beendigested by a method (usually using a dilute acidsolution) that results in dissolution of only readilysoluble substances. Complete dissolution of all theparticulate matter is not achieved by the digestiontreatment and thus the determination representssomething less than the “total” amount (that is, less than95 percent) of the constituent present in the sample. Toachieve comparability of analytical data, equivalentdigestion procedures are required of all laboratoriesperforming such analyses because different digestionprocedures are likely to produce different analyticalresults. Determinations of “suspended, recoverable”constituents are made either by directly analyzing thesuspended material collected on the filter or, morecommonly, by difference, based on determinations of (1)dissolved and (2) total recoverable concentrations of theconstituent. (See also “Suspended”)
Suspended sediment is the sediment maintained insuspension by the upward components of turbulentcurrents or that exists in suspension as a colloid.(See also “Sediment”)
Suspended-sediment concentration is the velocity-weighted concentration of suspended sediment in thesampled zone (from the water surface to a pointapproximately 0.3 ft above the bed) expressed asmilligrams of dry sediment per liter of water-sedimentmixture (mg/L). The analytical technique uses the massof all of the sediment and the net weight of the water-sediment mixture in a sample to compute the suspended-sediment concentration. (See also “Sediment” and“Suspended sediment”)
Suspended-sediment discharge (tons/day) is the rate ofsediment transport, as measured by dry mass or volume,that passes a cross section in a given time. It is calculatedin units of tons per day as follows: concentration (mg/L) xdischarge (ft3/s) x 0.0027.
(See also “Sediment,” “Suspended sediment,” and“Suspended-sediment concentration”)
Suspended-sediment load is a general term that refers toa given characteristic of the material in suspension thatpasses a point during a specified period of time. Theterm needs to be qualified, such as “annual suspended-sediment load” or “sand-size suspended-sediment load,”and so on. It is not synonymous with either suspended-sediment discharge or concentration. (See also“Sediment”)
Suspended, total is the total amount of a given con-stituent in the part of a water-sediment sample that isretained on a 0.45-micrometer membrane filter. Thisterm is used only when the analytical procedure assuresmeasurement of at least 95 percent of the constituentdetermined. Knowledge of the expected form of theconstituent in the sample, as well as the analyticalmethodology used, is required to determine when theresults should be reported as “suspended, total.”Determinations of “suspended, total” constituents aremade either by directly analyzing portions of thesuspended material collected on the filter or, morecommonly, by difference, based on determinations of(1) dissolved and (2) total concentrations of theconstituent. (See also “Suspended”)
Suspended solids, total residue at 105 ˚C concentrationis the concentration of inorganic and organic materialretained on a filter, expressed as milligrams of drymaterial per liter of water (mg/L). An aliquot of thesample is used for this analysis.
Synoptic studies are short-term investigations of specificwater-quality conditions during selected seasonal orhydrologic periods to provide improved spatialresolution for critical water-quality conditions. For theperiod and conditions sampled, they assess the spatialdistribution of selected water-quality conditions inrelation to causative factors, such as land use andcontaminant sources.
Taxa richness is the total number of distinct species orgroups and usually decreases with pollution. (See also“Percent Shading”)
Taxonomy is the division of biology concerned with theclassification and naming of organisms. The classi-fication of organisms is based upon a hierarchicalscheme beginning with Kingdom and ending withSpecies at the base. The higher the classification level,the fewer features the organisms have in common. Forexample, the taxonomy of a particular mayfly,Hexagenia limbata, is the following:
Kingdom: AnimalPhylum: ArthropodaClass: InsectaOrder: EphemeropteraFamily: EphemeridaeGenus: HexageniaSpecies: Hexagenia limbata

38 WATER RESOURCES DATA FOR WASHINGTON 2001
Temperature preferences:
Cold – preferred water temperature for the species is lessthan 20 ˚C or spawning temperature preference less than16 ˚C and native distribution is considered to bepredominantly north of 45˚ N. latitude.
Warm – preferred water temperatures for the species isgreater than 20 ˚C or spawning temperature preferencegreater than 16 ˚C and native distribution is considered tobe predominantly south of 45˚ N. latitude.
Cool – intermediate between cold and warm watertemperature preferences.
Thermograph is an instrument that continuously recordsvariations of temperature on a chart. The more generalterm “temperature recorder" is used in the tabledescriptions and refers to any instrument that recordstemperature whether on a chart, a tape, or any othermedium.
Time-weighted average is computed by multiplying thenumber of days in the sampling period by theconcentrations of individual constituents for thecorresponding period and dividing the sum of theproducts by the total number of days. A time-weightedaverage represents the composition of water resultingfrom the mixing of flow proportionally to the duration ofthe concentration.
Tons per acre-foot (T/acre-ft) is the dry mass (tons) of aconstituent per unit volume (acre-foot) of water. It iscomputed by multiplying the concentration of theconstituent, in milligrams per liter, by 0.00136.
Tons per day (T/DAY, tons/d) is a common chemical orsediment discharge unit. It is the quantity of a substancein solution, in suspension, or as bedload that passes astream section during a 24-hour period. It is equivalent to2,000 pounds per day, or 0.9072 metric tons per day.
Total is the amount of a given constituent in arepresentative whole-water (unfiltered) sample,regardless of the constituent’s physical or chemical form.This term is used only when the analytical procedureassures measurement of at least 95 percent of theconstituent present in both the dissolved and suspendedphases of the sample. A knowledge of the expected formof the constituent in the sample, as well as the analyticalmethodology used, is required to judge when the resultsshould be reported as “total.” (Note that the word “total”does double duty here, indicating both that the sampleconsists of a water-suspended sediment mixture and thatthe analytical method determined at least 95 percent ofthe constituent in the sample.)
Total coliform bacteria are a particular group of bacteriathat are used as indicators of possible sewage pollution.This group includes coliforms that inhabit the intestine ofwarm-blooded animals and those that inhabit soils. Theyare characterized as aerobic or facultative anaerobic,gram-negative, nonspore-forming, rod-shaped bacteriathat ferment lactose with gas formation within 48 hoursat 35 °C. In the laboratory, these bacteria are defined asall the organisms that produce colonies with a golden-
green metallic sheen within 24 hours when incubated at35 °C plus or minus 1.0 °C on M-Endo medium (nutrientmedium for bacterial growth). Their concentrations areexpressed as number of colonies per 100 mL of sample.(See also “Bacteria”)
Total discharge is the quantity of a given constituent,measured as dry mass or volume, that passes a streamcross section per unit of time. When referring toconstituents other than water, this term needs to bequalified, such as “total sediment discharge,” “totalchloride discharge,” and so on.
Total in bottom material is the amount of a givenconstituent in a representative sample of bottom material.This term is used only when the analytical procedureassures measurement of at least 95 percent of theconstituent determined. A knowledge of the expectedform of the constituent in the sample, as well as theanalytical methodology used, is required to judge whenthe results should be reported as “total in bottommaterial.”
Total length (fish) is the straight-line distance from theanterior point of a fish specimen’s snout, with the mouthclosed, to the posterior end of the caudal (tail) fin, withthe lobes of the caudal fin squeezed together.
Total load refers to all of a constituent in transport. Whenreferring to sediment, it includes suspended load plus bedload.
Total organism count is the number of organismscollected and enumerated in any particular sample. (Seealso “Organism count/volume.”)
Total recoverable is the amount of a given constituent in awhole-water sample after a sample has been digested bya method (usually using a dilute acid solution) thatresults in dissolution of only readily soluble substances.Complete dissolution of all particulate matter is notachieved by the digestion treatment, and thus thedetermination represents something less than the “total”amount (that is, less than 95 percent) of the constituentpresent in the dissolved and suspended phases of thesample. To achieve comparability of analytical data forwhole-water samples, equivalent digestion proceduresare required of all laboratories performing such analysesbecause different digestion procedures may producedifferent analytical results.
Total sediment discharge is the mass of suspended-sediment plus bed-load transport, measured as dryweight, that passes a cross section in a given time. It is arate and is reported as tons per day. (See also“Sediment,” “Suspended sediment,” “Suspended-Sediment Concentration,” “Bedload,” and “Bedloaddischarge”)
Total sediment load or total load is the sediment intransport as bedload and suspended-sediment load. Theterm may be qualified, such as “annual suspended-sediment load” or “sand-size suspended-sediment load,”and so on. It differs from total sediment discharge in thatload refers to the material whereas discharge refers to thequantity of material, expressed in units of mass per unit
WATER RESOURCES DATA FOR WASHINGTON 2001 39
time. (See also “Sediment,” “Suspended-SedimentLoad,” and “Total load”)
Trophic group:
Filter feeder – diet composed of suspended plant and/oranimal material.
Herbivore – diet composed predominantly of plantmaterial.
Invertivore – diet composed predominantly ofinvertebrates.
Omnivore – diet composed of at least 25-percent plantand 25-percent animal material.
Piscivore – diet composed predominantly of fish.
Turbidity is the reduction in the transparency of a solutiondue to the presence of suspended and some dissolvedsubstances. The measurement technique records thecollective optical properties of the solution that causelight to be scattered and attenuated rather thantransmitted in straight lines; the higher the intensity ofscattered or attenuated light, the higher the value of theturbidity. Turbidity is expressed innephelometric turbidity units (NTU). Depending on themethod used, the turbidity units as NTU can be definedas the intensity of light of a specified wavelengthscattered or attenuated by suspended particles orabsorbed at a method specified angle, usually 90 degrees,from the path of the incident light. Currently approvedmethods for the measurement of turbidity in the USGSinclude those that conform to EPA Method 180.1, ASTMD1889-00, and ISO 7027. Measurements of turbidity bythese different methods and different instruments areunlikely to yield equivalent values. Consequently, themethod of measurement and type of instrument used toderive turbidity records should be included in the“REMARKS” column of the Annual Data Report.
Ultraviolet (UV) absorbance (absorption) at 254 or280 nanometers is a measure of the aggregateconcentration of the mixture of UV absorbing organicmaterials dissolved in the analyzed water, such as lignin,tannin, humic substances, and various aromaticcompounds. UV absorbance (absorption) at 254 or 280nanometers is measured in UV absorption units percentimeter of pathlength of UV light through a sample.
Vertical datum (See “Datum”)
Volatile organic compounds (VOCs) are organiccompounds that can be isolated from the water phase of asample by purging the water sample with inert gas, suchas helium, and subsequently analyzed by gaschromatography. Many VOCs are human-madechemicals that are used and produced in the manu-factureof paints, adhesives, petroleum products,pharmaceuticals, and refrigerants. They are oftencomponents of fuels, solvents, hydraulic fluids, paintthinners, and dry cleaning agents commonly used inurban settings. VOC contamination of drinking-watersupplies is a human health concern because many aretoxic and are known or suspected human carcinogens(U.S. Environmental Protection Agency, 1996).
Water table is the level in the saturated zone at which thepressure is equal to the atmospheric pressure.
Water-table aquifer is an unconfined aquifer withinwhich is found the water table.
Water year in USGS reports dealing with surface-watersupply is the 12-month period October 1 throughSeptember 30. The water year is designated by thecalendar year in which it ends and which includes 9 ofthe 12 months. Thus, the year ending September 30,2001, is called the “2001 water year.”
WDR is used as an abbreviation for “Water-Data Report”in the REVISED RECORDS paragraph to refer to Stateannual hydrologic-data reports. (WRD was used as anabbreviation for “Water-Resources Data” in reportspublished prior to 1976.)
Weighted average is used in this report to indicatedischarge-weighted average. It is computed bymultiplying the discharge for a sampling period by theconcentrations of individual constituents for thecorresponding period and dividing the sum of theproducts by the sum of the discharges. A discharge-weighted average approximates the composition of waterthat would be found in a reservoir containing all thewater passing a given location during the water year afterthorough mixing in the reservoir.
Wet mass is the mass of living matter plus containedwater. (See also “Biomass” and “Dry mass”)
Wet weight refers to the weight of animal tissue or othersubstance including its contained water. (See also “Dryweight”)
WSP is used as an acronym for “Water-Supply Paper” inreference to previously published reports.
Zooplankton is the animal part of the plankton.Zooplankton are capable of extensive movements withinthe water column and are often large enough to be seenwith the unaided eye. Zooplankton are secondaryconsumers feeding upon bacteria, phytoplankton, anddetritus. Because they are the grazers in the aquaticenvironment, the zooplankton are a vital part of theaquatic food web. The zooplankton community isdominated by small crustaceans and rotifers. (See also“Plankton”)

40 WATER RESOURCES DATA FOR WASHINGTON 2001
TECHNIQUES OF WATER-RESOURCES INVESTIGATIONSOF THE U.S. GEOLOGICAL SURVEY
The U.S.G.S. publishes a series of manuals describing procedures for planning and conducting specializedwork in water-resources investigations. The material is grouped under major subject headings called books and isfurther divided into sections and chapters. For example, section A of book 3 (Applications of Hydraulics) pertains tosurface water. The chapter, the unit of publication, is limited to a narrow field of subject matter. This format permitsflexibility in revision and publication as the need arises.
The reports listed below are for sale by the U.S.G.S., Information Services, Box 25286, Federal Center, Den-ver, Colorado 80225 (authorized agent of the Superintendent of Documents, Government Printing Office). Prepay-ment is required. Remittance should be made in the form of a check or money order payable to the “U.S. GeologicalSurvey.” Prices are not included because they are subject to change. Current prices can be obtained by writing to theabove address. When ordering or inquiring about prices for any of these publications, please give the title, book num-ber, chapter number, and mention the “U.S. Geological Survey Techniques of Water-Resources Investigations.”
Book 1. Collection of Water Data by Direct Measurement
Section D. Water Quality
1-D1. Water temperature—influential factors, field measurement, and data presentation, by H.H. Stevens, Jr., J.F.Ficke, and G.F. Smoot: USGS–TWRI book 1, chap. D1. 1975. 65 p.
1-D2. Guidelines for collection and field analysis of ground-water samples for selected unstable constituents, byW.W. Wood: USGS–TWRI book 1, chap. D2. 1976. 24 p.
Book 2. Collection of Environmental Data
Section D. Surface Geophysical Methods
2-D1. Application of surface geophysics to ground-water investigations, by A.A.R. Zohdy, G.P. Eaton, and D.R.Mabey: USGS–TWRI book 2, chap. D1. 1974. 116 p.
2-D2. Application of seismic-refraction techniques to hydrologic studies, by F.P. Haeni: USGS–TWRI book 2,chap. D2. 1988. 86 p.
Section E. Subsurface Geophysical Methods
2-E1. Application of borehole geophysics to water-resources investigations, by W.S. Keys and L.M. MacCary:USGS–TWRI book 2, chap. E1. 1971. 126 p.
2-E2. Borehole geophysics applied to ground-water investigations, by W.S. Keys: USGS–TWRI book 2, chap. E2.1990. 150 p.
Section F. Drilling and Sampling Methods
2-F1. Application of drilling, coring, and sampling techniques to test holes and wells, by Eugene Shuter and W.E.Teasdale: USGS–TWRI book 2, chap. F1. 1989. 97 p.
Book 3. Applications of Hydraulics
Section A. Surface-Water Techniques
3-A1. General field and office procedures for indirect discharge measurements, by M.A. Benson andTate Dalrymple: USGS–TWRI book 3, chap. A1. 1967. 30 p.
3-A2. Measurement of peak discharge by the slope-area method, by Tate Dalrymple and M.A. Benson: USGS–TWRI book 3, chap. A2. 1967. 12 p.
3-A3. Measurement of peak discharge at culverts by indirect methods, by G.L. Bodhaine: USGS–TWRI book 3,chap. A3. 1968. 60 p.
3-A4. Measurement of peak discharge at width contractions by indirect methods, by H.F. Matthai: USGS-TWRIbook 3, chap. A4. 1967. 44 p.
3-A5. Measurement of peak discharge at dams by indirect methods, by Harry Hulsing: USGS–TWRI book 3,chap. A5. 1967. 29 p.
3-A6. General procedure for gaging streams, by R.W. Carter and Jacob Davidian: USGS–TWRI book 3, chap. A6.1968. 13 p.

WATER RESOURCES DATA FOR WASHINGTON 2001 41
PUBLICATIONS ON TECHNIQUES OF WATER-RESOURCES INVESTIGATIONS—Continued
3-A7. Stage measurement at gaging stations, by T.J. Buchanan and W.P. Somers: USGS–TWRI book 3, chap. A7.1968. 28 p.
3-A8. Discharge measurements at gaging stations, by T.J. Buchanan and W.P. Somers: USGS–TWRI book 3,chap. A8. 1969. 65 p.
3-A9. Measurement of time of travel in streams by dye tracing, by F.A. Kilpatrick and J.F. Wilson, Jr.: USGS–TWRI book 3, chap. A9. 1989. 27 p.
3-Al0. Discharge ratings at gaging stations, by E.J. Kennedy: USGS–TWRI book 3, chap. A10. 1984. 59 p.
3-A11. Measurement of discharge by the moving-boat method, by G.F. Smoot and C.E. Novak: USGS–TWRI book3, chap. A11. 1969. 22 p.
3-A12. Fluorometric procedures for dye tracing, Revised, by J.F. Wilson, Jr., E.D. Cobb, and F.A. Kilpatrick:USGS–TWRI book 3, chap. A12. 1986. 34 p.
3-A13. Computation of continuous records of streamflow, by E.J. Kennedy: USGS–TWRI book 3, chap. A13.1983. 53 p.
3-A14. Use of flumes in measuring discharge, by F.A. Kilpatrick and V.R. Schneider: USGS–TWRI book 3, chap.A14. 1983. 46 p.
3-A15. Computation of water-surface profiles in open channels, by Jacob Davidian: USGS–TWRI book 3, chap.A15. 1984. 48 p.
3-A16. Measurement of discharge using tracers, by F.A. Kilpatrick and E.D. Cobb: USGS–TWRI book 3, chap.A16. 1985. 52 p.
3-A17. Acoustic velocity meter systems, by Antonius Laenen: USGS–TWRI book 3, chap. A17. 1985. 38 p.
3-A18. Determination of stream reaeration coefficients by use of tracers, by F.A. Kilpatrick, R.E. Rathbun,Nobuhiro Yotsukura, G.W. Parker, and L.L. DeLong: USGS–TWRI book 3, chap. A18. 1989. 52 p.
3-A19. Levels at streamflow gaging stations, by E.J. Kennedy: USGS–TWRI book 3, chap. A19. 1990. 31 p.
3-A20. Simulation of soluable waste transport and buildup in surface waters using tracers, by F.A. Kilpatrick:USGS–TWRI book 3, chap. A20. 1993. 38 p.
3-A21 Stream-gaging cableways, by C. Russell Wagner: USGS–TWRI book 3, chap. A21. 1995. 56 p.
Section B. Ground-Water Techniques
3-B1. Aquifer-test design, observation, and data analysis, by R.W. Stallman: USGS–TWRI book 3, chap. B1.1971. 26 p.
3-B2. Introduction to ground-water hydraulics, a programed text for self-instruction, by G.D. Bennett: USGS–TWRI book 3, chap. B2. 1976. 172 p.
3-B3. Type curves for selected problems of flow to wells in confined aquifers, by J.E. Reed: USGS–TWRI book 3,chap. B3. 1980. 106 p.
3-B4. Regression modeling of ground-water flow, by R.L. Cooley and R.L. Naff: USGS–TWRI book 3, chap. B4.1990. 232 p.
3-B4. Supplement 1. Regression modeling of ground-water flow--Modifications to the computer code for nonlinearregression solution of steady-state ground-water flow problems, by R.L. Cooley: USGS–TWRI book 3,chap. B4. 1993. 8 p.
3-B5. Definition of boundary and initial conditions in the analysis of saturated ground-water flow systems—Anintroduction, by O.L. Franke, T.E. Reilly, and G.D. Bennett: USGS–TWRI book 3, chap. B5. 1987. 15 p.
3-B6. The principle of superposition and its application in ground-water hydraulics, by T.E. Reilly, O.L. Franke,and G.D. Bennett: USGS–TWRI book 3, chap. B6. 1987. 28 p.
3-B7. Analytical solutions for one-, two-, and three-dimensional solute transport in ground-water systems withuniform flow, by E.J. Wexler: USGS–TWRI book 3, chap. B7. 1992. 190 p.
3-B8. System and boundary conceptualization in ground-water flow simulation, by T.E. Reilly: USGS-TWRI book3, chap. B8. 2001. 29 p.

42 WATER RESOURCES DATA FOR WASHINGTON 2001
PUBLICATIONS ON TECHNIQUES OF WATER-RESOURCES INVESTIGATIONS—Continued
Section C. Sedimentation and Erosion Techniques
3-C1. Fluvial sediment concepts, by H.P. Guy: USGS–TWRI book 3, chap. C1. 1970. 55 p.
3-C2. Field methods for measurement of fluvial sediment, by T.K. Edwards and G.D. Glysson: USGS–TWRI book3, chap. C2. 1999. 89 p.
3-C3. Computation of fluvial-sediment discharge, by George Porterfield: USGS–TWRI book 3, chap. C3. 1972.66 p.
Book 4. Hydrologic Analysis and Interpretation
Section A. Statistical Analysis
4-A1. Some statistical tools in hydrology, by H.C. Riggs: USGS–TWRI book 4, chap. A1. 1968. 39 p.
4-A2. Frequency curves, by H.C. Riggs: USGS–TWRI book 4, chap. A2. 1968. 15 p.
Section B. Surface Water
4-B1. Low-flow investigations, by H.C. Riggs: USGS–TWRI book 4, chap. B1. 1972. 18 p.
4-B2. Storage analyses for water supply, by H.C. Riggs and C.H. Hardison: USGS–TWRI book 4, chap. B2. 1973.20 p.
4-B3. Regional analyses of streamflow characteristics, by H.C. Riggs: USGS–TWRI book 4, chap. B3. 1973. 15 p.
Section D. Interrelated Phases of the Hydrologic Cycle
4-D1. Computation of rate and volume of stream depletion by wells, by C.T. Jenkins: USGS–TWRI book 4, chap.D1. 1970. 17 p.
Book 5. Laboratory Analysis
Section A. Water Analysis
5-A1. Methods for determination of inorganic substances in water and fluvial sediments, by M.J. Fishman and L.C.Friedman, editors: USGS–TWRI book 5, chap. A1. 1989. 545 p.
5-A2. Determination of minor elements in water by emission spectroscopy, by P.R. Barnett and E.C. Mallory, Jr.:USGS–TWRI book 5, chap. A2. 1971. 31 p.
5-A3. Methods for the determination of organic substances in water and fluvial sediments, edited byR.L. Wershaw, M.J. Fishman, R.R. Grabbe, and L.E. Lowe: USGS–TWRI book 5, chap. A3. 1987. 80 p.
5-A4. Methods for collection and analysis of aquatic biological and microbiological samples, by L.J. Britton andP.E. Greeson, editors: USGS–TWRI book 5, chap. A4. 1989. 363 p.
5-A5. Methods for determination of radioactive substances in water and fluvial sediments, by L.L. Thatcher, V.J.Janzer, and K.W. Edwards: USGS–TWRI book 5, chap. A5. 1977. 95 p.
5-A6. Quality assurance practices for the chemical and biological analyses of water and fluvial sediments, by L.C.Friedman and D.E. Erdmann: USGS–TWRI book 5, chap. A6. 1982. 181 p.
Section C. Sediment Analysis
5-C1. Laboratory theory and methods for sediment analysis, by H.P. Guy: USGS–TWRI book 5, chap. C1. 1969.58 p.
Book 6. Modeling Techniques
Section A. Ground Water
6-A1. A modular three-dimensional finite-difference ground-water flow model, by M.G. McDonald and A.W.Harbaugh: USGS–TWRI book 6, chap. A1. 1988. 586 p.
6-A2. Documentation of a computer program to simulate aquifer-system compaction using the modular finite-difference ground-water flow model, by S.A. Leake and D.E. Prudic: USGS–TWRI book 6, chap. A2. 1991.68 p.
6-A3. A modular finite-element model (MODFE) for areal and axisymmetric ground-water-flow problems, Part 1:Model Description and User’s Manual, by L.J. Torak: USGS–TWRI book 6, chap. A3. 1993. 136 p.
WATER RESOURCES DATA FOR WASHINGTON 2001 43
PUBLICATIONS ON TECHNIQUES OF WATER-RESOURCES INVESTIGATIONS—Continued
6-A4. A modular finite-element model (MODFE) for areal and axisymmetric ground-water-flow problems, Part 2:Derivation of finite-element equations and comparisons with analytical solutions, by R.L. Cooley: USGS–TWRI book 6, chap. A4. 1992. 108 p.
6-A5. A modular finite-element model (MODFE) for areal and axisymmetric ground-water-flow problems, Part 3:Design philosophy and programming details, by L.J. Torak: USGS–TWRI book 6, chap. A5. 1993. 243 p.
6-A6. A coupled surface-water and ground-water flow model (MODBRANCH) for simulation of stream-aquiferinteraction, by Eric D. Swain and Eliezer J. Wexler: USGS-TWRI book 6, chap. A5. 1996. 125 p.
Book 7. Automated Data Processing and Computations
Section C. Computer Programs
7-C1. Finite difference model for aquifer simulation in two dimensions with results of numerical experiments, byP.C. Trescott, G.F. Pinder, and S.P. Larson: USGS–TWRI book 7, chap. C1. 1976. 116 p.
7-C2. Computer model of two-dimensional solute transport and dispersion in ground water, by L.F. Konikow andJ.D. Bredehoeft: USGS–TWRI book 7, chap. C2. 1978. 90 p.
7-C3. A model for simulation of flow in singular and interconnected channels, by R.W. Schaffranek, R.A. Baltzer,and D.E. Goldberg: USGS–TWRI book 7, chap. C3. 1981. 110 p.
Book 8. Instrumentation
Section A. Instruments for Measurement of Water Level
8-A1. Methods of measuring water levels in deep wells, by M.S. Garber and F.C. Koopman: USGS–TWRI book 8,chap. A1. 1968. 23 p.
8-A2. Installation and service manual for U.S. Geological Survey manometers, by J.D. Craig: USGS–TWRI book8, chap. A2. 1983. 57 p.
Section B. Instruments for Measurement of Discharge
8-B2. Calibration and maintenance of vertical-axis type current meters, by G.F. Smoot and C.E. Novak: USGS–TWRI book 8, chap. B2. 1968. 15 p.
Book 9. Handbooks for Water-Resources Investigations
Section A. National Field Manual for the Collection of Water-Quality Data
9-A1. National Field Manual for the Collection of Water-Quality Data: Preparations for Water Sampling, by F.D.Wilde, D.B. Radtke, Jacob Gibs, and R.T. Iwatsubo: USGS–TWRI book 9, chap. A1. 1998. 47 p.
9-A2. National Field Manual for the Collection of Water-Quality Data: Selection of Equipment for WaterSampling, edited by F.D. Wilde, D.B. Radtke, Jacob Gibs, and R.T. Iwatsubo: USGS–TWRI book 9, chap.A2. 1998. 94 p.
9-A3. National Field Manual for the Collection of Water-Quality Data: Cleaning of Equipment for WaterSampling, edited by F.D. Wilde, D.B. Radtke, Jacob Gibs, and R.T. Iwatsubo: USGS–TWRI book 9, chap.A3. 1998. 75 p.
9-A4. National Field Manual for the Collection of Water-Quality Data: Collection of Water Samples, edited byF.D. Wilde, D.B. Radtke, Jacob Gibs, and R.T. Iwatsubo: USGS–TWRI book 9, chap. A4. 1999. 156 p.
9-A5. National Field Manual for the Collection of Water-Quality Data: Processing of Water Samples, edited byF.D. Wilde, D.B. Radtke, Jacob Gibs, and R.T. Iwatsubo: USGS–TWRI book 9, chap. A5. 1999. 149 p.
9-A6. National Field Manual for the Collection of Water-Quality Data: Field Measurements, edited by F.D. Wildeand D.B. Radtke: USGS–TWRI book 9, chap. A6. 1998. Variously paginated.
9-A7. National Field Manual for the Collection of Water-Quality Data: Biological Indicators, edited byD.N. Myers and F.D. Wilde: USGS–TWRI book 9, chap. A7. 1997 and 1999. Variously paginated.
9-A8. National Field Manual for the Collection of Water-Quality Data: Bottom-material samples, by D.B. Radtke:USGS–TWRI book 9, chap. A8. 1998. 48 p.
9-A9. National Field Manual for the Collection of Water-Quality Data: Safety in Field Activities, by S.L. Lane andR.G. Fay: USGS–TWRI book 9, chap. A9. 1998. 60 p.
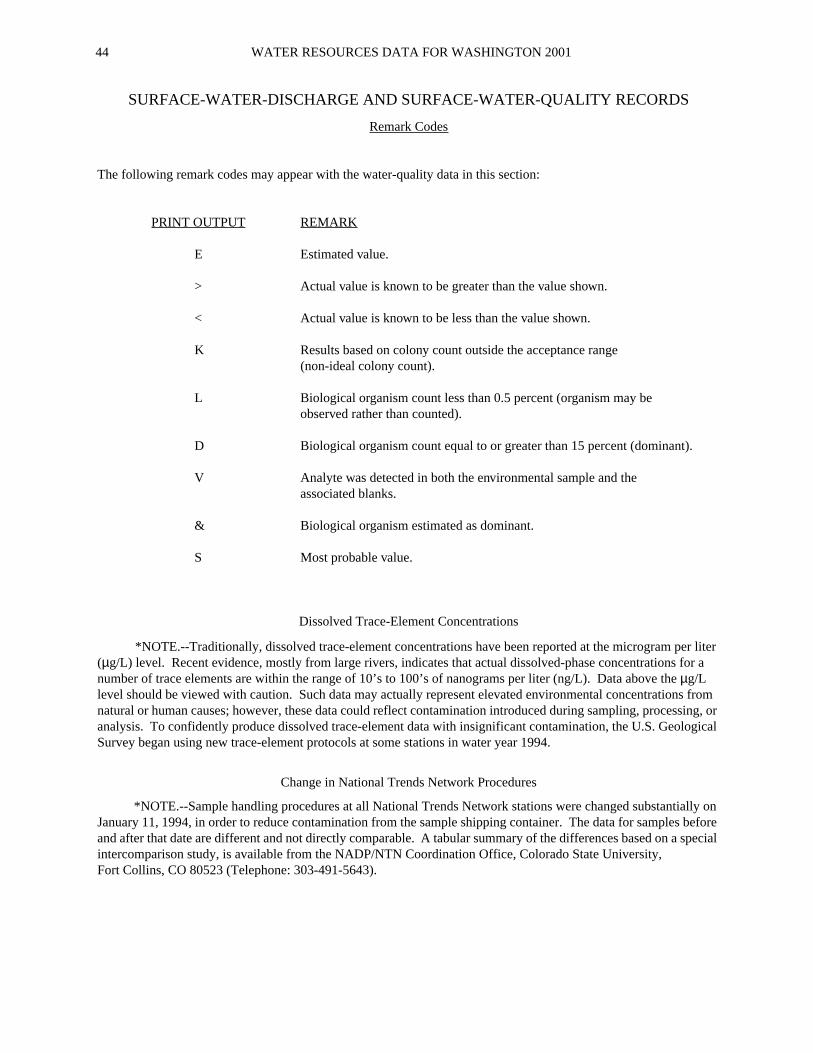
44 WATER RESOURCES DATA FOR WASHINGTON 2001
SURFACE-WATER-DISCHARGE AND SURFACE-WATER-QUALITY RECORDS
Remark Codes
The following remark codes may appear with the water-quality data in this section:
PRINT OUTPUT REMARK
E Estimated value.
> Actual value is known to be greater than the value shown.
< Actual value is known to be less than the value shown.
K Results based on colony count outside the acceptance range(non-ideal colony count).
L Biological organism count less than 0.5 percent (organism may beobserved rather than counted).
D Biological organism count equal to or greater than 15 percent (dominant).
V Analyte was detected in both the environmental sample and theassociated blanks.
& Biological organism estimated as dominant.
S Most probable value.
Dissolved Trace-Element Concentrations
*NOTE.--Traditionally, dissolved trace-element concentrations have been reported at the microgram per liter(µg/L) level. Recent evidence, mostly from large rivers, indicates that actual dissolved-phase concentrations for anumber of trace elements are within the range of 10’s to 100’s of nanograms per liter (ng/L). Data above the µg/Llevel should be viewed with caution. Such data may actually represent elevated environmental concentrations fromnatural or human causes; however, these data could reflect contamination introduced during sampling, processing, oranalysis. To confidently produce dissolved trace-element data with insignificant contamination, the U.S. GeologicalSurvey began using new trace-element protocols at some stations in water year 1994.
Change in National Trends Network Procedures
*NOTE.--Sample handling procedures at all National Trends Network stations were changed substantially onJanuary 11, 1994, in order to reduce contamination from the sample shipping container. The data for samples beforeand after that date are different and not directly comparable. A tabular summary of the differences based on a specialintercomparison study, is available from the NADP/NTN Coordination Office, Colorado State University,Fort Collins, CO 80523 (Telephone: 303-491-5643).
Related Documents