INTRODUCTION TO THE UNIFORM DATA SYSTEM FOR NEW SUBMITTERS Bureau of Primary Health Care October 15, 2014, 2-4 PM (EST)

Welcome message from author
This document is posted to help you gain knowledge. Please leave a comment to let me know what you think about it! Share it to your friends and learn new things together.
Transcript
INTRODUCTION TO THE UNIFORM DATA SYSTEM FOR NEW SUBMITTERS
Bureau of Primary Health Care October 15, 2014, 2-4 PM (EST)
Agenda
• Introducing the UDS • Importance of the UDS • Critical dates in the UDS process • Available Assistance • Overview of UDS Tables and Definitions • Cross Table Consistency in Reporting • Strategies for Successful Reporting
2
Why is the UDS Important?
• UDS data are used by the BPHC to: – Ensure compliance with legislative and regulatory
requirements – Report program achievements – Monitor performance and identify TA needs
• UDS data are used by programs to monitor and improve performance
3
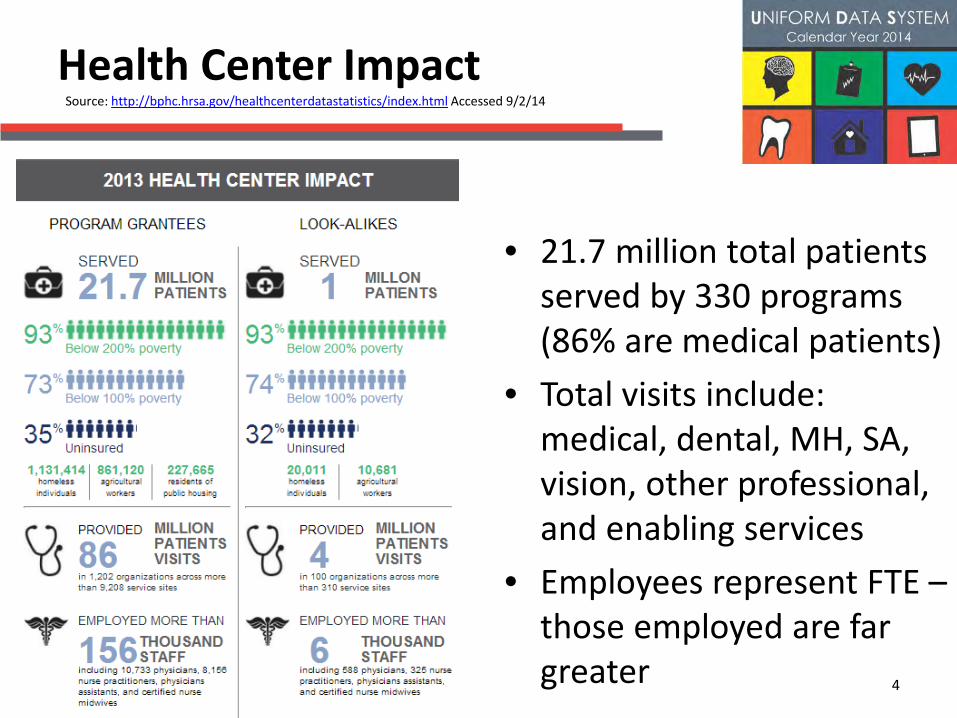
Health Center Impact
Source: http://bphc.hrsa.gov/healthcenterdatastatistics/index.html Accessed 9/2/14
4
• 21.7 million total patients served by 330 programs (86% are medical patients)
• Total visits include: medical, dental, MH, SA, vision, other professional, and enabling services
• Employees represent FTE – those employed are far greater

What is the Uniform Data System (UDS)?
• Standardized set of data reported by federal programs: – Section 330 Grantees – Community Health Center (CHC),
Health Care for the Homeless (HCH), Migrant Health Center (MHC) and Public Housing Primary Care Program (PHPC)
– Look-alikes – Urban Indian Health programs
• “Scope of Project” for the period January 1, 2014 - December 31, 2014
5
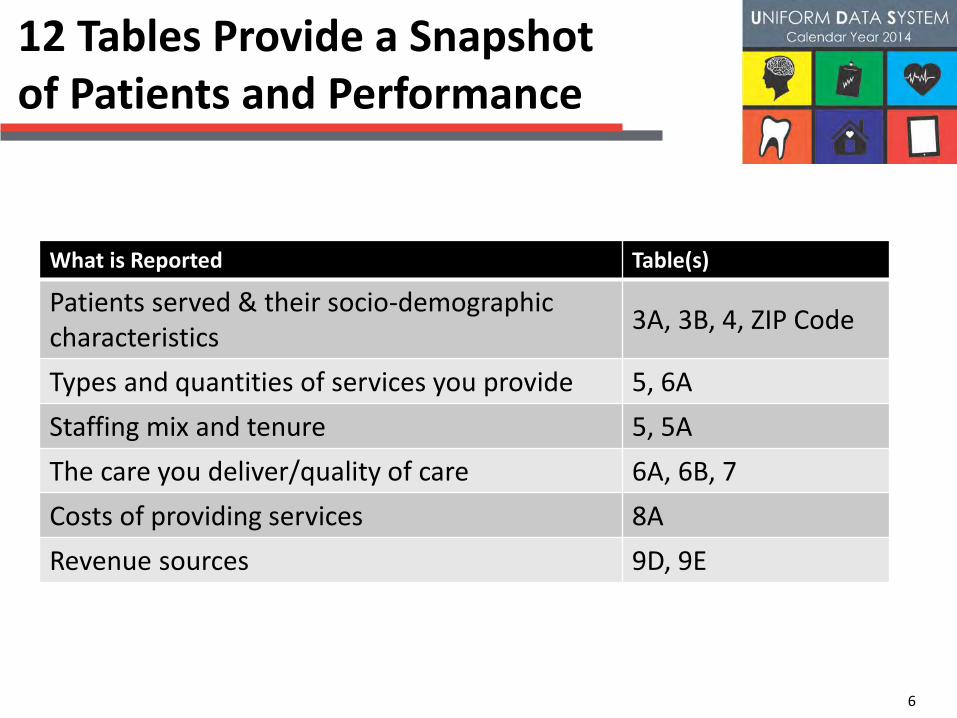
12 Tables Provide a Snapshot of Patients and Performance
6
What is Reported Table(s)
Patients served & their socio-demographic characteristics 3A, 3B, 4, ZIP Code
Types and quantities of services you provide 5, 6A Staffing mix and tenure 5, 5A The care you deliver/quality of care 6A, 6B, 7 Costs of providing services 8A Revenue sources 9D, 9E
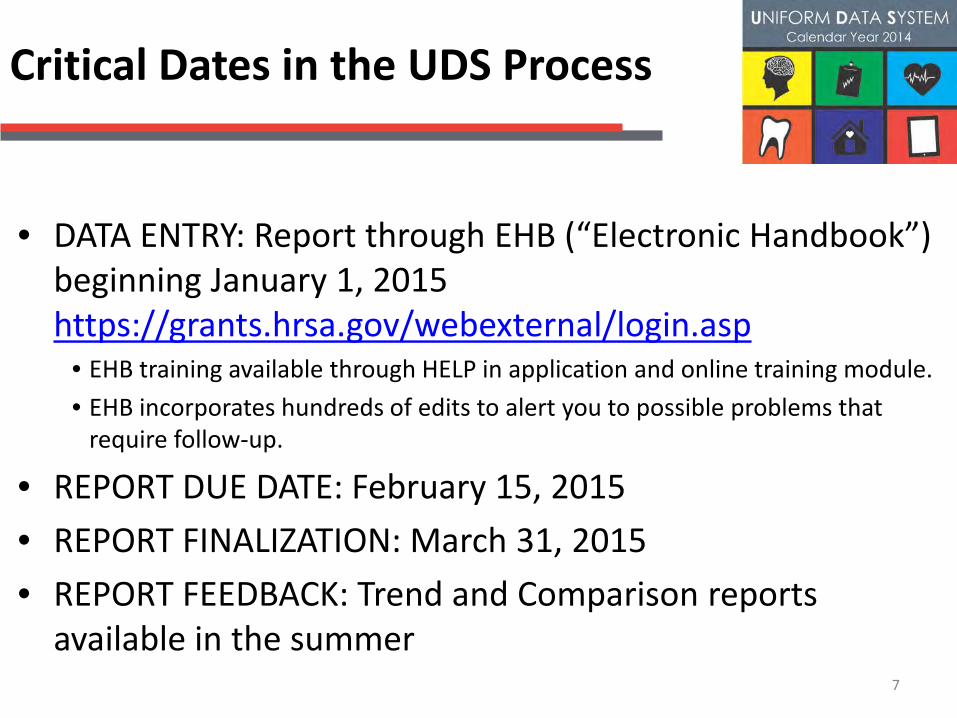
Critical Dates in the UDS Process
• DATA ENTRY: Report through EHB (“Electronic Handbook”) beginning January 1, 2015 https://grants.hrsa.gov/webexternal/login.asp
• EHB training available through HELP in application and online training module. • EHB incorporates hundreds of edits to alert you to possible problems that
require follow-up.
• REPORT DUE DATE: February 15, 2015 • REPORT FINALIZATION: March 31, 2015 • REPORT FEEDBACK: Trend and Comparison reports
available in the summer 7

Review Process
• Individualized Technical Review: – Report is assigned to a reviewer who works with you to
correct your data from February 15-March 31 – Reviewer checks tables to identify inconsistencies and
possible errors – Reviewer prepares a summary of issues – Reviewer works with you by phone and/or email to correct
your data
8

Available Assistance
• Regional in-person trainings • Webinars: look-alikes, clinical measures, sampling
methodology, & UDS changes for the coming year • Online training modules, manual, fact sheets, webinars,
and other TA materials available at: • http://www.bphcdata.net • http://bphc.hrsa.gov/healthcenterdatastatistics/reporting/index.html
9

Available Assistance
• Program Assistance Letters (PALs) • PAL 2014-01: Approved Uniform Data System Changes for Calendar Year 2014
http://bphc.hrsa.gov/policiesregulations/policies/pal201401.html • PAL 2014-02: 2014 Uniform Data System Reporting Changes for Look-Alikes
http://bphc.hrsa.gov/policiesregulations/policies/pdfs/pal201402.pdf
• Telephone and email support line for UDS reporting questions and use of UDS data: 866-UDS-HELP or [email protected]
• Technical support to review submission • EHB Support
• HRSA Call Center for EHB account access and roles: 877-464-4772 • BPHC Help Desk for EHB system issues: 301-443-7356
10

Available Webinars
Introduction to UDS Clinical Measures When: October 20, 2014 from 2:00 – 4:30 EST
Objectives: Review clinical performance measures (Table 6B and 7) and discuss strategies for accurate data collection and reporting
Introduction to the UDS for Look-alikes When: October 22, 2014 from 1:30 – 3 EST
Objectives: Review differences in reporting requirements and overview of review process
UDS Sampling Methods When: November 6, 2014 from 1:30 – 3 EST
Objectives: Review purpose of random sample and correct methods for generating random sample and chart substitutions
11

THE UDS TABLES
12

Table
1 BPHC 330-Funded Program and BHW
Primary Care Clinic: Universal Report
More than 1 BPHC 330-Funded Program:
Universal + Special Pop. Grant Reports
Look-Alike Health Center: Universal Report
ZIP Codes Yes n/a Yes
3A, 3B, 4 Yes Yes No Agricultural Worker or Health Care for the Homeless detail
5 Yes Visits & Patients, only Yes
5A Yes n/a Yes
6A Yes Yes Yes
6B Yes n/a Yes
7 Yes n/a Yes
8A Yes n/a Yes
9D Yes n/a Yes
9E Yes n/a No 330 grants
Who Reports Which Tables
13
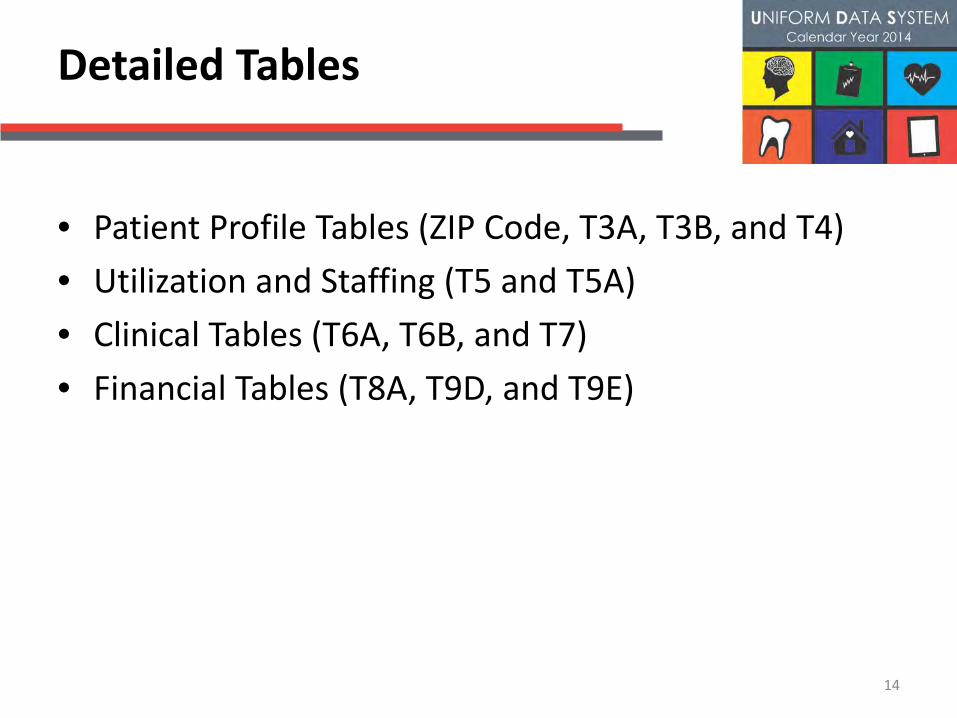
Detailed Tables
• Patient Profile Tables (ZIP Code, T3A, T3B, and T4) • Utilization and Staffing (T5 and T5A) • Clinical Tables (T6A, T6B, and T7) • Financial Tables (T8A, T9D, and T9E)
14
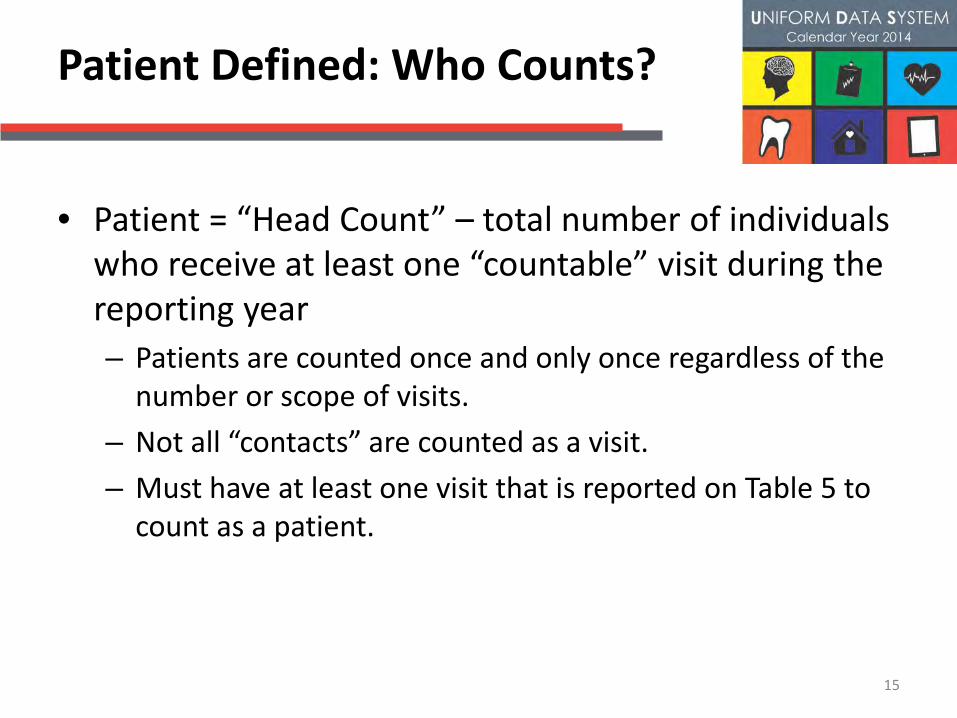
Patient Defined: Who Counts?
• Patient = “Head Count” – total number of individuals who receive at least one “countable” visit during the reporting year – Patients are counted once and only once regardless of the
number or scope of visits. – Not all “contacts” are counted as a visit. – Must have at least one visit that is reported on Table 5 to
count as a patient.
15
PATIENT PROFILE ZIP Code Table and Tables 3A, 3B, and 4
16

4 Patient Profile Tables
• Patients by ZIP Code (by primary medical insurance)
17
• Table 3A: Patients by Age and Gender – Table 3A Grant report:
completed for each additional 330 funding stream

4 Patient Profile Tables—continued
• Table 3B: Patients by Race and Ethnicity
• Tables 3B and 4 Grant report: completed for each additional funding stream
• Table 4: Patients by Income, Insurance, and Target Populations
18

Data Uses and Accuracy Checks for Patient Profile Tables
• Uses of Patient Profile Data: – Describes the patients you serve compared to target
populations – Maps your service area in UDS Mapper – Calculates indicators such as cost per patient, visits per
patient, etc. • Data Checks:
– ZIP codes, Table 3A, 3B, and 4 describe the SAME patients; totals must be equal
– Grant tables are subsets of the universe; no number can be greater than the universal report for the same field
19
KEY DEFINITIONS
20
Visits Defined: What Counts?
• Not all contacts with patients count as a visit • Face to face, one to one between patient and provider
– Exception: behavioral health (group and telemedicine) • The service must be documented in a patient chart.
• Include visits by paid, volunteer and contracted providers • Count paid referral, nursing home, hospital, home visits • Only 1 visit/patient/provider type/day
– Unless 2 different providers at 2 different sites • Only 1 visit/provider/patient/day regardless of number of
services provided
21
Visit Defined—What doesn’t Count?
• Do not count immunization only, lab only, dental varnishing or fluoride treatments, mass screenings, health fairs, outreach, or pharmacy visits
• No group health education, group diabetes sessions, etc.
• Not all staff report visits – No services are counted for ancillary services, medical
assistants, other enabling, non-health related services, non-clinical support staff
22

Full-time Equivalent (FTE) Defined
• Who is counted? All personnel who contribute to the operations of the health center at approved locations and within the scope of the project – Employees, contracted staff, residents, locums, and volunteers – Do not count paid referral provider FTEs
• How is FTE calculated? – 1.0 FTE is equivalent to one person working full-time for one year;
prorate part-time and part-year staff • Cannot use staff list as of December 31
– Report FTE based on work performed • FTEs can be allocated across multiple categories
– While most sites use 2080 hours as full time, some staff actually work 36 hour weeks or 35 hour weeks. If that is the case, than 1872 paid hours (36 X 52) might be one FTE.
23

Tenure Defined
• Who is counted? Providers and key management staff who contribute to the operations of the health center at approved locations and within the scope of the project – Full and Part Time Staff
– Employees (full- and part- time or year), on-site contracted staff, and NHSC assignees
– Other Service Providers – Residents, locum tenans, on-call providers, volunteers, and off-site contract providers
– Include persons working on last day of the year and those who have the day off, but are scheduled to return
– Do not count paid referral providers or individuals who may work many days but do not have a regular schedule
• How is Tenure calculated? – Head count of persons as of December 31 in consecutive months in
current position (months will be over 12 if the person has had the position for more than one year) 24

UTILIZATION AND STAFFING Tables 5 and 5A
25
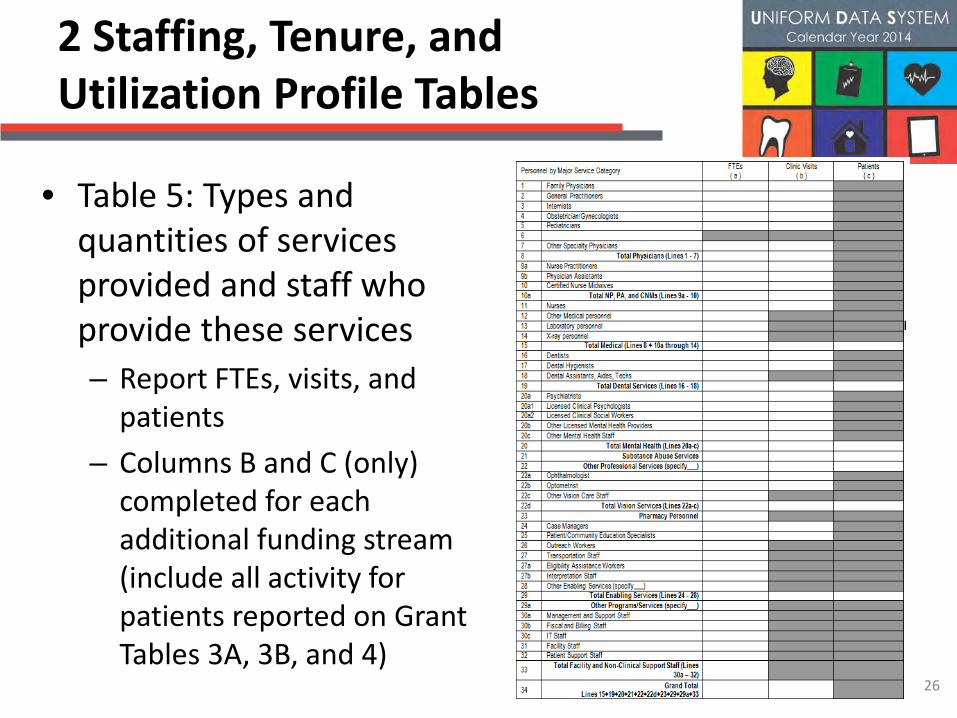
2 Staffing, Tenure, and Utilization Profile Tables
• Table 5: Types and quantities of services provided and staff who provide these services – Report FTEs, visits, and
patients – Columns B and C (only)
completed for each additional funding stream (include all activity for patients reported on Grant Tables 3A, 3B, and 4)
26 26
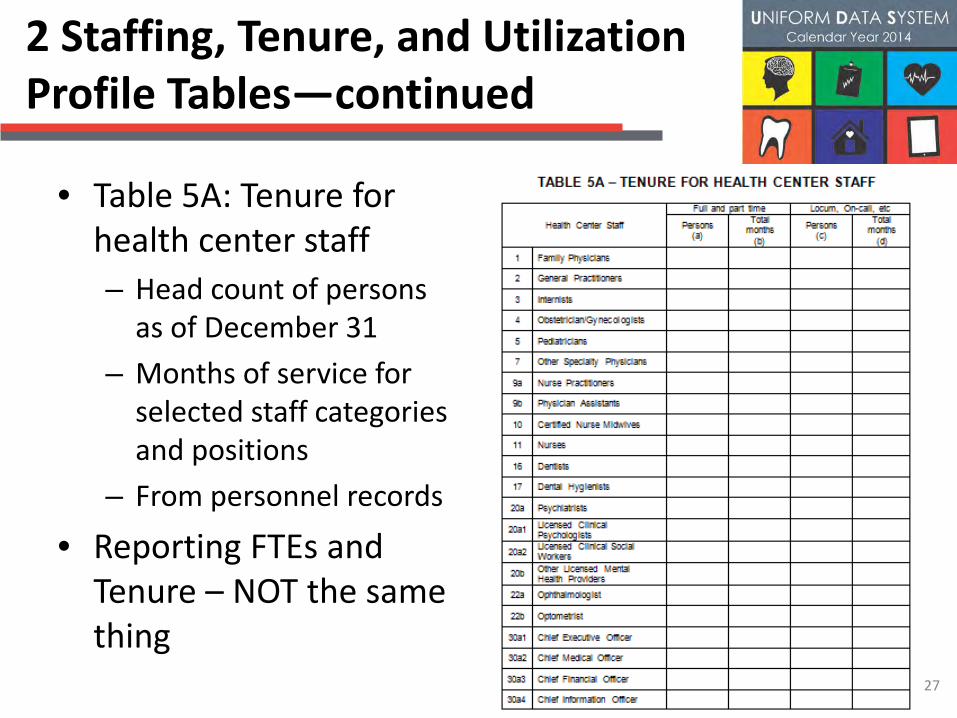
2 Staffing, Tenure, and Utilization Profile Tables—continued
• Table 5A: Tenure for health center staff – Head count of persons
as of December 31 – Months of service for
selected staff categories and positions
– From personnel records
• Reporting FTEs and Tenure – NOT the same thing
27 27

Data Uses and Accuracy Checks of Staffing and Utilization Profile
• Uses of Staffing, Tenure, and Utilization Data: – Used with other table data to calculate indicators such as cost per
visit, continuity of care, staffing levels, continuity of key staff, etc. • Data Checks:
– Total patients on ZIP Code Table, Tables 3A, 3B, and 4 cannot exceed patients on Table 5; this would mean patients were not included by service received or the total patient count has duplication
– Total patients on Table 5 will be greater than the total unduplicated count if multiple types of services are provided (e.g., medical and dental)
– Staffing relates to costs on Table 8A – Table 5A staffing, although relate to the staff reported on table 5, will
not equal the same numbers (FTE vs. head count) – Visits relate to revenues reported on Table 9D – Grant tables are subsets of the universe
28
CLINICAL TABLES Tables 6A, 6B, and 7 and EHR Capabilities and Quality Recognition
29
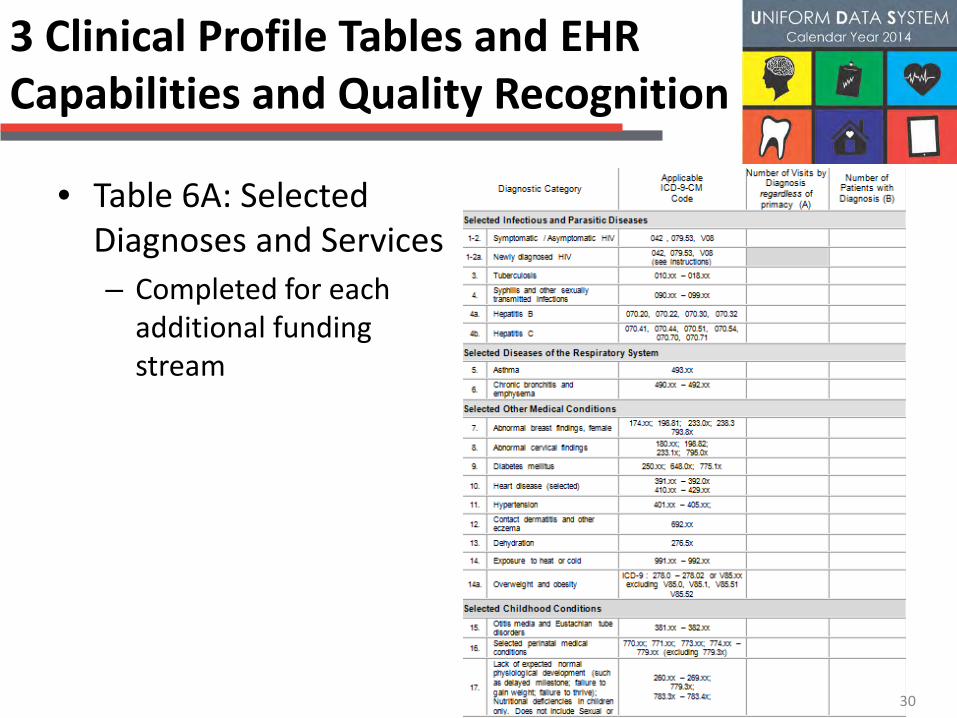
3 Clinical Profile Tables and EHR Capabilities and Quality Recognition
• Table 6A: Selected Diagnoses and Services – Completed for each
additional funding stream
30 30

3 Clinical Profile Tables and EHR Form — continued
• Table 6B: Quality of Care Indicators – “Process measures”:
If patients receive timely routine and preventive care, then we can expect improved health.
31
• Access to Prenatal Care (First Prenatal Visit in 1st Trimester)
• Childhood Immunization • Cervical Cancer Screening • Adolescent Weight Screening and Follow Up • Adult Weight Screening and Follow Up • Tobacco Use Screening and Cessation
Intervention • Asthma Treatment • Cholesterol Treatment (Lipid Therapy for
Coronary Artery Disease Patients) • Heart Attack/Stroke Treatment (Aspirin
Therapy for Ischemic Vascular Disease Patients)
• Colorectal Cancer Screening • Depression Screening and Follow Up • New HIV Cases with Timely Follow Up
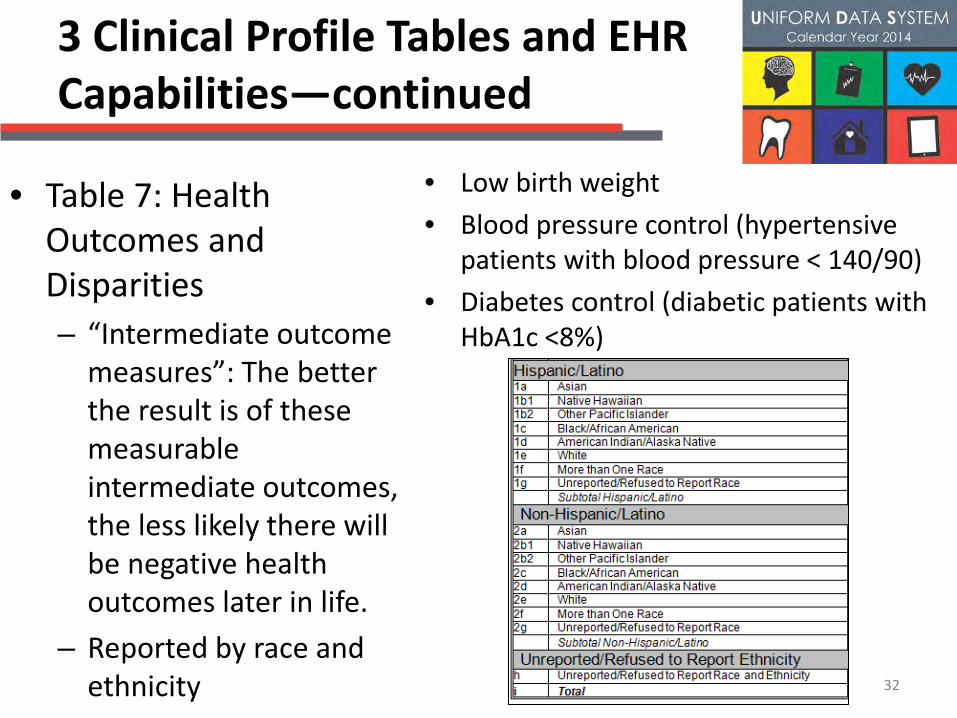
3 Clinical Profile Tables and EHR Capabilities—continued
• Table 7: Health Outcomes and Disparities – “Intermediate outcome
measures”: The better the result is of these measurable intermediate outcomes, the less likely there will be negative health outcomes later in life.
– Reported by race and ethnicity
• Low birth weight • Blood pressure control (hypertensive
patients with blood pressure < 140/90) • Diabetes control (diabetic patients with
HbA1c <8%)
32
Electronic Health Record (EHR) Capabilities and Quality Recognition
• Series of questions on health information technology (HIT) capabilities, including EHR interoperability and leverage for Meaningful Use. • Includes the implementation of EHR, certification of
systems, how widely adopted the system is throughout the health center and its providers, and national and/or state quality recognition (accreditation or PCMH)
33
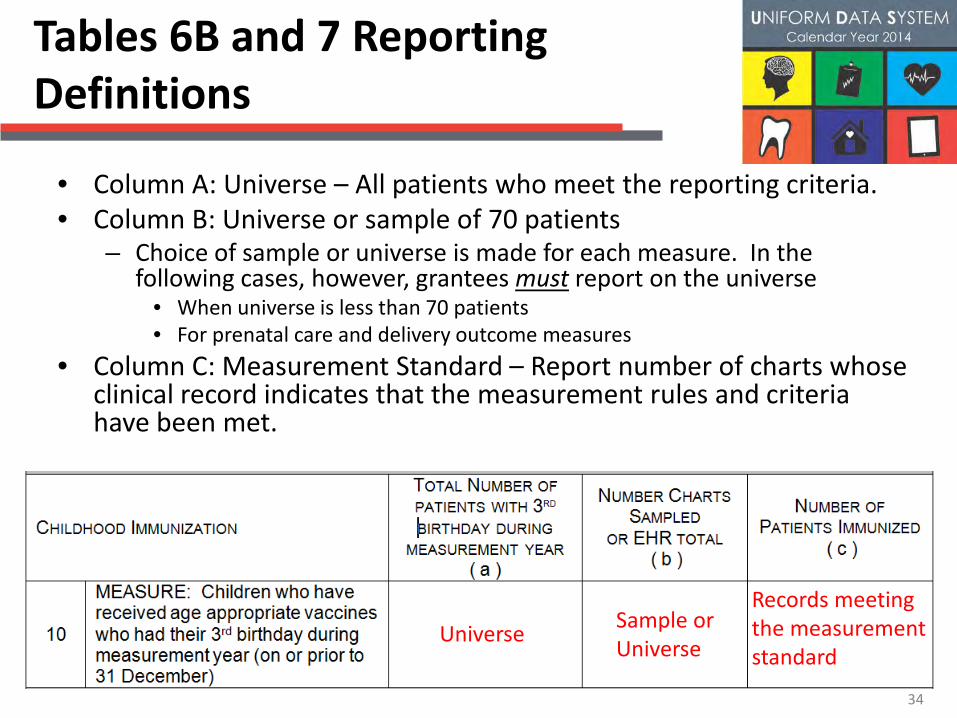
Tables 6B and 7 Reporting Definitions
• Column A: Universe – All patients who meet the reporting criteria. • Column B: Universe or sample of 70 patients
– Choice of sample or universe is made for each measure. In the following cases, however, grantees must report on the universe
• When universe is less than 70 patients • For prenatal care and delivery outcome measures
• Column C: Measurement Standard – Report number of charts whose clinical record indicates that the measurement rules and criteria have been met.
Universe Sample or Universe
Records meeting the measurement standard
34
Data Uses and Accuracy Checks of Clinical Profile
• Uses of Clinical Data: – Evaluate clinical performance level achievements of
preventive and chronic care services provided to patients – Monitor and identify quality improvement activities
• Data Checks: – Patients reported by health condition relates to patients
by age and gender (Table 3A), race and ethnicity (Table 3B), and medical care provided to patients (Table 5)
– Birth outcomes (Table 7) relate to prenatal patients (Table 6B)
35

FINANCIAL TABLES Tables 8A, 9D, and 9E
36

3 Financial Profile Tables
• Table 8A – Financial Costs – Column A = Total
accrued costs (by cost center)
– Column B = Allocation of total facility and non-clinical support (Line 16, Column A) to each cost center
37 37
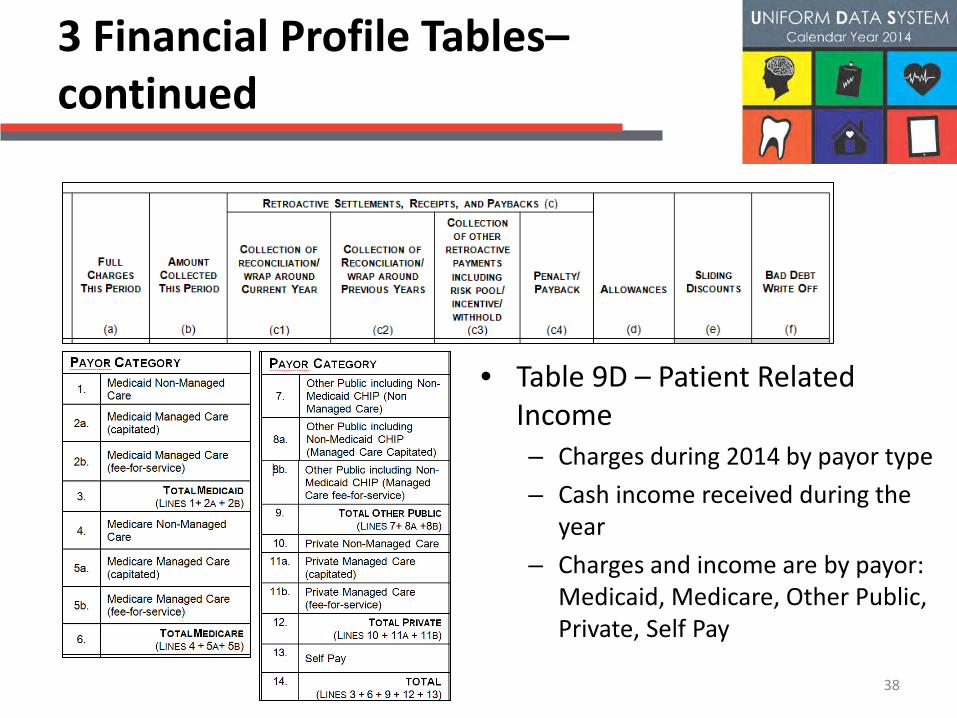
3 Financial Profile Tables–continued
• Table 9D – Patient Related Income – Charges during 2014 by payor type – Cash income received during the
year – Charges and income are by payor:
Medicaid, Medicare, Other Public, Private, Self Pay
38

3 Financial Tables—continued
• Table 9E – Other Income – Report:
• Income received in 2014 (on a cash basis) from grants, contracts, and other non-patient service related sources
• In category based on the last party to have the money before receipt of funds
– Do Not Report on Table 9E: • Money reported on Table 9D • Donations reported on Table
8A (e.g., “in-kind” facilities, services or supplies)
• Do not report capital received as loan 39
Data Uses and Accuracy Checks of Financial Profile
• Uses of Financial Data: – Evaluate financial viability (e.g., costs vs. income; fee
structure, payor mix)
• Data Checks: – Collections by payor are related to patients by insurance
enrollment on Table 4 for some categories of payors – Managed care income PMPM can be calculated – Charges on table 9D relate to visits on Table 5 – Costs on table 8A relate to income on tables 9D and 9E – Reclassification of charges
40

STRATEGIES FOR SUCCESSFUL REPORTING
41
Strategies for Successful Reporting
• Work as a team – Tables are interrelated.
• Adhere to definitions and instructions – Read manual, fact sheets, and other resources and
apply definitions.
42
Strategies for Successful Reporting Continued
• Check your data before submitting – Check data trends, relationships across tables, and
compare to benchmarks. – Address edits in EHB by correcting or providing
explanations that demonstrate your understanding. • That does not mean typing “number is correct” for every
questioned item. If it is correct, tell us how you verified the data.
– Report on time, but do not submit incomplete reports
• Work with your reviewer 43
Questions?

Thank You
Thank you for attending this webinar and for all of your efforts to provide comprehensive and
accurate data on the Health Center Program
Ongoing questions can be addressed to [email protected]
or 866-UDS-HELP
45
Related Documents