Introduction to Telling Stories with Data Author: Nicholas G Reich This material is part of the statsTeachR project Made available under the Creative Commons Attribution-ShareAlike 3.0 Unported License: http://creativecommons.org/licenses/by-sa/3.0/deed.en US

Welcome message from author
This document is posted to help you gain knowledge. Please leave a comment to let me know what you think about it! Share it to your friends and learn new things together.
Transcript

Introduction toTelling Stories with Data
Author: Nicholas G Reich
This material is part of the statsTeachR project
Made available under the Creative Commons Attribution-ShareAlike 3.0 UnportedLicense: http://creativecommons.org/licenses/by-sa/3.0/deed.en US

Communicating ideas with evidence
What is a narrative? [From the OED]
An account of a series of events, facts, etc., given in order andwith the establishing of connections between them; a narration, astory, an account.
What is data? [From Google: literally, “what is data”]


How to tell a story using data
Telling stories with data requires
I detective work
I creativity, both scientific and artistic
I experimentation with different storylines
I good data, (good data does not nescessarily equal “big data”)

A process for data analysis
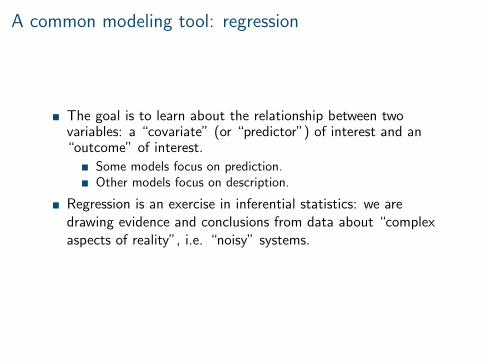
A common modeling tool: regression
� The goal is to learn about the relationship between twovariables: a “covariate” (or “predictor”) of interest and an“outcome” of interest.
� Some models focus on prediction.� Other models focus on description.
� Regression is an exercise in inferential statistics: we aredrawing evidence and conclusions from data about “complexaspects of reality”, i.e. “noisy” systems.

State-level SAT score data (1994-95)
Alabama
AlaskaArizona
Arkansas
California
Colorado
ConnecticutDelaware
Florida
Georgia
Hawaii
Idaho
Illinois
Indiana
Iowa
Kansas
Kentucky
Louisiana
MaineMarylandMassachusetts
Michigan
Minnesota
MississippiMissouri
Montana
Nebraska
Nevada
New Hampshire
New Jersey
New Mexico
New York
North Carolina
North Dakota
Ohio
Oklahoma
Oregon
PennsylvaniaRhode Island
South Carolina
South Dakota
Tennessee
Texas
Utah
VermontVirginia
WashingtonWest Virginia
Wisconsin
Wyoming
900
1000
1100
25 30 35 40 45 50
est. average public school teacher salary
aver
age
tota
l SAT
sco
re

State-level SAT score data (1994-95)
900
1000
1100
25 30 35 40 45 50
est. average public school teacher salary
aver
age
tota
l SAT
sco
re

State-level SAT score data (1994-95)
900
1000
1100
25 30 35 40 45 50
est. average public school teacher salary
aver
age
tota
l SAT
sco
re

The SAT example
What is the outcome variable?
What is the covariate or predictor variable?
What other data might be part of this story?
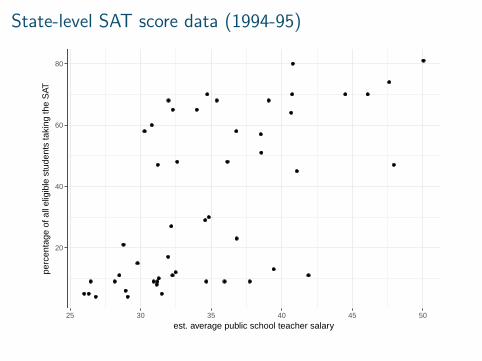
State-level SAT score data (1994-95)
20
40
60
80
25 30 35 40 45 50
est. average public school teacher salary
perc
enta
ge o
f all
elig
ible
stu
dent
s ta
king
the
SAT

State-level SAT score data (1994-95)
20
40
60
80
25 30 35 40 45 50
est. average public school teacher salary
perc
enta
ge o
f all
elig
ible
stu
dent
s ta
king
the
SAT
% taking SAT
low
medium
high

State-level SAT score data (1994-95)
900
1000
1100
25 30 35 40 45 50
est. average public school teacher salary
aver
age
tota
l SAT
sco
re
% taking SAT
low
medium
high

State-level SAT score data (1994-95)
low medium high
25 30 35 40 45 50 25 30 35 40 45 50 25 30 35 40 45 50
900
1000
1100
est. average public school teacher salary
aver
age
tota
l SAT
sco
re
% taking SAT
low
medium
high

State-level SAT score data (1994-95)
900
1000
1100
25 30 35 40 45 50
est. average public school teacher salary
aver
age
tota
l SAT
sco
re
% taking SAT
low
medium
high

State-level SAT score data (1994-95)
Alabama
AlaskaArizona
Arkansas
California
Colorado
ConnecticutDelaware
Florida
Georgia
Hawaii
Idaho
Illinois
Indiana
Iowa
Kansas
Kentucky
Louisiana
MaineMarylandMassachusetts
Michigan
Minnesota
MississippiMissouri
Montana
Nebraska
Nevada
New Hampshire
New Jersey
New Mexico
New York
North Carolina
North Dakota
Ohio
Oklahoma
Oregon
PennsylvaniaRhode Island
South Carolina
South Dakota
Tennessee
Texas
Utah
VermontVirginia
WashingtonWest Virginia
Wisconsin
Wyoming
900
1000
1100
25 30 35 40 45 50
est. average public school teacher salary
aver
age
tota
l SAT
sco
re
% taking SAT
low
medium
high

State-level SAT score data (1994-95)
What can we conclude from all of this? (BTW, this is an exampleof ”Simpson’s Paradox”.)
Regression modeling
The process of using data to describe the relationship betweenoutcomes and predictors is called modeling.
� Models are models, not reality.
� “All models are wrong, but some are useful.”
� Introduce structure to our model that balances realism with“goodness of fit”.

Things to come

Beware of correlation!


https://xkcd.com/552/

Appendix: Code for plotting
library(mosaicData)
library(ggplot2)
theme_set(theme_bw())
data(SAT)
SAT$fracgrp = cut(SAT$frac, breaks=c(0, 22, 49, 81),
labels=c("low", "medium", "high"))
ggplot(SAT) +
geom_text(aes(x=salary, y=sat, label=state), size=4, show.legend=FALSE) +
xlab("est. average public school teacher salary") +
ylab("average total SAT score")
More plotting code available here.
Related Documents