Introduction to statistics in medicine – Part 1 Arier Lee

Introduction to statistics in medicine – Part 1 Arier Lee.
Dec 17, 2015
Welcome message from author
This document is posted to help you gain knowledge. Please leave a comment to let me know what you think about it! Share it to your friends and learn new things together.
Transcript

Introduction to statistics in medicine – Part 1
Arier Lee

Introduction
• Who am I• Who do I work with• What do I do

Why do we need statistics
Population Sample

The important role of statistics in medicine
• Statisticians pervades every aspect of medical research
• Medical practice and research generates lots of data• Research involves asking lots of questions with
strong statistical aspects• The evaluation of new treatments, procedures and
preventative measures relies on statistical concepts in both design and analysis
• Statisticians are consulted at early stage of a medical study

Research process
Research question
Primary and secondary endpoints
Study design
Sampling and/or randomisation scheme
Power and sample size calculation
Pre-define analyses methods
Analyse data
Interpret results
Disseminate

• A form of systematic error that can affect scientific research
• Selection bias – well defined inclusion / exclusion criteria, randomisation
• Assessment bias – blinding• Response bias, lost-to-follow-up bias – maximise
response• Questionnaire bias – careful wording and good
interviewer training
Bias
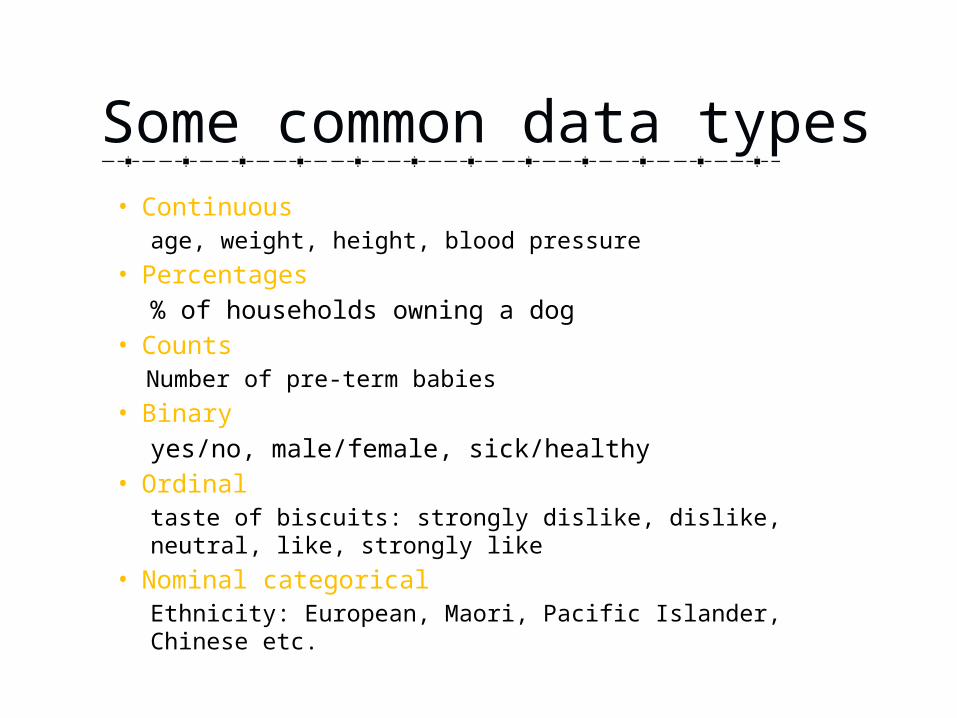
• Continuousage, weight, height, blood pressure
• Percentages% of households owning a dog
• CountsNumber of pre-term babies
• Binaryyes/no, male/female, sick/healthy
• Ordinaltaste of biscuits: strongly dislike, dislike, neutral, like, strongly like
• Nominal categoricalEthnicity: European, Maori, Pacific Islander, Chinese etc.
Some common data types
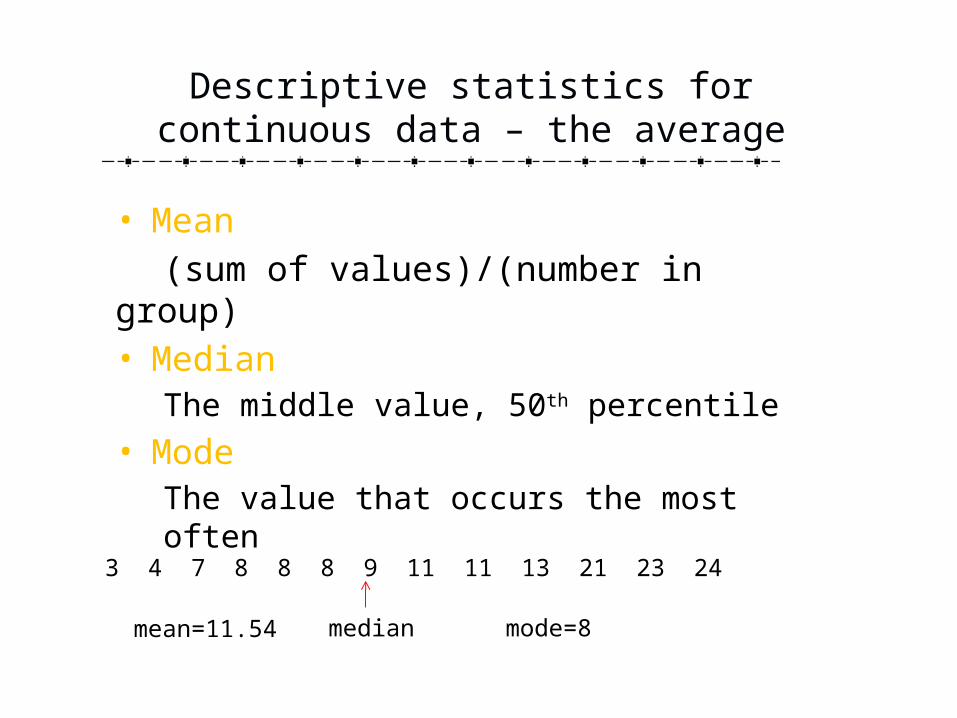
Descriptive statistics for continuous data – the average
• Mean(sum of values)/(number in group)
• MedianThe middle value, 50th percentile
• ModeThe value that occurs the most often
3 4 7 8 8 8 9 11 11 13 21 23 24
median mode=8mean=11.54

Descriptive statistics for continuous data – the spread
• RangeMinimum and maximum numbers
• Interquartile rangeQuartiles divide data into quarters
• Standard deviationA statistic that tells us how far away from the mean the data is spread (95% of the data lies between 2 SD) √ (xi - x) 2 /(n-1)
0, 1, 2, 5, 8, 8, 9, 10, 12, 14, 18, 20 21, 23, 25, 27, 34, 43
18 numbersQ1 Q2 Q3

– Estimation: determine value of a variable and its likely range (ie. 95% confidence intervals)
• Statistical inference is a process of generalising results calculated from a sample to a population
• We are interested in some numerical characteristic of a population (called a parameter). e.g. the mean height or the proportion of pregnant women with hypertension
• We take a sample from the population and calculate an estimate of this parameter
Estimation
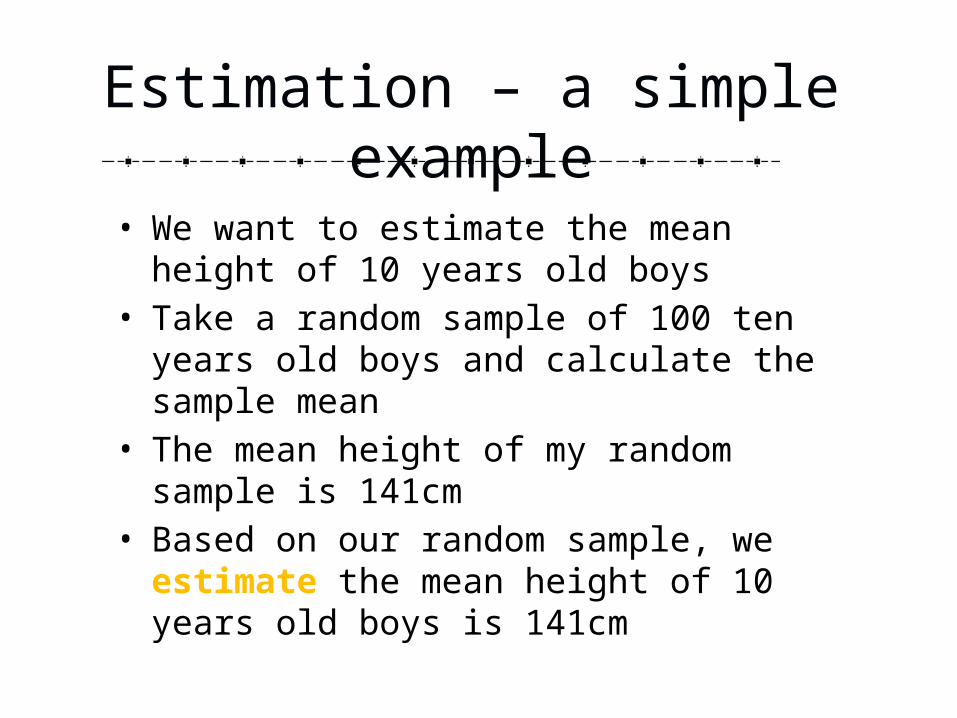
• We want to estimate the mean height of 10 years old boys
• Take a random sample of 100 ten years old boys and calculate the sample mean
• The mean height of my random sample is 141cm• Based on our random sample, we estimate the
mean height of 10 years old boys is 141cm
Estimation – a simple example

• It is essential to know the distribution of your data so you can choose the appropriate statistical method to analyse the data
• Data can be distributed (spread out) in different ways• Continuous data: There are many
cases when the data tends to be around a central value with no bias to the left or right – normal distribution
Distribution of Data

• Many parametric methods assumes data is normally distributed• Bell curve• Peak at a central value• Symmetric about the centre• Mean=median=mode• The distribution can be described by two parameters –
mean and standard deviation
Distribution of data – Normal distribution

• Standard deviation – shows how much variation or ‘dispersion’ exists in the data.
• 95% of the data are contained within 2 standard deviations
Standard deviation

A simulated example – Birth weight
Mean=3250gSD=550g
Histogram of birth weight
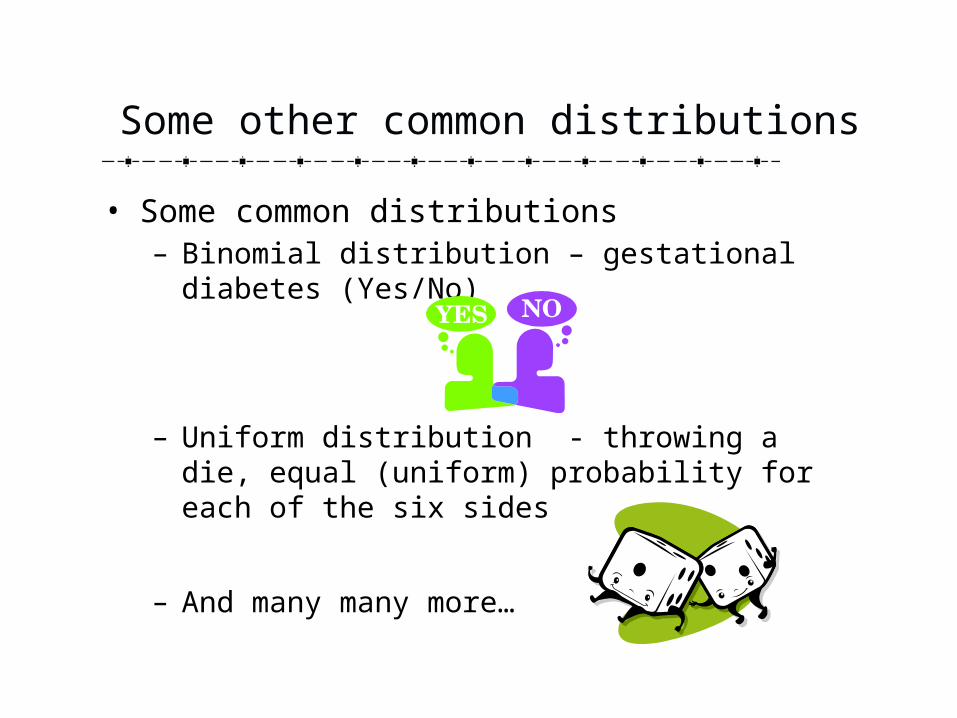
• Some common distributions– Binomial distribution – gestational diabetes (Yes/No)
– Uniform distribution - throwing a die, equal (uniform) probability for each of the six sides
– And many many more…
Some other common distributions

• Because of random sampling, the estimated value will be just an estimate – not exactly the same as the true value
• If repeated samples are taken from a population then each sample and hence sample mean and standard deviation is different. This is known as Sampling Variability
Sampling variability

• In practice we do not repeat the sampling to measure sampling variability we endeavour to obtain a random sample and use statistical theory to quantify the error
• Fundamental principle to justify our estimate is reasonable: If it were possible to repeat a study over and over again, in the long run the estimates of each study would be distributed around the true value
• If we have a random sample then the sampling variability depends on the size of the sample and the underlying variability of the variable being measured
Sampling variability
Related Documents