Introduction to Statistics and Research Design Arlo Clark-Foos

Welcome message from author
This document is posted to help you gain knowledge. Please leave a comment to let me know what you think about it! Share it to your friends and learn new things together.
Transcript
Introduction to Statistics and
Research Design
Arlo Clark-Foos

Dr. John Snow and Cholera
1854.London

Two Branches of Statistics
Descriptive Statistics
• Organize, summarize, & communicate
• Reduce large amounts of data
Inferential Statistics
• Uses sample data to make estimates about larger population
Public opinion on the future of gun legislation (Gallup, 2013):
MORE STRICT: 58% LESS STRICT: 6% KEPT AS IS: 34%
Public opinion on legalization of same-sex marriage (Gallup, 2013):
IN FAVOR: 54% AGAINST: 39%

Sample vs. Population
Sample: A set of observations drawn from the population of interest…
• Representative Sample:…that share the same characteristics as the population of interest.
• Latin characters (e.g., M, s), called statistics
Population: Includes all possible observations about which we’d like to know something.
• Greek characters (e.g., μ, σ), called parameters
Why use samples?
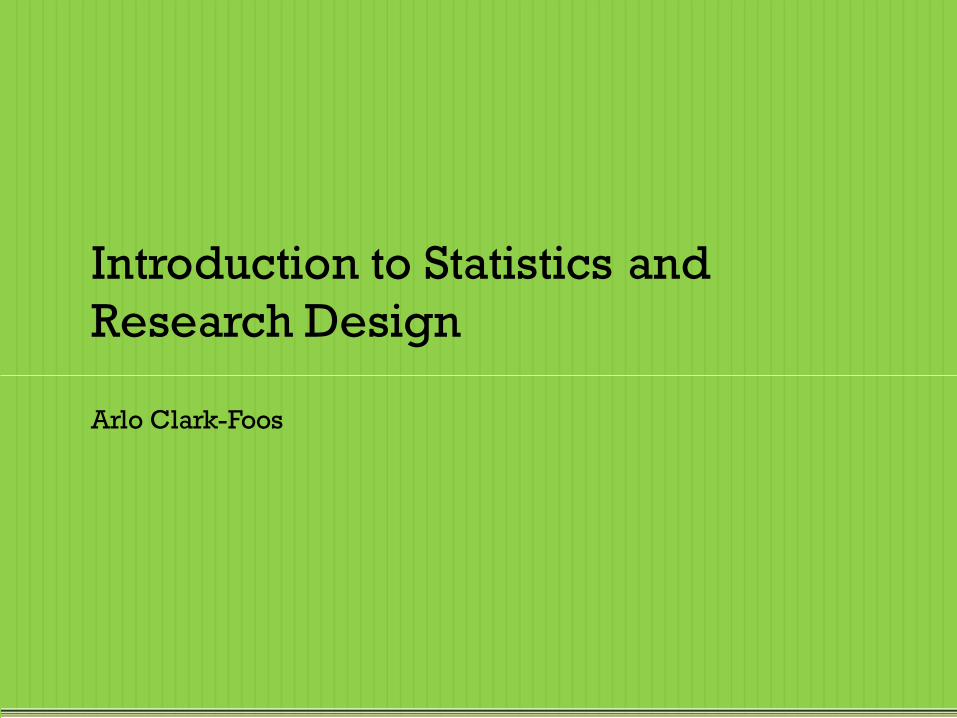
Transforming Observations Into
Numbers
Constructs: hypothetical ideas that have been developed to describe and explain human behavior
• Motivation, Anxiety, Happiness, Love, Anger, …
• Defining these constructs to be studied
GIGO (Garbage In, Garbage Out)
• Discrete Observations: Take on specific values; no other values exist between these numbers
Example: The number of people on a city bus.
• Continuous Observations: Can take on an infinite number of potential values
Example: Time taken to complete a math problem.

Scales of Measurement
Nominal: Observations have names or categories as values.
• Example: Race
Ordinal: Observations that have rankings as values
• Example: NCAA Rankings
Interval: Have actual numbers as values, and distance (or interval) between values is assumed to be equal.
• Example: Reaction Time, Temperature*
Ratio: Meet all criteria for interval but also have a meaningful zero point.
• Example: Distance, Temperature*

Scales of Measurement
Discrete & Ratio
How many kids
are riding on each
school bus?

Variables
Independent Variables (IV): Because variables vary, any
IV must have at least two values (levels) that it can take
on.
• IVs are manipulated or observed to determine the effects on
the dependent variable
Examples: Gender*, Caffeine Intake
Dependent Variable (DV): Observed or measured to
discover differences caused by changes in the IV.
Examples: Political Views, Exam Scores

Variables
Confounding Variables: Anything that systematically varies with the IV so that we cannot logically determine which variable is at work
Example: Did wind or water cause the damage observed after Hurricane Katrina?
Extraneous Variables: Randomly distributed influences that detract from efforts to measure what was intended to be measured.
Example: Distractions
Noise: Any influence that makes the relationship between variables less clear
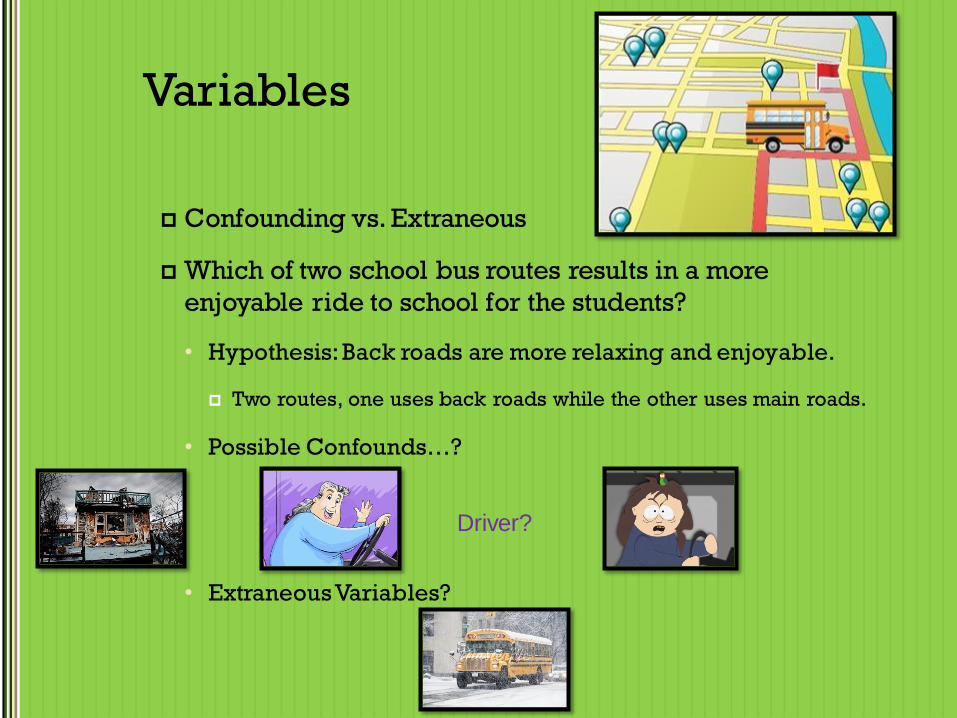
Variables
Confounding vs. Extraneous
Which of two school bus routes results in a more
enjoyable ride to school for the students?
• Hypothesis: Back roads are more relaxing and enjoyable.
Two routes, one uses back roads while the other uses main roads.
• Possible Confounds…?
• Extraneous Variables?
Driver?

Test Your Knowledge
New Drug May Cure Hangovers
What would the IV and DV be in this study?
What are some possible confounding or extraneous variables
in the above new drug study?

Measuring Behavior
Reliability: A test is considered reliable if it is consistent.
Example: Does your IQ score change from one day to the next?
Test-Retest Reliability
Validity: Does the test measure what it intends to
measure?
Example: Does the IQ test actually measure intelligence?
Predictive Validity
Your ACT/SAT or high school GPA?
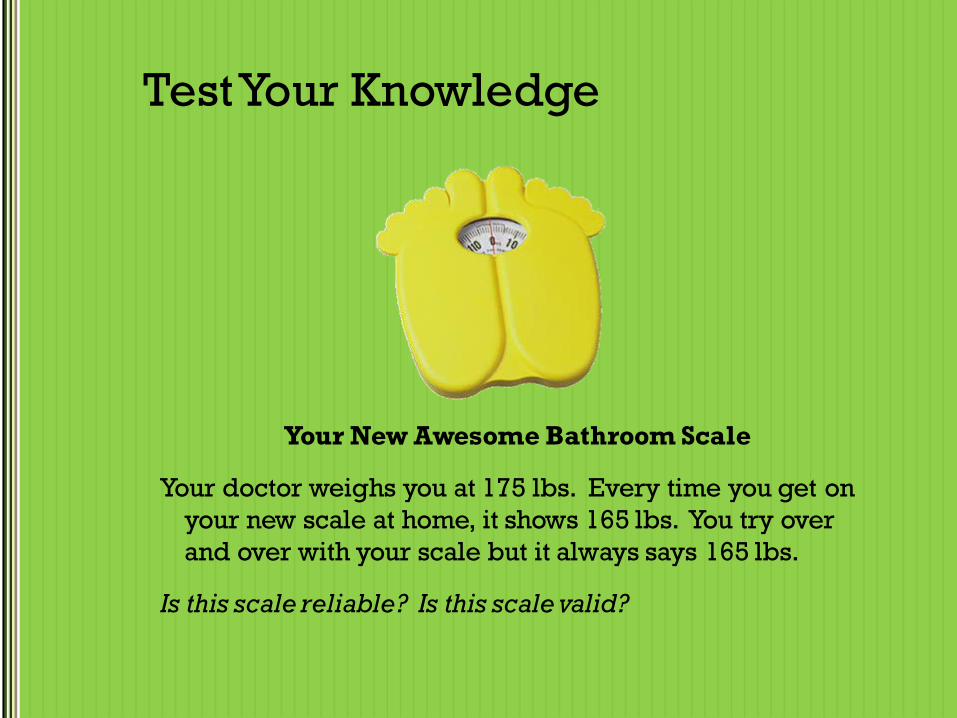
Test Your Knowledge
Your New Awesome Bathroom Scale
Your doctor weighs you at 175 lbs. Every time you get on
your new scale at home, it shows 165 lbs. You try over
and over with your scale but it always says 165 lbs.
Is this scale reliable? Is this scale valid?

Intro to Hypothesis Testing
What is a hypothesis?
• The predicted outcome of an experiment based on a belief
about the relation between variables. Not a question!
Should include direct reference to IV and DV (e.g., It is
expected that participants who consume caffeine prior to
learning a list of words will remember more of those words
than participants who do not consume caffeine).
What is hypothesis testing?
• The process of drawing conclusions about whether a
particular relation between variables is supported by the
evidence.
Operational Definition
“Specifies the operations or procedures used to
measure or manipulate a variable”
• Example: Self-report scale measuring anxiety
• “Why do I have to take this class?”
“Will the effort I put into this class yield personal benefits?”
• “Have previous students at this college benefited from learning
statistics?”
Survey alumni…
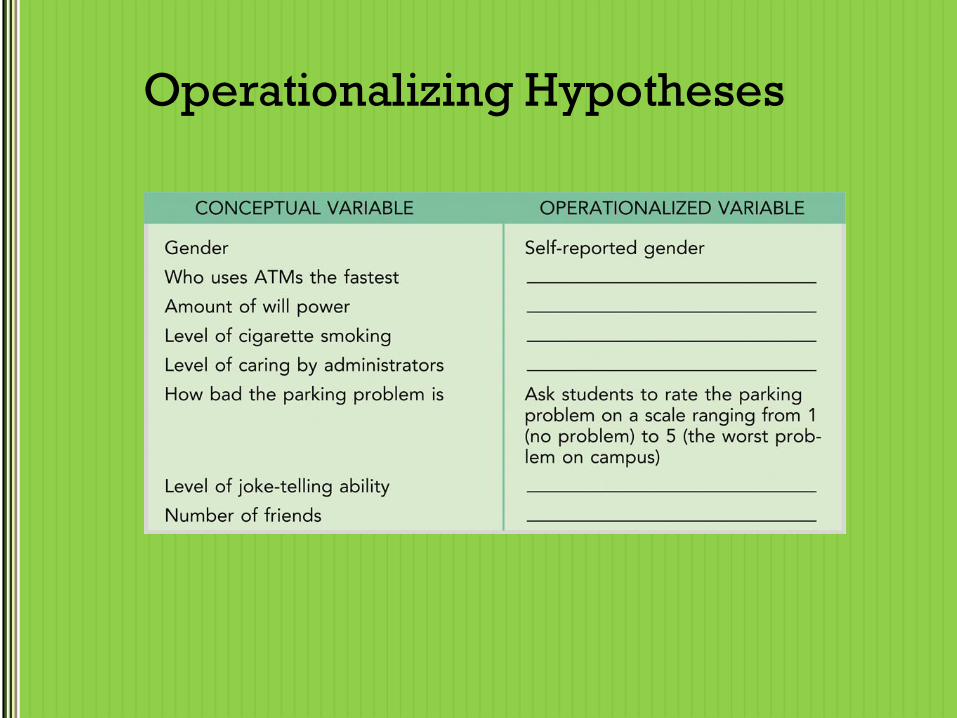
Operationalizing Hypotheses
Test Yourself
In a study of the effects of cocaine on specific regions of the
brain, microscopic amounts of the drug are delivered to
specific regions of the brain, using the latest technology. The
subjects are laboratory rats and they are randomly assigned to
four groups, each group to receive the drug in only one region
of the brain. The effects of the drug on arousal are measured
by seeing how long a tired animal will remain awake after an
injection of the drug.
• Independent Variable(s), Dependent Variable(s),
Confounding Variable(s), Extraneous Variable(s),
Operational Definition(s), Hypothesis(es)

Types of Research Design:
Experiments
A study in which participants are randomly assigned to a condition or level of one or more independent variables
• Random Assignment: Every participant in the study has an equal chance of being assigned to any condition.
• Single-Blind Experiment: Participants do not know the condition to which they are assigned.
Placebo Effect: When an expectation of an outcome causes or appears to cause that outcome to take place.
• Double-Blind Experiment: Neither participants nor experimenters know the participants’ assigned condition
Demand Characteristics: Inadvertently cueing the participants to certain responses.

Random Assignment
Why do we need random assignment? What does it
accomplish?
Will playing Scrabble regularly increase your vocabulary?
Why is
this bad?
Types of Research Design:
Between- vs. Within-Groups
Between-Groups: Participants experience one, and only
one, level of the independent variable.
Within-Groups: The different levels of the independent
variable are experience by all participants in the study.
• Order Effects (Practice Effects): How a participant’s behavior
changes when the DV is presented a second time.
Counterbalancing: Minimizes order effects by varying the order
of presentation of different levels of the IV from one participant to
the next.

Correlational Designs
Relationship between variables
• e.g., Proximity to Broad St. well and Probability of Dying
• NOT cause & effect
• Illusory Correlations
e.g., Big city folks are not as nice as those in the country
Outliers & Outlier Analysis
• Dr. Snow and the Cholera Outbreak
A London woman and her niece both died far away from Broad St.
A Brewery on Broad St. reports no deaths of its workers.
Related Documents