Introduction to Peakvue

Welcome message from author
This document is posted to help you gain knowledge. Please leave a comment to let me know what you think about it! Share it to your friends and learn new things together.
Transcript
Introduction to Peakvue
Objectives To Understand:
– 1. What Peakvue Is!
– 2. How it Works!
– 3. Filter Options
• Types of filters available
• Calculating the correct filter setting
• Filter Guidelines
– 4. Peakvue Data
• Spectrums and Waveforms
• Diagnosing Faults
– 5. Peakvue Versus Demodulation Techniques
– 6. Acquiring Peakvue Data using the 2120A
What is Peakvue™ What is Peakvue?
– Peakvue is a technology unique to CSI and means ‘Peak Value’
– Such as the Peak Value of an impact generated by a bearing defect in a time waveform - (True Peak Value)
– If you have a 21XX analyzer you have the capability to acquire ‘Peakvue Data’
These stress waves travel further than conventional vibration signals so a truer indication of fault severity is obtained.
The ‘True Peak Value’ is obtained by concentrating on ‘Stress Wave Analysis’ rather than conventional vibration data.
Initial Impact
What is Peakvue™
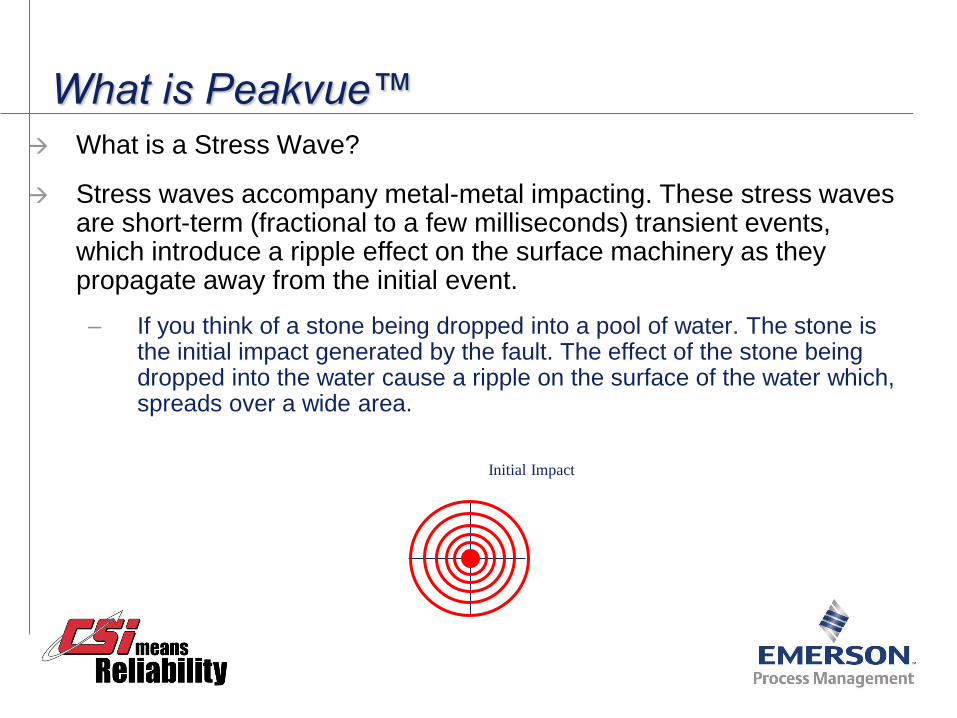
What is a Stress Wave?
Stress waves accompany metal-metal impacting. These stress waves are short-term (fractional to a few milliseconds) transient events, which introduce a ripple effect on the surface machinery as they propagate away from the initial event.
– If you think of a stone being dropped into a pool of water. The stone is the initial impact generated by the fault. The effect of the stone being dropped into the water cause a ripple on the surface of the water which, spreads over a wide area.
What is Peakvue
If a bearing has a sub-surface defect (early bearing wear), when a rolling element passes over the defect it bends the race slightly and then as the rolling element passes it restores back to it’s natural state.
This event causes a high frequency (1-50KHz) short duration stress wave.
This is what Peakvue detects
How Does It Work?
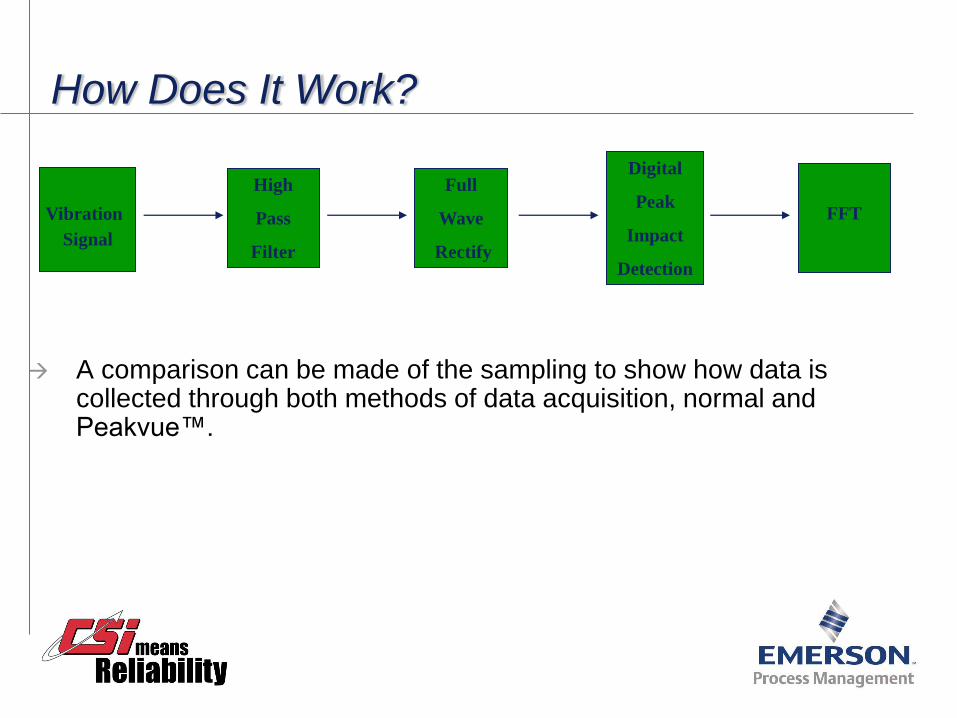
A comparison can be made of the sampling to show how data is collected through both methods of data acquisition, normal and Peakvue™.
FFT
High
Pass
Filter
Full
Wave
Rectify
Digital
Peak
Impact
Detection
Vibration Signal
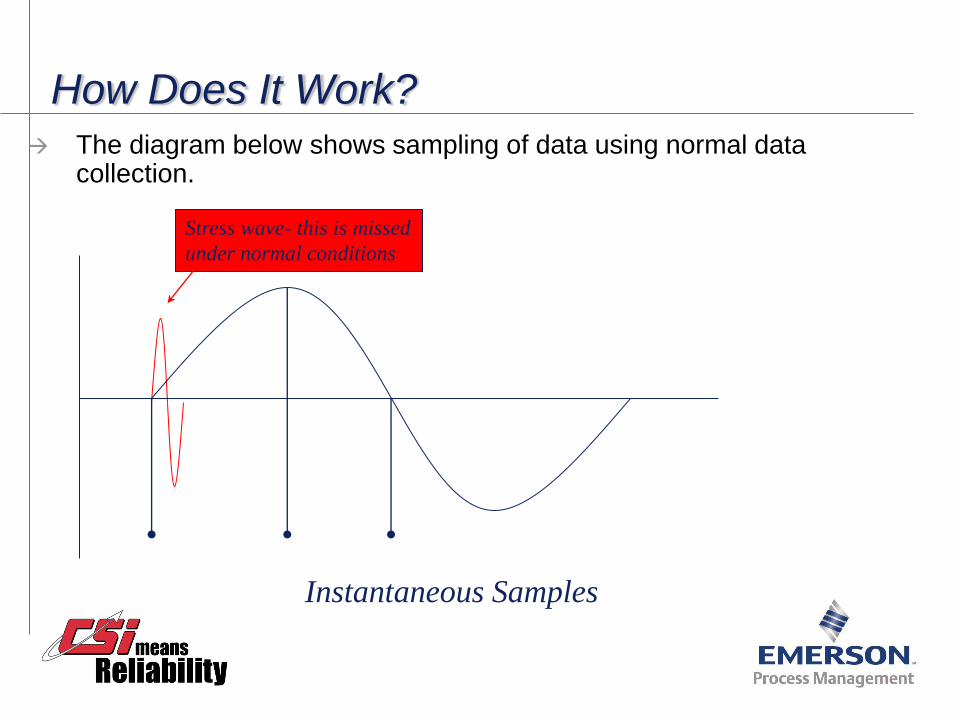
How Does It Work? The diagram below shows sampling of data using normal data
collection.
Stress wave- this is missed
under normal conditions
Instantaneous Samples
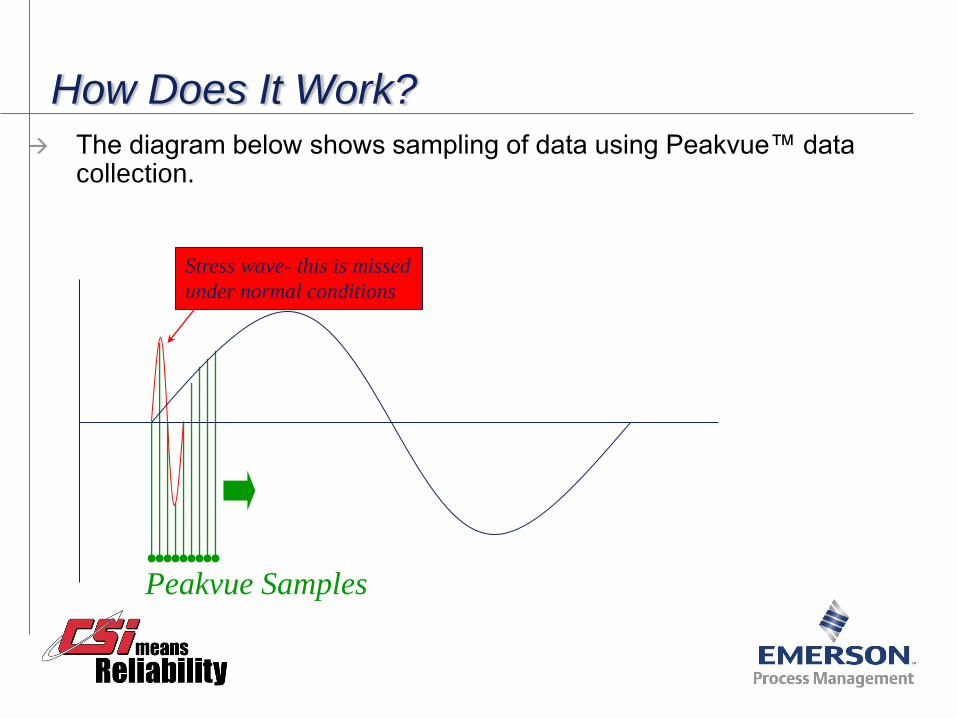
Peakvue Samples
How Does It Work? The diagram below shows sampling of data using Peakvue™ data
collection.
Stress wave- this is missed
under normal conditions
How Does It Work? Peakvue measures the highest amplitude found in a stress waves
(Pk Value) and holds that data
The waveform data is then passed through a high pass filter to remove the unwanted, low frequencies
– Imbalance, Misalignment, Looseness, resonance etc.
This just leaves us with the high frequency impacting data (Peak) above the machine noise level
The data is then brought back to fundamental frequency. (this allows analysis of the data to be done quicker and easier)
Filters Types of filter available
Filter Calculations
Filter Guidelines
Selecting the wrong type of filter will result in poor quality data
– To much noise filtered through (the spectrum becomes very noisy)
– To much is filtered out (The stress wave is not allowed to pass through)
Filters Options
There are two types of filter options in Peakvue, these are:
– 1. Band Pass Filter
– 2. High Pass Filter
Each of the filters are designed to remove unwanted data out of the signal at the appropriate levels
One of the key elements in acquiring meaningful peakvue data is the selection of ‘filters’
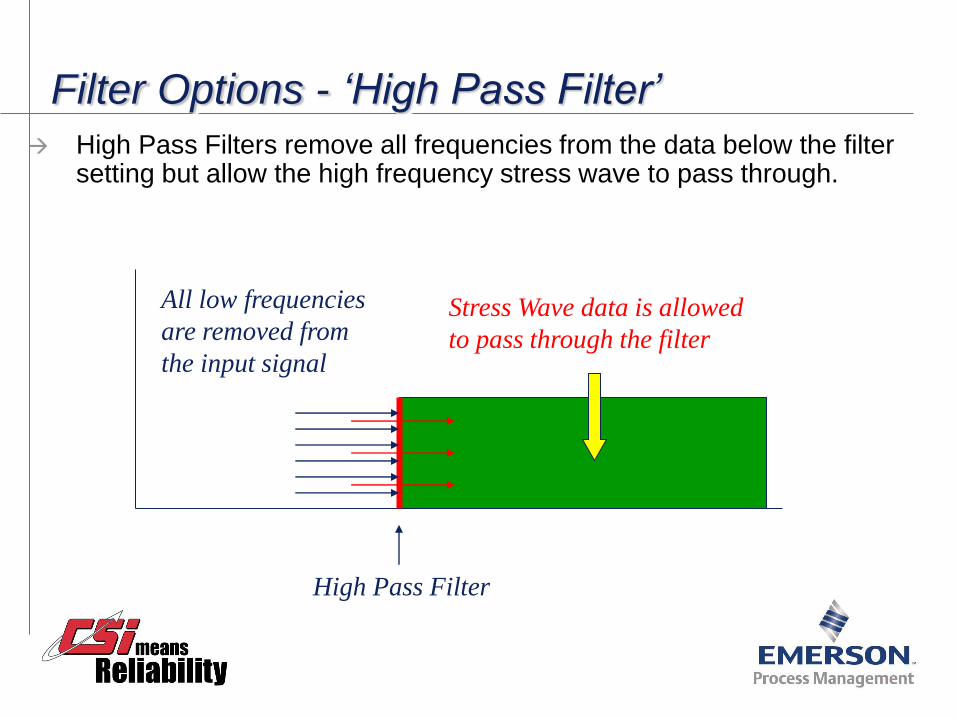
Filter Options - ‘High Pass Filter’ High Pass Filters remove all frequencies from the data below the filter
setting but allow the high frequency stress wave to pass through.
All low frequencies
are removed from
the input signal
Stress Wave data is allowed
to pass through the filter
High Pass Filter
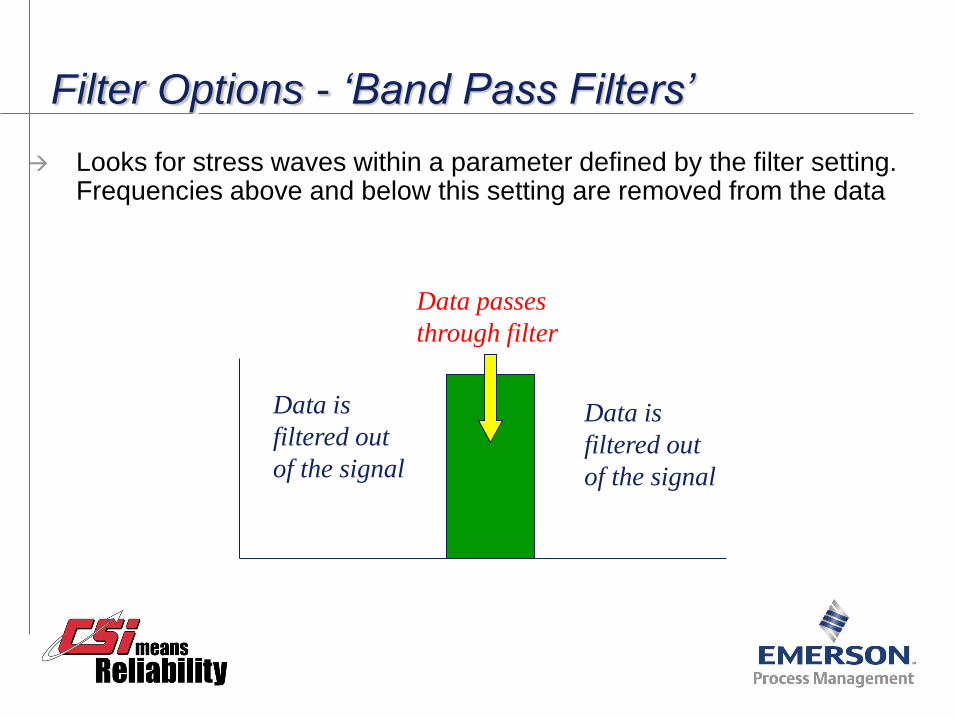
Filter Options - ‘Band Pass Filters’
Looks for stress waves within a parameter defined by the filter setting. Frequencies above and below this setting are removed from the data
Data is
filtered out
of the signal
Data is
filtered out
of the signal
Data passes
through filter
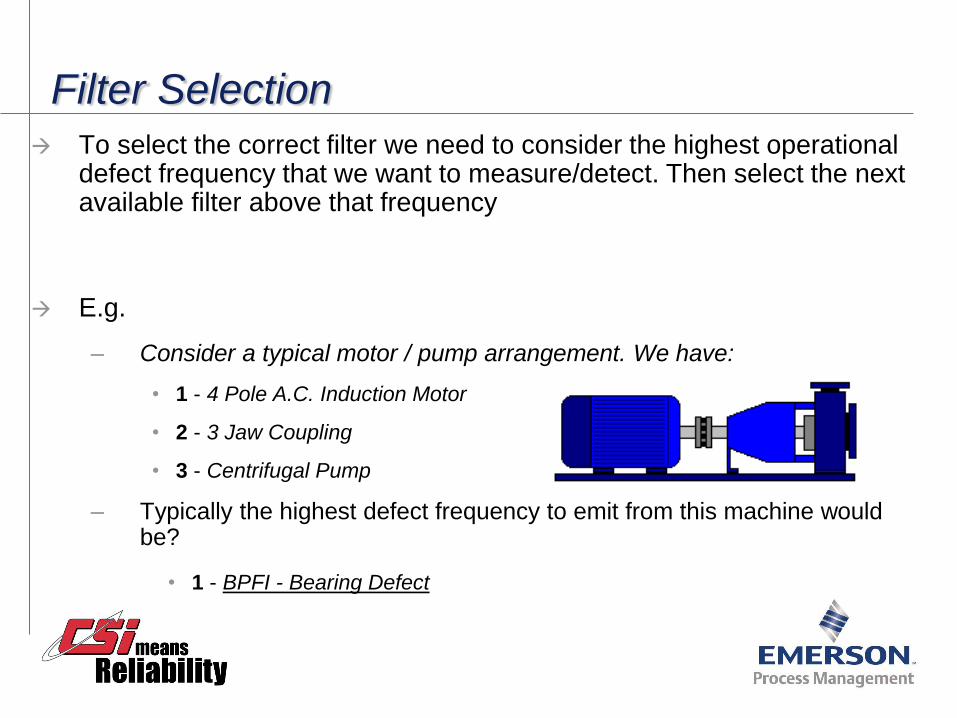
Filter Selection
To select the correct filter we need to consider the highest operational defect frequency that we want to measure/detect. Then select the next available filter above that frequency
E.g.
– Consider a typical motor / pump arrangement. We have:
• 1 - 4 Pole A.C. Induction Motor
• 2 - 3 Jaw Coupling
• 3 - Centrifugal Pump
– Typically the highest defect frequency to emit from this machine would be?
• 1 - BPFI - Bearing Defect
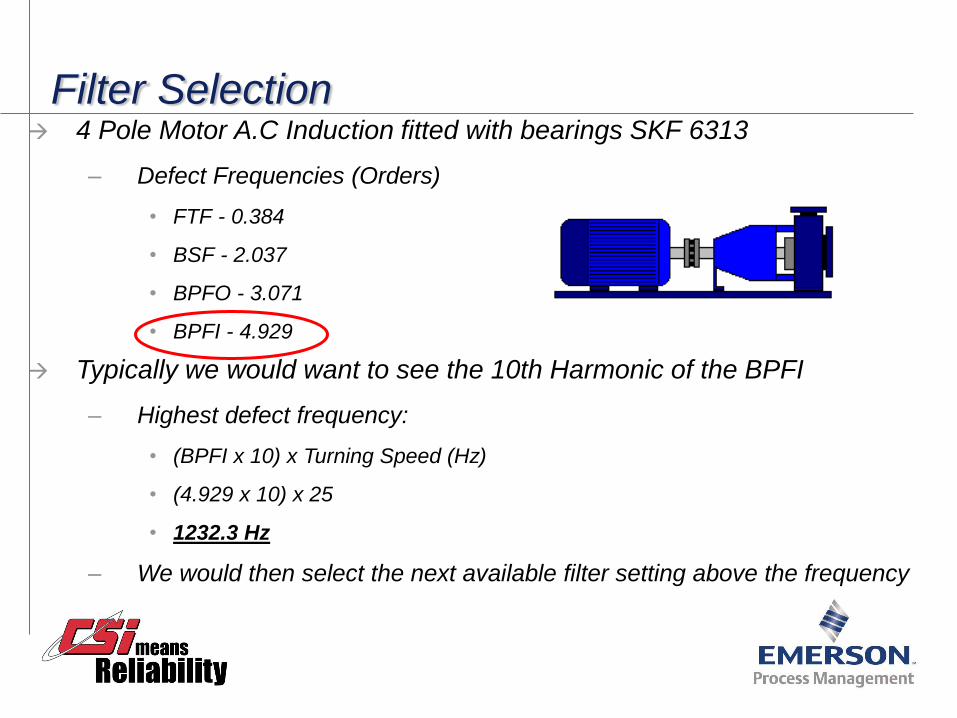
Filter Selection 4 Pole Motor A.C Induction fitted with bearings SKF 6313
– Defect Frequencies (Orders)
• FTF - 0.384
• BSF - 2.037
• BPFO - 3.071
• BPFI - 4.929
Typically we would want to see the 10th Harmonic of the BPFI
– Highest defect frequency:
• (BPFI x 10) x Turning Speed (Hz)
• (4.929 x 10) x 25
• 1232.3 Hz
– We would then select the next available filter setting above the frequency
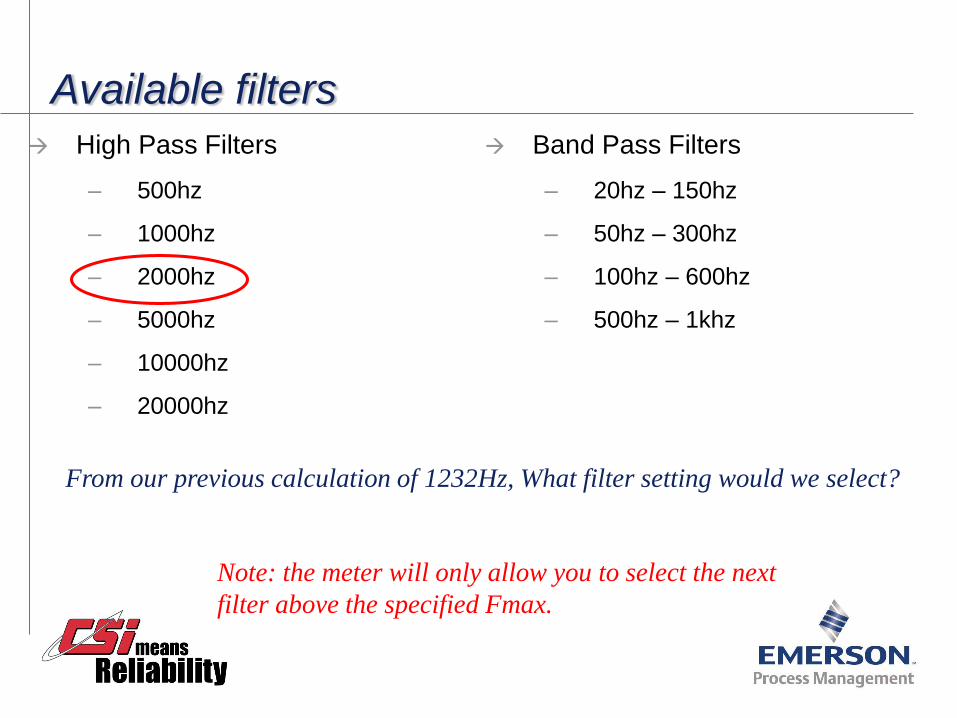
Available filters High Pass Filters
– 500hz
– 1000hz
– 2000hz
– 5000hz
– 10000hz
– 20000hz
Band Pass Filters
– 20hz – 150hz
– 50hz – 300hz
– 100hz – 600hz
– 500hz – 1khz
Note: the meter will only allow you to select the next
filter above the specified Fmax.
From our previous calculation of 1232Hz, What filter setting would we select?
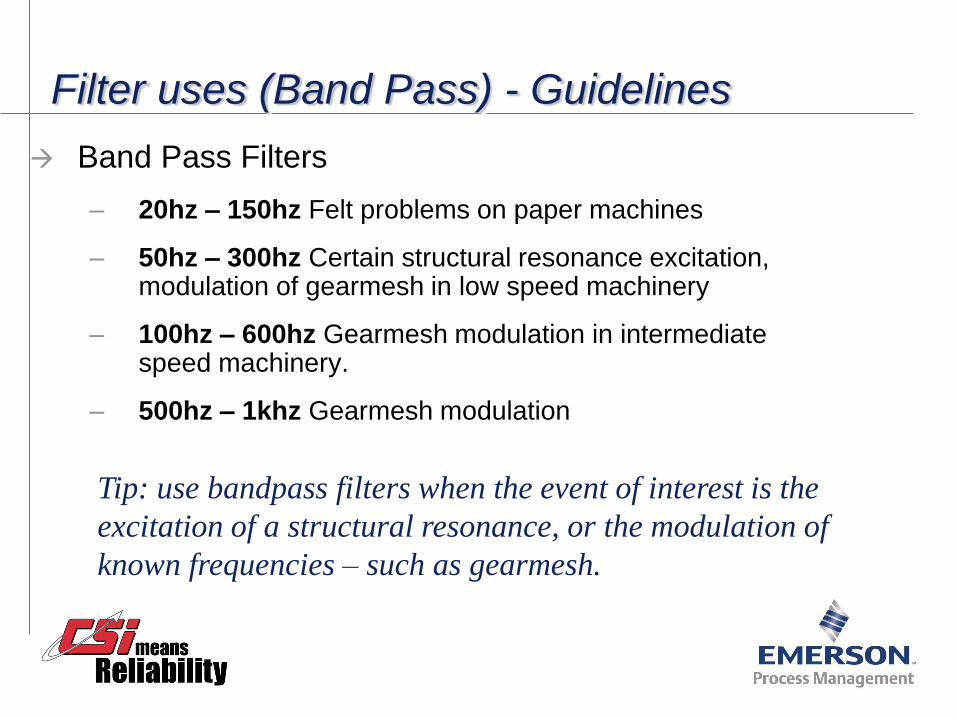
Filter uses (Band Pass) - Guidelines
Band Pass Filters
– 20hz – 150hz Felt problems on paper machines
– 50hz – 300hz Certain structural resonance excitation, modulation of gearmesh in low speed machinery
– 100hz – 600hz Gearmesh modulation in intermediate speed machinery.
– 500hz – 1khz Gearmesh modulation
Tip: use bandpass filters when the event of interest is the
excitation of a structural resonance, or the modulation of
known frequencies – such as gearmesh.
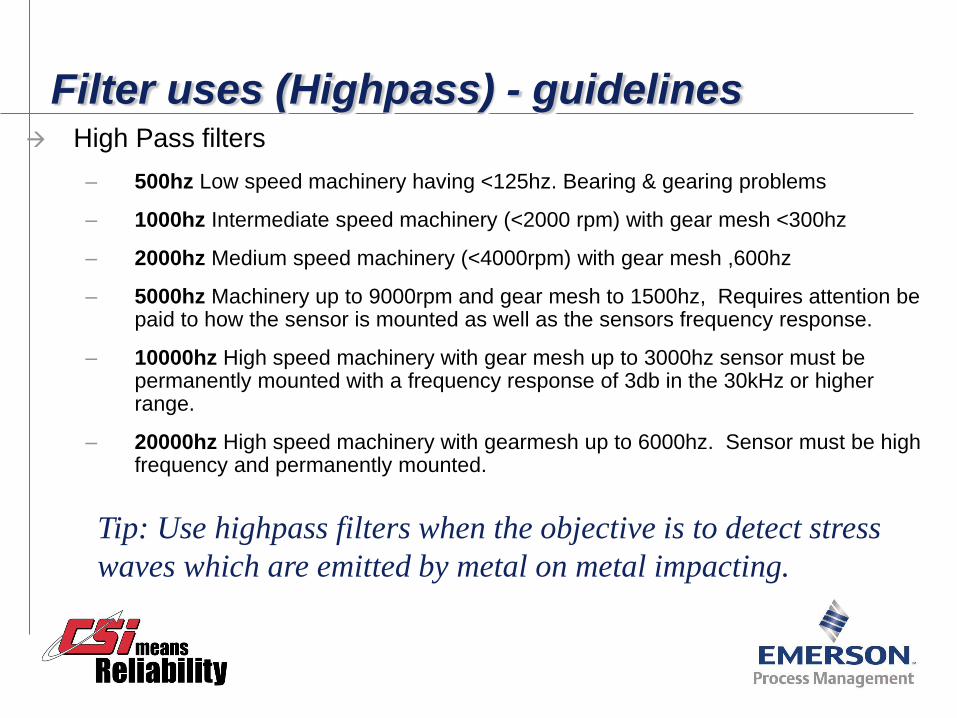
Filter uses (Highpass) - guidelines High Pass filters
– 500hz Low speed machinery having <125hz. Bearing & gearing problems
– 1000hz Intermediate speed machinery (<2000 rpm) with gear mesh <300hz
– 2000hz Medium speed machinery (<4000rpm) with gear mesh ,600hz
– 5000hz Machinery up to 9000rpm and gear mesh to 1500hz, Requires attention be paid to how the sensor is mounted as well as the sensors frequency response.
– 10000hz High speed machinery with gear mesh up to 3000hz sensor must be permanently mounted with a frequency response of 3db in the 30kHz or higher range.
– 20000hz High speed machinery with gearmesh up to 6000hz. Sensor must be high frequency and permanently mounted.
Tip: Use highpass filters when the objective is to detect stress
waves which are emitted by metal on metal impacting.
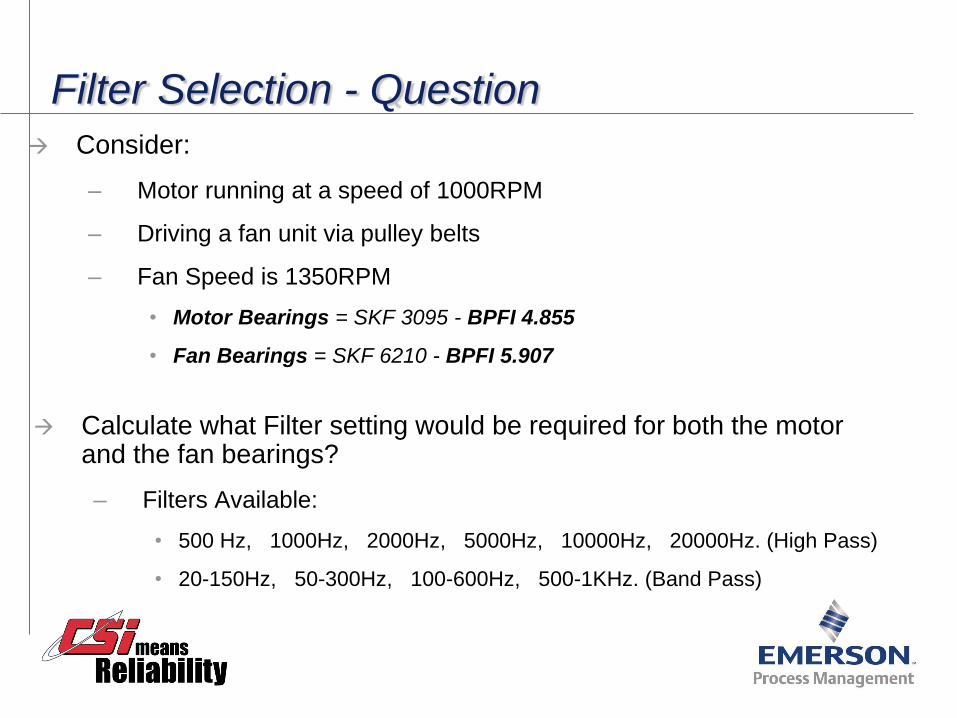
Filter Selection - Question
Consider:
– Motor running at a speed of 1000RPM
– Driving a fan unit via pulley belts
– Fan Speed is 1350RPM
• Motor Bearings = SKF 3095 - BPFI 4.855
• Fan Bearings = SKF 6210 - BPFI 5.907
Calculate what Filter setting would be required for both the motor and the fan bearings?
– Filters Available:
• 500 Hz, 1000Hz, 2000Hz, 5000Hz, 10000Hz, 20000Hz. (High Pass)
• 20-150Hz, 50-300Hz, 100-600Hz, 500-1KHz. (Band Pass)
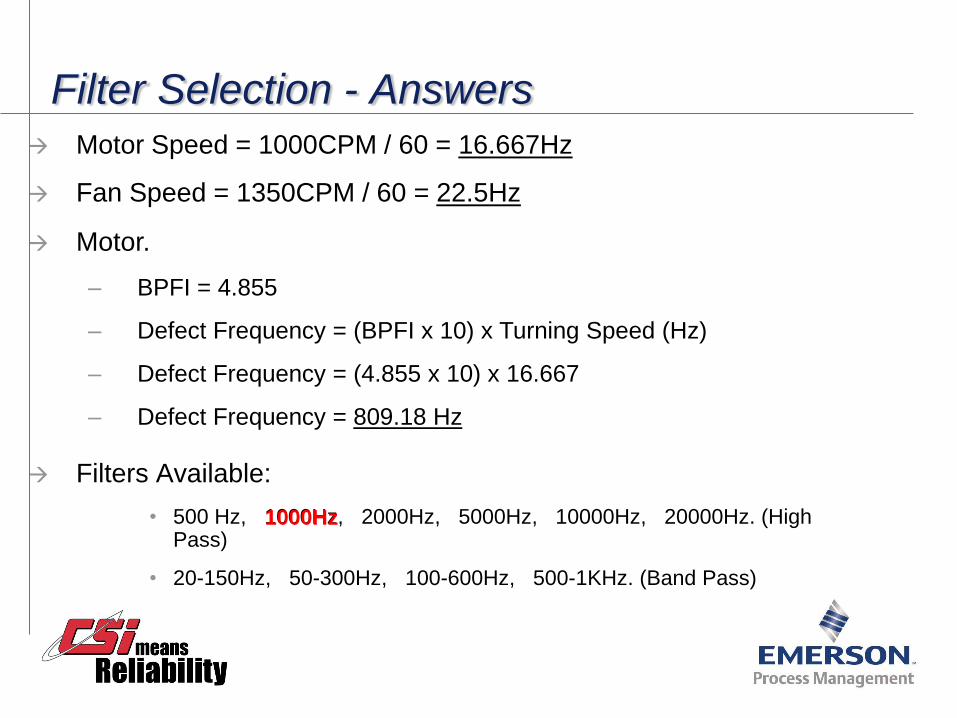
Filter Selection - Answers
Motor Speed = 1000CPM / 60 = 16.667Hz
Fan Speed = 1350CPM / 60 = 22.5Hz
Motor.
– BPFI = 4.855
– Defect Frequency = (BPFI x 10) x Turning Speed (Hz)
– Defect Frequency = (4.855 x 10) x 16.667
– Defect Frequency = 809.18 Hz
Filters Available:
• 500 Hz, 1000Hz, 2000Hz, 5000Hz, 10000Hz, 20000Hz. (High Pass)
• 20-150Hz, 50-300Hz, 100-600Hz, 500-1KHz. (Band Pass)
1000Hz
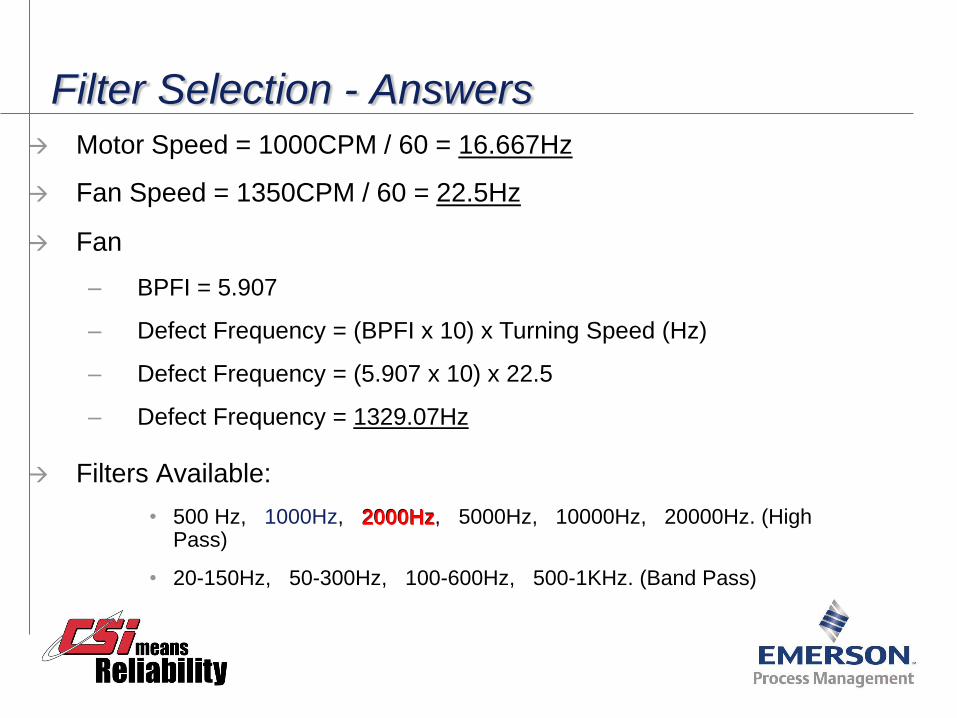
Filter Selection - Answers
Motor Speed = 1000CPM / 60 = 16.667Hz
Fan Speed = 1350CPM / 60 = 22.5Hz
Fan
– BPFI = 5.907
– Defect Frequency = (BPFI x 10) x Turning Speed (Hz)
– Defect Frequency = (5.907 x 10) x 22.5
– Defect Frequency = 1329.07Hz
Filters Available:
• 500 Hz, 1000Hz, 2000Hz, 5000Hz, 10000Hz, 20000Hz. (High Pass)
• 20-150Hz, 50-300Hz, 100-600Hz, 500-1KHz. (Band Pass)
2000Hz
Peakvue Data Spectrums and Waveforms
Diagnostics Techniques
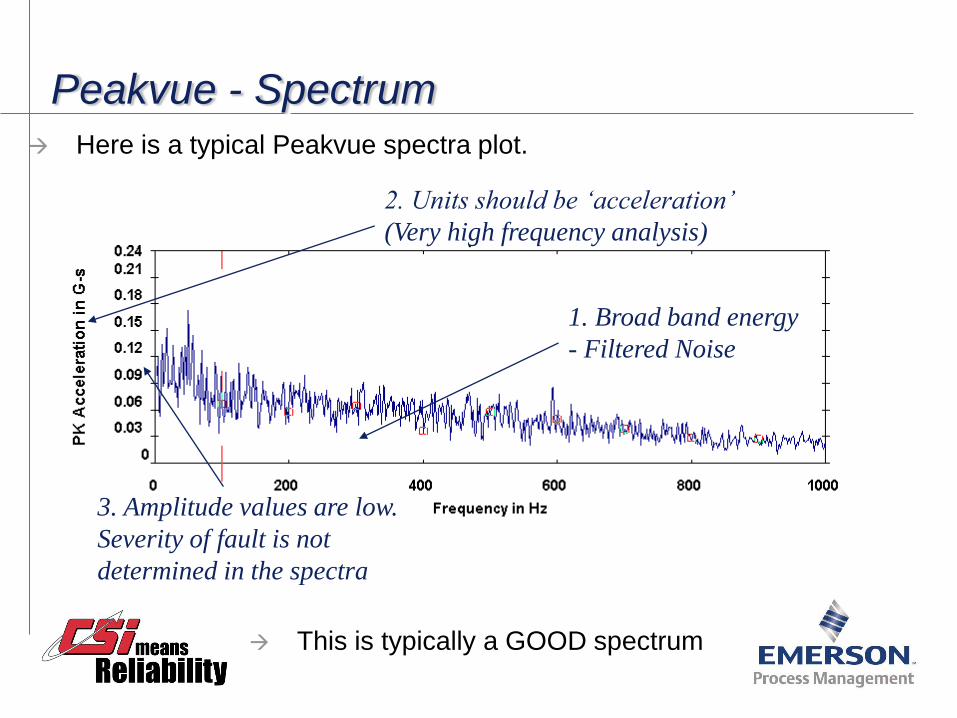
Peakvue - Spectrum Here is a typical Peakvue spectra plot.
This is typically a GOOD spectrum
1. Broad band energy
- Filtered Noise
2. Units should be ‘acceleration’
(Very high frequency analysis)
3. Amplitude values are low.
Severity of fault is not
determined in the spectra
Peakvue - Spectrum
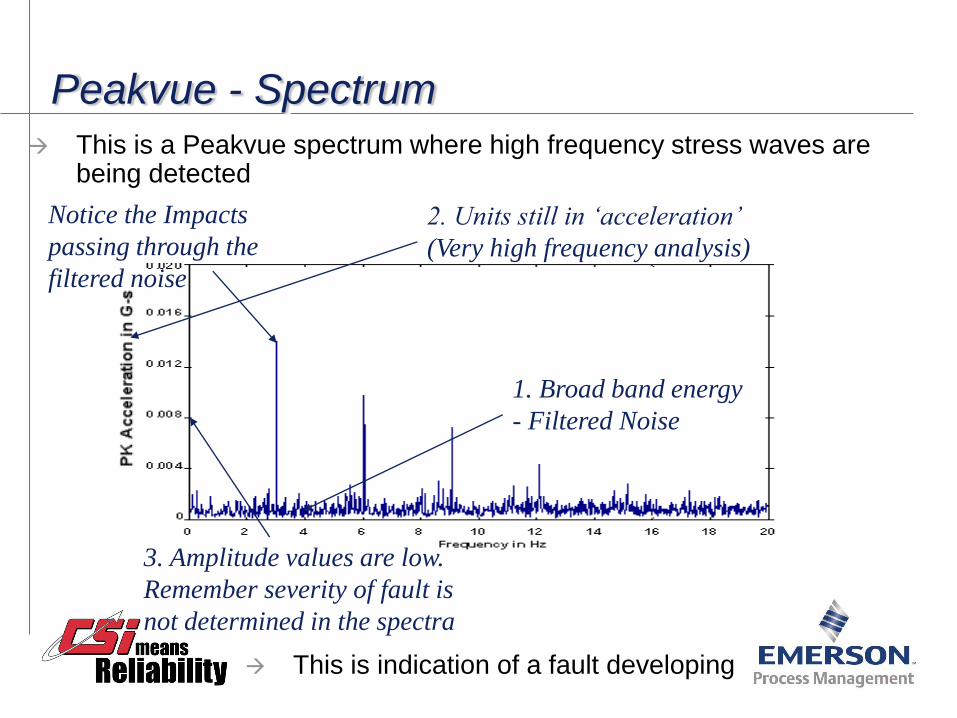
This is a Peakvue spectrum where high frequency stress waves are being detected
1. Broad band energy
- Filtered Noise
2. Units still in ‘acceleration’
(Very high frequency analysis)
3. Amplitude values are low.
Remember severity of fault is
not determined in the spectra
Notice the Impacts
passing through the
filtered noise
This is indication of a fault developing
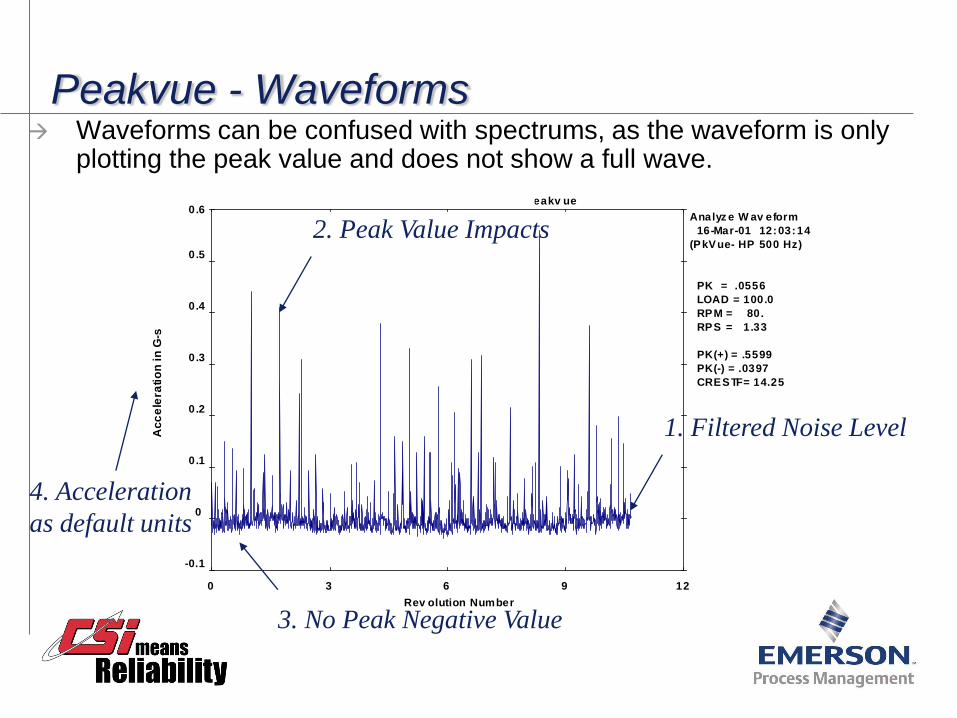
Peakvue - Waveforms Waveforms can be confused with spectrums, as the waveform is only
plotting the peak value and does not show a full wave. A1 - Example 1
EX 1 -D3P Tail Roll Non D/S Peakv ue
Label: Easy
Analyz e W av eform
16-Mar-01 12:03:14
(PkVue- HP 500 Hz)
PK = .0556
LOAD = 100.0
RPM = 80.
RPS = 1 .33
PK(+) = .5599
PK(-) = .0397
CRESTF= 14.25
0 3 6 9 12
-0.1
0
0.1
0.2
0.3
0.4
0.5
0.6
Rev olution Number
Ac
ce
lera
tio
n i
n G
-s
1. Filtered Noise Level
2. Peak Value Impacts
3. No Peak Negative Value
4. Acceleration
as default units
Peakvue - Diagnostics Diagnosing a Peakvue spectrum and waveform is not to dissimilar to
that of conventional data.
However there are a few differences which can be a bit confusing at first, these are:
– 1. Do not try to locate 1xTurning Speed, as this is low frequency data and will be filtered out.
• Turning speed should be entered using the conventional spectral data.
– 2. Multiple harmonics are often present within a spectrum due to the way peakvue samples the data.
• These do not indicate ‘Looseness’
– 3. Spectral amplitudes are always low in amplitude but should not be used to judge severity. Use the spectrum to diagnose the fault.
– 4. Waveforms indicate the severity of the problem.
Peakvue - Diagnostics
Continued…..
– 5. Ensure the same filter setting is used in both the spectrum and waveform.
• Potential faults can be missed or overlooked if different filters are used.
– 6. Cage Defects show up well in peakvue data and is normally an indication the bearing is under stress.
– 7. All low frequency faults are removed from the data and will not be seen in a Peakvue spectrum and waveform
• Imbalance, Misalignment, Looseness, Resonance - All Gone.
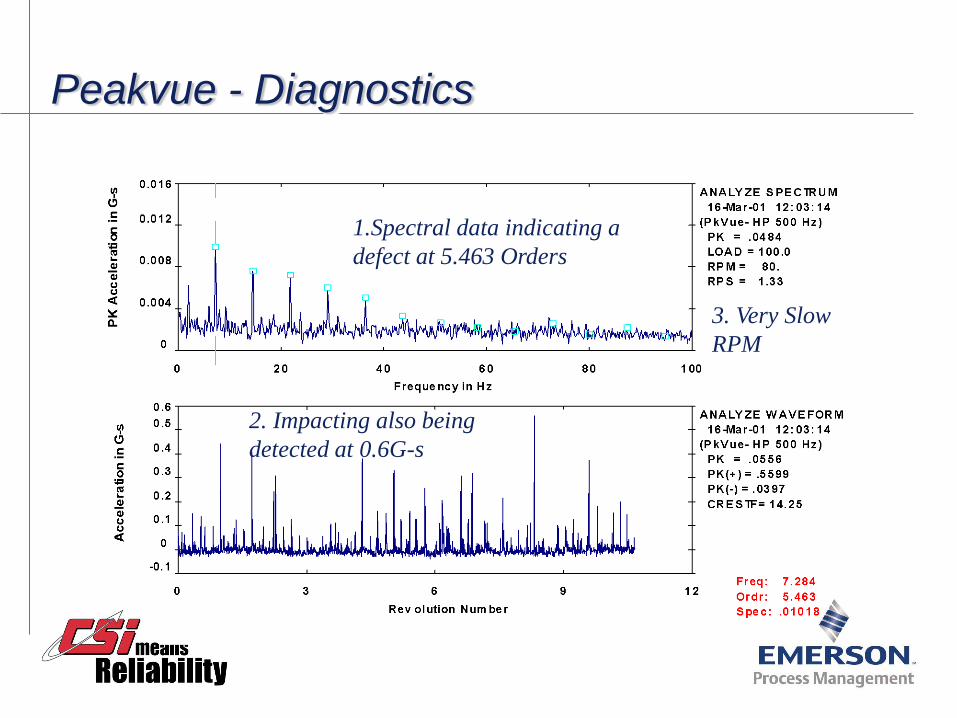
Peakvue - Diagnostics
1.Spectral data indicating a
defect at 5.463 Orders
2. Impacting also being
detected at 0.6G-s
3. Very Slow
RPM
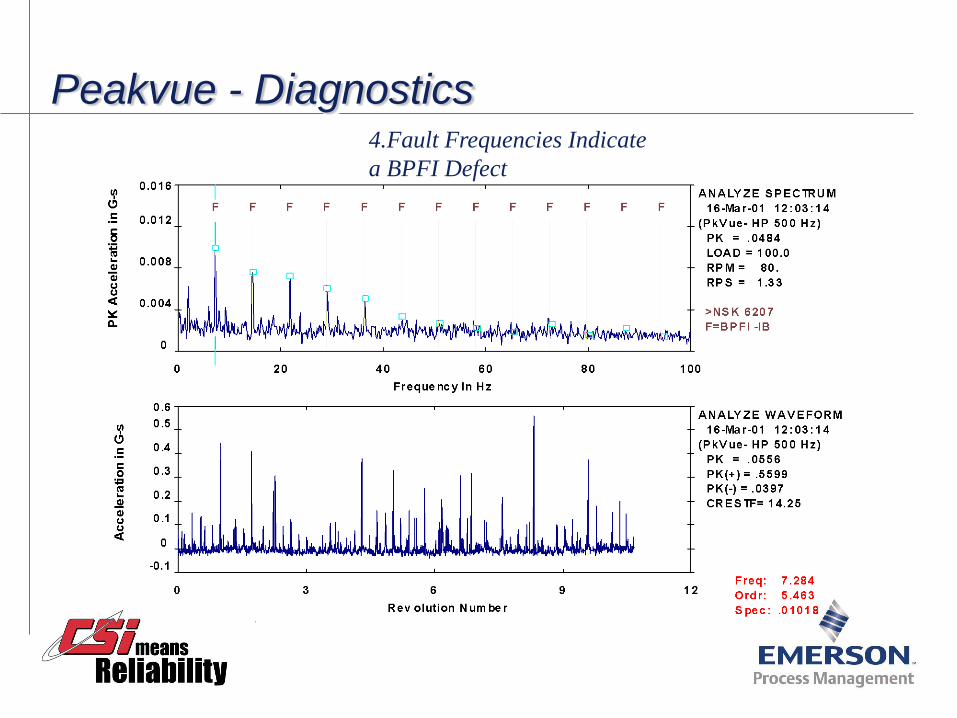
Peakvue - Diagnostics 4.Fault Frequencies Indicate
a BPFI Defect
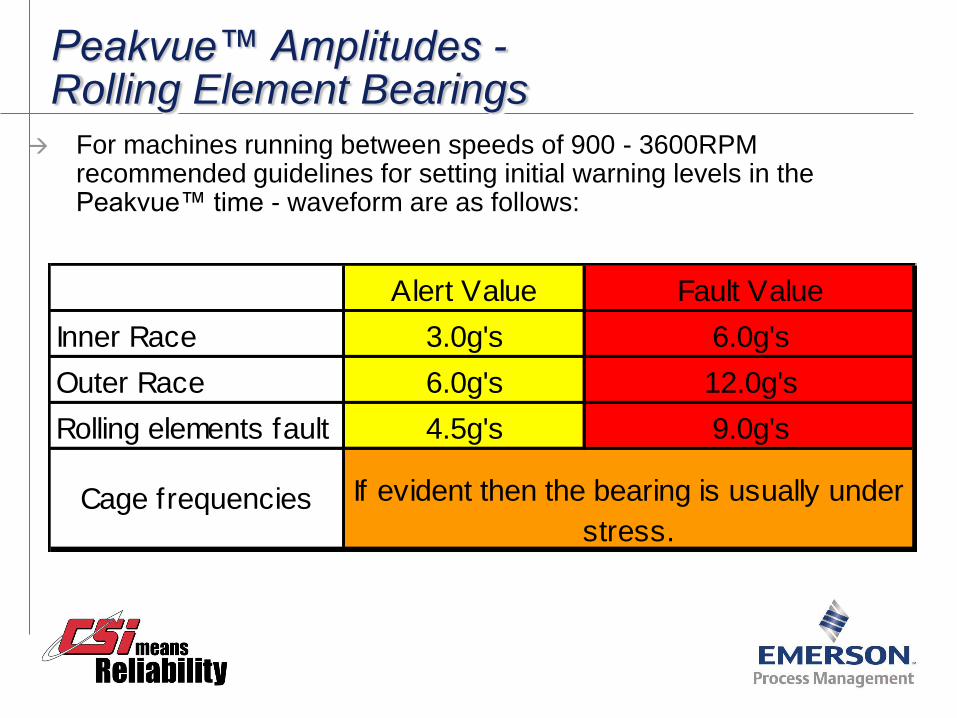
Peakvue™ Amplitudes - Rolling Element Bearings
For machines running between speeds of 900 - 3600RPM recommended guidelines for setting initial warning levels in the Peakvue™ time - waveform are as follows:
Alert Value Fault Value
Inner Race 3.0g's 6.0g's
Outer Race 6.0g's 12.0g's
Rolling elements fault 4.5g's 9.0g's
Cage frequencies If evident then the bearing is usually under
stress.
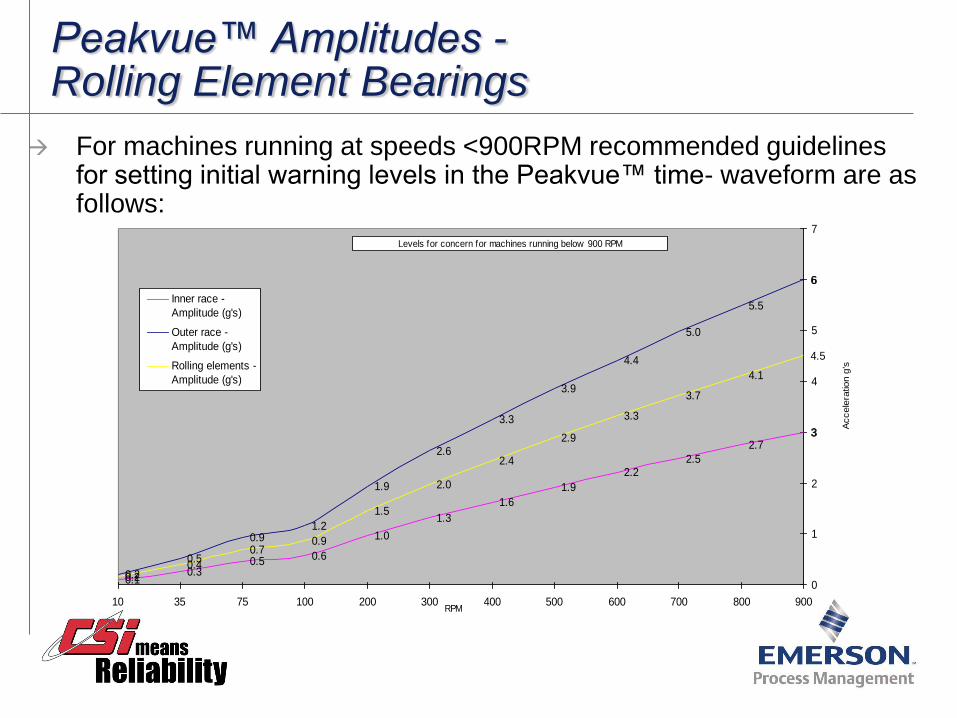
Peakvue™ Amplitudes - Rolling Element Bearings
For machines running at speeds <900RPM recommended guidelines for setting initial warning levels in the Peakvue™ time- waveform are as follows:
32.7
2.52.2
1.9
1.6
1.3
1.0
0.60.50.3
0.1
6
5.5
5.0
4.4
3.9
3.3
2.6
1.9
1.20.9
0.5
0.2
4.5
4.1
3.7
3.3
2.9
2.4
2.0
1.5
0.90.7
0.40.2
0
1
2
3
4
5
6
7
900800700600500400300200100753510
Inner race -
Amplitude (g's)
Outer race -
Amplitude (g's)
Rolling elements -
Amplitude (g's)
Levels for concern for machines running below 900 RPM
RPM
Accele
ration g
's
Peakvue Vs Demodulation
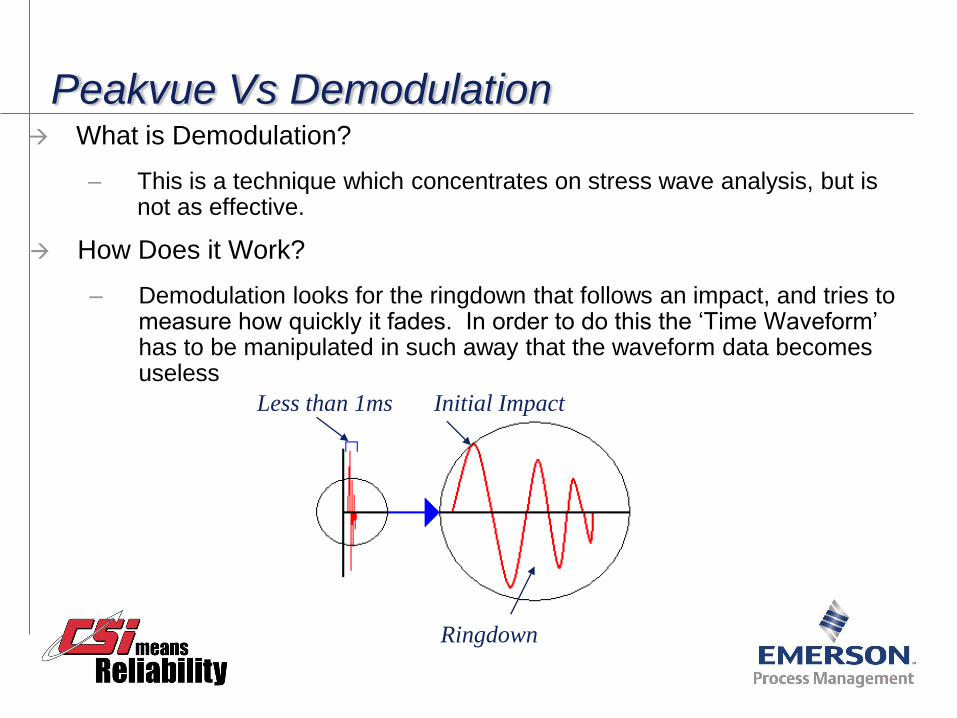
Peakvue Vs Demodulation What is Demodulation?
– This is a technique which concentrates on stress wave analysis, but is not as effective.
How Does it Work?
– Demodulation looks for the ringdown that follows an impact, and tries to measure how quickly it fades. In order to do this the ‘Time Waveform’ has to be manipulated in such away that the waveform data becomes useless
Less than 1ms Initial Impact
Ringdown
Peakvue Vs Demodulation
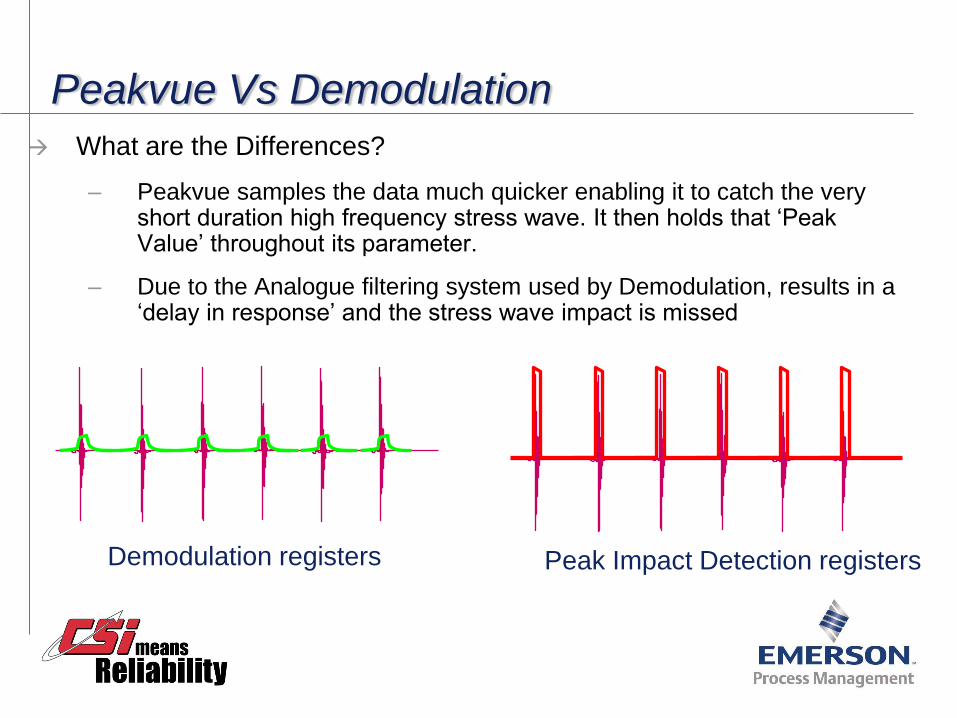
What are the Differences?
– Peakvue samples the data much quicker enabling it to catch the very short duration high frequency stress wave. It then holds that ‘Peak Value’ throughout its parameter.
– Due to the Analogue filtering system used by Demodulation, results in a ‘delay in response’ and the stress wave impact is missed
Demodulation registers Peak Impact Detection registers
Peakvue Vs Demodulation
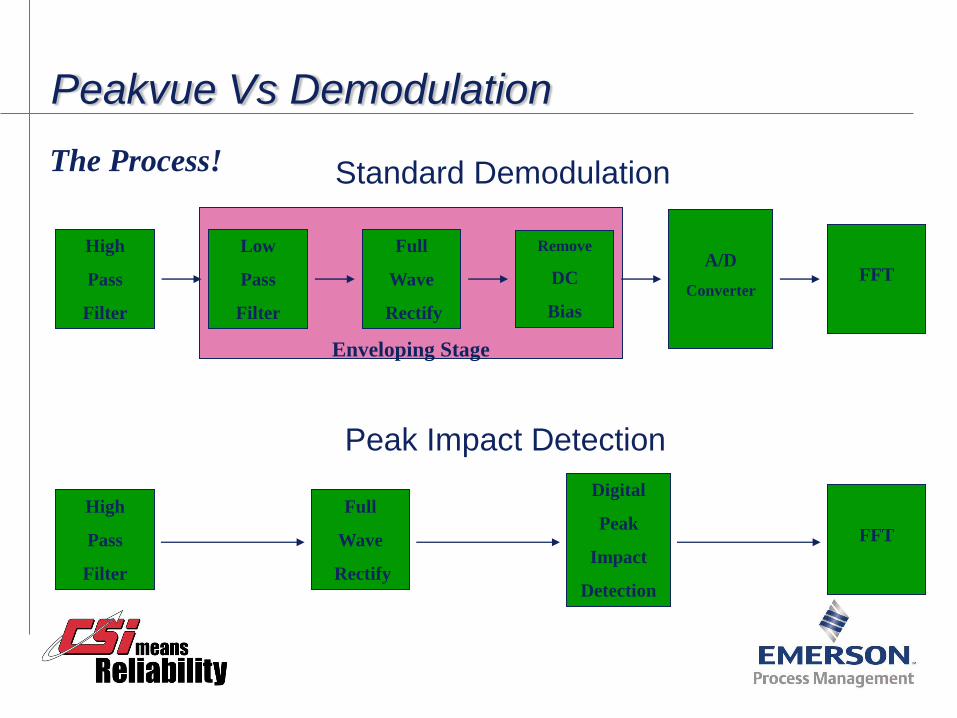
High
Pass
Filter
Full
Wave
Rectify
Digital
Peak
Impact
Detection
FFT
Peak Impact Detection
High
Pass
Filter
Low
Pass
Filter
Full
Wave
Rectify
Remove
DC
Bias
A/D
Converter
FFT
Standard Demodulation
Enveloping Stage
The Process!
Peakvue Vs Demodulation
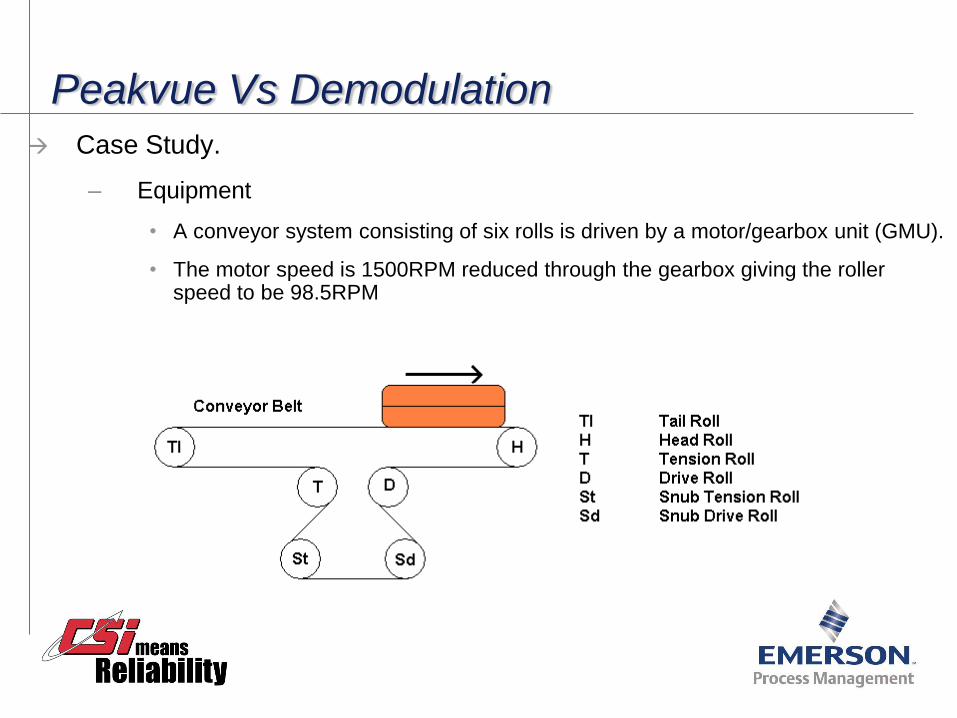
Case Study.
– Equipment
• A conveyor system consisting of six rolls is driven by a motor/gearbox unit (GMU).
• The motor speed is 1500RPM reduced through the gearbox giving the roller speed to be 98.5RPM
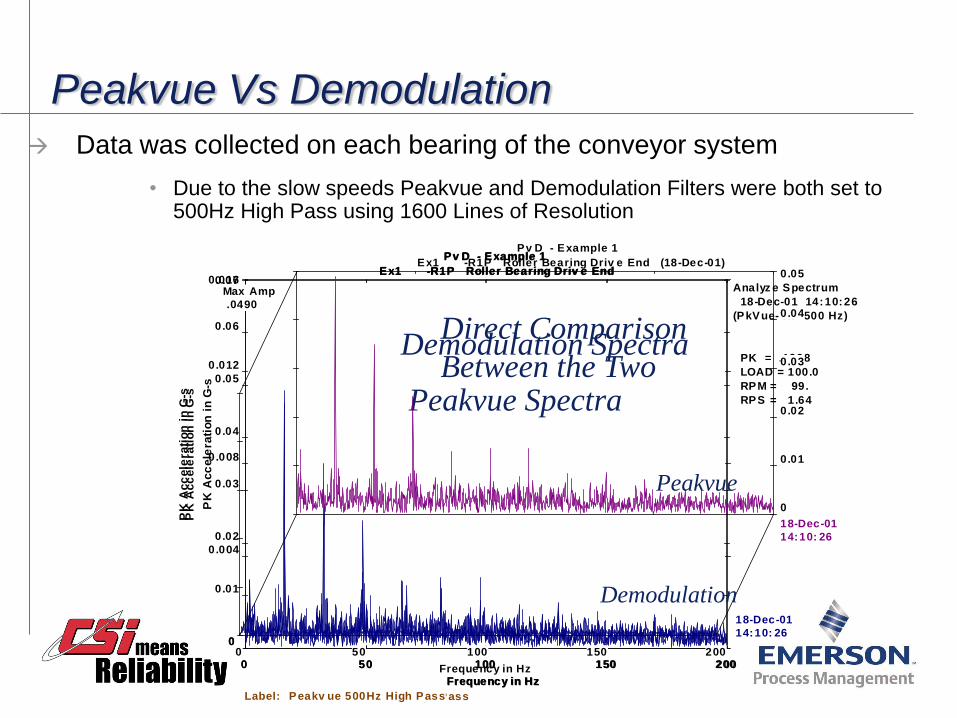
Peakvue Vs Demodulation
Data was collected on each bearing of the conveyor system
• Due to the slow speeds Peakvue and Demodulation Filters were both set to 500Hz High Pass using 1600 Lines of Resolution
Pv D - Example 1
Ex1 -R1P Roller Bearing Driv e End
Label: Demodulated 500Hz High Pass
Analyz e Spectrum
18-Dec-01 14:22:30
(Demod- HP 500 Hz )
PK = .0295
LOAD = 100.0
RPM = 97.
RPS = 1 .62
0 50 100 150 200
0
0.004
0.008
0.012
0.016
Frequency in Hz
PK
Ac
ce
lera
tio
n i
n G
-s
Demodulation Spectra
Pv D - Example 1
Ex1 -R1P Roller Bearing Driv e End
Label: Peakv ue 500Hz High Pass
Analyz e Spectrum
18-Dec-01 14:10:26
(PkVue- HP 500 Hz)
PK = .1238
LOAD = 100.0
RPM = 99.
RPS = 1 .64
0 50 100 150 200
0
0.01
0.02
0.03
0.04
0.05
0.06
0.07
Frequency in Hz
PK
Ac
ce
lera
tio
n i
n G
-s Peakvue Spectra
PK
Ac
ce
lera
tio
n i
n G
-s
Frequency in Hz
Pv D - Example 1
Ex1 -R1P Roller Bearing Driv e End (18-Dec-01)
0 50 100 150 200
0
0.01
0.02
0.03
0.04
0.05
Max Amp
.0490
14:10: 26
18-Dec-01
14:10: 26
18-Dec-01
Direct Comparison
Between the Two
Peakvue
Demodulation
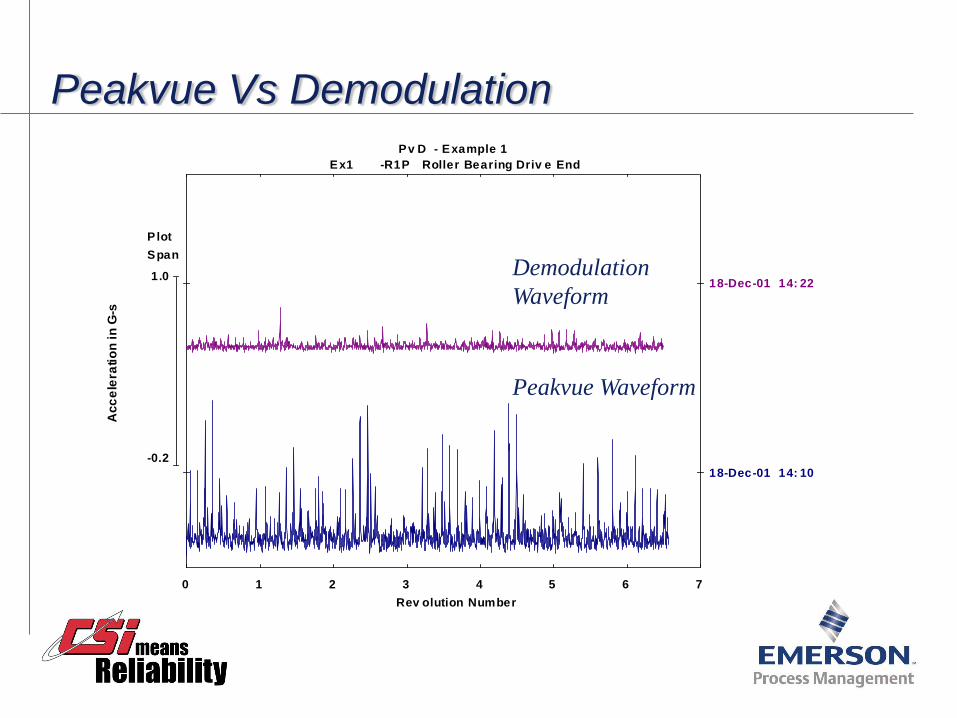
Peakvue Vs Demodulation Pv D - Example 1
Ex1 -R1P Roller Bearing Driv e End
Rev olution Number
Ac
ce
lera
tio
n i
n G
-s
0 1 2 3 4 5 6 7
Plot
Span
-0.2
1.0
18-Dec-01 14: 10
18-Dec-01 14: 22
Peakvue Waveform
Demodulation
Waveform
Acquiring Peakvue Data Setting up the 2120A
Creating a Peakvue AP Set
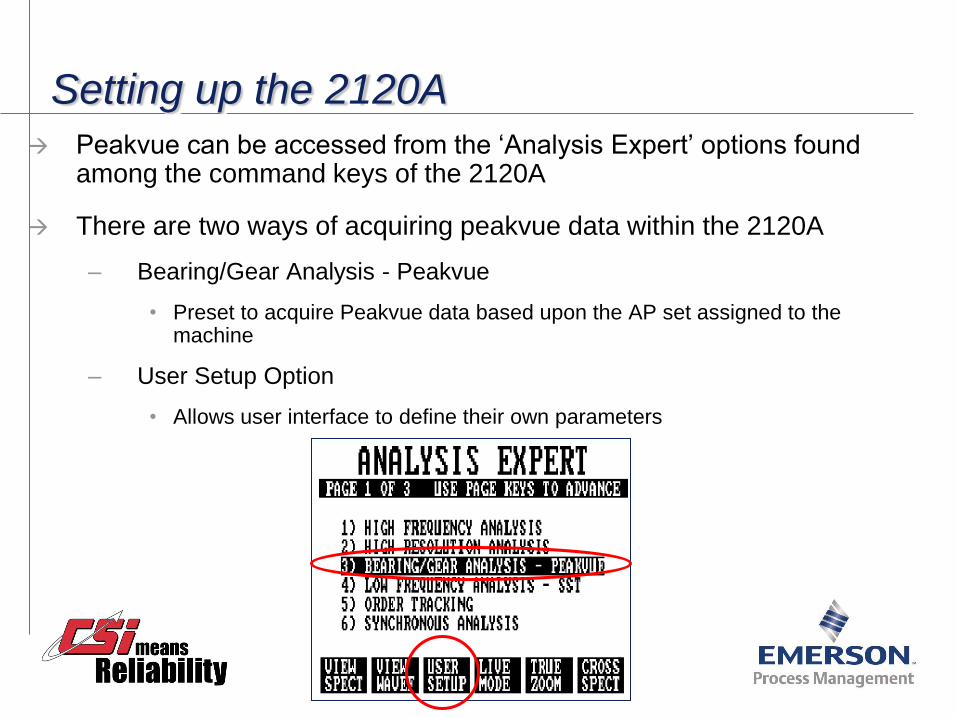
Setting up the 2120A Peakvue can be accessed from the ‘Analysis Expert’ options found
among the command keys of the 2120A
There are two ways of acquiring peakvue data within the 2120A
– Bearing/Gear Analysis - Peakvue
• Preset to acquire Peakvue data based upon the AP set assigned to the machine
– User Setup Option
• Allows user interface to define their own parameters
Setting up the 2120A
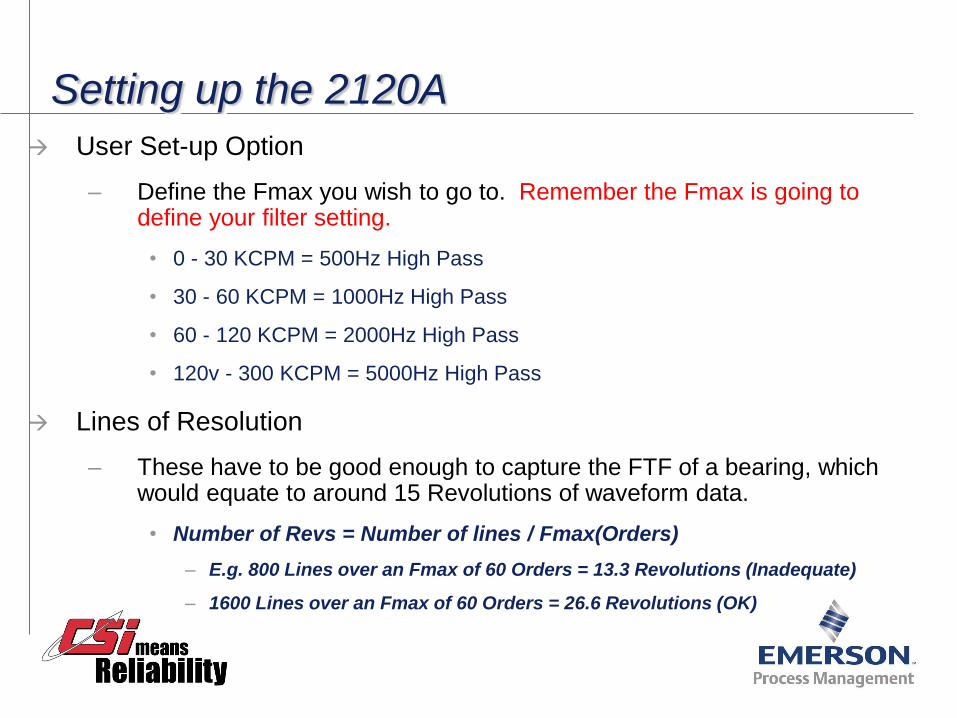
User Set-up Option
– Define the Fmax you wish to go to. Remember the Fmax is going to define your filter setting.
• 0 - 30 KCPM = 500Hz High Pass
• 30 - 60 KCPM = 1000Hz High Pass
• 60 - 120 KCPM = 2000Hz High Pass
• 120v - 300 KCPM = 5000Hz High Pass
Lines of Resolution
– These have to be good enough to capture the FTF of a bearing, which would equate to around 15 Revolutions of waveform data.
• Number of Revs = Number of lines / Fmax(Orders)
– E.g. 800 Lines over an Fmax of 60 Orders = 13.3 Revolutions (Inadequate)
– 1600 Lines over an Fmax of 60 Orders = 26.6 Revolutions (OK)
Setting up the 2120A Averages
– This has to be set to 1 Average to gain the ‘true peak’ value.
• If you start averaging the data then a stress wave detected in the first average that is not there in the second will lose it’s true amplitude when averaged together.
By using the ‘Page Down’ Button we can toggle through the pages until we find our Peakvue Options (Page 4 of 4)
– We turn Peakvue to ‘Yes’
– The Pre-filter can now be changed to our required HP Setting
Units
– The default unit for peakvue is ‘Acceleration’. Remember we are trying to detect very high frequency events, well above conventional vibration data. Acceleration accentuates high frequencies.
• Sensor units can be used if using an accelerometer, however CSI recommend a minimum mounting of a ‘Rare Earth Magnet’ for data collection
Setting up the 2120 Data collection can now commence.
Check the data once collection has finished
– Look for:
• Impacts in both spectrum and waveform
• Amplitude levels of the Waveform
• quality of the data
– If a problem is detected you may want to acquire more data with a different filter setting.
– Remember to store the data once the reading has been taken
At least one Peakvue point should be applied to each critical machine to detect early bearing wear, gearwear or adverse metal to metal contact.
– This will need building in the database and adding to the route
Peakvue™ Analysis Parameter Setup
Mastertrend and RBMware
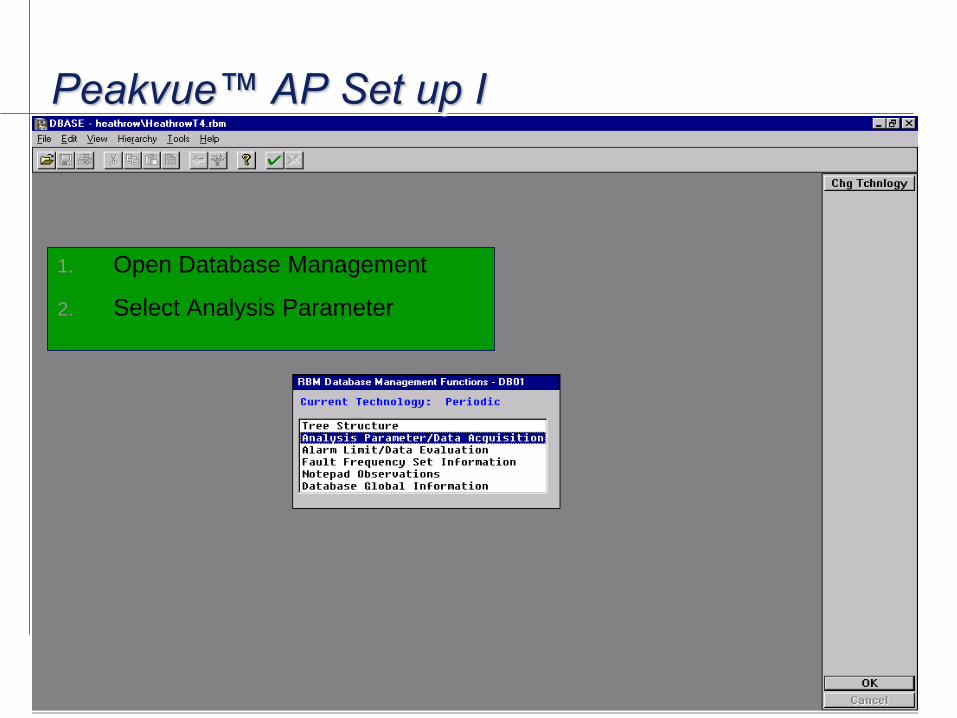
1. Open Database Management
2. Select Analysis Parameter
Peakvue™ AP Set up I
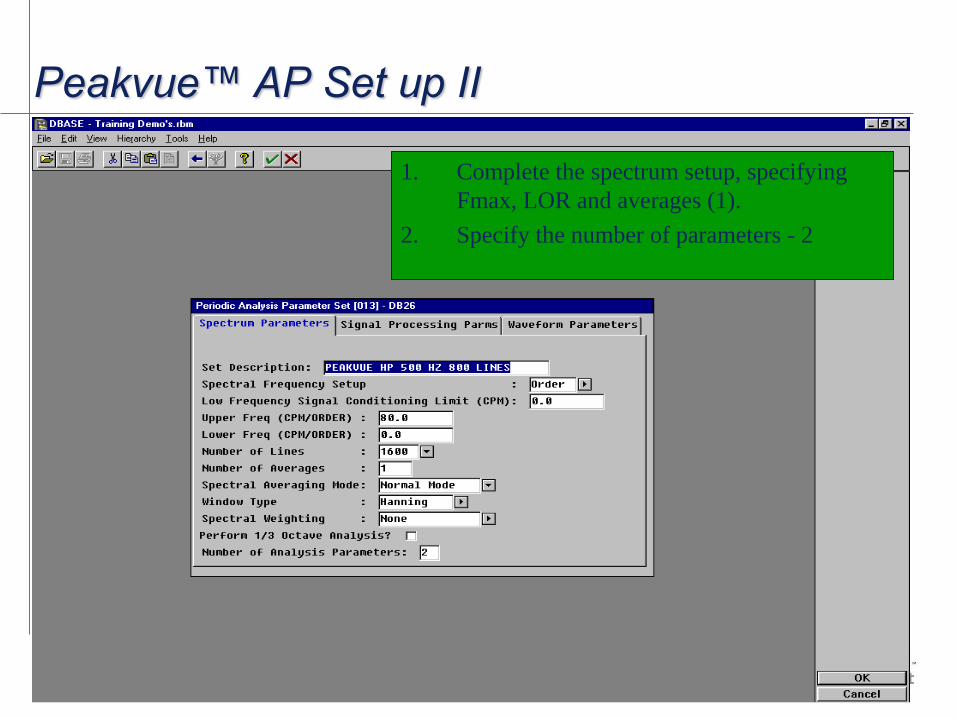
Peakvue™ AP Set up II
1. Complete the spectrum setup, specifying
Fmax, LOR and averages (1).
2. Specify the number of parameters - 2
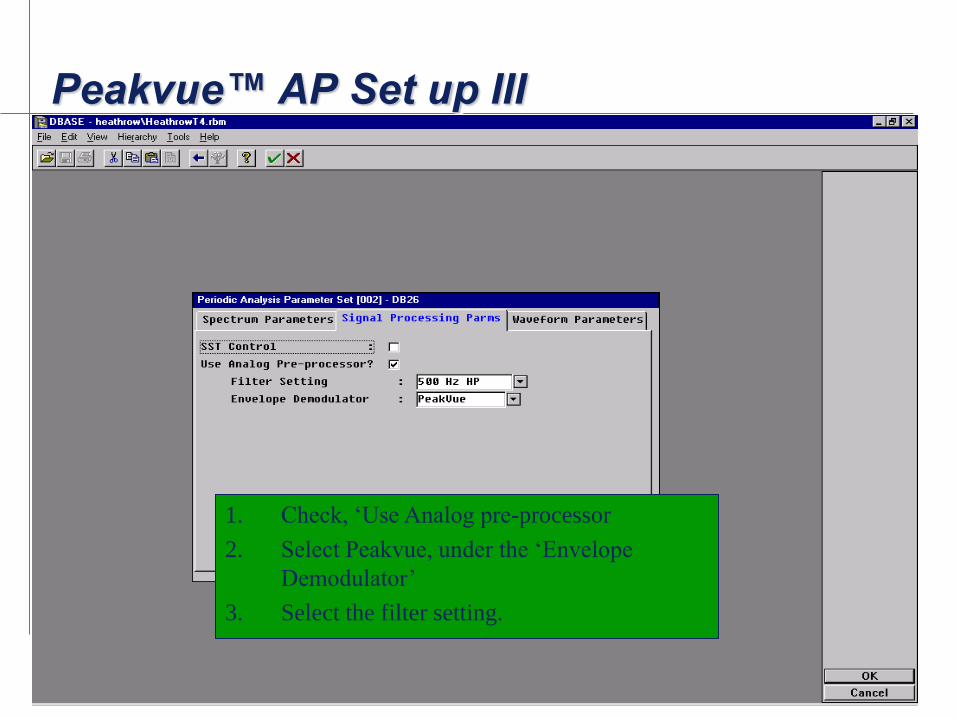
Peakvue™ AP Set up III
1. Check, ‘Use Analog pre-processor
2. Select Peakvue, under the ‘Envelope
Demodulator’
3. Select the filter setting.
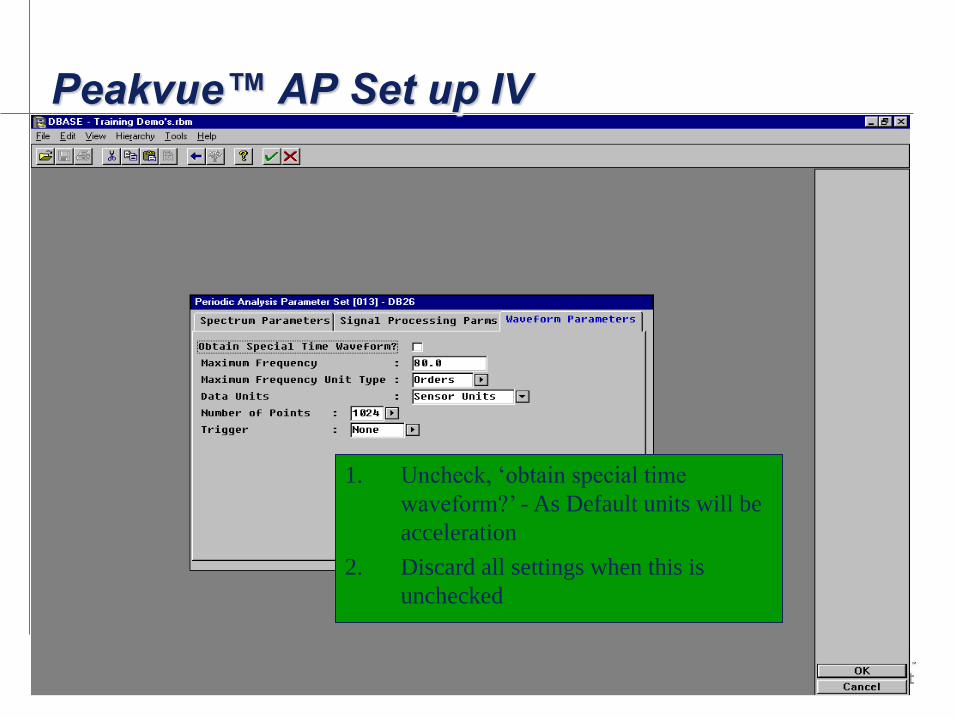
Peakvue™ AP Set up IV
1. Uncheck, ‘obtain special time
waveform?’ - As Default units will be
acceleration
2. Discard all settings when this is
unchecked
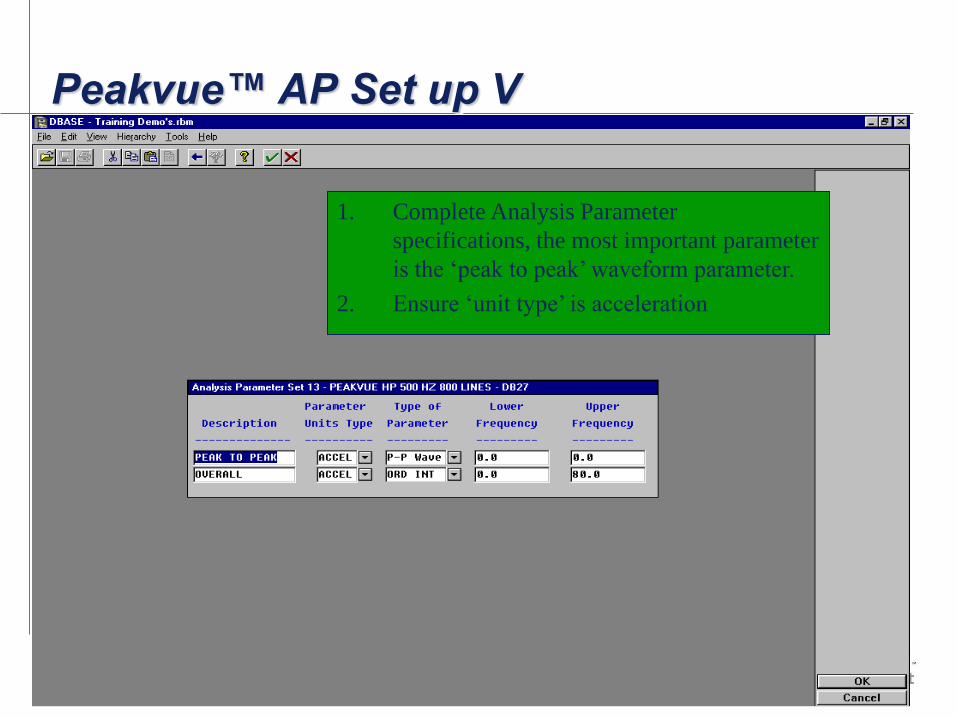
Peakvue™ AP Set up V
1. Complete Analysis Parameter
specifications, the most important parameter
is the ‘peak to peak’ waveform parameter.
2. Ensure ‘unit type’ is acceleration
Gearbox case study
Diagram
G1
G3
G4
G5
G6
G7
G8
G9
G10
G11
G12
M1 M2
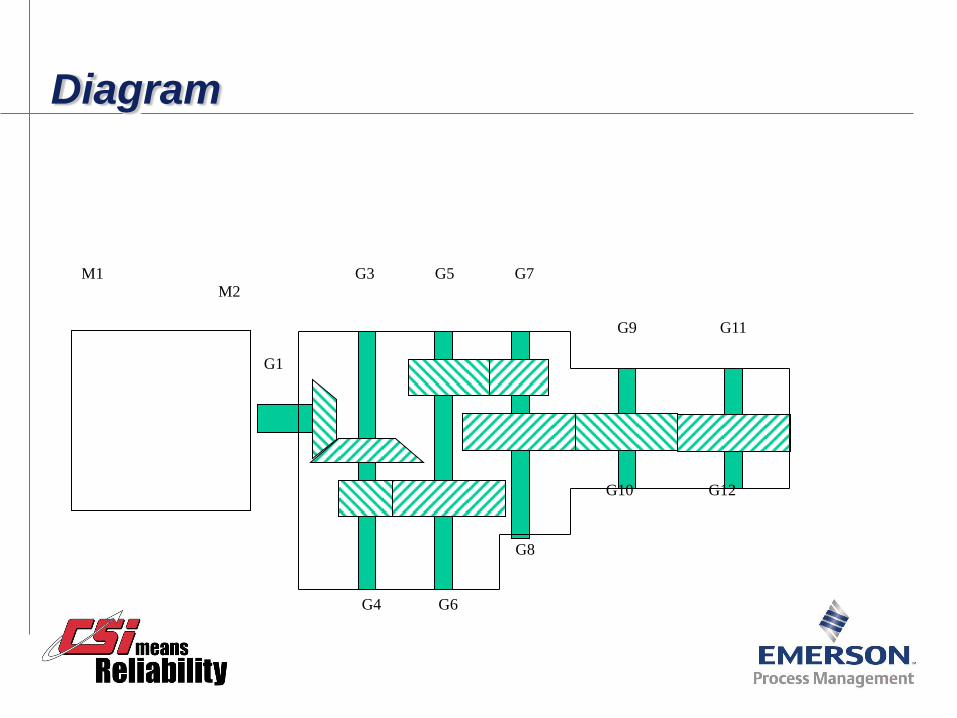
Introduction
The above gearbox had been overhauled in the workshop and was on its final test run. A vibration signature was taken to confirm a small knock believed to be coming from the coupling, and prove the gearbox was OK.
The readings were taken using Peakvue and standard Vibration Technology on the corresponding points indicated in the diagram above. The following spectrum where obtained.
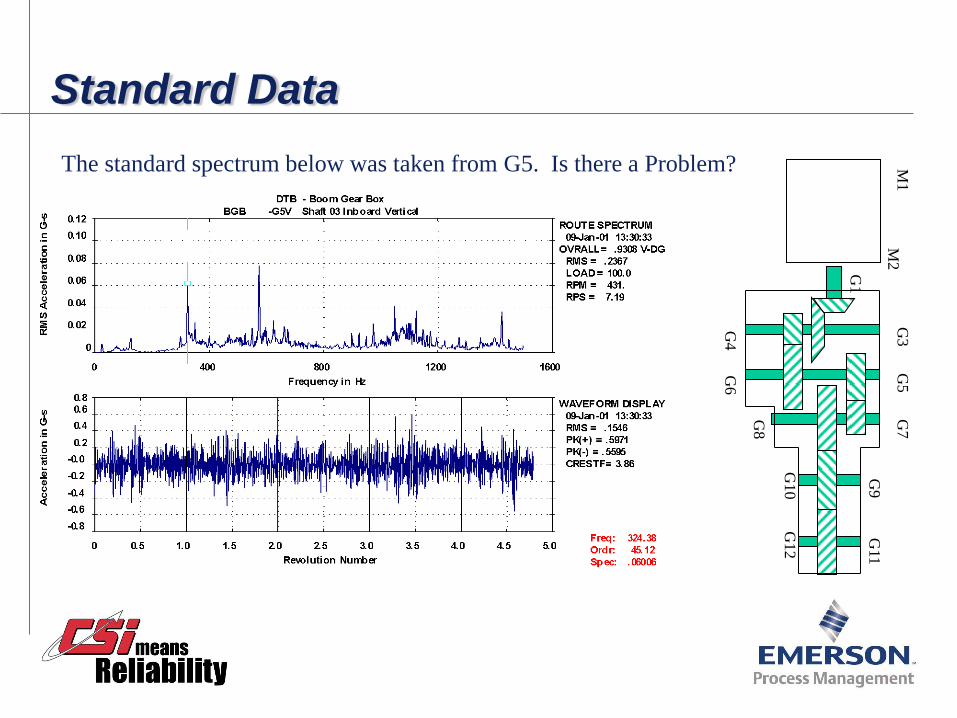
Standard Data
The standard spectrum below was taken from G5. Is there a Problem?
G1
G3
G4
G5
G6
G7
G8
G9
G10
G11
G12
M1
M2
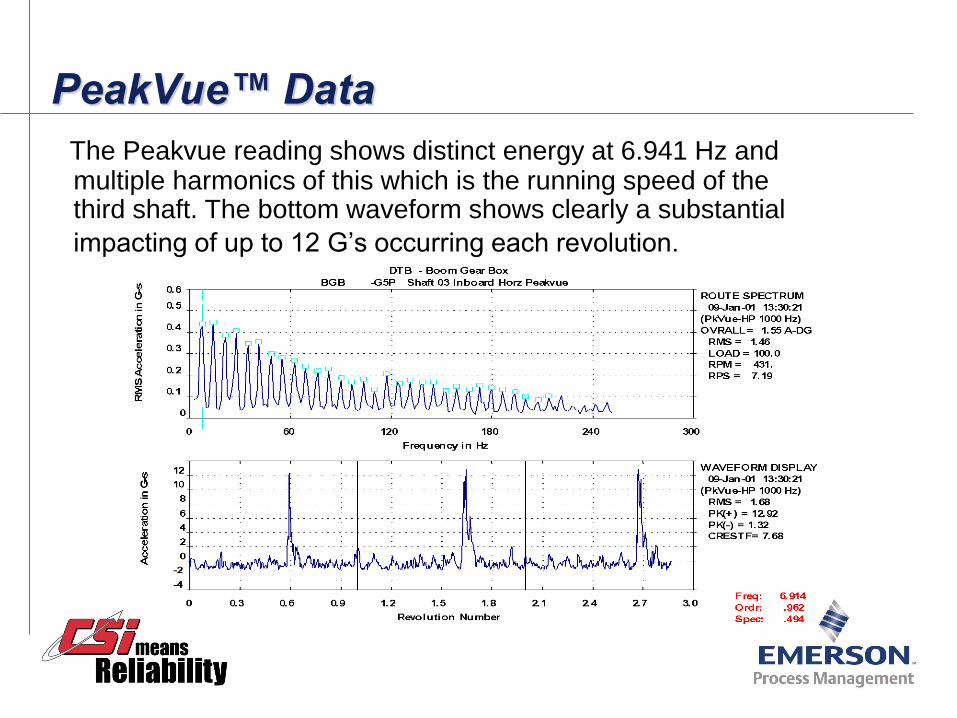
The Peakvue reading shows distinct energy at 6.941 Hz and multiple harmonics of this which is the running speed of the third shaft. The bottom waveform shows clearly a substantial
impacting of up to 12 G’s occurring each revolution.
PeakVue™ Data
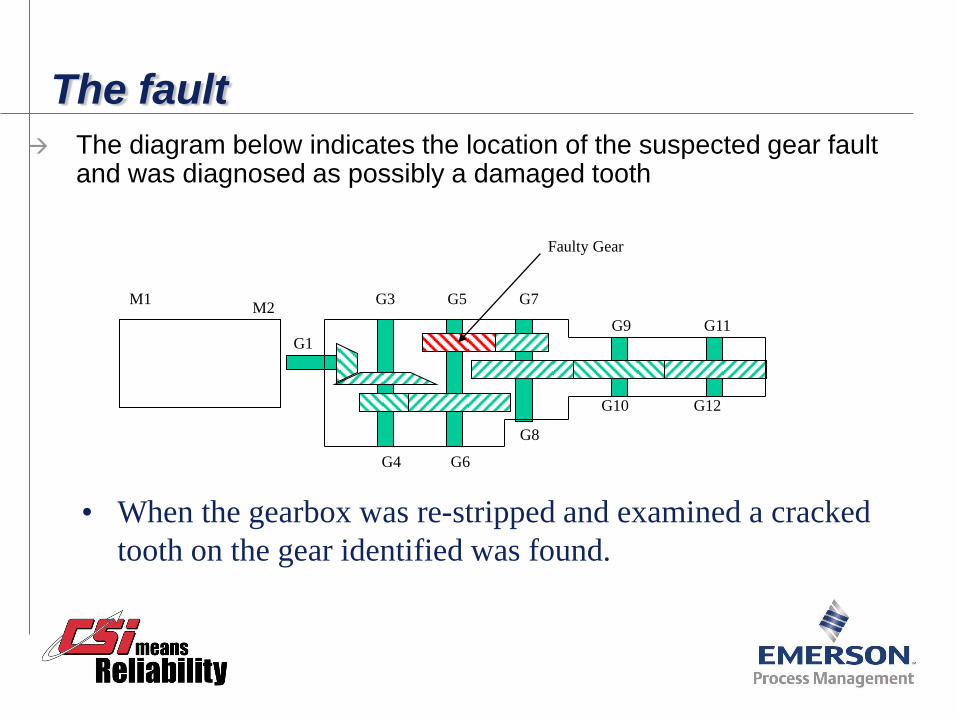
The fault The diagram below indicates the location of the suspected gear fault
and was diagnosed as possibly a damaged tooth
G1
G3
G4
G5
G6
G7
G8
G9
G10
G11
G12
M1 M2
Faulty Gear
• When the gearbox was re-stripped and examined a cracked
tooth on the gear identified was found.
Related Documents