The First NIDA Business Analytics and Data Sciences Contest/Conference วันที่ 1-2 กันยายน 2559 ณ อาคารนวมินทราธิราช สถาบันบัณฑิตพัฒนบริหารศาสตร์ -เมื่อทฤษฎีและปฏิบัติมาเจอกัน งานวิจัย BEST PRACTICE ความรู้ใหม่ เทคโนโลยี ใหม่ ทั้งด้าน BUSINESS ANALYTICS AND INTELLIGENCE, DATA SCIENCES, APPLIED STATISTIC, COMPUTER SCIENCES AND INFORMATION SYSTEM, INFORMATION TECHNOLOGY MANAGEMENT, และ LOGISTIC MANAGEMENT -ร่วมกันสร้างสรรค์และพัฒนาเยาวชนและบุคลากรของชาติเพื่อยกระดับความสามารถ ในการแข่งขันของประเทศไทยตามยุทธศาสตร์ THAILAND 4.0 -จัดโดยคณะสถิติประยุกต์ สถาบันบัณฑิตพัฒนบริหารศาสตร์และ DATA SCIENCE THAILAND https://businessanalyticsnida.wordpress.com https://www.facebook.com/BusinessAnalyticsNIDA/

Welcome message from author
This document is posted to help you gain knowledge. Please leave a comment to let me know what you think about it! Share it to your friends and learn new things together.
Transcript

The First NIDA Business Analytics and Data Sciences Contest/Conference วันที่ 1-2 กันยายน 2559 ณ อาคารนวมินทราธิราช สถาบันบัณฑิตพัฒนบริหารศาสตร์
-เมื่อทฤษฎีและปฏิบัติมาเจอกัน งานวิจัย BEST PRACTICE ความรู้ใหม่ เทคโนโลยีใหม่ ทั้งด้าน BUSINESS ANALYTICS AND INTELLIGENCE, DATA SCIENCES, APPLIED STATISTIC, COMPUTER SCIENCES AND INFORMATION SYSTEM, INFORMATION TECHNOLOGY MANAGEMENT, และ LOGISTIC MANAGEMENT -ร่วมกันสร้างสรรค์และพัฒนาเยาวชนและบุคลากรของชาติเพื่อยกระดับความสามารถในการแข่งขันของประเทศไทยตามยุทธศาสตร์ THAILAND 4.0 -จัดโดยคณะสถิติประยุกต์ สถาบันบัณฑิตพัฒนบริหารศาสตร์และ DATA SCIENCE THAILAND
https://businessanalyticsnida.wordpress.com https://www.facebook.com/BusinessAnalyticsNIDA/
1st September 2016
Introduction to Financial Time Series
NIDA Business Analytics and Data Sciences Conference
Chainarong Kesamoon, PhD Thammasat University & Data Science Thailand Team
Outline:
✤ What is time series?
✤ How to model financial time series?
✤ Forecasting

What is time series?✤ Numeric data
✤ 1, 1, 2, 3, 5, 8,…
✤ 2.8, 1.9, -10, 25, -6.7,…
✤ Time series
✤ measured by time
✤ Time matters!!!

Financial Time Series
✤ Stock prices
✤ Market index
✤ Money Exchange rates
✤ gold, oil

Date
Typical data set source: Google Finance
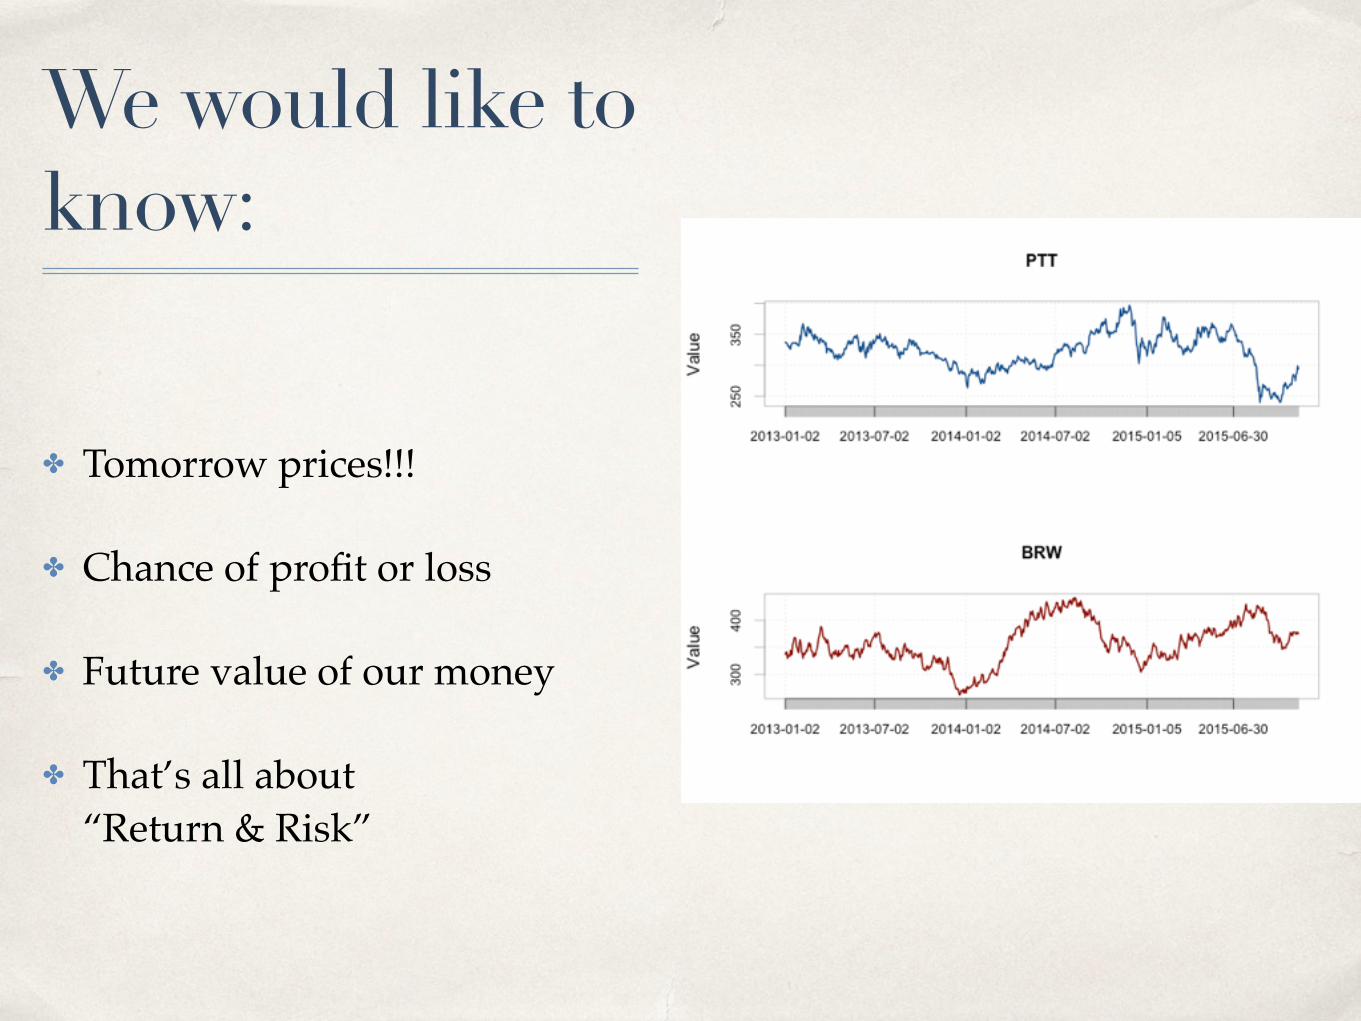
We would like to know:
✤ Tomorrow prices!!!
✤ Chance of profit or loss
✤ Future value of our money
✤ That’s all about “Return & Risk”

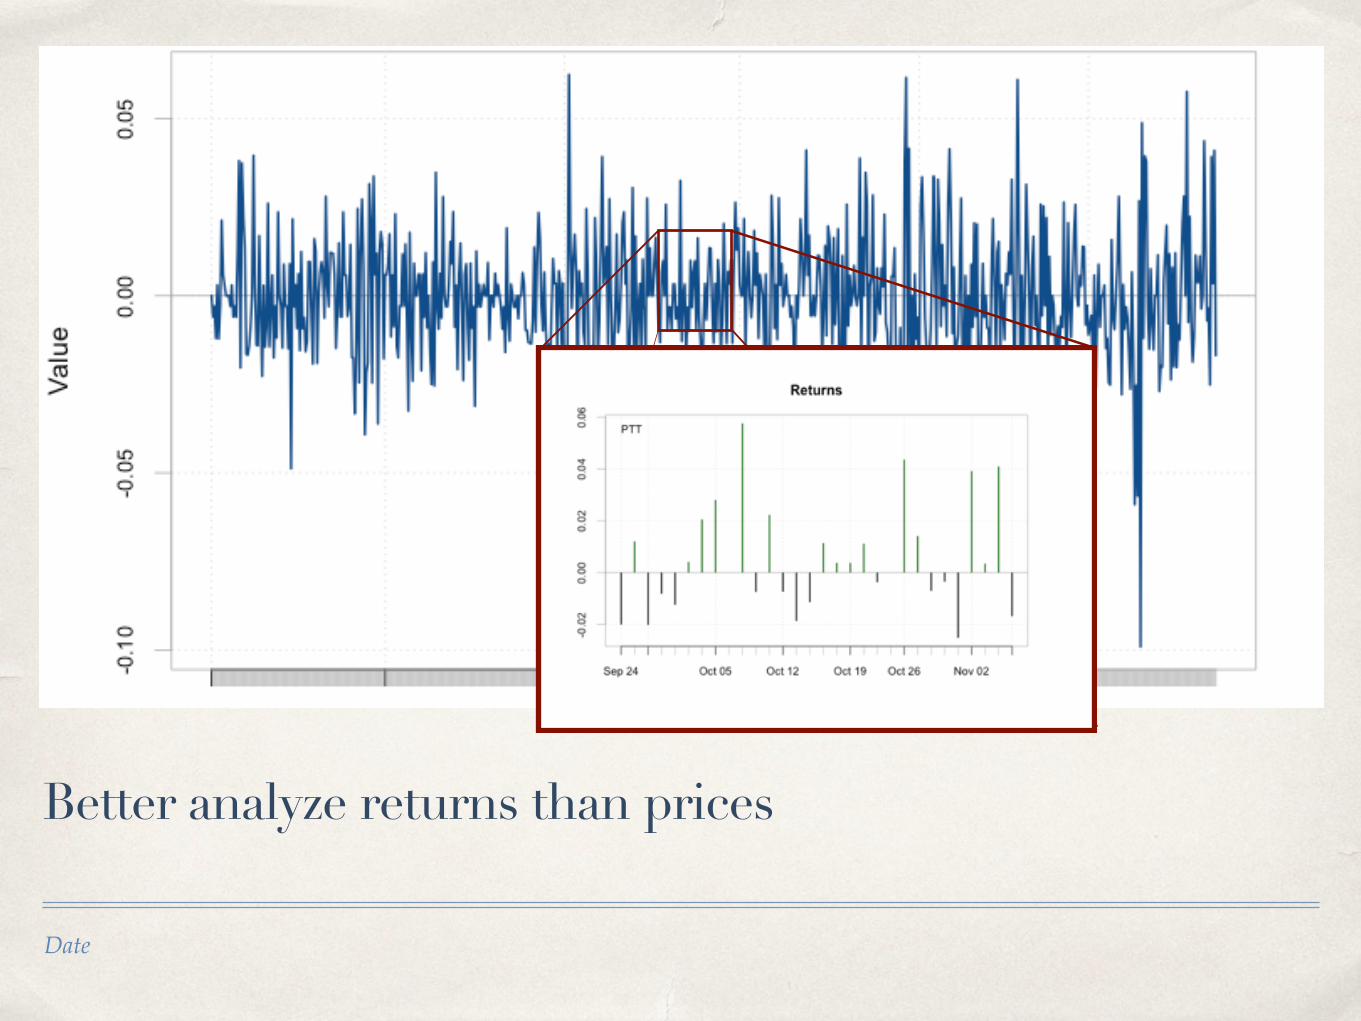
Return
✤ Today’s return=today’s price - yesterday’s price
✤ Percentage return = Today’s return/yesterday’s price
✤ Log return = log(today’s price) - log(yesterday’s price)
✤ know return then we also know price
Date
Better analyze returns than prices
Date
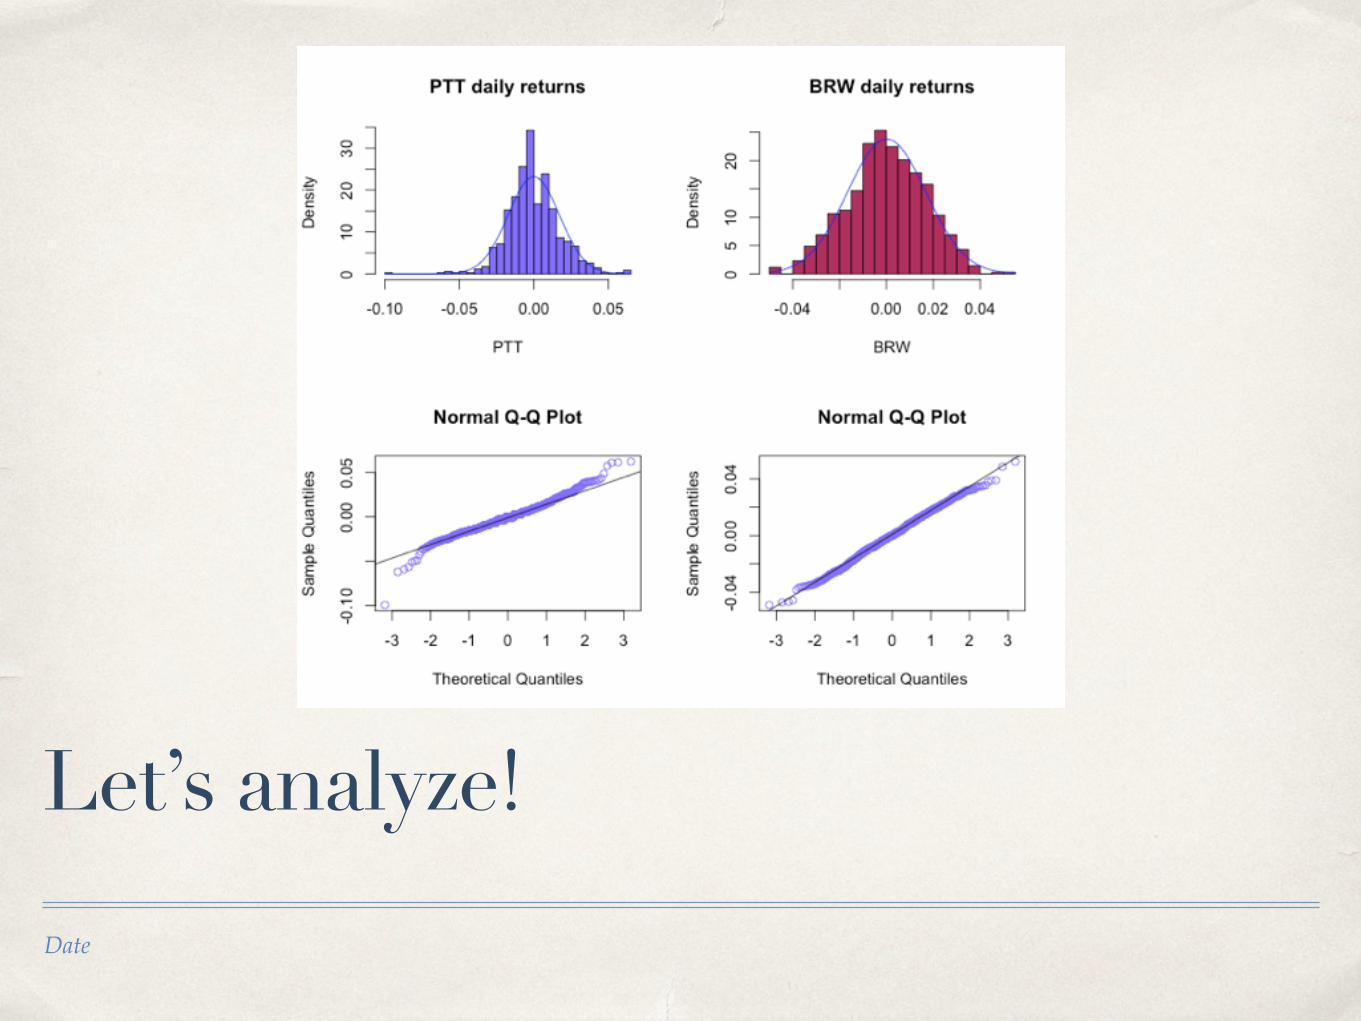
Let’s analyze!

Correlation
✤ Positive correlation :
✤ More experience, more salary
✤ Where there’s a will, there’s a way.
✤ Negative correlation:
✤ The higher the Doy, the lower the temperature.
✤ The more one works, the less free time one has.
✤ No correlation:
✤ The color of your shirt, the color of my shoes.
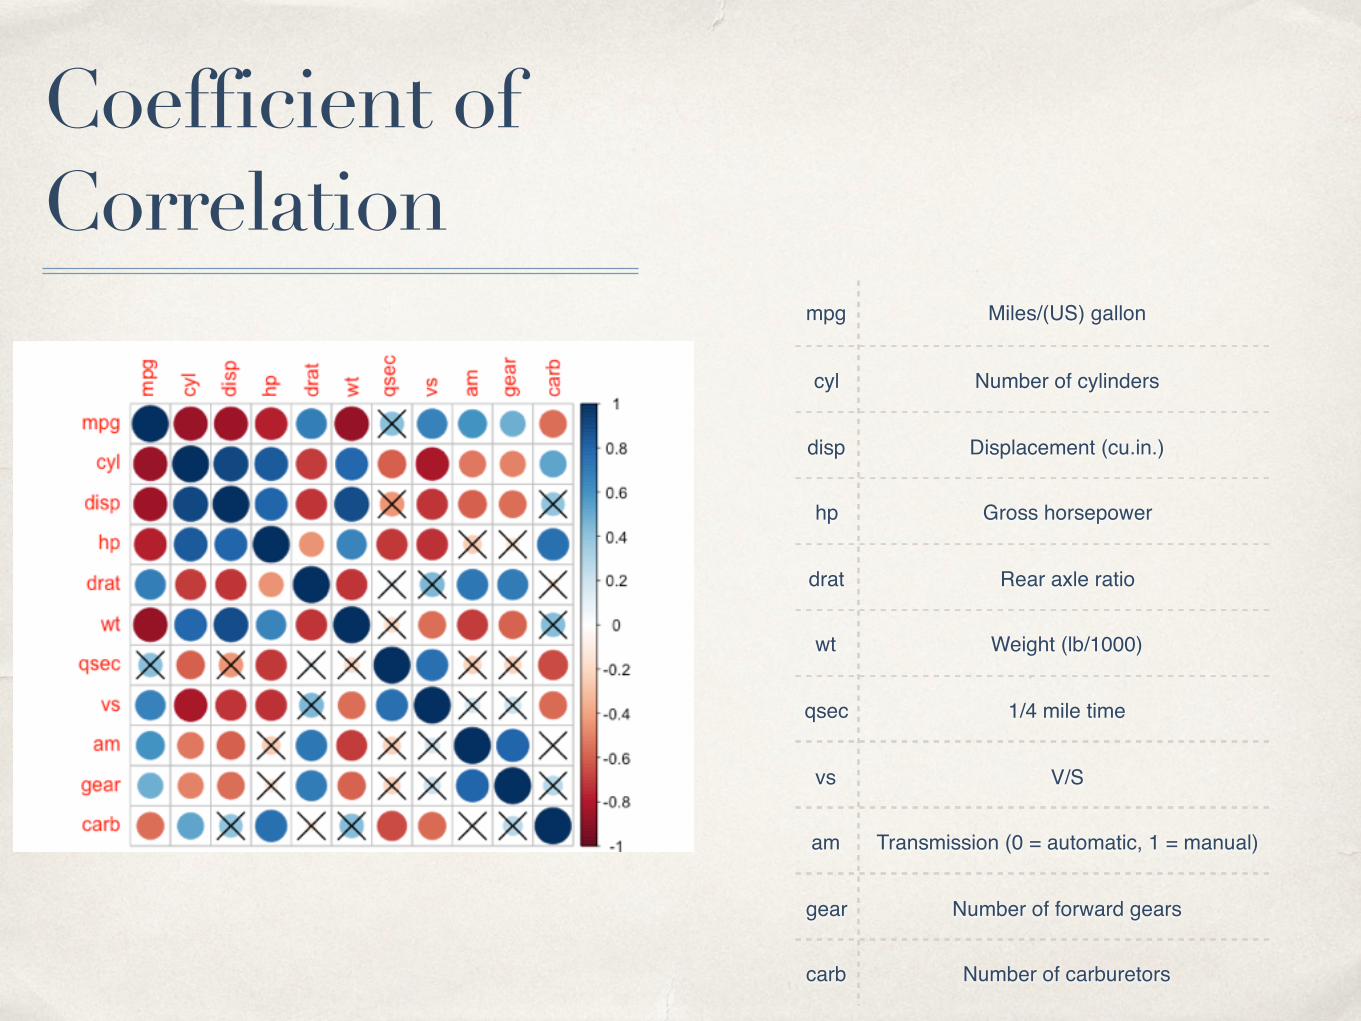
Coefficient of Correlation
mpg Miles/(US) gallon
cyl Number of cylinders
disp Displacement (cu.in.)
hp Gross horsepower
drat Rear axle ratio
wt Weight (lb/1000)
qsec 1/4 mile time
vs V/S
am Transmission (0 = automatic, 1 = manual)
gear Number of forward gears
carb Number of carburetors
Date
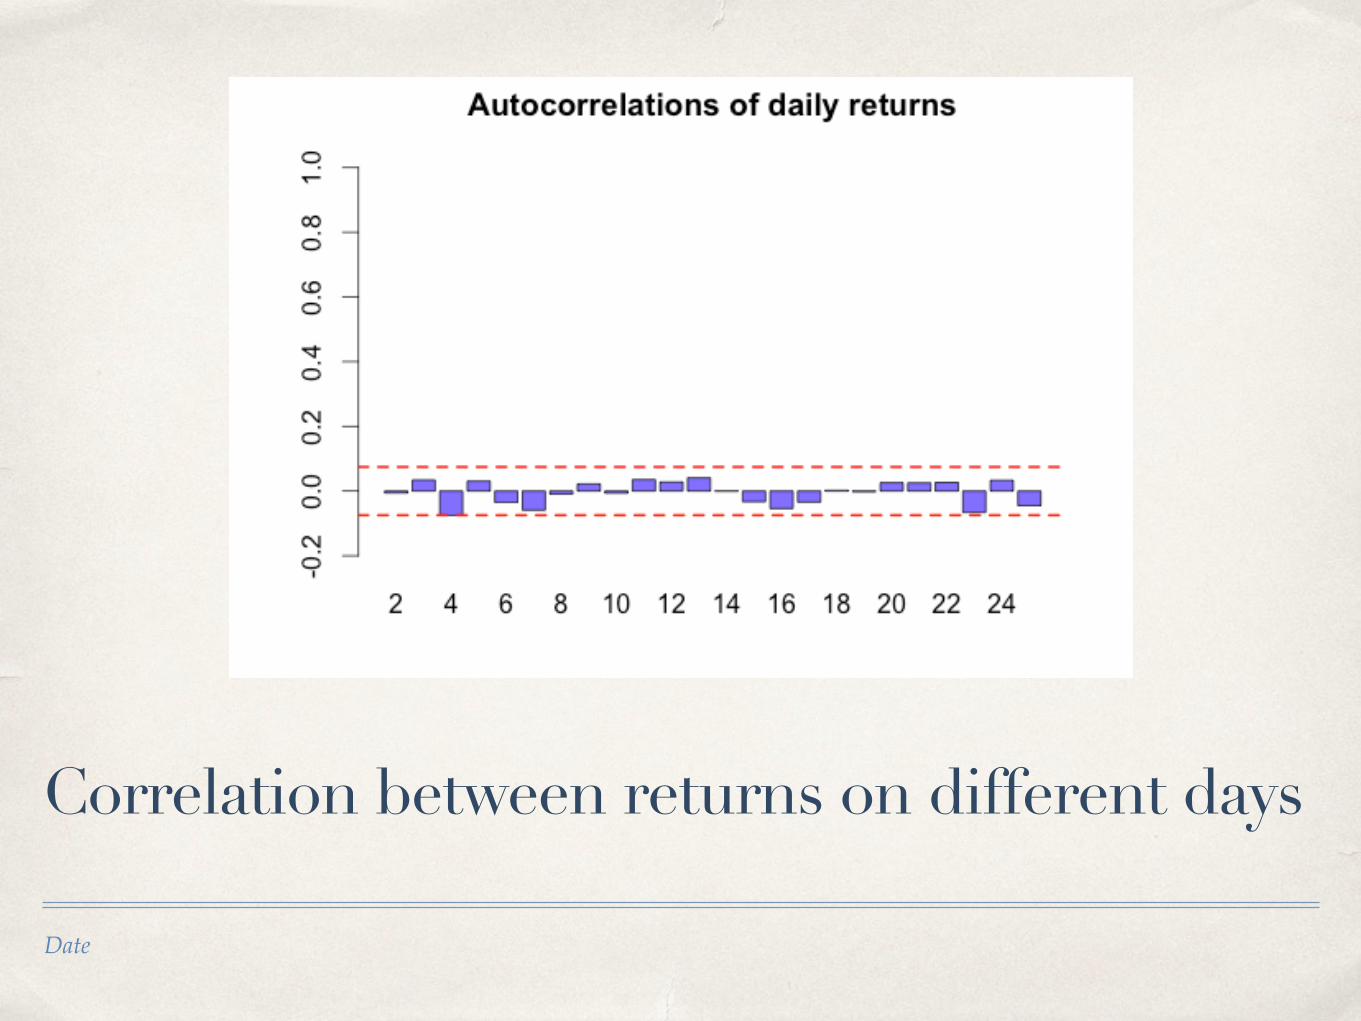
Correlation between returns on different days
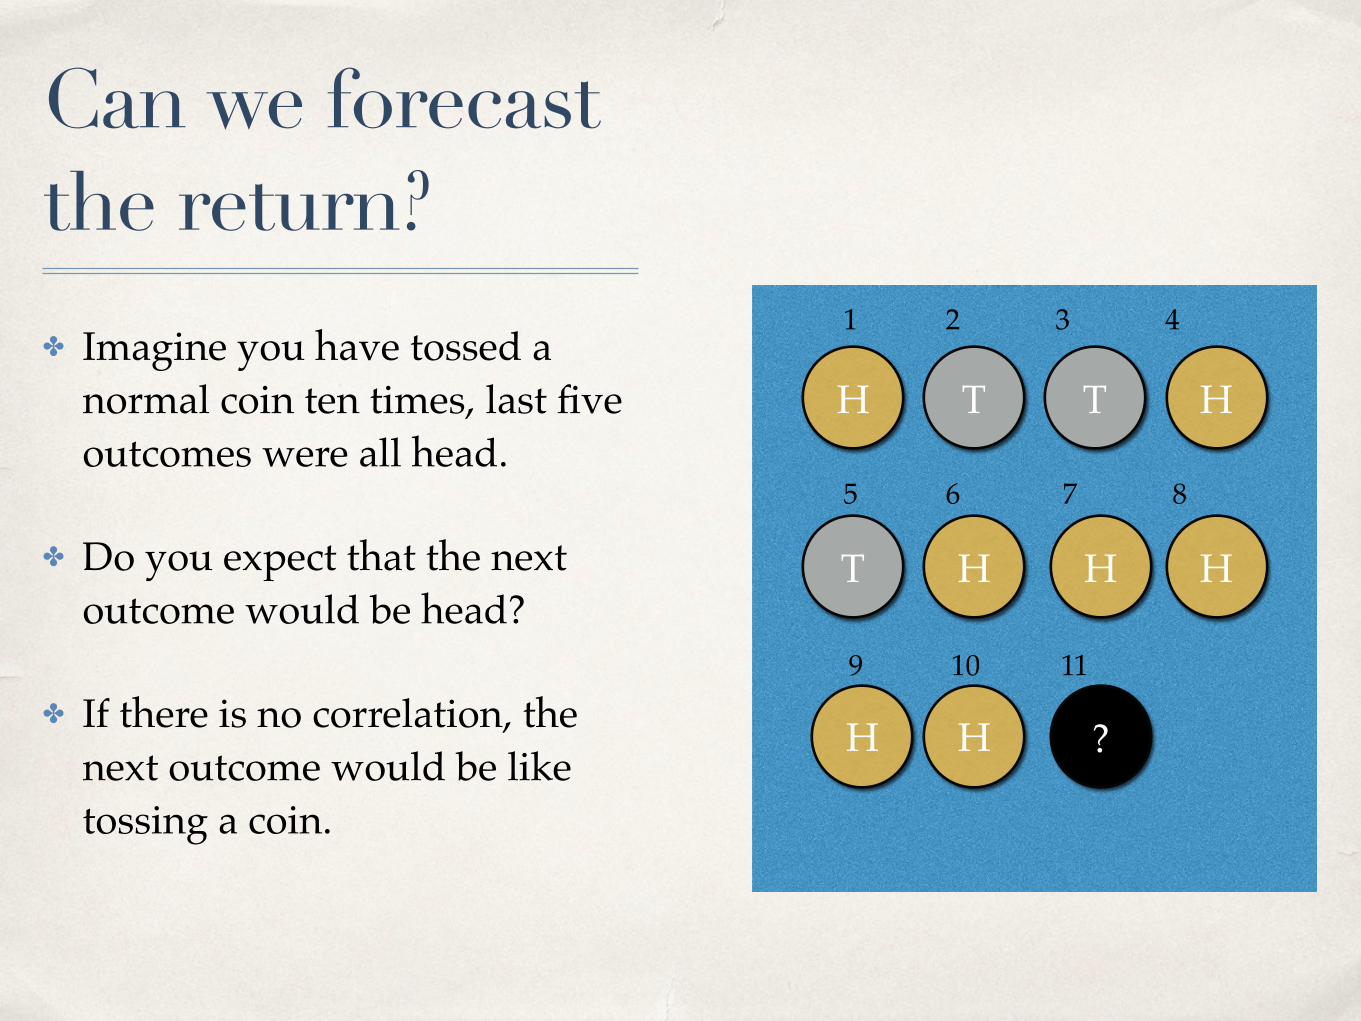
Can we forecast the return?✤ Imagine you have tossed a
normal coin ten times, last five outcomes were all head.
✤ Do you expect that the next outcome would be head?
✤ If there is no correlation, the next outcome would be like tossing a coin.
H T T H
T H H H
H H
1 2 3 4
5 6 7 8
9 10 11
?

Efficient Market Hypothesis
✤ A financial economist and passionate defender of the efficient markets hypothesis (EMH) was walking down the street with a friend. The friend stops and says, "Look, there's a $20 bill on the ground."
✤ The economist turns and says, "Boy, this must be our lucky day! Better pick that up quick because the market is so efficient it won't be there for very long. Finding a $20 bill lying around happens so infrequently that it would be foolish to spend our time searching for more of them. Certainly, after assigning a value to the time spent in the effort, an 'investment' in trying to find money lying on the street just waiting to be picked up would be a poor one. I am also certainly not aware of lots of people, if any, getting rich mining beaches with metal detectors."
✤ When he had finished they both look down and the $20 bill was gone!
source: http://www.etf.com/sections/features/123.html
Date
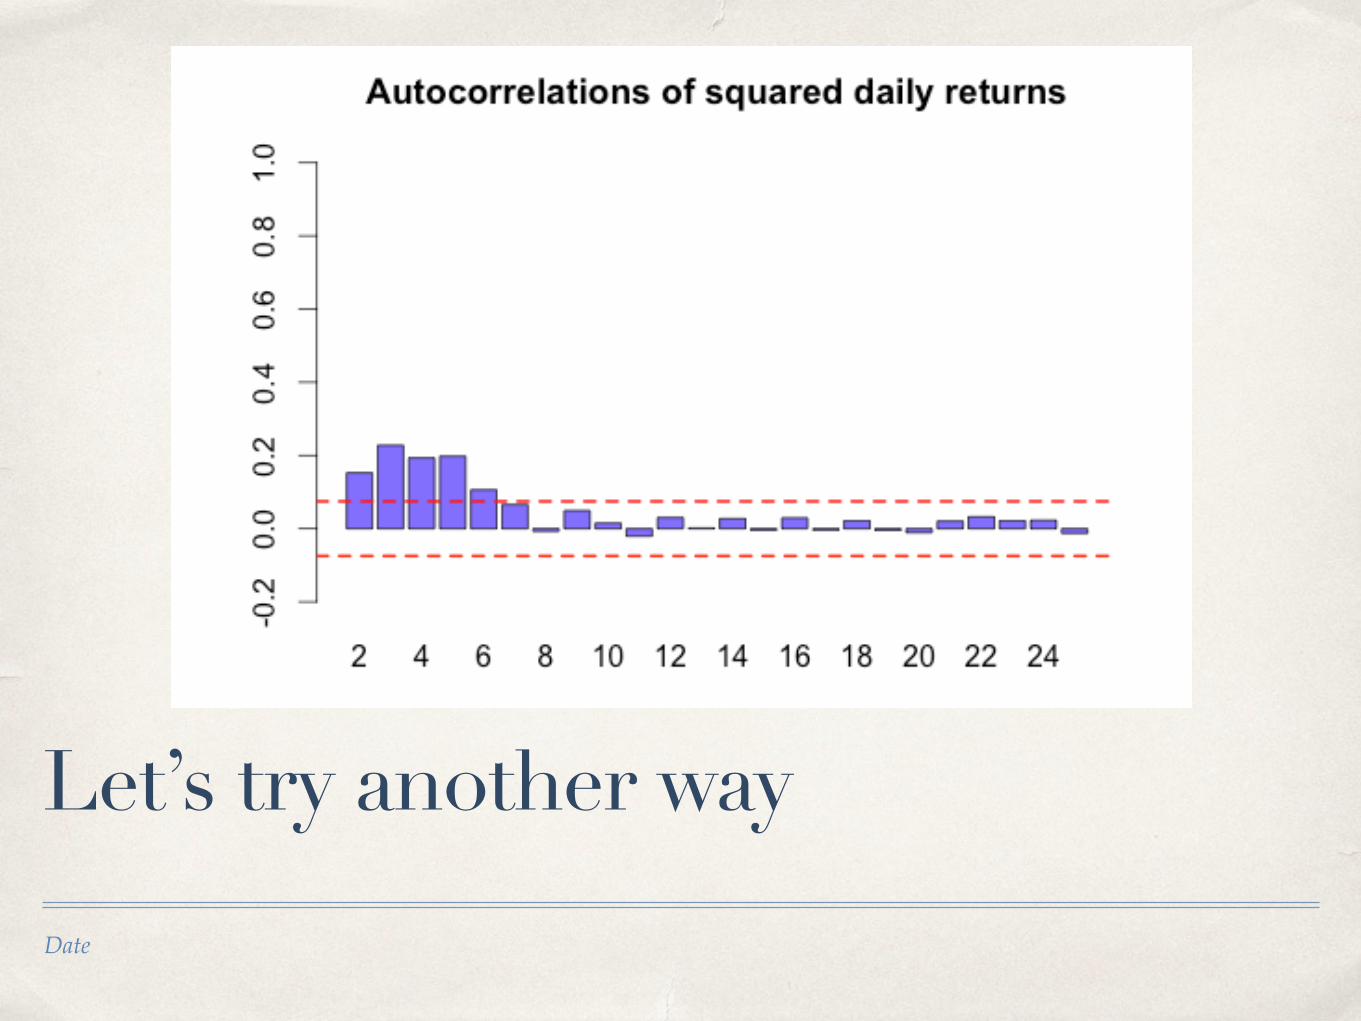
Let’s try another way

Why squared return?
✤ The variance of return is calculated from squared returns.
✤ Why variance? What is it?
✤ Variance is the degree of variation
✤ High variance => high volatility=> high risk
✤ Volatility is forecastable
✤ High risk, high return (but return can be either + or - )
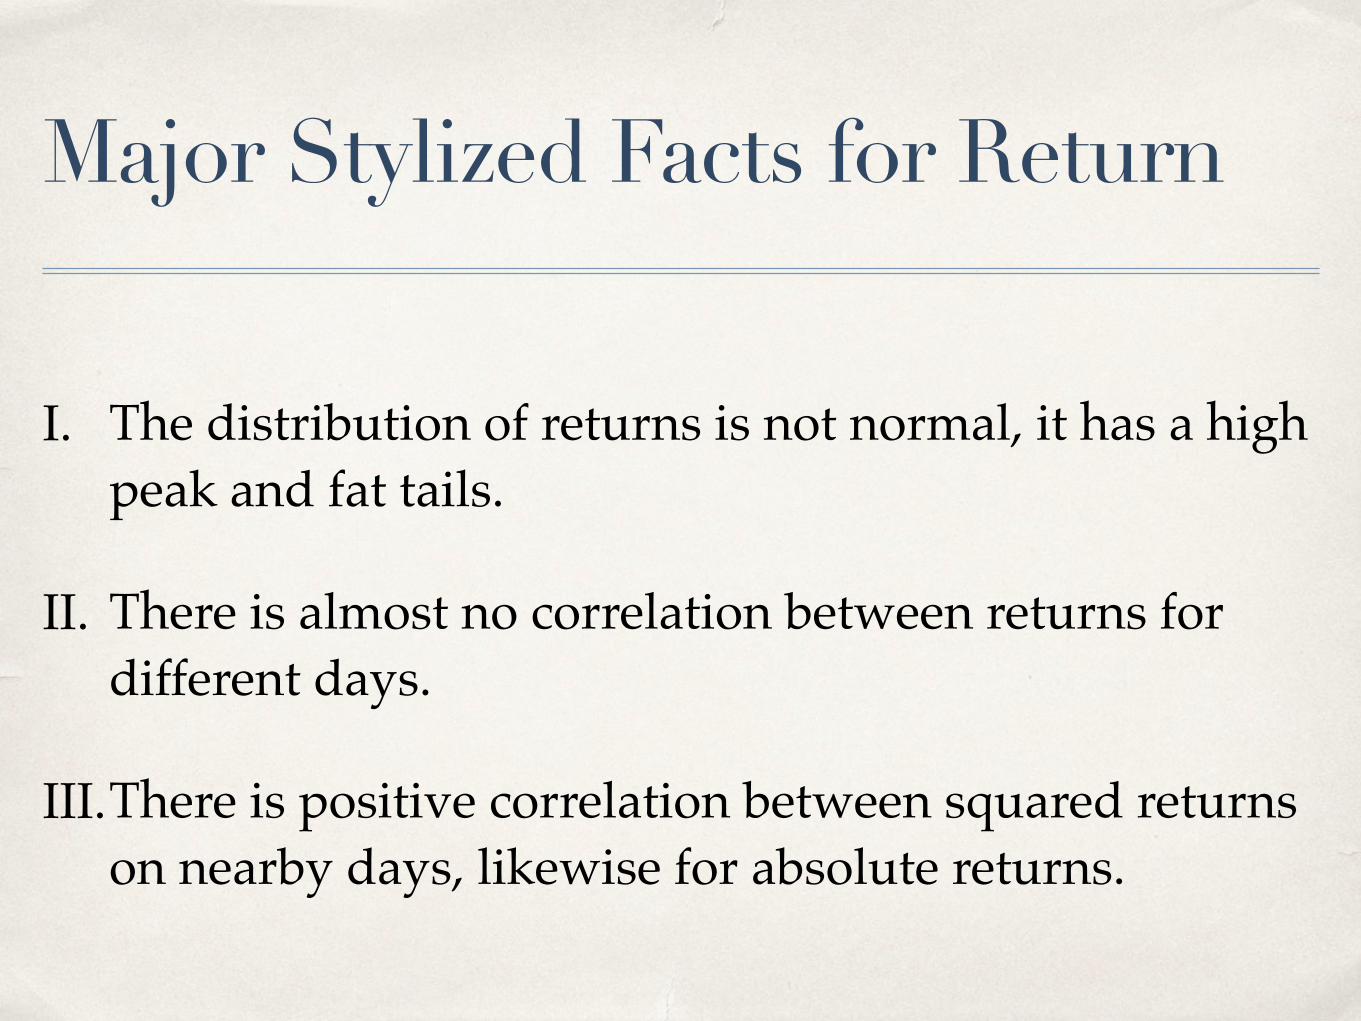
Major Stylized Facts for Return
I. The distribution of returns is not normal, it has a high peak and fat tails.
II. There is almost no correlation between returns for different days.
III.There is positive correlation between squared returns on nearby days, likewise for absolute returns.
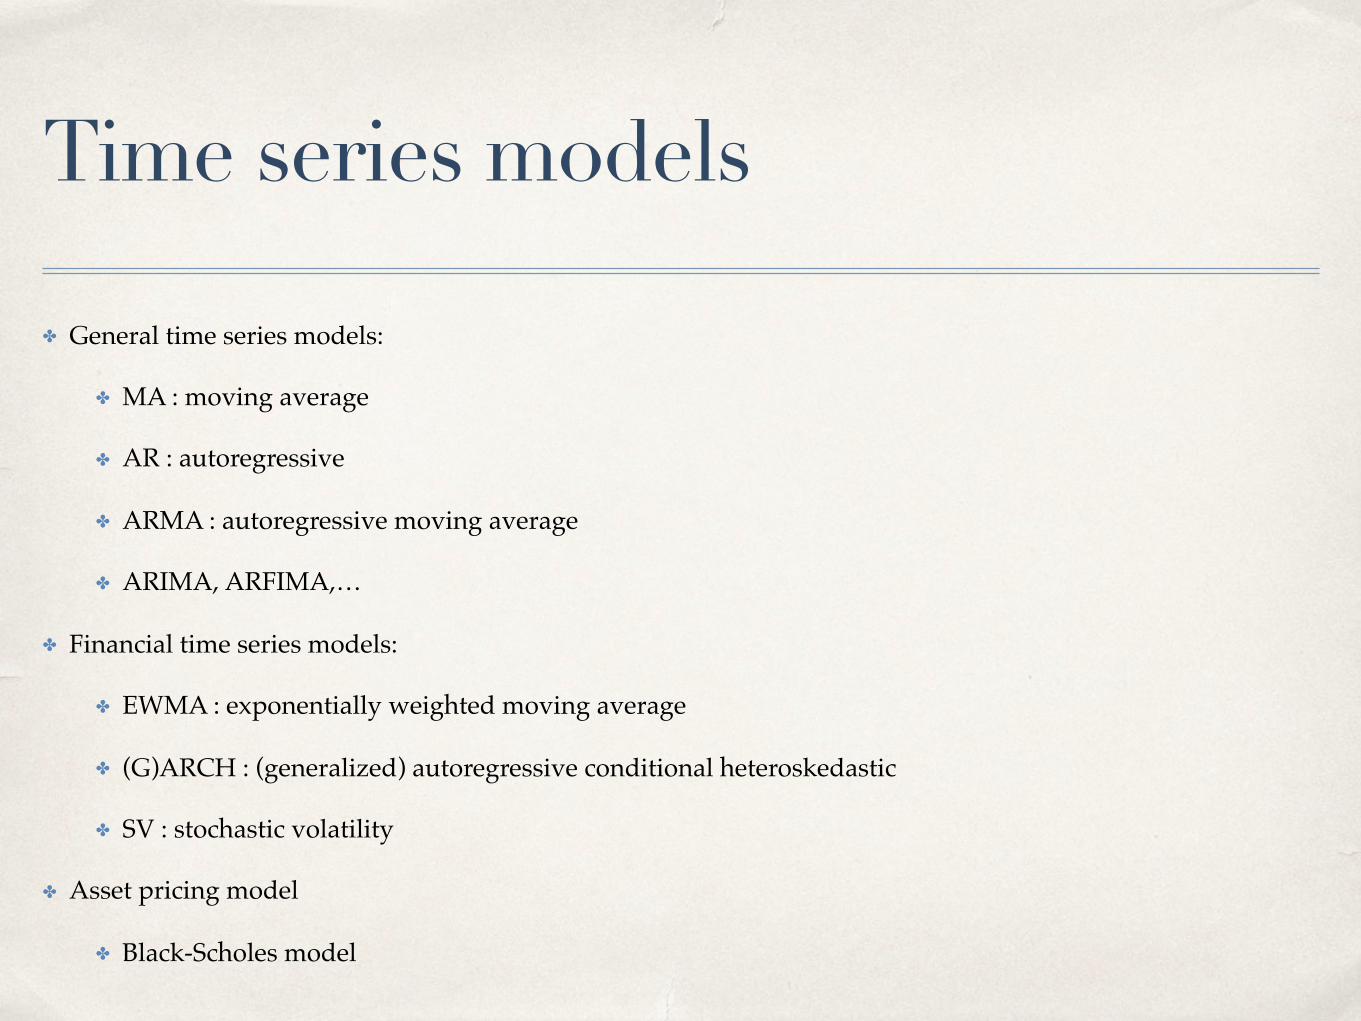
Time series models
✤ General time series models:
✤ MA : moving average
✤ AR : autoregressive
✤ ARMA : autoregressive moving average
✤ ARIMA, ARFIMA,…
✤ Financial time series models:
✤ EWMA : exponentially weighted moving average
✤ (G)ARCH : (generalized) autoregressive conditional heteroskedastic
✤ SV : stochastic volatility
✤ Asset pricing model
✤ Black-Scholes model
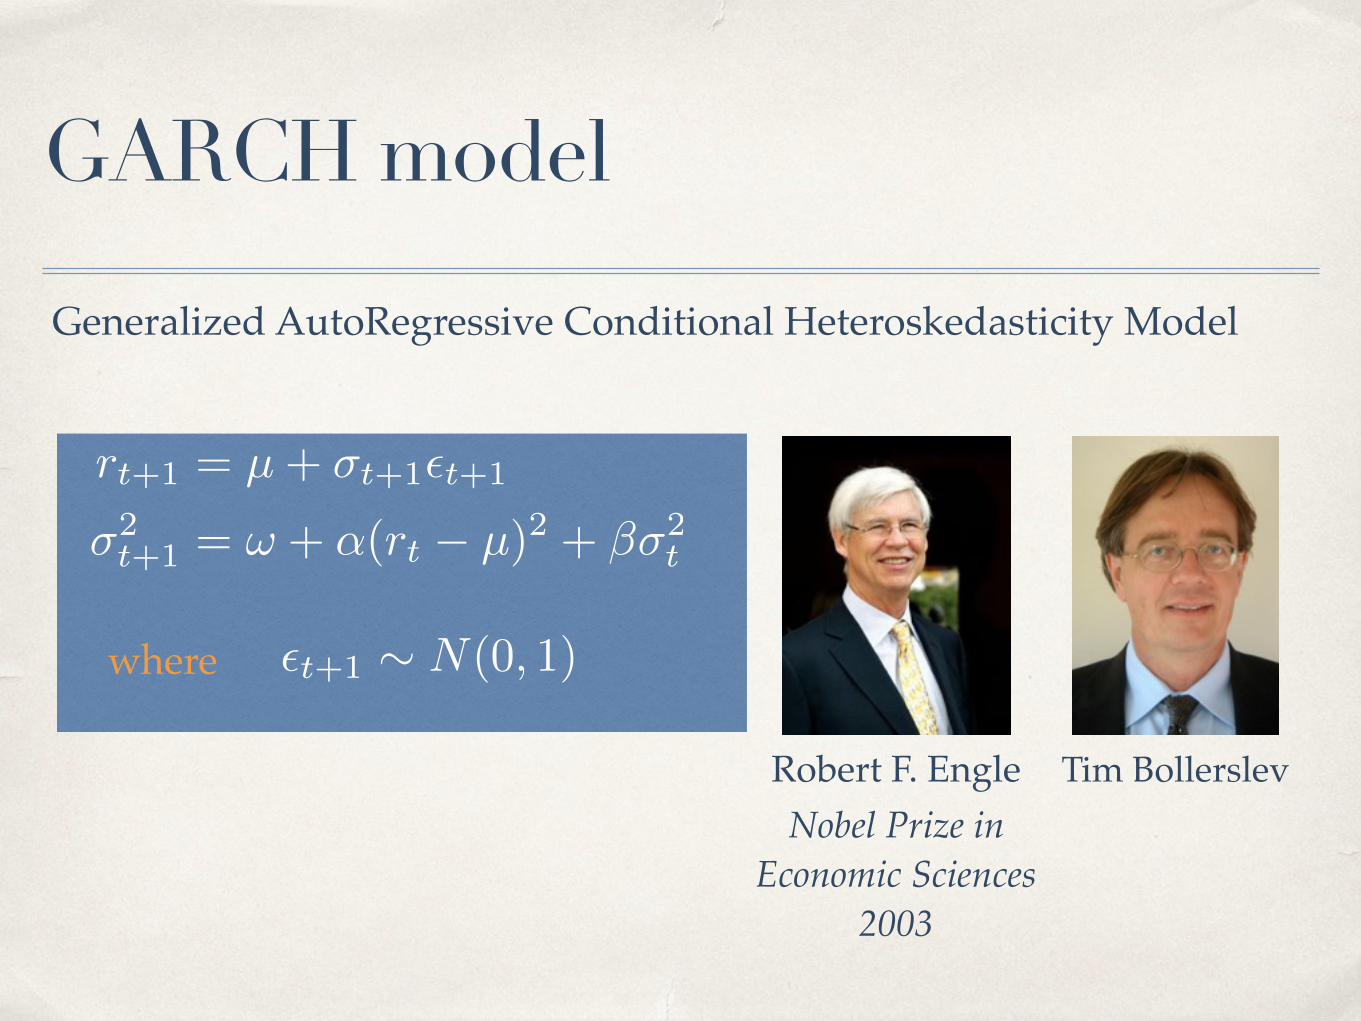
Robert F. Engle Tim BollerslevNobel Prize in
Economic Sciences 2003
GARCH model
Generalized AutoRegressive Conditional Heteroskedasticity Model
rt+1 = µ+ �t+1✏t+1
�2t+1 = ! + ↵(rt � µ)2 + ��2
t
where ✏t+1 ⇠ N(0, 1)
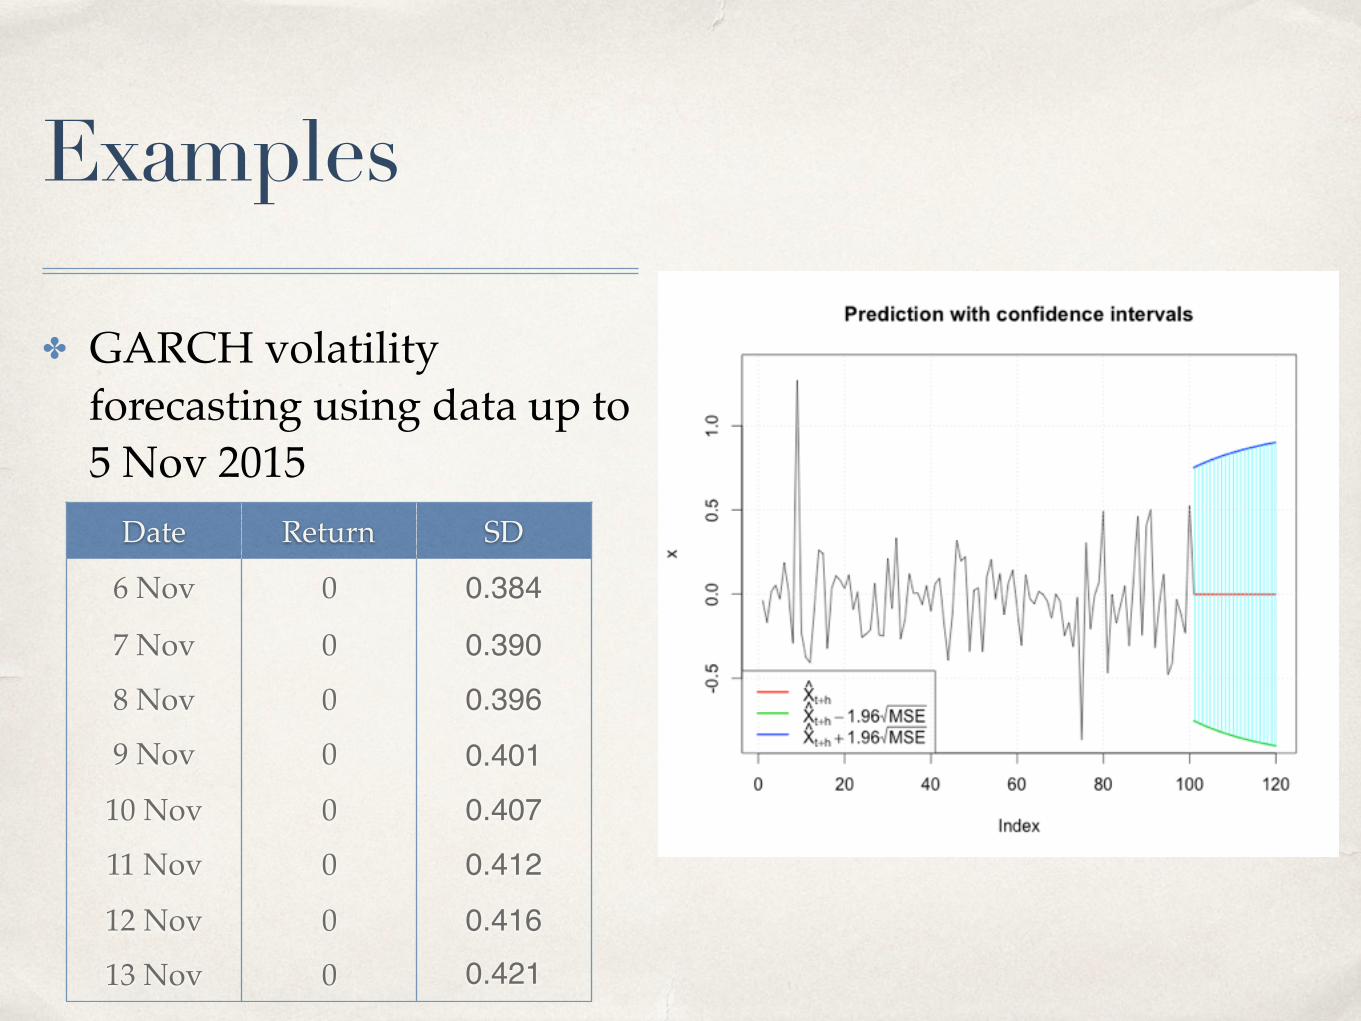
Examples
✤ GARCH volatility forecasting using data up to 5 Nov 2015
Date Return SD
6 Nov 0 0.384
7 Nov 0 0.3908 Nov 0 0.3969 Nov 0 0.401
10 Nov 0 0.40711 Nov 0 0.412
12 Nov 0 0.41613 Nov 0 0.421
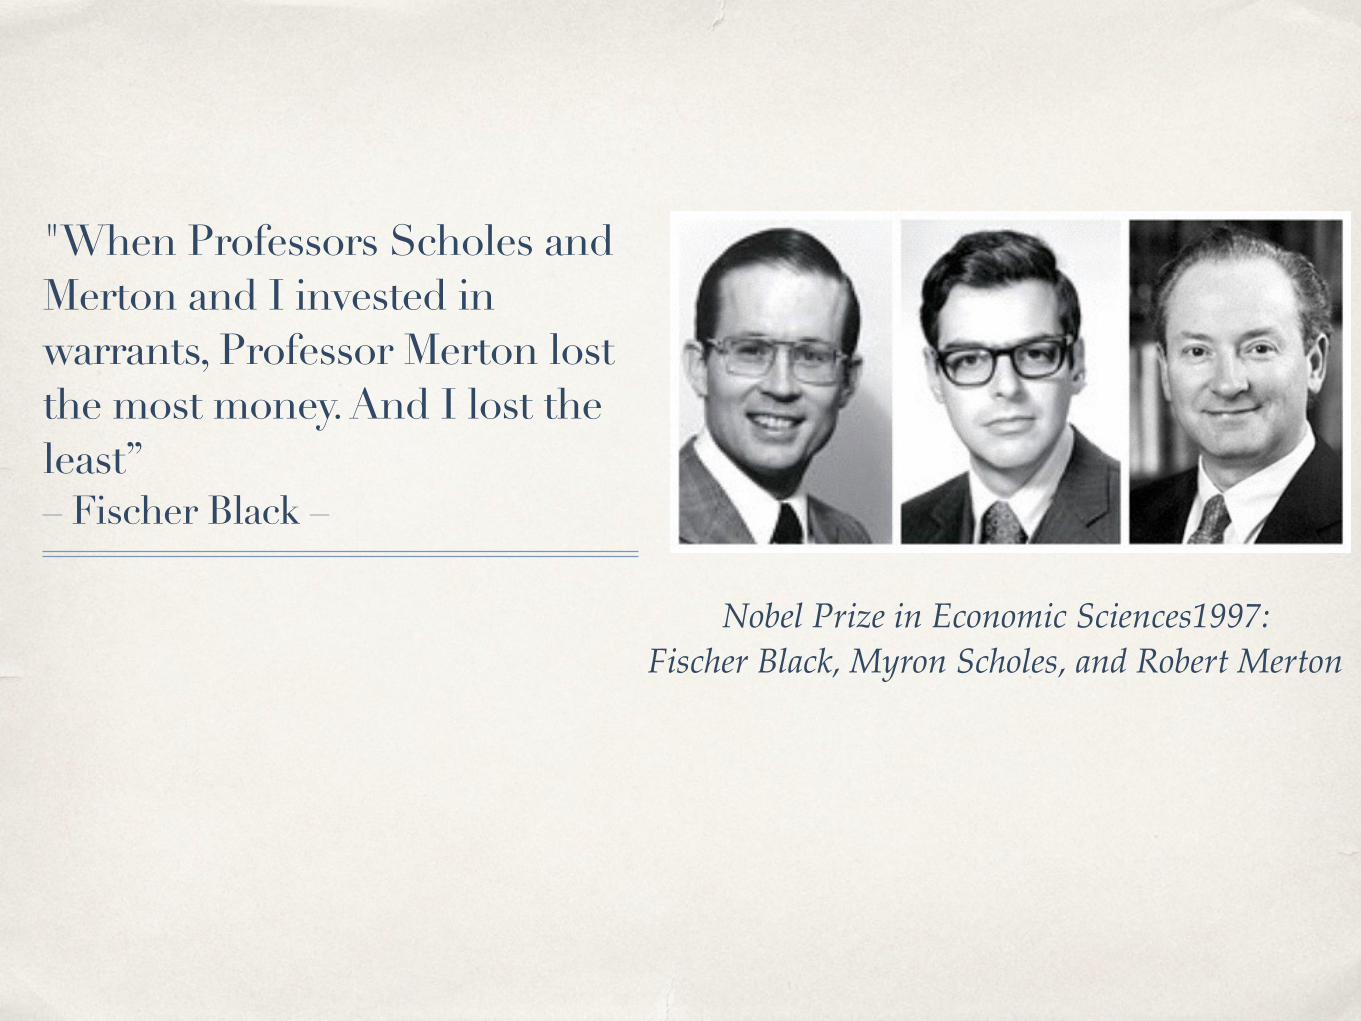
"When Professors Scholes and Merton and I invested in warrants, Professor Merton lost the most money. And I lost the least” – Fischer Black –
Nobel Prize in Economic Sciences1997: Fischer Black, Myron Scholes, and Robert Merton
Challenging, isn’t it?
✤ Financial time series is challenging as it is quite difficult to forecast.
✤ Multivariate time series is also of interest, but it is even more difficult to model multiple time series together.
✤ Most financial models were created some years ago, at the time that less data were available.
✤ Nowadays, we can access more and more data, that would be a good opportunity to explore and create better models for financial market.

“Moltes Gracies”
–Chainarong Kesamoon-
Related Documents