Introduction to Data Analysis

Introduction to Data Analysis. Defining Terms Population- the entire group of people or objects that you want information about Sample- specific part.
Dec 24, 2015
Welcome message from author
This document is posted to help you gain knowledge. Please leave a comment to let me know what you think about it! Share it to your friends and learn new things together.
Transcript
Introduction to Data Analysis
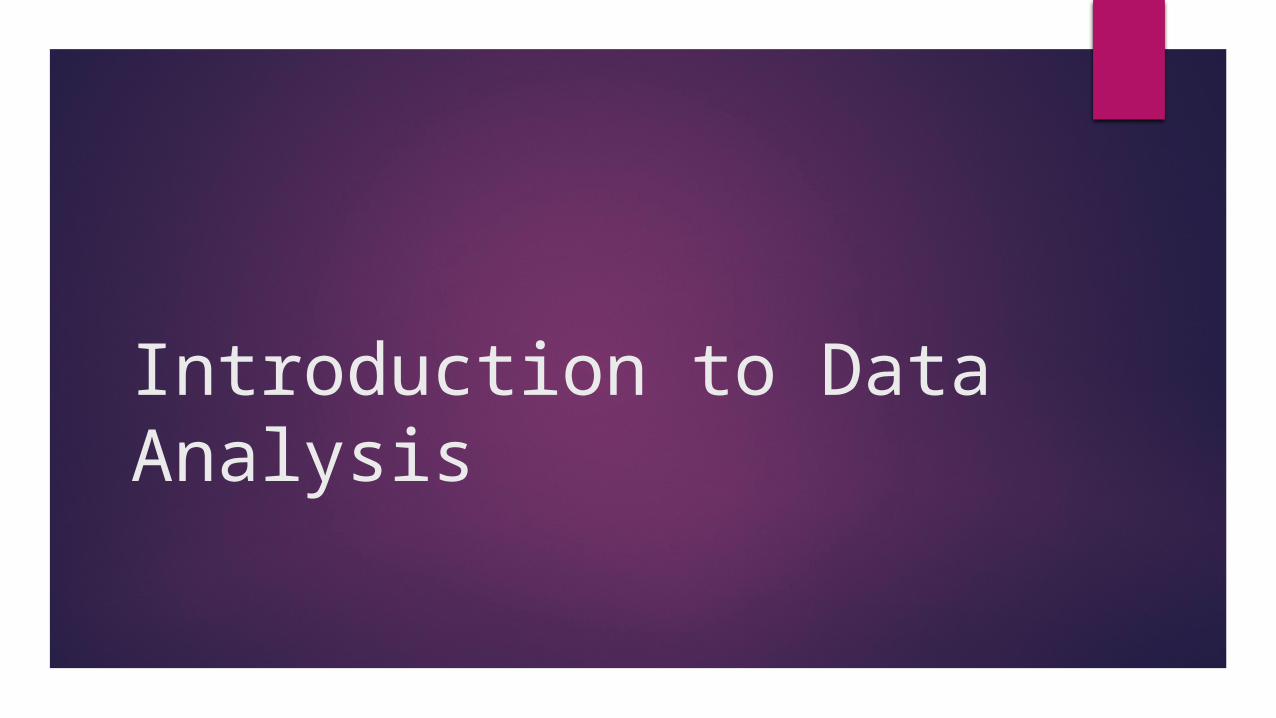
Defining Terms
Population- the entire group of people or objects that you want information about
Sample- specific part of the population that you are testing and gathering data from
A reasonable sample is Random Representative of the population you want to know about Large enough to provide accurate data
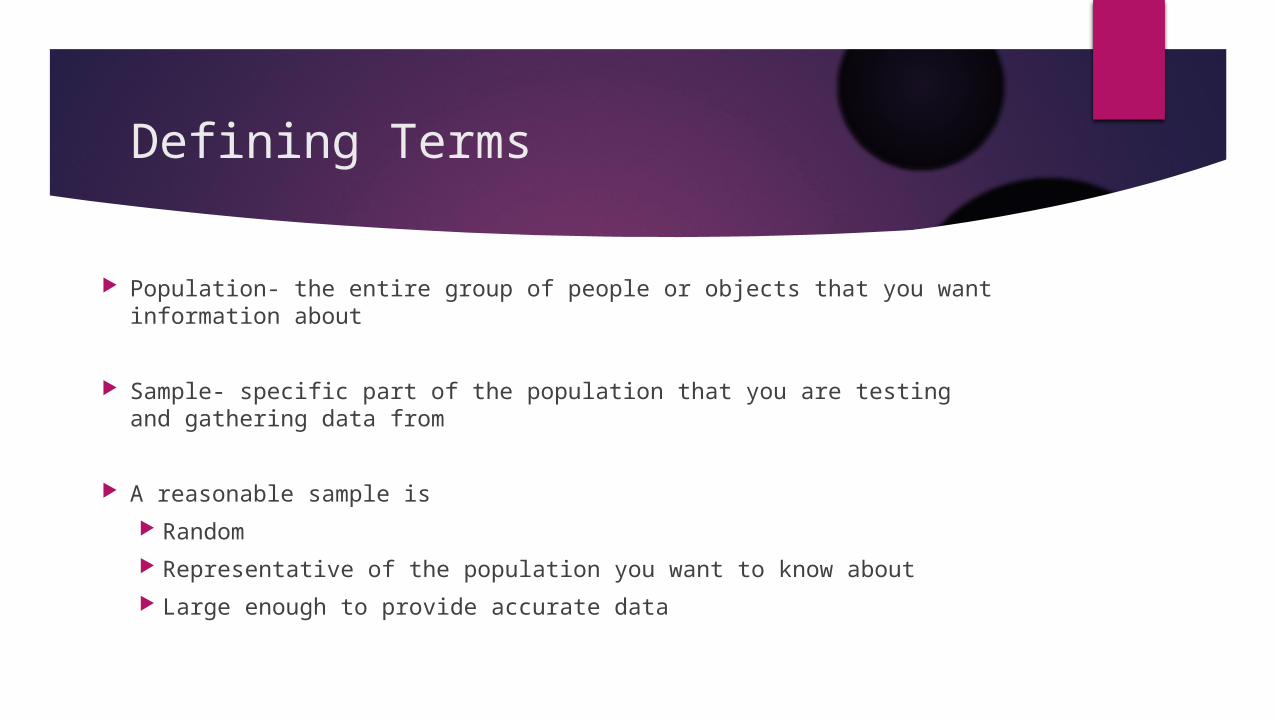
Practice
You are ordering pizza for Noble Academy’s students and you would like to know which toppings students like best. You don’t have time to ask about the opinion of every student, so you decide to take a reasonable sample. How should you collect data?
a. Have all seventh grade students fill out a survey
b. Interview four students from different grades about their preferences
c. Pick three students from each grade level out of a hat and survey them
d. Post a survey on your blog for visitors to vote on their favorite pizza topping
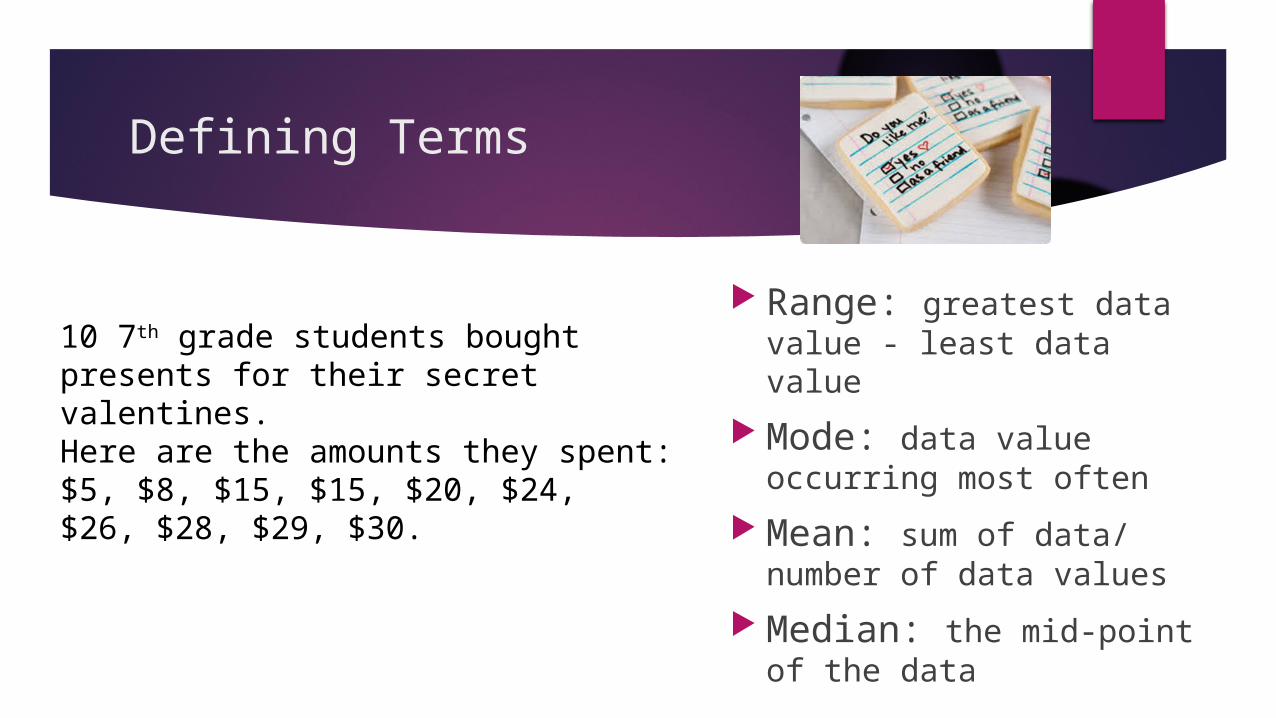
Defining Terms
Range: greatest data value - least data value
Mode: data value occurring most often
Mean: sum of data/ number of data values
Median: the mid-point of the data
10 7th grade students bought presents for their secret valentines. Here are the amounts they spent:$5, $8, $15, $15, $20, $24, $26, $28, $29, $30.

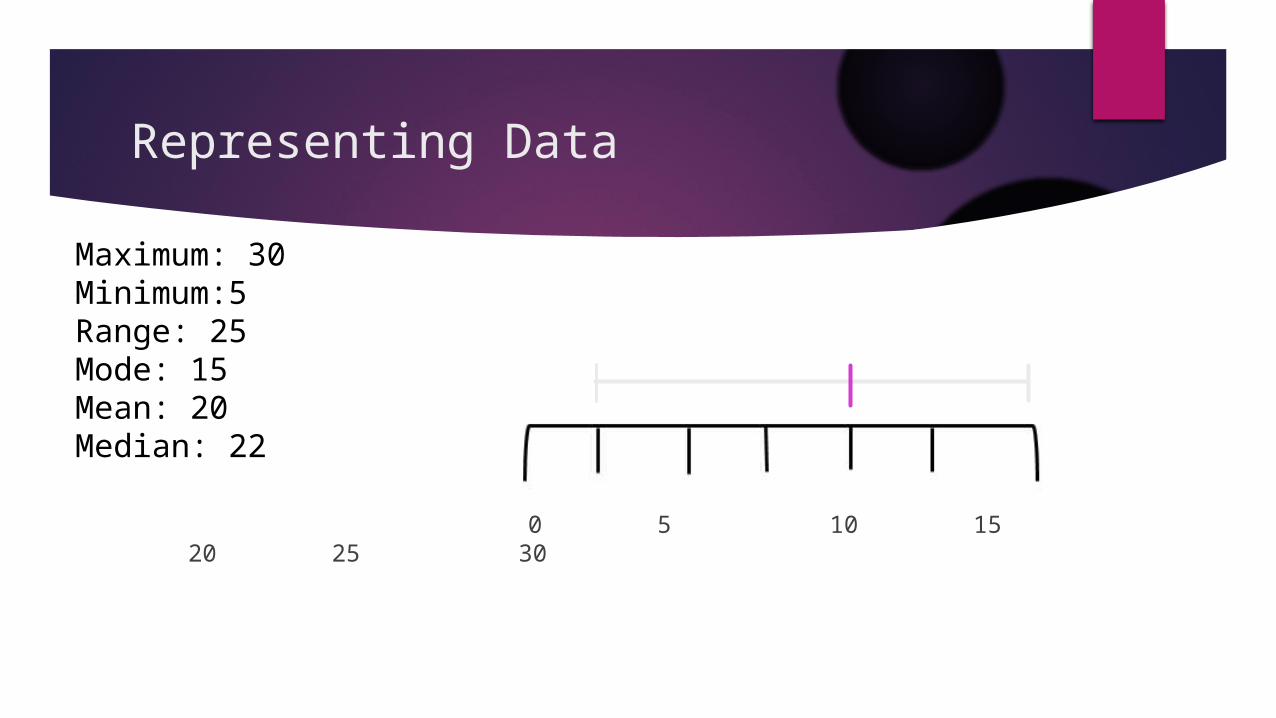
Representing Data$5, $8, $15, $15, $20, $24, $26, $28, $29, $30.
Displaying Data Stem and Leaf 0 1 234
Representing Data
0 5 10 15 20 25 30
Maximum: 30Minimum:5Range: 25Mode: 15Mean: 20Median: 22
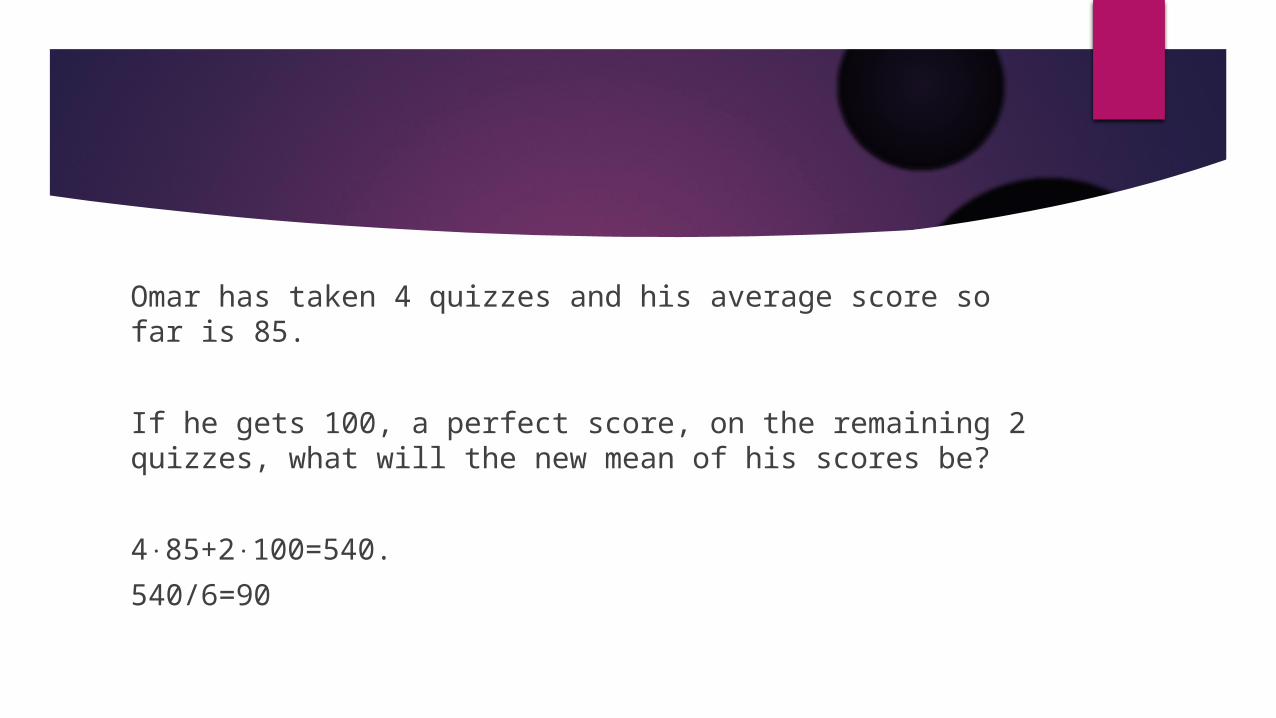
Omar has taken 4 quizzes and his average score so far is 85.
If he gets 100, a perfect score, on the remaining 2 quizzes, what will the new mean of his scores be?
4⋅85+2⋅100=540.
540/6=90

During her first four days of work, Amy earned an average of $36.00 a day.
What does she need to earn on the fifth day for her mean wage to be $40.00?
$56.00
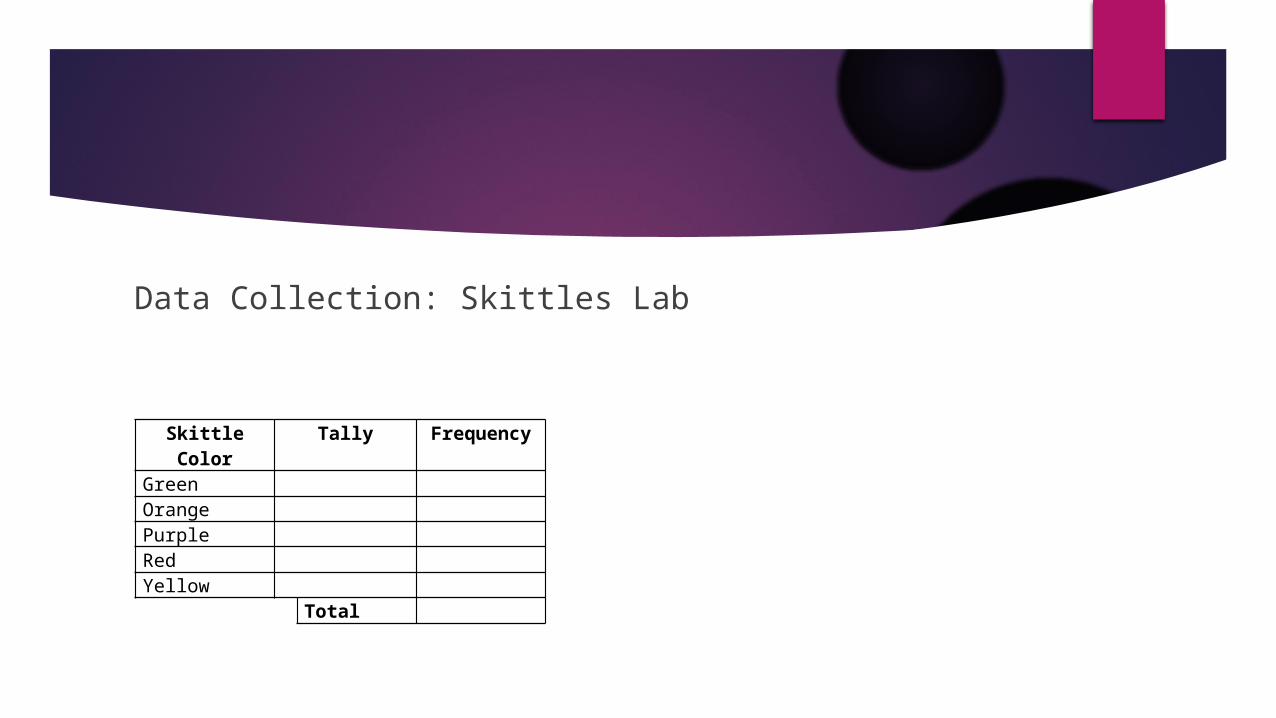
Data Collection: Skittles Lab
Skittle Color Tally FrequencyGreen Orange Purple Red Yellow Total

Box and whisker diagrams
Quartiles further separate data into four equal parts. Each of these parts contains one-fourth of the data.
1st quartile- 25th percentile
2nd quartile- 50th percentile (median)
3rd quartile- 75th percentile
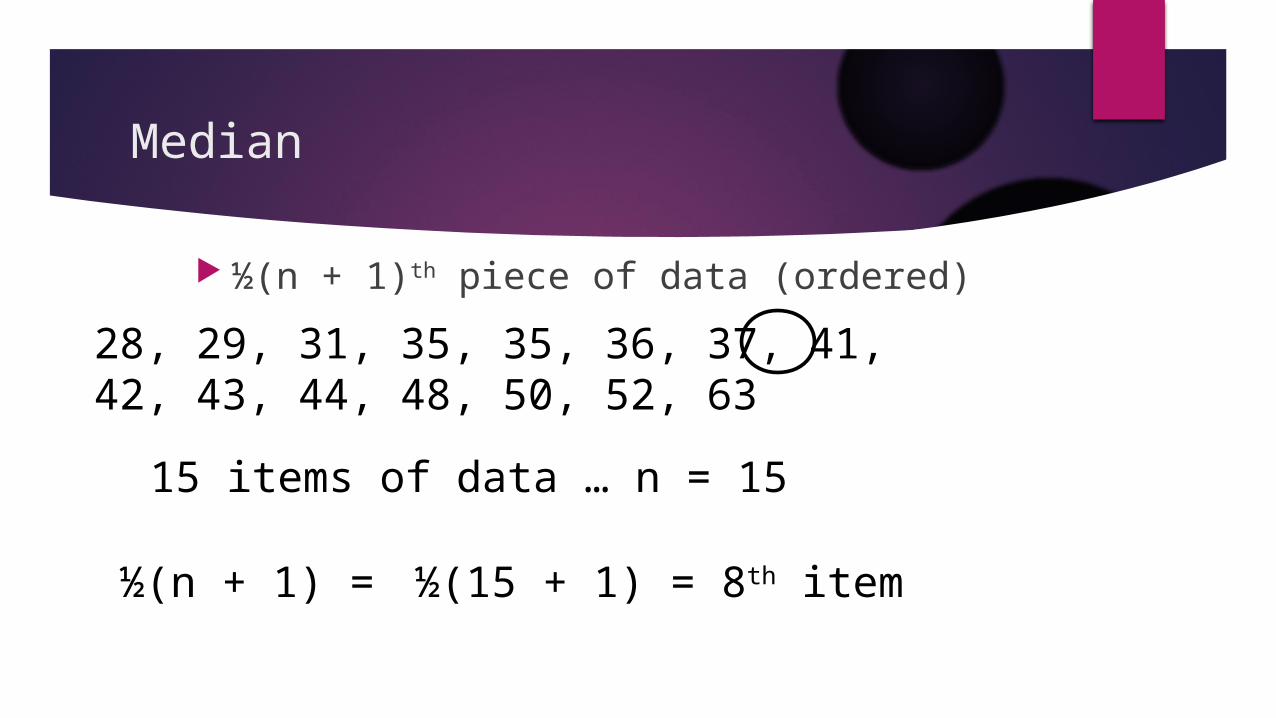
Median
½(n + 1)th piece of data (ordered)
28, 29, 31, 35, 35, 36, 37, 41, 42, 43, 44, 48, 50, 52, 63
15 items of data … n = 15
½(n + 1) = ½(15 + 1) = 8th item

Lower Quartile
¼(n + 1)th piece of data (ordered)
28, 29, 31, 35, 35, 36, 37, 41, 42, 43, 44, 48, 50, 52, 63
15 items of data … n = 15
¼(n + 1) = ¼(15 + 1) = 4th item

Upper Quartile
¾(n + 1)th piece of data (ordered)
28, 29, 31, 35, 35, 36, 37, 41, 42, 43, 44, 48, 50, 52, 63
15 items of data … n = 15
¾(n + 1) = ¾(15 + 1) = 12th item

Add that to our box and whisker plot!
min ($28), lower quartile = 35 max ($63), upper quartile = 48 median ($41) …
MinMedian
MaxLQ UQ
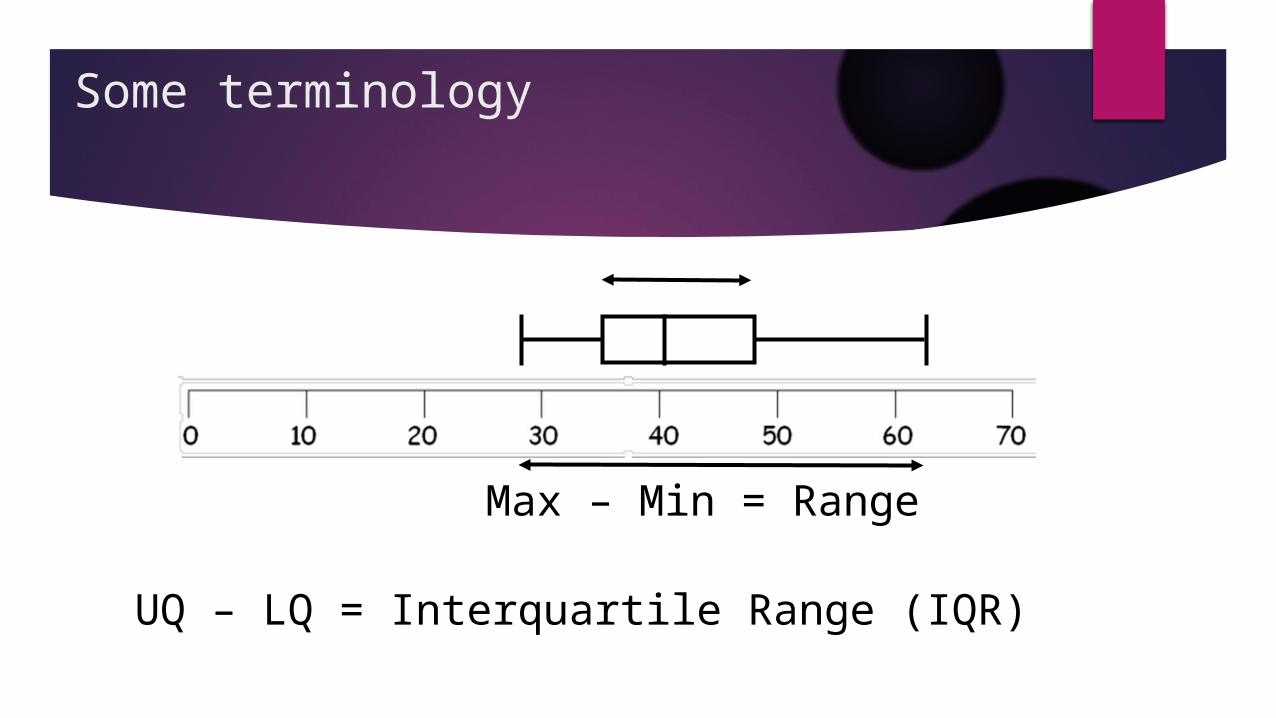
Some terminology
UQ – LQ = Interquartile Range (IQR)
Max – Min = Range
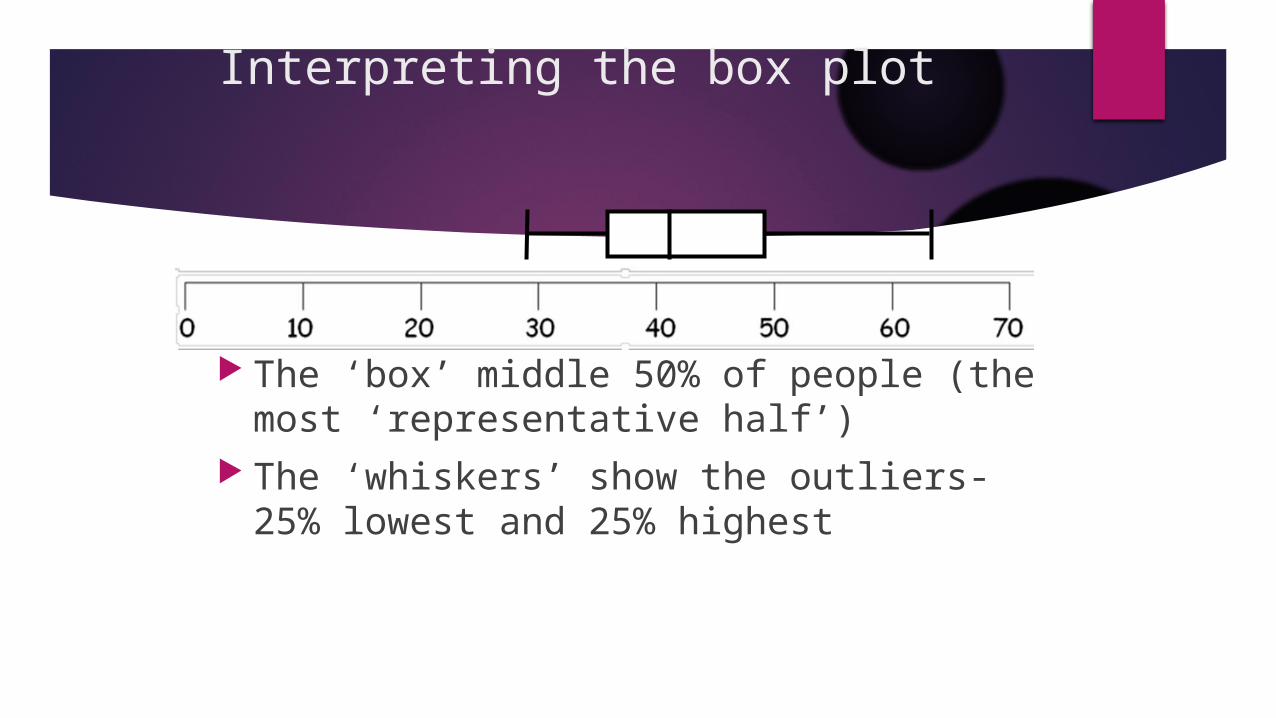
Interpreting the box plot
The ‘box’ middle 50% of people (the most ‘representative half’)
The ‘whiskers’ show the outliers- 25% lowest and 25% highest
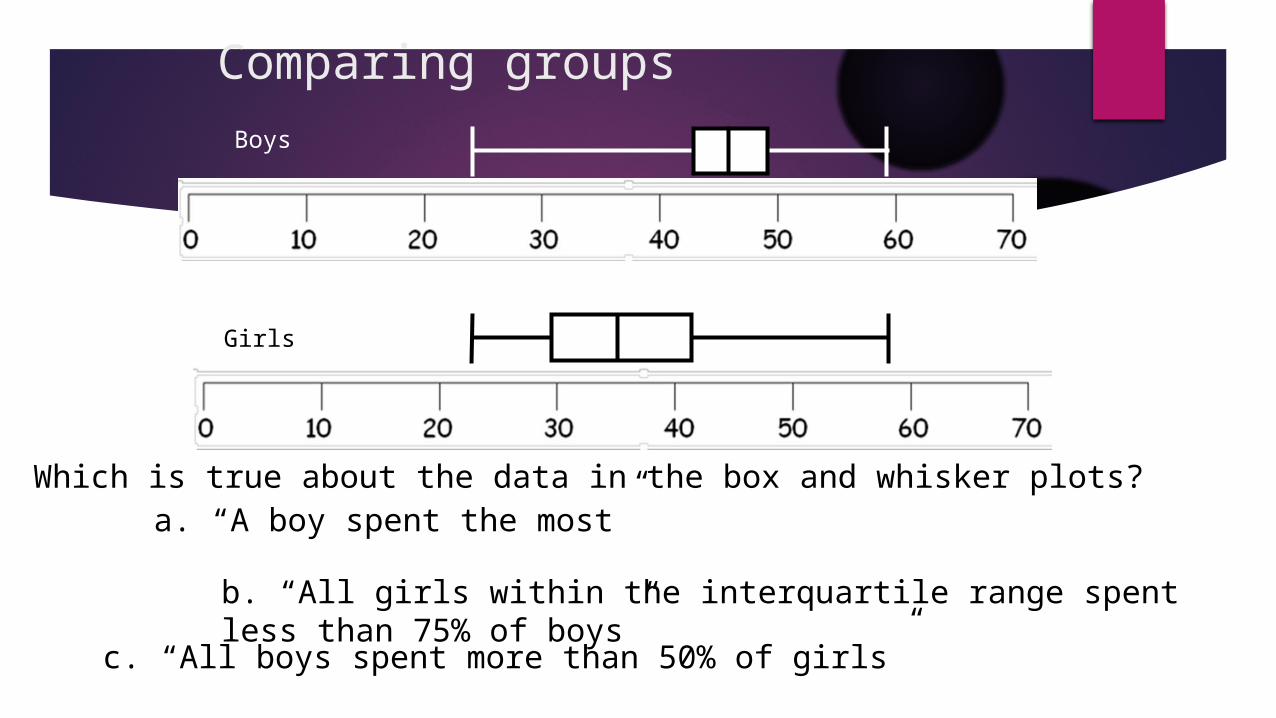
Comparing groupsBoys
Girls
Which is true about the data in the box and whisker plots? a. “A boy spent the most”
b. “All girls within the interquartile range spent less than 75% of boys”
c. “All boys spent more than 50% of girls”

Practice
23 boys and 11 girls were given a math test.
Their scores are listed below:
Boys: 7, 13, 15, 19, 35, 35, 37, 43, 44, 44, 45, 46, 47, 47, 49, 51, 52, 55, 55, 56, 78, 82, 91
Girls: 7, 18, 23, 47, 58, 63, 68, 72, 72, 75, 87
Use box plots to compare the differences between the boys and girls scores and comment on the differences.
Related Documents
![1 UML and Classes, Objects and Relationships [1] Defining Domain Models Using Class Diagrams.](https://static.cupdf.com/doc/110x72/55146470550346414e8b5ac8/1-uml-and-classes-objects-and-relationships-1-defining-domain-models-using-class-diagrams.jpg)