Introduction to Climate Change & Carbon Footprinting James Cadman, Action Sustainability

Welcome message from author
This document is posted to help you gain knowledge. Please leave a comment to let me know what you think about it! Share it to your friends and learn new things together.
Transcript
Introduction to Climate Change & Carbon Footprinting
James Cadman, Action Sustainability

HOUSE RULES
• Be present in the room! Cameras and mics on please.
• Get involved in our poll questions
• ‘Raise your hand’ or use the chatbox for questions
• Please participate in our small group discussions and
activities: Yes, we will be breaking into groups to chat!
• Share your feedback at the end
• Slides will be shared

• Go to www.menti.com in a new browser or tab on your phone or computer.
• When you see it on the slide or hear the trainer read it out, enter the menti code
51 26 63 3
• Don’t disconnect from the Teams meeting; you will still need to hear the trainer and colleagues
What words come to mind when you think of climate change and carbon?

INTRODUCTIONS
Let’s check your name badge✓ Your name and role
✓ How much do you know about climate change from 0 - 10?

Workshop Overview
✓ Overview of climate change
✓ How to do carbon footprinting
✓ The importance of data
✓ Guidance on useful resources
✓ Look at a carbon reduction action planning
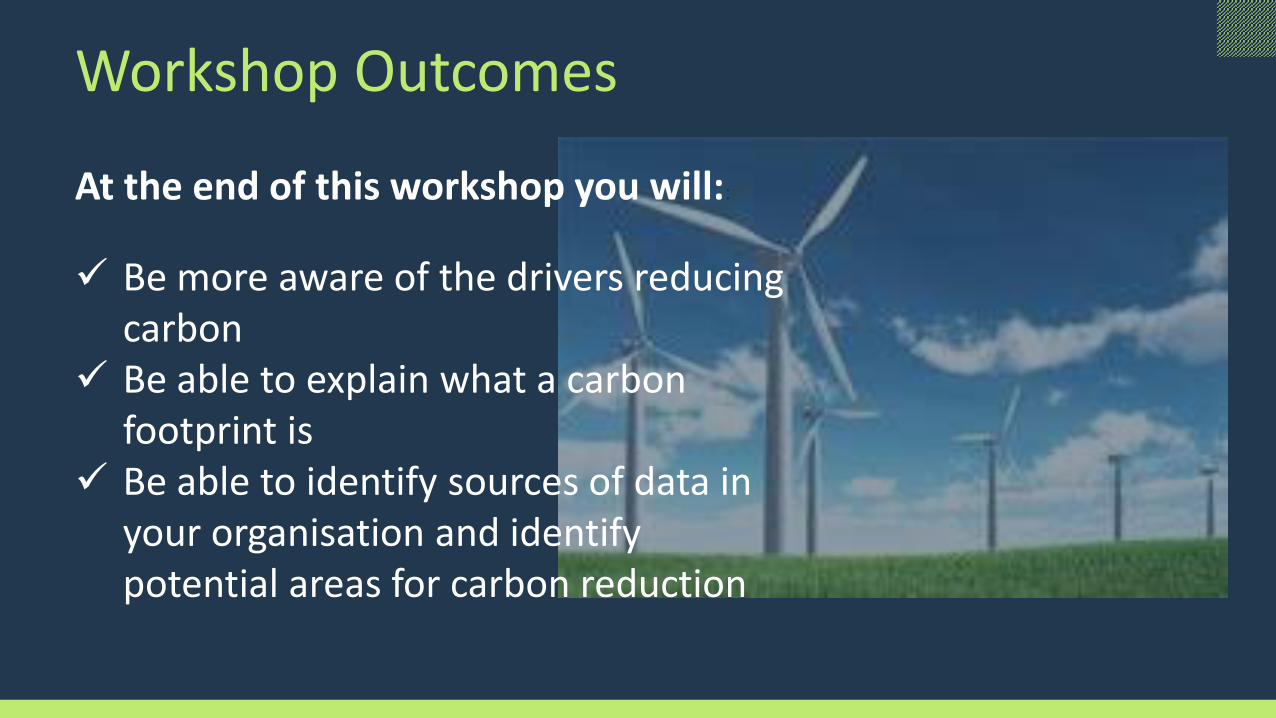
Workshop Outcomes
At the end of this workshop you will::
✓ Be more aware of the drivers reducing carbon
✓ Be able to explain what a carbon footprint is
✓ Be able to identify sources of data in your organisation and identify potential areas for carbon reduction
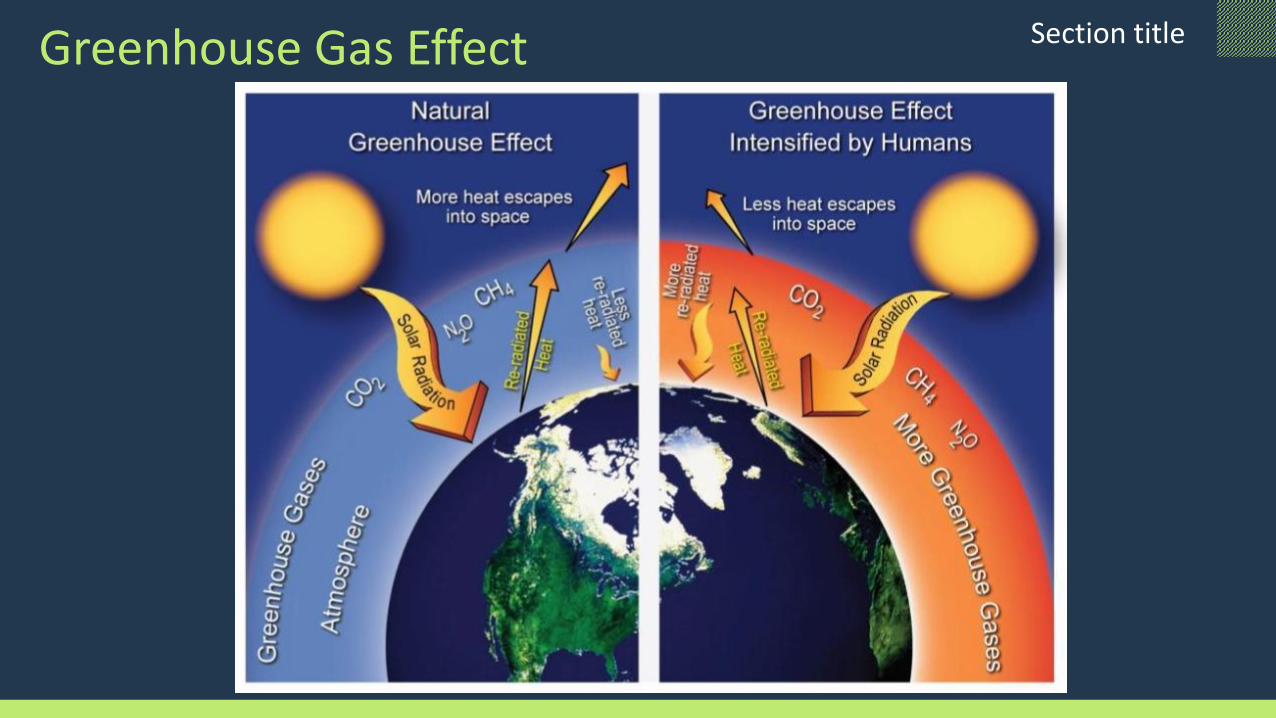
Section titleGreenhouse Gas Effect

The carbon cycle
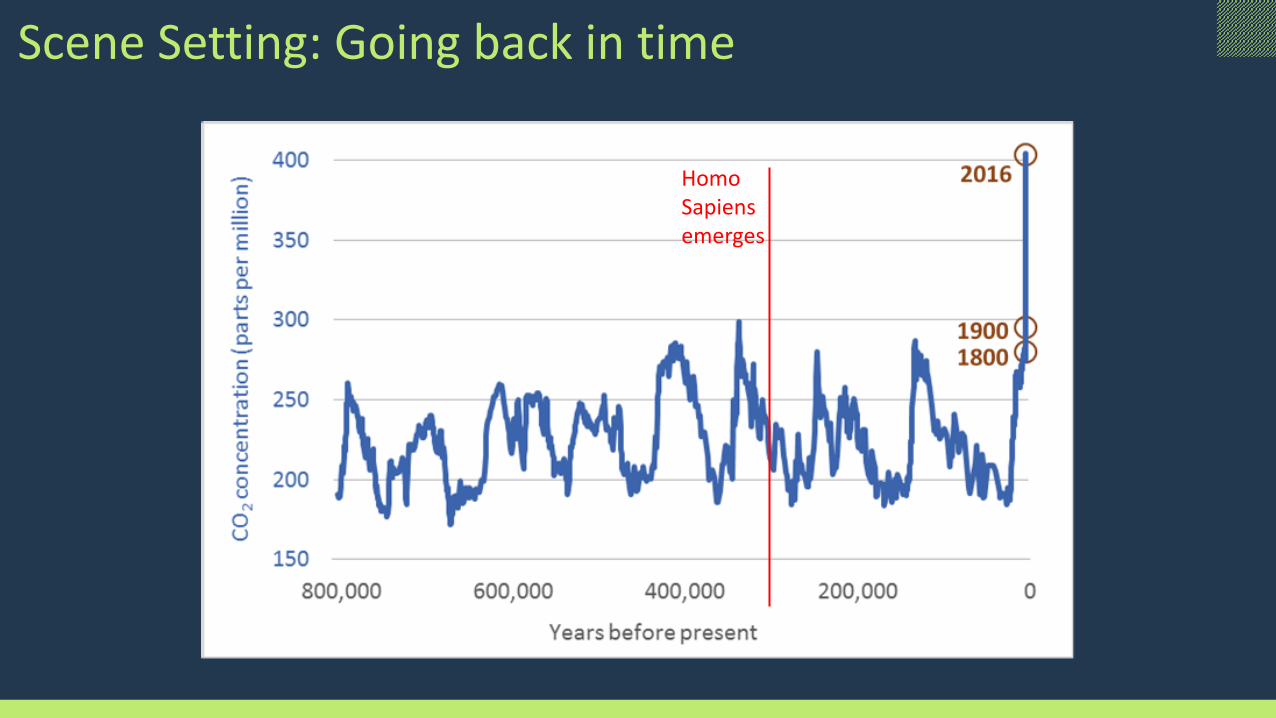
Scene Setting: Going back in time
Homo Sapiens emerges
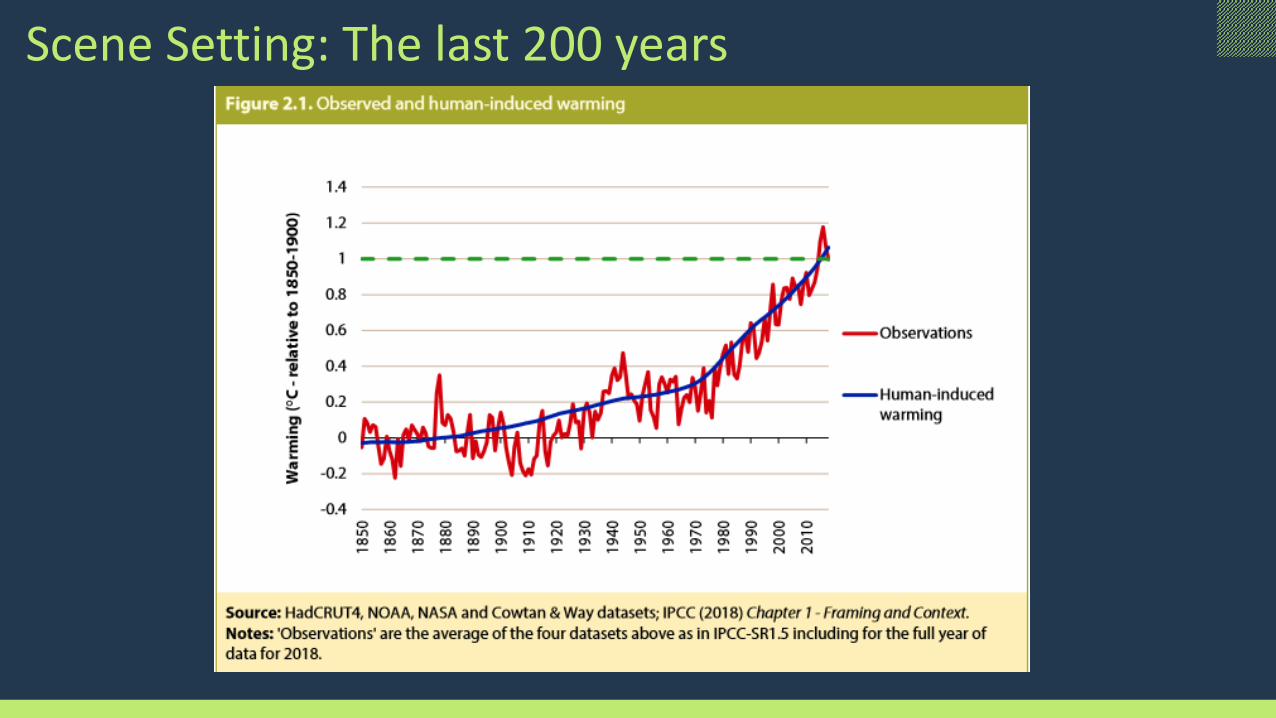
Scene Setting: The last 200 years

Setting the scene: the last few years
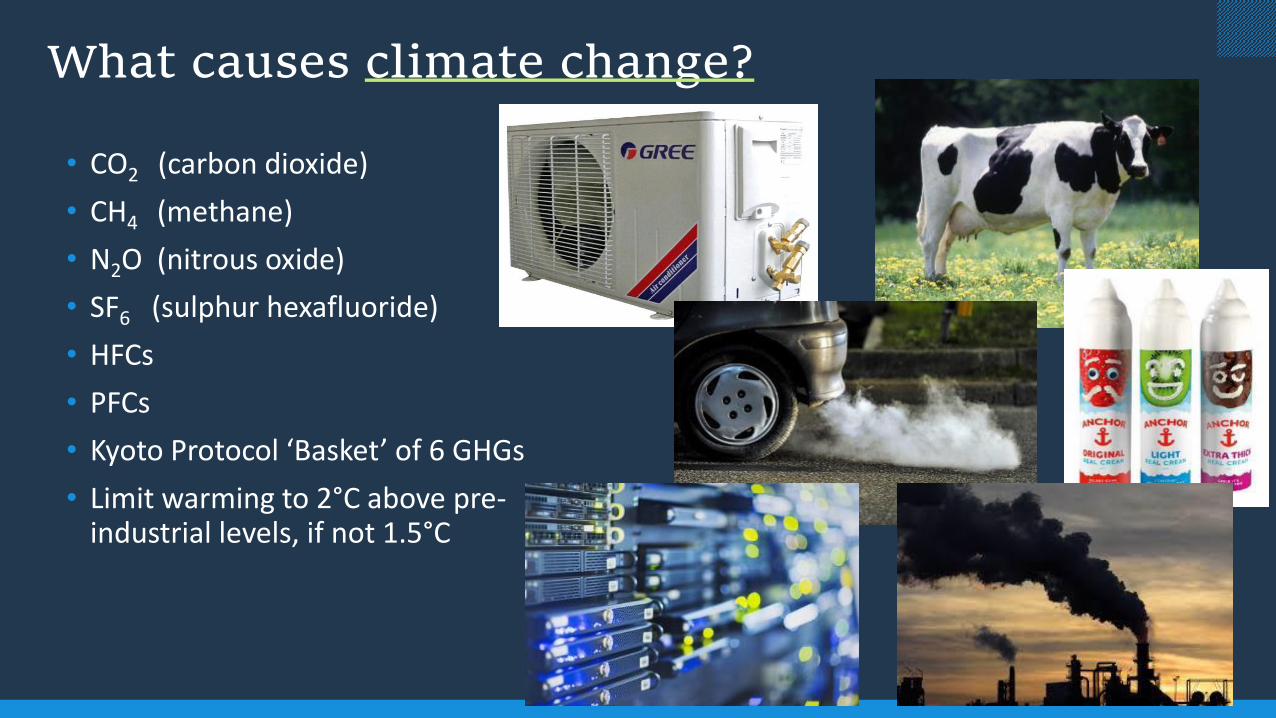
What causes climate change?
• CO2 (carbon dioxide)
• CH4 (methane)
• N2O (nitrous oxide)
• SF6 (sulphur hexafluoride)
• HFCs
• PFCs
• Kyoto Protocol ‘Basket’ of 6 GHGs
• Limit warming to 2°C above pre-industrial levels, if not 1.5°C
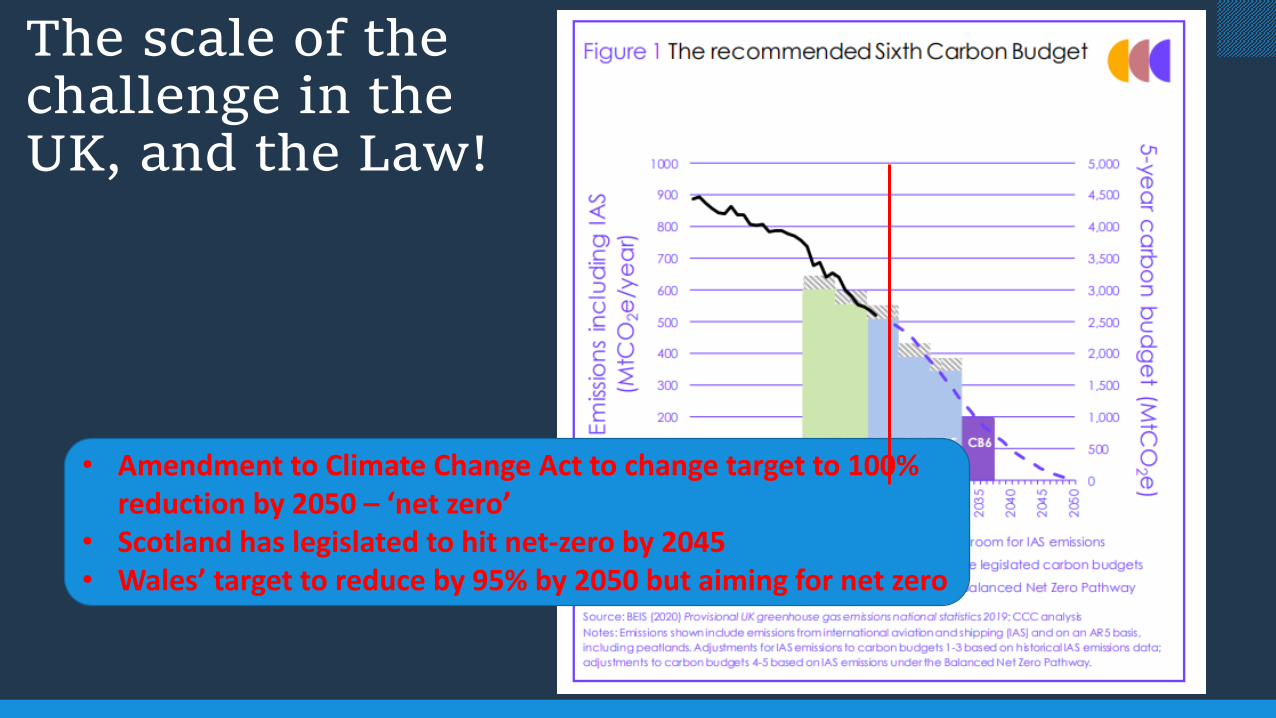
The scale of the challenge in the UK, and the Law!
• Amendment to Climate Change Act to change target to 100% reduction by 2050 – ‘net zero’
• Scotland has legislated to hit net-zero by 2045• Wales’ target to reduce by 95% by 2050 but aiming for net zero

Progress decarbonising the UK’s Grid
• Significant progress to reduce carbon intensity of the UK’s grid electric
• Reduced by 67% since 1990. Why? • Two big reasons• ‘Dash for gas’ in 1990’s (less coal)• Five-fold increase in renewable
energy production since 2010: on-& offshore wind, solar PV, and biomass
• 2020: Sunny weather + lower demand (covid-19) = no coal for over a month in our grid electric.
• Result? Renewables were 28% of production in that time with an average grid EF = 0.143kg CO2e/ kWh.
Dash for Gas
Investment in Renewable Energy

Paris Climate Change Agreement
• Significant progress on Kyoto
• Global engagement…
IPCC SR 1.5: Global Warming of 1.5°C Oct. 2018
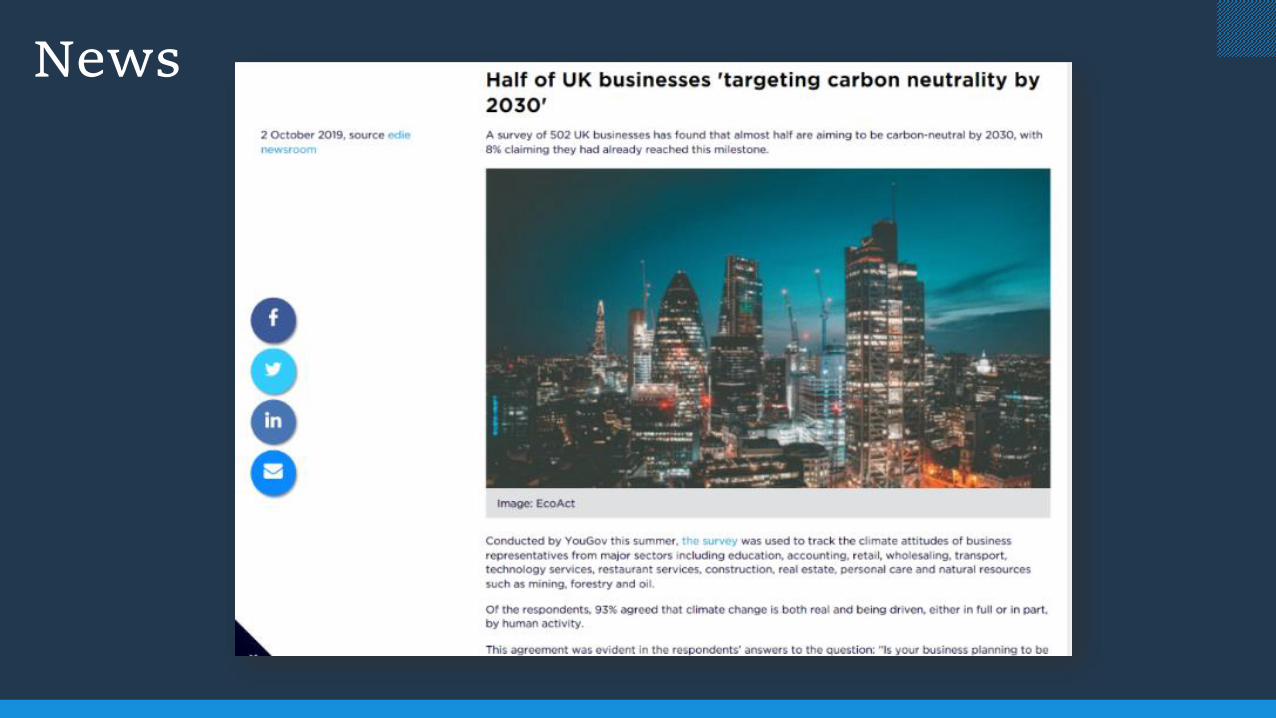
News
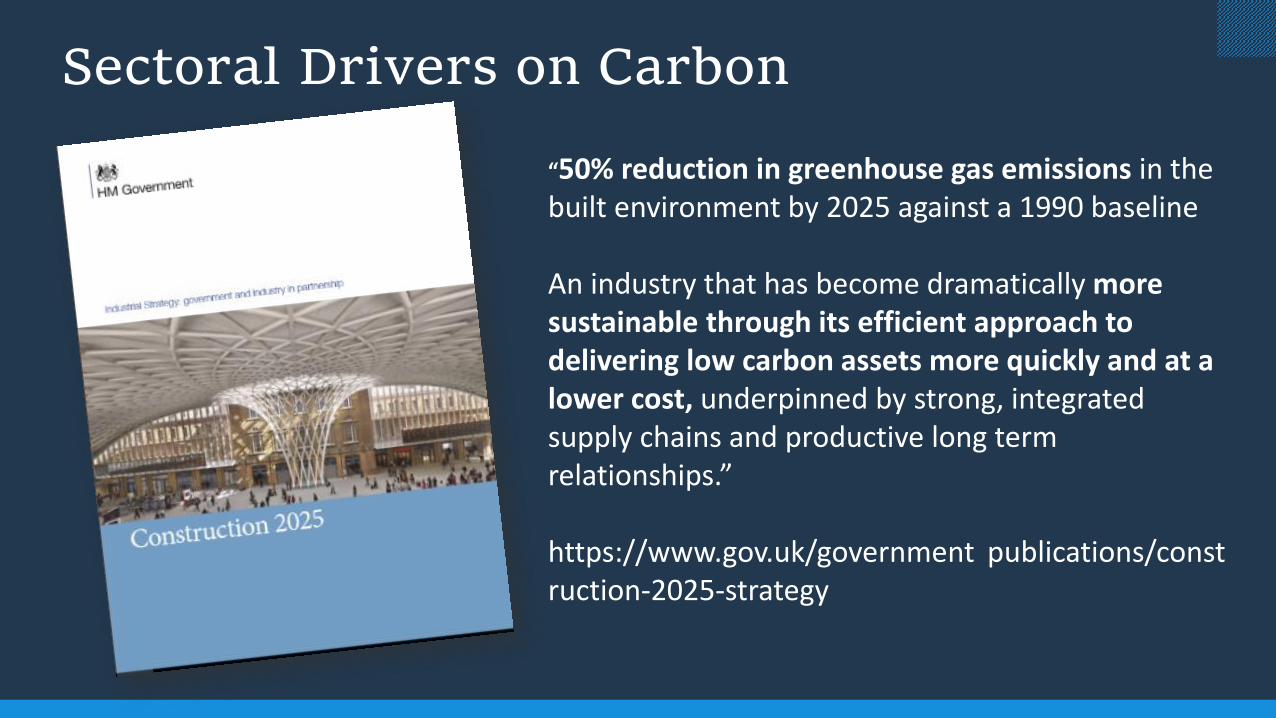
Sectoral Drivers on Carbon
“50% reduction in greenhouse gas emissions in the built environment by 2025 against a 1990 baseline
An industry that has become dramatically more sustainable through its efficient approach to delivering low carbon assets more quickly and at a lower cost, underpinned by strong, integrated supply chains and productive long term relationships.”
https://www.gov.uk/government/publications/construction-2025-strategy
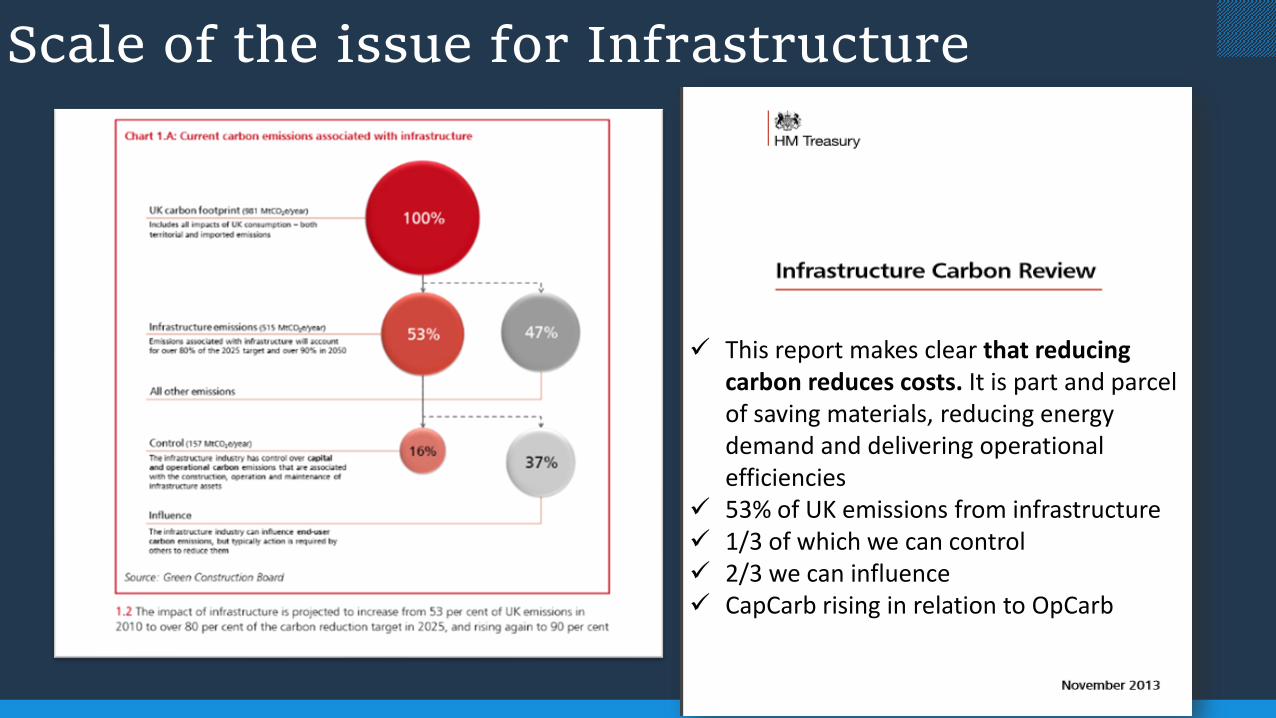
Scale of the issue for Infrastructure
✓ This report makes clear that reducing carbon reduces costs. It is part and parcel of saving materials, reducing energy demand and delivering operational efficiencies
✓ 53% of UK emissions from infrastructure✓ 1/3 of which we can control✓ 2/3 we can influence✓ CapCarb rising in relation to OpCarb
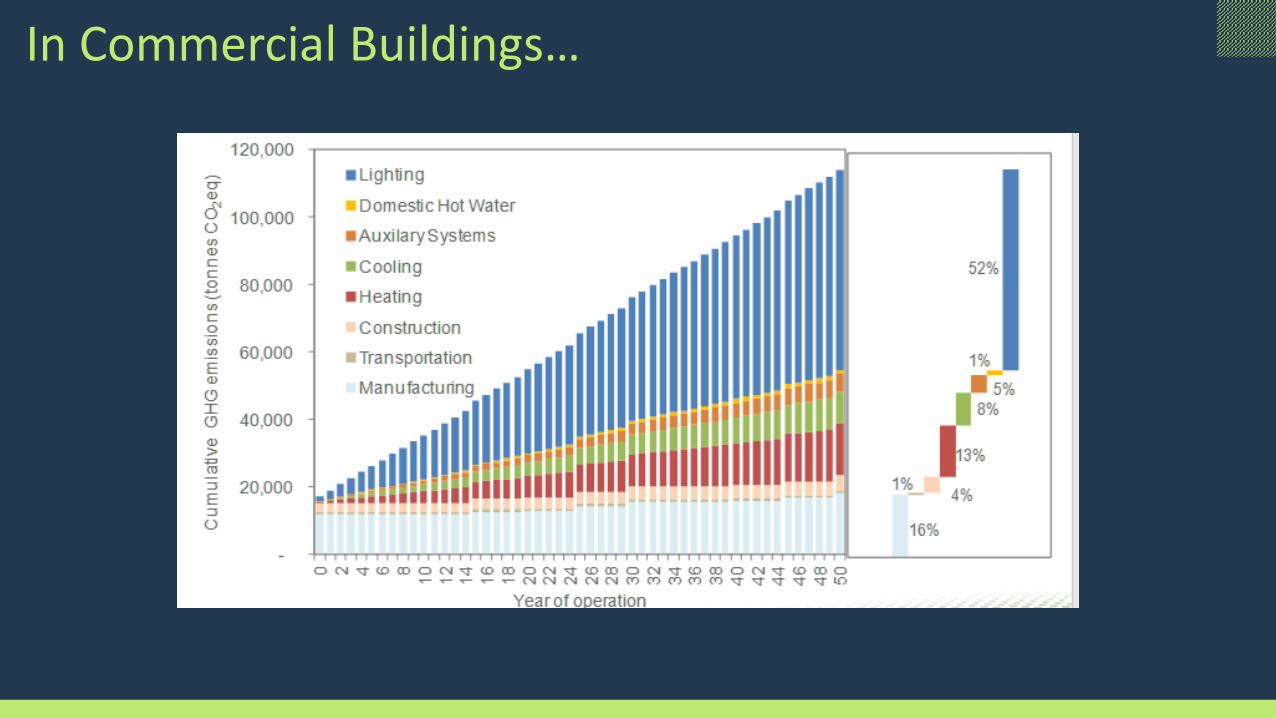
In Commercial Buildings…
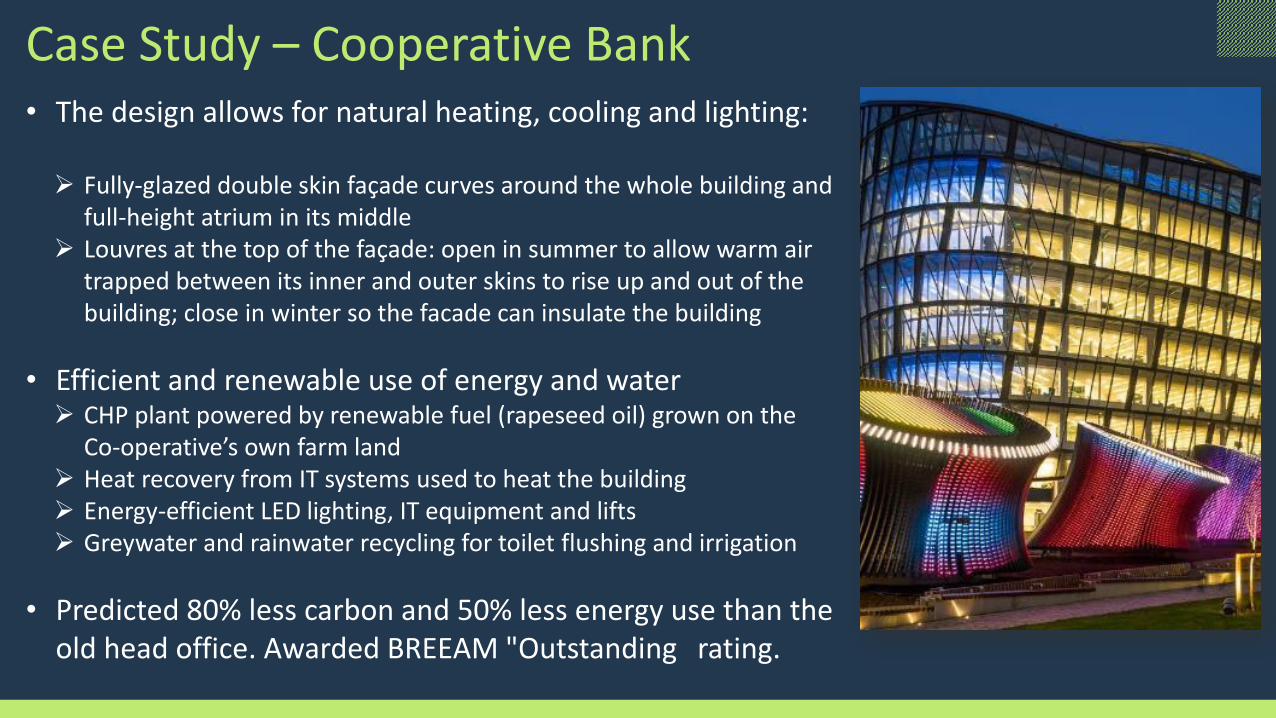
Case Study – Cooperative Bank • The design allows for natural heating, cooling and lighting:
➢ Fully-glazed double skin façade curves around the whole building and full‐height atrium in its middle
➢ Louvres at the top of the façade: open in summer to allow warm air trapped between its inner and outer skins to rise up and out of the building; close in winter so the facade can insulate the building
• Efficient and renewable use of energy and water➢ CHP plant powered by renewable fuel (rapeseed oil) grown on the
Co‐operative’s own farm land➢ Heat recovery from IT systems used to heat the building➢ Energy-efficient LED lighting, IT equipment and lifts➢ Greywater and rainwater recycling for toilet flushing and irrigation
• Predicted 80% less carbon and 50% less energy use than the old head office. Awarded BREEAM "Outstanding" rating.

But, still, why should we…?
• Reporting for compliance• Reduced risk of energy security• Stay ahead of regulation• Identify hotspots to make carbon
reductions and cost savings• Improve reputation• Meet stakeholder/client demands• Win new work• Become a market leader• Which all means data accuracy…

What can we do about it?

Carbon Reduction Actions
More efficient energy use in equipment and transport
➢ Invest in energy-efficient equipment, e.g. lighting, welfare cabins, plant & equipment, HVAC, IT
➢ Upgrade your fleet to Euro 6 and plant to NRMM Stage V. Go further to electric / hybrid. Knock on air quality benefits
➢ Consider infrastructure needs: provision of charging points for EV and land for ground-source heat pumps or solar PV
➢ Think about alternative transport modes, e.g. river barges
➢ Green travel plans: public transport, more tele- / video-conferencing than travel for face-to-face meetings: Covid-19
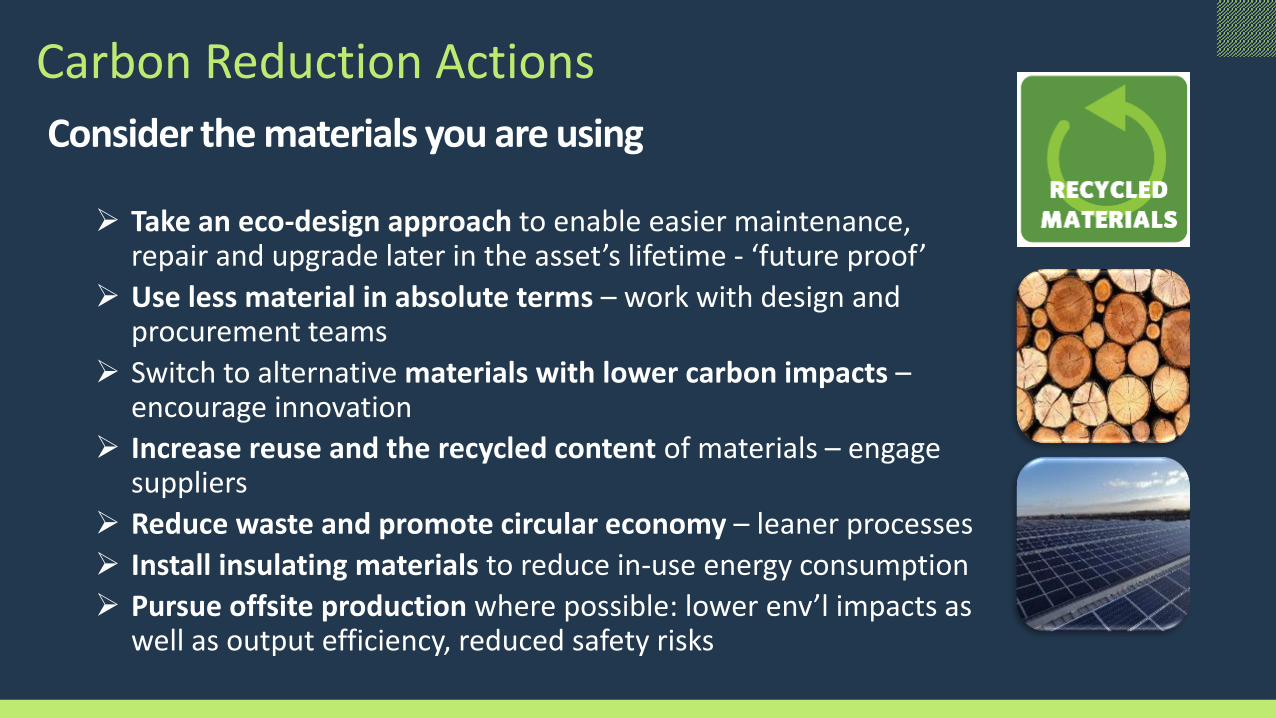
Consider the materials you are using
➢ Take an eco-design approach to enable easier maintenance, repair and upgrade later in the asset’s lifetime - ‘future proof’
➢ Use less material in absolute terms – work with design and procurement teams
➢ Switch to alternative materials with lower carbon impacts –encourage innovation
➢ Increase reuse and the recycled content of materials – engage suppliers
➢ Reduce waste and promote circular economy – leaner processes
➢ Install insulating materials to reduce in-use energy consumption
➢ Pursue offsite production where possible: lower env’l impacts as well as output efficiency, reduced safety risks
Carbon Reduction Actions

Improve behaviours➢ Energy Management Systems and automatic switches & sensors ➢ Train colleagues and suppliers in how to use equipment efficiently:
➢ Choose the right equipment for the job – don’t overspec➢ Turn off equipment that’s not being used➢ Avoid machine idling➢ Use correct power modes including in low / eco power modes
Energy and power sources➢ Increase onsite renewable energy provision in offices and sites, e.g. solar
PV, micro CHP➢ Battery operated instead of diesel or petrol➢ Alternatives to diesel: GTL, HVO
Different, lower-carbon business models➢ Service / rental rather than ownership➢ Remote rather than face-to-face
Carbon Reduction Actions
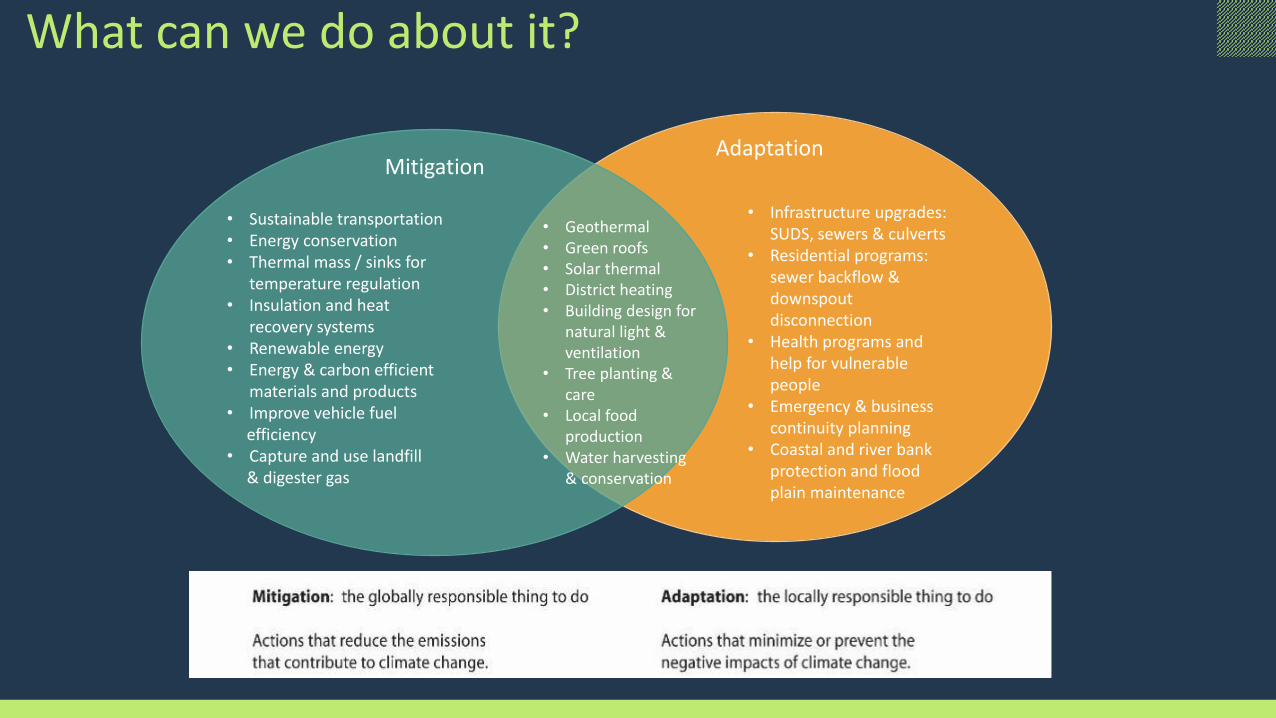
What can we do about it?
AdaptationMitigation
• Infrastructure upgrades: SUDS, sewers & culverts
• Residential programs: sewer backflow & downspout disconnection
• Health programs and help for vulnerable people
• Emergency & business continuity planning
• Coastal and river bank protection and flood plain maintenance
• Geothermal• Green roofs• Solar thermal• District heating• Building design for
natural light & ventilation
• Tree planting & care
• Local food production
• Water harvesting & conservation
• Sustainable transportation• Energy conservation • Thermal mass / sinks for
temperature regulation• Insulation and heat
recovery systems • Renewable energy • Energy & carbon efficient
materials and products• Improve vehicle fuel
efficiency • Capture and use landfill
& digester gas

Use the Carbon & Energy Hierarchy
AVOID: don’t
use energy if
you can avoid
the need
REDUCE: use less by smart design,
more efficient equipment, less
materials, and better behaviours
SWITCH to low carbon and renewable sources of energy and materials
OFFSET the residual remaining emissions when all other actions have been taken

• Go to www.menti.com in a new browser or tab on your phone or computer.
• When you see it on the slide or hear the trainer read it out, enter the menti code
51 26 63 3
• Don’t disconnect from the Teams meeting; you will still need to hear the trainer and colleagues
Where will you take action to reduce your carbon emissions?

How do you compare?...

Activity: Better or Worse Bingo!
Which is better for carbon: train or plane? (for the same distance)

• Go to www.menti.com in a new browser or tab on your phone or computer.
• When you see it on the slide or hear the trainer read it out, enter the menti code
51 26 63 3
• Don’t disconnect from the Teams meeting; you will still need to hear the trainer and colleagues
In % how much better for carbon is travelling by train vs plane (for the same distance)?
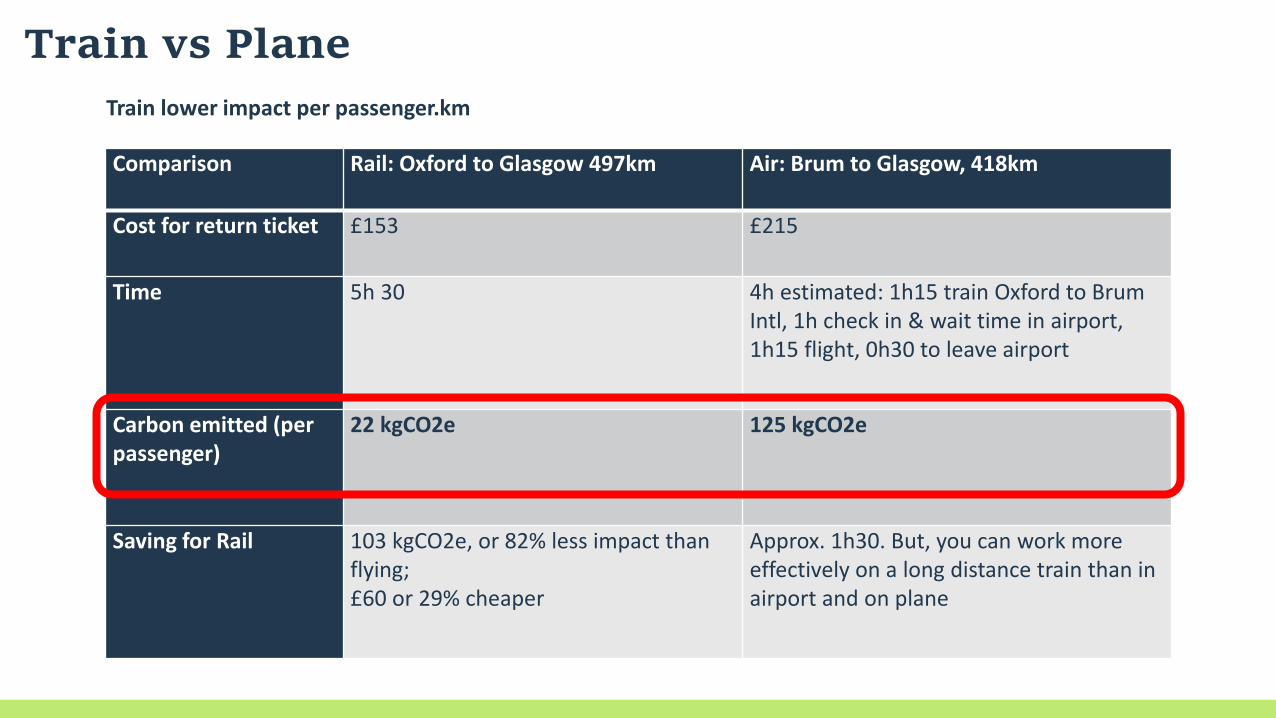
Train vs Plane
Comparison Rail: Oxford to Glasgow 497km Air: Brum to Glasgow, 418km
Cost for return ticket £153 £215
Time 5h 30 4h estimated: 1h15 train Oxford to Brum Intl, 1h check in & wait time in airport, 1h15 flight, 0h30 to leave airport
Carbon emitted (per passenger)
22 kgCO2e 125 kgCO2e
Saving for Rail 103 kgCO2e, or 82% less impact than flying;£60 or 29% cheaper
Approx. 1h30. But, you can work more effectively on a long distance train than in airport and on plane
Train lower impact per passenger.km
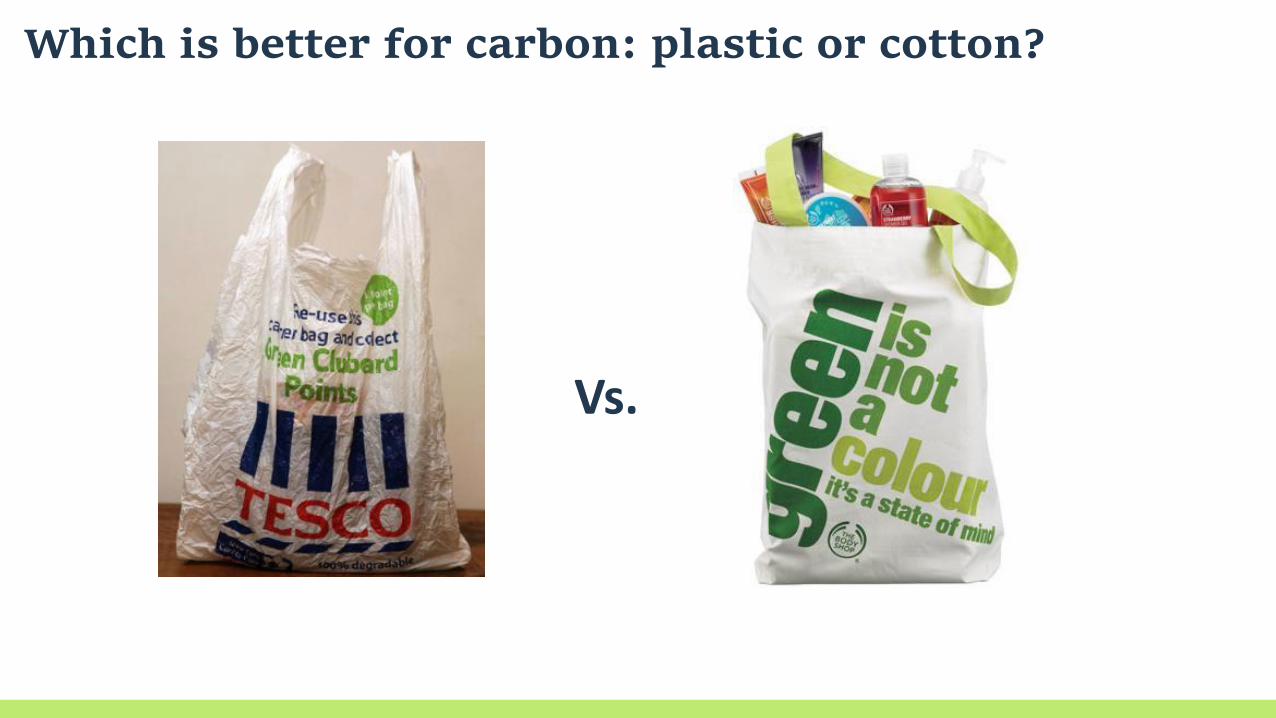
Which is better for carbon: plastic or cotton?
Vs.

• Go to www.menti.com in a new browser or tab on your phone or computer.
• When you see it on the slide or hear the trainer read it out, enter the menti code
51 26 63 3
• Don’t disconnect from the Teams meeting; you will still need to hear the trainer and colleagues
How often do you need to use the cotton bag for a lower footprint than a plastic bag?

Plastic vs Paper vs Cotton
Type of bag HDPE bag (No secondary reuse)
HDPE bag (40.3% reused as bin liners)
HDPE bag (100% reused as bin liners
HDPE bag (Used 3 times)
Paper 3 4 7 9
LDPE ‘bag for life’
4 5 9 12
Non-woven PP
11 14 26 33
Cotton 131 173 327 393
How do you know where to act?

What is Carbon Footprinting?
“Commonly used to describe the total amount of CO2 and other greenhouse gas (GHG) emissions attributable to an organisation, project or product.”

Your Business
• Fuel and energy in company facilities
• Vehicles and plant. • Chemical / biological
processes, and • Fugitive emissions
Your Suppliers
• Materials, goods and services,
• Capital goods, • Delivery• Utilities: electricity,
waste and water• Business travel
Sources of Carbon Emissions from your Organisation
Your Client
• In-use emissions from running the building / asset;
• End-of-life treatment• Downstream
distribution
“Embodied” Carbon“Capital” Carbon -
CapCarb
“Operational” Carbon -OpCarb
“End User” Carbon UseCarb
Upstream Company Downstream
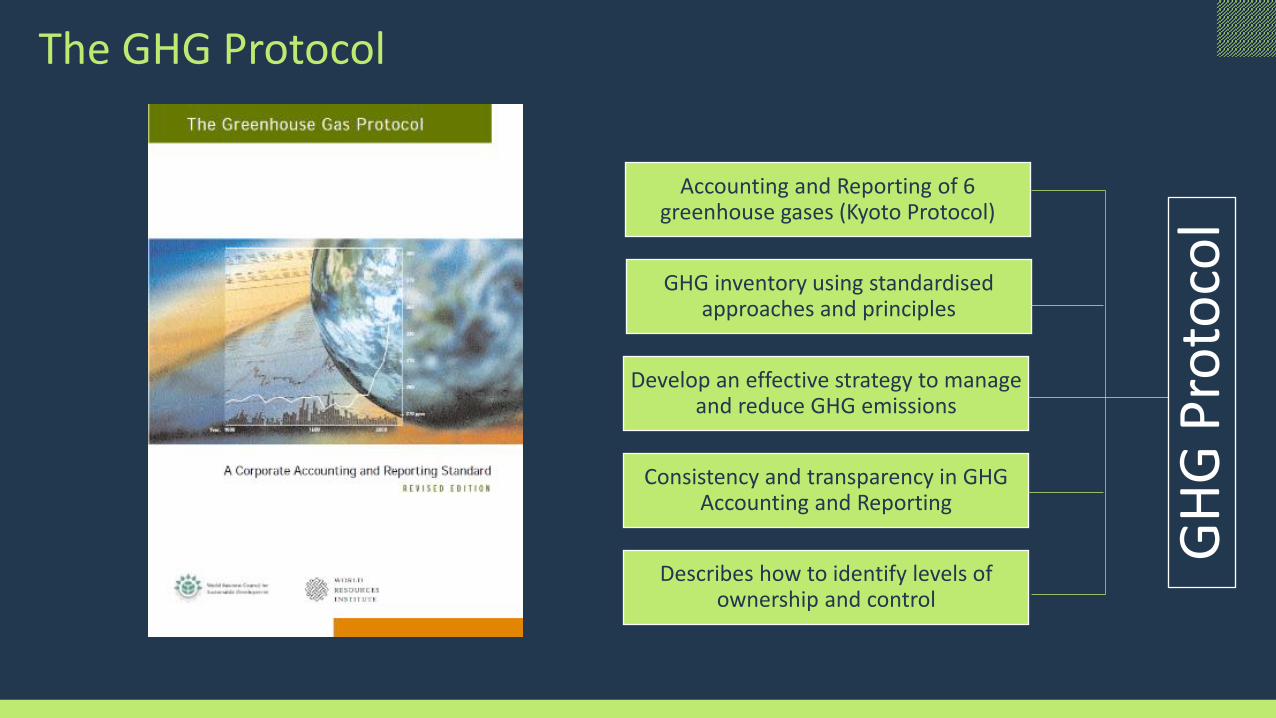
The GHG Protocol
Accounting and Reporting of 6 greenhouse gases (Kyoto Protocol)
Describes how to identify levels of ownership and control
GHG inventory using standardised approaches and principles
Develop an effective strategy to manage and reduce GHG emissions
Consistency and transparency in GHG Accounting and Reporting
GH
G P
roto
col

Organizational Boundaries: Consolidation approaches
• Equity share approach
• Control approach • Financial control • Operational control
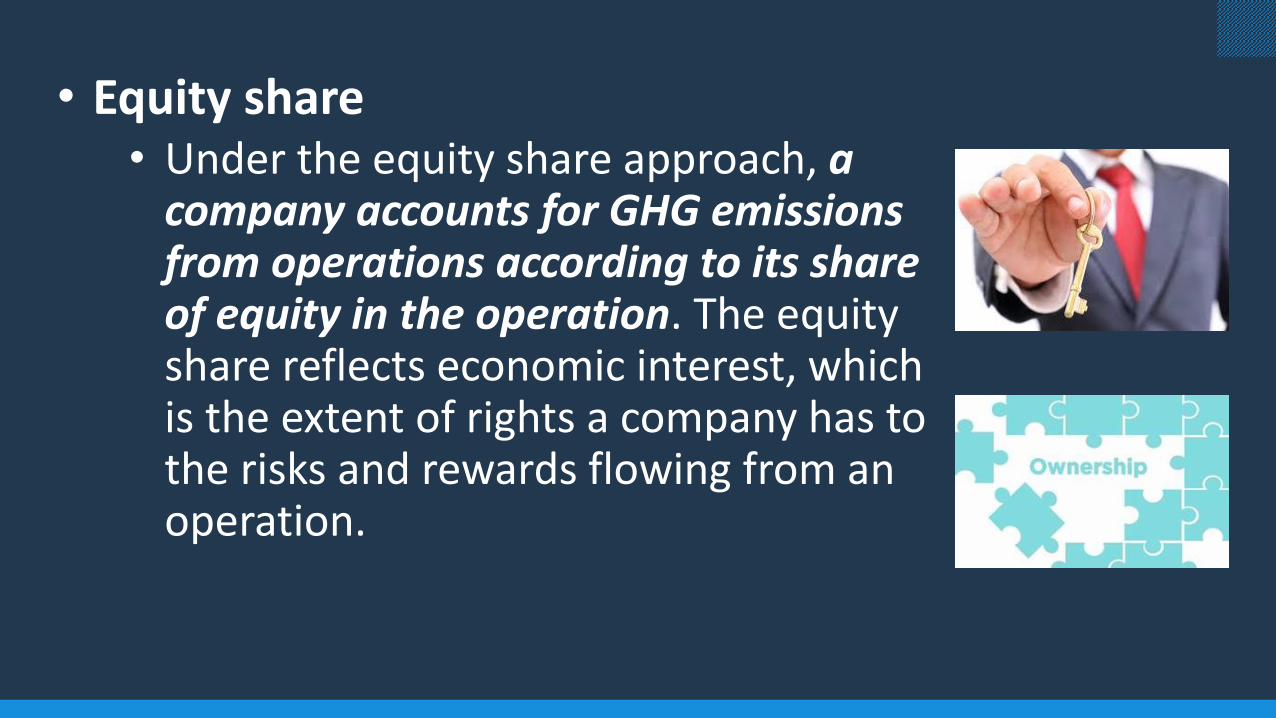
• Equity share • Under the equity share approach, a
company accounts for GHG emissions from operations according to its share of equity in the operation. The equity share reflects economic interest, which is the extent of rights a company has to the risks and rewards flowing from an operation.

• Financial control • Under the financial control approach, a
company accounts for 100% of the GHG emissions over which it has financial control. It does not account for GHG emissions from operations in which it owns an interest but does not have financial control.

• Operational control • Under the operational control
approach, a company accounts for 100% of the GHG emissions over which it has operational control. It does not account for GHG emissions from operations in which it owns an interest but does not have operational control.
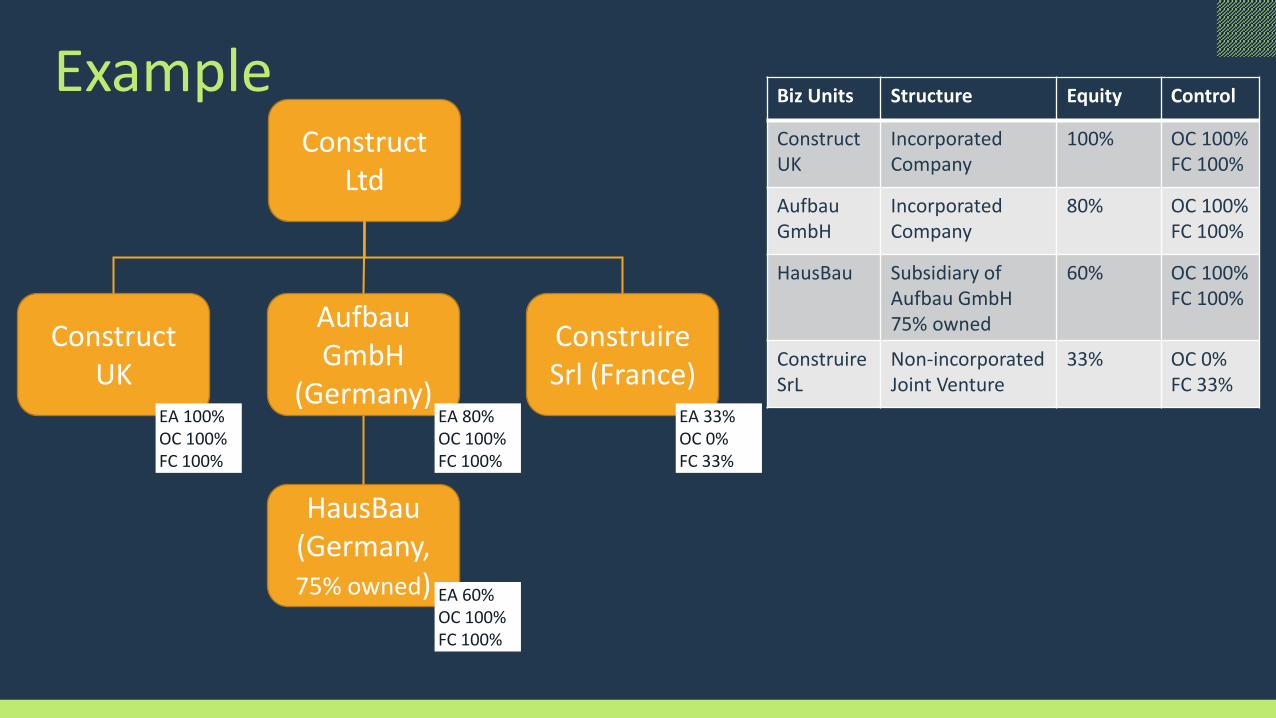
ExampleConstruct
Ltd
ConstruireSrl (France)
Construct UK
Aufbau GmbH
(Germany)
HausBau(Germany, 75% owned)
Biz Units Structure Equity Control
Construct UK
Incorporated Company
100% OC 100%FC 100%
Aufbau GmbH
Incorporated Company
80% OC 100%FC 100%
HausBau Subsidiary of Aufbau GmbH 75% owned
60% OC 100%FC 100%
ConstruireSrL
Non-incorporated Joint Venture
33% OC 0%FC 33%
EA 33% OC 0% FC 33%
EA 100% OC 100% FC 100%
EA 80% OC 100% FC 100%
EA 60% OC 100% FC 100%
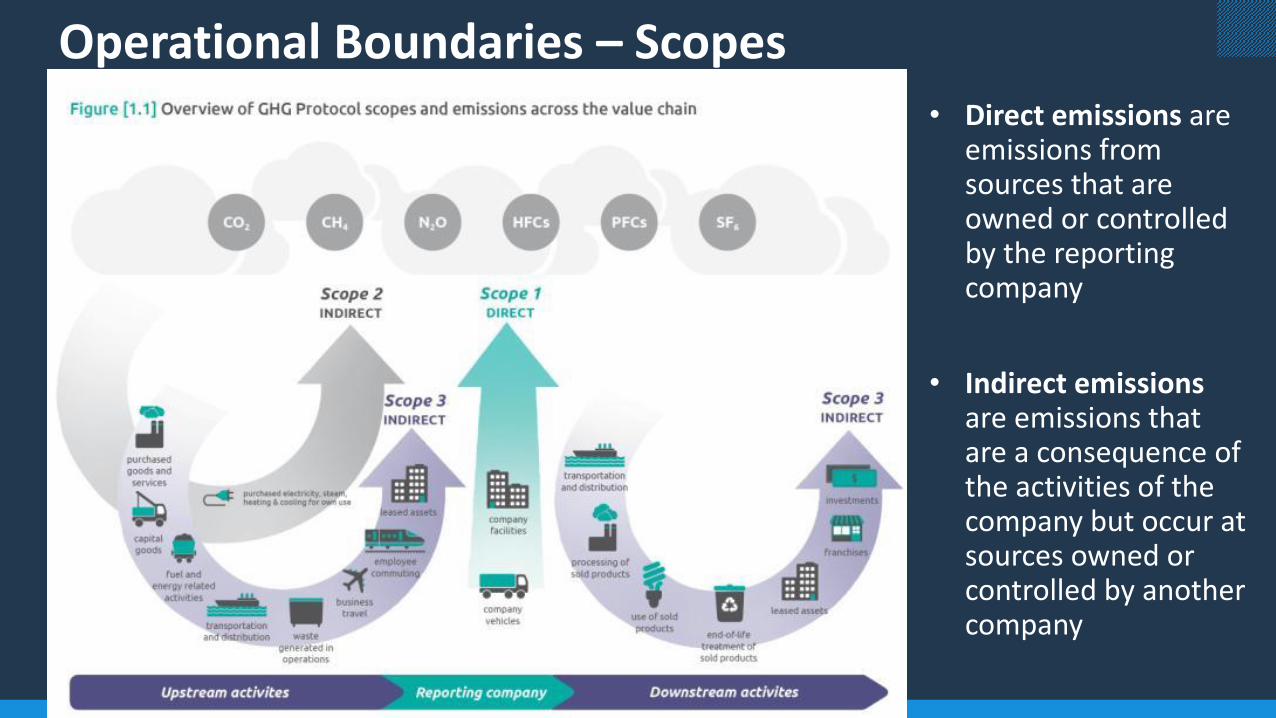
Operational Boundaries – Scopes
• Direct emissions are emissions from sources that are owned or controlled by the reporting company
• Indirect emissions are emissions that are a consequence of the activities of the company but occur at sources owned or controlled by another company

Tier 0 - ClientTier 1Tier 2Tier 3Tiers Continued
31
2 31
2
3
1
2
31
2
31
2
31
2
31
2
31
2
31
2
Scope 1 – Direct Emissions from owned or controlled sourcesScope 2 – Indirect emissions from generation of purchased energyScope 3 – All other indirect emissions that occur in a company’s value chain
31
2
The links between Scope 1, 2 and 3 carbon emissions in the Supply Chain
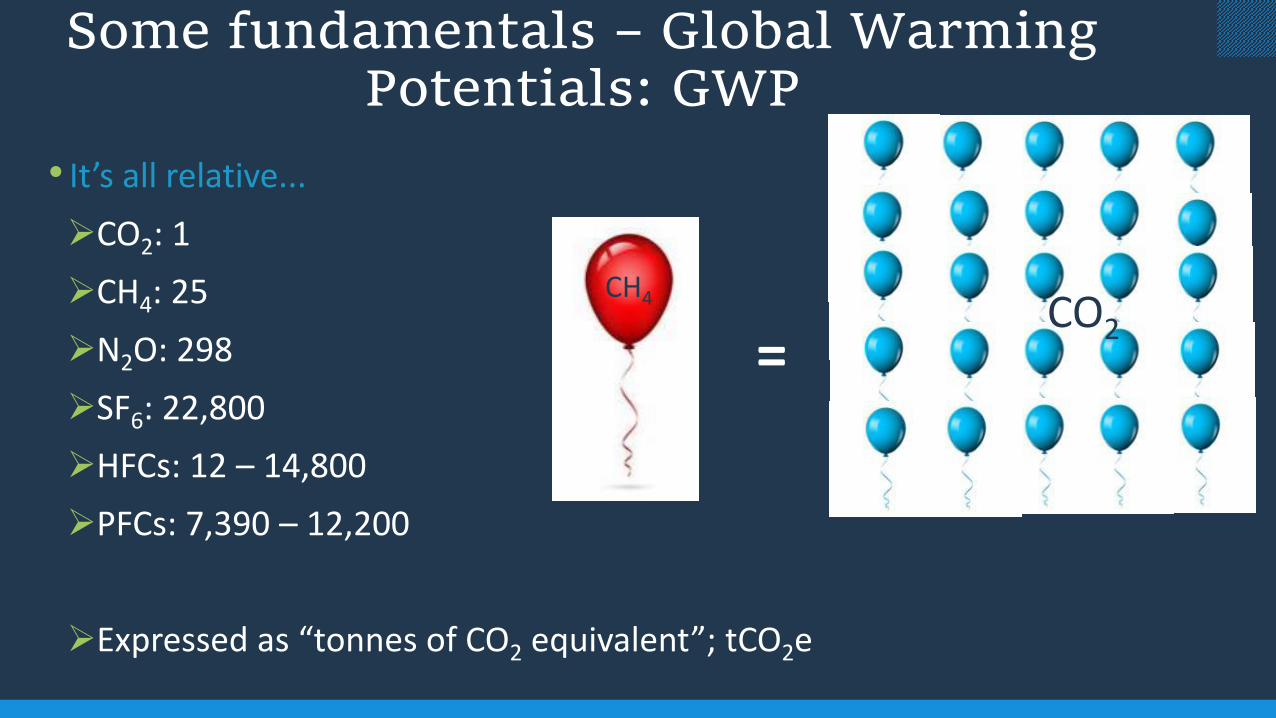
Some fundamentals – Global Warming Potentials: GWP
• It’s all relative...
➢CO2: 1
➢CH4: 25
➢N2O: 298
➢SF6: 22,800
➢HFCs: 12 – 14,800
➢PFCs: 7,390 – 12,200
➢Expressed as “tonnes of CO2 equivalent”; tCO2e
CH4 CO2=
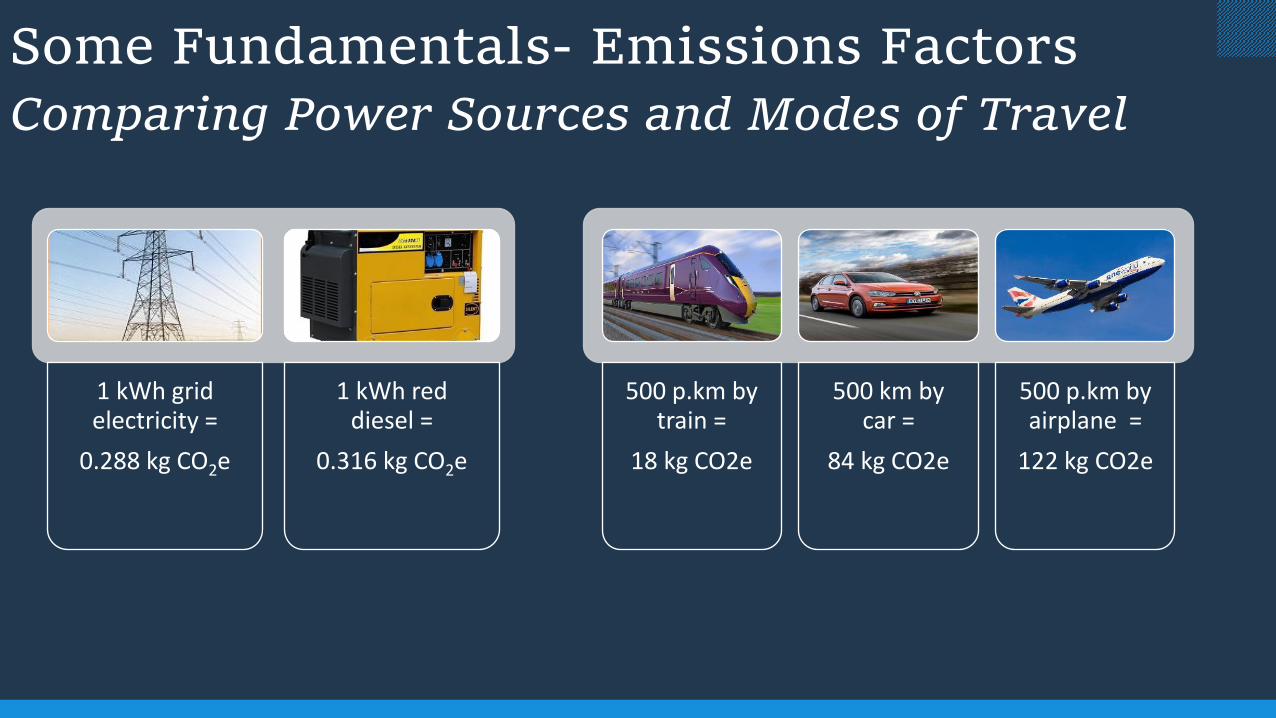
Some Fundamentals- Emissions FactorsComparing Power Sources and Modes of Travel
1 kWh grid electricity =
0.288 kg CO2e
1 kWh red diesel =
0.316 kg CO2e
500 p.km by train =
18 kg CO2e
500 km by car =
84 kg CO2e
500 p.km by airplane =
122 kg CO2e

Some Fundamentals- Emissions FactorsComparing Materials
1 tonne of aggregate =
5 kg CO2e
1 tonne of plasterboard =
390 kg CO2e
1 tonne of concrete =
100 kg CO2e
1 tonne of steel =
1550 kg CO2e
1 tonne of bricks =
210 kg CO2e

• Go to www.menti.com in a new browser or tab on your phone or computer.
• When you see it on the slide or hear the trainer read it out, enter the menti code
51 26 63 3
• Don’t disconnect from the Teams meeting; you will still need to hear the trainer and colleagues
Check your understanding of scopes! 5 questions! Operational Control
How to get a carbon footprint
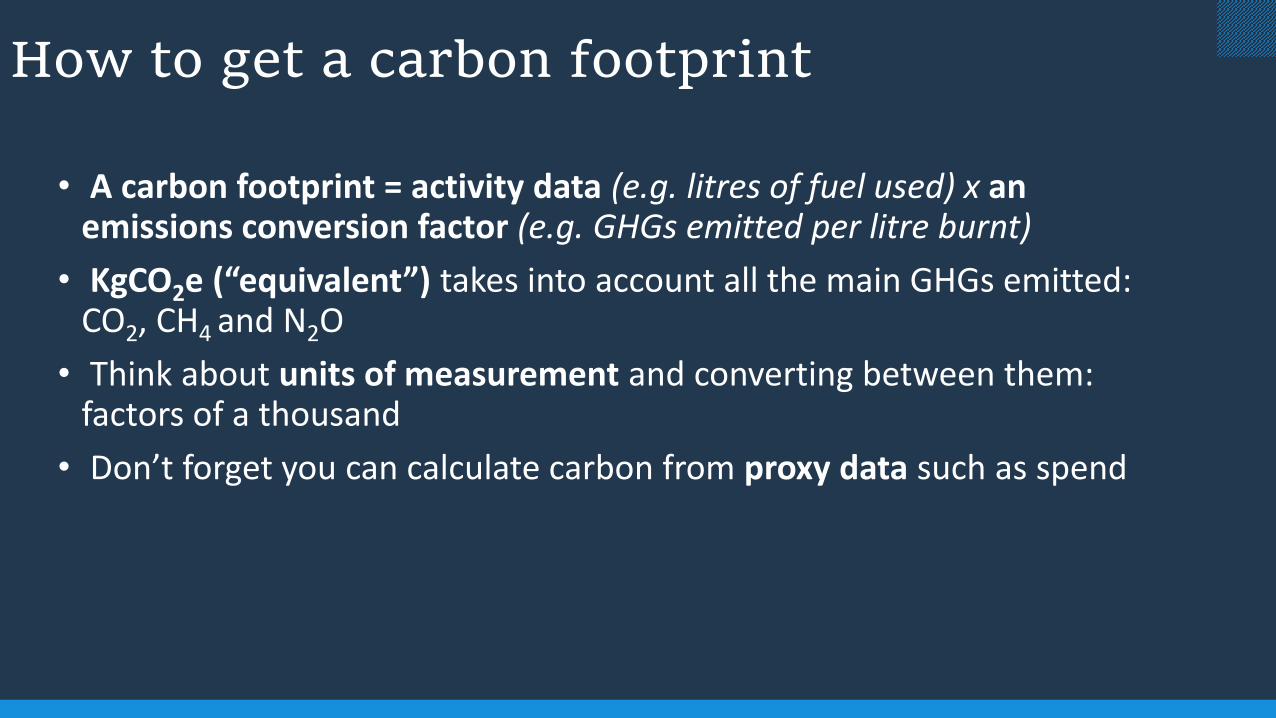
• A carbon footprint = activity data (e.g. litres of fuel used) x an emissions conversion factor (e.g. GHGs emitted per litre burnt)
• KgCO2e (“equivalent”) takes into account all the main GHGs emitted: CO2, CH4 and N2O
• Think about units of measurement and converting between them: factors of a thousand
• Don’t forget you can calculate carbon from proxy data such as spend

Exercise: Calculate the carbon footprint for your organisation or site
Use the data provided to calculate the carbon footprint of your site’s activities:
• Fork lift trucks
• Electricity for your offices
• Diesel for outsourced logistics
• List it as scopes 1, 2 and 3 and the overall total
• Time: 15 mins

And the answers are…
▪ Scope 1 389 kg CO2e ▪ Scope 2 1,282 kg CO2e ▪ Scope 3 2,546 kg CO2e ▪ Total 4,217 kg CO2e

Carbon reduction workshop: undertaking a footprint
1. Set the Goal
2. Set the Scope and Boundaries
3. Gather Data
4. Analyse
5. Report against KPIs
6. PDCA

Your Business
• Fuel and energy in company facilities
• Vehicles and plant. • Chemical / biological
processes, and • Fugitive emissions
Your Suppliers
• Materials, goods and services,
• Capital goods, • Delivery• Utilities: electricity,
waste and water• Business travel
Set your Boundaries for your Organisation
Your Client
• In-use emissions from running the building / asset;
• End-of-life treatment• Downstream
distribution
“Embodied” Carbon“Capital” Carbon -
CapCarb
“Operational” Carbon -OpCarb
“End User” Carbon UseCarb
Upstream Scopes 2 & 3 (Indirect) Company’s Scope 1 (Direct) Downstream Scope 3 (Indirect)
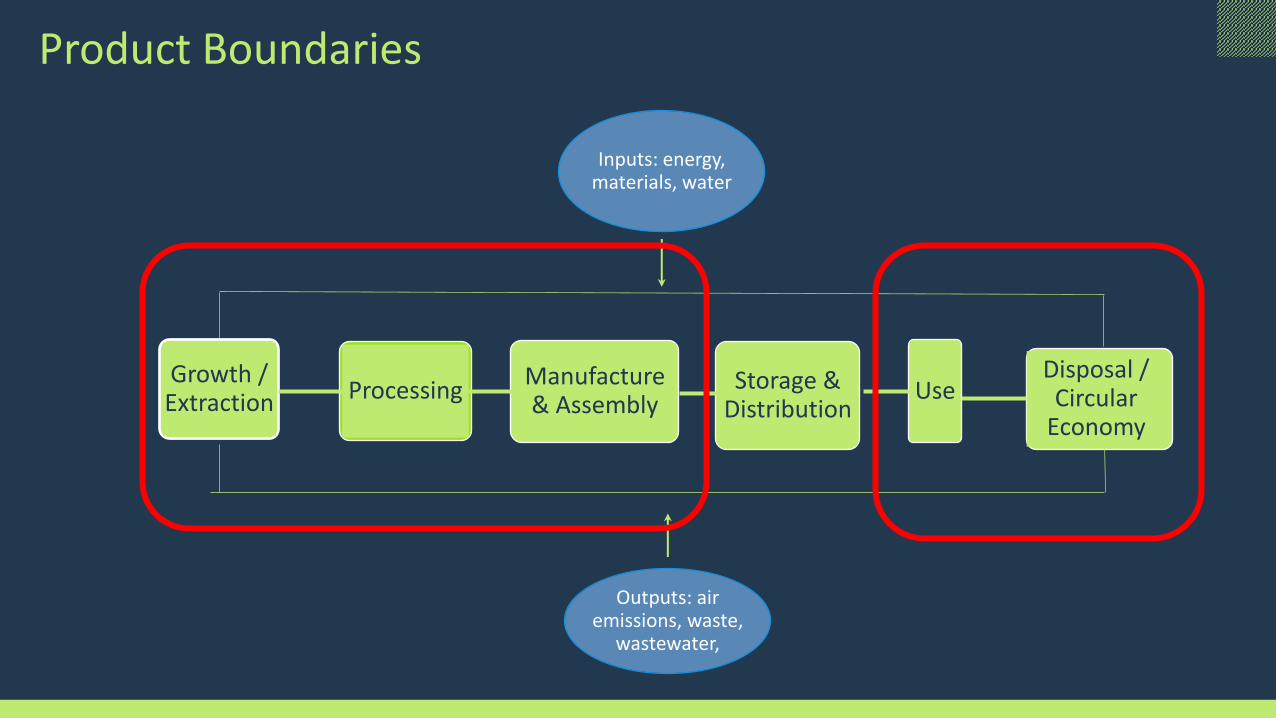
Product Boundaries
Inputs: energy, materials, water
Growth / Extraction Processing
Manufacture & Assembly
Storage & Distribution
UseDisposal / Circular
Economy
Outputs: air emissions, waste,
wastewater,

Boundaries
“Cradle-to-Grave” – Full supply chain from raw material extraction to end-user and final disposal. Or “cradle-to-cradle”
“Cradle-to-Site” – Supply Chain from raw material extraction to construction site
“Cradle-to-Gate” – Supply Chain from raw material extraction to factory gate
Setting the Boundaries – Lifecycle stages
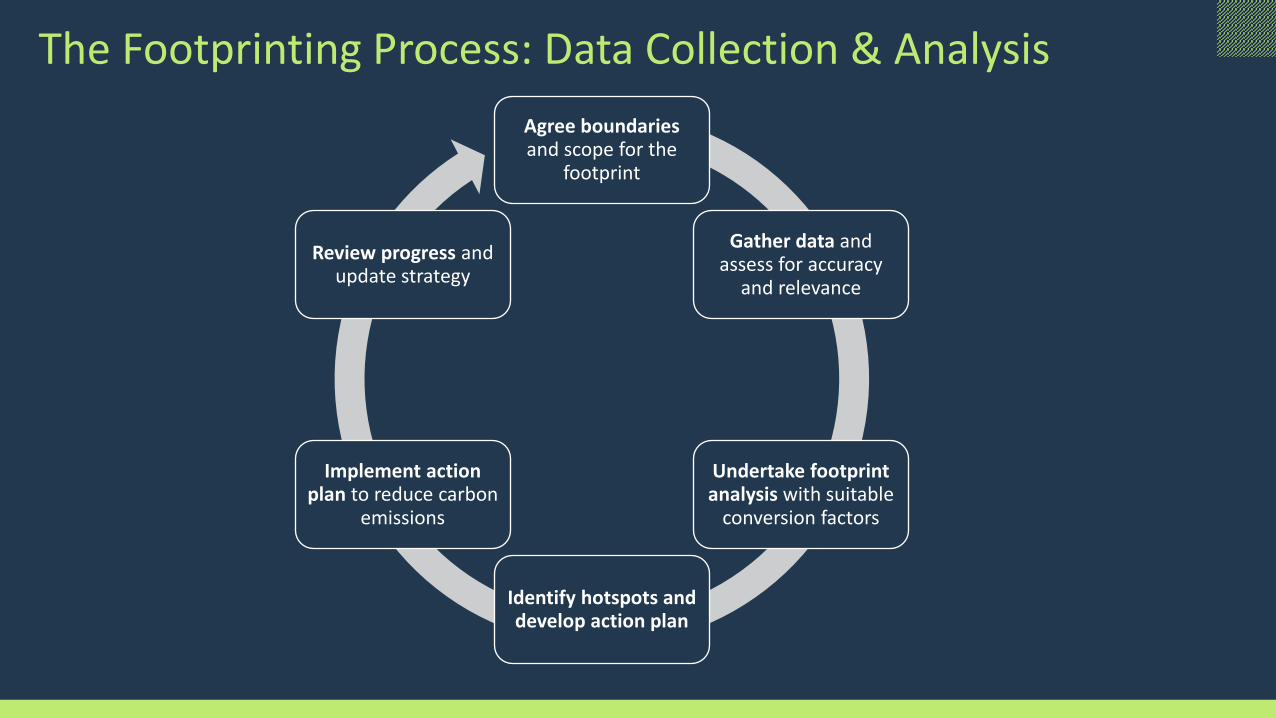
Agree boundaries and scope for the
footprint
Gather data and assess for accuracy
and relevance
Undertake footprint analysis with suitable
conversion factors
Identify hotspots and develop action plan
Implement action plan to reduce carbon
emissions
Review progress and update strategy
The Footprinting Process: Data Collection & Analysis

Example: building a train tunnel
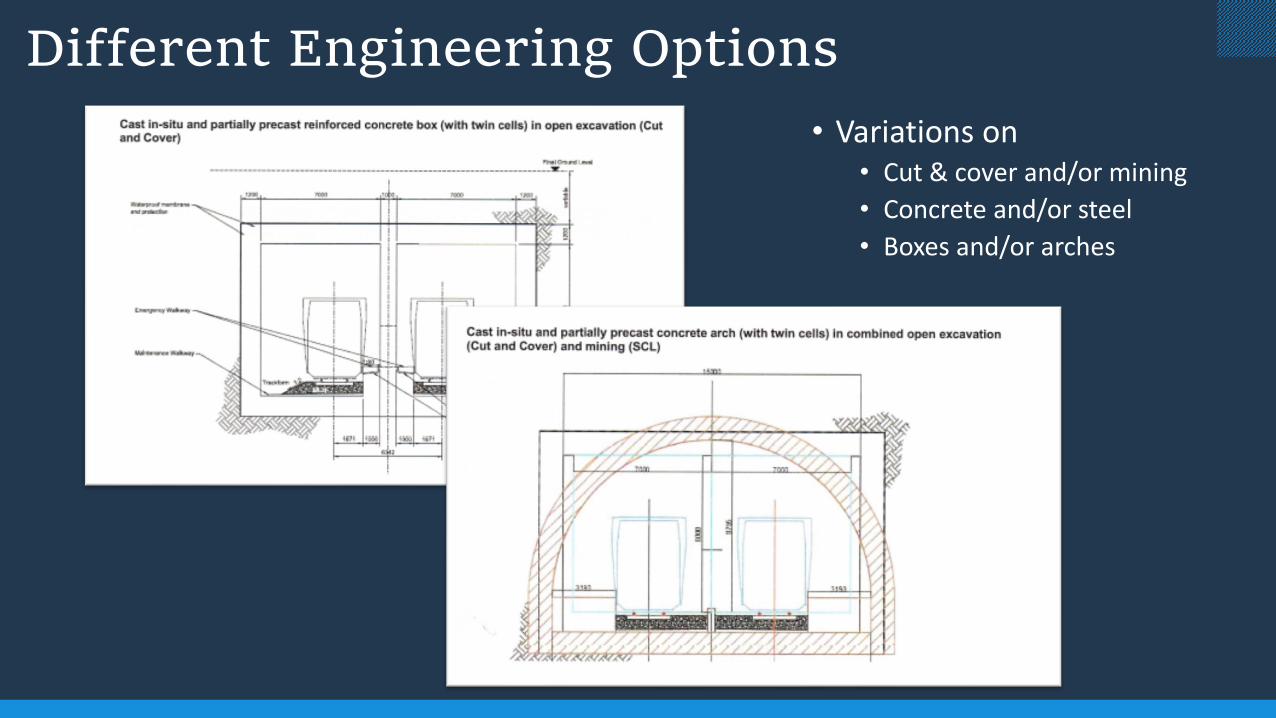
Different Engineering Options
• Variations on • Cut & cover and/or mining
• Concrete and/or steel
• Boxes and/or arches

Carbon impacts for the options
Option 1: 125,000 tCO2e
Option 2: 92,000 tCO2e
1. Excavation
2. Backfilling
3. Soil disposal
4. Dewatering
5. Concrete
6. Reinforcement
7. Waterproofing
8. Mining
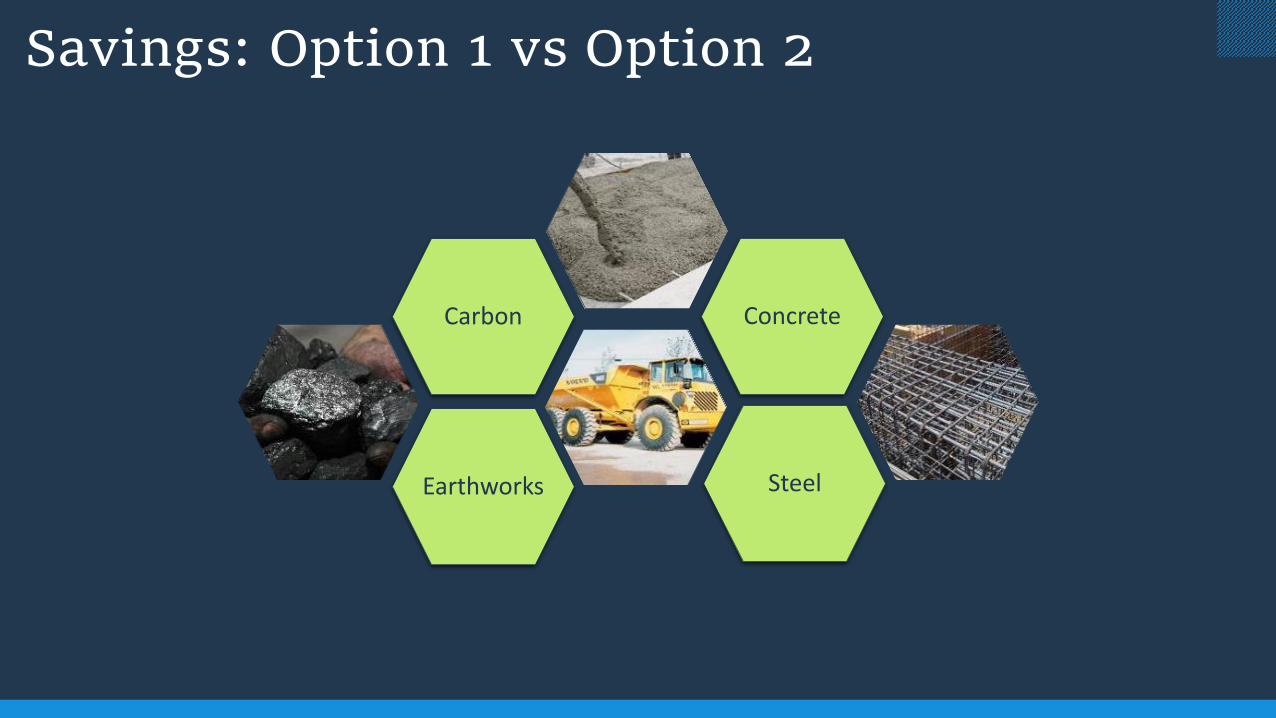
Savings: Option 1 vs Option 2
Earthworks Steel
Carbon Concrete

Carbon and Earthworks savingsSaving
33,000 t CO2e
Option 1: 125,000 t CO2e
Option 2: 92,000 t CO2e
x 1,000 fewer ADT movements
3,980,000 m3 1,900,000 m
3
2,070,000 m3
Option 1 Option 2
earthworks
Saving
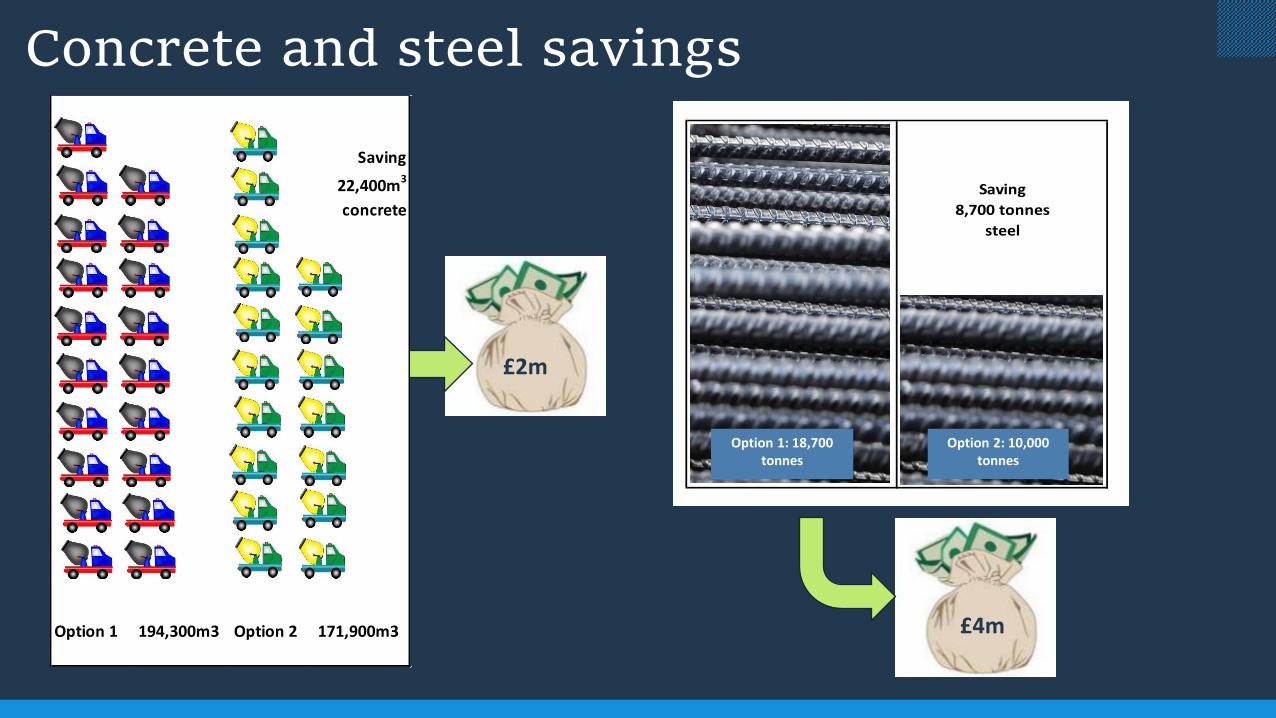
Concrete and steel savings
£2m
Saving
22,400m3
concrete
Option 1 194,300m3 Option 2 171,900m3
Saving
8,700 tonnes
steel
Option 1: 18,700 tonnes
Option 2: 10,000 tonnes
£4m
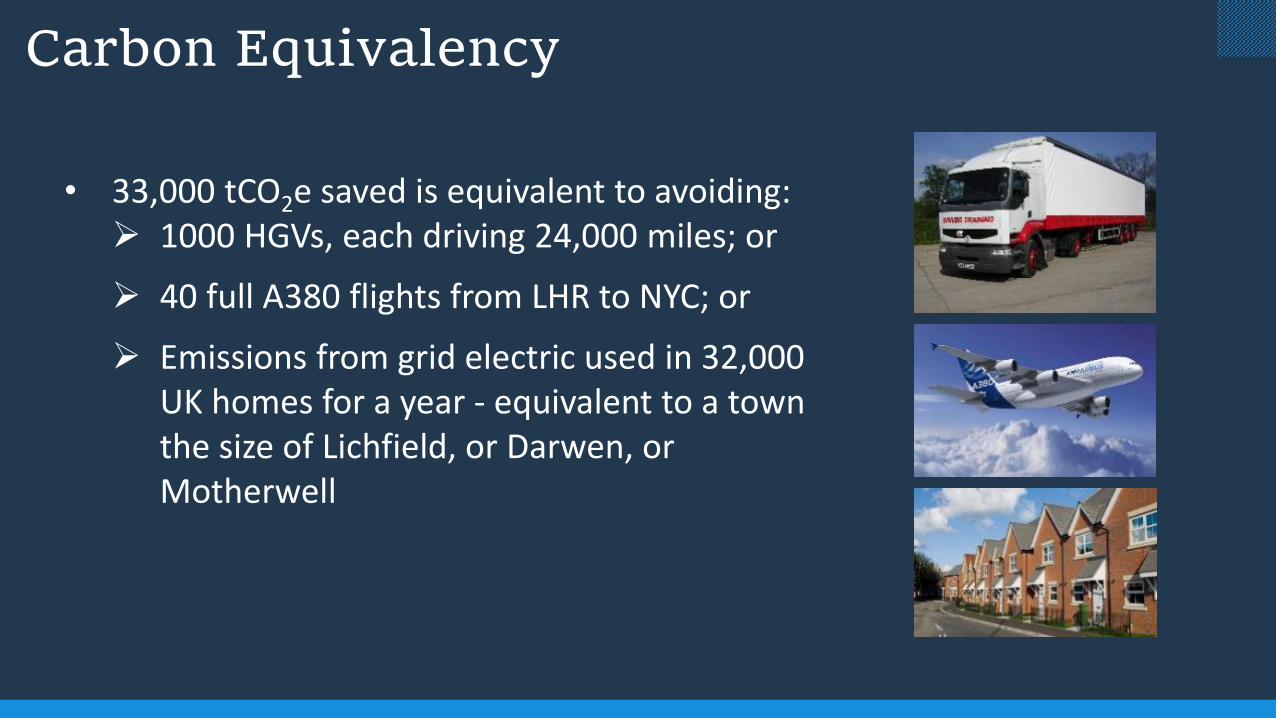
Carbon Equivalency
• 33,000 tCO2e saved is equivalent to avoiding:➢ 1000 HGVs, each driving 24,000 miles; or
➢ 40 full A380 flights from LHR to NYC; or
➢ Emissions from grid electric used in 32,000 UK homes for a year - equivalent to a town the size of Lichfield, or Darwen, or Motherwell

Exercise: Calculate the carbon footprint of concrete
Use the data in the hand-out
• Aggregates
• Cement
Look at the conversion factors:
Calculate answers
Time: 15 mins
And the answers are…
• 67.7 kg CO2 per tonne
or
• 148.8 kg CO2 / m3
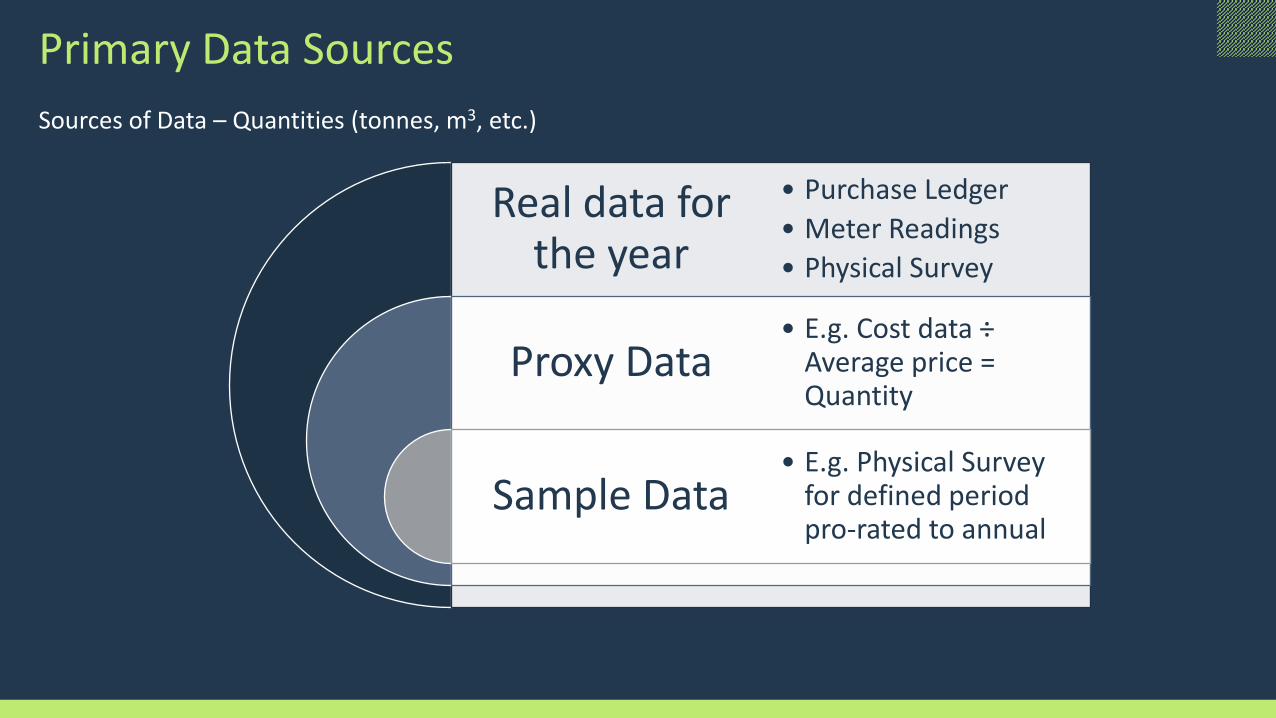
Primary Data Sources
Real data for the year
Proxy Data
Sample Data
• Purchase Ledger
• Meter Readings
• Physical Survey
• E.g. Cost data ÷Average price = Quantity
• E.g. Physical Survey for defined period pro-rated to annual
Sources of Data – Quantities (tonnes, m3, etc.)
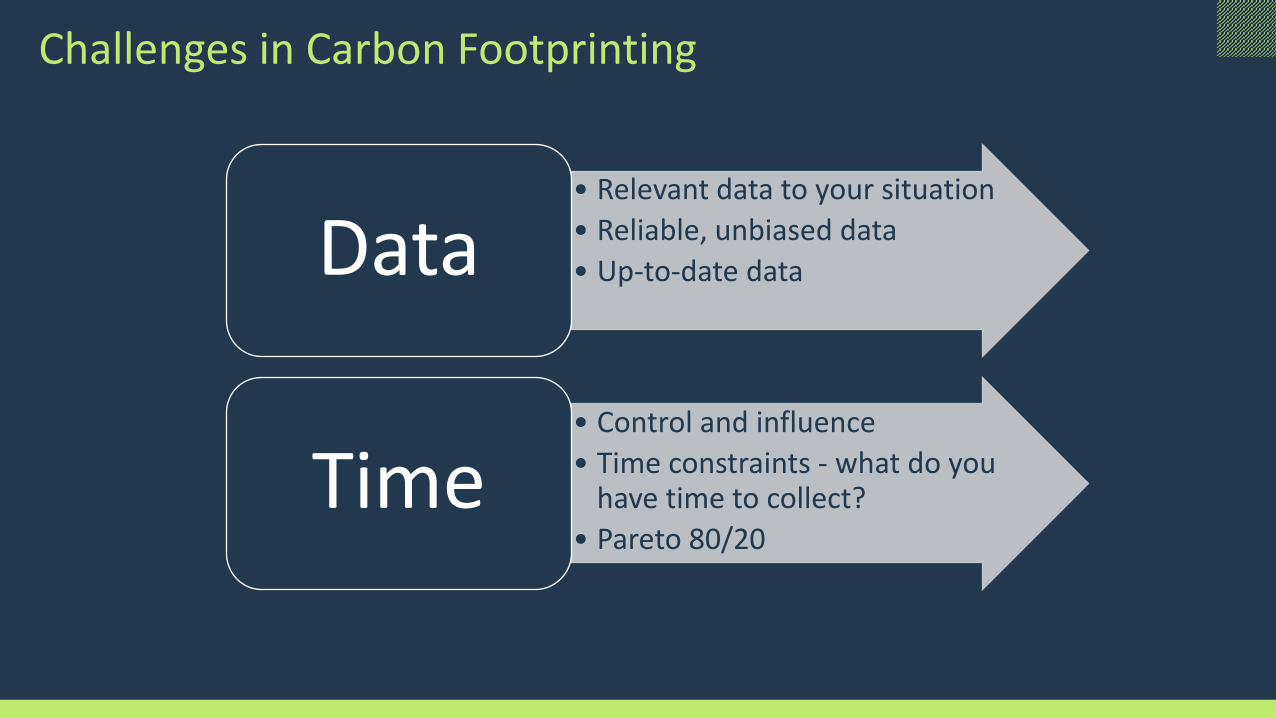
Challenges in Carbon Footprinting
• Relevant data to your situation
• Reliable, unbiased data
• Up-to-date dataData
• Control and influence
• Time constraints - what do you have time to collect?
• Pareto 80/20
Time

Competence & Collaboration
Publicly Available
• Individual Company Research
• “Trade Body” / Sector Research
• Academic Research
Key Points Before Use
• Are all conversion factors comparable?
• What does it include/exclude?
• Up to date?
Conversion Factors
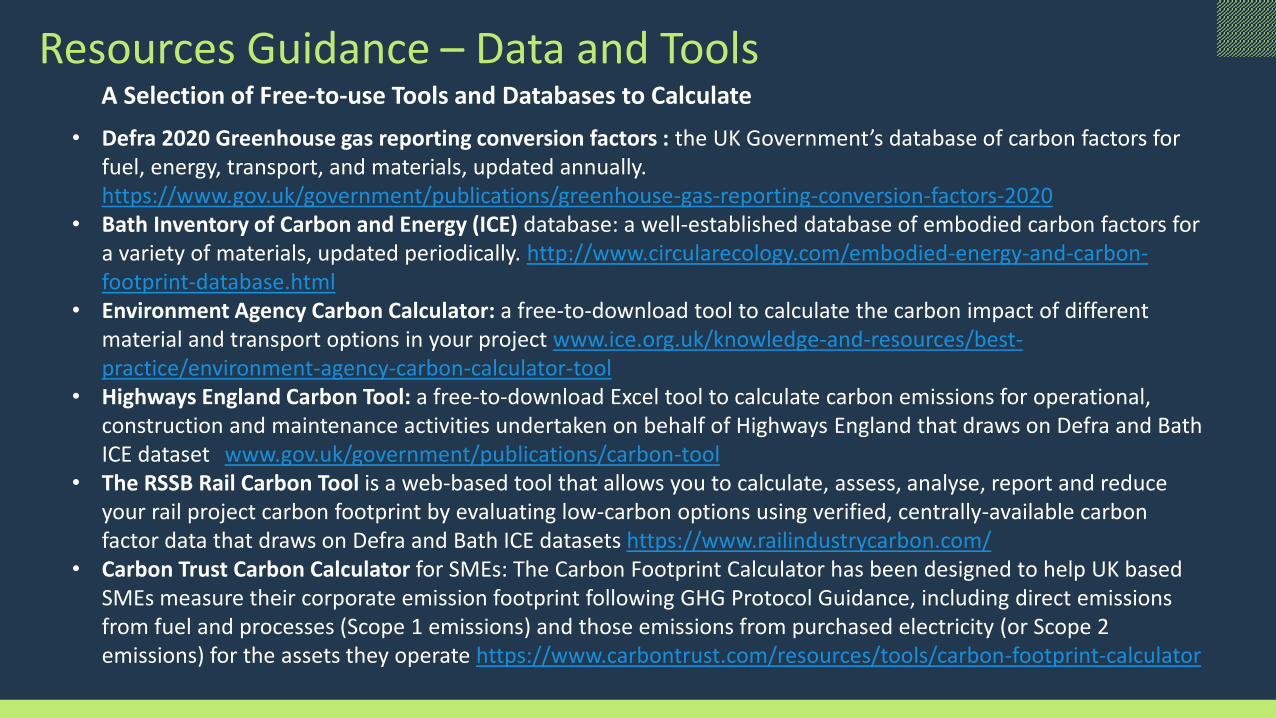
Resources Guidance – Data and Tools
• Defra 2020 Greenhouse gas reporting conversion factors : the UK Government’s database of carbon factors for fuel, energy, transport, and materials, updated annually. https://www.gov.uk/government/publications/greenhouse-gas-reporting-conversion-factors-2020
• Bath Inventory of Carbon and Energy (ICE) database: a well-established database of embodied carbon factors for a variety of materials, updated periodically. http://www.circularecology.com/embodied-energy-and-carbon-footprint-database.html
• Environment Agency Carbon Calculator: a free-to-download tool to calculate the carbon impact of different material and transport options in your project www.ice.org.uk/knowledge-and-resources/best-practice/environment-agency-carbon-calculator-tool
• Highways England Carbon Tool: a free-to-download Excel tool to calculate carbon emissions for operational, construction and maintenance activities undertaken on behalf of Highways England that draws on Defra and Bath ICE datasets www.gov.uk/government/publications/carbon-tool
• The RSSB Rail Carbon Tool is a web-based tool that allows you to calculate, assess, analyse, report and reduce your rail project carbon footprint by evaluating low-carbon options using verified, centrally-available carbon factor data that draws on Defra and Bath ICE datasets https://www.railindustrycarbon.com/
• Carbon Trust Carbon Calculator for SMEs: The Carbon Footprint Calculator has been designed to help UK based SMEs measure their corporate emission footprint following GHG Protocol Guidance, including direct emissions from fuel and processes (Scope 1 emissions) and those emissions from purchased electricity (or Scope 2 emissions) for the assets they operate https://www.carbontrust.com/resources/tools/carbon-footprint-calculator
A Selection of Free-to-use Tools and Databases to Calculate a Footprint
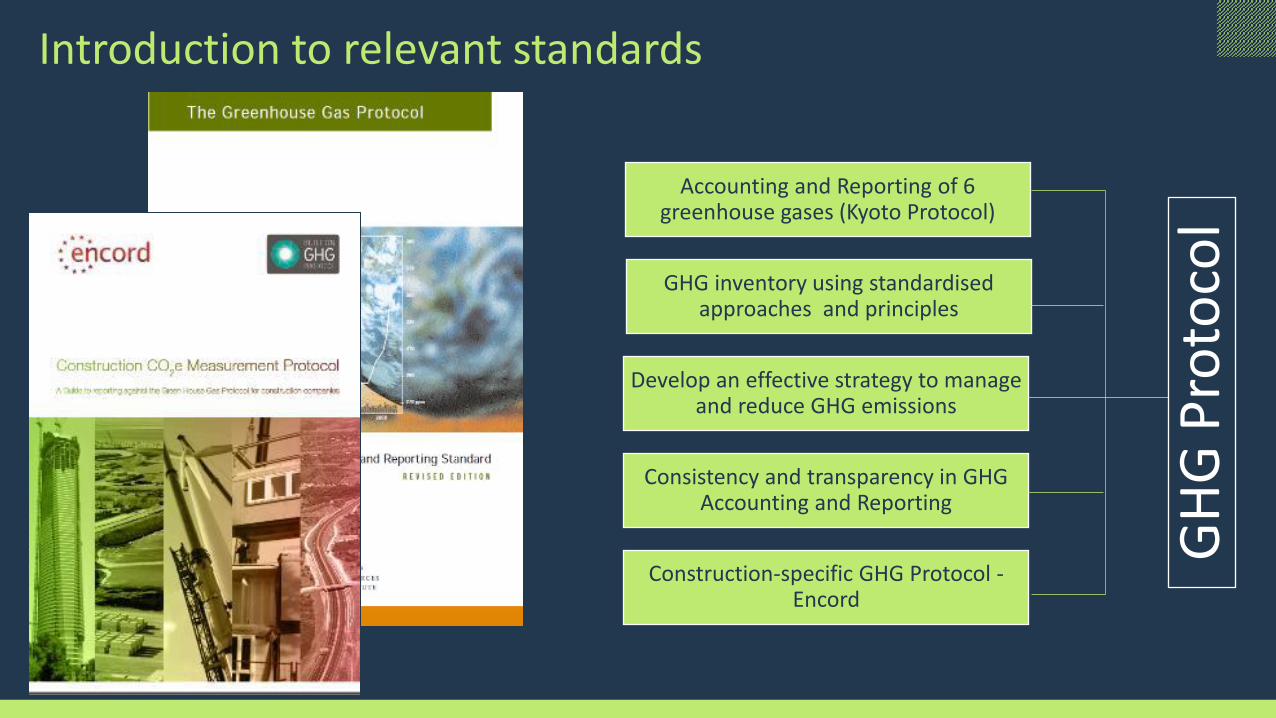
Introduction to relevant standards
Accounting and Reporting of 6 greenhouse gases (Kyoto Protocol)
Construction-specific GHG Protocol -Encord
GHG inventory using standardised approaches and principles
Develop an effective strategy to manage and reduce GHG emissions
Consistency and transparency in GHG Accounting and Reporting
GH
G P
roto
col
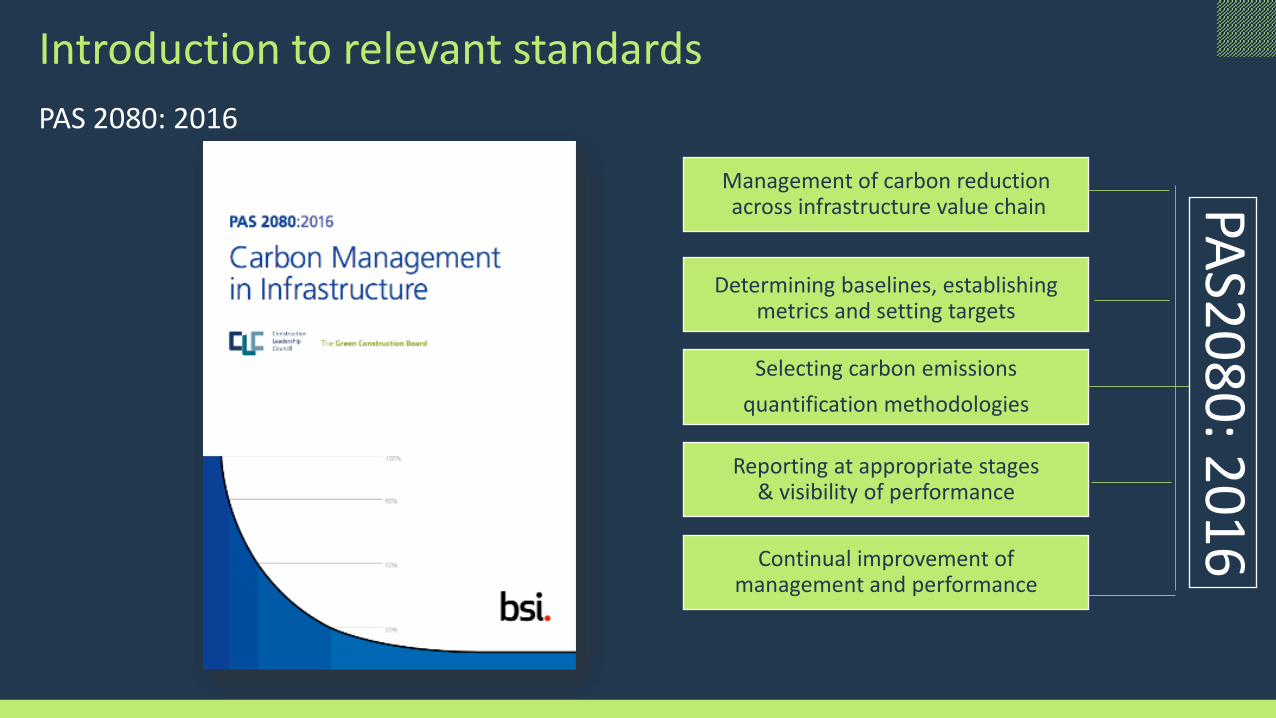
Introduction to relevant standards
Management of carbon reductionacross infrastructure value chain
Determining baselines, establishing metrics and setting targets
Selecting carbon emissions
quantification methodologies
Reporting at appropriate stages& visibility of performance
Continual improvement of management and performance
PAS 2080: 2016
PAS2
08
0: 2
01
6

Introduction to relevant standards
Applicable to construction projects, services and processes
Provides a structure to capture all aspects of carbon emissions
Encompasses life cycle: manufacture, construction, operation, maintenance
and demolition
Allows for fair comparison and a robust route to reducing carbon impacts
Covers all environmental impacts of a construction project
BS
EN 1
59
78
BS EN 15978
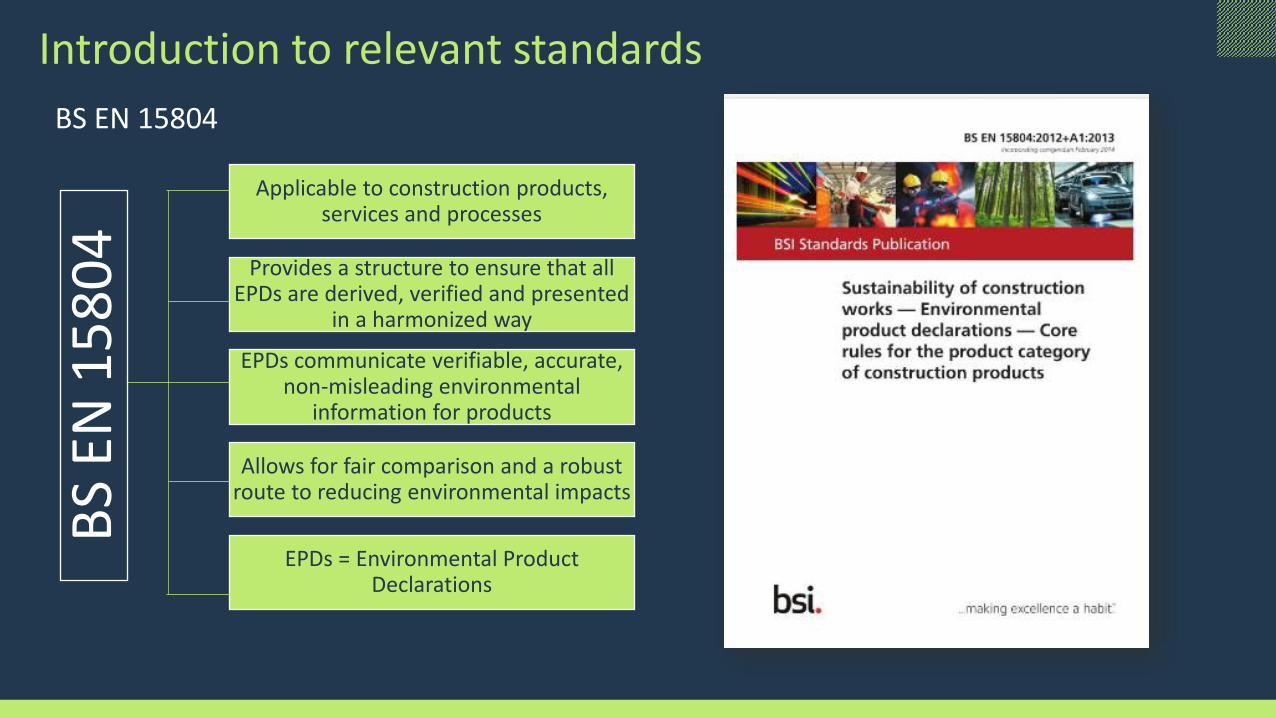
Introduction to relevant standards
Applicable to construction products, services and processes
Provides a structure to ensure that all EPDs are derived, verified and presented
in a harmonized way
EPDs communicate verifiable, accurate, non-misleading environmental
information for products
Allows for fair comparison and a robust route to reducing environmental impacts
EPDs = Environmental Product Declarations
BS
EN 1
58
04
BS EN 15804

Introduction to relevant standards
PAS
20
50
:20
11 Publicly Available Specification (PAS)
Standardised approach to product Carbon Footprinting
Applicable to products life cycle and/or cradle-to-gate
Design for all organisation regardless of size and sector
Additional economic, social and environmental impacts are not assessed
PAS 2050:2011
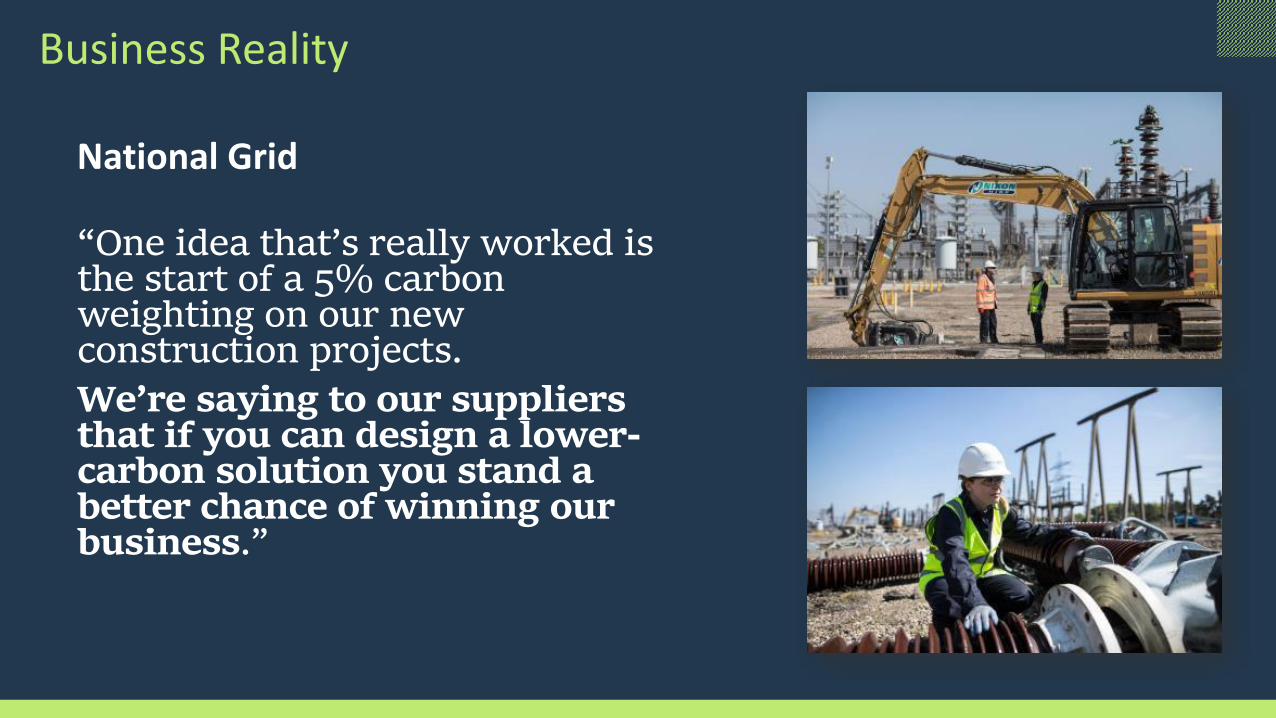
Business Reality
“One idea that’s really worked is the start of a 5% carbon weighting on our new construction projects.
We’re saying to our suppliers that if you can design a lower-carbon solution you stand a better chance of winning our business.”
National Grid
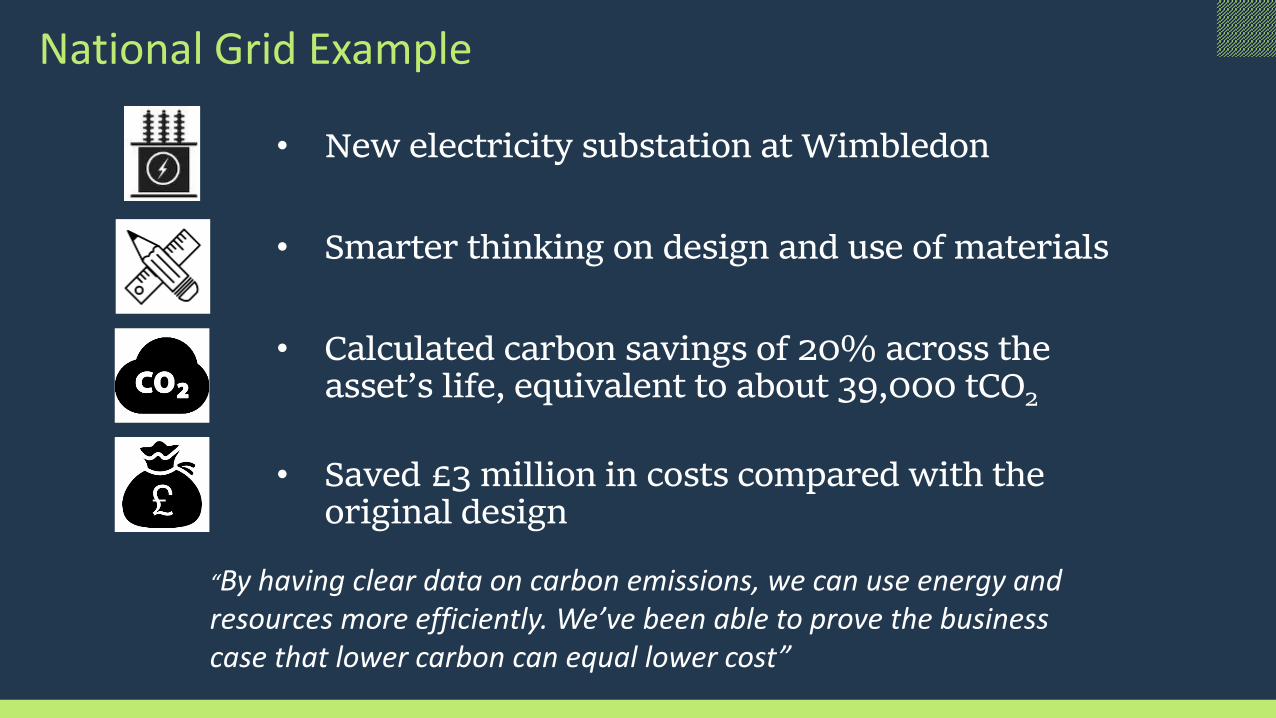
National Grid Example
• New electricity substation at Wimbledon
• Smarter thinking on design and use of materials
• Calculated carbon savings of 20% across the asset’s life, equivalent to about 39,000 tCO2
• Saved £3 million in costs compared with the original design
“By having clear data on carbon emissions, we can use energy and resources more efficiently. We’ve been able to prove the business case that lower carbon can equal lower cost”
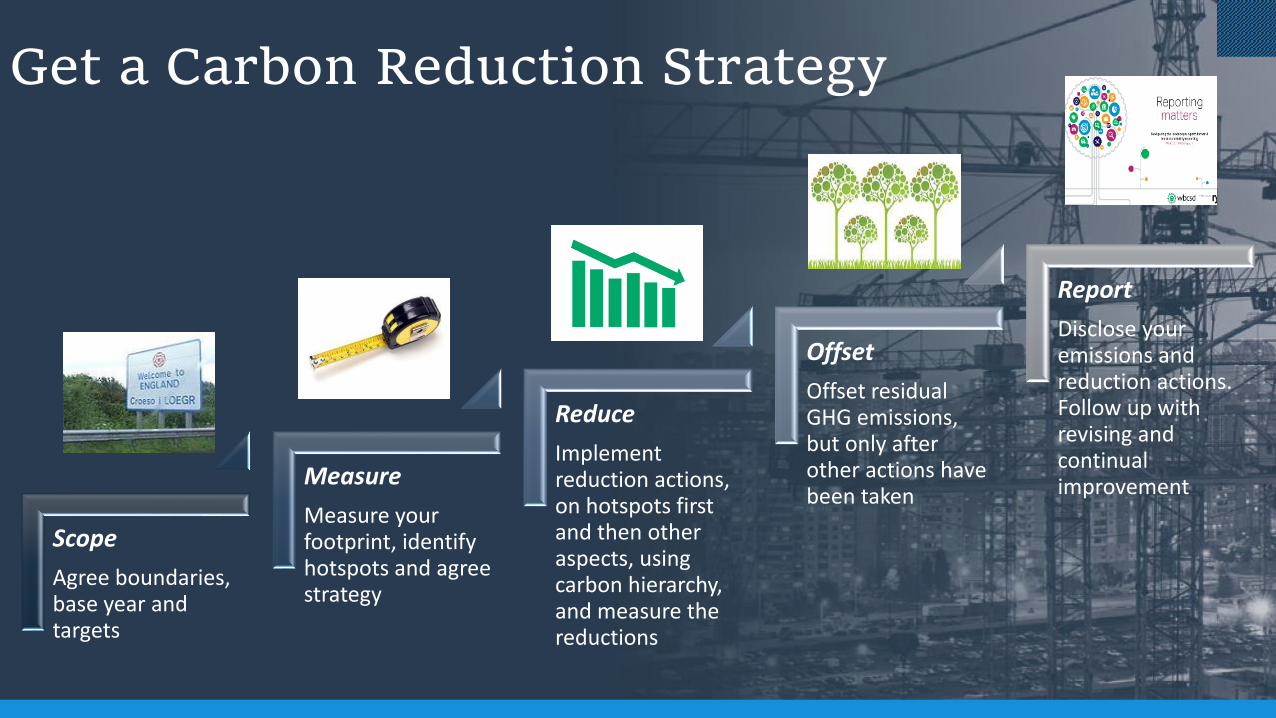
Get a Carbon Reduction Strategy
Scope
Agree boundaries, base year and targets
Measure
Measure your footprint, identify hotspots and agree strategy
Reduce
Implement reduction actions, on hotspots first and then other aspects, using carbon hierarchy, and measure the reductions
Offset
Offset residual GHG emissions, but only after other actions have been taken
Report
Disclose your emissions and reduction actions. Follow up with revising and continual improvement
The end of the training… for now…
…but the beginning of your carbon reduction plans!....

Questions, Answers and Feedback
https://www.surveymonkey.co.uk/r/Introtocarbonworkshop
Thank you!
James Cadman• Lead Consultant at Action Sustainability • 07884 654827• www.actionsustainability.com• @Action_Sustain
Related Documents