Energising Manufacturing Sector 19 Strategy Paper INTRODUCTION TENTH MALAYSIA PLAN, 2011-2015: PROGRESS Manufacturing Sector Small and Medium Enterprises in the Manufacturing Sector ISSUES AND CHALLENGES Productivity Low Value Add Labour Intensive Industries Innovation Competitiveness Enablers ELEVENTH MALAYSIA PLAN, 2016-2020: WAY FORWARD Moving Towards Complex and Diverse Products Enhancing Productivity Through Automation Stimulating Innovation-Led Growth Strengthening Growth Enablers Ramping Up Internationalisation CONCLUSION

Welcome message from author
This document is posted to help you gain knowledge. Please leave a comment to let me know what you think about it! Share it to your friends and learn new things together.
Transcript

Energising Manufacturing Sector
19 Strategy Paper
INTRODUCTION
TENTH MALAYSIA PLAN, 2011-2015:
PROGRESS
Manufacturing Sector
Small and Medium Enterprises in the
Manufacturing Sector
ISSUES AND CHALLENGES
Productivity
Low Value Add Labour Intensive Industries
Innovation
Competitiveness
Enablers
ELEVENTH MALAYSIA PLAN, 2016-2020:
WAY FORWARD
Moving Towards Complex and Diverse Products
Enhancing Productivity Through Automation
Stimulating Innovation-Led Growth
Strengthening Growth Enablers
Ramping Up Internationalisation
CONCLUSION

For further information refer to:
Director General
Economic Planning Unit
Prime Minister’s Department
Block B5 & B6
Federal Government Administrative Centre
62502 Putrajaya
MALAYSIA
http://www.epu.gov.my
Tel.: 603-8000 8000
Fax.: 603-8888 3755
_____________________________________________
Publisher’s Copyright ©
All Rights Reserved. No part of this publication may be reproduced, stored in a retrieval system or transmitted
in any form or by any means electronic, mechanical, photocopying, recording and/or otherwise without the
prior permission of the Economic Planning Unit, Prime Minister’s Department.

Eleventh Malaysia Plan 19-1 Strategy Paper 19: Energising Manufacturing Sector
I. INTRODUCTION
19.1 During the Tenth Malaysia Plan, 2011-2015, the performance of manufacturing
sector has been generally encouraging, with positive growth in Gross Domestic Product
(GDP) and exports. The manufacturing sector accounts for the largest contributor to the
total exports and the second largest to GDP. However, the share of Malaysia’s
manufacturing exports in the world market is declining, facing stiff competition from
emerging economies such as the People’s Republic of China, India and Vietnam, particularly
in the electrical and electronics (E&E) subsector. The manufacturing sector has not evolved
to respond to changing global demands, producing products that are also manufactured by
many other countries. This is supported by the declining number of exports that have
Revealed Comparative Advantage greater than 1 (RCA>1).
19.2 In the Eleventh Malaysia Plan, 2016-2020, strategies will be introduced to chart a
new direction for the manufacturing sector to produce high value, diverse and complex
products. Underpinning this transition will be the intensification of research and
development (R&D) as well as design and process improvements, adoption of sustainable
manufacturing practices, compliance to standards, enhancement of market intelligence and
stronger collaboration between stakeholders. Focus will shift from quantity to quality and
broad-based incentives to performance-based incentives. In addition, manufacturers will be
encouraged to expand into international markets by leveraging the ASEAN Economic
Community (AEC) and Free Trade Agreements (FTAs).
II. TENTH MALAYSIA PLAN, 2011-2015: PROGRESS
Manufacturing Sector
19.3 The overall performance of the manufacturing sector was positive with an estimated
growth of 4.8% per annum during the Tenth Plan period and contributing 23% or RM243.9
billion to GDP in 2015, as shown in Exhibit 19-1. The growth of the sector is mainly from the
E&E and chemicals subsectors. The value added of E&E increased from RM44.2 billion in
2011 to RM53.8 billion in 2015, partly due to new applications for semi-conductors in
digitalisation, mobility, connectivity, energy efficiency and miniaturisation. The chemicals
subsector recorded an average growth of 3.4% per annum with an increase in value added
from RM24.8 billion in 2011 to RM27.8 billion in 2015, as chemical products are important
input to industries such as automotive, E&E, pharmaceutical and construction.

Eleventh Malaysia Plan 19-2 Strategy Paper 19: Energising Manufacturing Sector
19.4 Manufactured goods continue to dominate export with a share of 81.8% of total
export or RM636.7 billion in 2015. The export of manufactured goods is estimated to chart
an annual average growth of 5.4% in the Tenth Plan period. In addition, investment in
manufacturing accounted for RM159.1 billion of total approved investment from 2011 to
2014. Of this amount, domestic direct investment (DDI) represented 42.8% and foreign
direct investment (FDI) 57.2%. A total of 348,495 new jobs were created from these
investments out of which 75% was in the managerial, technical and supervisory, and skilled
categories. The sector is expected to provide 2.5 million jobs, representing 18% of total
employment in 2015.
Exhibit 19-1 Major Indicators of the Manufacturing Sector, 2010-2020
Indicator 2010 2015 2020 Tenth Plan Eleventh Plan
Achieved Target Contribution of manufacturing sector to GDP (RM billion in 2010 prices)
192.5 243.9 312.5 1,110.9 1,417.3
Annual Growth Rate (%) 12.1 4.7 4.4 4.8 5.1
Share to GDP (%) 23.4 23.0 22.1 23.1 22.5
Total exports of manufactured goods (RM billion in current prices)
489.6 636.7 812.8 2,801.3 3,677.9
Share to Total Export (%) 76.6 81.8 83.4 76.4 82.8 Average Annual Growth Rate (%) Share to Total Employment (%) 17.0 18.0 18.2 3.9 2.5 Note: 2015 numbers are estimated and 2020 numbers are forecasted Source: Economic Planning Unit and Department of Statistics Malaysia
19.5 The factors that also contributed to the growth of the sector, despite the global
economic slowdown in 2012, are as follows:
strong demand from ASEAN countries
improved demand from the European Union (EU) especially Belgium, Germany, Italy,
Netherlands and Poland
higher imports by FTA partners such as Australia, Chile, People’s Republic of China,
New Zealand and the Republic of Korea
Small and Medium Enterprises in the Manufacturing Sector
19.6 Based on the Economic Census 2011, from a total of 662,939 establishments, 97.3%
or 645,136 were in the small and medium enterprises (SMEs) category. SMEs in the
manufacturing sector accounted for 37,861 establishments or 5.9%, with 57% of them in the
micro-enterprise category, as shown in Exhibit 19-2. In 2013, SMEs in the manufacturing
sector contributed 23.7% out of the total SME contribution to GDP and 48.5% of exports

Eleventh Malaysia Plan 19-3 Strategy Paper 19: Energising Manufacturing Sector
from SMEs. The average labour productivity of SMEs in this sector was at RM63,154 per
worker, above the overall average SME productivity of RM50,818 per worker in 2011-2013.
Exhibit 19-2 SME in the Manufacturing Sector
Source: Economic Planning Unit and Department of Statistics Malaysia
III. ISSUES AND CHALLENGES
19.7 Issues affecting the manufacturing sector are low productivity, pervasiveness of low
value add labour-intensive industries, lack of innovation and competitiveness, and weak
enablers.
Productivity
19.8 Labour productivity for the manufacturing sector is estimated to increase to
RM98,768 per worker in 2015 from RM94,423 per worker in 2011. However, based on the
Productivity Report 2013/2014 by Malaysia Productivity Corporation (MPC), the overall
growth of Malaysia labour productivity at 2.3% is still low compared with emerging
countries such as People’s Republic of China (7.1%), Thailand (2.5%) and India (2.4%),
reflecting reduced competitiveness in the global market. Among the manufacturing
subsectors, only four surpassed the productivity level of RM100,000 per worker namely,
tobacco, refined petroleum, chemicals and chemical products as well as palm oil-based
industry, as shown in Exhibit 19-3.

Eleventh Malaysia Plan 19-4 Strategy Paper 19: Energising Manufacturing Sector
Exhibit 19-3 Manufacturing Productivity and Wage Performance
Source: Productivity Report 2013/2014, Malaysia Productivity Corporation
Low Value Add Labour Intensive Industries
19.9 In line with the Government’s objectives to attract foreign investments and create
jobs in the 1970s and 1980s, the inflow of FDI was largely in the labour-intensive
manufacturing sector. Most of the jobs created through these FDI were in low value-add
industries that required low-skilled labour, which in later years led to high dependency on
foreign workers. This scenario has resulted in low automation and low demand for skilled
workers as reflected by the reduction in the composition of skilled workers from 26.3% in
2011 to 24.7% in 2013.
Dependency on Low-Skilled Foreign Workers
19.10 In 2014, 36% of foreign workers were employed in the manufacturing sector, of
which 74% were employed in seven subsectors namely E&E, wood and furniture, plastic,
food processing, rubber-based, textiles and fabricated metal. The easy access to low-skilled

Eleventh Malaysia Plan 19-5 Strategy Paper 19: Energising Manufacturing Sector
foreign workers discouraged manufacturers from innovating and investing in automation
and technology upgrade for higher productivity.
Talent Gaps
19.11 The shift towards producing higher value and more complex products requires
skilled, creative and innovative personnel with technological knowledge to constantly
improve products and processes. However, firms face difficulties in hiring skilled and
specialised workers where more than 40% of firms reported vacancies for skilled production
workers1. This is due to lack of talent with the required soft skills and relevant technical
skills. In addition, firms are unable to attract local talent due to the relatively lower
remuneration offered.
Innovation
19.12 Advancements in science and technology have resulted in shorter product cycles,
forcing manufacturers to continuously innovate and upgrade their products to remain
competitive. However, most manufacturers have low capability to innovate due to
inadequate resources, lack of knowledge and resistance towards change. In addition, lack of
understanding on intellectual property (IP) development, risk-averseness, and regulations
and standards that do not cater for evolving industry needs further hamper innovation
efforts.
Resources for R&D
19.13 R&D and innovation involve high risk, long gestation period and high investment to
procure machinery and testing equipment. Thus, manufacturers need to invest upfront to
undertake product and process improvements. However, manufacturers, particularly SMEs,
are often constrained to conduct R&D, design and development, and commercialisation due
to inadequate resources. This issue affects most of the subsectors particularly machinery
and equipment (M&E), transport, chemicals as well as rubber-based and wood-based
industries. The National Survey of Innovation 2012 (NSI-6) indicated that only 38% of
manufacturing firms are innovative.
1 Malaysia Economic Monitor on Modern Jobs 2010

Eleventh Malaysia Plan 19-6 Strategy Paper 19: Energising Manufacturing Sector
Technology Support
19.14 Most R&D efforts are undertaken by the Government and multinational companies
(MNCs). Although there are a number of public research institutions that undertake R&D
activities in specific sectors, research findings by these institutions often do not match
industry requirements. This leads to low returns on public expenditure on R&D and lack
scientific and technology support for industries. Hence, local firms are mostly adopters and
adapters rather than creators of technology2.
Intellectual Property
19.15 There is a lack of understanding on the importance of IPs such as industrial design,
trademark and copyright, to enhance creativity, promote technological innovation and
improve competitive positioning for trade. The need to obtain IP rights is commonly
perceived as a huge upfront cost and an administrative burden to comply. Between 2009
and 2011, from a total of 39,669 manufacturing establishments, there were only 6,055
registered applications for IP, of which only 609 or 10% of the applications were successful.
Industry Gaps between MNCs and SMEs
19.16 One of the measures taken to increase demand for SME products was by developing
domestic linkages with MNCs. However, SMEs are not able to meet the standards or fulfil
the demand of MNCs. This is mainly due to the high cost of acquiring new technology, R&D
and testing. These shortcomings hinder them from participating in the global supply chain
through MNCs, resulting in weak domestic linkages. The Malaysia Economic Monitor Report,
June 2014 by the World Bank, cited that the limited domestic linkages contributed to the
low value added of E&E. The report also quoted that MNCs in Malaysia source less than 40%
of their inputs from domestic firms, compared to 46% in Vietnam and 82% in People’s
Republic of China.
Risk-Averseness
19.17 Attitude and mindset of manufacturers who are risk averse further impede
innovation initiatives. Generally, manufacturers are reluctant to change their current
operations due to fear of disruption to production and comfortable with their current
business operations. In addition, product innovation usually involves high risks, high cost
and long duration, thus making it unaffordable and less attractive.
2 Study on Technology Innovation Capabilities of Malaysia-Owned Companies, 2012
Eleventh Malaysia Plan 19-7 Strategy Paper 19: Energising Manufacturing Sector
Competitiveness
19.18 The decreasing share of Malaysia’s world trade from 1.5% in 2000 to 1.2% in 2013
indicates the decline in the level of trade competitiveness. The share of the manufacturing
sector to the national export basket also declined from 83.3% in 2000 to 76.7% in 2014. The
decline is partly due to the increase in market competition following to the removal of trade
barriers through FTAs. The decline is worsened by the low utilisation of FTAs and the
increasing global requirements of high compliance to standards. In addition, with the
delisting of Malaysia from the European Union Generalised System of Preference (EU GSP)
with effect from 1 January 2014, local exporters faced stiffer competition to penetrate the
European market.
Diversification of Exports
19.19 Using the economic complexity framework, as shown in Box 19-1, the diversification
of exports increased rapidly from 490 products in 1980 to 750 products in 1990 but
stagnated at 760 products in both 2000 and 2010. In addition, the composition of the
exports changed from primarily raw materials to manufactured products, indicating a move
towards more complex products. Exports with RCA>1 also increased from 56 in 1980 to 126
in 1990. However, in the last two decades, the manufacturing sector has not evolved to
respond to the increasing global demand for more complex and sophisticated products. The
exports with RCA>1 increased moderately from 111 in 2000 to 123 in 2010. This implies that
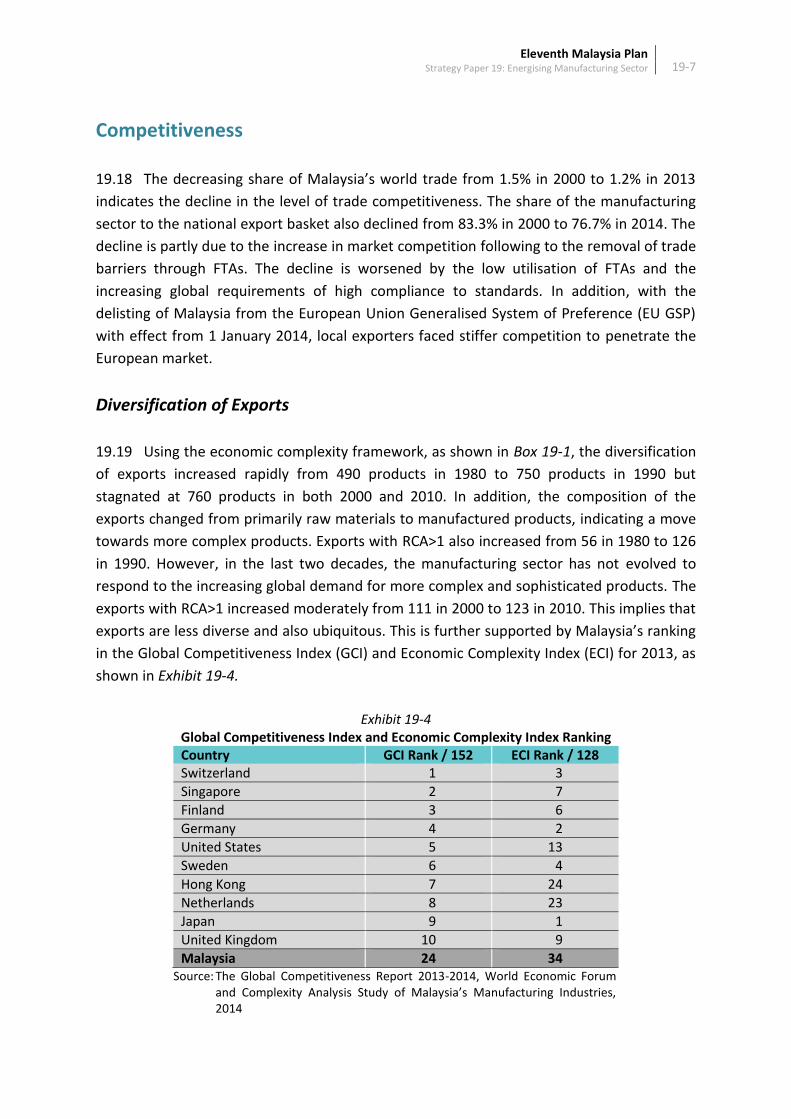
exports are less diverse and also ubiquitous. This is further supported by Malaysia’s ranking
in the Global Competitiveness Index (GCI) and Economic Complexity Index (ECI) for 2013, as
shown in Exhibit 19-4.
Exhibit 19-4 Global Competitiveness Index and Economic Complexity Index Ranking Country GCI Rank / 152 ECI Rank / 128 Switzerland 1 3
Singapore 2 7
Finland 3 6
Germany 4 2
United States 5 13
Sweden 6 4
Hong Kong 7 24
Netherlands 8 23
Japan 9 1
United Kingdom 10 9
Malaysia 24 34 Source: The Global Competitiveness Report 2013-2014, World Economic Forum
and Complexity Analysis Study of Malaysia’s Manufacturing Industries, 2014

Eleventh Malaysia Plan 19-8 Strategy Paper 19: Energising Manufacturing Sector
Box 19-1 Economic Complexity Index (ECI)
The Economic Complexity Index (ECI) summarises the complexity of a country’s export basket.
International trade data was used to observe the network that connects countries with the products
they make. ECI uses this trade network to measure the extent of productive capabilities or “know-
how” in the export basket as well as to identify less ubiquitous and more diverse products. Hence,
having a high ECI is an indicator of a high income country.
This is based on the framework of economic complexity and the product space developed by Cesar
A. Hidalgo (Massachusetts Institute of Technology Media Lab) and Ricardo Hausmann (Harvard
University's Kennedy School of Government), clearly outline the opportunity space and the risks
involved with different product diversification options. The framework shows that advanced
countries produce or export many products with RCA>1 (high diversification) and products that are
produced or exported by few countries (low ubiquity). On the other hand, less developed countries
produce or export few products with RCA>1 (low diversification) and products that are produced or
exported by many countries (high ubiquity). This can be summarised as follows:
Some countries make almost every product (they are diversified)
Other countries make only a few products (they are not diversified)
Some products are made by only a few countries (they are rare)
Other products are made by almost all countries (they are ubiquitous)
The products that are ubiquitous are made both by diversified and non-diversified countries
The products that are rare tend to be made only by countries that are diversified
Policy Reforms
19.20 There are several policy reforms undertaken to strengthen the labour market and to
remove market distortions in order to increase industry competitiveness. Minimum wage
was introduced to strengthen labour market and to encourage transition from labour
intensive to capital intensive industries. In addition, subsidy in energy prices is being
rationalised gradually to remove market distortions. These policy reforms have caused a
temporary spike in the price of inputs of production and thus affect the competitiveness.
Utilisation of FTA
19.21 There are increasing numbers of FTAs signed. However, the utilisation rate of most
of these FTAs is low, at an average of 40% as compared to 45% by other Asian firms. This
low utilisation is partly due to lack of awareness of FTAs as only 30% of firms understand the

Eleventh Malaysia Plan 19-9 Strategy Paper 19: Energising Manufacturing Sector
benefits of FTAs. The utilisation tends to be driven primarily by one or two major sectors
and a few large firms3. For example, the utilisation rate of Malaysia-Japan Economic
Partnership Agreement in 2012 was only 20%. The inability to utilise FTAs resulted in
manufacturers focusing in the domestic market and forgoing opportunities in the FTA
partner markets.
Compliance to Standards
19.22 World markets are progressively moving towards green production and
environmentally safe products. Compliance to standards requires investment in testing and
certification. However, due to lack of awareness, capital and knowledge, difficulties are
faced to comply with global environmental requirements. Failure in adhering to
requirements result in the goods not being able to be exported.
Enablers
19.23 Enablers are among the determinants of the attractiveness of a nation as an
investment destination. Key enablers namely logistics, industrial estates, broadband, and
financing help manufacturers to grow and become more competitive in the market.
However, there are challenges in the provision of these enablers.
Logistics Support
19.24 Inefficiency and high costs of logistics and trade facilitation cause Malaysia to fall
behind some of the ASEAN countries such as Indonesia, Singapore and Thailand, as shown in
Exhibit 19-5. Costs related to customs clearance, land transportation and goods handling in
Malaysia is higher compared to these countries.
Exhibit 19-5 Logistics Performance Index: Selected Countries, 2012
Country Malaysia Singapore Thailand Indonesia
Export Time and Cost/Port or Airport Supply Chain
Distance (km) 73 130 300 81
Lead time (days) 3 2 2 2
Cost (USD) 285 178 707 415
Export Time and Cost/Land Supply Chain
Distance (km) 172 25 300 104
Lead time (days) 2 2 2 3
Cost (USD) 298 250 250 309
Source: Logistics Performance Index Results 2012, World Bank
3 The Study to Assess the Impact of the Implementation of FTAs on Malaysian Industries and Consumers, 2014

Eleventh Malaysia Plan 19-10 Strategy Paper 19: Energising Manufacturing Sector
Infrastructure
19.25 There are over 600 Industrial Estates (IEs), many of which do not have adequate
facilities. They are also not well maintained due to the absence of dedicated park managers
and limited resources of the local authorities. Accessibility to and coverage of broadband is
still inadequate in many industrial areas. This hinders the use of ICT among manufacturers
particularly SMEs, to increase their efficiency and for better market access. Additional
challenges confront manufacturers in Sabah and Sarawak. Inadequate infrastructure has
resulted in low connectivity and poor quality of utilities. Manufacturers in these states also
face greater challenges in trade facilitation, difficulty in registering businesses and limited
market access.
Access to Financing
19.26 Financing plays an important part in supporting firms to innovate, scale-up and
adopt efficient production processes. However, most private financial institutions are
reluctant to provide financing due to risk aversion and lack of expertise to evaluate the
viability of new technologies. The requirement for collateral, particularly from new firms
and start-ups, is also a barrier to access financing.
IV. ELEVENTH MALAYSIA PLAN, 2016-2020: WAY FORWARD
19.27 In the Eleventh Plan, focus will be given on high-end manufacturing activities that
capture higher domestic value add, shift towards more complex and diversified products,
and generate high-paying jobs. Initiatives will be taken to enhance the quality of
manufactured products, particularly from SMEs, and to expand into new and regional
markets leveraging on the AEC and FTAs.
19.28 The manufacturing sector is targeted to grow at an annual rate of 5.1% during the
Plan period and contribute 22.1% to GDP in 2020, as shown in Exhibit 19-1. During the Plan
period, its share to total exports is expected to achieve 82.8% or RM3.68 trillion with labour
productivity growing at an average annual growth rate of 2.6%. The sector is targeted to
provide 18.2% of total employment by 2020.
19.29 Ten strategies have been identified to transform the manufacturing sector, as shown
in Exhibit 19-6. These strategies are clustered into five policy focus areas, namely:

Eleventh Malaysia Plan 19-11 Strategy Paper 19: Energising Manufacturing Sector
moving towards complex and diverse products
enhancing productivity through automation
stimulating innovation-led growth
strengthening growth enablers
ramping up internationalisation
Exhibit 19-6 Strategy Canvas for Manufacturing Sector
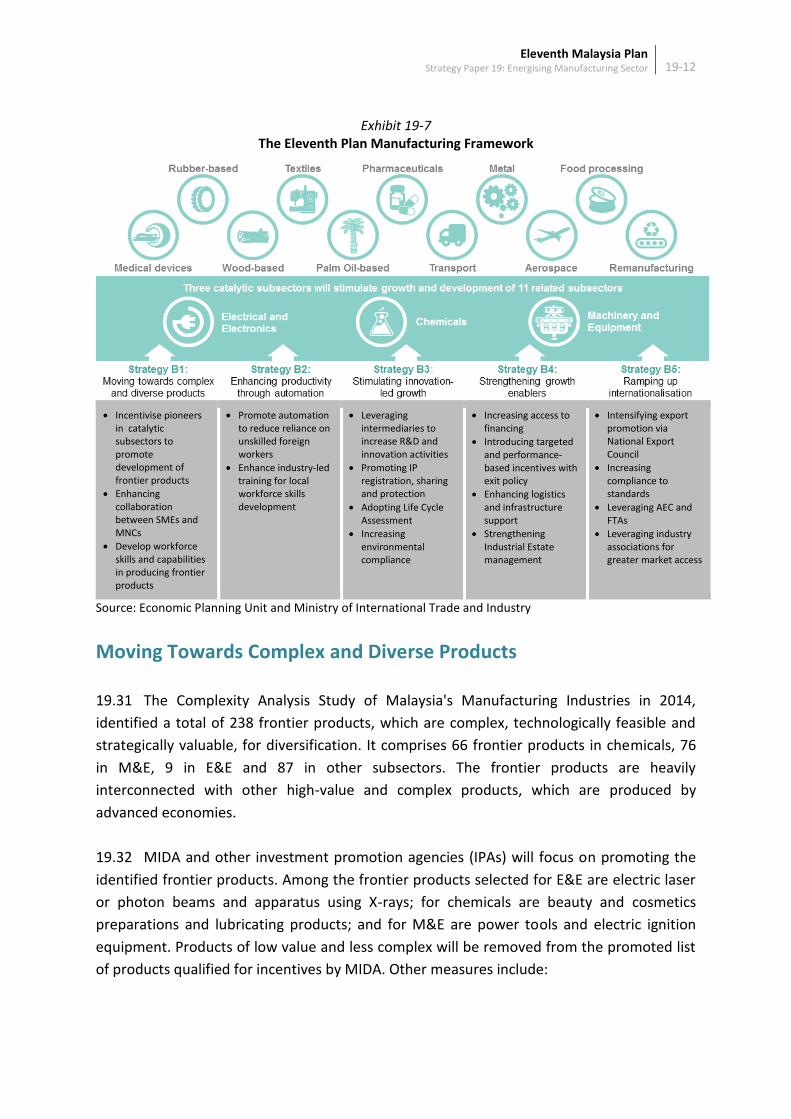
19.30 Three catalytic subsectors, namely chemicals, E&E, and M&E as well as two
subsectors with high potential growth namely aerospace and medical devices will drive the
manufacturing sector growth. This is due to their strong inter-linkages to other subsectors
as well as their capacity to support overall manufacturing development. In addition,
manufacturers in these subsectors have greater potential and strong capabilities to diversify
production towards more complex and high value-added products, as shown in Exhibit 19-7.
A move towards strategic diversification will be implemented to increase competitiveness
particularly in export. Diversification will be focused on complex and high-value products,
which are referred to as frontier products.
Eleventh Malaysia Plan 19-12 Strategy Paper 19: Energising Manufacturing Sector
Exhibit 19-7 The Eleventh Plan Manufacturing Framework
Incentivise pioneers
in catalytic subsectors to promote development of frontier products
Enhancing collaboration between SMEs and MNCs
Develop workforce skills and capabilities in producing frontier products
Promote automation to reduce reliance on unskilled foreign workers
Enhance industry-led training for local workforce skills development
Leveraging intermediaries to increase R&D and innovation activities
Promoting IP registration, sharing and protection
Adopting Life Cycle Assessment
Increasing environmental compliance
Increasing access to financing
Introducing targeted and performance-based incentives with exit policy
Enhancing logistics and infrastructure support
Strengthening Industrial Estate management
Intensifying export promotion via National Export Council
Increasing compliance to standards
Leveraging AEC and FTAs
Leveraging industry associations for greater market access
Source: Economic Planning Unit and Ministry of International Trade and Industry
Moving Towards Complex and Diverse Products
19.31 The Complexity Analysis Study of Malaysia's Manufacturing Industries in 2014,
identified a total of 238 frontier products, which are complex, technologically feasible and
strategically valuable, for diversification. It comprises 66 frontier products in chemicals, 76
in M&E, 9 in E&E and 87 in other subsectors. The frontier products are heavily
interconnected with other high-value and complex products, which are produced by
advanced economies.
19.32 MIDA and other investment promotion agencies (IPAs) will focus on promoting the
identified frontier products. Among the frontier products selected for E&E are electric laser
or photon beams and apparatus using X-rays; for chemicals are beauty and cosmetics
preparations and lubricating products; and for M&E are power tools and electric ignition
equipment. Products of low value and less complex will be removed from the promoted list
of products qualified for incentives by MIDA. Other measures include:

Eleventh Malaysia Plan 19-13 Strategy Paper 19: Energising Manufacturing Sector
Ministry of International Trade and Industry (MITI) will facilitate producers of
frontier products, industry associations and academic institutions to participate and
invest in the development of centre of excellences in frontier industries
MIDA will include the frontier products in their promoted list for incentives to
encourage manufacturers to diversify into these products
SME Corporation Malaysia (SME Corp.) will strengthen partnerships between SMEs
and large companies and emulate successful models for frontier products
a task force for chemicals and M&E subsectors will be established to access potential
for collaborative research similar to the function of Collaborative Research in
Engineering, Science & Technology (CREST) Centre
MATRADE will encourage MNCs to assist promising SME suppliers in frontier
industries gain access to untapped export markets
leveraging the Industry Skills Council (ISC), MITI will bridge skills gaps by
collaborating with other relevant ministries and agencies including industry
associations, to outline a skills framework in frontier industries
scope of existing funds under various agencies will be expanded to encourage SMEs,
in particular start-ups, to venture into frontier industries
Enhancing Productivity Through Automation
19.33 In the Eleventh Plan, industries will be encouraged to increase productivity through
automation, reduce reliance on foreign workers and develop more high skilled workers
through industry-led training.
Promoting Automation
19.34 Greater automation and technology utilisation to increase productivity will be
promoted to reduce the reliance on low-skilled foreign workers. Developmental and
financial assistance will be continued to encourage automation of production processes. The
scope of existing financial assistance will be expanded to include acquiring technology,
training, reskilling and upskilling for the purpose of operation and maintenance of
machinery.
Reducing Ease of Getting Foreign Workers
19.35 A series of measures will be undertaken to reduce the ease of getting unskilled
foreign workers to encourage automation in production. Among the measures that will be
undertaken are:

Eleventh Malaysia Plan 19-14 Strategy Paper 19: Energising Manufacturing Sector
increasing the rate of foreign worker levy gradually in the manufacturing sector
imposing a cap on foreign workers where manufacturers who operate within the cap
will be given priority for specialised and performance-based incentives
tightening inflow of foreign workers through monitoring of firms applying for
manufacturing licences and incentives as well as imposing harsher penalties on
manufacturers who employ illegal foreign workers
increasing the minimum wage gradually to reduce demand for foreign workers and
encourage greater automation
Enhancing Industry-Led Skills Training
19.36 Measures towards automation and higher productivity will be supported by
enhancement of industry-led skills training through greater collaboration with industry
experts and training institutes. The measures to be undertaken are aligned with the shift
towards technical and vocational education and training (TVET). The measures that will be
introduced are:
encouraging manufacturers to collaborate with skills development centres to equip
and upgrade the training facilities with up-to-date equipment and machinery to
ensure workforce readiness
leveraging ISC to strengthen, develop and roll out new and relevant syllabus specific
to emerging industry requirements through identification of areas and profiling of
human capital
encouraging manufacturers to provide longer periods of internships for students. A
structured internship programme with industries will be introduced to produce
talent that are industry-ready upon course completion
promoting re-skilling and up-skilling of skilled workers to upgrade their level of
competency and to acquire high-paying jobs
Stimulating Innovation-Led Growth
19.37 Product and process innovation are essential for manufacturing sector growth and
competitiveness. Innovation has to be perceived as an investment rather than cost as it
increases productivity. In this regard, manufacturers will be encouraged to:
leverage intermediaries to increase R&D and innovation activities
leverage industry associations and chambers of commerce to drive innovation and
productivity
promote IPR sharing and protection
adopt life cycle assessment
streamline industry development to multilateral environmental commitments

Eleventh Malaysia Plan 19-15 Strategy Paper 19: Energising Manufacturing Sector
Leveraging Intermediaries to Increase R&D and Innovation Activities
19.38 Manufacturers will be encouraged to undertake R&D and innovation activities to
improve their products and processes by leveraging existing research institutions through
intermediaries such as Steinbeis Malaysia Foundation (Steinbeis), SIRIM-Fraunhofer and
PlaTCOM Ventures Sdn. Bhd. These intermediaries will engage relevant experts to provide
solutions for manufacturing problems and strengthen collaboration between manufacturers
and research institutions. The collaboration will, reduce the cost of conducting R&D,
increase technical knowledge as well as improve work processes. In addition, the 1-
InnoCERT programme by SME Corp. will be further promoted to complement the
collaboration efforts by the intermediaries.
Leveraging Industry Associations and Chambers of Commerce to Drive
Innovation and Productivity
19.39 Industry associations and chambers of commerce will be leveraged as the platform
to spur innovation and adopt technology to improve productivity. This platform will be used
to disseminate information on industry-related policies, obtain feedback and conduct
industry specific training. In addition, information on improvement tools such as Lean Six
Sigma, A3 Problem Solving, Total Quality Management and Enterprise Resource Planning
can also be shared.
Promoting IPR Sharing and Protection
19.40 Collaboration between research institutions and manufacturers will be further
strengthened through promotion of IPR sharing and protection. Clear and transparent
guidelines on IP sharing and protection will be developed by research institutions to protect
the interests and ensure fair returns to researchers and manufacturers. These guidelines will
further encourage public research institutions to undertake collaborative research with the
private sector. In addition, a ‘pay per use’ mechanism will be introduced in public
laboratories and R&D facilities to reduce R&D costs to manufacturers and smaller research
institutions, and increase returns on investment for the facilities.
Adopting Life Cycle Assessment
19.41 The adoption of sustainable manufacturing processes, through the use of life cycle
assessment (LCA), will be promoted, in line with the global trend towards sustainable
consumption and production. Towards this end, manufacturers will be encouraged to use
green production processes to recover materials from waste thus reducing the use of raw

Eleventh Malaysia Plan 19-16 Strategy Paper 19: Energising Manufacturing Sector
materials in production. The use of LCA will catalyse the development of the
remanufacturing industry as a new source of economic growth.
Streamlining Industry Development to Multilateral Environmental
Commitments
19.42 Industry development will be streamlined to multilateral environmental and
international commitments to ensure products comply with international standards and to
overcome non-tariff barriers. The following measures will be taken:
adopting a participatory approach through early engagement with relevant
stakeholders in setting national goals and priorities, in all international negotiations
to ensure national interests are protected
developing a close collaboration, cooperation and communications system between
Government agencies and manufacturers to increase compliance with multilateral
environmental commitments
adopting the sustainable consumption and production (SCP) approach in which
policies, strategies, rules and regulations with regard to manufacturing will
incorporate the three pillars of sustainable development namely economy, social
and environment
increasing international strategic alliances with developed economies especially in
the field of technology, innovation and R&D to ensure environmental requirement
compliance as well as reduce compliance-related costs
Strengthening Growth Enablers
19.43 Financing, incentives, logistics services and IEs are key enablers of growth for the
manufacturing sector. In this regard, strategies identified to enable the growth of the sector
are through increasing access to financing, introducing performance-based incentives with
exit policy and enhancing physical infrastructure support.
Increasing Access to Financing
19.44 Access to financing to support innovation will be improved by increasing the
confidence level of financial institutions on innovation process and risks. These institutions
will be encouraged to establish independent panel of experts to evaluate business and
innovation projects in new areas. Loan procedures will be standardised, demand for
collateral reduced, and IPs monetised and recognised to increase access to financing. These
efforts will be further supported through:

Eleventh Malaysia Plan 19-17 Strategy Paper 19: Energising Manufacturing Sector
PARTNER Programme by The Association of Banks in Malaysia which simplifies the
process of securing loans particularly for SMEs
One Referral Centre (ORC) as a single portal under the SME Corp. to consolidate
information on the availability of financial support from banks, financial institutions
and government agencies
BNMLINK, acts as a centralised point of contact to provide a rapid and effective
response related to financial issues
Introducing Performance-Based Incentives
19.45 MIDA and other IPAs will introduce performance-based incentives, which are
incentives with clear key performance indicators, validity period and exit policy to increase
productivity and spur innovation among manufacturers. Incentives will be designed to
attract quality investments, promote automation, increase the number of multi-skilled
workers and enhance sustainable manufacturing.
Enhancing Logistics and Infrastructure Support
19.46 Logistics and trade facilitation ecosystem will be enhanced to optimise the
movement of goods, thus reducing overall product cost as well as increasing productivity
and competitive advantage. Virtual selling platform, which adopts e-commerce features, will
be promoted to match logistics supply and demand to encourage SMEs to leverage online
retails and gain access to a wider market.
19.47 IEs will be developed with a shift in perspective from real estate development to a
key enabler for long-term economic growth. A full lifecycle costing approach will be adopted
to ensure viability and sustainability of the IEs. In this respect, MITI will undertake the
following measures:
design a self-sustaining park management model to strengthen the current
governance of IEs. The model will include, among others, roles and responsibilities of
park managers as customer service providers to facilitate tenants in the IEs. Park
managers will be responsible to plan and provide adequate facilities and utilities
such as roads, electricity, water and broadband infrastructure as well as security
services and promotion
develop a centralised repository to house information on IEs including location,
physical attributes and land availability. This repository will be used by MIDA to
attract investments and facilitate investors in locating their businesses

Eleventh Malaysia Plan 19-18 Strategy Paper 19: Energising Manufacturing Sector
Ramping Up Internationalisation
19.48 As a small and open economy, the country’s growth trajectory is tied to trade
performance. Continuous efforts will be undertaken to explore and expand into new
markets in order to be among the preferred trading partners. Measures to be undertaken
include:
intensifying export promotion
increasing compliance to standards
capitalising on AEC and FTAs
leveraging industry associations for greater market access
enhancing SME collaboration with MNCs
Intensifying Export Promotion
19.49 Moving forward, MATRADE and other related agencies will intensify export
promotion through the following strategies:
leverage the National Export Council to address the gaps and challenges in the
export supply chain
continue Mid-Tier Companies Development Programme to accelerate export growth
and to strengthen the core business functions of mid-tier companies with an average
annual revenue of RM20 million to RM500 million. This will facilitate access to new
markets through global networks, distributors, and technology partners. About 50
mid-tier companies are expected to participate in this programme each year until
2020
continue Going Export (GoEx) Programme to internationalise SMEs and raise their
export contribution from 15.7% in 2010 to 25.0% by 2020
engage experts to gather information on overseas markets to help local firms to
participate in export
Increasing Compliance to Standards
19.50 More standards and relevant regulations will be made mandatory to ensure
manufacturers remain competitive and are able to penetrate global markets. The following
strategies will be undertaken:
increasing collaboration between Department of Standards Malaysia and
manufacturers to identify relevant international standards to be adopted by the local
industry

Eleventh Malaysia Plan 19-19 Strategy Paper 19: Energising Manufacturing Sector
adopting sustainable production practices that enable manufacturers to produce
eco-friendly products to meet demand for green products particularly, in the
European market
Capitalising on AEC and FTAs
19.51 The onset of AEC in 2015 creates a positive environment for trade and investment
and opening up the market for Malaysian businesses to 620 million people in the region.
One of the pillars of AEC is a ‘single production base’ where ASEAN can be the
manufacturing hub of products to serve ASEAN and its trading partners. AEC is also
expected to address other issues such as movement of skilled labour, taxation and IP
protection to support the single production base concept. The AEC Blueprint 2015 lays the
foundation for further deepening of economic integration of ASEAN beyond 2015. MITI as a
lead agency will drive the following initiatives:
promoting greater intra-ASEAN industry linkages to strengthen supply chain and
production networks to maximise opportunities in ASEAN and other greenfield
markets
encouraging cross-border investments by leveraging sub-regional growth triangles to
promote growth in border areas such as Serikin in Sarawak-Kalimantan and Padang
Besar in Perlis-Songkhla
leveraging existing Malaysian companies in People’s Republic of China and India by
collaborating with their State Owned Enterprises
increasing awareness on the benefits of FTAs to increase the utilisation rate of FTAs
as well as to explore possibilities for future FTAs
Leveraging Industry Associations for Greater Market Access
19.52 Industry associations will be encouraged to play a greater role to facilitate
information sharing, market accessibility, technology upgrade and human resource
development inter- and intra-subsectors. This will strengthen the industry associations,
enabling them to lead their industry in the global arena. The associations will be encouraged
to:
form smart partnerships with other industry associations in foreign countries, where
manufacturers will gain valuable information on market trends, get advice and
know-how from experts on standards and regulations, gain business opportunities
and discuss industry related issues including non-tariff barriers

Eleventh Malaysia Plan 19-20 Strategy Paper 19: Energising Manufacturing Sector
promote consortium approach among members to pool resources and market
intelligence, widen range of products, knowledge sharing and enhance networking to
improve export capabilities as well as overcome costs and risks to penetrate foreign
markets
Enhancing SME Collaboration with MNCs
19.53 Stronger support will be provided for SMEs to increase their capacity and capability.
In addition, MNCs will be encouraged to nurture and guide the SMEs to become their
suppliers and vendors. Among strategies to be undertaken include:
expanding the factory-in-factory concept, where SMEs are given the opportunity to
operate within MNC facilities
imposing tighter conditions for MNCs to source for inputs locally, particularly
through SMEs
strengthening the Vendor Development Programme to nurture SMEs to grow from
second-tier suppliers to become first-tier suppliers and eventually become Own-
Brand-Manufacturers and Own-Design-Manufacturers
V. CONCLUSION
19.54 In the Eleventh Plan, the manufacturing sector will be restructured to remain
competitive. Strategic initiatives will be undertaken to produce more complex, diversified
and high value products through the development of catalytic subsectors. Firms will be
encouraged to increase productivity through automation and innovation; implement
sustainable production practices and leverage industry associations to be more competitive.
Focus will shift towards quality, integrated sectoral governance, performance-based
incentives and further promoting exports.
Related Documents