Graduate Theses, Dissertations, and Problem Reports 2009 Introduction of programmable logic controller in industrial Introduction of programmable logic controller in industrial engineering curriculum engineering curriculum Atul Arvind Phadke West Virginia University Follow this and additional works at: https://researchrepository.wvu.edu/etd Recommended Citation Recommended Citation Phadke, Atul Arvind, "Introduction of programmable logic controller in industrial engineering curriculum" (2009). Graduate Theses, Dissertations, and Problem Reports. 4513. https://researchrepository.wvu.edu/etd/4513 This Thesis is protected by copyright and/or related rights. It has been brought to you by the The Research Repository @ WVU with permission from the rights-holder(s). You are free to use this Thesis in any way that is permitted by the copyright and related rights legislation that applies to your use. For other uses you must obtain permission from the rights-holder(s) directly, unless additional rights are indicated by a Creative Commons license in the record and/ or on the work itself. This Thesis has been accepted for inclusion in WVU Graduate Theses, Dissertations, and Problem Reports collection by an authorized administrator of The Research Repository @ WVU. For more information, please contact [email protected].

Welcome message from author
This document is posted to help you gain knowledge. Please leave a comment to let me know what you think about it! Share it to your friends and learn new things together.
Transcript

Graduate Theses, Dissertations, and Problem Reports
2009
Introduction of programmable logic controller in industrial Introduction of programmable logic controller in industrial
engineering curriculum engineering curriculum
Atul Arvind Phadke West Virginia University
Follow this and additional works at: https://researchrepository.wvu.edu/etd
Recommended Citation Recommended Citation Phadke, Atul Arvind, "Introduction of programmable logic controller in industrial engineering curriculum" (2009). Graduate Theses, Dissertations, and Problem Reports. 4513. https://researchrepository.wvu.edu/etd/4513
This Thesis is protected by copyright and/or related rights. It has been brought to you by the The Research Repository @ WVU with permission from the rights-holder(s). You are free to use this Thesis in any way that is permitted by the copyright and related rights legislation that applies to your use. For other uses you must obtain permission from the rights-holder(s) directly, unless additional rights are indicated by a Creative Commons license in the record and/ or on the work itself. This Thesis has been accepted for inclusion in WVU Graduate Theses, Dissertations, and Problem Reports collection by an authorized administrator of The Research Repository @ WVU. For more information, please contact [email protected].

Introduction of Programmable Logic Controller in
Industrial Engineering Curriculum
Atul Arvind Phadke
Thesis submitted to the
College of Engineering and Mineral Resources at West Virginia University
in partial fulfillment of the requirements for the degree of
Master of Science
in
Industrial Engineering
Dr. Rashpal S. Ahluwalia, Ph.D., Chair Dr. Robert C. Creese, Ph.D.
Dr. Aliakbar Afshari, Ph.D
Department of Industrial and Management Systems Engineering
Morgantown, West Virginia 2009
Keywords: PLC, Training, Course Design, Traffic Light Control,
Temperature Control

ABSTRACT
Introduction of Programmable Logic Controller in Industrial
Engineering curriculum
Atul Arvind Phadke
Recent trends in process control and industrial automation scenarios have resulted
in the emergence of many pioneering techniques that have revolutionized the
manufacturing industry. In order to maintain quality and precision, advances have been
associated with the increasing use of microprocessors in process control applications.
Most of the industrial process control systems utilize Programmable Logic Controllers
(PLC). Also due to the increase in internet usage and recent innovations in PLC software,
remote monitoring and PLC control of process through the internet is also a recent trend.
This thesis presents course/lab material for integration in the Industrial Engineering
curriculum. The course/lab content was designed to improve the student’s knowledge and
to broaden the industrial engineering curriculum at West Virginia University (WVU).
This thesis proposes the use of inexpensive T100MD+ PLCs. A traffic light control
system was developed to introduce the fundamental concepts of Boolean algebra and
real-time control. A series of control exercises can be carried on the traffic light system.
A temperature sensitive system was also developed. Students can test various PID control
strategies on this hardware/software platform. Students will also have the ability to
control the process via the internet.

iii
ACKNOWLEDGEMENT
I would like to thank my advisor Dr. Rashpal S. Ahluwalia for his continued
support, guidance, and encouragement during the course of this research. I also wish to
thank my committee members Dr. Robert C. Creese and Dr. Aliakbar Afshari for their
valuable advice and support.
Special thanks to Ms. Michelle Moore for technical editing and my colleagues
who helped me in many ways. Finally, I owe to my parents inexpressible words of
gratitude for their constant support and blessings in enabling my success and happiness in
all my pursuits and endeavors in life. I would also like to thank the department of
Industrial and Management Systems Engineering at West Virginia University for giving
me a chance to pursue my higher education.

iv
TABLE OF CONTENTS
ABSTRACT........................................................................................................................ ii
ACKNOWLEDGEMENT ................................................................................................. iii
NOMENCLATURE ........................................................................................................... x
1.0 INTRODUCTION ........................................................................................................ 1
1.1 Programmable logic Controllers (PLCs): ................................................................. 2
1.1.1 Definition: .......................................................................................................... 2
1.1.2 Programmable Logic Controller (PLC) hardware and types: ............................ 3
1.1.3 Ladder Logic:..................................................................................................... 5
1.2 Extended PLC with new approach – Fuzzy logic and Expert system: ..................... 7
1.2.1 Fuzzy logic:........................................................................................................ 7
1.2.2 Expert system:.................................................................................................. 11
2.0 OBJECTIVES OF RESEARCH................................................................................. 14
3. 0 LITERATURE REVIEW .......................................................................................... 15
4.0 HARDWARE SETUP ................................................................................................ 21
4.1 Boolean Logic......................................................................................................... 21
4.2 Programmable Logic Controllers............................................................................ 25
4.3 Traffic Light Setup:................................................................................................. 28
4.2.1 T100MD+ PLC card: ....................................................................................... 29
4.1.2 WVU PLC Trainer setup: ................................................................................ 32
4.1.3 Push Buttons: ................................................................................................... 33
4.1.4 Toggle switch................................................................................................... 34
4.1.5 Traffic lights..................................................................................................... 34
4.2 Water Tank Setup ................................................................................................... 36
4.2.1 PTS PLC training station ................................................................................. 37

v
4.2.2 Inputs – Sensors: .............................................................................................. 38
4.2.3 Calibration of Resistant Temperature Detectors (RTD): ................................. 40
4.2.4 Outputs – Heaters and Fan............................................................................... 41
4.2.5 Temperature controller environment setup:..................................................... 42
4.2.6 Final hardware connections: ............................................................................ 43
5.0 SOFTWARE SETUP.................................................................................................. 45
5.1 TRiLOGI introduction: ........................................................................................... 45
5.2 Program Ladder Logic: ........................................................................................... 47
5.3 Process Control ....................................................................................................... 63
5. 3.1 Process control models ................................................................................... 64
5. 3.2 PID control...................................................................................................... 65
5. 3. 3 Controller Design Methods............................................................................ 66
5. 3. 4 PID Computer code........................................................................................ 66
5.4 Flow Diagram: ........................................................................................................ 68
5.5 Determining PID values by using various methods:............................................... 68
5.6 PLC program using PID values: ............................................................................. 74
5.7 PLC Program using IF THEN function: ................................................................. 75
6.0 CONCLUSION AND FUTURE WORK ................................................................... 76
6.1 CONCLUSION....................................................................................................... 76
6.2 FUTURE WORK.................................................................................................... 76
REFERENCES ................................................................................................................. 77
Appendix A: PLC Exercises ............................................................................................. 80
Appendix B: PLC Exercise Solutions............................................................................... 83

vi
LIST OF FIGURES
Figure 1: Logic Circuit Diagram....................................................................................... 24
Figure 2: Components of a PLC ....................................................................................... 27
Figure 3: Limit Switch ...................................................................................................... 27
Figure 4: Latin Tech PLC trainer 1................................................................................... 28
Figure 5: Latin Tech PLC trainer 2................................................................................... 28
Figure 6: PLC T100MD+ Card......................................................................................... 30
Figure 7: WVU PLC Trainer ............................................................................................ 31
Figure 8: WVU PLC Trainer ............................................................................................ 32
Figure 9: Push Buttons...................................................................................................... 33
Figure 10: Toggle Switch.................................................................................................. 34
Figure 11: WVU PLC Trainer Traffic Lights ................................................................... 34
Figure 12: WVU PLC Trainer .......................................................................................... 35
Figure 13: T100 PTS PLC training station ....................................................................... 37
Figure 14: Resistant Temperature Detectors..................................................................... 39
Figure 15: Temperature transmitters................................................................................. 39
Figure 16: Temperature Vs Time Calibration Chart......................................................... 40
Figure 17: Electric water heating rod and fan................................................................... 41
Figure 18: Temperature controlled environment initial setup .......................................... 42
Figure 19: Solid State Relay ............................................................................................. 43
Figure 20: Final water tank setup...................................................................................... 44
Figure 21: Electrical wiring diagram ................................................................................ 48
Figure 22: Ladder Logic diagram ..................................................................................... 48
Figure 23: Initial start up screen ....................................................................................... 49
Figure 24: I/O table inputs ................................................................................................ 49
Figure 25: I/O table output................................................................................................ 49
Figure 26: Trilogi initial screening for creating circuit .................................................... 50
Figure 27: Single ladder with push button to single output .............................................. 50
Figure 28: Serial port communication and testing............................................................ 51
Figure 29: Trilogi server initial screen.............................................................................. 51
vii
Figure 30: Individual login ID access for Trilogi server .................................................. 52
Figure 31: Single input output ladder logic ...................................................................... 52
Figure 32: AND truth table and diagram .......................................................................... 53
Figure 33: AND circuit diagram....................................................................................... 53
Figure 34: AND ladder logic example.............................................................................. 53
Figure 35: OR gate truth table with diagram .................................................................... 54
Figure 36: OR gate circuit diagram .................................................................................. 54
Figure 37: OR gate ladder logic diagram.......................................................................... 54
Figure 38: NOT gate truth table and diagram................................................................... 55
Figure 39: NOT gate circuit diagram................................................................................ 55
Figure 40: NOT gate ladder logic diagram....................................................................... 55
Figure 41: AND-OR ladder logic diagram ....................................................................... 56
Figure 42: Ex-OR gate diagram........................................................................................ 56
Figure 43: EX-OR gate ladder logic diagram................................................................... 57
Figure 44: AND-OR ladder logic diagram ....................................................................... 57
Figure 45: Actual industrial relay ..................................................................................... 58
Figure 46: Relay ladder logic example ............................................................................. 58
Figure 47: Contact relay ladder logic................................................................................ 59
Figure 48: Timer ladder logic diagram ............................................................................. 59
Figure 49: Trilogi I/O timer input..................................................................................... 59
Figure 50: Trilogi timer program ladder logic simulator.................................................. 60
Figure 51: Trilogi PLC ladder logic using timer .............................................................. 60
Figure 52: Single input Counter use ladder logic example............................................... 61
Figure 53: I/O table counters ............................................................................................ 61
Figure 54: Counter example in Trilogi ............................................................................. 62
Figure 55: Counter example simulation program ............................................................. 62
Figure 56: Sequencer ladder logic example...................................................................... 63
Figure 57: Flow diagram of water tank hardware setup ....Error! Bookmark not defined.
Figure 58: Data plot for tuning PID controller ................................................................. 70
Figure 59: Zeigler-Nicholas calculations.......................................................................... 70
Figure 60: Kc = 2 .............................................................................................................. 71

viii
Figure 61: Kc = 4 .............................................................................................................. 72
Figure 62: Kc = 6 .............................................................................................................. 72
Figure 63: Kc = 8 .............................................................................................................. 73
Figure 64: Constant values................................................................................................ 73
Figure 65: PID output ....................................................................................................... 74
Figure 66: Solution 1.a...................................................................................................... 83
Figure 67: Solution 1.b ..................................................................................................... 83
Figure 68: Solution 1.c...................................................................................................... 84
Figure 69: Solution 1.d ..................................................................................................... 84
Figure 70: Solution 1.e...................................................................................................... 84
Figure 71: Solution 2 ........................................................................................................ 85
Figure 72: Solution 3 ........................................................................................................ 87
Figure 73: Solution 4 ........................................................................................................ 87
Figure 74: Solution 5 ........................................................................................................ 88
Figure 75: Solution 6 ........................................................................................................ 89
Figure 76: Solution 7 ........................................................................................................ 90
Figure 77: Solution 9 ........................................................................................................ 92
Figure 78: Solution 10 ...................................................................................................... 93
Figure 79: Solution 11 ...................................................................................................... 94
Figure 80: Solution 12 ...................................................................................................... 95
Figure 81: Solution 13 ...................................................................................................... 95
Figure 82: Solution 14 ...................................................................................................... 97
Figure 83: Solution 15 ...................................................................................................... 98
Figure 84: Solution 16 .................................................................................................... 100

ix
LIST OF TABLES
Table 1: Basic gates table 1......……………………………………………………….....51
Table 2: Basic gates table 2……………………………………………………………...52
Table 3: Input/output components symbols……………………………………………..55
Table 4: Temperature transmitter relation………………………………………….........36

x
NOMENCLATURE
CK - Controller constant
DT - Derivative constant
IT - Integral constant
UK - Ultimate gain value
UP - Ultimate oscillation gain
AC/DC – Alternating Current / Direct Current
ADC – Analog to Digital Control
AI – Artificial Intelligence
CPU – Central Processing Unit
DAC – Digital to Analog Control
DCS – Distributed Control System
E-labs – Electronic Laboratories
FLC – Fuzzy Logic Control
GUI – Graphical User Interface
I/O – Inputs and Outputs
IE – Industrial Engineering
IT – Information Technology
JIC – Joint Industrial Junction
LCD – Liquid Crystal Display
LVDT – Linear Variable Differential Transformer
MRAC - Model Reference Adaptive Control
NASA – National Aeronautics and Space Administration
NCP – Normally Closed Circuit
NOC – Normally Open Circuit
OPC – Open Process Control
PID – Proportional Integral Derivative
PLC - Programmable Logic Controller
PWM – Pulse Width Modulation

xi
R-labs – Remote Laboratories
RTD – Resistance Temperature Detector
RTU – Remote Terminal Units
SCADA – Supervisory Control And Data Acquisition
SSR- Solid State Relay
TBASIC – Tri Beginner’s All-purpose Symbolic Instruction Code
TCP/IP – Transmission Control Protocol/ Internet Protocol
VDC – Direct Current Voltage
V-labs – Virtual Laboratories
WVU – West Virginia University

1
Chapter 1.0
INTRODUCTION
The recent trend in process control has resulted in the emergence of many
pioneering techniques, such as the Programmable Logic Control (PLC) system, Fuzzy
Logic Control (FLC) system, Distributed Controlled System (DCS) and Supervisory
Control And Data Acquisition (SCADA), which have revolutionized manufacturing as
well as other engineering companies. In order to obtain quality and precision, advances
have been associated with the increased use of microprocessors in advanced process
control systems. PLCs, one of the process control systems, have been in demand since the
1980s due to continuous innovations. The most recent trends in processing complex
programs is remotely accessing and controlling the process through the internet. This was
possible only due to advancement in information technology and computer engineering.
Also advances in electronics and mechanical engineering have caused new fields to
emerge like mechatronics and control engineering. The result of the advances in these
fields was innovation in third generation applications such as SCADA with PLC and
TCP/IP connections. Introduction of TCP/IP in SCADA enhanced operations via the
internet, and complex programs transfer via the internet to PLC hardware for process
control was simplified.
Advances in control engineering made the process control field more specific and
accurate. Also with the use of a remotely controlled process system, it became the most
efficiently applicable engineering solution. These systems are mostly used in
manufacturing plants, biohazard labs, and even office environments. Irrespective of the
environment where these systems are used, like error checking, cutting down labor costs,
or automated control, they play a key role either directly or indirectly. These automatic
control systems require less attention once they are set up through controllers. Such
controllers are divided into two major types: computer interfaced controllers (using
Visual Basic, C++, Java) and microprocessor hardware interface controllers (hardware
setups like programmable logic controller, fuzzy logic controller). Now many controllers
are software controlled (using Visual Basic, C++ base) due to their simple graphical user

2
interface (GUI) and custom-based functions. As they are difficult to operate using high
level controllers like FLC and DCS, major manufacturing and engineering companies
still use PLCs with partial SCADA applications.
1.1 Programmable logic Controllers (PLCs):
1.1.1 Definition:
“A control device usually used in industrial control applications that employ the
hardware architecture of a computer and relay ladder diagram language. Inputs to
programmable logic controllers can originate from many sources, including sensors and
the outputs of other logic devices.” [1]. Many factors such as cost, maintenance
frequency, required technical skills, quantity of machines, or processes to control, are
being considered while setting up PLC controllers. Controllers are selected as per user
requirements. These controllers are usually set up with default settings that can be easily
modified as per the user’s need, since PLC’s are rugged, reliable, have a short learning
curve, and have fewer intricacies than relay-based control systems. PLCs’ flexibility
helps them to attach any system rather than just Remote Terminal Units (RTU) due to
their architecture. The control system and its dichotomy provide a clear understanding of
programmable logic controllers and are classified as: Continuous Control Systems or
Logical Control Systems.
In a Continuous Control System the values to be controlled get changed. A
continuous control system is further divided into: Linear and Non-Linear systems. A
Linear Control System uses linear negative feedback to produce a control signal
mathematically based on other variables, with a view to maintaining the controlled
process within an acceptable operating range [2]. A Non-Linear Control System is further
divided into Model Reference Adaptive Control (MRAC) and Fuzzy logic.
In a Discrete Control System the parameters to be controlled are described
depending on their ON-OFF condition. A Discrete Control System is further divided into
conditional and sequential control systems. In a Conditional Control System, a control

3
decision is made considering only present conditions. A conditional system is further
divided into Boolean and Expert Systems. In a Sequential Control System, the controller
must keep track of things that change with time and limit till it processes. A sequential
control system is further divided into Temporal and Event Based systems. Temporal
systems overwrite the data with respect to time. The event-based sequential control
system is an event-dependent system. Depending on the change of events with respect to
time, the control system processes relative data.
Advantages of a programmable logic controller are:
1. Cost effective for complex systems.
2. Flexible and easily controllable for other type of systems.
3. Reliable and can operate untouched for many years.
4. Easy addition of new components.
5. Computational abilities allowing sophisticated control.
Considering the above advantages, all of them were successfully utilized in the PLC
application to demonstrate its usage.
1.1.2 Programmable Logic Controller (PLC) hardware and types:
PLC hardware consists of inputs and outputs with wirings, relays, electrical
wiring diagrams and Joint Industrial Council (JIC) wiring symbols. A simple electrical
wiring setup can be easier than constructing complex setup, hence PLC processors are
used for their construction. This setup can be easily understood using wiring diagrams
and symbolic representation. PLC hardware mainly consists of power supply (commonly
used voltage levels like 24 VDC, 120 VAC), CPU (central processing unit used mainly to
store the ladder logic for the hardware to operate), inputs/outputs (for PLC to monitor and
control the requirements from the hardware) and light indicators (mainly used for output
diagnosis purposes). PLC configuration depends on the type of arrangement used for

4
packing its components. Various types of PLCs as per their packing arrangements are:
Rack, Mini, Shoebox, Micro, and Software.
As defined previously, Control Systems are classified into Continuous and
Discrete. PLCs come under both Continuous as well as Discrete Control System. If a
single light bulb and a single switch are considered to be a system with simple ON-OFF
function, then it can be said to have a Discrete Control System. Continuous systems are
sensitive rather than Discrete Control Systems, which are certain and have simplified
controls. Most of the PLC units use Discrete Control System functions in their inputs and
outputs.
Considering logical functions used for inputs and outputs in PLC, sensors are the
inputs and relays are the outputs in the majority of cases. Inputs coming from sensors
translate the physical phenomena into electrical signals. Typical sensors are listed below:
• Proximity sensors are the sensors that can detect objects nearby without physical
contact.
• Switches
• Potentiometer is a three-terminal resistor with sliding contact.
• Linear variable differential transformer (LVDT)
Important outputs from PLCs are actuators, which are mainly used for functional
purposes. But due to their large current-drawing capacities or safety considerations, these
outputs are connected through relays. Following is the list of outputs generally expected
from PLC:
• Solenoid Valves
• Starter Motors
• Lights
• Servo Motors
• Heaters

5
• Hydraulic or Pneumatic Actuators
Inputs to PLC are from AC or DC supply. Mainly these inputs are:
Sourcing (PNP): Current flows to common ground. Sourcing is used mainly when
different voltages are applied to the input.
Sinking (NPN): Current flows from supply, through output device, and then ground.
Sinking is most generally used, as it has a single source of voltage
input.
1.1.3 Ladder Logic:
Ladder logic is a programming method used for PLCs. This ladder logic is used to
mimic relay logic by generating a magnetic field and turning the switch ON. The ladder
logic in the PLC is a user-defined computer program. The PLC program follows the
concept of logic gates and operates in a similar manner. The criticality of these programs
is dependant on the needs of the system. Most of the ladder logic diagrams are created in
simple ways using symbolic functions, while the complex diagrams are generated using
flow diagrams. Ladder logic is a set of instructions to be sent from the
computer/microprocessor to the PLC hardware for operational purposes. One of the
recent instruction methods is called mnemonic instruction. These instructions are sets of
conversion codes built-in the PLC software. These codes help to understand and interpret
the data that can be provided to the PLC hardware, depending on the input and output
parameters.
A ladder logic diagram works in similar way to a simple ON-OFF switch with
VDC. Ladder logic is connected to inputs and outputs of a PLC hardware circuit,
allowing simple logical decisions. In-build PLC functions extend basic ladder logic to
allow other types of control such as a timer, sequencer, or counter-based control,
depending on the requirement of the user. Ladder logic functions can also be called data
handling and/or logical functions. Data handling functions are basically the functions

6
handling mathematical, conversion, array data, and statistics functions. Logical functions
are comparisons of values within required limits or Boolean logical functions.
Many industrial applications use advanced ladder logic functions, which are not
oriented to simple data values, e.g., list functions. The list functions will allow storage
and recovery of bits and words used for creating ladder logic. These functions are useful
while implementing buffered and queued systems. Similarly the program control
functions can perform tasks that do not execute the simple ladder logic model. These
functions recognize the program to be executed from left-to-right and top-to-bottom. In
advanced ladder logic functions mainly shift registers, sequencers, stacks branching and
looping programs, fault detections statements, and case statements like IF-THEN-ELSE
are used to determine the desired output of the system.
Sequencers are the functions used in ladder logic programs to create a sequence in
actions. A musical instrument is a simple example to help understand a sequencer. As the
drum function in this instrument turns it ON, it has small pins that will sound different
notes. When the note sequence is adjusted, it always follows the same pattern predefined
in it. Traffic light controllers are now controlled with PLC based devices, but previously
the traffic controllers used hardware-based sequencers that were based on a rotating drum
with cams, which would open and close relay terminals. As the cam rotates slowly, the
surfaces under the contacts will rise and fall to open and close contacts. For traffic light
controllers the speed of rotation would set the total cycle time for the traffic lights. Each
cam controls one light, and by adjusting the circumferential length of rises and drops, the
on and off times can be adjusted. Due to electronically controlled traffic lights, now it is
possible to change their sequence via the internet also.
Some more important functions like branching and looping allow parts of ladder
logic programs to be included or excluded from each program scan. These functions are
similar to functions in other programming languages such as C, C++, Java, and Pascal.

7
PLC also has fault detection and interruption functions (varies from different PLC
hardware). The PLC can be set up to run programs automatically using user-specified
interrupts for following reasons:
• To deal with errors that occur (e.g., divide by zero).
• To run a program at a regularly timed interval (e.g., SPC calculations).
• To respond when a long instruction is complete (e.g., analog input).
• When a certain input changes (e.g., panic button).
1.2 Extended PLC with new approach – Fuzzy logic and Expert system:
Advances in PLC have extended the horizons of logical control, making it more
precise and accurate. Fuzzy logic and Expert systems are two important extensions in
logical control of equipment in manufacturing or engineering industries. Though there are
many advantages to these extensive fields, they also have limitations in compatibility
with PLCs in different applications.
1.2.1 Fuzzy logic:
In continuation with control engineering and programmable logic controller, more
specialized fields like precision control were concentrated. Fuzzy logic was one of the
recently specialized fields due to precision control enhancement. The fuzzy logic name
was given by Dr. Lotfi Zadeh in 1965. According to him, fuzzy logic deals with more
approximate reasoning rather than precise modes of the same, making it a decision-
making tool over a range of transitional values instead of defined ones.
During the past several years, various applications in different fields from finance
and business to engineering were created using fuzzy logic. But the outstanding aspect
and the most visible one in today’s world is in an area not anticipated when the fuzzy
logic idea was predicted. The field of fuzzy logic-based process control has been the
focus in various fields. The very first implementation of fuzzy logic was done by
Madaami and Assilan [3] in connection with regulation of a steam engine.

8
The main reason for utilization of Fuzzy Logic as stated by Zadeh in [4] was
because the traditional control systems are based on mathematical differential equations,
which sometimes do not stabilize the progress of transforming human problem solving
techniques into a computer algorithm. As per Jager [5] fuzzy logic, when used with
control systems, uses a linguistic approach that allows the person to express the desired
control actions in words.
1.2.1.1 Advantages and applications of Fuzzy Logic:
Using fuzzy logic, system designers can realize low development cost, better-
quality features, and enhanced end product performance. The most important feature of
fuzzy logic is that a product can be brought into the market quickly and cost effectively.
Several factors that have made fuzzy logic enviable to system designers are as follows:
1. Complex mathematical models are eliminated, and simple solutions can be
determined instead of increasing confusion and uncertainty in the solution of the
system.
2. Simple and effective performance can be achieved by optimizing the solution.
3. The development cost is reduced due to simplified system design.
4. More elaborate system to manage, maintain, and upgrade easily.
5. System robustness and system sensitivity would have a better trade-off with high
fault tolerance.
6. Providing products with dominant features and performance within a price range
of other providers.
Fuzzy logic provides a method for constructing algorithms in an easy and
responsive way and provides the ability to confine the non–linear control human
behavior, which has proven important for complex tasks. A design method for controllers
can reduce improvement time and requires less skill sets. Moreover, economically this
design becomes more beneficial due to fuzzy logic. It can be further concluded that

9
robustness of human controllers is primarily due to their ability to adapt to a changing
environment and their learning potential.
In today’s world, fuzzy logic has found application in every dominion of life,
from washing machines to control of delicate processes, in navigation to economics. In
Japan, the use of fuzzy logic in control processes is being pursued in many application
areas. Automatic train operation, vehicle control, robot control, speech recognition,
universal controller, and stabilization control are just a few examples of recent
applications in which fuzzy logic is being used. Some excellent examples of
implementation of fuzzy logic have been used in the Sendai subway system [6]. Although
fuzzy system implementation in safety-driven situations was challenging, in 1986 it was
acted upon and was observed to be more accurate and has doubled the comfort index and
reduced power consumption by 10%. In recent months, researchers at Ohio State
University have taken steps toward developing a system using fuzzy logic, which helps
pilots regain control of aircraft following a major system malfunction. They are working
on the basis that fuzzy logic can be used to give imprecise instructions to machines,
which can then decide the performance levels of machines that are appropriate to the
level of failure that has occurred. Temperature control being a very important factor
while launching satellites [7], recently NASA has flown experimental payloads with
fuzzy logic-based temperature control devices. Around the world all major automotive
manufacturers are implementing fuzzy concepts for cruise control, engine spark
advances, active shock absorption and engine idling. Considering all the applications and
advantages, fuzzy logic has been a motivating factor in this research. But in order to
apply fuzzy logic, initially it needs to be verified that it is compatible with the system.
1.2.1.2 Need of Fuzzy System:
Systems created without fuzzy rule-based systems are found to be hard to
understand as well as apply. Fuzzy rule-based system allow a natural expression of
concepts by experts and users. The usage of fuzzy sets is done to evaluate indistinctness
and ambiguity in natural language, so that they can be employed to represent often-used

10
or rarely used concepts. Fuzzy rule-based systems are converted into expert systems by
collecting fuzzy membership functions and rules, instead of Boolean logic, to act upon
reasoning of the data. Mechatronics, on the other hand, focuses on a combination of
mechanics and electronics. Mechatronics is designing and developing innovative
products integrating all engineering disciplines. During product design using integrated
concepts of engineering, two essential features, intellect and elasticity of the product, are
considered. Cameras, camcorders, and washing machines are some of the examples of
basic Mechatronic products. But as the technology advances, there is constant change in
pressure for development of user-friendly smart products. Currently Mechatronics and
Fuzzy logic concepts are exclusively used in development of controllers for
accomplishing human probability and requirements. In a fuzzy controller, these
requirements are handled by only fuzzy rule-based expert systems. Considering possible
integrations of multi-valued logic, probability theory and knowledge-based fuzzy logic
control enhances human thinking to control any physical system.
1.2.1.3 Mechatronics and its advantages:
Mechatronics is an old term used after the 1970s invented by the Japanese
describing new technological fusion. As described before, it is a combination of
mechanical and electronics applications. It is an excellent combination of precision
mechanical engineering, electronic control, and systems engineering in designing and
developing various products. Due to advancement in technology and the invention of new
information technology, Mechatronics improved in terms of performance. Advances in
Information Technology (IT) caused automotive applications to expand their horizons.
Fields like robotics and numerically controlled machines became more condensed after
the involvement of IT in Mechatronics.
Furthermore, innovations in technology caused a new field to open known as
communication technology. This field multiplied and added the expansion of
Mechatronics, causing machines, robots, and automobiles to be remotely accessed and
controlled. The micro-robot is the best example of a Mechatronics and communication

11
technology application and was recently used to inject into a human body for eradicating
unreachable or critical cancer cells.
Benefits of Mechatronics are countless, as it enhanced other fields like fuzzy logic
and neural networks indirectly. Due to mechatronics it was possible to enhance
productivity, increase efficiency, and reduce waste in manufacturing and automotive
industries. Also, tremendous research and development in Mechatronics has resulted in
expansion of mechanical and electronics field horizons. Recently due to advances in
mechantronics, IT and biosciences, a new field known as bio-informatics was introduced
for research and development. Considering various application areas of mechatronics, a
few of its advantages are listed below:
1. Cost effectiveness
2. Rapidly developing tests
3. Reduction of machine setup time
4. Simplification of machine design
5. Increased performance and efficiency
6. Ease in redesigning and programming
7. Automated data collection and reporting
8. Short development cycle
9. Increased flexibility
10. Implementing distributed control in complex system
1.2.2 Expert system:
Expert system is a logical computer program used to reproduce the performance
of more than one human expert. It has been a traditional application for Artificial
Intelligence (AI) to determine the specific problem-solving domain, but it is used in a
variety of applications such as health care services, psychology, manufacturing,
educational services, and industrial applications. Expert systems are simplified further
depending on the flow of the chaining process used to analyze the problem as follows:
12
1. Forward chaining
2. Backward chaining
In the forward chaining process, it analyses the given data to achieve the desired
goal. An inference engine is created to analyze the user input to obtain the desired output.
The goal is achieved by using a set of user/system defined rules, which can be verified
and modified. IF THEN ELSE conditions are used to generate options in obtaining a
desired output. Expert system basically operates in three modes: knowledge acquisition,
consultation, and explanation mode.
Knowledge acquisition mode is based on a predefined activity process known as
expert system database. This expert system database is interpreted by an expert engineer
for consistency of data loaded. Finally the human expert performs several tests to analyze
the build-up expert system.
Consulting mode in an expert system is to interact with the designed system.
Initially the data is entered into the system in English. The inference engine attempts to
understand and interpret the user fed input data. Depending on the inference engine and
user inputs, desired outputs are displayed.
Explanation mode allows the system to explain its conclusions and its reasoning
process. This ability comes from the AND/OR tree diagram structures created during the
production system reasoning process.
1.2.2.1 Advantages of an Expert system:
1. Consistent answers are obtained for repetitive decisions or processes
2. Can maintain significant level of information
3. Logical clarification to organization in decision-making process
4. Can perform similar questionnaires as humans

13
As described above for fuzzy logic systems and expert systems, both can be useful
to PLCs in generating ladder logic programs for process control. A PLC processor is a
logical processor. It cannot interpret fuzzy logic membership values from 0 to 1. Also it
cannot understand a complex fuzzy set of rules in real time with PID control on hardware
setup. Hence a special PLC processor has been generated to understand and apply fuzzy
logic known as Fuzzy-PID controller. But considering the limited scope of application of
a fuzzy-PID controller due to its compatibility, expert system rules can be used in PLC
programming with TBASIC language support to generate a logical set of rules. In order
to introduce expert systems in PLC for certain applications, it is necessary to understand
the work done in the past and the scope of applications.

14
Chapter 2.0
OBJECTIVES OF RESEARCH
Programmable Logic Controllers are increasingly being used to automate a
variety of tasks in manufacturing and service industries. Modern PLCs go beyond typical
relay control; they are capable of sophisticated motion control, process control,
supervisory control, and internet-based control. Several industrial engineering (IE)
programs include PLC training and education in their curriculum. Currently, the IE
program at West Virginia University (WVU) does not include PLC instruction. The
objective of this study is to develop PLC-based laboratory material for an existing course
(IENG 405/505) in the IE program at WVU. The study will carry out the following
tasks:
1. Design, implement, and test hardware and software for a traffic light control system.
1.1 The traffic light control system shall have red, yellow, left yellow, green, and
left green lights. It will have a manual/auto switch. If the manual switch is on,
the lights will be controlled manually by on-off switches. If the manual switch
is off, the lights will be controlled automatically. In the auto mode, the timing
sequence should be programmable.
1.2 Develop a set of exercises for the traffic light control system.
2 Design, implement, and test hardware and software for a water temperature control
system.
2.1 The water temperature control system shall have the capability to input water
at any temperature. It will be equipped with a heater, fan, and a thermocouple.
2.2 Develop a set of exercises to do manual, proportional, integral, and derivative
control.

15
Chapter 3.0
LITERATURE REVIEW
Until recent years, PLCs were used and operated locally, but due to recent
advances in the internet and remote computer access, the microprocessor-hardware based
PLC can also be integrated with a computer and transfer the program remotely to the
PLC hardware. For example, two computers connected to the internet are connected
together via PLC software. This software is connected to the hardware system to be
controlled by another computer A to send the program to computer B.
Remote access to any hardware from any corner of the world made controlling the
task easy, efficient, and fast. For example: An engineer of a company can access the
specific machine from any part of the world to operate, detect error, or alter the settings
from his location. Students can operate any machine remotely without physically being
present in the lab. Other indirect benefits from online control are the reduction in
overhead costs, such as paper and printing cost, labor cost, and pollution levels. Remote
control over these PLC systems is part of skill sets and knowledge, but precision control
over PLC systems has gained recent attention in manufacturing as well as service
industries. Also, remote access and control of any automated hardware process causes
safety and security issues, which can be eliminated by precaution and using skilled labor.
Various researches have been performed in the past for remote access and control,
like online or virtual laboratories. These research studies have been done for actual
implementation in industries as well as educational institutions. Most of the research
consisted of online feedback monitoring equipment. Though these research studies were
used for feedback control, they lacked precision control using some of the recent
techniques like expert systems and fuzzy logic. Most of the focus in online PLC process-
based laboratories was to demonstrate feedback control using PID.
A PLC process-based project was demonstrated at the University of Western
Australia by Harjono [8] remotely controlling an environment requiring temperature

16
stability. The research was done with a sensor-based hardware setup to give the desired
output to the heater, which would finally maintain the needed environment. The project
was basically to demonstrate feedback control using LABview for Telelabs Project. It
consisted of a control system using two types of temperature controls: a thermostat and
Pulse Width modulation. Both temperature controls were operated using LABview. The
project demonstrated an excellent application of PLC process-based hardware setup
causing an extra count in the field of remotely controlled labs. With temperature control
being an important, critical aspect in most fields like biochemical and nuclear
laboratories, this research impacted on students in control engineering.
Like Harjono, Benmohamed [9] describes remote laboratories as new technology
and architecture. The paper describes making a decision to build laboratories, considering
their respective usages. E-Labs (Electronic Labs), R-Labs (Remote Labs) and V-Labs
(Virtual Labs) were the three different laboratory possibilities considered as alternatives.
A broad concept for the same was building labs that would cover all the requirements and
experimental setups to focus on remote and virtual learning. The study considered usage
of control-based systems like, PLC process-based and PC-based control of hardware.
Benmohamed’s research was a hint in the process of remotely controlled labs.
Another web-based, online control, multi-pipe fluid flow experiment was done in
the laboratory by Raghavan [10]. The laboratory permitted students to control a physical
setup of a multi-pipe fluid flow experiment through the internet and to predict and
analyze the results. The laboratory learning environment interface was developed using
LABview. The remotely controlled environment provided an increase in individual
access to equipment during and outside of regular hours from any web-enabled location.
Multi-piped flow was advanced in student’s laboratories study in the areas of fluid
dynamics and its applications. Individual access to students was done by creating
individual log-on per student to reduce group experimentation and increase safety.
Due to online training and online courses, remote laboratories in many
universities have become highlights. Another attempt was observed in a journal by

17
Alexander [11] where he describes the sophomore e-level mechanics of materials
engineering online laboratory. It included experiments like a hand-operated test frame for
conducting tensile tests, an instrumented bow and stand for measuring load,
displacement, and arrow velocity for calculations of energy conservation, a beam
deflection experiment using a low-watt laser, and a strain gage mounting exercise. The
laboratory with this content allowed greater flexibility for students in hands-on
experience and education. Variety in experimental setups increased exposure in
application-based technology motivating the interest of students.
A paper describing similar remote laboratory experiments through the internet by
Ramakrishnan [12] explains further about an oscilloscope experiment performed in a
remote laboratory in the department of electrical engineering. The experiment was
performed in LABview. Though this control was a logic-based PLC hardware setup,
similar to Raghvan’s experimental setup [10], it had feedback control using GUI. PID
control being a combination of proportional, integrated, and derivative control over the
system, using a feedback mechanism was considered the main learning point in this
experiment.
Another paper presented by Beugelsdijk [13] describes a method for creating
internet-accessible machines that execute a variety of physical operations in a highly
variant manner. The method integrates existing capabilities and technologies from a
number of areas—laboratory science, automation and robotics, interconnect standards,
object-oriented language, relational databases, shipping services, and internet providers.
For medical research applications, the batch science machines described in the paper
would serve as programmable laboratory technicians, perform the work of hundreds of
humans, and help in tackling problems.
A similar research paper was presented by Chvostek [14]. The paper was about
adaptive PID controllers using the Open Process Control (OPC) Toolbox. The research
was basically divided in two phases. The first phase was intended to control the
environment using PLC control system, while the next phase used Matlab environment-

18
based OPC client function. The second phase was connected to Matlab web function
making the whole system controllable remotely through the web. The OPC environment
processed complex algorithms and data, which is very difficult to handle by the first
phase, PLC. An excellent demonstration of OPC client/server-based environment usage
and its application can be observed in this research, which adds an important position in
this research.
PID without PhD [15], an important research about simplification of control
systems using PID, contributed to this research as a useful resource. The feedback
mechanism through PID was made simple by certain techniques, reducing heavy
mathematical calculations, and eliminating intricate control engineering theories.
All the above research relates each other in remote laboratory aspect and PLC. As
this research also considers the same aspect, these related research studies were taken into
consideration as motivation, and various innovative ideas were utilized as concepts for
the hardware setup in this research.
Closely related research:
Research on Distributed Control Systems (DCS) was presented by Lessard [16],
describing reliable, secure, and survivable control systems using PLC. As the system was
connected to the outside world, it was possible for disgruntled employees, hackers, and
cyber terrorists to attack and harm the system. Taking into consideration the safety
scenario first, this research was highlighted for application of PLC on SCADAville, a
municipal water system emulator, which was modeled after a typical municipal water
distribution system. The research was a part of a designed course in Norwich University
[17] as a part of student curriculum of ladder logic code for digital controller reliability.
Controlling the hardware locally and remotely makes a lot of difference as
discussed in the previous paragraph in terms of safety. Precision control adds to the same
list of remote controlling systems. There are many methods used in precision controlling

19
programmable logic controllers. One of the methods is using fuzzy logic. These rules
play a vital role in increasing the system’s efficiency. Fuzzy logic discovered by Lofti
Zadeh in 1965 was initially used for industrial applications. During the 1970s and after, it
was developed as an important tool in business applications, neural networks, and various
health care applications. Following are closely related research studies done in the past,
which concentrated on precision control using fuzzy logic and remote controlled
laboratories.
An internet based PLC air-controlled system experiment was conducted by Yen-
Shin Lai [18]. It was difficult for them to perform a high level of operation for
intelligence control using only PLC; hence the internet-based fuzzy controlled inverter
system was developed to overcome this problem. The logical rule using fuzzy sets is sent
through a server for online control of an air-conditioner. It described the importance of
precision control in a PLC process-based environment using one of the advanced
methods like fuzzy logic.
A project undertaken at Ryerson Polytechnic University [19] integrated recent
trends in control engineering. A fuzzy logic-based intelligent control system was created
with highly coupled, multi input and output, three degrees of freedom simulator of a
helicopter. This project was made accessible and controlled via the internet. The
performance under linear control over the whole range of operating conditions caused the
system to not deteriorate away from the equilibrium point, which remains comparable for
the setup. The project was an excellent example of fuzzy logic-based intelligent control
system usage and control engineering.
Another research study that was closely related to this research was at the
Robotics and Automation Laboratory (R & A Lab) [20]. This research work concentrated
on the development of a number of key technologies to enhance remote maneuvers at
nuclear facilities by utilizing intelligent systems. Current projects in this lab concentrate
on fault-tolerant systems, design of an omni-directional platform, and intelligent control.
On-going research in this facility has added many features into it. The first phase has
20
already been tested, while the next phase would soon be tested and verified for usage.
This research had a human/machine remote control system used to assist the operator in
performing complex and uncertain tasks in hazardous environments such as nuclear
reactors, in space, and in under-water operations.
Finally the fuzzy logic controller design research, which was applied to non-linear
systems, contributed to this literature review [21]. This fuzzy logic controller was
designed and tested using the sliding motor control concept. A single input, quasi-fuzzy
sliding mode method was innovated in this research as it was tough to implement fuzzy
logic rules for this system. This research also provided the simulation results that helped
them derive their theory of slide motor control.
Considering all this background and getting deeply motivated to develop a PLC
process-based fuzzy logic remote controlled system would be useful to students in a
remotely controlled lab, while learning programmable logic controller and its application.
A sensor-based hardware setup was done, which will be explained in the following
chapters. Taking into consideration the student mindset and learning levels, a simple
hardware setup of a temperature-controlled environment using water as medium was
considered.

21
Chapter 4.0
HARDWARE SETUP
Hardware setup is one of the important sections in this intended course/lab. The
hardware setup described causes students to perform hands-on applications in a process
control scenario. Before proceeding to the hardware setup, the students are introduced to
Boolean algebra, PLC hardware, PLC software, and process control using PLC for
theoretical information.
4.1 Boolean Logic
Boolean logic is used to develop logic circuits. Three basic logic gates are OR
(+), AND (.), and NOT (‘). The OR gate is used for parallel logic. The output of a two
input OR gate is true if either input 1 (I1) is true OR input 2 (I2) is true. The AND gate is
used for series logic. The output of two input AND gates is true when Input 1 (I1) AND
Input 2 (I2) are true. NOT is simply a complement operator, if input is true then the
output is false; if input is false, then output is true.
Table 1: Basic Gates
I2
I1 O1 AND
I1
I2 O1 OR
I1 O1 NOT
AND -Truth Table
OR - Truth Table
NOT - Truth Table
I1 O1
0 1 1 0
I1 I2 O1
0 0 0 0 1 0 1 0 0 1 1 1
I1 I2 O1
0 0 0 0 1 1 1 0 1 1 1 1

22
Some of the fundamental laws of Boolean algebra are shown in following table:
Table 2: Basic Gates
OR Version AND Version
Identity X+1=1 X.1=X
Null Element X+0=X X.0=0
Idempotent
Theorems
X + X=X X.X =X
Complements X + X’=1 X.X’ = 0
Negation (X’)’=X (X’)’=X
Commutative Laws X + Y=Y+X X.Y=Y.X
Associative Laws X+(Y+Z)=(X+Y)+Z X.(Y.Z)=(X.Y).Z
Distributive Laws X+Y.Z=(X+Y).(X+ Z) X.(Y+Z)= X.Y+X.Z
Absorption Laws X+X.Y=X X.(X+Y)=X
Reflective
Theorems
X+X’.Y=X+Y X.(X’+Y)=X.Y
DeMorgan’s Laws (X+Y)’=X’.Y’ (X.Y)’=X’+Y’
Example: Let’s say we have Boolean expression: X + X.Y.Z+X+X’.Y
We can simplify this as follows:
X.(1 + Y.Z) + X +Y = X+X+Y = X + Y
Example:
Let’s say we have three computers monitoring the status of some critical device, and we
want to develop a logic circuit that will trigger an alarm when two out of the three
computers are not operational.
Step 1: Define input/output variables:
We have three input variables: The status of three computers (I1, I2, I3).
Let logic 0 = computer operational and logic 1 = computer not operational.

23
We have one output variable: Alarm (O1).
Let logic 1 = Alarm on, and logic 0 = Alarm off.
Step 2: Develop the Truth Table:
I1 I2 I3 O1
0 0 0 0 0
1 0 0 1 0
2 0 1 0 0
3 0 1 1 1
4 1 0 0 0
5 1 0 1 1
6 1 1 0 1
7 1 1 1 1
3. Write the Boolean Expression and simplify it
O1 = Σ (3, 5, 6, 7)
= I1’*I2*I3 + I1*I2’*I3 + I1*I2*I3’ + I1*I2*I3
= I1’*I2*I3 + I1*I2’*I3 + I1*I2*(I3’ +I3)
= I1’*I2*I3 + I1*I2’*I3 + I1*I2 = I1’*I2*I3 + I1*(I2’*I3 + I2)
= I1’*I2*I3 + I1*(I2 + I3) = I1’*I2*I3 +I1*I2 + I1*I3
= I2*(I1 + I1’*I3) + I1*I3 = I2*(I1 + I3) + I1*I3
= I1*I2 + I2*I3 + I1*I3

24
4. Draw the Logic Circuit Diagram
Figure 1: Logic Circuit Diagram
Ladder Logic
Programming a PLC involves creating logic circuits or ladder logic diagrams. A ladder
logic diagram is similar to an electrical wiring diagram. The basic symbols of a ladder
logic diagram are as follows:
Input from devices such as: on/off switches, relays, and light
sensors.
Output to devices such as: motors, valves, alarms, bells, and lights.
Inverse of the input, like the NOT (‘) function.
I1
I2
I1*I2
O1
I3
I1*I3
I2*I3

25
Table 3: Input/Output Component Symbols
Inputs (I) Outputs (O)
Name Symbol Name Symbol
Push Button
Switch (NO)
Lamp
Push Button
Switch (NC)
Control
Relay
SPST
Switch (NO)
Motor
Starter
SPST
Switch (NC)
Horn
Limit Switch
(NO)
Solenoid
Valve
4.2 Programmable Logic Controllers
A Programmable Logic Controller (PLC) is a specialized computer used to
control machines and processes. It was first introduced in the 1960s to eliminate much of
PB
LS
PB CR
L
SW
SW M
H
SV

26
the hard wiring associated with conventional relay circuits. Today, the PLCs are used for
numerous applications, such as painting cars, filling soft drink bottles, controlling traffic
lights, assembling appliances, and controlling vending machines.
The essential elements of a PLC are: a) Backup power, b) Memory (ROM and
RAM), c) Microprocessor, d) Input/Output interface, and e) Detachable programming
module. Devices such as switches, motors, lights, and alarms are connected via the
input/output interface. Typical voltage levels of discrete (on/off) I/O devices are 5 V DC,
12 V AC/DC, 24 V AC/DC, 48 V AC/DC and 120 V AC/DC and 230 V AC/DC.
Common analog inputs are temperature, pressure, flow, and humidity. Common analog
outputs are analog displays, AC/DC motors, valves, and actuators. The detachable
programming module or a laptop computer is used to program one or more PLCs. Figure
1 shows a typical PLC, and Figure 2 shows the ladder logic program being developed for
a PLC on a laptop computer.
A PLC is not a general-purpose microcomputer. PLCs are designed specifically
to interface with physical devises in a plant and to carry out predefined logical
operations. A typical PLC will execute a small logic program for days, as opposed to a
general-purpose microcomputer, which will execute several complex programs during a
single day. Major components of a typical PLC are shown in Figure 2. The basic
functions that a PLC performs are:
1. Control functions: Generate an output signal from one or more input signals based
on programmed logic rules.
2. Timing functions: Generate an output signal after a specified time delay or keep
the output signal on for a specified period of time, up - down counters.
3. Arithmetic functions: Perform basic arithmetic operations (+, -, *, /)
4. Analog control functions: Perform open loop or closed loop control procedures.

27
Figure 2: Components of a PLC
Figure 2 describes an inexpensive PLC connected to simple input and output
devices. Figure 3 shows a simple limit switch. Figures 4 and 5 shows a T100MD+ PLC
mounted on a circuit board with I/O connectors, RS 232, and RS 485 interfaces. The
PLC card mounted on circuit board are Latin-tech PLC trainer 1 and 2, respectively.
Figure 3: Limit Switch
Backup Power
Memory (ROM, RAM)
Microprocessor Unit
Input Devices
Discrète (switches, relays, etc)
Analog
(Potentiometers, voltage, etc)
Registers
(Thumbwheel, encoders, etc)
Detachable Programming Module
Output Devices
Discrète (lights, relays, etc)
Analog (Displays, voltage, etc)
Registers (Digital displays, etc)
Input Interface
Output Interface

28
Figure 4: Latin Tech PLC trainer 1
Figure 5: Latin Tech PLC trainer 2
4.3 Traffic Light Setup:
The WVU PLC trainer consists of a T100MD+ PLC, five ON-OFF switches
(SW1-SW5), two push button switches (PB1, PB2), one manual/auto switch (M/A), one
red light (L1), two yellow lights (L2, L3), and two green lights (L4, L5). The input and
output devices are connected to the PLC digital input and digital output line as shown in
figure 7.

29
The lights are intended to simulate traffic lights at an intersection (red for stop,
yellow for proceed with caution, left yellow for turn left with caution, green for go, and
left green to turn left). When developing applications on the WVU PLC Trainer follow
the procedure described below.
1. Identify number of inputs and outputs from the problem statement
2. Develop the ladder logic circuit
3. Test the circuit on the TriLogi simulator
4. Download the ladder logic circuit to the T100MD888+ PLC
5. Test the circuit on the WVU PLC Trainer
4.2.1 T100MD+ PLC card:
T100MD+ is a super programmable controller PLC card [23] applicable to
TRiLOGI© v 6.0 and below. The card operates on single regulated 12 or 24vdc supply
for both the CPU as well as I/O connections. The card offers maximum of 8 channels of
analog input (10 bit) and maximum 2 analog outputs (8 bit). The analog outputs use the
same power supply of 12 or 24vdc to generate stable voltage of +5vdc. The analog
outputs are limited to 10mA current. It uses this as a reference voltage. The build-in
channels in T100MD+ for PID computation cause excellent process control for
automation. The PLC card mainly has two inputs: The first input can be provided via
RS232 port for programming as well as monitoring. The second input can be provided
via RS485 port for networking or getting connected to external devices such as LCD
display and RS485-based analog input/output cards. But RS485 can also support multiple
communication protocols with RS232. Figure 6 shows the actual T100MD+ PLC card
with attached LCD display.

30
Figure 6: PLC T100MD+ Card

31
Figure 7: WVU PLC Trainer
L1 (Red)
L2 ((Yellow)
L5 (Green)
L3 (Left-Yellow)
L4 (Left-Green)
V-
T100MD888+
PLC
V+
SW1
RS232C
SW2
SW3
SW4
SW5
PB1
PB2
M/A
I1
I8
O1
O2
I7
I6
I5
I4
I3
I2
O6
O7
O8
O5
O4
O3
12 VDC
On off Fuse
RS485
12 VDC
Relay 1
Relay 2
Relay 3
Relay 4
Relay 5
V- V+

32
The analog outputs and inputs share two pins in common (DAC 1, 2 and ADC 7,
8), hence a digital to analog function is needed to set commands for converting the pins
in required outputs using TBASIC language [24]. TBASIC is one of the PLC computer
languages that control the PLC functions as per the logical and Boolean rules created in
the ladder logic program. This ladder logic program is said to be a custom-functioned
ladder logic program. The analog custom-based function setup for I/O’s are described
further in the software section.
4.1.2 WVU PLC Trainer setup:
Figure 8: WVU PLC Trainer
The WVU PLC Trainer isunique and was manufactured mainly as a training kit
for students to learn the basics of PLC and its usage in a simple application like traffic
lights. The WVU PLC Trainer was manufactured considering concepts of professional
product manufacturing. The WVU PLC Trainer was comparatively the lowest cost trainer
as compared to the available PLC trainers on the market. It also considered low cost and
usage depending on the student need. WVU trainer comprises the following parts:

33
1) Trilogi T100MD+ PLC card, 12 / 24 VDC
2) Bulbs, 5 nos., 12 VDC each
3) Push buttons, 2 nos. 12 – 24 VDC each
4) Toggle switches, 5 nos. 12 – 24 VDC each
5) Fuse
6) ON/OFF switch
7) Relays
8) Wooden support, 2 nos.
9) Connecting screws, 4 nos.
10) AC/DC adapters to power the Trilogi PLC card, input: 100-240 VAC, output: 15
VDC
11) AC/DC adapter to power the bulbs, input: 100-240 VAC, output: 12 VDC
12) Cardboard box, 1 no., used as carrying case for the trainer.
Following is the description of the main parts used in WVU PLC Trainer:
4.1.3 Push Buttons:
Figure 9: Push Buttons
Push buttons switches (2 nos.) are used in the WVU PLC Trainer for special function
DAC program inputs as per its requirement. The basic use of push buttons is to initiate
the ladder logic program transferred in the T100MD+ PLC card. As the push button is

34
turned ON, it can be used only when the operation is applicable to trigger the input or
program initiation.
4.1.4 Toggle switch
Figure 10: Toggle Switch
Toggle switches (5 nos.) are used in the WVU PLC Trainer for DAC inputs with ON-
OFF conditioning programs. One of the inputs in the WVU PLC Trainer is the manual-
auto (M/A) switch so that it can be used separately for controlling the traffic lights. The
remaining four toggle switches are used as manual inputs to switch on the lights. The
toggle switch used is a three-way toggle switch, which can be connected for three-way
ON-OFF conditions.
4.1.5 Traffic lights
Figure 11: WVU PLC Trainer Traffic Lights

35
One face traffic lights (one red, two yellow, two green) are used in the WVU PLC
Trainer. These traffic lights are connected to individual relays respectively and are
energized by a separate 12 VDC supply through voltage adapter with a time delay of 0.1
seconds.
Figure 12: WVU PLC Trainer
L1 (Red)
L2 ((Yellow)
L5 (Green)
L3 (Left-Yellow)
L4 (Left-Green)
V-
T100MD888+
PLC
V+
SW1
RS232C
SW2
SW3
SW4
SW5
PB1
PB2
M/A
I1
I8
O1
O2
I7
I6
I5
I4
I3
I2
O6
O7
O8
O5
O4
O3
12 VDC
On off Fuse
RS485
12 VDC
Relay 1
Relay 2
Relay 3
Relay 4
Relay 5
V- V+

36
4.2 Water Tank Setup
This chapter describes the design of a temperature-controlled environment to
demonstrate a programmable logic controller using PID control and theoretical
explanation of fuzzy logic implementation on the setup for precision control. The
intention of the design of the hardware was to create a feedback system scenario and to
create a remotely controlled experimental setup. The hardware setup was built taking into
consideration water as the medium to be controlled by using Resistant Temperature
Detectors (RTD’s) and Proportional Integrated Derivative (PID) logic.
The system is made complex by including a heater and fan so as to increase
variation in the temperature. Due to these variations, the hardware setup becomes
difficult to control through PLC using PID. Hence a type of applicable control theory is
applied with respect to PID control. Depending on the experimental requirements, the
following hardware requirements are considered:
1. Electric heater.
2. Resistance Temperature Detector sensors (K type).
3. Enclosure for water.
4. T100 PTS Trainer.
5. Fan.
6. Solid-state relay.
7. Temperature transmitter.
A plan for the experiment was created in order to avoid uncertainty and delay after
fulfilling the hardware requirements. The following flow was plotted for the hardware
setup:
1. Calibration of sensors.
2. Complete water enclosure structure.
3. Locating sensors, heater and fan.
4. Connections and wiring.

37
5. Remote access to PLC connecting the hardware setup
4.2.1 PTS PLC training station
Figure 13: T100 PTS PLC training station
The T100MD+ card was used in the T100 PTS training station [25], taking into
consideration the safety of the hardware setup as well as the PLC card. The T100 PTS
training station provided ready-made outlets for inputs, outputs and analog I/O’s, which
reduced the chaotic construction of outlets safety in terms of the PLC card. Due to the
following advantages of T100 PTS training station, it was considered as one of the major
component in the hardware setup:
1. Cost effective
2. Input switches (2 push buttons, 4 toggle switches)
3. Relay outputs LED’s (4 nos. for each 4 outputs)
4. LCD display
5. Fuse controlled ON/OFF power switch

38
Finally taking into consideration the advantages, T100MD+ was used in the water
temperature control hardware setup. Following are the advantages of T100MD+ utilized
in this study:
1. Low operational and maintenance cost.
2. Remotely controller PLC
3. Ladder logic programming using TBASIC
4. Applicable in manufacturing as well as industrial plants.
5. Small, compact, and light weight.
6. Ideally useful for robotics and motion control applications.
7. Ladder logic program simulation
8. Online monitoring of PLC program.
9. Voice messaging, emailing, and paging event reports.
4.2.2 Inputs – Sensors:
The inputs used for the water temperature controlled environment setup are
measured from Resistance Temperature Detectors (RTD’s). The RTD is made up of
platinum, having linear resistant temperature characteristics. These sensors measure
change in resistance depending on the medium temperature. But as the PLC requires
inputs in terms of voltage, temperature transmitters (AD495 amplification chips) are
connected to them in series. These temperature transmitters convert input from RTDs,
into output voltage between a range of 0 – 5 VDC.
Sensors were selected depending on the environment to be controlled. As water
was the medium in the water temperature control setup, RTD’s with temperature range of
-200 to 260 C with 100 Ohm DIN Platinum precision. Long probe length, easily insert
able ¼ “ diameter, Class A and B accuracy in 3 standard these were the few advantages
due to which the RTD’s were selected.

39
Figure 14: Resistant Temperature Detectors
The temperature transmitter is provided with constant input power supply to
convert the RTD acquired resistance in terms of voltage. The sensors used are in three
different ranges: High, Medium and Low. As per the respective range differences, the
sensors were placed at predefined levels in the temperature-controlled environment tank
and marked with level differences for visual certification. As water being the medium for
maintaining and control temperature, leakage and spillage conditions were taken care of
beforehand. Also care was taken while placing the sensors at their specified levels to
maintain evenness in temperature differences. Though all the three sensors were similar,
their calibration was necessary to avoid variation in the temperature range during
experimentation. Also, the sensor calibration was indirectly responsible for the results
and final conclusion.
Figure 15: Temperature transmitters

40
4.2.3 Calibration of Resistant Temperature Detectors (RTD):
A simple calibration procedure was maintained for all the three sensors.
Calibration of one of the sensor is as shown below Figure 16:
Sensor Calibration
y = 0.3449Ln(x) + 24.17
23.6
23.8
24
24.2
24.4
24.6
24.8
25
25.2
25.4
0 2 4 6 8 10 12 14 16 18 20 22 24 26 28 30 32 34 36 38
Time (min.)
Temp (C)
Temp
Log. (Temp)
Figure 16: Temperature Vs Time Calibration Chart
The calibration of sensors was followed by temperature transmitters. It was done
using following relation:
Table 4: Temperature Transmitter relation
i = electric current in mA
The temperature sensors and transmitters provided necessary output voltage
required for the PLC input, but stability from the output may vary, affecting essential

41
changes in the required outputs from the PLC processor, finally to obtain varied outputs
to heater and fan. Hence, to avoid variation, amplification and steady output is generated
using AD495 electronic chips.
4.2.4 Outputs – Heaters and Fan
The research utilizes two main outputs: heater and fan. As mentioned before,
controlling temperature-variable environments being the main motive behind this thesis,
the heater was obviously one of the outputs selected. A heater with 200 W, 110 V
specifications is shown in Figure 17. Considering the usage of the system and the
temperature requirements, 200W specifications were selected as useful and cost effective.
The heater is located in the center of the water tank considering water properties.
Only purified water was used for the experimental setup (salts in water cause changes in
medium consistency and variations in heating conditions [26]). Heater was connected to
the DAC output 8 of T100MD+ PLC card.
Figure 17: Electric water heating rod and fan
The second output used in this thesis was the fan. The main motive behind using a
fan was to create disturbance in the temperature-controlled environment by fluctuating it.

42
The fluctuation in the water medium makes the control hard, hence motivating for
precision control using TBASIC language. The fan output is located outside the water
medium to avoid extreme fuzzification of the system and control using PID. For
controlling purpose, the fan output is connected to DAC output 7 of T100MD+ PLC card.
Figure 17 shows the fan used in the system.
4.2.5 Temperature controller environment setup:
The hardware for the temperature-controlled environmental setup was restored
with sensor controls, heater, and fan connecting to T100MD+ PLC card. Following
Figure 18 shows the complete setup of the same:
Figure 18: Temperature controlled environment initial setup
During the process, safety was considered as an important aspect in terms of user
and hardware. The enclosure was kept partly open at the top for steam to evaporate. The
location of all internal hardware, like the fan, sensors, and heater were presented at visual
height to make it easy for students to control and to gain a valid response.

43
Figure 19: Solid State Relay
As the heater was receiving high input voltage (110VAC) before connection, the
output supply from the PLC outlet was connected to Solid State Relay (SSR). The SSR
properties support handling a heavy voltage supply for a trigger of low volt supply input
resulting in an energized magnetic field of the same. Also its trigger time being very low
(20 µsec), the output would be energized instantaneously. The voltage range required for
the SSR being 3 – 32 VDC, the ladder logic program was set up with the same
consideration. Terminals 1 and 2 of SSR are connected to main 240 VAC, while
terminals 3 and 4 are used for ON/OFF state of the SSR. Due to its advantages like very
low trigger time, and heavy load stability SSR is used in this experiment.
4.2.6 Final hardware connections:
The final hardware connections were considered to be the final step before
verifying all the hardware and its properties. In order to avoid confusion and
malfunctioning of the setup, following sequential steps for the hardware connections was
considered:
1. Water tank
2. RTDs

44
3. Signal Conditioner
4. PLC Processor
5. Solid State Relay
6. Output (heater and fan)
The final completed hardware setup is as shown in Figure 20:
Figure 20: Final water tank setup

45
Chapter 5.0
SOFTWARE SETUP
The software setup is another important part of this thesis. Considering the
compatibility of the T100MD+ PLC card, TRiLOGI software from Triangular Research
International Ltd. [24] is used to control the mechanical based process environment. The
software consists of the main executable file and an independent server needed to access
and control the hardware remotely. The following pages describe in detail the TRiLOGI
software and PLC programming of the same.
5.1 TRiLOGI introduction:
TRiLOGI Version 6.13 is the latest version of the software, which was used in
this study. TRiLOGI Version 4.1 and further upgrades have made the software more
user-friendly and capable of many custom-based functions for programming. Except M
series PLCs from Triangular Research International Ltd., all other series can operate with
4.1 and above versions. The latest TRiLOGI Version 6.13 consists of expanded ladder
logic language, comprising TBASIC variables making it more efficient at handling
complex computational tasks rather than traditional ladder logic programming. The
custom-based functions using TBASIC provide a full-screen text editor enabling special
functions, for example, the SETLCD function can be customized to change display
positions, depending on user requirements [24]. The same custom function is used for
this research with PID control. Other than PID control custom function, many other
functions are used from the library of TBASIC commands.
TRiLOGI software, being only applicable to T100MD+ PLC card, has certain
advantages over other PLC software. Also due to advantages like cost effectiveness,
portability, and easy remote access control features make it the foremost option for
selection in this study. Following are key features of TRiLOGI used in this study, making
it the better choice than other PLC software.

46
1. Online monitoring: Online monitoring is a build-in function used for monitoring
the ladder logic program sent to the PLC hardware. The inputs can be verified and
controlled via online monitoring with emergency stops to avoid any critical error
in the program. The operation of the program can be monitored in a stepwise
fashion for each ladder with individual assessment.
2. Simulation run: Simulation in TRiLOGI, although not fancy, gives extremely
useful information about the variables. These variables and other peripheral
variables, encompassing values during operation, are displayed in simulation. The
variables are displayed on three different screens: system variable screen, data
memory screen and string variable screen.
3. Built-in custom functions: Custom functions are user-defined, programming
logical relations required in the PLC program and which are hard to create using
simple functions. These functions, as defined in previous chapters, are for
complex operations in the program. The IF THEN ELSE logical TBASIC
programming, useful for creating expert system rules, is basically one of the
custom build functions useful in this study. The usage of IF THEN ELSE
programming for creating the expert system rules will be revealed in the
following appendix chapter.
4. Remote access and control over PLC hardware: One of the important features
of TRiLOGI is remote access and control over the PLC hardware. A TRiLOGI-
built, Java-based server can be connected to a distant computer via the internet,
local computer to distant computer as can be remotely accessed easily. But
application-based control, using both the computers, can only be done when both
computers have TRiLOGI servers running. The connectivity for the same is done
by means of respective IP addresses and manipulating the network as well as
computer security levels. The remote access feature illustrates program transfer
safety by setting password access control, to eliminate interference by hackers and
restrict unauthorized student access.

47
5. TBASIC programming: TBASIC language use, as described in custom
functions, is useful in the logical application as well as user defined programming
control. TBASIC programming operates in a similar manner to BASIC
programming language. The difference between TBASIC and other logical
programming language is the complier and platform used. TBASIC is a
methodical and relatively easy way to create complex PLC ladder logic programs.
As described, TBASIC is used as expert systems programming, but it is also
useful in many other simulation applications that can be used, like a clock
custom-function simulator, which shows diagrammatic representation of the input
pulse monitored.
Considering all the above reasoning for selecting TRiLOGI software, the following
chapters describe the actual program built using various functions and custom-based
TBASIC language programming.
5.2 Program Ladder Logic:
Triangle Research International (BC, Canada and WA, USA) makes the
T100MD+ series of single board PLCs. The following circuit diagram shows the
T100MD888+ PLC. It has six 10-bit analog input channels (0-5V), two 8-bit analog
output channels (0-5V), eight (24V NPN) high speed digital inputs, eight digital output
channels (2 PWM 10A@24VDC, 2 stepper motor pulse outputs). The dimensions of the
PLC are 5” x 4.5” x.8”. The T100MD888+ also has a built in LCD display interface,
RS485 interface, and an RS232 interface.

48
The electrical wiring diagram shows a circuit to turn on the light when the pushbutton is
pressed. The corresponding ladder logic diagram is shown on the right. It is common to
use Logical 1 (true) to represent the switch being closed and Logical 0 (false) to indicate
the switch being open. A switch can be of the type Normally Open (NO) or Normally
Closed (NC).
Figure 21: Electrical wiring diagram
Figure 22: Ladder Logic diagram
+ -
Push Button Light
PB
+
- Light
Battery
PB1 (I6) PLC Card L1 (O1)
- +

49
A ladder logic diagram can be the tester on the Trilogi software. To run the software,
start the Trilogi Version 6.12 software and follow these steps.
a. Open Trilogi software
b. Go to Edit and open I/O Table
Figure 23: Initial start up screen
1. Go to inputs, type in PB1 in row 6 and press enter.
Figure 24: I/O table inputs
2. Press and select outputs. Enter L1 in row 1 and press enter.
Figure 25: I/O table output
3. Close the I/O labels window.

50
4. Click on Circuit and select insert circuit. The circuit creator would be visible on
screen.
Figure 26: Trilogi initial screening for creating circuit
5. Select to insert PB1 in the first rung of circuit. The I/O label will pop up.
Select PB1.
6. Select to insert L1 in the first rung of the circuit. Again the I/O Label will
appear, select L1.
7. Select FILE and SAVE or hit Ctrl + S to save the circuit. Save the file in the
proper location and file name (PLC01-group number).
Figure 27: Single ladder with push button to single output
The ladder logic program can be downloaded to the trainer by running the TLServer
Version 3.0 program. Follow the steps shown below to download the program to the
T100MD888+ PLC.
1. Connect the PC to the PLC via an RS232C serial cable.
2. Open TLServer 3.0 and select serial port setup.
3. Type in IR* in the command string text box. If the PLC is connected to the serial
port, IR01* will be displayed in the message box.

51
Figure 28: Serial port communication and testing
Figure 29: Trilogi server initial screen
4. After receiving output message as IR01,* close the serial communication setup
window and minimize the TLServer window.
5. Now open the Trilogi Version 6.13. Open a new file or saved file to transfer the
program to PLC.

52
6. Select Controller and click on Program transfer to PLC or Ctrl + T.
7. A window will appear as shown. Check that the details are the same as shown in
the window below and then click OK.
Figure 30: Individual login ID access for Trilogi server
8. Then click OK for the next few windows to transfer the program.
Example (on input/one output):
Create a ladder logic diagram to turn on the light (L1) when push button (PB1) is pressed.
Assume the push button is connected to input 1 (I1) and the light is connected to output 1
(O1). Test your circuit on the Trilogi simulator.
Figure 31: Single input output ladder logic
Logical AND
In the following circuit, the push button and the switch have to be true for the light to turn
on. It illustrates the logical AND operation.
I1 O1
( )

53
I1 = Normally Open Switch
I2 = Normally Open Switch
O1 = Light
I1 I2 O1
0 0 0
0 1 0
1 0 0
1 1 1
Figure 32: AND truth table and diagram
Figure 33: AND circuit diagram
Example (Two input AND):
Create a ladder logic diagram to turn on light L1 when switch SW1 and SW2 are on.
Assume the SW1 is connected to input (I1), SW2 is connected to input (I2) and light L1
is connected to (O1). Test your logic on the Trilogi simulator.
Figure 34: AND ladder logic example
+ -
PB1 L1 SW1
SW1 L1
( )
SW2
I2
I1
O1 AND

54
Logical OR
In the following circuit the light comes on when the switch is closed (true) or the
pushbutton is closed (true).
PB1 SW1 L1
0 0 0
0 1 1
1 0 1
1 1 1
Figure 35: OR gate truth table with diagram
Ladder diagram for two input OR
L1 = PB1 + SW1
Figure 36: OR gate circuit diagram
Example (Two input OR):
Create a ladder logic diagram to turn on light L1 when switch SW1 or SW2 is on.
Assume the SW1 is connected to input (I1), SW2 is connected to input (I2), and output
L1 is connected to (O1). Test your logic on the Trilogi simulator.
Figure 37: OR gate ladder logic diagram
L1 SW1
PB1 OR
- +
PB1 L1
SW1
PB1
( )
SW1
L1

55
Logical NOT
In the following circuit we use the normally closed push button. The light comes on
when the push button is open.
PB1(I1) L1
(O1)
0 1
1 0
Figure 38: NOT gate truth table and diagram
Ladder diagram for one input NOT. Assume a normally closed pushbutton (PB1)
L1 = PB1’
Figure 39: NOT gate circuit diagram
Example (One input NOT):
Create a ladder logic diagram to turn on light L1 when switch SW1 is off. Assume the
SW1 is connected to input (I1), and output L1 is connected to (O1). Test your logic on
the Trilogi simulator.
Figure 40: NOT gate ladder logic diagram
I5 O1
( )
PB1 NOT L1
+ -
PB1 L1

56
Example (AND-OR-Circuit):
Create a ladder logic diagram to turn on light L1 when switch 1 and switch 3 are true or
when switch 2 and switch 3 are true. Assume SW1 is connected to input (I1), SW2 is
connected to input (I2), and output L1 is connected to (O1). Test your logic on the Trilogi
simulator.
Figure 41: AND-OR ladder logic diagram
Exclusive OR
Let’s say we want the output to be true when the input 1 is false and input 2 is true, or
when input 1 is true and input 2 is false. Such a circuit is called Exclusive OR (XOR).
O1 = I1’ * I2 + I1 * I2’
Figure 42: Ex-OR gate diagram
Example (XOR Circuit):
Create a ladder logic diagram to turn on light L1 when SW1 is true and SW2 is false, or
when SW1 is false and SW2 is true. Assume SW1 is connected to input (I1), SW2 is
connected to input (I2), and output L1 is connected to (O1). Test your logic on the Trilogi
simulator.
I2
I1
O1
SW1 L1
( ) AND-OR Circuit
SW2
SW3
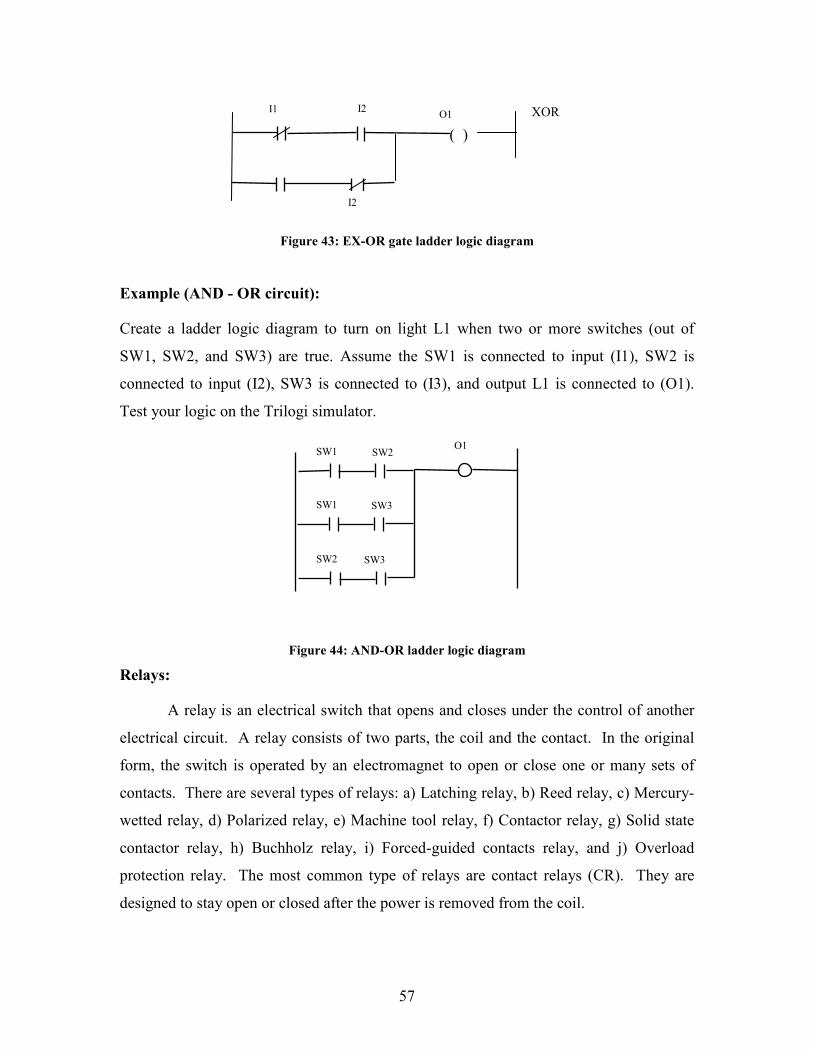
57
Figure 43: EX-OR gate ladder logic diagram
Example (AND - OR circuit):
Create a ladder logic diagram to turn on light L1 when two or more switches (out of
SW1, SW2, and SW3) are true. Assume the SW1 is connected to input (I1), SW2 is
connected to input (I2), SW3 is connected to (I3), and output L1 is connected to (O1).
Test your logic on the Trilogi simulator.
Figure 44: AND-OR ladder logic diagram
Relays:
A relay is an electrical switch that opens and closes under the control of another
electrical circuit. A relay consists of two parts, the coil and the contact. In the original
form, the switch is operated by an electromagnet to open or close one or many sets of
contacts. There are several types of relays: a) Latching relay, b) Reed relay, c) Mercury-
wetted relay, d) Polarized relay, e) Machine tool relay, f) Contactor relay, g) Solid state
contactor relay, h) Buchholz relay, i) Forced-guided contacts relay, and j) Overload
protection relay. The most common type of relays are contact relays (CR). They are
designed to stay open or closed after the power is removed from the coil.
I1 O1
( )
XOR I2
I2
SW1 SW2
SW1 SW3
SW2 SW3
O1
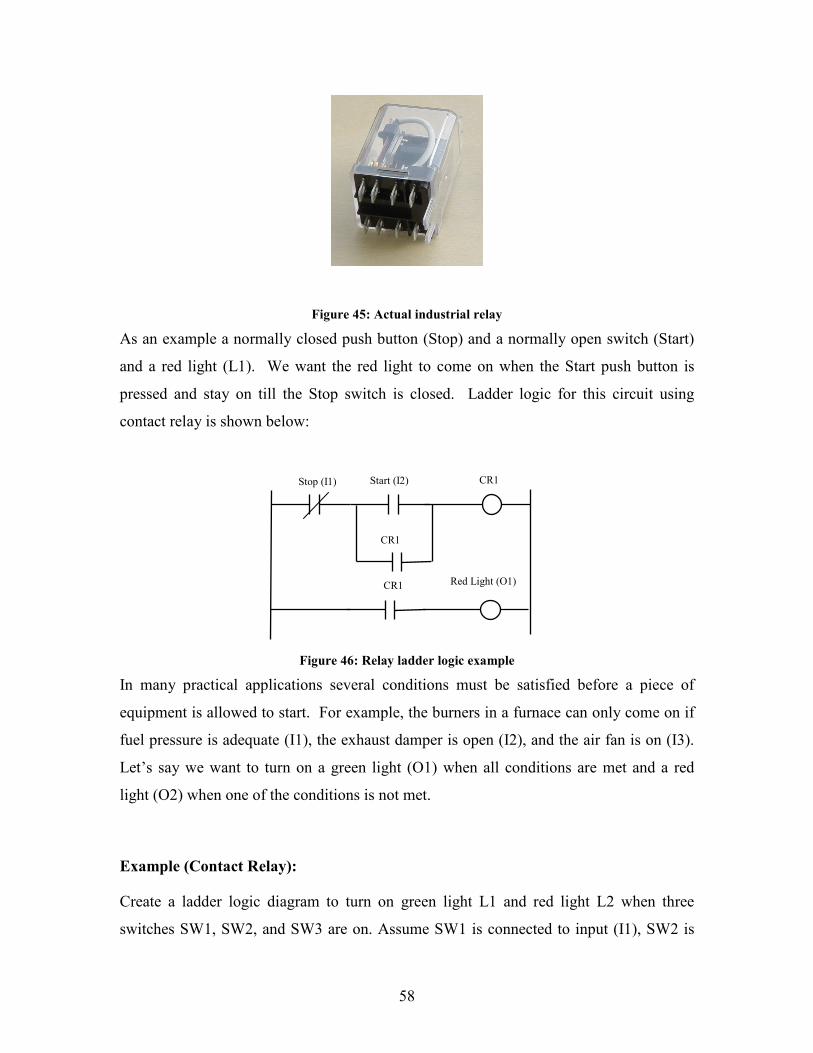
58
Figure 45: Actual industrial relay
As an example a normally closed push button (Stop) and a normally open switch (Start)
and a red light (L1). We want the red light to come on when the Start push button is
pressed and stay on till the Stop switch is closed. Ladder logic for this circuit using
contact relay is shown below:
Figure 46: Relay ladder logic example
In many practical applications several conditions must be satisfied before a piece of
equipment is allowed to start. For example, the burners in a furnace can only come on if
fuel pressure is adequate (I1), the exhaust damper is open (I2), and the air fan is on (I3).
Let’s say we want to turn on a green light (O1) when all conditions are met and a red
light (O2) when one of the conditions is not met.
Example (Contact Relay):
Create a ladder logic diagram to turn on green light L1 and red light L2 when three
switches SW1, SW2, and SW3 are on. Assume SW1 is connected to input (I1), SW2 is
CR1 Start (I2) Stop (I1)
Red Light (O1) CR1
CR1

59
connected to input (I2), SW3 is connected to input (I3), and the internal contact relay is
connected to CR1. Output L1 is connected to (O1) and output L2 is connected to (O2).
Test your logic on the Trilogi simulator.
Figure 47: Contact relay ladder logic
Timers
A timer simply delays turning ON the output signal. In other words, after input turns ON
we wait x seconds before activating an output. Let’s say we want the red light to come
on 20 seconds after a pushbutton is pressed. Let’s assume a push button is connected to
input 6 (I6), and the red light is connected to output 1 (O1).
Figure 48: Timer ladder logic diagram
1. Click Edit to open I/O Table. Press to move toward the timers.
Figure 49: Trilogi I/O timer input
CR1 I1
CR1
CR1 O2 (R)
O1 (G)
I2 I3
+ - T1 (20) I6
O1 T1

60
2. Type in TIM1 in the timer label and set its value (delay timing) to 100 and press
enter. A window would appear as follows:
3. To check the simulation of the program, select Simulate and click run or Ctrl +
F9. A window would appear as follows:
Figure 50: Trilogi timer program ladder logic simulator
Figure 51: Trilogi PLC ladder logic using timer
Example (Timer):
Create a ladder logic diagram to turn on light L1 using timer T1 when switch SW1 is
turned on. Assume the SW1 is connected to input (I1) output L1 is connected to (O1).
Test your logic on the Trilogi simulator.

61
Counters
A counter is similar to a timer. It counts up or down. Let’s say that after the push button
is pressed we count down from 100 to 0 and then turn on the red light. Let’s assume a
push button is connected to input 6 (I6), and the red light is connected to output 1 (O1).
Figure 52: Single input Counter use ladder logic example
1. Click Edit to open the I/O Table. Press to move toward the
Counters.
2. Type in C1 in the timer label and press enter. A window would appear as follows:
Figure 53: I/O table counters
+
- C1 (100) I6
O1 C1

62
Figure 54: Counter example in Trilogi
To check the simulation of the program, select Simulate and click run or Ctrl + F9. A
window would appear as follows:
Figure 55: Counter example simulation program
Example (Counter):
Create a ladder logic diagram to turn on light L1 using counter C1 when switch
SW1 is turned on. Assume the SW1 is connected to input (I1) and output L1 is connected
to (O1). Test your logic on the Trilogi simulator. Each time the switch is true, the counter
goes up by one.

63
Sequencer
Sequencers are used when a process involves repeating some operations. A
sequencer can be used for diagnostics or control when a machine operates within a set
sequence of events. An example of a set sequence of events would be: air blows off a
mold, the mold closes, high pressure is engaged, and if the temperature is good, an
injection cylinder pushes material into the mold, timer times up, and the mold opens.
Then the cycle would start all over again.
Figure 56: Sequencer ladder logic example
Notice that Relays, Timers, Counters, and Sequencers are output and input device.
Example (Sequencer):
Create a ladder logic diagram to turn on light L1 using sequencer SEQ1 when switch
SW1 is turned on. Assume the SW1 is connected to input (I1) and output L1 is connected
to (O1). Test your logic on the Trilogi simulator.
5.3 Process Control
As described in previous chapters about process and its control, this section
continues simple PLC program sequences to explain expert level process control using
PID functions in PLC. In order to describe feedback process control functions, theoretical
background is described in the following pages.
+
- SEQ1 I6
O1 SEQ1:1

64
5. 3.1 Process control models
A process control model basically consists of two major components: process and
controller. The process has input and a manipulated variable, known as the control
variable. The process output is called a process variable. This variable is measured using
a sensor. The desired value of the process variable is known as a set point or even as a
reference point. Control error is nothing but the difference between the set point and the
process variable. The main purpose of the complete process control model is to maintain
the process variable close to the desired value. The process to achieve the desired value is
known as feedback control looping. Taking these terminologies into consideration,
process control models are classified into two categories:
a. Static models
b. Dynamic models
A static model consists of steady state regulation between an input signal and a
process signal. This model can be attained by using an open loop system where the
system is set to a certain constant value, and the process output is measured when it
reaches its steady state. Another approach to attaining a static model is to use a close loop
system by setting the set point to a certain constant value, and the control variable is
measured in steady state. The major drawback of this model is that the process needs to
be repeated again and again for the full range of values. Also, in certain conditions it is
not possible to move the process over the full operating range.
A dynamic model consists of the relation between input and output signals during
its short-term existence and is mostly used where there is little deviation from
equilibrium. The only system to which this model can be applied is the time invariant
system. Similar to the above described basic models, there are many models, depending
upon the complexity and response of the system.

65
5. 3.2 PID control
PID control, referred to as feedback control, looks deceptively simple, although it
has enabled a major breakthrough in control and communication as well as
instrumentation areas. In addition to the previously explained feedback control, if the
process variable increases when the manipulated variable is increased, then it is known as
negative feedback control.
Proportional control relates to a proportional response in respect to gain by setting
upper and lower limits to the variables to adjust error. A high proportional gain results in
a large change in the output for a given change in error. If the proportion is high, the
system becomes unstable. In contrast with a small gain, the control gain is too small
when responding to the system.
Integral control is proportional to both the magnitude of the error and duration of
the error. Summation of integrated error precisely gives the accumulated offset. The
accumulated gain is then coupled with integral gain with controller output. Integral term
accelerates the movement of process toward the set point and eliminates residual error.
Derivative control is the rate of change of process error calculated by determining
the slope over time and then coupled with the rate of change of derivative gain. The
derivative term slows the rate of change of the controller output and its effect is
noticeable close to the set point.
A combination of all the three control techniques is nothing but PID
(Proportional-Integral-Derivative control). Considering the benefits and losses of all the
control techniques, PID stands to be an excellent option in process control.
Drawbacks of PID control process:
1. Higher order processing problem
2. System with long dead time

66
3. System with oscillatory modes.
5. 3. 3 Controller Design Methods
In order to maintain the system in stable mode, it must be controlled. Hence, the
few control methods used that are dependent on the system requirements are as follows:
a. Manual tuning: This method is non-mathematical, but trial and error, so it requires an
experienced professional for tuning the hardware.
b. Ziegler–Nichols: This method is the most recognized and proven and is widely used to
control the hardware. This method is used in two ways: Step response method and
frequency response method.
c. Software tools: This method is newly used depending on the PID control process used.
It requires a trained technician with computer expertise. But, it allows simulated results
to analyze the hardware output conditions.
d. Cohen-Coon: This method, similar to the Zeigler-Nichols method, is accepted as one
of the best methods to control the PID control process. Due to its disadvantages, it
can only be used for first order processes.
5. 3. 4 PID Computer code
Considering the various methods for designing the controller, certain computer
software codes can also be generated with the PLC applicable software in order to
generate a PID feedback mechanism. A very simple way to do this is to create relation
equations. In these relations, actual formulas for the respective gains are stored in certain
values and retrieved whenever required. Another way to generate computer code is by
using IF THEN ELSE functions, if the computer program allows for TBasic language for
PID programming.

67
IF THEN ELSE RULE:
E1 = SP1 – T1 E2 = SP2 – T2 E3 = SP3 – T3 Rule1: IF E1 = 0 THEN F Rule2: ELSE E2 ≠ 0 AND E3 ≠0 THEN H
Figure 57: Water temperature control system diagram
TRILOGI PLC PROGRAM
HEATER (H)
FAN (F)
T1
T2
T3
SP1 SP2 SP3
ADC1
ADC2
ADC3
DAC1
DAC2
FAN (F) HEATER (H)
SENSOR T1
SENSOR T2
SENSOR T3
TEMPERATURE CONTROLLED ENVIRONMENT
WATER

68
As a brief introduction of the software as well as the methods to determine output, this
section also explains about PLC programs created for this course/lab. Before initializing
the program, a logical flow diagram is created to clarify the function of a water
temperature controlled system. This flow diagram is used to determine the PID values for
calculating the PLC outputs. These PID values are dependant on the inputs of RTDs
attached in the water temperature control setup. Various parameters required to derive
PID values are: process variables, error values, and respective gain. Depending on the
parameters, PID values can be determined with tuning. The flow diagram for the water
temperature control setup follws, which can be divided into two steps.
5.4 Flow Diagram:
The flow diagram of the PLC program was designed depending on the logical
flow of the hardware setup and user requirements. As the user can change the logical
flow of the setup, the default logical flow was build as shown on the previous page. As
shown in the figure, the input from the top level sensor (90 set value) is connected to the
output of the fan, while the mid level sensor (80 set value) and bottom level sensor (70
set value) are connected to the heater output. The mid-level and bottom-level sensor
trigger output as true only if the temperature drops below the required stability levels.
The output will be true, if it follows in a similar way as the top level sensor and the other
two sensors.
5.5 Determining PID values by using various methods:
PID value using Microsoft Excel:
The second step toward the program ladder logic is to determine PID values from
the raw data. PID values were determined using the Ziegler-Nichols oscillation method,
taking into consideration the critical gain and determining the response. Also manual
tuning was used to stabilize the system. Water temperature control uses PID function of
PLC in-order to control the system. As PID is used for feedback control, one of the above
mentioned controlling methods is selected. In the water temperature control system, two

69
methods mainly Zeigler-Nicholas and software tools are used in order to determine the
PID constants. Generally Zeigler-Nicholas method is used when a mathematical model is
unavailable for a particular system. But the system also needs to be verified using
software tool. Zeigler-Nicholas method can be used in both open as well as closed loop
control system. A generalized feedback control equation used to calculate the constants in
PID is as follows:
)0(
0
=+++= ∫ t
t
DIPtPV
dt
dEKEdtKEKPV
Ziegler-Nicholas closed loop tuning method is one of the oldest methods to obtain the
controlling parameters. Due to software implementation methods, this method is hardly
used to obtain the required parameters. Zeigler-Nicholas method uses the ultimate gain
value (UK ), and ultimate period of oscillation (
UP ), to calculate the gain of proportional
controller (CK ). The constants
CK , integral time (
IT ) and derivative time (
dT ) can be
obtained by feedback control. In order to determine all the values, following steps are
considered:
1. Integral and Derivative gains are set to zero.
2. IT is set to maximum value (generally 999) and
dT is kept zero.
3. Disturbance is created by changing the set point. Proportional gain is adjusted
until constant amplitude is not obtained.
4. UK And
UP are obtained by using proportional gain only.
5. Integral and Derivative gains are calculated as per derived Ziegler-Nicholas
closed loop tuning equation.
CK is determined by transferring PID control program (using only P value) to the Trilogi
PLC hardware. For various CK values following chart is obtained.
UP can be calculated
from the following chart.

70
Figure 58: Data plot for tuning PID controller
Finally using the Zeigler-Nicholas relation, integral and derivative values are obtained as
follows:
Ziegler–Nichols method:
Ku 6
Pu 4 Descriptions:
Ku Critical gain
Kc Ti Td Pu Oscillation period
P 3.00 Kc Proportional gain
PI 2.73 3.33 Ti Integral gain
PID 3.53 2.00 0.50 Td Derivative gain
Figure 59: Zeigler-Nicholas calculations
PID values using software tools:
PID values are verified using Sysquake PID simulation software tool. Sysquake
parameters are set to categorize the system depending on the method used (Zeigler-
Nichols method). Following procedure is followed to determine the PID values in
Sysquake:
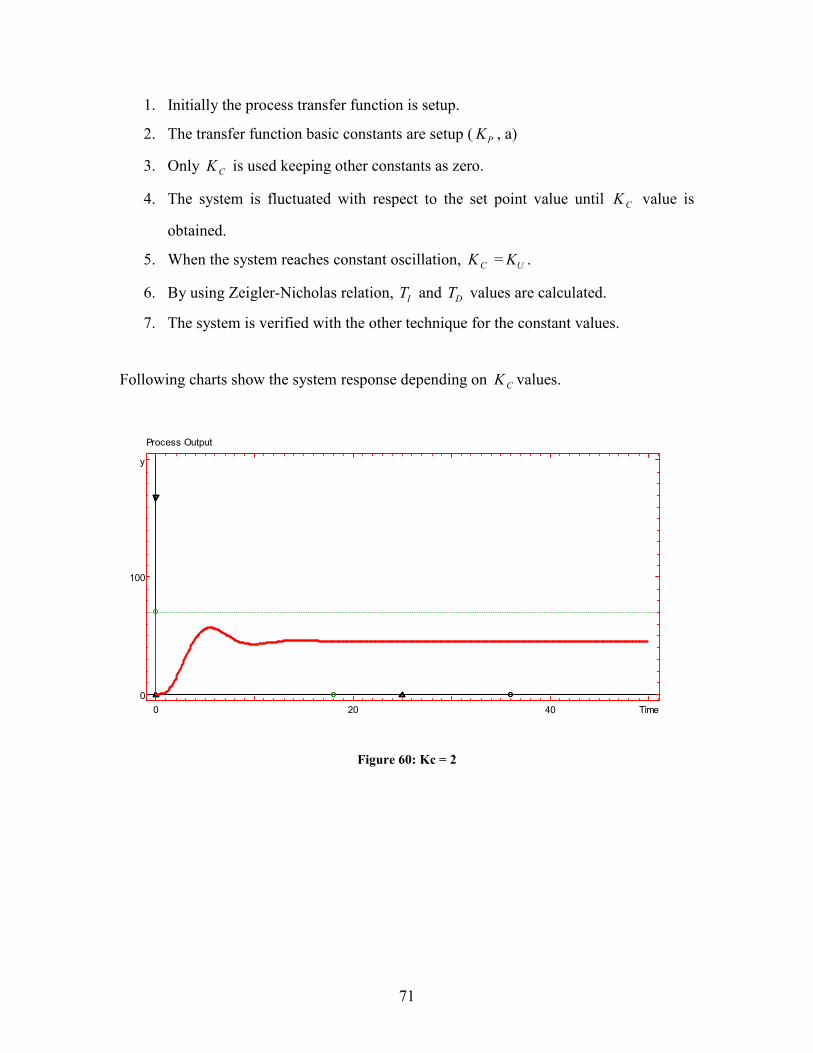
71
1. Initially the process transfer function is setup.
2. The transfer function basic constants are setup (PK , a)
3. Only CK is used keeping other constants as zero.
4. The system is fluctuated with respect to the set point value until CK value is
obtained.
5. When the system reaches constant oscillation, CK =
UK .
6. By using Zeigler-Nicholas relation, IT and
DT values are calculated.
7. The system is verified with the other technique for the constant values.
Following charts show the system response depending on CK values.
0 20 40 Time
0
100
y
Process Output
Figure 60: Kc = 2

72
t=3.25, y=67.48
0 20 40 Time
0
100
y
Process Output
Figure 61: Kc = 4
t=2.62, y=69.43
0 20 40 Time
0
100
y
Process Output
Figure 62: Kc = 6

73
t=2.26, y=68.13
0 20 40 Time
0
100
y
Process Output
Figure 63: Kc = 8
As from the figure
CK = 6 makes the system stable as compared other values, hence is
considered to be the ultimate gain value UK = 6. After selecting the
UK and determining
UP value by using Ziegler-Nicholas relation, other constants are calculated. PID values
obtained are input to the simulation tool for gaining the final PID process output:
Kp: 1.01
a: 1.00
Controller
P I PI PD PID
K: 3
Ti: 2
Td: 0.5
N: 10
b: 1.3
Figure 64: Constant values

74
0 50 Time
0
100
y
Process Output
Figure 65: PID output
5.6 PLC program using PID values:
Defining the logical flow of the program and determining the PID values, finally
the actual PLC ladder logic program can be build simply. The ladder logic program uses
the build-in custom functions and clock triggers. Custom functions include defining PID,
computing PID values, and finally, providing desired output to required output. Clock
trigger function verifies the ON condition as TRUE with a 1-second time difference to
avoid lag or changes in input.
Verification of the program before transferring to a T100MD+ PLC card should
be done using the simulation function in the TRiLOGI software. The figure above shows
the build-in custom functions becoming activated. The details of the functioning program
can be observed in the view button, which displays its data in two screens as mentioned
in the previous chapters. After the same file is transferred to a T100MD+ card, a similar
window of online monitoring is generated where the control checkbox plays an important
role in direct control over hardware from the TRiLOGI software.

75
5.7 PLC Program using IF THEN function:
Verification of the program before transferring to T100MD+ PLC card is to be
done in a similar way to the PID program using simulation function in the TRiLOGI
software. The main difference in the PID and IF THEN ELSE program is TBASIC
language usage for creating custom function. The IF THEN ELSE logic is done in
TBASIC language, which is similar to C programming language, making the logical
relation easy to understand and apply. Similar to the PID program, the same file is
transferred to T100MD+ card. Also, a similar window of online monitoring is generated
where the control checkbox plays an important role in direct control over the hardware
from the TRiLOGI software.
After the basic required connections, like when the hardware and software setups
are done, the final part of the setup integration and testing are done to verify the system.

76
Chapter 6.0
CONCLUSION AND FUTURE WORK
6.1 CONCLUSION
A PLC-based traffic light and water temperature control systems were developed.
The laboratory material will be integrated into the IENG 405/505 course at WVU. The
students will learn Boolean algebra and process control theory in the lecture material and
will get hands-on experience with real time control using the hardware and software
developed in this work.
6.2 FUTURE WORK
The following points may be considered for future work or additional research:
1. Feedback process control using SCADA in PLC with xml programming can be
considered as a possible extension to control the available hardware setup.
2. A water temperature-controlled hardware setup can be made complex using level
control sensors and actuators.
3. A water temperature-controlled hardware setup can be modified by using Pulse
Width modulation (PWM) programmed using TBASIC.
4. An SMS and e-mailing facility for error feedback for evaluating the traffic light
control and water temperature control setups can be added in future.

77
REFERENCES
1. http://www.hq.nasa.gov/office/codeq/software/ComplexElectronics/h_glossary.ht
m, 12 June 2008
2. http://www.answers.com/topic/control-system, 17 June 2008
3. http://www.fuzzy-logic.com/Ch1.htm, 17 June 2008
4. Fuzzy Logic. i.e. Zadeh, L.A. (1965). “Fuzzy sets,” Information and Control 8
(3): 338-353
5. Jager, Rene' (1995). Fuzzy Logic in Control. Ph.D. Thesis, Delft University of
Technology, Department of Electrical Engineering, Control Laboratory, pp. 312,
Delft, The Netherlands. ISBN 90-9008318-9.
6. http://www.ecst.csuchico.edu/~hanzi/fuzzy/final.html, 10 July 2008
7. Zadeh, H.S., Constrained multi-objective optimization of a fuzzy logic controller-
application in a non-linear system and a goal-seeking rover, Control Applications,
2003. CCA 2003. Proceedings of 2003 IEEE Conference on, Volume 1, Issue 23-
25, June 2003 Page(s): 240 - 244 Vol.1
8. Harjono (2001), On-line Temperature Control Laboratory. Honors Thesis, School
of Mechanical Engineering, The University of Western Australia
9. Remote Laboratories: New Technology and Standard Based Architecture, Hence
Benmohamed, Arnaud Levleve, Patrick Prevot, ICTT Laboratory/INSA, Lyon,
France
10. Work In Progress - A Remote e-Laboratory for Student Investigation,
Manipulation, and Learning, Imbrie, P.K.; Raghavan, S., Frontiers in Education,
2005. FIE apos: 05. Proceedings 35th Annual Conference, Volume, Issue, 19-22
Oct. 2005 Page(s): F3J-13 - F3J-15,
11. Delivering an engineering laboratory course using the internet, the post office,
and a campus visit, Alexander, David G, Smelser, Journal of Engineering
Education, Jan 2003
12. C. C. Ko, B. M. Chen, S. H. Chen, V. Ramakrishnan, R. Chen, S. Y. Hu and Y.
Zhuang, "A large scale web-based virtual oscilloscope laboratory experiment,"

78
IEE Engineering Science and Education Journal, Vol. 9, No. 2, pp. 69-76, April
2000.
13. Mass customized testing and manufacturing via the internet, Robotics and
Computer-Integrated Manufacturing, Volume 14, Number 5, October 1998, pp.
377-387(11)
14. The Adaptive PID Controller Using OPC Toolbox, T. Chvostek, M. Foltin, Ľ.
Farkas, Syprin s. r. o., Žehrianska 10, 851 05 Bratislava, Slovak Republic
15. PID Without a PhD, Tim Wescott, Wescott Design Services
16. Teaching Reliable, Secure, and Survivable Distributed Control System Design,
R. Lessard, J. Beneat, Electrical and Computer Engineering Department, Norwich
University
17. http://www.norwich.edu/, 25 July 2008
18. Water flow control for air-conditioner using inverter-controlled induction motor
drives, Ming-Chi Chang Jennshing Wang, Yen-Shin Lai, Dept. of Electr. Eng.,
Nat. Taipei Univ. of Technol., Taipei. Power Engineering Society Summer
Meeting, 2000. IEEE, Publication Date: 2000, Volume: 4, On page(s): 2459-
2462 vol. 4
19. Innovative initiatives in control education at Ryerson Polytechnic University.
Fuzzy-logic control of the 3D-helicopter simulator, Zywno, M.S.; Pereira, D.
American Control Conference, 2000. Proceedings. Volume 6, Issue, 2000
Page(s):3991 - 3995 vol.6
20. Control architectures for autonomous underwater vehicles, Valavanis, K.P.;
Gracanin, D.; Matijasevic, M.; Kolluru, R.; Demetriou, G.A. Control Systems
Magazine, IEEE, Volume 17, Issue 6, Dec 1997 Page(s): 48 – 64
21. Design of Fuzzy Sliding Mode Controller with Applications to Nonlinear
Systems Shi-Yuan Chen and Hung-Yuan Chung, Department of Electrical
Engineering, National Central University, Chungli, Taiwan 320, R.O.C.
22. http://www.nsf.gov/pubs/2007/nsf07524/nsf07524.htm, 10 August 2008
23. http://www.dcitech.com/TriPLC/M/T100MD.htm, 14 August 2008
24. www.tri-plc.com/tbasic.pdf, 10 September 2008
25. www.lt-automation.com/PTS%20T100%20Brochure.pdf, 12 September 2008

79
26. http://ga.water.usgs.gov/edu/phdiagram.html, 22 September 2008
27. http://en.wikipedia.org/wiki/PID_controller, 4 October 2008

80
Appendix A: PLC Exercises
1. Create ladder logic to:
a. Turn on red light when SW1 is on, turn off red light when SW1 is off
b. Turn on yellow light when SW2 is on, turn off yellow light when SW2 is
off
c. Turn on left yellow light when SW3 is on, turn off left yellow light when
SW3 is off
d. Turn on left green light when SW4 is on, turn off left green light when
SW4 is off
e. Turn on green light when SW5 is on, turn off green light when SW5 is off
2. Create ladder logic to check if the M/A switch is on. If the switch is off (manual)
then carry out the task in Exercise #1. If the selector switch is on (auto) then turn
on red light for 30 seconds, yellow light for 10 seconds, and green light for 20
seconds. The program should continue as long as the selector switch is in ON
(auto) mode.
3. Add left turn signals (left green, left yellow) to Exercise #2 and synchronize
timing.
4. Design an automatic garage door. Identify the inputs and outputs. Develop
ladder logic digram to open and close the door.
5. Create a ladder logic diagram to turn on 1) Output Ignition sensor L2 when 4
inputs Door (SW1), Seat Belt (SW2), Key In (SW3) is ON and 2) Output Start
Car L1 when Ignition (SW4), Trans Park (SW5), and Key In (SW3) is ON. If
ignition is ON initially then SW3 and SW5 should start car. Test your logic on the
Trilogi simulator.
6. Create a ladder logic diagram to turn on lights L1 when any two out of the three
switches SW1, SW2, and SW3 are on. After 30 seconds, light L1 should turn off
and light L2 should turn on for 30 seconds. The L1, L2 sequence should continue
until two or more switches are off. Test your logic on the Trilogi simulator.

81
7. Create a ladder logic diagram to turn on machine L1 (a press machine) when two
push buttons PB1 and PB2 are triggered together within 25 second. If only one
push button is pushed, light L1 does not turn on. If OFF switch is used, no output
is observed at any stage. Test your logic on the Trilogi simulator.
8. Create a ladder logic diagram to turn on Light L1 using Start switch SW1, which
continues to trigger Buzz alarm L2 for (20 seconds). After Buzz alarm, heating
coil (L3) is turned ON (100 seconds). After heating coil, fan (L4) is turned ON
(120 seconds). If start switch is used, the cycle is terminated after Fan output. If
Auto switch SW3 is turned ON, the same cycle continues. If stop switch SW2 is
used, the circuit is turned off. Test your logic on the Trilogi simulator.
9. Create a ladder logic diagram to turn on light L1 when 1) Switch SW1, a limit
switch, LS1 and LS3 are turned ON with 15 counts 2) Timer TIM1 having 20 set
value is triggered by limit switch LS2. Use Reset switch RS1 to reset the whole
circuit. Test your logic on the Trilogi simulator
10. Create a ladder logic diagram to turn on light L1 when two timers, TIM1 with set
value 20 and timer TIM2 with set value 15, trigger counter (5 counts) using
switch SW1. The timing cycle should repeat ly until light L1 is ON. Test your
logic on the Trilogi simulator.
11. Create a ladder logic diagram to turn on lights in sequence when the START
switch is ON. The sequencer starts with light L1 and L8 together, followed by L2
and L7, L3 and L6, and finally L4 and L5. The sequence continues until the STOP
switch is not ON. If MANUAL switch is used, the circuit is operated manually.
Sequence counter counts until it reaches 4 units. The circuit should be continuous
until only STOP is used. Test your logic on the Trilogi simulator.
12. Take one digital input (DI1) to switch the heater on-off (Out1).
13. Take two digital inputs (DI1, DI2) to switch the heater (Out1) and fan (Out2) on-
off.
14. Take input from the one sensor (Top level, TS1) and switch the heater (Out1) on-
off and maintain environment temperature 70 (using PID and IF THEN ELSE).

82
15. Take inputs from two sensors (Top, TS1 and Bottom, TS3 level) to switch on-off
heater (Out1) and fan (Out2) respectively maintaining the environment
temperature of 70 degrees (using PID and IF THEN ELSE).
16. Take inputs from three sensors (All levels, TS1, TS2, TS3) to switch on-off heater
(Out1) and fan (Out2), respectively, maintaining the environment temperature of
70 degrees (using PID and IF THEN ELSE).
17. Transfer each program in T100MD+ PLC card onto a local computer.
18. Transfer each program in T100MD+ PLC card remotely (Trilogi 6.12v with Java
update provided for students transferring the program remotely.)

83
Appendix B: PLC Exercise Solutions
1. Create ladder logic to:
a. Turn on red light when SW1 is on, turn off red light when SW1 is off
b. Turn on yellow light when SW2 is on, turn off yellow light when SW2 is
off
c. Turn on left yellow light when SW3 is on, turn off left yellow light when
SW3 is off
d. Turn on left green light when SW4 is on, turn off left green light when
SW4 is off
e. Turn on green light when SW5 is on, turn off green light when SW5 is off
Figure 66: Solution 1.a
Figure 67: Solution 1.b

84
Figure 68: Solution 1.c
Figure 69: Solution 1.d
Figure 70: Solution 1.e
2. Create ladder logic to check if the M/A switch is on. If the switch is off (manual)
then carry out task in Exercise #1. If the selector switch is on (auto) then turn on
red light for 30 seconds, yellow light for 10 seconds, and green light for 20
seconds. The program should continue as long as the selector switch is in on
(auto) mode.

85
Figure 71: Solution 2

86
3. Add left turn signals (left green, left yellow) to Exercise #2 and synchronize
timing.

87
Figure 72: Solution 3
4. Design an automatic garage door. Identify the inputs and outputs. Develop a
ladder logic diagram to open and close the door.
Figure 73: Solution 4

88
5. Create a ladder logic diagram to turn on 1) Output Ignition sensor L2 when 4
inputs Door (SW1), Seat Belt (SW2), Key In (SW3) is ON and 2) Output Start
Car L1 when Ignition (SW4), Trans Park (SW5), and Key In (SW3) is ON. If
ignition is ON initially, then SW3 and SW5 should start the car. Test your logic
on the Trilogi simulator.
Figure 74: Solution 5

89
6. Create a ladder logic diagram to turn on lights L1 when any two out of the three
switches SW1, SW2, and SW3 are on. After 30 seconds light L1 should turn off
and light L2 should turn on for 30 seconds. The L1, L2 sequence should continue
until two or more switches are off. Test your logic on the Trilogi simulator.
Figure 75: Solution 6

90
7. Create a ladder logic diagram to turn on machine L1 (a press machine) when two
push buttons PB1 and PB2 are triggered together within 25 second. If only one
push button is pushed, light L1 does not turn on. If the OFF switch is used, no
output is observed at any stage. Test your logic on the Trilogi simulator.
Figure 76: Solution 7

91
8. Create a ladder logic diagram to turn on light L1 using Start switch SW1, which
continues to trigger Buzz alarm L2 for (20 seconds). After Buzz alarm, heating
coil (L3) is turned ON (100 seconds). After heating coil, fan (L4) is turned ON
(120 seconds). If Start switch is used, the cycle is terminated after fan output. If
Auto switch SW3 is turned ON, the same cycle continues. If stop switch SW2 is
used, the circuit is turned off. Test your logic on the Trilogi simulator.

92
9. Create a ladder logic diagram to turn on light L1 when 1) Switch SW1, a limit
switch, LS1 and LS3 are turned ON with 15 counts, 2) Timer TIM1 having 20 set
value is triggered by limit switch LS2. Use Reset switch RS1 to reset the whole
circuit. Test your logic on the Trilogi simulator
Figure 77: Solution 9

93
10. Create a ladder logic diagram to turn on light L1 when two timers TIM1 with set
value 20 and timer TIM2 with set value 15 trigger counter (5 counts) using switch
SW1. The timing cycle should repeat continuously until light L1 is ON. Test your
logic on the Trilogi simulator.
Figure 78: Solution 10

94
11. Create a ladder logic diagram to turn on lights in sequence when the START
switch is ON. The sequencer starts with light L1 and L8 together, followed by L2
and L7, L3 and L6, and finally L4 and L5. The sequence continues until STOP
switch is not ON. If MANUAL switch is used, the circuit is operated manually.
Sequence counter counts till 4 units. The circuit should be continuous until only
STOP is used. Test your logic on the Trilogi simulator.
Figure 79: Solution 11

95
12. Take one digital input (DI1) to switch on-off for the heater (Out1).
Solution
Figure 80: Solution 12
13. Take two digital inputs (DI1, DI2) to switch on-off for the heater (Out1) and fan
(Out2).
Figure 81: Solution 13

96
14. Take input from the one sensor (Top level, TS1) and switch on-off for the heater
(Out1) and maintain environment temperature of 70 degrees(using PID and IF
THEN ELSE).

97
Figure 82: Solution 14
15. Take inputs from two sensors (Top, TS1 and Bottom, TS3 level) to switch on-off
heater (Out1) and fan (Out2) respectively maintaining environment temperature
of 70 degrees (using PID and IF THEN ELSE).

98
Figure 83: Solution 15

99
16. Take inputs from three sensors (All levels, TS1, TS2, TS3) to switch the on-off
heater (Out1) and fan (Out2), respectively, maintaining environment temperature
of 70 degrees (using PID and IF THEN ELSE).
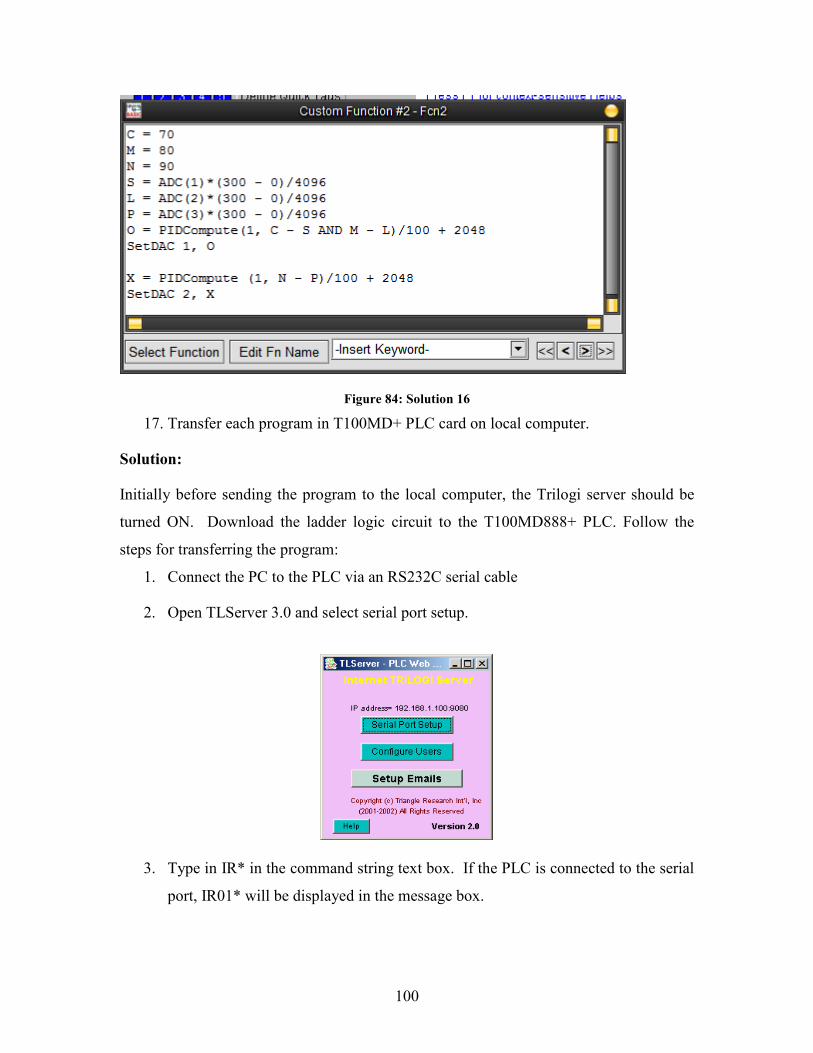
100
Figure 84: Solution 16
17. Transfer each program in T100MD+ PLC card on local computer.
Solution:
Initially before sending the program to the local computer, the Trilogi server should be
turned ON. Download the ladder logic circuit to the T100MD888+ PLC. Follow the
steps for transferring the program:
1. Connect the PC to the PLC via an RS232C serial cable
2. Open TLServer 3.0 and select serial port setup.
3. Type in IR* in the command string text box. If the PLC is connected to the serial
port, IR01* will be displayed in the message box.

101
4. After receiving output message as IR01,* close the serial communication setup
window and minimize the TLServer window.
5. Now open the Trilogi Version 6.13. Open a new file or saved file to transfer the
program to PLC.
6. Select Controller and click on Program transfer to PLC or Ctrl + T.
7. A window will appear as shown, check that the details are the same as shown in
the next window and then click OK.

102
18. Transfer each program in T100MD+ PLC card remotely (Trilogi 6.12v with Java
update provided for students transferring the program remotely.)
Solution:
First start up the internet browser, as earlier versions of the browser may have some bugs
in the JVM implementation and hence may not work well with TRiLOGI.
Next, check the TLServer front panel for its IP Address. If the system is running
TLServer on a PC without a network connection, it will probably show: IP Address =
127.0.0.1:9080. If the computer has the internet connection before starting up TLServer,
then the internet IP address of the PC can be seen. If the PC has both a local area network
connection as well as a direct internet connection, two IP addresses can be seen and
reported.
Now, if the IP Address http://127.0.0.1:9080, including the port number are in the
browser's "Address" (for IE5) or "URL" (for Netscape) text entry area, then the internet
java applet starts with the same interface of the Trilogi software, and the program can be
easily transferred similarly to the local transfer.
Related Documents