1 © Committee for the Development of CASBEE-City (pilot version for worldwide use) CASBEE - City Pilot version for worldwide use (2015) A Comprehensive city assessment tool applicable to various types of cities around the world Members of Committee for the Development of CASBEE - City (Pilot version for worldwide use) 2 nd December COP21 side event Fujino Junichi Shuzo Murakami Toshiharu Ikaga Shun Kawakubo NIES IBEC Keio University Hosei Universit y NIES: National Institute for Environmental Studies, IBEC: Institute for Building Environment and Energy Conservation e t.al.

Welcome message from author
This document is posted to help you gain knowledge. Please leave a comment to let me know what you think about it! Share it to your friends and learn new things together.
Transcript

1© Committee for the Development of CASBEE-City (pilot version for worldwide use)
CASBEE-City Pilot version for worldwide use (2015)
A Comprehensive city assessment tool
applicable to various types of cities around the world
Members of Committee for the Development of
CASBEE-City (Pilot version for worldwide use)
2nd December
COP21 side event
Fujino Junichi
Shuzo Murakami
Toshiharu Ikaga
Shun Kawakubo
NIES
IBEC
Keio University
Hosei University
NIES: National Institute for Environmental Studies, IBEC: Institute for Building Environment and Energy Conservation
et.al.
© Committee for the Development of CASBEE-City (pilot version for worldwide use)
Importance of conducting assessment of cities
City Profile
0
50
100
3.0
0.5
1.5 BEE=1.0
Understanding thereal condition of cities
Present Future
Medical check-ups are important for us in detecting diseases at an early
stage and living a long healthy life. Assessing a municipality is analogous
to having a medical check-up.
City-scale assessments should be conducted in order to understand the
local conditions and to consider effective measures for making cities,
towns and villages more sustainable.
2
© Committee for the Development of CASBEE-City (pilot version for worldwide use)
2015/12/3
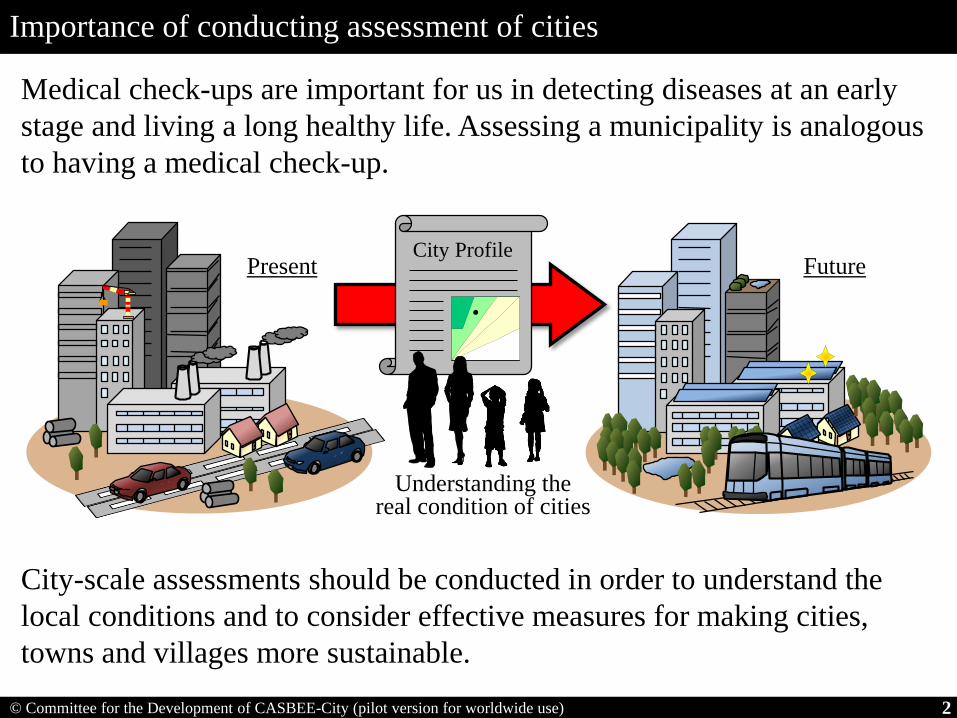
BREEAM: BRE Environmental Assessment Method (U.K.),
CASBEE: Comprehensive Assessment System for Built Environment Efficiency (Japan)
LEED: Leadership in Energy and Environmental Design (U.S.)
Housing & Building scale
Urban scale
City scale
CASBEE and other tools in the world
BREEAM(U.K.)
LEED(U.S.)
Green Star(Australia)
CASBEE(Japan)
(1990) (2001) (2003) (2001)
(2008) (2007) (2012) (2006)
(2011)
(developed year)
3
© Committee for the Development of CASBEE-City (pilot version for worldwide use)
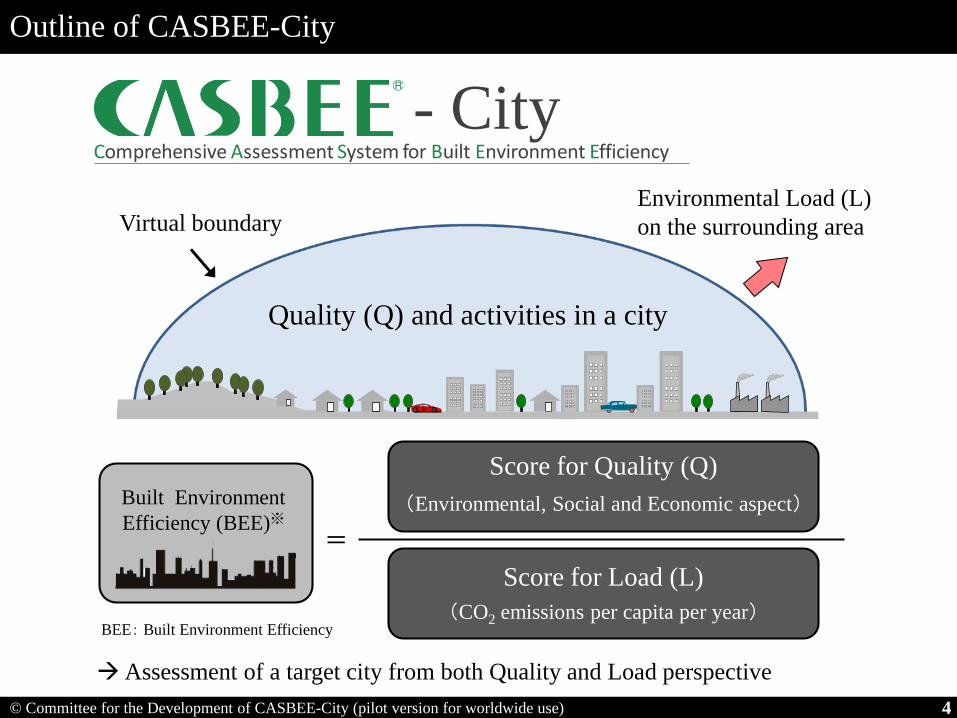
Outline of CASBEE-City
都市Comprehensive Assessment System for Built Environment Efficiency
=
BEE: Built Environment Efficiency
Built Environment
Efficiency (BEE)※
Quality (Q) and activities in a city
Virtual boundaryEnvironmental Load (L)
on the surrounding area
Score for Load (L)
(CO2 emissions per capita per year)
Score for Quality (Q)
(Environmental, Social and Economic aspect)
- City
Assessment of a target city from both Quality and Load perspective
4

© Committee for the Development of CASBEE-City (pilot version for worldwide use)
Assessment items for CASBEE-City (e.g. Japanese standard version)
Economic
aspects
Social
aspects
Environmental
aspects
・Local environmental
quality
・Resource recycling
・Living environment
・Social services
・Social vitality
・Industrial vitality
・Financial viability
Quality of a city (Q)
・CO2 emissions
from energy sources・CO2 sinks
・Nature conservation
Comprehensive assessment based on the concept of
Triple Bottom Line (TBL) and eco-efficiency
・CO2 emissions from
non energy sources
(per capita per year)
・Emission trading
BEE
Score for Q
Score for L=
Load (L)
5

© Committee for the Development of CASBEE-City (pilot version for worldwide use)
Visualization of city performance based on BEE (BEE chart)
0
50
100
3.0
0.5
1.5 BEE=1.03.0 1.5
0.5
100500
50
0
100Good
Poor
Good PoorEnvironmental load (L)
1.0BEE=S A B+
C
B-
Good (more sustainable)
Poor (less sustainable)
BEE of city X
=1.4 (=56/40)
Rank B+
: ★★★★★
:★★★★
:★★★
:★★
: ★40
56
S
A
B+
B-
C
BEE of a city
Score for Q
Score for L=
Qu
alit
y (
Q)
(CO2 emissions per capita per year)
6

© Committee for the Development of CASBEE-City (pilot version for worldwide use)
Visualization of city performance based on BEE (BEE chart)
7
Score for L
Go
od
Po
or
Sco
re fo
r Q
0 50 1000
50
100 BEE= 3.0 1.5 1.0
0.5
S A B+
C
B-
PoorGood
★★★★★ ★★★★ ★★★
★★
★
(Sustainable)
(Unsustainable)
High Quality
Low Quality
High Quality
Low Quality
Low Load High Load
Low Load High Load
Cities with
Cities with
Cities with
Cities with

© Committee for the Development of CASBEE-City (pilot version for worldwide use)
Assessment of whole municipalities (=1,750) in Japan using CASBEE-City
70-80%
60-70%
50-60%
40-50%
30-40%
20-30%
10-20%
0-10%
Results
Good
Poor
90-100%
80-90%
8

© Committee for the Development of CASBEE-City (pilot version for worldwide use)
0
50
100
3.0
0.5
1.5 BEE=1.03.0 1.5
0.5
100500
50
0
100
(Q
(Qual
ity))
Good
Poor
Good Poor(L(Environmental load))(CO2 per capita per year)
1.0
(Best)
(Worst)
(BEE)
S★★★★★
A★★★★
B+
★★★
B-
★★
C★
(Sustainable)
1995 (post-disaster situation)
1990 (pre-disaster situation)
2) Percentage of area heavily affected by earthquake: 2.3%
1) Decrease in GDP: 2.7%
3) Percentage of area affected by earthquake: 10%
2010 (current)
2025 (Future target)
9
Monitoring the reconstruction process of Kobe after big disaster in 1995
Visualization of reconstruction process using CASBEE-City tool
http://www.wbcsd.org/
uiikobereport.aspx
English report available at:
© Committee for the Development of CASBEE-City (pilot version for worldwide use)
Outline of CASBEE-City (Pilot version for worldwide use)
10
Assessment of cities around the world using
CASBEE-City (Pilot version for worldwide use)

© Committee for the Development of CASBEE-City (pilot version for worldwide use)
Assessment methodology of CASBEE-City (Pilot version for worldwide use)
Expanding Application Boundaries from Japanese Cities to Cities Worldwide
1.00 point (worst in Japan)
3.00 points (average level in Japan)
5.00 points (best in Japan)
CASBEE-City (Japanese standard version) (A tool developed for assessing Japanese cities)
CASBEE-City (Jap. standard version)
1.00 point(worst in the world)
3.00 points(average level in the world)
5.00 points(best in the world)
CASBEE-City (Pilot version for worldwide use)
11

© Committee for the Development of CASBEE-City (pilot version for worldwide use)
Assessment items and indicators will be carefully developed by referring
UN’s SDGs (Sustainable Development Goals) and ISO 37120, etc.
Assessment based on Triple Bottom Line perspectives
Assessment items for CASBEE-City (Pilot version for worldwide use)
Economic
aspect
Social
aspect
Environmental
aspect
Quality (Q) = Assessment from Env., Soc., and Eco. aspects
GHG emissions
per capita per year
Environmental Load (L)
12
© Committee for the Development of CASBEE-City (pilot version for worldwide use)
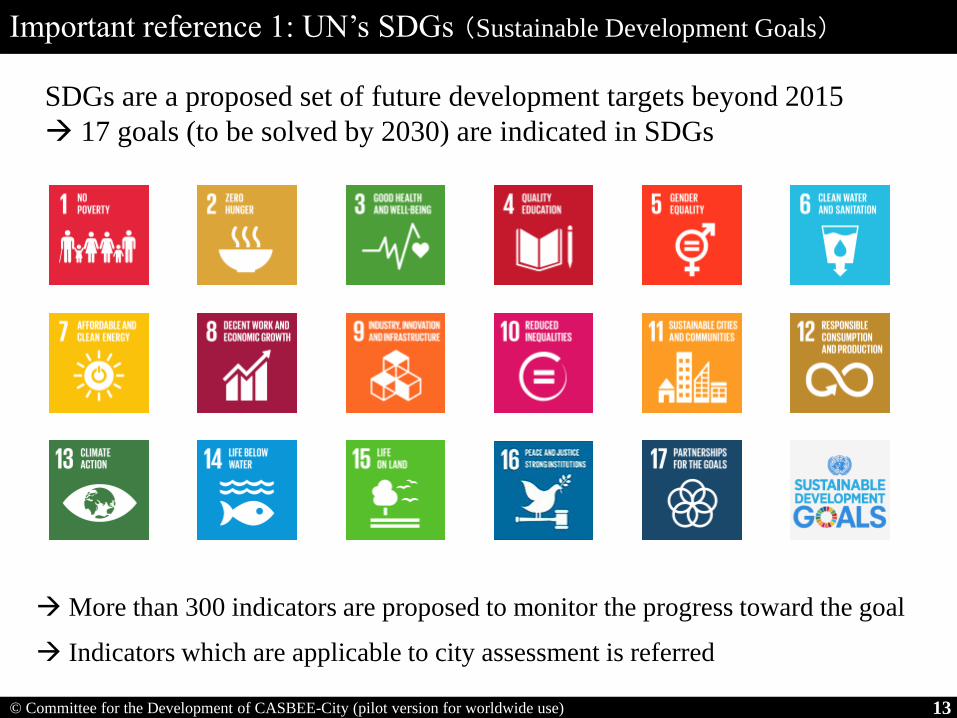
Important reference 1: UN’s SDGs (Sustainable Development Goals)
SDGs are a proposed set of future development targets beyond 2015
17 goals (to be solved by 2030) are indicated in SDGs
More than 300 indicators are proposed to monitor the progress toward the goal
Indicators which are applicable to city assessment is referred
13

© Committee for the Development of CASBEE-City (pilot version for worldwide use)
Important reference 2: ISO37120
100 Indicators
1. Economy
2. Education
3. Energy
17. Water and sanitation
:
1.1 unemployment rate
1.2 property values
1.3 ratio of people in poverty
1.7 number of new patents
:
Indicators for city services and quality of life (became IS in May 2014)
100 indicators (46 Core Indicators and 54 Supporting Indicators)
Characteristics and current situation of ISO37120
1) The first international standardized indicators for city services
2) Under revision process (as of September 2015)
3) Just a set of indicators and is not an assessment tool with value judgment
Indicators which are applicable to whole cities in the world is referred
14
© Committee for the Development of CASBEE-City (pilot version for worldwide use)
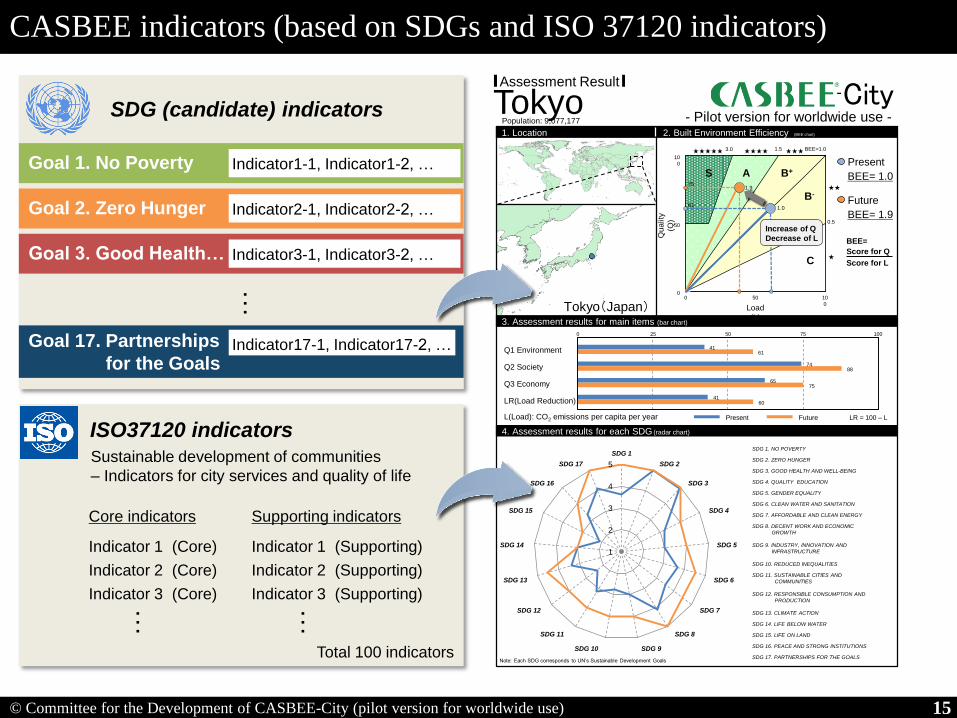
Present
BEE= 1.0
Future
BEE= 1.9
CASBEE indicators (based on SDGs and ISO 37120 indicators)
15
Goal 1. No Poverty Indicator1-1, Indicator1-2, …
Goal 17. Partnerships
for the GoalsIndicator17-1, Indicator17-2, …
…
SDG (candidate) indicators
Goal 2. Zero Hunger Indicator2-1, Indicator2-2, …
Indicator 1 (Core)
Indicator 2 (Core)
Indicator 3 (Core)
Total 100 indicators
…
ISO37120 indicators
Indicator 1 (Supporting)
Indicator 2 (Supporting)
Indicator 3 (Supporting)
Core indicators Supporting indicators
…
Sustainable development of communities
– Indicators for city services and quality of life
Goal 3. Good Health… Indicator3-1, Indicator3-2, …
Tokyo City- Pilot version for worldwide use -
Assessment Result
1. Location
Population: 9,077,177
2. Built Environment Efficiency (BEE chart)
3. Assessment results for main items (bar chart)
4. Assessment results for each SDG (radar chart)
SDG 1. NO POVERTY
SDG 2. ZERO HUNGER
SDG 3. GOOD HEALTH AND WELL-BEING
SDG 4. QUALITY EDUCATION
SDG 5. GENDER EQUALITY
SDG 6. CLEAN WATER AND SANITATION
SDG 7. AFFORDABLE AND CLEAN ENERGY
SDG 8. DECENT WORK AND ECONOMIC
GROWTH
SDG 9. INDUSTRY, INNOVATION AND
INFRASTRUCTURE
SDG 10. REDUCED INEQUALITIES
SDG 11. SUSTAINABLE CITIES AND
COMMUNITIES
SDG 12. RESPONSIBLE CONSUMPTION AND
PRODUCTION
SDG 13. CLIMATE ACTION
SDG 14. LIFE BELOW WATER
SDG 15. LIFE ON LAND
SDG 16. PEACE AND STRONG INSTITUTIONS
SDG 17. PARTNERSHIPS FOR THE GOALS
SDG 1
SDG 2
SDG 3
SDG 4
SDG 5
SDG 6
SDG 7
SDG 8
SDG 9SDG 10
SDG 11
SDG 12
SDG 13
SDG 14
SDG 15
SDG 16
SDG 17
Q1 Environment
Q2 Society
Q3 Economy
LR(Load Reduction)
0 25 50 75 100
LR = 100 – LPresent Future
4161
7488
6575
4160
0 50 100
0
50
100
Score
for
Qualit
y (
Q)
Score for Load (L)
B-
B+
0.5
BEE=1.03.0 1.5
C
AS75
1.9
★★★★★ ★★★★ ★★★
★★
★
611.0
Tokyo(Japan)
BEE=
Score for Q
Score for L
Load
(L)
Qu
ality
(Q)
10
0
500
10
0
50
0
Increase of Q
Decrease of L
Note: Each SDG corresponds to UN’s Sustainable Development Goals
L(Load): CO2 emissions per capita per year
1
2
3
4
5
-

© Committee for the Development of CASBEE-City (pilot version for worldwide use)
Selection criteria (for indicators)
1) data availability
2) simplicity
3) reliability
4) applicability for urban policy
5) balance among assessment items
Indicators are selected (or newly developed) by taking the following
criteria into account and by referring UN’s SDGs and ISO’s ISO37120, etc.
16
© Committee for the Development of CASBEE-City (pilot version for worldwide use)
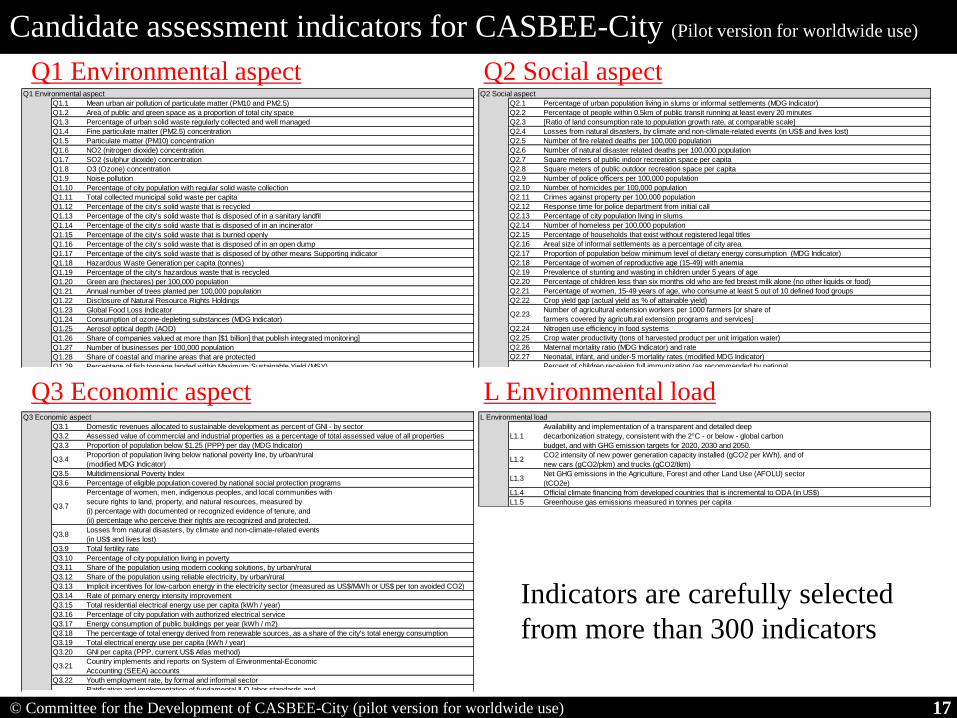
Candidate assessment indicators for CASBEE-City (Pilot version for worldwide use)
17
Q1 Environmental aspect
Q1.1 Mean urban air pollution of particulate matter (PM10 and PM2.5)
Q1.2 Area of public and green space as a proportion of total city space
Q1.3 Percentage of urban solid waste regularly collected and well managed
Q1.4 Fine particulate matter (PM2.5) concentration
Q1.5 Particulate matter (PM10) concentration
Q1.6 NO2 (nitrogen dioxide) concentration
Q1.7 SO2 (sulphur dioxide) concentration
Q1.8 O3 (Ozone) concentration
Q1.9 Noise pollution
Q1.10 Percentage of city population with regular solid waste collection
Q1.11 Total collected municipal solid waste per capita
Q1.12 Percentage of the city's solid waste that is recycled
Q1.13 Percentage of the city's solid waste that is disposed of in a sanitary landfil
Q1.14 Percentage of the city's solid waste that is disposed of in an incinerator
Q1.15 Percentage of the city's solid waste that is burned openly
Q1.16 Percentage of the city's solid waste that is disposed of in an open dump
Q1.17 Percentage of the city's solid waste that is disposed of by other means Supporting indicator
Q1.18 Hazardous Waste Generation per capita (tonnes)
Q1.19 Percentage of the city's hazardous waste that is recycled
Q1.20 Green are (hectares) per 100,000 population
Q1.21 Annual number of trees planted per 100,000 population
Q1.22 Disclosure of Natural Resource Rights Holdings
Q1.23 Global Food Loss Indicator
Q1.24 Consumption of ozone-depleting substances (MDG Indicator)
Q1.25 Aerosol optical depth (AOD)
Q1.26 Share of companies valued at more than [$1 billion] that publish integrated monitoring]
Q1.27 Number of businesses per 100,000 population
Q1.28 Share of coastal and marine areas that are protected
Q1.29 Percentage of fish tonnage landed within Maximum Sustainable Yield (MSY)
Q1.30 Annual change in forest area and land under cultivation (modified MDG Indicator)
Q1.31 Area of forest under sustainable forest management as a percent of forest area
Q1.32 Annual change in degraded or desertified arable land (% or ha)
Q1.33 Red List Index
Q1.34 Protected areas overlay with biodiversity
Q1.35 Percentage change in number of native species
Q2 Social aspect
Q2.1 Percentage of urban population living in slums or informal settlements (MDG Indicator)
Q2.2 Percentage of people within 0.5km of public transit running at least every 20 minutes
Q2.3 [Ratio of land consumption rate to population growth rate, at comparable scale]
Q2.4 Losses from natural disasters, by climate and non-climate-related events (in US$ and lives lost)
Q2.5 Number of fire related deaths per 100,000 population
Q2.6 Number of natural disaster related deaths per 100,000 population
Q2.7 Square meters of public indoor recreation space per capita
Q2.8 Square meters of public outdoor recreation space per capita
Q2.9 Number of police officers per 100,000 population
Q2.10 Number of homicides per 100,000 population
Q2.11 Crimes against property per 100,000 population
Q2.12 Response time for police department from initial call
Q2.13 Percentage of city population living in slums
Q2.14 Number of homeless per 100,000 population
Q2.15 Percentage of households that exist without registered legal titles
Q2.16 Areal size of informal settlements as a percentage of city area
Q2.17 Proportion of population below minimum level of dietary energy consumption (MDG Indicator)
Q2.18 Percentage of women of reproductive age (15-49) with anemia
Q2.19 Prevalence of stunting and wasting in children under 5 years of age
Q2.20 Percentage of children less than six months old who are fed breast milk alone (no other liquids or food)
Q2.21 Percentage of women, 15-49 years of age, who consume at least 5 out of 10 defined food groups
Q2.22 Crop yield gap (actual yield as % of attainable yield)
Q2.23Number of agricultural extension workers per 1000 farmers [or share of
farmers covered by agricultural extension programs and services]
Q2.24 Nitrogen use efficiency in food systems
Q2.25 Crop water productivity (tons of harvested product per unit irrigation water)
Q2.26 Maternal mortality ratio (MDG Indicator) and rate
Q2.27 Neonatal, infant, and under-5 mortality rates (modified MDG Indicator)
Q2.28Percent of children receiving full immunization (as recommended by national
vaccination schedules)
Q2.29 HIV incidence, treatment rate, and mortality (modified MDG Indicator)
Q2.30 Incidence, prevalence, and death rates associated with all forms of TB (MDG Indicator)
Q2.31 Incidence and death rates associated with malaria (MDG Indicator)
Q2.32Probability of dying between exact ages 30 and 70 from any of cardiovascular
disease, cancer, diabetes, chronic respiratory disease, [or suicide]
Q2.33 Percent of population overweight and obese, including children under 5
Q2.34 Road traffic deaths per 100,000 population
Q2.35 [Consultations with a licensed provider in a health facility or the community per person, per year]
Q2.36 [Percentage of population without effective financial protection for health care]
Q2.37Proportion of persons with a severe mental disorder (psychosis, bipolar
affective disorder, or moderate-severe depression) who are using services
Q2.38 Contraceptive prevalence rate (MDG Indicator)
Q2.39 Current use of any tobacco product (age-standardized rate)
Q2.40 Average life expectancy
Q2.41 Number of in-patient hospitals per 100,000 population
Q2.42 Number of physicians per 100,000 population
Q2.43 Under age five mortality per 1,000 live births
Q2.44 Number of nursing and midwifery personnel per 100,000 population
Q2.45 Number of mental health practitioners per 100,000 population
Q2.46 Suicide rate per 100,000 population
Q2.47 Transportation fatalities per 100,000 population
Q2.48Percentage of children (36-59 months) receiving at least one year of a quality
pre-primary education program
Q2.49 Early Child Development Index (ECDI)
Q2.50 Primary completion rates for girls and boys
Q2.51
Percentage of girls and boys who master a broad range of foundational skills,
including in literacy and mathematics by the end of the primary school cycle
(based on credibly established national benchmarks)
Q2.52 Secondary completion rates for girls and boys
Q2.53
Percentage of girls and boys who achieve proficiency across a broad range of
learning outcomes, including in literacy and in mathematics by end of lower
secondary schooling cycle (based on credibly established national
benchmarks)
Q2.54 Tertiary enrollment rates for women and men
Q2.55 Percentage of students completing primary education : survival rate
Q2.56 Percentage of students completing secondary education : survival rate
Q2.57 Primary education student / teacher ratio
Q2.58 Percentage of male school-aged population enrolled in schools
Q2.59 Percentage of school-aged population enrolled in schools
Q2.60 Number of higher education degrees per 100,000 population
Q2.61Prevalence of girls and women 15-49 who have experienced physical or sexual
violence [by an intimate partner] in the last 12 months
Q2.62Percentage of referred cases of sexual and gender-based violence against
women and children that are investigated and sentenced
Q2.63 Percentage of women aged 20-24 who were married or in a union before age 18
Q2.64 Percentage of girls and women aged 15-49 years who have undergone FGM/C
Q2.65 Average number of hours spent on paid and unpaid work combined (total work burden), by sex
Q2.66
Percentage of seats held by women and minorities in national parliament
and/or sub-national elected office according to their respective share of the
population (modified MDG Indicator)
Q2.67 Met demand for family planning (modified MDG Indicator)
Q2.68 Percentage of female school-aged population enrolled in schools
Q2.69 Women as a percentage of total elected to city-level office
Q2.70 Percentage of women employed in the city government workforce
Q2.71Percentage of population using safely managed water services, by urban/rural
(modified MDG Indicator)
Q2.72Percentage of population using safely managed sanitation services, by
urban/rural (modified MDG Indicator)
Q2.73 Percentage of wastewater flows treated to national standards [and reused]
Q2.74 Indicator on water resource management
Q2.75 Proportion of total water resources used (MDG Indicator)
Q2.76 Percentage of city population served by wastewater collection
Q2.77 Percentage of the city's wastewater that has received no treatment
Q2.78 Percentage of the city's wastewater receiving primary treatment
Q2.79 Percentage of the city's wastewater receiving secondary treatment Core indicator
Q2.80 Percentage of the city's wastewater receiving tertiary treatment
Q2.81 Percentage of city population with potable water supply service
Q2.82 Percentage of city population with sustainable access to an improved water source
Q2.83 Percentage of population with access to improved sanitation
Q2.84 Total domestic water consumption per capita (litres / day)
Q2.85 Total water consumption per capita (litres / day
Q2.86 Average annual hours of water service interruption per household
Q2.87 Percentage of water loss (unaccounted for water)
Q2.88 Access to all-weather road (% access within [x] km distance to road)
Q2.89 Mobile broadband subscriptions per 100 inhabitants, by urban/rural
Q2.90 Index on ICT maturity
Q2.91 Manufacturing value added (MVA) as percent of GDP
Q2.92Total energy and industry-related GHG emissions by gas and sector,
expressed as production and demand-based emissions (tCO2e)
Q2.93 Personnel in R&D (per million inhabitants)
Q2.94 Average number of electrical interruptions per customer per year
Q2.95 Average length of electrical interruptions (in hours)
Q2.96 Number of firefighters per 100,000 population
Q2.97 Number of volunteer and part-time firefighters per 100,000 population
Q2.98 Response time for emergency response services from initial call
Q2.99 Response time for fire department from initial call
Q2.100 Number of internet connections per 100,000 population
Q2.101 Number of cell phone connections per 100,000 population
Q2.102 Number of landline phone connections per 100,000 population
Q2.103 Kilometres of high capacity public transport system per 100,000 population Core
Q2.104 Kilometres of light passenger public transport system per 100,000 population
Q2.105 Annual number of public transport trips per capita
Q2.106 Number of personal automobiles per capita
Q2.107 Percentage of commuters using a travel mode to work other than a personal vehicle
Q2.108 Number of two-wheel motorized vehicles per capita
Q2.109 Kilometres of bicycle paths and lanes per 100,000 population
Q2.110 Commercial air connectivity (number of non-stop commercial air destinations
Q2.111 Violent injuries and deaths per 100,000 population
Q2.112 Number of refugees
Q2.113Proportion of legal persons and arrangements for which beneficial
ownership information is publicly available
Q2.114
Revenues, expenditures, and financing of all central government
entities are presented on a gross basis in public budget documentation
and authorized by the legislature
Q2.115 Percentage of children under age 5 whose birth is registered with a civil authority
Q2.116Existence and implementation of a national law and/or constitutional
guarantee on the right to information
Q2.117 Perception of public sector corruption
Q2.118 Debt service ratio (debt service expenditure as a percentage of a municipality's own-source revenue)
Q2.119 Capital spending as a percentage of total expenditure
Q2.120 Own-source revenue as a percentage of total revenues
Q2.121 Tax collected as a percentage of tax billed
Q2.122 Voter participation in last municipal election (as a percentage of eligible voters)
Q2.123 Number of convictions for corruption and / or bribery by city officials per 100,000 population Supporting indicator
Q2.124 Citizens' representation : number of local officials elected to office per 100,000 population
Q2.125 Number of registered voters as a percentage of the voting age population
Q2.126 Violent crime rate per 100,000 population
Q3 Economic aspect
Q3.1 Domestic revenues allocated to sustainable development as percent of GNI - by sector
Q3.2 Assessed value of commercial and industrial properties as a percentage of total assessed value of all properties
Q3.3 Proportion of population below $1.25 (PPP) per day (MDG Indicator)
Q3.4Proportion of population living below national poverty line, by urban/rural
(modified MDG Indicator)
Q3.5 Multidimensional Poverty Index
Q3.6 Percentage of eligible population covered by national social protection programs
Q3.7
Percentage of women, men, indigenous peoples, and local communities with
secure rights to land, property, and natural resources, measured by
(i) percentage with documented or recognized evidence of tenure, and
(ii) percentage who perceive their rights are recognized and protected.
Q3.8Losses from natural disasters, by climate and non-climate-related events
(in US$ and lives lost)
Q3.9 Total fertility rate
Q3.10 Percentage of city population living in poverty
Q3.11 Share of the population using modern cooking solutions, by urban/rural
Q3.12 Share of the population using reliable electricity, by urban/rural
Q3.13 Implicit incentives for low-carbon energy in the electricity sector (measured as US$/MWh or US$ per ton avoided CO2)
Q3.14 Rate of primary energy intensity improvement
Q3.15 Total residential electrical energy use per capita (kWh / year)
Q3.16 Percentage of city population with authorized electrical service
Q3.17 Energy consumption of public buildings per year (kWh / m2)
Q3.18 The percentage of total energy derived from renewable sources, as a share of the city's total energy consumption
Q3.19 Total electrical energy use per capita (kWh / year)
Q3.20 GNI per capita (PPP, current US$ Atlas method)
Q3.21Country implements and reports on System of Environmental-Economic
Accounting (SEEA) accounts
Q3.22 Youth employment rate, by formal and informal sector
Q3.23Ratification and implementation of fundamental ILO labor standards and
compliance in law and practice
Q3.24 City's unemployment rate
Q3.25 Percentage of persons in full-time employment
Q3.26 Youth unemployment rate
Q3.27 Jobs / housing ratio
Q3.28 [Indicator on inequality at top end of income distribution: GNI share of richest 10% or Palma ratio]
Q3.29Percentage of households with incomes below 50% of median income ("relative
poverty")
Q3.30 Domestic revenues allocated to sustainable development as percent of GNI, by sector
Q3.31 Official development assistance and net private grants as percent of GNI
Q3.32Private net flows for sustainable development at market rates as share
of high-income country GNI, by sector
Q3.33
Annual report by Bank for International Settlements (BIS), International Accounting Standards Board (IASB), International
Financial Reporting Standards (IFRS), International Monetary Fund (IMF), World Intellectual Property Organization
(WIPO), and World Trade Organization (WTO) [other organizations to be added] on the relationship between
international rules and the SDGs and the implementation of relevant SDG targets
Q3.34 Share of SDG Indicators that are reported annually
Q3.35 Evaluative Wellbeing and Positive Mood Affect
Q3.36 Number of new patents per 100,000 population per year
L Environmental load
L1.1
Availability and implementation of a transparent and detailed deep
decarbonization strategy, consistent with the 2°C - or below - global carbon
budget, and with GHG emission targets for 2020, 2030 and 2050.
L1.2CO2 intensity of new power generation capacity installed (gCO2 per kWh), and of
new cars (gCO2/pkm) and trucks (gCO2/tkm)
L1.3Net GHG emissions in the Agriculture, Forest and other Land Use (AFOLU) sector
(tCO2e)
L1.4 Official climate financing from developed countries that is incremental to ODA (in US$)
L1.5 Greenhouse gas emissions measured in tonnes per capita
Q1 Environmental aspect Q2 Social aspect
Q3 Economic aspect L Environmental load
Indicators are carefully selected
from more than 300 indicators

© Committee for the Development of CASBEE-City (pilot version for worldwide use)
Assessment of cities around the world using CASBEE-City (Pilot ver. for worldwide use)
18
South America
1 country,
3 cities
North America
3 countries,
12 cities
Europe
11 countries,
11 cities
East Asia
3 countries,
10 cities
South and
South-east Asia
2 countries,
7 cities
Africa
1 country,
2 cities
Oceania
1 country,
2 cities
World 47 cities (22 countries) are assessed using CASBEE-City

© Committee for the Development of CASBEE-City (pilot version for worldwide use)
Assessment of major cities around the world using CASBEE-City
19
Good PoorScore for L
50 100
0
50
100S A B+
Sustainable
BEE(Q / L) 3.0 1.5 1.0
0
B-
0.5
C
Unsustainable
Good
Poor
Sco
re fo
r Q
East Asia (n=10)
South-east Asia (n=7)
South America (n=3)
North America (n=12)
Europe (n=11)
Oceania (n=2)
Africa (n=2)
★★★★★ ★★★★ ★★★
★★
★
* A single plot represents a city

© Committee for the Development of CASBEE-City (pilot version for worldwide use)
Achieving real sustainable city using CASBEE-City tool
Good PoorScore for L
Goo
dP
oo
rS
core
fo
r Q
50 100
0
50
100S A B+Sustainable
BEE(Q / L) 3.0 1.5 1.0
0
B-
0.5
CUnsustainable
City C
City A
City B
Sustainable City
City A:Necessary to
reduce L
City B:Necessary to
improve Q, with
reducing L
City C:Necessary to
improve Q without
increasing L
20
© Committee for the Development of CASBEE-City (pilot version for worldwide use)
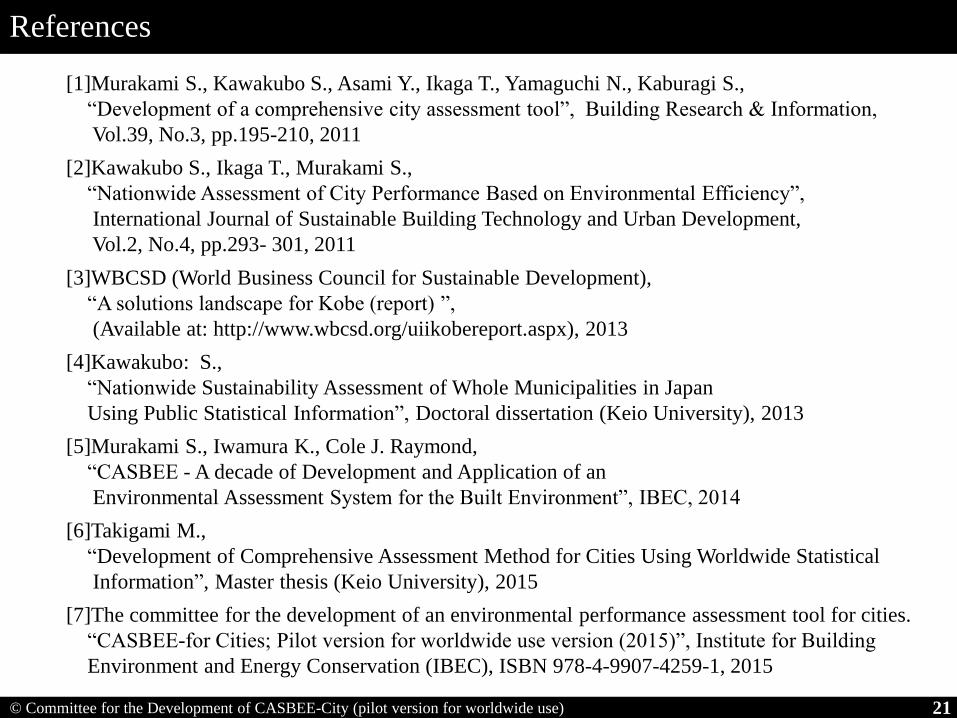
References
21
[2]Kawakubo S., Ikaga T., Murakami S.,
“Nationwide Assessment of City Performance Based on Environmental Efficiency”,
International Journal of Sustainable Building Technology and Urban Development,
Vol.2, No.4, pp.293- 301, 2011
[1]Murakami S., Kawakubo S., Asami Y., Ikaga T., Yamaguchi N., Kaburagi S.,
“Development of a comprehensive city assessment tool”, Building Research & Information,
Vol.39, No.3, pp.195-210, 2011
[5]Murakami S., Iwamura K., Cole J. Raymond,
“CASBEE - A decade of Development and Application of an
Environmental Assessment System for the Built Environment”, IBEC, 2014
[3]WBCSD (World Business Council for Sustainable Development),
“A solutions landscape for Kobe (report) ”,
(Available at: http://www.wbcsd.org/uiikobereport.aspx), 2013
[4]Kawakubo: S.,
“Nationwide Sustainability Assessment of Whole Municipalities in Japan
Using Public Statistical Information”, Doctoral dissertation (Keio University), 2013
[6]Takigami M.,
“Development of Comprehensive Assessment Method for Cities Using Worldwide Statistical
Information”, Master thesis (Keio University), 2015
[7]The committee for the development of an environmental performance assessment tool for cities.
“CASBEE-for Cities; Pilot version for worldwide use version (2015)”, Institute for Building
Environment and Energy Conservation (IBEC), ISBN 978-4-9907-4259-1, 2015

22© Committee for the Development of CASBEE-City (pilot version for worldwide use)
Thank you for your kind attention !
We would like to express our sincere gratitude for
the great cooperation to the members of
committee for the development of CASBEE-City
(pilot version for worldwide use); Yasushi Asami,
Tomohiro Uchiike, Shinichi Kaburagi, Takahiro
Kawayoke, Ryota Kuzuki, Noriaki Takai, Akira
Nakamura, Takashi Otsuka, Takashi Hashimoto,
Nobuhaya Yamaguchi, Junya Yamasaki, Takeo
Fukui, Tadashi Inoue, Koji Yamada, Kiyohisa
Oine, Nobufusa Yoshizawa & Shoichiro Fujita.
Fig. Brochure of CASBEE for Cities, Pilot version for
worldwide use (2015), ISBN 978-4-9907-4259-1
Related Documents