CPED User Guide Draft The Main Worksheet CPED CENTER PIVOT EVALUATION AND DESIGN User Guide 2014 Natural Resources Conservation Service Introduction The Center Pivot Evaluation and Design Program (CPED) is a simulation model for center pivot and linear move irrigation systems. It is used by NRCS personnel to ensure that the center pivot design of a private dealership or manufacturer meets the criteria of the NRCS practice standard for sprinkler systems (code 442). The national NRCS Practice Standard for Sprinkler System (Code 442, date: April 2014) requires that the coefficient of uniformity (CU) of a new center pivot is at least 90%, or that the distribution uniformity (DU) is at least 84%. When data for a center pivot is entered into CPED, it provides both the CU and DU for the center pivot. Any user of a center pivot or linear move system can benefit from knowing that an installed or modified system will perform as intended. Good irrigation water management is also an important factor in the beneficial use of irrigation water. Good equipment cannot overcome bad management. CPED is based on the first model presented by Heermann and Hein (1968), which was verified with field data. In 2012, Dr. Troy Peters of Washington State University extension took the 1 | Page

Welcome message from author
This document is posted to help you gain knowledge. Please leave a comment to let me know what you think about it! Share it to your friends and learn new things together.
Transcript

CPED User Guide Draft The Main Worksheet
CPED
CENTER PIVOT EVALUATION AND DESIGN
User Guide 2014
Natural Resources Conservation Service
Introduction
The Center Pivot Evaluation and Design Program (CPED) is a simulation model for center pivot and linear move irrigation systems. It is used by NRCS personnel to ensure that the center pivot design of a private dealership or manufacturer meets the criteria of the NRCS practice standard for sprinkler systems (code 442).
The national NRCS Practice Standard for Sprinkler System (Code 442, date: April 2014) requires that the coefficient of uniformity (CU) of a new center pivot is at least 90%, or that the distribution uniformity (DU) is at least 84%. When data for a center pivot is entered into CPED, it provides both the CU and DU for the center pivot.
Any user of a center pivot or linear move system can benefit from knowing that an installed or modified system will perform as intended.
Good irrigation water management is also an important factor in the beneficial use of irrigation water. Good equipment cannot overcome bad management.
CPED is based on the first model presented by Heermann and Hein (1968), which was verified with field data. In 2012, Dr. Troy Peters of Washington State University extension took the previously existing program and ported it to an Excel spreadsheet.
1 | P a g e

CPED User Guide Draft The Main Worksheet
Table of ContentsIntroduction......................................................................................................................................1
Quick Summary...............................................................................................................................4
How Do I….....................................................................................................................................4
The Main Worksheet...................................................................................................................7
Navigation Buttons..................................................................................................................7
Data Entry................................................................................................................................8
The Pump worksheet.................................................................................................................11
Pressure/Flow Control Radio Buttons...................................................................................11
After the selection of one of the Pressure/Flow Control Radio Buttons...............................13
The Tower Worksheet...............................................................................................................19
The Span worksheet...................................................................................................................21
The Sprinkler Worksheet...........................................................................................................23
Using the Sprinkler Wizard...................................................................................................23
Run Simulation..............................................................................................................................26
Output worksheet...........................................................................................................................26
Report Worksheet..........................................................................................................................26
Appendix A: Catchcan worksheet.............................................................................................27
Appendix B:...............................................................................................................................27
Appendix C................................................................................................................................28
REFERENCES..........................................................................................................................31
Changes requested:........................................................................................................................32
Sprinkler Database (as of 9/10/2014)............................................................................................33
Komet Precision Spray..........................................................................................................35
Komet Endguns.....................................................................................................................38
Nelson Accelerators...............................................................................................................40
Nelson Dual Nozzle...............................................................................................................41
Nelson Nutators.....................................................................................................................45
Nelson Rotators (add link to Nelson PIVOT_R3000.pdf).....................................................46
2 | P a g e

CPED User Guide Draft The Main Worksheet
Nelson Spinners (add link to Nelson PIVOT_R3000.pdf)....................................................48
Rainbird.................................................................................................................................52
Figure 1: Is it a linear/lateral system or a center pivot?...................................................................7Figure 2: Main Worksheet (center pivot option selected) showing four navigation buttons..........7Figure 3: Excel worksheet tabs are also available for navigation to another worksheet.................8Figure 4: Main Worksheet Data Entry Table (center pivot option).................................................8Figure 5: Pressure/Flow Control Radio Buttons............................................................................11Figure 6: Pivot Point and Pump Information Table:.....................................................................14Figure 7: Pivot Point and Pump Information Table:.....................................................................16Figure 8: Pivot Point and Pump Information Table:.....................................................................17Figure 9..........................................................................................................................................19Figure 10........................................................................................................................................19Figure 11: One pivot point and six towers.....................................................................................19Figure 12: Example Data entered into the Tower Worksheet.......................................................20Figure 13: Nominal and actual diameters for typical center pivot laterals....................................21Figure 14: Span Worksheet Data Entry.........................................................................................22Figure 15: The Sprinkler Wizard...................................................................................................23Figure 16: Right angle and left angle example..............................................................................25Figure 17: Results from the Output Worksheet.............................................................................26
3 | P a g e

CPED User Guide Draft The Main Worksheet
Quick Summary
CPED is an Excel based tool. The tool has five worksheets that should be completed before the “Run Simulation” button is pressed. They are:
The Main worksheet The Pump worksheet The Tower worksheet The Span worksheet The Sprinkler worksheet
The appendix contains data that can be inputted to CPED and compared with results here.
How Do I…
Account for elevation differences in the field?o Verify the worst case scenarios (i.e. the position of the lateral where the elevation
difference makes the most impact on the system.)o If pressure regulators are used, analyze the system when the lateral is at the
highest part of the field. Check to make sure the pressure at each nozzle exceeds the pressure regulator setting by at least 5 psi (or less if the manufacturer states this.)
o If no pressure regulators are used, analyze the system at both the high and low part of the field.
o In the Pump Worksheet, enter an appropriate value for the pivot pad elevationo In the Tower Worksheet, enter the worst case scenario for the ground elevation at
each tower.o The worst case scenario is not representative of the system’s overall performance.
Determine what sprinkler to enter?o Sprinkler height: when the sprinkler height of the design is not one of the
sprinkler options (typically the options are 3 and 9 feet) do this… Indicate that I am using pressure regulators?
Complete these four tasks:
1. Set the cell for “Type of Pressure Control” to “Pressure Regulators” on the Main Worksheet.
2. Select the Constant Head/Pressure button on the Pump Worksheet3. Enter a number higher than the pressure regulator setting in the cell for
“Constant Head (psi)”. The number you enter is the pressure at the pump
4 | P a g e

CPED User Guide Draft The Main Worksheet
outlet, so this number will be reduced by the pipe friction in the pump to pipe riser pipe (i.e. the mainline).
4. Enter the pressure regulator setting for each of the nozzles in Column J on the Sprinkler worksheet.
What are CU and DU?o CU (coefficient of uniformity) and DU (distribution uniformity) are two different
calculations that show how uniform an irrigation system applies water. The CU for a center pivot has some important differences with generic CU because each sprinkler along a center pivot lateral irrigates a different sized piece of land. Heermann and Hein (Dale Heermann is the creator of the original CPED program) devised a formula to determine CU for a center pivot.
Entering a pump curve is time consuming. Do I have to do it?o One advantage of entering a pump curve is that it can verify the pump will
provide the pivot with enough pressure and flow. Occasionally pumps are poorly selected, and CPED will help you realize this.
o To answer the question, though, here are the times it is not necessary to enter a pump curve:
When pressure regulators are used and it is known that the pump will supply adequate pressure to each nozzle
When there is a good measurement of the pressure produced by the pump and the field is relatively flat.
CPED reports the pressure at the pivot point. Exactly where is the pivot point?o In terms of a location (x,y,z), the (x,y) is the ground location where the riser pipe
goes up and connects with the lateral. The z (elevation) is the height of the sprinkler nozzle that the user entered in the Main worksheet.
o When CPED reports the pressure at the pivot point, it is the pressure at the sprinkler height of a sprinkler located at the beginning of the lateral. Note: there will NEVER be a sprinkler located at the beginning of the lateral; this is just a calculation CPED uses and reports.
o The pivot point is often considered to be at the riser, either at ground level or where the riser connects to the lateral. CPED does not use either of these locations.
o Why is it done this way? CPED makes a shortcut to calculate the friction loss. Note that CPED never asks for the height of the riser pipe. CPED calculates the friction loss from the pad elevation, up the riser pipe to the height of the nozzle, and then the friction loss in the lateral. It assumes that the pressure loss of the riser pipe from the sprinkler elevation to the lateral elevation is the same as the pressure gain from the lateral to the nozzle through the drop, and doesn’t calculate either one. It does calculate the local (minor) losses in the riser pipe.
5 | P a g e

CPED User Guide Draft The Main Worksheet
What are the unique aspects of entering data for a linear move? What do I need to do to model an endgun? What do I do if some sprinklers have pressure regulators and others don’t?
6 | P a g e

CPED User Guide Draft The Main Worksheet
The Main Worksheet
In addition to limited data entry, use the Main worksheet as a gateway to other worksheets.
At the top left of the Main Worksheet, select the button for the type of system analyzed (see Figure 1). The graphic to the right of these buttons will change depending on the selection.
Buttons on a drawing of the center pivot or linear move system can be selected to move to that worksheet. Excel worksheet tabs at the bottom of the Excel window can also be used for navigation.
Navigation Buttons
Use each of the four buttons (i.e. Pump Info, Span Info, Sprinkler Info, and Tower Info) to directly navigate to the appropriate worksheet. The user can also navigate to the other
7 | P a g e
Figure 2: Main Worksheet (center pivot option selected) showing four navigation buttons
Figure 1: Is it a linear/lateral system or a center pivot?

CPED User Guide Draft The Main Worksheet
worksheets using the worksheet tabs that are at the bottom of the Excel spreadsheet.
Data Entry
The main worksheet also has a table that requires data entry.
Simulation Parameters
Hours/Revolution: Enter how long (in hours) it takes for the pivot to do a complete revolution. For partial circle pivots, enter how long it would take for a complete revolution if it were a full circle. This is dependent on the pivot speed setting. Since this variable can be changed by the center pivot operator, enter a typical number for a pivot in your area. Most pivots cannot complete a revolution in less than 16 hours. If you do not know, a 60 hour revolution is a good guess.
8 | P a g e
Figure 4: Main Worksheet Data Entry Table (center pivot option)
Figure 3: Excel worksheet tabs are also available for navigation to another worksheet

CPED User Guide Draft The Main Worksheet
This data is necessary to calculate the correct depth of application. It will not affect the results for CU and DU.
Sprinkler Number, Start Distance and Stop Distance
CPED allows the user to consider only parts of the center pivot system. For example, the sprinkler system practice standard (Code 442) allows the user to ignore the first 250 feet of the center pivot lateral in the calculation for uniformity. This can be helpful because achieving a high uniformity close to the pivot point is difficult. Uniformity will also decrease past the end of the lateral, as the irrigation application depth goes to 0.
Sprinkler Number: Enter ALL to analyze the system. Analyze sections of the center pivot by entering data in the start distance and stop distance cells.
Enter a sprinkler number (from Column C of the Sprinkler worksheet) in order to analyze the effect of one sprinkler. This can be helpful to analyze the effect of an end gun.
Start Distance (ft): CPED estimates the application depth and calculates the uniformity starting at this distance along the center pivot lateral. For compliance with the national practice standard, do not enter a distance greater than 250 feet.
Center pivots have difficulty applying water uniformly along the first part of the center pivot lateral (close to the pivot point). The national NRCS standard allows the design of a center pivot to ignore the first 250 feet along the center pivot lateral for the uniformity calculations. This accounts for approximately 4.5 acres.
Stop Distance (ft): CPED estimates the application depths and uniformity stopping at this distance of the lateral. This distance can be greater than the length of the lateral.
Distance Increment (ft): CPED models the application depth at each of these distance increments. For example, entering 10 (feet) will instruct CPED to calculate the application depth every 10 feet along the lateral. Typical distance increments are 10 feet and 20 feet.
Uniformity calculations may vary slightly with different distance increments.
Minimum Depth (in): Simulated application depths less than the number entered here will be excluded from the uniformity and all other calculations. For example, this can be used to exclude data generated past the end of the lateral, as the irrigation application depth goes to 0.
Travel Distance (ft): This is for linear move systems only. Enter the length of the field in the direction of the linear travel (i.e. how far the linear must move).
9 | P a g e

CPED User Guide Draft The Main Worksheet
System Parameters
Type of Pressure Control: Choose from the options in the pulldown list:
Noneo Use this option when there is no method to control the pressure of the
system. An example of a method to control the pressure is the use of pressure regulators.
Pressure Regulatorso Use this option when pressure regulators are used. Even if pressure
regulators are entered on the sprinkler worksheet, if this option is not selected CPED will not recognize them.
Fixed orifice Linear pressure
Booster pump pressure increase (psi): Booster pumps are often used on center pivots to ensure that the pressure available for an end gun sprinkler is sufficient. If a booster pump is used, enter the increase in pressure in psi that it produces.
Number of sprinklers beyond booster pump: If there is a booster pump, enter the number of sprinklers past the booster pump, including the end gun. If there is no booster pump, leave this cell blank. For all nozzles past the booster pump, the calculations will be based on the increased pressure due to the booster pump.
When all the relevant data has been entered into the cells of the Main Worksheet, continue on to the next worksheet. The order in which the worksheets are filled out is not important.
10 | P a g e

CPED User Guide Draft May 7, 2023 The Pump Worksheet
The Pump worksheet
Use the pump worksheet to:
Select the type of pressure or flow control of the system. Enter basic data for the system upstream (i.e. the pump side) of the top of the pivot. If necessary, enter the pump curve for the system’s pump.
Pressure/Flow Control Radio Buttons
There are three pressure/flow control radio buttons. Selecting one of the radio buttons will change the data required for the Pivot Point and Pump Information Table.
Normal (no flow or pressure control)
Select the “Normal (no flow or pressure control)” radio button when the pressure at the nozzles or system flow can vary depending on the conditions. Do not select this option if pressure regulators are used throughout the system
For this option, enter data representing the pump curve of the pump supplying the system.
CPED will use the pump curve and the data entered for the pipeline from the pump to the pivot to determine the pressure at the pump, the friction loss through the mainline (“the pump to riser pipe”), the pivot riser, and the center pivot lateral to determine the pressure and flow rate at each nozzle.
Click the “Input a Pump Curve” button and input data points from the pump curve. When inputting a pump curve:
o Bracket the design point (i.e. enter data points that are on both sides of the design point). The design point is the location on the pump curve where the system is designed to operate. Remember that the pump curve represents the pressure at the pump, not at the pivot point.
o The points on the left side (i.e. close to the y-axis) tend to be more important.
11 | P a g e
Figure 5: Pressure/Flow Control Radio Buttons

CPED User Guide Draft May 7, 2023 The Pump Worksheet
o Include the point of zero head and maximum flow. If the pump curve does not continue to the point where the head is zero, extend the pump curve to the x-axis and enter the x-intercept (i.e the point where the head is zero and the flowrate (Q) is maximized.)
o The more points inputted, the more accurate the solution.o When the pump curve data is inputted, data is automatically entered into the
“Number of Pumps Stages” and the “Pump Curve on the Quadratic Term” cells.
Constant Head/Pressure
Select the Constant Head/Pressure button when there are pressure regulators on the system. When pressure regulators are used, ensure that the cell for “Type of Pressure Control” is set to “Pressure Regulators” on the Main Worksheet.
This option is also used when the pressure is constant (and known) at the pump and pressure regulators are not used.
This option can be used when the pressure is constant (and known) at the pivot point and pressure regulators are not used. However, it requires some trickery. Enter a very short length (e.g. 1 foot) for the pump to pipe riser, and enter large diameters (e.g. 10 inches) both for the pump to riser pipe and the riser. CPED will calculate the friction loss in the pump to pipe riser as a number very close to 0, so that the pressure at the pump, and pressure at the pivot pad are essentially equal.
12 | P a g e

CPED User Guide Draft May 7, 2023 The Pump Worksheet
If the pressure is known at the location where the pump to riser pipe and the riser meet (.i.e. the pressure at the pivot pad), enter this value in the cell for constant head (psi) (see below for more information on the “constant head (psi)” cell). The value for pivot pressure that is reported on both the output worksheet is the pressure at an imaginary nozzle located at the pivot point and at the elevation entered in the “sprinkler height above the ground” cell.
If the pressure is known and constant at the top of the pivot (i.e. where the pivot riser and the pivot lateral meet), convert the height of the riser to psi (i.e., if the riser is 13 feet high, then divide 13 feet by 2.31) and add this to the known pressure at the top of the pivot. A drawing would be nice.
Note that this selection assumes the pump is capable of providing pressure above the regulator’s settings. Ensure that the real life pump has this capacity. An error results if the pressure at some of the regulators are above their setting, and others are below.
Constant Flow
Select the Constant Flow radio button when the flow rate of the center pivot is a known constant.
If this option is selected, the best option is to select, on the Main Worksheet under Type of Pressure Control, no pressure regulators. Even if the nozzles on the Sprinkler worksheet indicate pressure regulators, CPED will distribute the flow rate through all the nozzles in a hydraulically consistent manner.
If the user selects pressure regulators, the calculations are strange as CPED tries to overcome the pressure regulators to achieve the desired flow.
After the selection of one of the Pressure/Flow Control Radio Buttons
Once a pressure control radio button is selected, enter data into the shaded cells of the Pivot Point and Pump Information Table. The selection of a pressure control radio button will automatically fill some of the cells in this table. Fill in the cells that are shaded.
The information requested also changes depending on the pressure/flow control radio button
13 | P a g e

CPED User Guide Draft May 7, 2023 The Pump Worksheet
selected.
Pump Name (optional): Enter the name of the pump. This is optional. The pump name can be helpful when the user is examining several pump options. However, only one pump can be entered for each CPED file. Create a new CPED file to compare the effects of changing a pump.
Number of Pump Stages: (Default value of 1 is entered when either the constant pressure or constant flow radio button is selected) Deep well turbine pumps usually have multiple stages, and the pump curve usually represents the performance of one stage. Enter the number of pump stages and CPED will adjust the pump curve accordingly. If the pump curve represents all the stages of the pump, enter 1.
The third row in the table changes according to the radio button selection
Normal (no flow or pressure control) selected:
Pump Intercept – GPM: After entering data representing a pump curve, this cell will automatically be filled. See the Appendix for detail on how CPED does this.
Constant Head/Pressure selected:
Estimated Discharge (gpm): Enter the value for the estimated flow through the center pivot system. CPED will calculate the actual value, so enter a reasonable number and move on.
Constant Flow selected:
Constant Discharge (gpm): Enter the constant flow rate of the system, in gpm.
The fourth row in the table changes according to the radio button selection
Normal (no flow or pressure control) selected:
Pump Curve Slope on Linear Term: After entering data representing a pump curve, this cell will automatically be filled. See the Appendix for detail on how CPED does this.
Constant Head/Pressure selected:
Constant Head (psi) Enter the pressure at outlet of the pump. Ensure that this number is high enough so that the pressure regulators have enough pressure after accounting for friction and elevation loss in the pump to riser pipe, the riser pipe and the center pivot lateral. If pressure regulators are used, a higher than actual pressure will not affect the results because CPED assumes the pressure regulators can handle any excess pressure. If using pressure regulators, enter a sufficiently high number, and move on.
14 | P a g e

CPED User Guide Draft May 7, 2023 The Pump Worksheet
What is a “sufficiently high number”? CPED takes the pressure value entered in the Constant Head cell (i.e. the pressure at the pump) and reduces it by the friction loss in the mainline, riser pipe, and along the pivot lateral. If pressure regulators are used, estimate a number larger than the pressure regulator setting that will allow CPED to have at least the pressure regulator setting value at each nozzle after subtracting the friction loss. It is better to overestimate than underestimate.
Constant Flow selected: The cell’s background changes, indicating data entry is not required (or possible).
Constant Discharge (gpm): Enter the constant flow rate of the system, in gpm.
Pump Curve on the Quadratic Term: After entering data representing a pump curve, this cell will automatically be filled. See the Appendix for detail on how CPED does this.
When the constant pressure option is selected, CPED will automatically enter in the value of 9999 for the value for the pump curve on the Quadratic Term. The default of 9999 indicates to the program that the pump curve is not used.
Total Dynamic Lift (ft): This is the elevation difference (in feet) between the center pivot pad and the depth to the water table, including the drawdown while pumping.
Pad/ Ground Elevation (ft): This can be a measured or assumed elevation. Be sure that this elevation is consistent with the data that is entered in the Tower Worksheet. For example, if the field is level, and the pivot pad elevation is 100 feet, then the tower elevations in the Tower Worksheet should also be 100 feet.
15 | P a g e

CPED User Guide Draft May 7, 2023 The Pump Worksheet
Sprinkler height above the ground (ft): This is the distance, in feet, above the ground of the sprinklers.
ID of the riser pipe (in): The location of the riser pipe is indicated in the illustration. Enter the inside diameter of this pipe. CPED will calculate the local loss in the riser pipe assuming it consists of two 90 degree elbows and no length. Here, the assumption is that the friction loss in the riser pipe is exclusively local (i.e. sometimes called minor) losses. The value CPED uses for
the resistance coefficient for the riser pipe is the value entered on the Span Worksheet for the first span.
ID of the pump to riser pipe (in): This is the supply pipe for the system and is often called the mainline. Note that the illustration of the pivot point is not to scale. The length of this pipe can be quite long. Enter the inside diameter of this pipe.
Hazen-Williams or Darcy-Weisbach resistance coefficient: Enter the resistance coefficient for the pump to riser pipe. Typically NRCS personnel use the Hazen-Williams formula to determine friction loss in a pipe. Enter the appropriate value here; CPED will determine whether the number entered is for the Hazen-Williams or the Darcy-Weisbach formula based on the number’s magnitude. If the number is greater than 1, CPED will use the Hazen-Williams formula. If the coefficient entered is less than one, CPED uses the Darcy-Weisbach formula. The
16 | P a g e
Figure 7: Pivot Point and Pump Information Table:Constant Head/Pressure (psi) radio button selected

CPED User Guide Draft May 7, 2023 The Pump Worksheet
hint lists common values for use in the Hazen-Williams equation.
Hazen Williams and Darcy Table here
Length of the pump to riser pipe (ft): The illustration of the pivot point is not to scale, and the pump to riser pipe is often 1,500 feet long or more. This pipeline is often called the mainline. Enter this pipe’s length here.
Note that the value entered for Constant Head is reported on the Output Worksheet. It appears as “Head at Pump (ft/stage)”, after the conversion from psi to feet. The pivot pressure reported here is the pressure of an imaginary nozzle set at the user entered sprinkler height elevation located at the pivot point. Friction losses have been calculated.
If the constant flow radio button is selected, no head loss is calculated for the pump to riser pipe or the riser pipe. Although not used, enter approximate values into these cells. The values aren’t important; zeros can be used if you don’t know the actual numbers.
17 | P a g e
Figure 8: Pivot Point and Pump Information Table:Constant Flow radio button selected

CPED User Guide Draft May 7, 2023 The Tower Worksheet
The Tower Worksheet
Use the Tower Worksheet to enter data that will indicate the length of the pivot and the elevation at the base of each tower.
Enter the length of each span in the Tower Worksheet. CPED will calculate the distance from the pivot point for each span.
Tower #1 is the tower closest to the pivot point. In Figure 11, the first tower is indicated.
Ensure that the ground elevation entered is consistent with the pad elevation entered on the Pump Worksheet. CPED will calculate the pressure difference in the lateral due to both friction loss in the lateral and elevation change.
In order to account for elevation differences in the field, enter the worst case scenario for the ground elevation. If pressure regulators are used, ensure that the pressure at each nozzle at least equal to the pressure regulator setting. The value for CU and DU using the worst case scenario is not the CU and DU for the system, but it does give the user a better understanding of how the system will perform.To simulate a linear system, the first cart is Tower Number 1 with a “distance from pivot” of 0.
18 | P a g e
Figure 9
Tower #1

CPED User Guide Draft May 7, 2023 The Tower Worksheet
19 | P a g e

CPED User Guide Draft May 7, 2023 The Span Worksheet
The Span worksheet
Enter data for the different spans of the center pivot lateral in the table on the Span Worksheet.
A hint in the “Inside Diameter (ID) of Span Pipe (in)” lists the inside diameter of pipe given the nominal diameter of the pipe. Enter the inside diameter in this column.
CPED will use either the Hazen Williams or Darcy Weisbach friction formula depending on the magnitude of the number entered in the Resistance Coefficient column. CPED uses the resistance coefficient entered in the first row as the resistance coefficient for the riser pipe at the pivot point.
The first number in the column labeled “Starting Distance for Sprinkler Pipe Diameter (ft)” should be 0. At least one row should be filled out in this table. If there are three different diameters of spans, there should be three rows filled out.
20 | P a g e
Nominal Diameter Inside Diameterinch inch
10 9.7558 5/8 8.3758 7.7556 5/8 6.3756 5.7555 9/16 5.3185 4.7554 3.7553 2.755
Figure 13: Nominal and actual diameters for typical center pivot
laterals.

CPED User Guide Draft May 7, 2023 The Span Worksheet
Figure 14 shows an example of a center pivot that has a lateral with two different diameters. The first section of the lateral (most of the span) has an inside diameter of 6.407 inches. After 1,278.8 feet, the diameter of the span reduces to 3.789 inches. There is no need to enter data to indicate the total length of the lateral here, because CPED assumes that every sprinkler (in the Sprinkler Worksheet) is attached to the lateral.
21 | P a g e
Figure 14: Span Worksheet Data Entry

CPED User Guide Draft May 7, 2023 The Sprinkler Worksheet
The Sprinkler Worksheet
Use the Sprinkler Worksheet to enter data that will indicate the type of each sprinkler and its location.
Although each sprinkler can be entered manually, it is far easier to use the Sprinkler Wizard.
Using the Sprinkler Wizard
The wizard is self-explanatory. Each of the data entry boxes have a pull down list. Select the appropriate value in the pull down list for each of the cells. Enter the sprinkler number where this sprinkler model begins and end, choose the pattern, and press “Add”.
The wizard will overwrite the data that is already in the worksheet. Pressing ‘Done” will close the wizard.
Although the wizard enters most of the data required for sprinklers, the user must continue and enter the nozzle size and pressure regulator setting, if any.
Manual Data Entry
This is an Excel spreadsheet, and all of the techniques for copying and pasting data are available.
The following columns labels are in the sprinkler worksheet:
Span Number (optional): Entering the span number in this column can help the user with data entry and verification. It is optional.
Sprinkler Number: Enter the sprinkler number from the dealer information here. Although not needed for any calculation, the sprinkler number helps find data entry errors quickly.
The Sprinkler Wizard allows you to enter a range of values (e.g. 10 to 27) in the wizard; this range will be inputted into this column.
22 | P a g e
Figure 15: The Sprinkler Wizard

CPED User Guide Draft May 7, 2023 The Sprinkler Worksheet
Distance from last sprinkler (ft): Enter this data found on the dealer information sheet.
Distance from pivot point (ft): Except for the first sprinkler, this information is automatically entered when the distance from the “distance from last sprinkler” is entered.
Sprinkler Model Number: Use the dealer information sheet to find the sprinkler model number and enter it here.
Sprinkler application Pattern: There are three spray patterns associated with sprinklers: triangular, elliptical, and donut. Research shows that there is little difference in the uniformity of the sprinkler based on the sprinkler pattern. If you are in doubt, enter elliptical.
Range Nozzle Diameter (in 1/128ths or in 1/64ths): Older impact sprinklers often had two nozzles, one was called the range nozzle and the other was called the spreader nozzle. Unless the system has one of these older impact sprinklers, use the range nozzle column and leave the spreader column blank.
Enter the diameter of the sprinkler nozzle following theses guidelines: Senninger reports their nozzle diameters in 1/64th of an inch. If the design reports a Senninger nozzle diameter as 15, it means that the actual diamter of the nozzle is 15/64th of an inch. In this case, enter 15 in this cell.
Nelson reports their nozzle diameters in 1/128th of an inch. If the design reports a Nelson nozzle diameter as 15, it means that the actual diameter of the nozzle is 15/128th of an inch. In this case, enter 15 in this cell
Ensure that the correct radio button, either 64th or 128th, (located at the top of the column) is selected.
If the nozzle diameter is reported in inches, convert this to either 64th or 128ths of an inch, depending on your radio button selection.
Spreader Nozzle Diameter (in 1/128ths or in 1/64ths): Older impact sprinklers often had two nozzles, one was called the range nozzle and the other was called the spreader nozzle. If you are not using one of these impact sprinklers, leave this column blank
Pressure or orifice diameter of pressure controlled sprinkler (psi or in): Depending on the selection made on the Main Worksheet (System Parameters/Type of Pressure Control) this column can accept either the pressure regulator setting or the orifice diameter.
This column is critical if pressure regulators are used. If pressure regulators are used, enter the pressure regulator setting here.
23 | P a g e
CPED User Guide Draft May 7, 2023 The Sprinkler Worksheet
Stop angles of part circle sprinklers L+(degrees) & Start angle of part circle sprinklers R+(degrees)
Data is most commonly entered here only for end guns.
End guns do not typically irrigate a full circle. Use the start and stop angle cells to indicate the area irrigated by the end gun. Imagine that you are at the pivot point, looking out along the lateral. Then using the pipe as the zero reference point, measure the angle to the left (start angle) of the lateral. Use the same technique for the stop angle.
The right (stop) angle is the angle to the right of the lateral from your viewpoint at the pivot point, and the left (start) angle is the angle to the left of the lateral.
Offset distances (ft) and Left offset distances (ft): If the system has an offset for the nozzle (i.e boombacks, enter the data here. This is not used in any calculations.
Names of pressure regulated sprinklers: This data is not used in any calculation.
24 | P a g e
Figure 16: Right angle and left angle example

CPED User Guide Draft May 7, 2023 The Sprinkler Worksheet
Run Simulation
When data has been entered into all five data entry worksheets, click on the run simulation button found on the main worksheet.
Figure 17: Results from the Output Worksheet
Output worksheet
A successful CPED run ends with the Output Worksheet.
Both the coefficient of uniformity and the low quarter distribution uniformity are given. Both values reflect the section of the pivot or linear move indicated in the main worksheet for start and stop distance. If the start distance is not 0, and the end distance is not the end of the lateral and the CU and DU do not represent the entire system.
Head at Pump (ft/stage): The head at the pump as either determined by the pump curve, or entered manually. Note that the unit for head is feet.
Pivot Pressure psi: The pressure of an imaginary sprinkler located at the pivot point, set above the ground at the height entered in the pump page.
Report Worksheet
Of particular note, check line pressure and make sure that pressure regulators have at least a 5 psi higher line pressure than the pressure regulator being used.
25 | P a g e

Appendix A: Catchcan worksheet
Appendix B:
Selecting the “normal (no flow or pressure control)” radio button on the Pump Worksheet requires entering the data representing a pump curve. CPED will find a best fit quadratic equation representing the data points entered.
Pump curves are represented on an x-y graph, with the flow rate in gallons per minutes along the x axis, and the total dynamic head in feet along the y-axis. CPED takes the data entered and finds a best fit quadratic equation for the pump curve. The pump curve is represented by the equation:
Q=B0+B1 H+B2 H 2
where:
Q is discharge in gallons per minuteH is the head per stage in feetB0 is the pump intercept (change to constant)B1 is the pump curve slope on the linear term (change to linear coefficient)B2 is the pump curve slope on the quadratic term (change to quadratic coefficient)
As an example, the data from the pump curve in Error: Reference source not found can be represented by the quadratic equation:
Q=143.33+12.56 H−0.0523 H 2
The paired data from the pump curve of discharge in gpm and head in feet can be entered and the three coefficients calculated.
The number of stages for the pump must be entered when the manufacturer’s pump curve is for a single stage. However, if the pump curve comes from field measurements, set the number of stages equal to one.
The total dynamic lift in feet must also be entered. It is the elevation difference (feet) between the center pivot pad and the depth to the water table, including the drawdown while pumping.
26 | P a g e

Appendix C: Example CPED input
Using the dealer print out in this section, determine the following:
the coefficient of uniformity and the distribution uniformity.
Main Worksheet
The hours/revolution calculation will not affect the uniformity, so we can choose any reasonable number here. For this pivot, a run time of 60.8 hours will apply 1 inch (see page 5). We want to analyze the entire system out past the end, so our analysis starts at 0 feet, and stops at 1,500 feet.
CPED will calculate the depth of application every 10 feet. The calculations for CU and DU will be based on these results, so a different value (e.g. 5 feet) may give a slightly different value for CU and DU
The type of pressure control is pressure regulators. There is no end gun, so the next two boxes are left blank.
Pump Worksheet
Since we know there are pressure regulators, select the radio button “Constant Head/Pressure (psi)
Normal (no flow or pressure control)
Constant Flow (gpm)
Input a pump curveConstant Head/Pressure (psi)
In order to use CPED to model pressure regulators when we are not going to enter a pump curve, we will make several short cuts. WE are assuming the pump can provide the pressure at the pivot that is required to operate the center pivot as designed. Much of that data requested below is used to calculate the friction loss before the water arrives at the pivot
27 | P a g e
Simulation ParametersHours/Revolution 60.8Sprinkler Number allStart Distance (ft) 0Stop Distance (ft) 1500Distance Increment (ft) 10
Minimum Depth (in) (Optional)
System Parameters
Type of Pressure Control: Pressure
RegulatorsBooster pump pressure increase (psi)Number of sprinklers beyond booster pump

point (e.g. friction loss through the main pipe). Since we are telling CPED that we know the pressure at the pivot point, we won’t worry about what happened upstream of the pivot point; we have the required pressure.
Pump Name (optional) The pump name is optional, and can be used to remind you what pump curve information has been entered, if any.
Number of pump stages: In this case, we enter 1.
Estimated discharge (gpm) The estimated discharge is found in the print out on page 2.
Constant Head (psi) The “Constant Head” is the pressure at the outlet of the pump. We don’t know that value, but for this exercise, we don’t really need to know it. What we want is for the pivot to have a pressure of 31 psi at the pivot (given, see page 2). Since there are pressure regulators, as long as our pressure along the lateral does not go below the rating of the pressure regulator (plus 5 psi, for the correct operation of a pressure regulator), the pivot should work as designed.
Enter 35 psi, because there will be losses between the pump and the pivot point, and we want at least 31 feet at the pivot point. Since we use pressure regulators, overstating the constant head here will not affect the results. This assumes that the pump is capable of producing enough pressure,
(Note that on page 3, Note 4, the manufacturer states, “Pivot pressure is measured up on the main horizontal distribution pipe just after the last elbow.” This is not the location CPED uses.
Pump Curve of the Quadratic curve: CPED automatically enters 9999 when pressure regualtors are used.
Total dynamic lift: in this case, leave it blank
Pad/Ground elevation Use 100 feet. Be consistent with other data entry.
Sprinkler Height above the ground: 3 feet
ID of the riser pipe: Enter 9.79, although this is not used in this example
ID of the pump to riser pipe: Enter 9.79, although this is not used in this example.
Hazen Williams or Dacry Weisbach resistance coefficient: 140 is a typical Hazen Williams value for the center pivot lateral. This is given on page 2
Length of pump to riser pipe: Not relevant here, so enter 1 foot.
28 | P a g e

DescriptionPump Name (optional) 101Number of pump stages 1Estimated Discharge (gpm) 1200Constant Head (psi) 35Pump Curve on the Quadratic Term 9999Total dynamic lift (ft)Pad/Ground elevation (ft) 100Sprinkler height above the ground (ft) 3ID of the riser pipe (in) 9.79ID of the pump to riser pipe (in) 9.79Hazen-Williams or Darcy-Weisbach resistance coeffi cient 140Length of pump to riser pipe (ft) 1
Span Worksheet
The span information (inside diameter, length of each pipe, and Hazen Williams factor) is given on page 2. Note that the starting distance is the distance from the pivot point where that particular pipe begins.
Inside Diameter (ID) of Span Pipe
(in)
Hazen-Williams or Darcy-Weisbach Resistance
Coefficient
Starting Distance for Sprinkler Pipe Diameter
(ft)
9.79 140 07.79 140 258.56.41 140 732.54.79 140 1453
29 | P a g e

30 | P a g e

REFERENCES
Beccard, R. W. and D. F. Heermann. 1981. Performance of pumping plant--center pivot sprinkler irrigation systems. ASAE Paper 81-2548, Chicago, IL.
Chu, T.S. and D.L. Moe. 1972. Hydraulics of a center pivot system. Trans. of the ASAE 15(5):894,896.
Edling, R.J. 1979. Variation of center pivot operation with field slope. Trans. Of ASAE 15(5):1039-1043.
Heermann, D. F. and P. R. Hein. 1968. Performance characteristics of the self-propelled center pivot sprinkler irrigation system. Trans. ASAE 11(1):11-15.
Heermann, D.F. and K.M. Stahl. l986. Center pivot uniformity for chemigation. ASAE Paper 86-2584, Chicago, IL.
James, L.G. 1984. Effects of pump selection and terrain of center pivot performance. Trans. of ASAE 27(1):64-68,72.
Kincaid, D. C., D. F. Heermann and E. G. Kruse. 1969. Application rates and runoff in center pivot sprinkler irrigation. Trans. ASAE 12:790-794, 797.
Kincaid, D. C. and D. F. Heermann. 1970. Pressure distribution on a center pivot sprinkler irrigation system. Trans. ASAE 13:556-558.
31 | P a g e

Changes requested:
When the radio button is selected, change the color on the cells in the table so the user doesn’t have to enter data that will not be used.
Don’t ask for data if the program won’t use it: if there are pressure regulators, no need to ask for the data required to calculate friction loss through the pump to riser pipe,
Allow the user to change the radio button selection for pressure without crashing.
Take out the “?” in Pump Name?
Pivot Pressure psi on the output worksheet will vary with the pump to riser pipe length but not the dynamic lift.
Test this thought: if all the nozzle’s pressure reading are below the setting, or all above, it is fine. If the some nozzles are above, and some below, it crashes. It goes into an infinite loop if the pump to riser pipes friction loss brings the pressure at a nozzle below the pressure regulator setting, but not if the constant head is set to the pressure regulator setting, which is too low.
Constant discharge: change code so no data entry is used when cells for pump to pivot pipe are empty.
32 | P a g e

Sprinkler Database (as of 9/10/2014)
1. KM-KPS-BK-FLmini-24-32. KM-KPS-BK-FLmini-24-63. KM-KPS-BK-FLmini-24-94. KM-KPS-BK-FL-33-35. KM-KPS-BK-FL-33-66. KM-KPS-BK-FL-33-97. KM-KPS-BL-CC-33-38. KM-KPS-BL-CC-33-69. KM-KPS-BL-CC-33-910. KM-KPS-GR-FL-24-311. KM-KPS-GR-FL-24-612. KM-KPS-GR-FL-24-913. KM-KPS-PC-BL-CC-15-314. KM-KPS-PC-BL-CC-15-615. KM-KPS-PC-BL-CC-15-916. KM-KPS-TQ-FLmini-0-317. KM-KPS-TQ-FLmini-0-618. KM-KPS-TQ-FLmini-0-919. KM-KPS-YL-FL-30-320. KM-KPS-YL-FL-30-621. KM-KPS-YL-FL-30-922. KM-KPT-BK-10-323. KM-KPT-BK-10-624. KM-KPT-BK-10-925. KM-KPT-BL-10-326. KM-KPT-BL-10-627. KM-KPT-BL-10-928. KM-KPT-YL-10-329. KM-KPT-YL-10-630. KM-KPT-YL-10-931. KOMET_TWINMAX32. KOMET10133. KOMET14034. KOMET16035. KOMET20236. NLA3000_GD137. NLA3000_GD338. NLA3000_GD639. NLA3000_GD940. NLA3000_NV1241. NLA3000_MR1
42. NLA3000_MR343. NLA3000_MR644. NLA3000_MR945. NLD3000_BK346. NLD3000_BK947. NLD3000_BL348. NLD3000_BL949. NLD3000_BR350. NLD3000_BR951. NLD3000_GN352. NLD3000_GN953. NLD3000_GR354. NLD3000_GR955. NLD3000_OR356. NLD3000_OR957. NLD3000_PU358. NLD3000_PU959. NLD3000_TQ360. NLD3000_TQ961. NLD3000_YL362. NLD3000_YL963. NLF32AS64. NLF32S65. NLF333DN66. NLF33A67. NLF33AS68. NLF33S69. NLF43A70. NLF43AP71. NLF43P72. NLF44AAB73. NLF70A74. NLF80A75. NLHD300076. NLN3000_BL377. NLN3000_BL678. NLN3000_GN379. NLN3000_GN680. NLO3000_BK381. NLO3000_BK682. NLO3000_BL3
83. NLO3000_BL684. NLO3000_PU385. NLO3000_PU686. NLP85A87. NLP85AV88. NLP85PV89. NLR3090. NLR30_LEPA91. NLR55a92. NLR3000_BL1293. NLR3000_BR194. NLR3000_BR395. NLR3000_BR696. NLR3000_BR997. NLR3000_GN198. NLR3000_GN399. NLR3000_GN6100.NLR3000_GN9101.NLR3000_OR1102.NLR3000_OR3103.NLR3000_OR6104.NLR3000_OR9105.NLR3000_RD1106.NLR3000_RD3107.NLR3000_RD6108.NLR3000_RD9109.NLR3000_WH12110.NLR3000_PC1111.NLR3000_PC3112.NLR3000_PC6113.NLS3000_BG3114.NLS3000_BG6115.NLS3000_GR3116.NLS3000_GR6117.NLS3000_PU3118.NLS3000_PU6119.NLS3000_RD3120.NLS3000_RD6121.NLS3000_YL3122.NLS3000_YL6123.NLS3000_TRQPC3
33 | P a g e

124.NLS3000_TRQPC6125.NLSPR1126.NLSR100127.NLSR150128.NLSR200129.NLSR75130.NT3FC02.0_BL12131.NT3FC02.0_GN6132.NT3FC02.5_BL12133.NT3FC02.5_GN6134.NT3FC03.0_BL12135.NT3FC03.0_GN6136.NT3FC03.5_BL12137.NT3FC03.5_GN6138.NT3FC04.0_BL12139.NT3FC04.0_GN6140.NT3FC04.3_BL12141.NT3FC04.3_GN6142.NT3FC05.0_BL12143.NT3FC05.0_GN6144.NT3FC05.5_BL12145.NT3FC05.5_GN6146.NT3FC06.0_BL12147.NT3FC06.0_GN6148.NT3FC07.0_BL12149.NT3FC07.0_GN6150.NT3FC08.0_BL12151.NT3FC08.0_GN6152.NT3FC09.0_BL12153.NT3FC09.0_GN6154.NT3FC10.0_BL12155.NT3FC10.0_GN6156.RB20157.RB30158.RB35159.RB40160.RB65161.RB70162.RB85163.RB8X164.RBL20165.RBL2020166.RBL30
167.RBL3030168.SEN_LDN_LEPA169.SENLDNCV1.5170.SENLDNCV3171.SENLDNCV6172.SENLDNCV9173.SENLDNCX1.5174.SENLDNCX1.5-UP3175.SENLDNCX3176.SENLDNCX3-UP3177.SENLDNCX6178.SENLDNCX6-UP3179.SENLDNCX9180.SENLDNCX9-UP3181.SENLDNFL1.5182.SENLDNFL1.5-UP3183.SENLDNFL3184.SENLDNFL3-UP3185.SENLDNFL6186.SENLDNFL6-UP3187.SENLDNFL9188.SENLDNFL9-UP3189.SENLNDCV1.5-UP3190.SENLNDCV3-UP3191.SENLNDCV6-UP3192.SENLNDCV9-UP3193.SENSSPRAYCV_3-UP3194.SENSSPRAYCV_6-UP3195.SENSSPRAYCV_9-UP3196.SENSSPRAYCX_3-UP3197.SENSSPRAYCX_6-UP3198.SENSSPRAYCX_9-UP3199.SENSSPRAYFL_3-UP3200.SENSSPRAYFL_6-UP3201.SENSSPRAYFL_9-UP3202.SN2014PM_12203.SNIWOBL6_3204.SNIWOBL6_3-UP3205.SNIWOBL6_6206.SNIWOBL6_6-UP3207.SNIWOBL9_3208.SNIWOBL9_3-UP3209.SNIWOBL9_6
210.SNIWOBL9_6-UP3211.SNIWOBS6_3-UP3212.SNIWOBS6_6-UP3213.SNIWOBS9_3214.SNIWOBS9_3-UP3215.SNIWOBS9_6216.SNIWOBS9_6-UP3217.SNS3005_SPVN218.SNS3005_STVN219.SNS4006220.SNS5006221.SNS5006H222.SNSENDSPRAY223.SNSFANSPRAY224.SNSSPR225.SNSSPR_LEPA226.SNSWobLA227.SNSWobSD228.SNXCELHA_12229.SNXCELMA_12230.SNXWOB605_TOP231.SNXWOB605_TOP-UP3232.SNXWOB610_3233.SNXWOB610_3-UP3234.SNXWOB610_6235.SNXWOB610_6-UP3236.SNXWOB615_3237.SNXWOB615_3-UP3238.SNXWOB615_6239.SNXWOB615_6-UP3240.SNXWOB910_3241.SNXWOB910_3-UP3242.SNXWOB910_6243.SNXWOB910_6-UP3244.VLSPR06245.VLSPR10246.WobLA_LEPA247.WobSD_LEPA248.
34 | P a g e

Komet Precision Spray
Listed in CPED as…Manufacturer
and ModelPlate Color
Plate TrajectoryNumber of Grooves
Sprinkler Height above
ground(in feet)
1. KM-KPS-BK-FLmini-24-3
KometPrecision Spray
(KPS)
BlackFlat24
3
2. KM-KPS-BK-FLmini-24-6
KometPrecision Spray
(KPS)
BlackFlat24
6
3. KM-KPS-BK-FLmini-24-9
KometPrecision Spray
(KPS)
BlackFlat24
9
4. KM-KPS-BK-FL-33-3Komet
Precision Spray (KPS)
BlackFlat33
3
5. KM-KPS-BK-FL-33-6Komet
Precision Spray (KPS)
BlackFlat33
6
6. KM-KPS-BK-FL-33-9Komet
Precision Spray (KPS)
BlackFlat33
9
7. KM-KPS-BL-CC-33-3Komet
Precision Spray (KPS)
BlueConcave
333
8. KM-KPS-BL-CC-33-6Komet
Precision Spray (KPS)
BlueConcave
336
9. KM-KPS-BL-CC-33-9Komet
Precision Spray (KPS)
BlueConcave
339
10. KM-KPS-GR-FL-24-3Komet
Precision Spray (KPS)
GreyFlat24
3
11. KM-KPS-GR-FL-24-6Komet
Precision Spray (KPS)
GreyFlat24
6
12. KM-KPS-GR-FL-24-9Komet
Precision Spray (KPS)
GreyFlat24
9
35 | P a g e

Komet Precision Spray (continued)
Listed in CPED as…Manufacturer
and ModelPlate Color
Plate TrajectoryNumber of Grooves
Sprinkler Height above
ground(in feet)
13. KM-KPS-PC-BL-CC-15-3
KometPrecision Spray
(KPS)
Part CircleBlue
Concave15
3
14. KM-KPS-PC-BL-CC-15-6
KometPrecision Spray
(KPS)
Part CircleBlue
Concave15
6
15. KM-KPS-PC-BL-CC-15-9
KometPrecision Spray
(KPS)
Part CircleBlue
Concave15
9
16. KM-KPS-TQ-FLmini-0-3
KometPrecision Spray
(KPS)
TurquoiseFlat
No grooves3
17. KM-KPS-TQ-FLmini-0-6
KometPrecision Spray
(KPS)
TurquoiseFlat
No grooves6
18. KM-KPS-TQ-FLmini-0-9
KometPrecision Spray
(KPS)
TurquoiseFlat
No grooves9
19. KM-KPS-YL-FL-30-3Komet
Precision Spray (KPS)
YellowFlat30
3
20. KM-KPS-YL-FL-30-6Komet
Precision Spray (KPS)
YellowFlat30
6
21. KM-KPS-YL-FL-30-9Komet
Precision Spray (KPS)
YellowFlat30
9
36 | P a g e

Komet Precision Twister (KPT)
Listed in CPED as…Manufacturer
and ModelPlate Color
Plate TrajectoryNumber of Grooves
Sprinkler Height above
ground(in feet)
22. KM-KPT-BK-10-3 Komet Precision Twister (KPT)
BlackStandard Trajectory Angle
10 grooves3
23. KM-KPT-BK-10-6 Komet Precision Twister (KPT)
BlackStandard Trajectory Angle
10 grooves6
24. KM-KPT-BK-10-9 Komet Precision Twister (KPT)
BlackStandard Trajectory Angle
10 grooves9
25. KM-KPT-BL-10-3 Komet Precision Twister (KPT)
BlueLow Trajectory Angle
10 grooves3
26. KM-KPT-BL-10-6 Komet Precision Twister (KPT)
BlueLow Trajectory Angle
10 grooves6
27. KM-KPT-BL-10-9 Komet Precision Twister (KPT)
BlueLow Trajectory Angle
10 grooves9
28. KM-KPT-YL-10-3 Komet Precision Twister (KPT)
YellowUltra-Low Trajectory Angle
10 grooves3
29. KM-KPT-YL-10-6 Komet Precision Twister (KPT)
YellowUltra-Low Trajectory Angle
10 grooves6
30. KM-KPT-YL-10-9 Komet Precision Twister (KPT)
YellowUltra-Low Trajectory Angle
10 grooves9
37 | P a g e

Komet Endguns
Listed in CPED as… Manufacturer Model Name
31. KOMET_TWINMAX Komet Twin Max
32. KOMET101 Komet Twin 101
33. KOMET140 Komet Twin 140
34. KOMET160 Komet Twin 160
35. KOMET202 Komet Twin 202
38 | P a g e

39 | P a g e

Nelson Accelerators
Listed in CPED as… ManufacturerSeries
Plate Color
Sprinkler Height (above
ground)
36. NLA3000_GD1Nelson
3000 SeriesAccelerator
Gold 1 foot
37. NLA3000_GD3Nelson
3000 SeriesAccelerator
Gold 3 feet
38. NLA3000_GD6Nelson
3000 SeriesAccelerator
Gold 6 feet
39. NLA3000_GD9Nelson
3000 SeriesAccelerator
Gold 9 foot
40. NLA3000_NV12Nelson
3000 SeriesAccelerator
Navy 12 feet
41. NLA3000_MR1Nelson
3000 SeriesAccelerator
Maroon 1 foot
42. NLA3000_MR3Nelson
3000 SeriesAccelerator
Maroon 3 feet
43. NLA3000_MR6Nelson
3000 SeriesAccelerator
Maroon 6 feet
44. NLA3000_MR9Nelson
3000 SeriesAccelerator
Maroon 9 feet
40 | P a g e

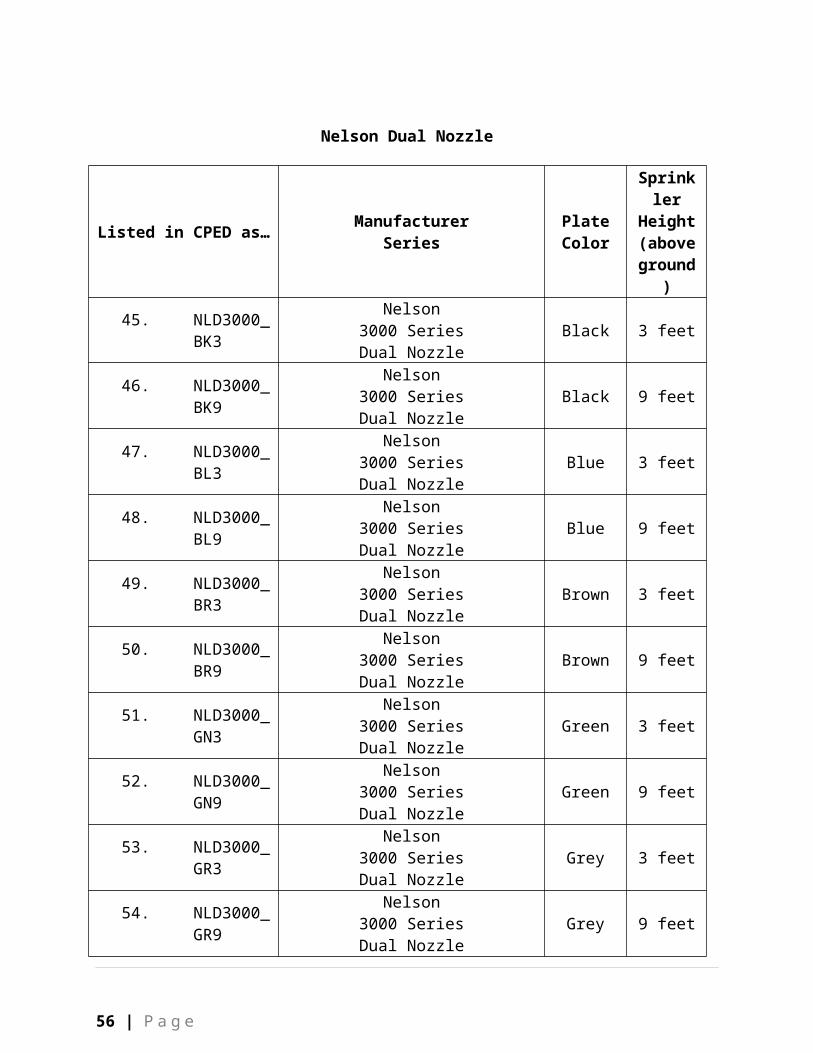
Nelson Dual Nozzle
Listed in CPED as… ManufacturerSeries
Plate Color
Sprinkler Height (above
ground)
45. NLD3000_BK3Nelson
3000 SeriesDual Nozzle
Black 3 feet
46. NLD3000_BK9Nelson
3000 SeriesDual Nozzle
Black 9 feet
47. NLD3000_BL3Nelson
3000 SeriesDual Nozzle
Blue 3 feet
48. NLD3000_BL9Nelson
3000 SeriesDual Nozzle
Blue 9 feet
49. NLD3000_BR3Nelson
3000 SeriesDual Nozzle
Brown 3 feet
50. NLD3000_BR9Nelson
3000 SeriesDual Nozzle
Brown 9 feet
51. NLD3000_GN3Nelson
3000 SeriesDual Nozzle
Green 3 feet
52. NLD3000_GN9Nelson
3000 SeriesDual Nozzle
Green 9 feet
53. NLD3000_GR3Nelson
3000 SeriesDual Nozzle
Grey 3 feet
54. NLD3000_GR9Nelson
3000 SeriesDual Nozzle
Grey 9 feet
55. NLD3000_OR3Nelson
3000 SeriesDual Nozzle
Orange 3 feet
56. NLD3000_OR9Nelson
3000 SeriesDual Nozzle
Orange 9 feet
57. NLD3000_PU3 Nelson3000 Series Purple 3 feet
41 | P a g e

Dual Nozzle
58. NLD3000_PU9Nelson
3000 SeriesDual Nozzle
Purple 9 feet
Listed in CPED as… ManufacturerSeries
Plate Color
Sprinkler Height (above
ground)
59. NLD3000_TQ3Nelson
3000 SeriesDual Nozzle
Turquoise 3 feet
60. NLD3000_TQ9Nelson
3000 SeriesDual Nozzle
Turquoise 9 feet
61. NLD3000_YL3Nelson
3000 SeriesDual Nozzle
Yellow 3 feet
62. NLD3000_YL9Nelson
3000 SeriesDual Nozzle
Yellow 9 feet
42 | P a g e

Nelson High Impact Sprinkler
Listed in CPED as…Manufacturer
Series
Sprinkler Height (above
ground)
63. NLF32AS Nelson
High Pressure Impact
Sprinkler
64. NLF32S Nelson
High Pressure Impact
Sprinkler
65. NLF333DN Nelson
High Pressure Impact
Sprinkler
66. NLF33A Nelson
High Pressure Impact
Sprinkler
67. NLF33AS Nelson
High Pressure Impact
Sprinkler
68. NLF33S Nelson
High Pressure Impact
Sprinkler
69. NLF43A Nelson
High Pressure Impact
Sprinkler
70. NLF43AP Nelson
High Pressure Impact
Sprinkler
71. NLF43P Nelson
High Pressure Impact
Sprinkler72. NLF44AAB Nelson
F44AABLow
Pressure Low Angle Pivot Sprinkler
43 | P a g e

Impact Sprinkler
73. NLF70A Nelson
High Pressure Impact
Sprinkler
74. NLF80A Nelson
High Pressure Impact
Sprinkler
75. NLHD3000 Nelson
44 | P a g e

Nelson Nutators
76. NLN3000_BL3Nelson
3000 SeriesNutator
Blue 3
77. NLN3000_BL6Nelson
3000 SeriesNutator
Blue 6
78. NLN3000_GN3Nelson
3000 SeriesNutator
Green 3
79. NLN3000_GN6Nelson
3000 SeriesNutator
Green 6
Nelson Orbitors
80. NLO3000_BK3 Nelson 3000 Series Orbitor Black
81. NLO3000_BK6 Nelson 3000 Series Orbitor Blue
82. NLO3000_BL3 Nelson 3000 Series Orbitor Blue
83. NLO3000_BL6 Nelson 3000 Series Orbitor Blue
84. NLO3000_PU3 Nelson 3000 Series Orbitor Blue
85. NLO3000_PU6 Nelson 3000 Series Orbitor Blue
86. NLP85A Nelson
87. NLP85AV Nelson
88. NLP85PV Nelson
89. NLR30 Nelson
90. NLR30_LEPA Nelson
45 | P a g e

Nelson Rotators (add link to Nelson PIVOT_R3000.pdf)
Available plates: Red, Orange, Brown, Blue, Green, White
91. NLR55aNelson
3000 SeriesRotator
12
92. NLR3000_BL12Nelson
3000 SeriesRotator
Blue(up top)
12
93. NLR3000_BR1Nelson
3000 SeriesRotator
Brown 1
94. NLR3000_BR3Nelson
3000 SeriesRotator
Brown 3
95. NLR3000_BR6Nelson
3000 SeriesRotator
Brown 6
96. NLR3000_BR9Nelson
3000 SeriesRotator
Brown 9
97. NLR3000_GN1Nelson
3000 SeriesRotator
Green 1
98. NLR3000_GN3Nelson
3000 SeriesRotator
Green 3
99. NLR3000_GN6Nelson
3000 SeriesRotator
Green 6
100. NLR3000_GR9Nelson
3000 SeriesRotator
Green 9
101. NLR3000_OR1Nelson
3000 SeriesRotator
Orange 1
102. NLR3000_OR3Nelson
3000 SeriesRotator
Orange 3
103. NLR3000_OR6Nelson
3000 SeriesRotator
Orange 6
104. NLR3000_OR9 Nelson Orange 9
46 | P a g e

3000 SeriesRotator
105. NLR3000_RD1 Nelson3000 Series
Rotator
Red 1
106. NLR3000_RD3Nelson
3000 SeriesRotator
Red 3
107. NLR3000_RD6Nelson
3000 SeriesRotator
Red 6
108. NLR3000_RD9Nelson
3000 SeriesRotator
Red 9
109. NLR3000_WH12Nelson
3000 SeriesRotator
White(up top)
12
110. NLR3000_PC1Nelson
3000 SeriesRotator
1
111. NLR3000_PC3Nelson
3000 SeriesRotator
3
112. NLR3000_PC6Nelson
3000 SeriesRotator
6
47 | P a g e

Nelson Spinners (add link to Nelson PIVOT_R3000.pdf)
Available plates: Red, Yellow, Purple, Beige
113. NLS3000_BG3Nelson
3000 SeriesSpinner
Beige 3
114. NLS3000_BG6Nelson
3000 SeriesSpinner
Beige 6
115. NLS3000_GR3Nelson
3000 SeriesSpinner
Green 3
116. NLS3000_GR6Nelson
3000 SeriesSpinner
Green 6
117. NLS3000_PU3Nelson
3000 SeriesSpinner
Purple 3
118. NLS3000_PU6Nelson
3000 SeriesSpinner
Purple 6
119. NLS3000_RD3Nelson
3000 SeriesSpinner
Red 3
120. NLS3000_RD6Nelson
3000 SeriesSpinner
Red 6
121. NLS3000_YL3Nelson
3000 SeriesSpinner
Yellow 3
122. NLS3000_YL6Nelson
3000 SeriesSpinner
Yellow 6
123. NLS3000_TRQPC3Nelson
3000 SeriesSpinner
3
124. NLS3000_TRQPC6Nelson
3000 SeriesSpinner
6
48 | P a g e

125. NLSPR1 Nelson Low Pressure spray sprinkler
126. NLSR100 Nelson 100 Series Big Gun
127. NLSR150 Nelson 150 Series Big Gun
128. NLSR200 Nelson 200 Series Big Gun
129. NLSR75 Nelson 75 Series Big Gun
49 | P a g e

Listed in CPED as… Manufacturer Series
Nozzle Features
Plate Color
Sprinkler Height (above
130. NT3FC02.0_BL12Nelson
Trashbuster T3000
Flow Control
2.0Blue 12
131. NT3FC02.0_GN6Nelson
Trashbuster T3000
Flow Control
2.0Green 6
132. NT3FC02.5_BL12Nelson
Trashbuster T3000
Flow Control
2.5Blue 12
133. NT3FC02.5_GN6Nelson
Trashbuster T3000
Flow Control
2.5Green 6
134. NT3FC03.0_BL12Nelson
Trashbuster T3000
Flow Control
3.0Blue 12
135. NT3FC03.0_GN6Nelson
Trashbuster T3000
Flow Control
3.0Green 6
136. NT3FC03.5_BL12Nelson
Trashbuster T3000
Flow Control
3.5Blue 12
137. NT3FC03.5_GN6Nelson
Trashbuster T3000
Flow Control
3.5Green 6
138. NT3FC04.0_BL12Nelson
Trashbuster T3000
Flow Control
4.0Blue 12
139. NT3FC04.0_GN6Nelson
Trashbuster T3000
Flow Control
4.0Green 6
140. NT3FC04.3_BL12Nelson
Trashbuster T3000
Flow Control
4.3Blue 12
141. NT3FC04.3_GN6Nelson
Trashbuster T3000
Flow Control
4.3Green 6
142. NT3FC05.0_BL12Nelson
Trashbuster T3000
Flow Control
5.0Blue 12
143. NT3FC05.0_GN6Nelson
Trashbuster T3000
Flow Control
5.0Green 6
144. NT3FC05.5_BL12 Nelson Flow Blue 12
50 | P a g e

Trashbuster T3000
Control5.5
145. NT3FC05.5_GN6Nelson
Trashbuster T3000
Flow Control
5.5Green 6
146. NT3FC06.0_BL12Nelson
Trashbuster T3000
Flow Control
6.0Blue 12
147. NT3FC06.0_GN6Nelson
Trashbuster T3000
Flow Control
6.0Green 6
148. NT3FC07.0_BL12Nelson
Trashbuster T3000
Flow Control
7.0Blue 12
149. NT3FC07.0_GN6Nelson
Trashbuster T3000
Flow Control
7.0Green 6
150. NT3FC08.0_BL12Nelson
Trashbuster T3000
Flow Control
8.0Blue 12
151. NT3FC08.0_GN6Nelson
Trashbuster T3000
Flow Control
8.0Green 6
152. NT3FC09.0_BL12Nelson
Trashbuster T3000
Flow Control
9.0Blue 12
153. NT3FC09.0_GN6Nelson
Trashbuster T3000
Flow Control
9.0Green 6
154. NT3FC10.0_BL12Nelson
Trashbuster T3000
Flow Control
10.0Blue 6
155. NT3FC10.0_GN6Nelson
Trashbuster T3000
Flow Control
10.0Green 12
51 | P a g e

Rainbird
Rainbird156. RB20157. RB30158. RB35159. RB40160. RB65161. RB70162. RB85163. RB8X164. RBL20165. RBL2020166. RBL30
167. RBL3030
¾ “ full circle impact sprinkler
52 | P a g e

Listed in CPED as… Manufacturer
Plate Color
Sprinkler Height (above
ground)
145. SEN_LDN_LEPASenninger
146. SENLDNCV1.5 Senninger
147. SENLDNCV3 Senninger
148. SENLDNCV6 Senninger
149. SENLDNCV9 Senninger
150. SENLDNCX1.5 Senninger
151. SENLDNCX1.5-UP3 Senninger
152. SENLDNCX3 Senninger
153. SENLDNCX3-UP3 Senninger
154. SENLDNCX6 Senninger
155. SENLDNCX6-UP3 Senninger
156. SENLDNCX9 Senninger
157. SENLDNCX9-UP3 Senninger
158. SENLDNFL1.5 Senninger
159. SENLDNFL1.5-UP3 Senninger
160. SENLDNFL3 Senninger
161. SENLDNFL3-UP3 Senninger
162. SENLDNFL6 Senninger
163. SENLDNFL6-UP3 Senninger
164. SENLDNFL9 Senninger
165. SENLDNFL9-UP3 Senninger
166. SENLNDCV1.5-UP3 Senninger
167. SENLNDCV3-UP3 Senninger
168. SENLNDCV6-UP3 Senninger
169. SENLNDCV9-UP3 Senninger
53 | P a g e

193. SENSSPRAYCV_3-UP3
Senninger SuperSprayConcave Plate
UP3(Universal Pivot Products Platform)
3 feet
194. SENSSPRAYCV_6-UP3
Senninger SuperSprayConcave Plate
UP3(Universal Pivot Products Platform)
6 feet
195. SENSSPRAYCV_9-UP3
Senninger SuperSprayConcave Plate
UP3(Universal Pivot Products Platform)
9 feet
196. SENSSPRAYCX_3-UP3
Senninger SuperSprayConvex Plate
UP3(Universal Pivot Products Platform)
3 feet
197. SENSSPRAYCX_6-UP3
Senninger SuperSprayConvex Plate
UP3(Universal Pivot Products Platform)
6 feet
198. SENSSPRAYCX_9-UP3
Senninger SuperSprayConvex Plate
UP3(Universal Pivot Products Platform)
9 feet
199. SENSSPRAYFL_3-UP3
Senninger SuperSprayFlat Plate
UP3(Universal Pivot Products Platform)
3 feet
200. SENSSPRAYFL_6-UP3
Senninger SuperSprayFlat Plate
UP3(Universal Pivot Products Platform)
6 feet
201. SENSSPRAYFL_9-UP3
Senninger SuperSprayFlat Plate
UP3(Universal Pivot Products Platform)
9 feet
54 | P a g e

202. SN2014PM_12 Senninger
203. SNIWOBL6_3
SenningeriWob
Low Angle6 grooves
3 feet
204. SNIWOBL6_3-UP3
SenningeriWob
Low Angle6 grooves
UP3(Universal Pivot Products Platform)
3 feet
205. SNIWOBL6_6
SenningeriWob
Low Angle6 grooves
6 feet
206. SNIWOBL6_6-UP3
SenningeriWob
Low Angle6 grooves
UP3(Universal Pivot Products Platform)
6 feet
207. SNIWOBL9_3
SenningeriWob
Low Angle9 grooves
3 feet
208. SNIWOBL9_3-UP3
SenningeriWob
Low Angle9 grooves
UP3(Universal Pivot Products Platform)
3 feet
209. SNIWOBL9_6
SenningeriWob
Low Angle9 grooves
6 feet
210. SNIWOBL9_6-UP3
SenningeriWob
Low Angle9 grooves
UP3(Universal Pivot Products Platform)
6 feet
55 | P a g e
211. SNIWOBS6_3-UP3
SenningeriWob
Standard Angle6 grooves
UP3(Universal Pivot Products Platform)
3 feet
212. SNIWOBS6_6-UP3
SenningeriWob
Standard Angle6 grooves
UP3(Universal Pivot Products Platform)
6 feet
213. SNIWOBS9_3
SenningeriWob
Standard Angle9 grooves
3 feet
214. SNIWOBS9_3-UP3
SenningeriWob
Standard Angle9 grooves
UP3(Universal Pivot Products Platform)
3 feet
215. SNIWOBS9_6
SenningeriWob
Standard Angle9 grooves
6 feet
216. SNIWOBS9_6-UP3
SenningeriWob
Standard Angle9 grooves
UP3(Universal Pivot Products Platform)
6 feet
56 | P a g e

217. SNS3005_SPVN Senninger
218. SNS3005_STVN Senninger
219. SNS4006 Senninger
220. SNS5006 Senninger
221. SNS5006H Senninger
222. SNSENDSPRAY Senninger
223. SNSFANSPRAY Senninger
224. SNSSPR Senninger
225. SNSSPR_LEPA Senninger
226. SNSWobLA Senninger
227. SNSWobSD Senninger
228. SNXCELHA_12 Senninger
229. SNXCELMA_12 Senninger
57 | P a g e

230. SNXWOB605_TOP
Senninger Model 605 TOPXi-Wob
6 grooves5 degree trajectory
Top of Pipe
231. SNXWOB605_TOP-UP3
Senninger Model 605 TOP Xi-Wob6 grooves
5 degree trajectoryUP3
(Universal Pivot Products Platform)
Top of Pipe
232. SNXWOB610_3
Senninger Model 610Xi-Wob
6 grooves10 degree trajectory
3 feet
233. SNXWOB610_3-UP3
Senninger Model 610Xi-Wob
6 grooves10 degree trajectory
UP3(Universal Pivot Products Platform)
3 feet
234. SNXWOB610_6
Senninger Model 610Xi-Wob
6 grooves10 degree trajectory
6 feet
235. SNXWOB610_6-UP3
Senninger Model 610Xi-Wob
6 grooves10 degree trajectory
UP3(Universal Pivot Products Platform)
6 feet
236. SNXWOB615_3
Senninger Model 615Xi-Wob
6 grooves15 degree trajectory
3 feet
237. SNXWOB615_3-UP3
Senninger Model 615Xi-Wob
6 grooves15 degree trajectory
UP3(Universal Pivot Products Platform)
3 feet
238. SNXWOB615_6
Senninger Model 615Xi-Wob
6 grooves15 degree trajectory
6 feet
58 | P a g e

239. SNXWOB615_6-UP3
Senninger Model 615Xi-Wob
6 grooves15 degree trajectory
UP3(Universal Pivot Products Platform)
6 feet
240. SNXWOB910_3
Senninger Model 910Xi-Wob
9 grooves10 degree trajectory
3 feet
241. SNXWOB910_3-UP3
Senninger Model 910Xi-Wob
9 grooves10 degree trajectory
UP3(Universal Pivot Products Platform)
3 feet
242. SNXWOB910_6
Senninger Model 910Xi-Wob
9 grooves10 degree trajectory
6 feet
243. SNXWOB910_6-UP3
Senninger Model 910Xi-Wob
9 grooves10 degree trajectory
UP3(Universal Pivot Products Platform)
6 feet
244. VLSPR06 Senninger
245. VLSPR10 Senninger
246. WobLA_LEPA Senninger
59 | P a g e

247. WobSD_LEPA
Senninger
60 | P a g e
Related Documents


