B. B. Karki, LSU CSC 7443: Scientific Information Visualization Introduction CSC 7443: Scientific Information Visualization

Welcome message from author
This document is posted to help you gain knowledge. Please leave a comment to let me know what you think about it! Share it to your friends and learn new things together.
Transcript

B. B. Karki, LSUCSC 7443: Scientific Information Visualization
Introduction
CSC 7443:Scientific Information Visualization

B. B. Karki, LSUCSC 7443: Scientific Information Visualization
Definition and Concept

B. B. Karki, LSUCSC 7443: Scientific Information Visualization
What Is Visualization?
• Process of making a computer image or graph forgaining an insight into data/information– Transforming abstract, physical data/information to a
form that can be seen– Interpreting in visual terms or putting into visual forms
(i.e., into pictures)
• Cognitive process– Form a mental image of something– Internalize an understanding

B. B. Karki, LSUCSC 7443: Scientific Information Visualization
Visualization Process
Computation:-simulation/modeling
Measured Data: -CT, MRI, Seismic Financial data:
-transactions per day
Data/Information
Transform Map Display

B. B. Karki, LSUCSC 7443: Scientific Information Visualization
Example: Visual Representation of Data
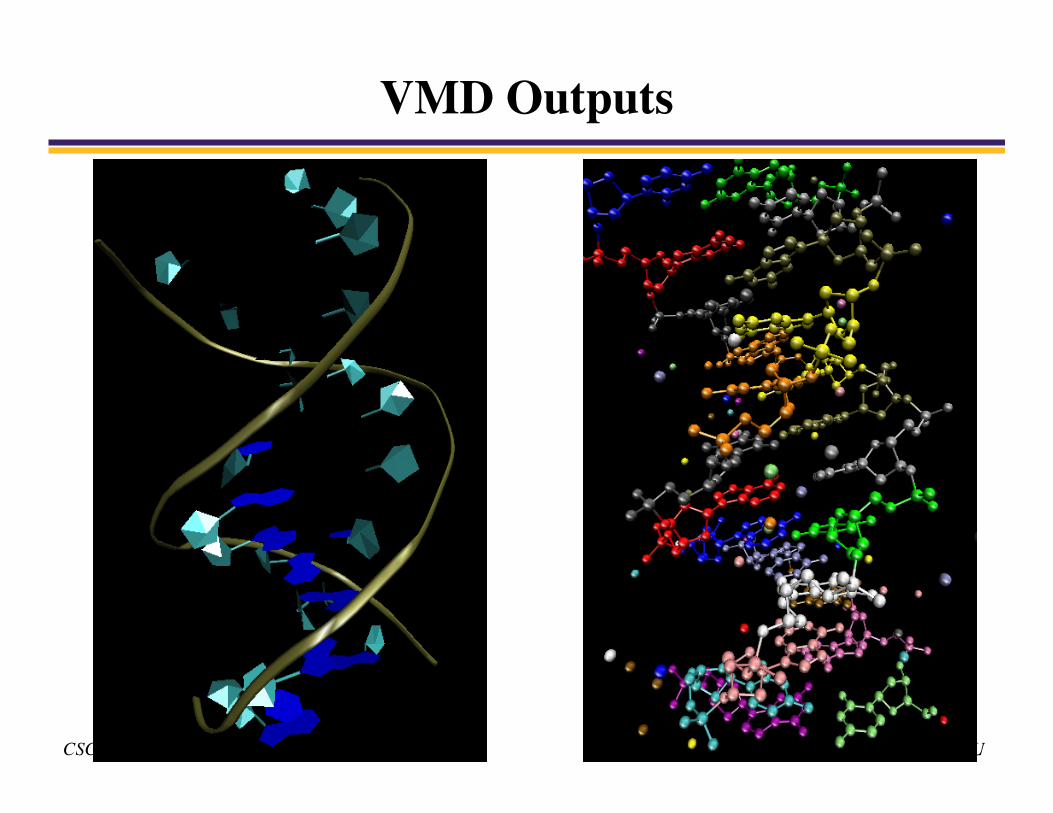
• Look at the data table for a biomolecule– Table shows atomic types, positions etc.– Can you get any information? How does its structure look like?
HEADER DEOXYRIBONUCLEIC ACID 04-JAN-93 111D 111D 2
COMPND DNA (5'-D(*CP*GP*CP*AP*AP*AP*TP*TP*GP*GP*CP*G)-3') 111D 3
CRYST1 25.230 41.160 65.010 90.00 90.00 90.00 P 21 21 21 8 111D 43
ATOM 1 O5* C A 1 19.185 35.253 25.139 1.00 0.00 111D 50
ATOM 2 C5* C A 1 19.533 35.044 23.748 1.00 0.00 111D 51
ATOM 3 C4* C A 1 20.280 33.726 23.644 1.00 0.00 111D 52
ATOM 4 O4* C A 1 19.606 32.677 24.281 1.00 0.00 111D 53
ATOM 5 C3* C A 1 20.487 33.261 22.214 1.00 0.00 111D 54
ATOM 6 O3* C A 1 21.753 32.648 21.999 1.00 0.00 111D 55
………………….
B. B. Karki, LSUCSC 7443: Scientific Information Visualization
VMD Outputs

B. B. Karki, LSUCSC 7443: Scientific Information Visualization
Why Visualization?
• Vision is most important human perception– Seeing is believing
• Is there any state in US which is connected to 8 states?

B. B. Karki, LSUCSC 7443: Scientific Information Visualization
Why?• Visual information is compact
– A picture is worth of thousands of words
London Subway

B. B. Karki, LSUCSC 7443: Scientific Information Visualization
Why?
• Extends our vision– Removes limits of human vision in space, time,
frequency and complexity– Creates images or pictures of things that otherwise can
not be seen
• See an object’s internal structure (visible man)• See things that are far away (stars and nebulas)• See microscopic world (crystal structure)• See things that move very fast (molecular dynamics)

B. B. Karki, LSUCSC 7443: Scientific Information Visualization
Human Inner Organs
• Visible (voxel) man– Reconstruction of human
body from tomographicdatasets of dissected realbodywww.uke.uni-hamburg.de

B. B. Karki, LSUCSC 7443: Scientific Information Visualization
Stars and Emission Nebulas
• VisualizingOrion Nebula:– Ionization
and emissivegas layers,proplyds andshock fronts,and stars
Nadeau et al., ComputerGraphs Forum, 20: 27(2001)

B. B. Karki, LSUCSC 7443: Scientific Information Visualization
Crystal Structure
• MgSiO3 perovskite
• An orthorhombicunit cell
• Atomic coordination

B. B. Karki, LSUCSC 7443: Scientific Information Visualization
Molecular Dynamics
Alkanethiol molecular chains on gold substrate: Collectivebehavior as time elapses in picoseconds (10-12 seconds)
Gold

B. B. Karki, LSUCSC 7443: Scientific Information Visualization
Why?
• Improves activities– Demonstrate, analyze, understand, explore, enlighten
– Provides a frame of reference (a temporary storage) tohelp us think

B. B. Karki, LSUCSC 7443: Scientific Information Visualization
Visualization as a Formal Discipline
• A part of our everyday life– Research/education– Business/finance– Entertainment industry
• Being developed as an important discipline or field– 1987 NSF report on visualization in scientific computing– IEEE visualization, ACM SIGGRAPH conferences– Several more international conferences

B. B. Karki, LSUCSC 7443: Scientific Information Visualization
Types and Applications

B. B. Karki, LSUCSC 7443: Scientific Information Visualization
Types of Visualization
• Scientific Visualization– Scientific data
• Information Visualization– Hypertext, abstract data structures
• Data Visualization– A more general term– data sources beyond science such as financial,
marketing, or business data– Broad enough to encompass both scientific and
information visualization

B. B. Karki, LSUCSC 7443: Scientific Information Visualization
Scientific Visualization
• Relates to and represents something physical orgeometric– Images of human brain– Air flow over a wing
• Data come from scientific computing andmeasurements

B. B. Karki, LSUCSC 7443: Scientific Information Visualization
Scientific Computing
• Real materials simulation/modeling– Electronic calculations– Atomistic MD (molecular dynamics) modeling– Finite element (continuum) modeling
• Solving differential equations– Computational fluid dynamics– Temperature distribution– Electromagnetic field

B. B. Karki, LSUCSC 7443: Scientific Information Visualization
Example: Electronic structures
Fermi Surface of Chromium(3 bands are shown)http://www.phys.ufl.edu/fermisurface/
Electronic charge density in MgO around avacancy defect (Red: deposition, Blue:depletion)

B. B. Karki, LSUCSC 7443: Scientific Information Visualization
Example: Fracture in Fiber Composite
A billion-atom MD simulation of fracture inSiN-matrix SiC-fiber composite
Nakano et al., 2000

B. B. Karki, LSUCSC 7443: Scientific Information Visualization
Example: Air Flow over Windshield
Air flow coming froma dashboard vent andstriking the windshieldof an automobile
http://www-fp.mcs.anl.gov/fl

B. B. Karki, LSUCSC 7443: Scientific Information Visualization
Example: Air Flow Around Plane
Streamlinerepresentationof air flow(vector field)

B. B. Karki, LSUCSC 7443: Scientific Information Visualization
Scientific Experiments
• Medical– Magnetic resonance imaging (MRI)– Computed tomography (CT)– Ultrasound
• Biological– Confocal microscope– Electron microscope
• Physical– Scanning tunnel microscope (STM)– Atomic force microscope (AFM)
• Earth science– Space station– Seismic tomography
• Object shape capture– 3D laser scanner

B. B. Karki, LSUCSC 7443: Scientific Information Visualization
Example: Medical Imaging
Standard brain CT image Volume rendered brain image
http://www.gemedicalsystems.com

B. B. Karki, LSUCSC 7443: Scientific Information Visualization
Example: Convection in Earth’s Mantle
www.vislab.usyd.edu.au/education/sv3/2001

B. B. Karki, LSUCSC 7443: Scientific Information Visualization
Information Visualization
• What is information?– Items, entities, things which do not have a direct
physical relevance, e.g, stock trends, baseball statistics,car attributes
– Text, statistics, financial/business data, internetinformation
• Visual representation of abstract entities– To amplify cognition– Useful for analysis, explanation and decision making

B. B. Karki, LSUCSC 7443: Scientific Information Visualization
Example: Power Costs
Average cost per month
Wall Street Journal, August 16, 2001

B. B. Karki, LSUCSC 7443: Scientific Information Visualization
Example: Electoral College
Atlanta Journal, November 5, 2000

B. B. Karki, LSUCSC 7443: Scientific Information Visualization
Example: London Subway
www.londontransport.co.uk/tube

B. B. Karki, LSUCSC 7443: Scientific Information Visualization
Example: Stock Market Data
• Financial visualization ofstock market– Four stocks over time
• Lines are wrapped withvariable radius tubes– Side view: History of stock
closing prices– Top view: Changes in stock
volume with time
Visualization Toolkit, Schroeder et al.,1997

B. B. Karki, LSUCSC 7443: Scientific Information Visualization
Application Areas
• Medical
• Biology
• Physics
• Astronomy
• Chemistry
• Earth sciences
• Engineering
• Metrology
• Business
• Finance
• Computer science

B. B. Karki, LSUCSC 7443: Scientific Information Visualization
Issues

B. B. Karki, LSUCSC 7443: Scientific Information Visualization
What make Visualization Challenging?
• Scale
• Dimensionality
• Data types
• Visual mapping
• Interactivity

B. B. Karki, LSUCSC 7443: Scientific Information Visualization
Data Explosion
• How to make sense out of the datasets when they becomevery large
• Scientific data– A million-atom simulation: 7 GB/step– Satellite or space station: TB/day– MRI dataset: 2563 = 16 MB/slice– Laser scanning: 2 million points/minute– Geographically distributed data
• Complex society– There simply is more stuff– Access to an incredible amount of data (news, sports, purchases)
by computers, internet and web– New York stock market: billion transactions/day
B. B. Karki, LSUCSC 7443: Scientific Information Visualization
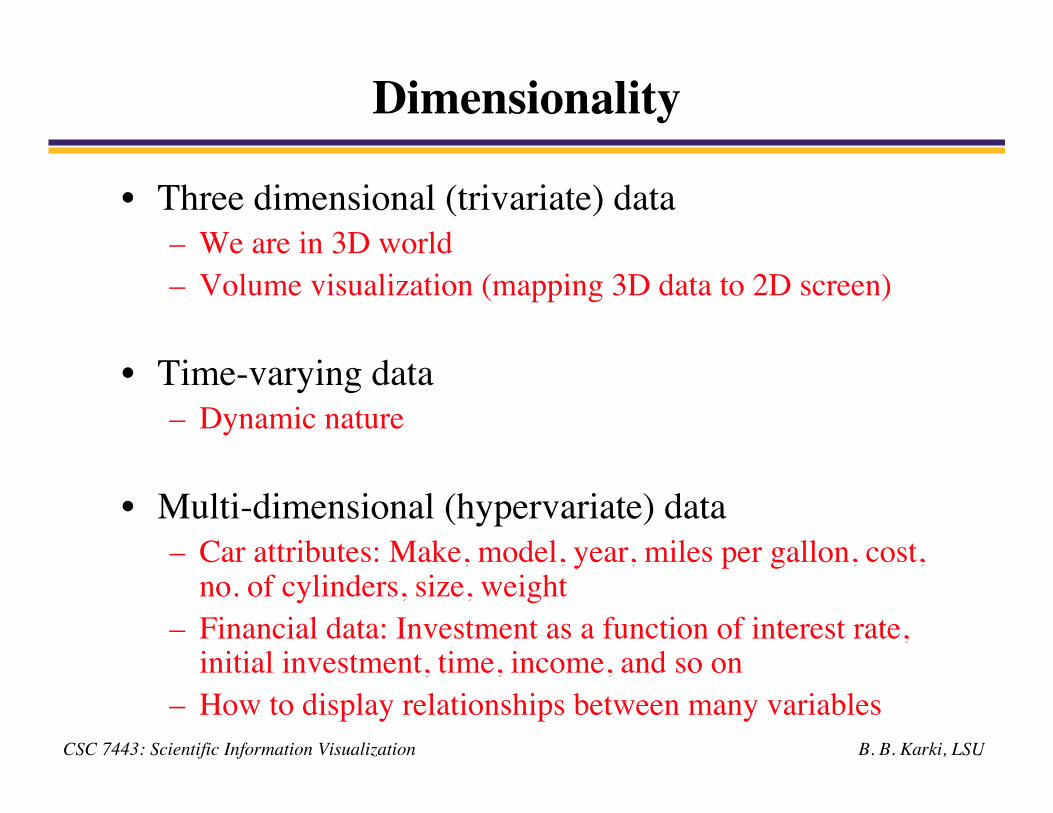
Dimensionality
• Three dimensional (trivariate) data– We are in 3D world– Volume visualization (mapping 3D data to 2D screen)
• Time-varying data– Dynamic nature
• Multi-dimensional (hypervariate) data– Car attributes: Make, model, year, miles per gallon, cost,
no. of cylinders, size, weight– Financial data: Investment as a function of interest rate,
initial investment, time, income, and so on– How to display relationships between many variables

B. B. Karki, LSUCSC 7443: Scientific Information Visualization
Data Types
• Structured versus unstructured data– Unstructured (irregular) data are less compact and efficient– Preprocessing of data
• Scalar, vector and tensor data– Data from flow dynamics– Stress-strain data
• Multiple data sets
• Non-numerical data– Ordinal: days of the week– Categorical data: names of animals

B. B. Karki, LSUCSC 7443: Scientific Information Visualization
Visual Mapping
• Display without ambiguity– Colors, lighting, translucent, animation, texture
mapping
• Too much data for too little display area (screen)– Too many cases– Too many variables
• Need to highlight particular cases or variables

B. B. Karki, LSUCSC 7443: Scientific Information Visualization
Interactivity
• Visualization is naturally interactive
• Show multiple different perspectives on the data
• Real-time interactions– Immersive interactive (virtual reality) environments

B. B. Karki, LSUCSC 7443: Scientific Information Visualization
Available Programs and APIs

B. B. Karki, LSUCSC 7443: Scientific Information Visualization
OpenGL
• Industry standard for a graphics API (Unix, PCs, Macs)
• Assembler language of computer graphics– One can have ultimate control in developing application– Faster execution– Most software is based on OpenGL
• Access from C/C++, Fortran, JAVA
• Window-system and operating system independent
• Source: www.opengl.org

B. B. Karki, LSUCSC 7443: Scientific Information Visualization
Visual Molecular Dynamics (VMD)
• Designed for biological macromolecules
• Immersive and interactivity
• Freely available for Unix, Mac and PCs
• Source: http://www.ks.uiuc.edu/Research/vmd/

B. B. Karki, LSUCSC 7443: Scientific Information Visualization
Visualization Toolkit (VTK)
• An open source, freely available software system
• Visualize any data in 3D -- medical, scientific orfinancial
• Build applications with C++, Java or Tcl
• Implemented on Unix-based platforms and PCs
• Source: http://public.kitware.com/VTK

B. B. Karki, LSUCSC 7443: Scientific Information Visualization
Advanced Visual Systems (AVS)
• AVS/Express, OpenViz
• Object-Oriented (C++, Java, Visual Basics)
• 3D stereo immersion and interactivity
• OpenViz for displaying business data
• Source: www.avs.com

B. B. Karki, LSUCSC 7443: Scientific Information Visualization
OpenDX (Data Explorer)
• Open source software version of IBMvisualization DX
• Unix, Linux, Macs and Pcs
• Work in client/server environment, and distributedprocessing
• Source: www.opendx.org

B. B. Karki, LSUCSC 7443: Scientific Information Visualization
Open Inventor
• Object-oriented toolkit (C and C++)
• Window system and platform independent
• Supports SGI graphics
• Serves as the basis for virtual reality modelinglanguage
• Source: www.sgi.com/software/inventor

B. B. Karki, LSUCSC 7443: Scientific Information Visualization
Amira
• Based on OpenGL and open inventor
• Window, Unix, Linux
• Automatic and interactive segmentation of data
• Various file formats such as tiff, jpeg, binary data
• Source: www.amiravis.com
Related Documents