23

Welcome message from author
This document is posted to help you gain knowledge. Please leave a comment to let me know what you think about it! Share it to your friends and learn new things together.
Transcript

23
24
Introduction
Mango originated in the Indo-Burmese region during the earlier period of
Cretaceous era (De Candolle, 1884; Gangolly et al, 1957; Subramanyam et al, 1975)
and gradually spread to the tropical and subtropical regions around the world. India is
thought to be the primary center of diversity along with its status as the center of
origin for mango. Presently India harbors more than 1000 mango cultivars and
represents the biggest mango germ pool in the world. Australia, China, Florida, Israel
and Thailand are the other regions that also maintain a healthy germplasm of mango.
Over the various mango growing regions, mango breeding attempts are always
on for creating better cultivars. Precise information on the genetic relationships within
such germplasm diversity is always needed for carrying out efficient breeding
programs. In order to assess the genetic diversity in mango, PCR based DNA markers
are considered be the best tools (Joshi et al, 1999). A range of DNA markers viz.
AFLP, DAMD, ISSR, ITS and RAPD have been used for exploring the diversity of
the global mango germ pool (Schnell et al, 1995; Bally et al, 1996; Lopez- Valenzuela
et al, 1997; Eiadthong et al, 1999a and b; Chunwongse et al, 2000; Ravishankar et al,
2000; Hemanth Kumar et al, 2001; Karihaloo et al, 2003; Ravishankar et al, 2004;
Srivastava et al, 2005). Among these, inter simple sequence repeat (ISSR)
(Zietkiewicz et al, 1994) is a reproducible semi arbitrary primed PCR method that
uses simple sequence repeats as primers, combining most of the advantages of
microsatellites and amplified fragment length polymorphism (AFLP), to the
universality of randomly amplified polymorphic DNA (RAPD) (Gemas et al, 2004).
ISSRs offer more probability than any other PCR marker system in the repeat regions
of the genome, which are the most potent regions for producing cultivar specific
markers. Automated PCR base makes ISSRs the markers of choice for screening the

25
genotypes. Here, ISSR marker system has been used to assess the diversity among 70
mango cultivars.
Materials and methods
Cultivar selection
For the present study, 60 elite Indian cultivars were selected on the basis of
their consistency in behavior for the last 30 years at their growing region, their
promising features for breeding and their plausibility to race in the global market.
Among these 60, 38 are south Indian cultivars including ‘Villai Kolumban’, as the
only Indian polyembryonic cultivar in the set and 16 are north Indian cultivars. Eight
promising Indian cultivars with the undecided south Indian or north Indian origin
(designated as Indian throughout the analysis) were also included in order to reveal
their parentage or at least their alliance in the mango cultivar cladogram. Among these
60, Alphonso, Badami, Baramahi Hapus, Banarasi Hapus and Kala Hapus real are
suspected to be synonymous to each other and were selected especially for confirming
their status. Ratna is F1 progeny cultivar of the Neelum × Alphonso cross, while
Sindhu is the outcome of Ratna- Alphonso backcross. Ten non-Indian cultivars were
included in this analysis to test the assumption that over the centuries, selection
criteria for the world market have been significantly different than those for the Indian
market and under such differential selection pressure the non-Indian cultivars may
show isolation from the diversity pool of Indian mango. These ten include five
Floridian cultivars, three Israeli and one Australian (‘Kensington’ as non Indian
polyembryonic cultivar) and Taiwanese cultivar each. The list of cultivars along with
their origins is given in Table 1. The two above-mentioned polyembryonic cultivars,
Villai Kolumban and Kensington were included as the ‘close outgroup’ taxa in the
26
study. Nothopegia colebrookiana Blume. (Anacardiaceae), a distant relative of the
genus Mangifera L, which is available in the local forests, was selected as the ‘distant
outgroup’.
Plant material
Flushing leaves from 70 mango cultivars (Table 1) were collected from the
experimental orchards at the Regional Fruit Research Station (RFRS) of Dr.
Balasaheb Savant Kokan Krishi Vidyapeeth [(DBSKKV) (Dr. Balasaheb Savant
Kokan Agricultural University)], Vengurle, Maharashtra, India and those of N.
Colebrookiana were collected from the forest of Amboli, Maharashtra. All leaf
samples were frozen in liquid nitrogen for transportation to the laboratory and
subsequently stored at –80οC until processed.
DNA extraction
DNA was extracted as described by Doyle and Doyle (1990). DNA
concentrations were determined by the comparison with the intensity of standard
DNA (λ DNA, Bangalore Genei, India) after electrophoresis in ethidium bromide
stained 0.8% agarose gel.
DNA amplification
A set of 100 ISSR primers, procured from University of British Columbia
(UBC, Vancouver, USA), was used for amplification of plant DNA.
Initially all 100 UBC primers were screened with ten mango cultivars wherein
at least one cultivar represented each geographic region along with one out-group.
The primers that generated polymorphism were used for the final experiment with all
the 70 cultivars along with one outgroup.
Polymerase chain reaction (PCR) was carried out in 25 µl volume as detailed
by Deshpande et al (2001). The amplified products were separated on 2.0% agarose

27
gel in 0.5 X TAE buffer and bands were detected by ethidium bromide staining as
suggested by Deshpande et al (2001). The size of each fragment was estimated with
reference to a DNA size marker φX 174/ Hae III digest (Bangalore Genei, India).
The band pattern obtained by each ISSR primer was scored by visual
inspection and the bands were recorded as present (1) or absent (0). From the band
patterns obtained with each primer, the cultivar specific bands (if any) along with
their sizes were recorded.
Statistical analysis
Similarity estimate ‘D’ was calculated as 2Nab/ Na+Nb for each primer and
also collectively for all 33 primers (Wetton et al, 1987). The probability that a
fragment in one cultivar is also found in another for all pairwise comparisons
(Fingerprinting potential of a marker) was then calculated for each primer as [(XD)n]
where, XD represents the average similarity index for all pairwise comparisons and n
is the average number of bands amplified by the primer (Ramakrishna et al, 1995).
[(XD)n] was also calculated considering the data from all 33 primers together.
The binary score data from ISSR amplification was directly fed to the
multivriate statistical package (MVSP) (Kovach, 2002) for Principal Co-Ordinate
analysis (PCO).
The genetic distance matrices were generated by the ‘Windist’ software option
from the Winboot package (Yap and Nelson, 1996) with Dice and Jaccard
coefficients. Bootstrapping (Felsenstein, 1985) was done by ‘Winboot’ software to
construct the dendrograms using unweighted pair group method with arithmetic
averages (UPGMA) algorithm with 500 replicates.
Entire analysis from the tissue collection to the statistical data analysis was
repeated twice.

28
Table 1. Mango cultivars used in the ISSR analysis with their region of cultivation.
Sr no.
Name of Cultivar
Region of cultivation
Sr. no.
Name of Cultivar
Region of cultivation
1 13-3 Israel 36 Keitt Florida 2 Alphonso South India 37 Kent Florida 3 Badaigol India 38 Kensington Australia 4 Badami South India 39 Kesar North India 5 Banarasi Batli North India 40 Kingphone Taiwan 6 Banarasi Hapus South India 41 Ladaio South India 7 Bangalore Goa South India 42 Langra North India 8 Baramahi Hapus India 43 Lili Israel 9 Baramasia South India 44 Mahalanjeo South India
10 Bengali pairi North India 45 Maharaja of Mysore
South India
11 Bekurad India 46 Makaram India 12 Bombay green South India 47 Maya Israel
13 Borsha Kalamshar
North India 48 Mulgoba South India
14 Chandrama South India 49 Musharad South India
15 Chinna Suvarnarekha
South India 50 Naliaro South India
16 Chittur Badami South India 51 Neelum South India 17 Creeping South India 52 Osteen Florida 18 Dadamio North India 53 Pairi South India 19 Dasheri North India 54 Palmar Florida 20 Devrukhio South India 55 Pau India 21 Dilpasand South India 56 Police India 22 Dudh peda South India 57 Rajapuri North India 23 Fakira North India 58 Rangar India 24 Fernandin South India 59 Ratna South India 25 Gadhemar South India 60 Roos South India 26 Goamankur South India 61 Rumani South India 27 Gopta of Navasari North India 62 Sabja South India 28 Hamlet South India 63 Saleem South India 29 Hathizool North India 64 SB Chausa North India 30 Jamadar North India 65 Sindhu South India 31 Kajalio South India 66 Tankij- amadi India 32 Kala Pahad North India 67 Tomy-Atkins Florida 33 Kalahapus real South India 68 Totapuri South India 34 Karanjio South India 69 Vanraj North India 35 Karelia North India 70 Villai Kolumban South India
71 Nothopegia colebrookiana
South India
29
Results
ISSR profiles in mango cultivars
Out of 100 ISSR primers, 40 showed amplification in 11 genotypes that were
used for the initial screening. Of these 40, 33 primers generated reproducible
polymorphic DNA amplification patterns in all the 71 genotypes. Twenty-seven of
these 33 primers belonged to the anchored di-nucleotide repeat class; remarkably, 15
of these 27 belong to either ‘AG repeat’ class or its complementary ‘CT repeat’ class
(Table 2).
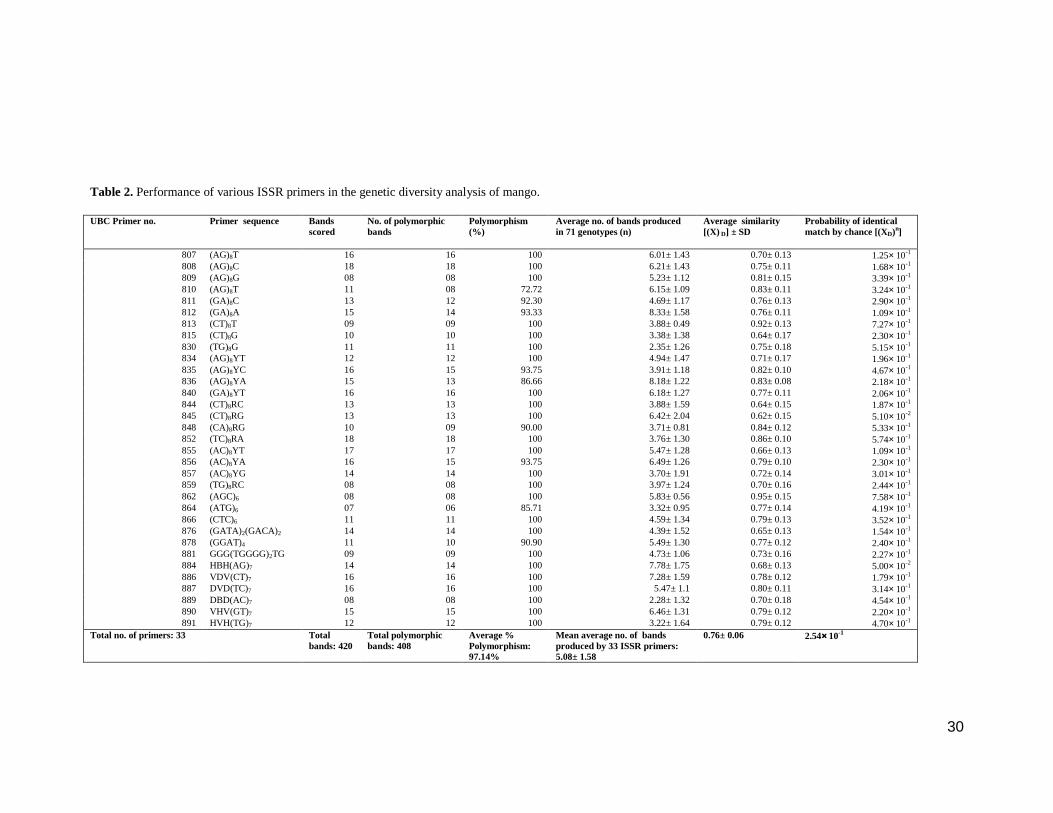
Table 2 explains the performance of the each of the 33 ISSR primers with 71
genotypes. These primers yielded a total of 420 scorable bands on amplification and
their sizes ranged between 200 bp to 2000 bp. The number of scorable bands
generated by the individual primers ranged between seven (UBC 864) and 18 (UBC
809 and UBC 852). Out of 420, 408 bands (97.14%) were polymorphic and only 12
bands (2.86%) were monomorphic. Most of the primers (24 of 33= 67%) exhibited
100% polymorphism while the least polymorphism (8 of 11 loci= 72.72%) was shown
by UBC 810. The average number of bands amplified from the pool of 71 genotypes
by UBC 889 was 2.28 and that by UBC 812 was 8.33; other primers produced
average number of scorable bands within the range of these two values.
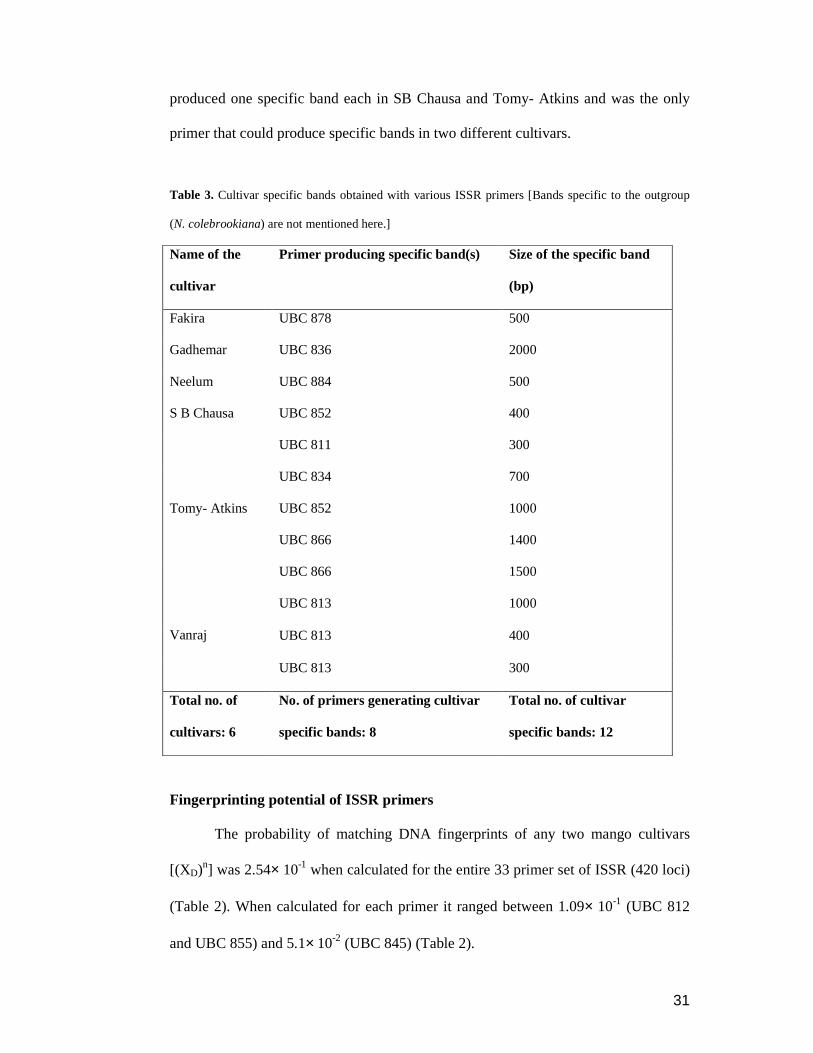
Cultivar specific bands
Twelve different cultivar specific bands were obtained from the amplification
profiles with eight ISSR primers (Table 3). Tomy- Atkins stood out to be a unique
cultivar with maximum of five specific bands produced by various primers. Primer
UBC 813 produced three specific bands for Vanraj making three as the highest
number of specific bands that any primer has produced. UBC 852
30
Table 2. Performance of various ISSR primers in the genetic diversity analysis of mango.
UBC Primer no. Primer sequence Bands
scored No. of polymorphic bands
Polymorphism (%)
Average no. of bands produced in 71 genotypes (n)
Average similarity [(X) D] ± SD
Probability of identical match by chance [(XD)n]
807 (AG)8T 16 16 100 6.01± 1.43 0.70± 0.13 1.25× 10⁻¹ 808 (AG)8C 18 18 100 6.21± 1.43 0.75± 0.11 1.68× 10⁻¹ 809 (AG)8G 08 08 100 5.23± 1.12 0.81± 0.15 3.39× 10⁻¹ 810 (AG)8T 11 08 72.72 6.15± 1.09 0.83± 0.11 3.24× 10⁻¹ 811 (GA)8C 13 12 92.30 4.69± 1.17 0.76± 0.13 2.90× 10⁻¹ 812 (GA)8A 15 14 93.33 8.33± 1.58 0.76± 0.11 1.09× 10⁻¹ 813 (CT)8T 09 09 100 3.88± 0.49 0.92± 0.13 7.27× 10⁻¹ 815 (CT)8G 10 10 100 3.38± 1.38 0.64± 0.17 2.30× 10⁻¹ 830 (TG)8G 11 11 100 2.35± 1.26 0.75± 0.18 5.15× 10⁻¹ 834 (AG)8YT 12 12 100 4.94± 1.47 0.71± 0.17 1.96× 10⁻¹ 835 (AG)8YC 16 15 93.75 3.91± 1.18 0.82± 0.10 4.67× 10⁻¹ 836 (AG)8YA 15 13 86.66 8.18± 1.22 0.83± 0.08 2.18× 10⁻¹ 840 (GA)8YT 16 16 100 6.18± 1.27 0.77± 0.11 2.06× 10⁻¹ 844 (CT)8RC 13 13 100 3.88± 1.59 0.64± 0.15 1.87× 10⁻¹ 845 (CT)8RG 13 13 100 6.42± 2.04 0.62± 0.15 5.10× 10⁻² 848 (CA)8RG 10 09 90.00 3.71± 0.81 0.84± 0.12 5.33× 10⁻¹ 852 (TC)8RA 18 18 100 3.76± 1.30 0.86± 0.10 5.74× 10⁻¹ 855 (AC)8YT 17 17 100 5.47± 1.28 0.66± 0.13 1.09× 10⁻¹ 856 (AC)8YA 16 15 93.75 6.49± 1.26 0.79± 0.10 2.30× 10⁻¹ 857 (AC)8YG 14 14 100 3.70± 1.91 0.72± 0.14 3.01× 10⁻¹ 859 (TG)8RC 08 08 100 3.97± 1.24 0.70± 0.16 2.44× 10⁻¹ 862 (AGC)6 08 08 100 5.83± 0.56 0.95± 0.15 7.58× 10⁻¹ 864 (ATG)6 07 06 85.71 3.32± 0.95 0.77± 0.14 4.19× 10⁻¹ 866 (CTC)6 11 11 100 4.59± 1.34 0.79± 0.13 3.52× 10⁻¹ 876 (GATA)2(GACA)2 14 14 100 4.39± 1.52 0.65± 0.13 1.54× 10⁻¹ 878 (GGAT)4 11 10 90.90 5.49± 1.30 0.77± 0.12 2.40× 10⁻¹ 881 GGG(TGGGG)2TG 09 09 100 4.73± 1.06 0.73± 0.16 2.27× 10⁻¹ 884 HBH(AG)7 14 14 100 7.78± 1.75 0.68± 0.13 5.00× 10⁻² 886 VDV(CT)7 16 16 100 7.28± 1.59 0.78± 0.12 1.79× 10⁻¹ 887 DVD(TC)7 16 16 100 5.47± 1.1 0.80± 0.11 3.14× 10⁻¹ 889 DBD(AC)7 08 08 100 2.28± 1.32 0.70± 0.18 4.54× 10⁻¹ 890 VHV(GT)7 15 15 100 6.46± 1.31 0.79± 0.12 2.20× 10⁻¹ 891 HVH(TG)7 12 12 100 3.22± 1.64 0.79± 0.12 4.70× 10⁻¹
Total no. of primers: 33 Total bands: 420
Total polymorphic bands: 408
Average % Polymorphism: 97.14%
Mean average no. of bands produced by 33 ISSR primers: 5.08± 1.58
0.76± 0.06 2.54×××× 10-1
31
produced one specific band each in SB Chausa and Tomy- Atkins and was the only
primer that could produce specific bands in two different cultivars.
Table 3. Cultivar specific bands obtained with various ISSR primers [Bands specific to the outgroup
(N. colebrookiana) are not mentioned here.]
Name of the
cultivar
Primer producing specific band(s) Size of the specific band
(bp)
Fakira UBC 878 500
Gadhemar UBC 836 2000
Neelum UBC 884 500
S B Chausa UBC 852 400
UBC 811 300
UBC 834 700
UBC 852 1000
UBC 866 1400
Tomy- Atkins
UBC 866 1500
UBC 813 1000
UBC 813 400
Vanraj
UBC 813 300
Total no. of
cultivars: 6
No. of primers generating cultivar
specific bands: 8
Total no. of cultivar
specific bands: 12
Fingerprinting potential of ISSR primers
The probability of matching DNA fingerprints of any two mango cultivars
[(XD)n] was 2.54× 10⁻¹ when calculated for the entire 33 primer set of ISSR (420 loci)
(Table 2). When calculated for each primer it ranged between 1.09× 10⁻¹ (UBC 812
and UBC 855) and 5.1× 10⁻² (UBC 845) (Table 2).
32
PCO analysis
Separation of non-Indian cultivars from the Indian cultivars was revealed in
the PCO (Fig 1). Foreign cultivars were placed in the first and the fourth quadrants
with the close cluster of Floridian cultivars including the Israeli cultivar Maya
(cultivar no. 47; Table 1). However, Tomy-Atkins (cultivar no. 67; Table 1), the
Floridian cultivar was placed distantly in the fourth quadrant from the pool of mango
cultivars. 13-3 (cultivar no. 1; Table 1) was placed centrally to the clusters of Indian
and foreign cultivars. N. colebrookiana (outgroup no. 71; Table 1) was placed
completely aloof in the fourth quadrant. All the Indian cultivars were observed to be
grouped together closely. However, seven Indian cultivars Badaigol (cultivar no. 3;
Table 1), Badami (cultivar no. 4; Table 1), Banarasi Batli (cultivar no. 5; Table 1),
Banarasi Hapus (cultivar no. 6; Table 1), Baramahi Hapus (cultivar no. 8; Table 1),
Baramasia (cultivar no. 9; Table 1), Chandrama (cultivar no. 14; Table 1) and Chittur
Badami (cultivar no. 16; Table 1) were not placed very closely to the cluster of Indian
cultivars and 13-3 (cultivar no. 1) was placed with these cultivars.
No geographical separation was revealed between the north Indian and the
south Indian cultivars by any of these statistical combinations.
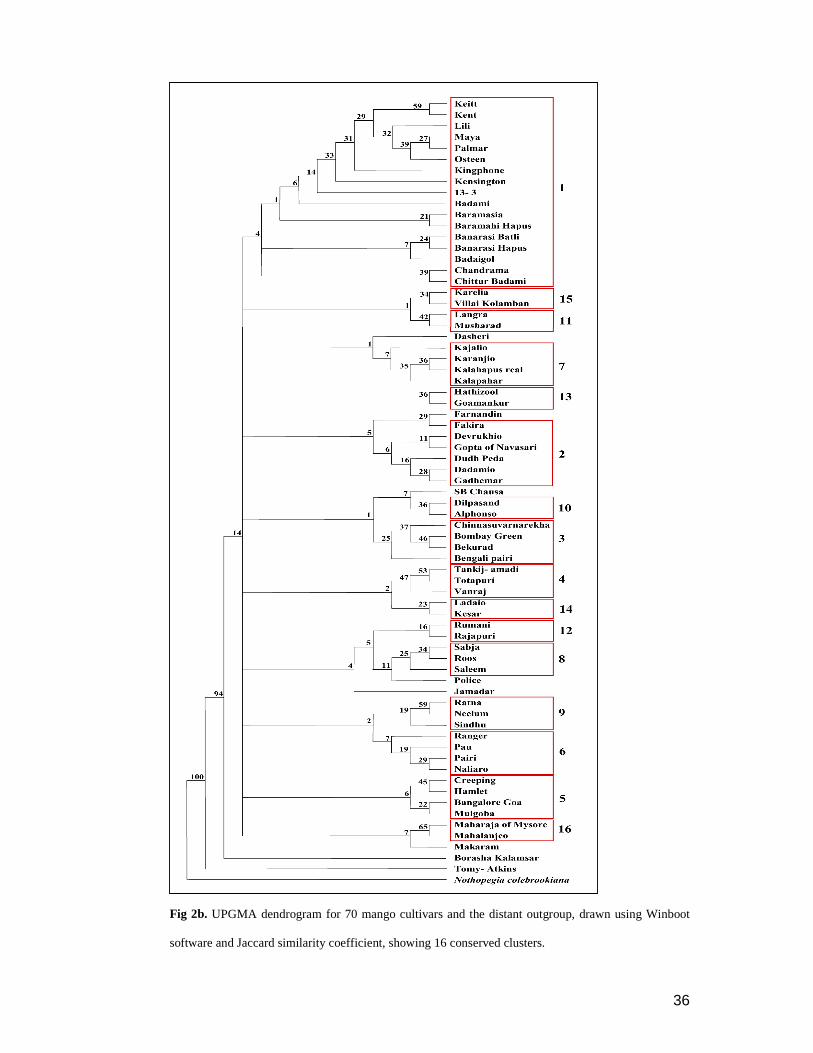
Cluster analysis
Both UPGMA dendrograms drawn using Dice (Fig 2a and b) and Jaccard
coefficients, showed highly similar grouping of cultivars. Both showed high bootstrap
separation of outgroup (100%) from the mango clade and that of Tomy- Atkins
(average 95 and 94%, respectively) from the big cluster of 69 mango cultivars.
Though non-Indian cultivars grouped separately from most of the Indian cultivars,
eight Indian cultivars grouped with the foreign cultivars. Congruence in the
composition of small clusters [3- 5 operational taxonomic units (OTU)] or OTU pairs

33
was remarkable in both the dendrograms; however, for most of the clusters Dice
coefficient produced higher bootstrap values than those of Jaccard coefficient (Fig 2a
and b).
Fig 1. Principle coordinate analysis based on the ISSR marker data, for 70 mango cultivars (Indian as
well as foreign) along with Nothopegia colebrookiana, the outgroup. Numbers denoting the plotted
data points represent respective mango cultivars as listed in Table 1.
Separation among the Indian cultivars was seen with low bootstrap values;
however, the cultivars those were suspected to be synonymous, opted different
subgroups. Villai Kolumban subgrouped with Karelia within the group of Indian
cultivars in both the trees. Similarly, Kensington grouped with the non Indian
cultivars. Six cultivars with the unknown origin were found scattered over the
dendrograms. Among these, Badaigol remained in the eight Indian cultivars that
grouped with the foreign cultivars. Remaining five subgrouped with various south

34
Indian cultivar clusters; Bekurad with Bombay green and Chinnasuvarnarekha;
Makaram with Mahalanjeo and Maharaja of Mysore; and lastly, Pau, Police and
Rangar with Naliaro and Pairi.
Integrity of smaller clusters or OTU pairs was remarkable in both the
Dendrograms. Sixteen clusters, including seven pairs were observed in both these
dendrograms (Table 4). First cluster was the biggest consisting nine non Indian and
eight Indian cultivars. Ratna and Sindhu clustered with Neelum in both these
analyses.
Table 4. Conserved clusters of mango cultivars extracted from two different UPGMA clustering
analyses performed using Dice and Jaccard similarity coefficients, respectively.
No. Cultivars of the conserved clusters
1. Keitt, Kent, Lili, Maya, Palmar, Osteen, Kingphone, Kensington, 13-3 ,
Badaigol, Banarasi Hapus, Banarasi Batli, Badami, Baramasia,
Baramahi Hapus, Chittur Badami, Chandrama
2. Dadamio, Devrukhio, Dudhpeda, Gadhemar, Gopta of Navsari, Fakira
3. Bengali pairi , Bekurad, Bombay Green, Chinna Suvarnarekha
4. Tankij-amadi, Totapuri, Vanraj
5. Bangalore Goa, Creeping, Hamlet, Mulgoba
6. Naliaro, Pairi, Pau, Rangar
7. Kajalio, Kala Pahad, Kalahapus Real, Karanjio
8. Roos, Sabja, Saleem
9. Neelum, Ratna, Sindhu
10. Alphonso, Dilpasand
11. Langra, Musharad
12. Rajapuri, Rumani
13. Goamankur, Hathizool
14. Kesar, Ladaio
15. Karelia, Villai Kolumban
16. Mahalanjeo, Maharaja of Mysore

35
Fig 2a. UPGMA dendrogram for 70 mango cultivars and the distant outgroup, drawn using Winboot
software and Dice similarity coefficient, showing 16 conserved clusters.
36
Fig 2b. UPGMA dendrogram for 70 mango cultivars and the distant outgroup, drawn using Winboot
software and Jaccard similarity coefficient, showing 16 conserved clusters.

37
Similarity estimates of Neelum ×××× Alphonso progeny
Similarity estimates for the group of Alphonso, Neelum, Ratna and Sindhu are
given in Table 5. Similarity between Alphonso and Neelum was 0.581, which was the
lowest among those values produced by these 4 cultivars. The highest similarity was
noted between Neelum and Sindhu (0.678).
Table 5. Similarity estimates between Alphonso, Neelum their F1 progeny cultivar Ratna and Sindhu,
the progeny of backcross between Ratna and Alphonso.
Alphonso Neelum Ratna Sindhu
Alphonso 1
Neelum 0.581 1
Ratna 0.595 0.678 1
Sindhu 0.587 0.614 0.628 1
Discussion
To the best of our knowledge there are only two reports (Eiadthong et al,
1999b; Srivastava et al, 2005), where the genetic diversity in mango is assessed by
ISSR markers. The report by Eidthong et al (1999b) mainly dealt with the
amplification in Thai cultivars by seven ISSR primers of which four were anchored
dinucleotide repeat primers. Srivastava et al (2005) have also used seven ISSR
primers which include two anchored dinucleotide repeat primers. Here, 100 ISSR
primers have been screened to find that the majority of anchored ISSR primers
(>80%) that can produce multilocus amplifications in mango, belong to the
dinucleotide repeat class. It indicates that the mango genome is likely to be rich in the
dinucleotide repeat regions. Eidthong et al (1999b) also reported variability in the
band patterns in order to distinguish any two cultivars, which could not be obtained in
the current set of cultivars. Indian cultivars showed higher homogeneity in the ISSR

38
targeted regions; it was also true for the selected foreign cultivars. Based on the
present study including the highest number of cultivars, number of primers as well as
the number of loci scored, it can be postulated that the variability observed by
previous researchers could be because of small sample size used and such variability
might get eliminated with the increase in the sample size and rule out the possibility
that ISSRs can become a direct and comprehensive marker system in mango cultivar
identification. Nonetheless, we report cultivar specific bands from the present set of
cultivars (Table 3). It should be noted that these specific bands are more in case of
two most diverged cultivars Tomy Atkins and Vanraj. These two probably define the
either extremes of the dendrograms in the present set of cultivars as the similarity
between them calculated using all Dice as well as Jaccard similarity coefficients was
the lowest of all the pairwise cultivar comparisons (0.504 and 0.337 respectively).
Rest of the cultivar pool is considerably homogenous for the ISSR targeted genomic
regions, which is evident from the ‘close’ pairwise similarity values. Srivastava et al
(2005) reported the RAPD and DAMD bands that were specific to cultivar Neelum
and its hybrid descendents; no such bands could be found in Alphonso, Neelum,
Ratna and Sindhu group with the ISSR marker system. Moreover, the present analysis
revealed some interesting information about this group of cultivars, wherein Neelum
emerged as a genetically close parent for Ratna. Surprisingly, Sindhu, which is a
backcross between Ratna and Alphonso, was also placed closer to Neelum than
Alphonso (Table 3 and 4). ISSR’s property to target repeat regions might be one of
the causes of such grouping.
Various markers that have been used to assess the genetic diversity in mango
have proved to be successful in various dimensions. RAPD markers in case of mango
could resolve the monoembryonic and polyembryonic cultivars clearly (Lopez-
39
Valenzuela et al, 1997; Karihaloo et al, 2003). Such a differentiation has not been
reported by AFLP, ISSR or any other system. Kensington and Villai Kolumban, the
two polyembryonic cultivars might have diverged as close outgroup taxa for the
present set of cultivars as per the priori assumption if ISSRs would have had that
resolution power. Present data is strong enough to state that no such differentiation
has taken place in the SSR regions of mango genome. Secondly, Lopez-Valenzuela et
al (1997) and Schnell et al (1995) mentioned the geographical clustering of cultivars
with the RAPDs, which we have also obtained quite clearly and consistently with the
ISSRs. Considering the extent of genomic regions spanned by the ISSRs and the
RAPDs, this phenomenon can be quoted as an evidence for the initiation of spatial
isolation in the global mango germ pool. Isolation within Indian cultivars as North
Indian and South Indian has also been reported by Karihaloo et al (2003) and
Ravishankar et al (2004), (Dendrogram as well as PCO results) using the RAPDs.
This grouping was observed to be dissolved by increase in the sample size
(Ravishankar et al, 2000) and by the change in selected cultivar set (Chunwongse et
al, 2000). ISSRs in the present study completely merge both the groups. This was
clearly evident from the high probability to find the shared bands among two
cultivars, the scatter plot as well as from the low bootstrap values in the dendrograms.
This could be because of the cultivar spreading in the recent past and higher rate of
new cultivar generation in India. While clustering, small conserved groups that were
observed instead of major lineages also support the postulate of recent history. In
order to obtain a better picture, such studies should be carried out with the larger
sample size, which will span the vast diversity of Indian cultivars and also with
different types of markers, each in statistically significant number. India being the

40
center of origin and the primary center of diversity for mango, such a study holds
worth scientific importance.
Related Documents