Introducing ViNAR (Visual Neglect Assessment and Rehabilitation) using the Leap Controller and Processing Can Eldem National University of Ireland in Maynooth Department of Computer Science NUI, Maynooth Co. Kildare Kate Forte National University of Ireland in Maynooth Department of Psychology NUI, Maynooth Co. Kildare Richard Roche National University of Ireland in Maynooth Department of Psychology NUI, Maynooth Co. Kildare Joseph Duffin National University of Ireland in Maynooth Department of Computer Science NUI, Maynooth Co. Kildare Abstract Visual Neglect is a common neuropsychological deficit associated with a person having a Stroke [1]. Stroke is a brain injury caused by a disruption of blood supply to different areas of the brain. In the case of visual neglect the brain area responsible for visual spatial processing is damaged [2]. Visual neglect is manifested by a Stroke patient’s inability to notice things usually in the left hand side of their visual space. Currently in a clinical setting, pen and paper-based techniques are used to assess the presence of Visual neglect in patients and in addition to this there have been a number of rehabilitative programs developed to try and ameliorate the symptoms of Visual Neglect with limited success [3]. Using the Leap Motion Controller, the associated SDK and the Processing programming language, this project sets out to develop a novel measurement paradigm for the mapping the spatial distribution of visual neglect as well as laying the groundwork for developing a novel rehabilitative intervention (a means of helping stroke patients to recover from visual neglect). Categories and Subject Descriptors H.1.2 [Models and Principles]: User/Machine Systems Human factors, Human information processing, Software psychology.; H.5.2 [Information Interfaces and Presentation]: User Interfaces Evaluation/Methodology, Ergonomics, Input Devices and Strategies, Prototyping, Audio Feedback (non-speech), Bench Marking. General Terms Human Factors, Measurement, Experimentation, De- sign Keywords Stroke, Visual spatial Neglect,Injury,Brain Injury Assess- ment and Rehabilitation, Brain Lesion, Leap Motion Controller, SDK, Processing Framework, Cognitive assessment. 1. Introduction Visual Neglect (VN) is a neuropsychological phenomenon that commonly occurs after stroke (brain injury) and results in a failure of patients to report, respond or orient to stimuli presented to their neglected visual field [4]. VN occurs more frequently in association with right hemisphere stroke and tends to be more severe in these cases [25,26]. VN which is associated with a right hemisphere stroke (injury to the right half of the brain) results in a neglect of the left side of the visual field (contralesional) [4]. This apparent mismatch in the side of damage versus deficit is due to the nature of the brain and the cross control of the hemispheres; i.e. the left hemisphere of the brain controls the right side of the body and the right hemisphere the left [5]. It manifests as an imbalance in spatial attention biased towards the right, leading to a relative neglect of the left side of space which can have various real world implications depending on severity. VN has a serious impact on the daily life of patients; they will often fail to dress themselves properly or only shave the right half of their faces or eat half of their meal. They also have a tendency to bump into objects on the left and as a result, hurt themselves or they can fail to find objects they leave in their left visual field [6]. More seriously VN impacts on the rehabilitation of other domains, such as motor deficits [7], [8]. As a result many otherwise capable patients are consigned to life in nursing homes and institutions, increasing financial and familial burdens above and beyond what fellow patients with similar lesions but no neglect would experience [9]. It has been suggested that correct assessment and rehabilitation of neglect could dramatically reduce the demand for related services in cases of stroke [4]. Regarding assessment there are numerous pen and paper measures currently in use as standard in clinical settings such as cancellation tasks [10], [11], line bisection [12], and figure copying and drawing tasks (see Figure 4). In the line bisection task patients are required to estimate and mark the mid point of six horizontal lines of different length. In this task, visual neglect is assessed as the patient’s deviation from the actual mid point (see Figure 1).

Welcome message from author
This document is posted to help you gain knowledge. Please leave a comment to let me know what you think about it! Share it to your friends and learn new things together.
Transcript
Introducing ViNAR (Visual Neglect Assessment andRehabilitation) using the Leap Controller and Processing
Can EldemNational University of Ireland in Maynooth
Department of Computer ScienceNUI, Maynooth Co. [email protected]
Kate ForteNational University of Ireland in Maynooth
Department of PsychologyNUI, Maynooth Co. Kildare
Richard RocheNational University of Ireland in Maynooth
Department of PsychologyNUI, Maynooth Co. [email protected]
Joseph DuffinNational University of Ireland in Maynooth
Department of Computer ScienceNUI, Maynooth Co. [email protected]
AbstractVisual Neglect is a common neuropsychological deficit associated with aperson having a Stroke [1]. Stroke is a brain injury caused by a disruptionof blood supply to different areas of the brain. In the case of visual neglectthe brain area responsible for visual spatial processing is damaged [2].Visual neglect is manifested by a Stroke patient’s inability to notice thingsusually in the left hand side of their visual space. Currently in a clinicalsetting, pen and paper-based techniques are used to assess the presenceof Visual neglect in patients and in addition to this there have been anumber of rehabilitative programs developed to try and ameliorate thesymptoms of Visual Neglect with limited success [3]. Using the LeapMotion Controller, the associated SDK and the Processing programminglanguage, this project sets out to develop a novel measurement paradigmfor the mapping the spatial distribution of visual neglect as well as layingthe groundwork for developing a novel rehabilitative intervention (a meansof helping stroke patients to recover from visual neglect).
Categories and Subject Descriptors H.1.2 [Models and Principles]:User/Machine Systems Human factors, Human information processing,Software psychology.; H.5.2 [Information Interfaces and Presentation]:User Interfaces Evaluation/Methodology, Ergonomics, Input Devices andStrategies, Prototyping, Audio Feedback (non-speech), Bench Marking.
General Terms Human Factors, Measurement, Experimentation, De-sign
Keywords Stroke, Visual spatial Neglect,Injury,Brain Injury Assess-ment and Rehabilitation, Brain Lesion, Leap Motion Controller, SDK,Processing Framework, Cognitive assessment.
1. IntroductionVisual Neglect (VN) is a neuropsychological phenomenon that commonlyoccurs after stroke (brain injury) and results in a failure of patients to report,
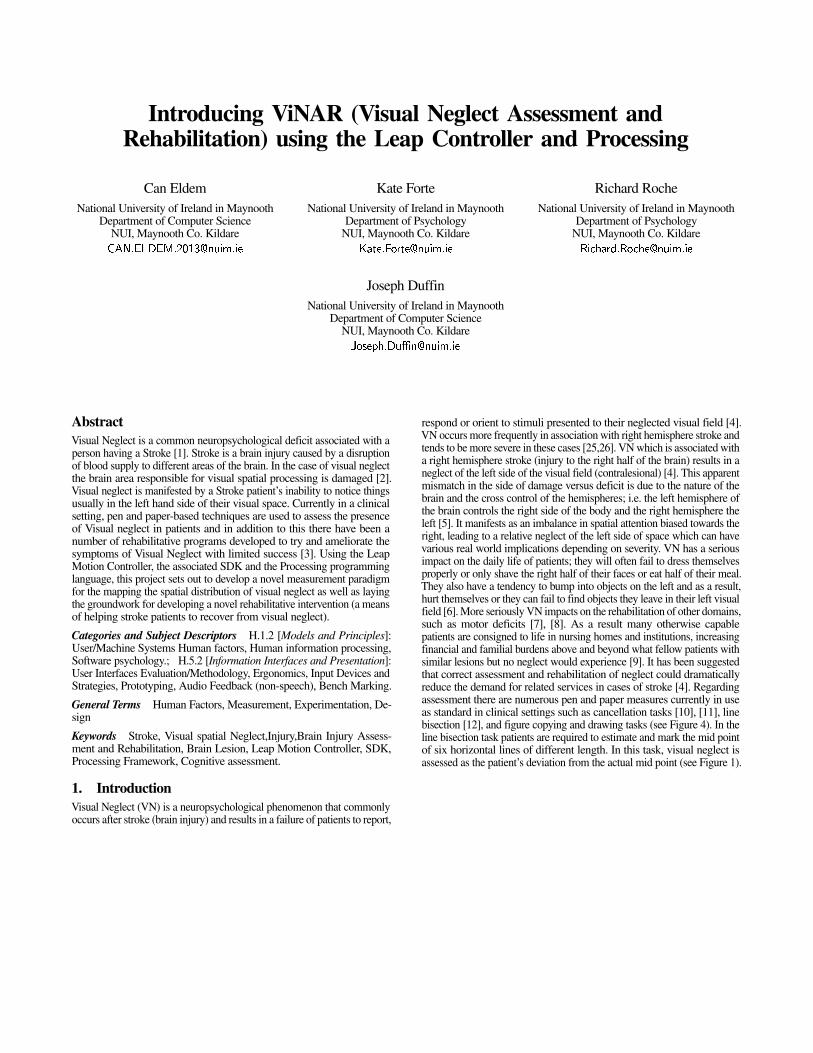
respond or orient to stimuli presented to their neglected visual field [4].VN occurs more frequently in association with right hemisphere stroke andtends to be more severe in these cases [25,26]. VN which is associated witha right hemisphere stroke (injury to the right half of the brain) results in aneglect of the left side of the visual field (contralesional) [4]. This apparentmismatch in the side of damage versus deficit is due to the nature of thebrain and the cross control of the hemispheres; i.e. the left hemisphere ofthe brain controls the right side of the body and the right hemisphere theleft [5]. It manifests as an imbalance in spatial attention biased towards theright, leading to a relative neglect of the left side of space which can havevarious real world implications depending on severity. VN has a seriousimpact on the daily life of patients; they will often fail to dress themselvesproperly or only shave the right half of their faces or eat half of their meal.They also have a tendency to bump into objects on the left and as a result,hurt themselves or they can fail to find objects they leave in their left visualfield [6]. More seriously VN impacts on the rehabilitation of other domains,such as motor deficits [7], [8]. As a result many otherwise capablepatients are consigned to life in nursing homes and institutions, increasingfinancial and familial burdens above and beyond what fellow patients withsimilar lesions but no neglect would experience [9]. It has been suggestedthat correct assessment and rehabilitation of neglect could dramaticallyreduce the demand for related services in cases of stroke [4]. Regardingassessment there are numerous pen and paper measures currently in useas standard in clinical settings such as cancellation tasks [10], [11], linebisection [12], and figure copying and drawing tasks (see Figure 4). In theline bisection task patients are required to estimate and mark the mid pointof six horizontal lines of different length. In this task, visual neglect isassessed as the patient’s deviation from the actual mid point (see Figure 1).
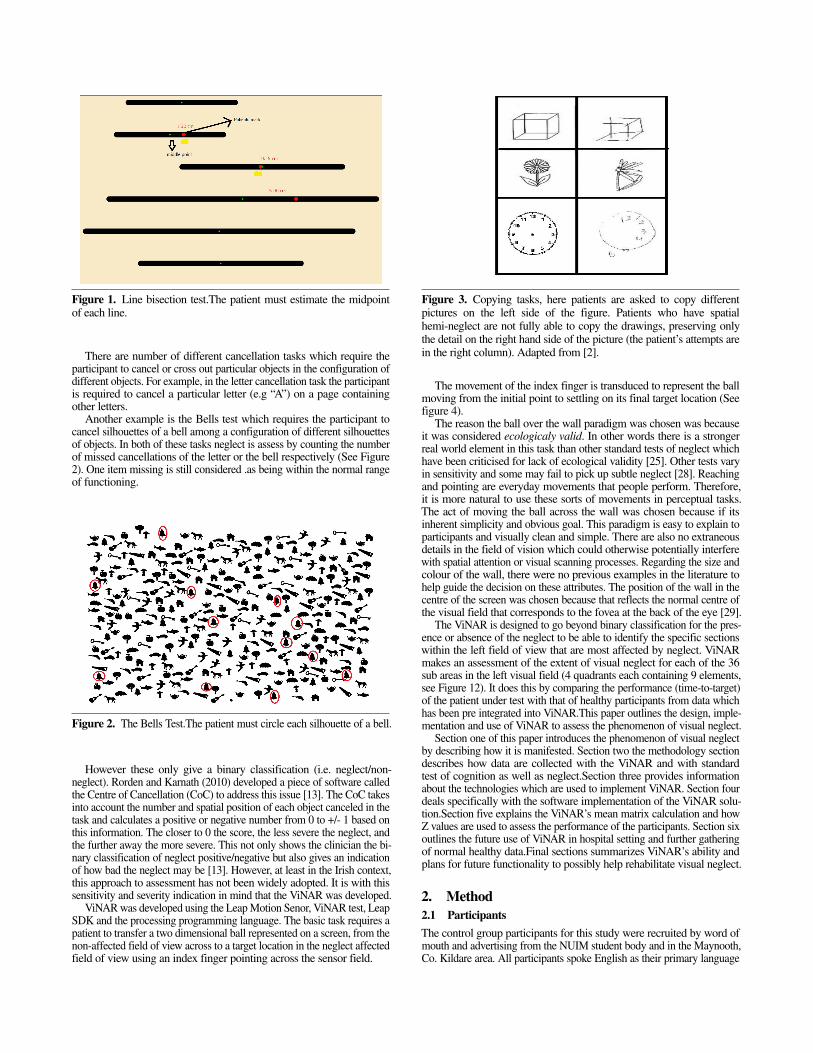
Figure 1. Line bisection test.The patient must estimate the midpointof each line.
There are number of different cancellation tasks which require theparticipant to cancel or cross out particular objects in the configuration ofdifferent objects. For example, in the letter cancellation task the participantis required to cancel a particular letter (e.g “A”) on a page containingother letters.
Another example is the Bells test which requires the participant tocancel silhouettes of a bell among a configuration of different silhouettesof objects. In both of these tasks neglect is assess by counting the numberof missed cancellations of the letter or the bell respectively (See Figure2). One item missing is still considered .as being within the normal rangeof functioning.
Figure 2. The Bells Test.The patient must circle each silhouette of a bell.
However these only give a binary classification (i.e. neglect/non-neglect). Rorden and Karnath (2010) developed a piece of software calledthe Centre of Cancellation (CoC) to address this issue [13]. The CoC takesinto account the number and spatial position of each object canceled in thetask and calculates a positive or negative number from 0 to +/- 1 based onthis information. The closer to 0 the score, the less severe the neglect, andthe further away the more severe. This not only shows the clinician the bi-nary classification of neglect positive/negative but also gives an indicationof how bad the neglect may be [13]. However, at least in the Irish context,this approach to assessment has not been widely adopted. It is with thissensitivity and severity indication in mind that the ViNAR was developed.
ViNAR was developed using the Leap Motion Senor, ViNAR test, LeapSDK and the processing programming language. The basic task requires apatient to transfer a two dimensional ball represented on a screen, from thenon-affected field of view across to a target location in the neglect affectedfield of view using an index finger pointing across the sensor field.
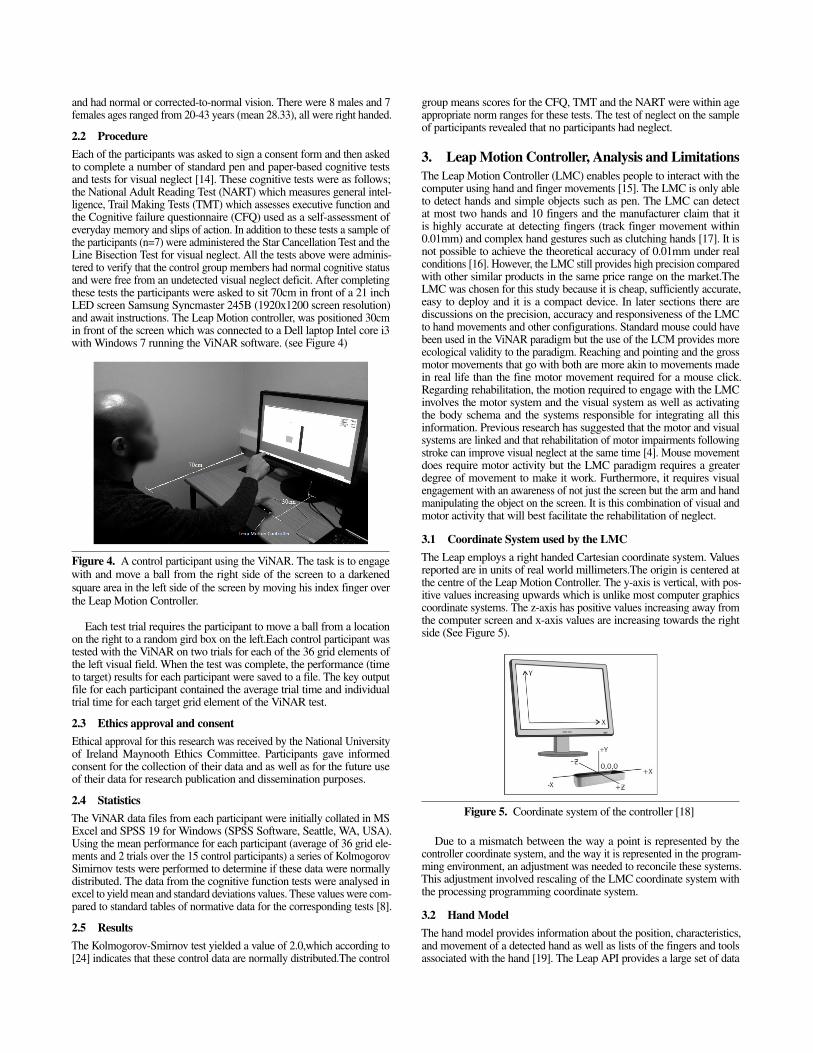
Figure 3. Copying tasks, here patients are asked to copy differentpictures on the left side of the figure. Patients who have spatialhemi-neglect are not fully able to copy the drawings, preserving onlythe detail on the right hand side of the picture (the patient’s attempts arein the right column). Adapted from [2].
The movement of the index finger is transduced to represent the ballmoving from the initial point to settling on its final target location (Seefigure 4).
The reason the ball over the wall paradigm was chosen was becauseit was considered ecologicaly valid. In other words there is a strongerreal world element in this task than other standard tests of neglect whichhave been criticised for lack of ecological validity [25]. Other tests varyin sensitivity and some may fail to pick up subtle neglect [28]. Reachingand pointing are everyday movements that people perform. Therefore,it is more natural to use these sorts of movements in perceptual tasks.The act of moving the ball across the wall was chosen because if itsinherent simplicity and obvious goal. This paradigm is easy to explain toparticipants and visually clean and simple. There are also no extraneousdetails in the field of vision which could otherwise potentially interferewith spatial attention or visual scanning processes. Regarding the size andcolour of the wall, there were no previous examples in the literature tohelp guide the decision on these attributes. The position of the wall in thecentre of the screen was chosen because that reflects the normal centre ofthe visual field that corresponds to the fovea at the back of the eye [29].
The ViNAR is designed to go beyond binary classification for the pres-ence or absence of the neglect to be able to identify the specific sectionswithin the left field of view that are most affected by neglect. ViNARmakes an assessment of the extent of visual neglect for each of the 36sub areas in the left visual field (4 quadrants each containing 9 elements,see Figure 12). It does this by comparing the performance (time-to-target)of the patient under test with that of healthy participants from data whichhas been pre integrated into ViNAR.This paper outlines the design, imple-mentation and use of ViNAR to assess the phenomenon of visual neglect.
Section one of this paper introduces the phenomenon of visual neglectby describing how it is manifested. Section two the methodology sectiondescribes how data are collected with the ViNAR and with standardtest of cognition as well as neglect.Section three provides informationabout the technologies which are used to implement ViNAR. Section fourdeals specifically with the software implementation of the ViNAR solu-tion.Section five explains the ViNAR’s mean matrix calculation and howZ values are used to assess the performance of the participants. Section sixoutlines the future use of ViNAR in hospital setting and further gatheringof normal healthy data.Final sections summarizes ViNAR’s ability andplans for future functionality to possibly help rehabilitate visual neglect.
2. Method2.1 ParticipantsThe control group participants for this study were recruited by word ofmouth and advertising from the NUIM student body and in the Maynooth,Co. Kildare area. All participants spoke English as their primary language
and had normal or corrected-to-normal vision. There were 8 males and 7females ages ranged from 20-43 years (mean 28.33), all were right handed.
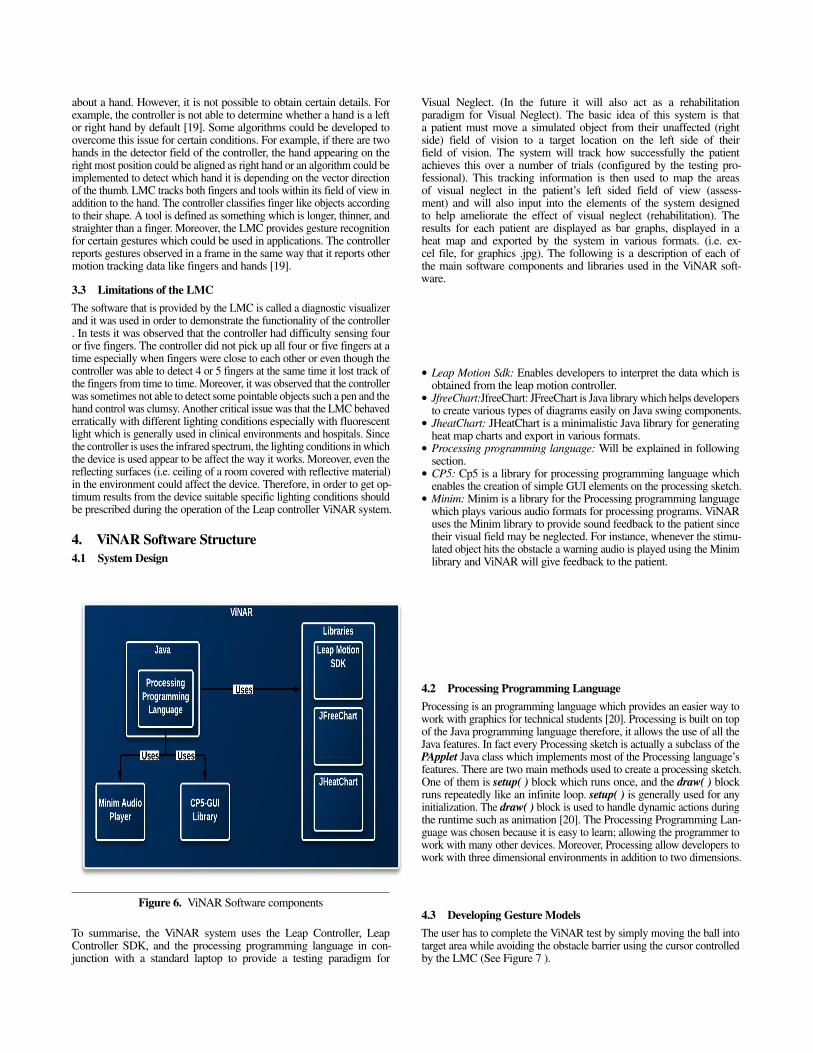
2.2 ProcedureEach of the participants was asked to sign a consent form and then askedto complete a number of standard pen and paper-based cognitive testsand tests for visual neglect [14]. These cognitive tests were as follows;the National Adult Reading Test (NART) which measures general intel-ligence, Trail Making Tests (TMT) which assesses executive function andthe Cognitive failure questionnaire (CFQ) used as a self-assessment ofeveryday memory and slips of action. In addition to these tests a sample ofthe participants (n=7) were administered the Star Cancellation Test and theLine Bisection Test for visual neglect. All the tests above were adminis-tered to verify that the control group members had normal cognitive statusand were free from an undetected visual neglect deficit. After completingthese tests the participants were asked to sit 70cm in front of a 21 inchLED screen Samsung Syncmaster 245B (1920x1200 screen resolution)and await instructions. The Leap Motion controller, was positioned 30cmin front of the screen which was connected to a Dell laptop Intel core i3with Windows 7 running the ViNAR software. (see Figure 4)
Figure 4. A control participant using the ViNAR. The task is to engagewith and move a ball from the right side of the screen to a darkenedsquare area in the left side of the screen by moving his index finger overthe Leap Motion Controller.
Each test trial requires the participant to move a ball from a locationon the right to a random gird box on the left.Each control participant wastested with the ViNAR on two trials for each of the 36 grid elements ofthe left visual field. When the test was complete, the performance (timeto target) results for each participant were saved to a file. The key outputfile for each participant contained the average trial time and individualtrial time for each target grid element of the ViNAR test.
2.3 Ethics approval and consentEthical approval for this research was received by the National Universityof Ireland Maynooth Ethics Committee. Participants gave informedconsent for the collection of their data and as well as for the future useof their data for research publication and dissemination purposes.
2.4 StatisticsThe ViNAR data files from each participant were initially collated in MSExcel and SPSS 19 for Windows (SPSS Software, Seattle, WA, USA).Using the mean performance for each participant (average of 36 grid ele-ments and 2 trials over the 15 control participants) a series of KolmogorovSimirnov tests were performed to determine if these data were normallydistributed. The data from the cognitive function tests were analysed inexcel to yield mean and standard deviations values. These values were com-pared to standard tables of normative data for the corresponding tests [8].
2.5 ResultsThe Kolmogorov-Smirnov test yielded a value of 2.0,which according to[24] indicates that these control data are normally distributed.The control
group means scores for the CFQ, TMT and the NART were within ageappropriate norm ranges for these tests. The test of neglect on the sampleof participants revealed that no participants had neglect.
3. Leap Motion Controller, Analysis and LimitationsThe Leap Motion Controller (LMC) enables people to interact with thecomputer using hand and finger movements [15]. The LMC is only ableto detect hands and simple objects such as pen. The LMC can detectat most two hands and 10 fingers and the manufacturer claim that itis highly accurate at detecting fingers (track finger movement within0.01mm) and complex hand gestures such as clutching hands [17]. It isnot possible to achieve the theoretical accuracy of 0.01mm under realconditions [16]. However, the LMC still provides high precision comparedwith other similar products in the same price range on the market.TheLMC was chosen for this study because it is cheap, sufficiently accurate,easy to deploy and it is a compact device. In later sections there arediscussions on the precision, accuracy and responsiveness of the LMCto hand movements and other configurations. Standard mouse could havebeen used in the ViNAR paradigm but the use of the LCM provides moreecological validity to the paradigm. Reaching and pointing and the grossmotor movements that go with both are more akin to movements madein real life than the fine motor movement required for a mouse click.Regarding rehabilitation, the motion required to engage with the LMCinvolves the motor system and the visual system as well as activatingthe body schema and the systems responsible for integrating all thisinformation. Previous research has suggested that the motor and visualsystems are linked and that rehabilitation of motor impairments followingstroke can improve visual neglect at the same time [4]. Mouse movementdoes require motor activity but the LMC paradigm requires a greaterdegree of movement to make it work. Furthermore, it requires visualengagement with an awareness of not just the screen but the arm and handmanipulating the object on the screen. It is this combination of visual andmotor activity that will best facilitate the rehabilitation of neglect.
3.1 Coordinate System used by the LMCThe Leap employs a right handed Cartesian coordinate system. Valuesreported are in units of real world millimeters.The origin is centered atthe centre of the Leap Motion Controller. The y-axis is vertical, with pos-itive values increasing upwards which is unlike most computer graphicscoordinate systems. The z-axis has positive values increasing away fromthe computer screen and x-axis values are increasing towards the rightside (See Figure 5).
Figure 5. Coordinate system of the controller [18]
Due to a mismatch between the way a point is represented by thecontroller coordinate system, and the way it is represented in the program-ming environment, an adjustment was needed to reconcile these systems.This adjustment involved rescaling of the LMC coordinate system withthe processing programming coordinate system.
3.2 Hand ModelThe hand model provides information about the position, characteristics,and movement of a detected hand as well as lists of the fingers and toolsassociated with the hand [19]. The Leap API provides a large set of data
about a hand. However, it is not possible to obtain certain details. Forexample, the controller is not able to determine whether a hand is a leftor right hand by default [19]. Some algorithms could be developed toovercome this issue for certain conditions. For example, if there are twohands in the detector field of the controller, the hand appearing on theright most position could be aligned as right hand or an algorithm could beimplemented to detect which hand it is depending on the vector directionof the thumb. LMC tracks both fingers and tools within its field of view inaddition to the hand. The controller classifies finger like objects accordingto their shape. A tool is defined as something which is longer, thinner, andstraighter than a finger. Moreover, the LMC provides gesture recognitionfor certain gestures which could be used in applications. The controllerreports gestures observed in a frame in the same way that it reports othermotion tracking data like fingers and hands [19].
3.3 Limitations of the LMCThe software that is provided by the LMC is called a diagnostic visualizerand it was used in order to demonstrate the functionality of the controller. In tests it was observed that the controller had difficulty sensing fouror five fingers. The controller did not pick up all four or five fingers at atime especially when fingers were close to each other or even though thecontroller was able to detect 4 or 5 fingers at the same time it lost track ofthe fingers from time to time. Moreover, it was observed that the controllerwas sometimes not able to detect some pointable objects such a pen and thehand control was clumsy. Another critical issue was that the LMC behavederratically with different lighting conditions especially with fluorescentlight which is generally used in clinical environments and hospitals. Sincethe controller is uses the infrared spectrum, the lighting conditions in whichthe device is used appear to be affect the way it works. Moreover, even thereflecting surfaces (i.e. ceiling of a room covered with reflective material)in the environment could affect the device. Therefore, in order to get op-timum results from the device suitable specific lighting conditions shouldbe prescribed during the operation of the Leap controller ViNAR system.
4. ViNAR Software Structure4.1 System Design
Figure 6. ViNAR Software components
To summarise, the ViNAR system uses the Leap Controller, LeapController SDK, and the processing programming language in con-junction with a standard laptop to provide a testing paradigm for
Visual Neglect. (In the future it will also act as a rehabilitationparadigm for Visual Neglect). The basic idea of this system is thata patient must move a simulated object from their unaffected (rightside) field of vision to a target location on the left side of theirfield of vision. The system will track how successfully the patientachieves this over a number of trials (configured by the testing pro-fessional). This tracking information is then used to map the areasof visual neglect in the patient’s left sided field of view (assess-ment) and will also input into the elements of the system designedto help ameliorate the effect of visual neglect (rehabilitation). Theresults for each patient are displayed as bar graphs, displayed in aheat map and exported by the system in various formats. (i.e. ex-cel file, for graphics .jpg). The following is a description of each ofthe main software components and libraries used in the ViNAR soft-ware.
• Leap Motion Sdk: Enables developers to interpret the data which isobtained from the leap motion controller.
• JfreeChart:JfreeChart: JFreeChart is Java library which helps developersto create various types of diagrams easily on Java swing components.
• JheatChart: JHeatChart is a minimalistic Java library for generatingheat map charts and export in various formats.
• Processing programming language: Will be explained in followingsection.
• CP5: Cp5 is a library for processing programming language whichenables the creation of simple GUI elements on the processing sketch.
• Minim: Minim is a library for the Processing programming languagewhich plays various audio formats for processing programs. ViNARuses the Minim library to provide sound feedback to the patient sincetheir visual field may be neglected. For instance, whenever the stimu-lated object hits the obstacle a warning audio is played using the Minimlibrary and ViNAR will give feedback to the patient.
4.2 Processing Programming LanguageProcessing is an programming language which provides an easier way towork with graphics for technical students [20]. Processing is built on topof the Java programming language therefore, it allows the use of all theJava features. In fact every Processing sketch is actually a subclass of thePApplet Java class which implements most of the Processing language’sfeatures. There are two main methods used to create a processing sketch.One of them is setup( ) block which runs once, and the draw( ) blockruns repeatedly like an infinite loop. setup( ) is generally used for anyinitialization. The draw( ) block is used to handle dynamic actions duringthe runtime such as animation [20]. The Processing Programming Lan-guage was chosen because it is easy to learn; allowing the programmer towork with many other devices. Moreover, Processing allow developers towork with three dimensional environments in addition to two dimensions.
4.3 Developing Gesture ModelsThe user has to complete the ViNAR test by simply moving the ball intotarget area while avoiding the obstacle barrier using the cursor controlledby the LMC (See Figure 7 ).
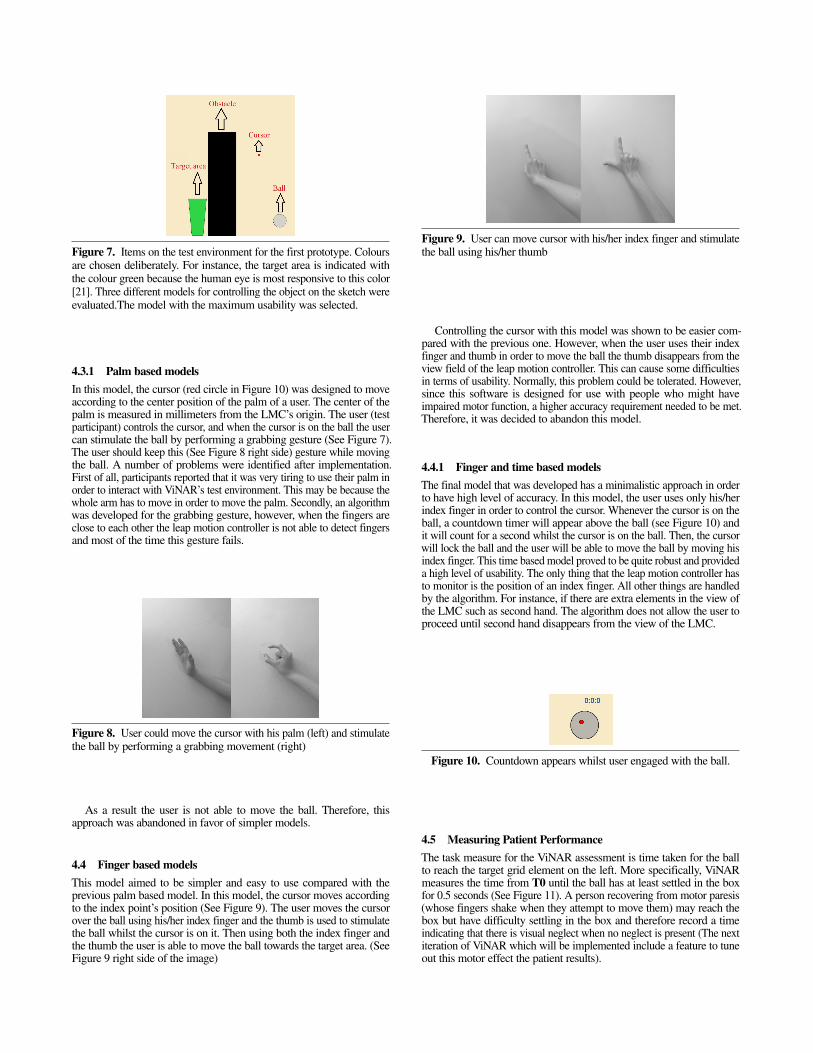
Figure 7. Items on the test environment for the first prototype. Coloursare chosen deliberately. For instance, the target area is indicated withthe colour green because the human eye is most responsive to this color[21]. Three different models for controlling the object on the sketch wereevaluated.The model with the maximum usability was selected.
4.3.1 Palm based modelsIn this model, the cursor (red circle in Figure 10) was designed to moveaccording to the center position of the palm of a user. The center of thepalm is measured in millimeters from the LMC’s origin. The user (testparticipant) controls the cursor, and when the cursor is on the ball the usercan stimulate the ball by performing a grabbing gesture (See Figure 7).The user should keep this (See Figure 8 right side) gesture while movingthe ball. A number of problems were identified after implementation.First of all, participants reported that it was very tiring to use their palm inorder to interact with ViNAR’s test environment. This may be because thewhole arm has to move in order to move the palm. Secondly, an algorithmwas developed for the grabbing gesture, however, when the fingers areclose to each other the leap motion controller is not able to detect fingersand most of the time this gesture fails.
Figure 8. User could move the cursor with his palm (left) and stimulatethe ball by performing a grabbing movement (right)
As a result the user is not able to move the ball. Therefore, thisapproach was abandoned in favor of simpler models.
4.4 Finger based modelsThis model aimed to be simpler and easy to use compared with theprevious palm based model. In this model, the cursor moves accordingto the index point’s position (See Figure 9). The user moves the cursorover the ball using his/her index finger and the thumb is used to stimulatethe ball whilst the cursor is on it. Then using both the index finger andthe thumb the user is able to move the ball towards the target area. (SeeFigure 9 right side of the image)
Figure 9. User can move cursor with his/her index finger and stimulatethe ball using his/her thumb
Controlling the cursor with this model was shown to be easier com-pared with the previous one. However, when the user uses their indexfinger and thumb in order to move the ball the thumb disappears from theview field of the leap motion controller. This can cause some difficultiesin terms of usability. Normally, this problem could be tolerated. However,since this software is designed for use with people who might haveimpaired motor function, a higher accuracy requirement needed to be met.Therefore, it was decided to abandon this model.
4.4.1 Finger and time based modelsThe final model that was developed has a minimalistic approach in orderto have high level of accuracy. In this model, the user uses only his/herindex finger in order to control the cursor. Whenever the cursor is on theball, a countdown timer will appear above the ball (see Figure 10) andit will count for a second whilst the cursor is on the ball. Then, the cursorwill lock the ball and the user will be able to move the ball by moving hisindex finger. This time based model proved to be quite robust and provideda high level of usability. The only thing that the leap motion controller hasto monitor is the position of an index finger. All other things are handledby the algorithm. For instance, if there are extra elements in the view ofthe LMC such as second hand. The algorithm does not allow the user toproceed until second hand disappears from the view of the LMC.
Figure 10. Countdown appears whilst user engaged with the ball.
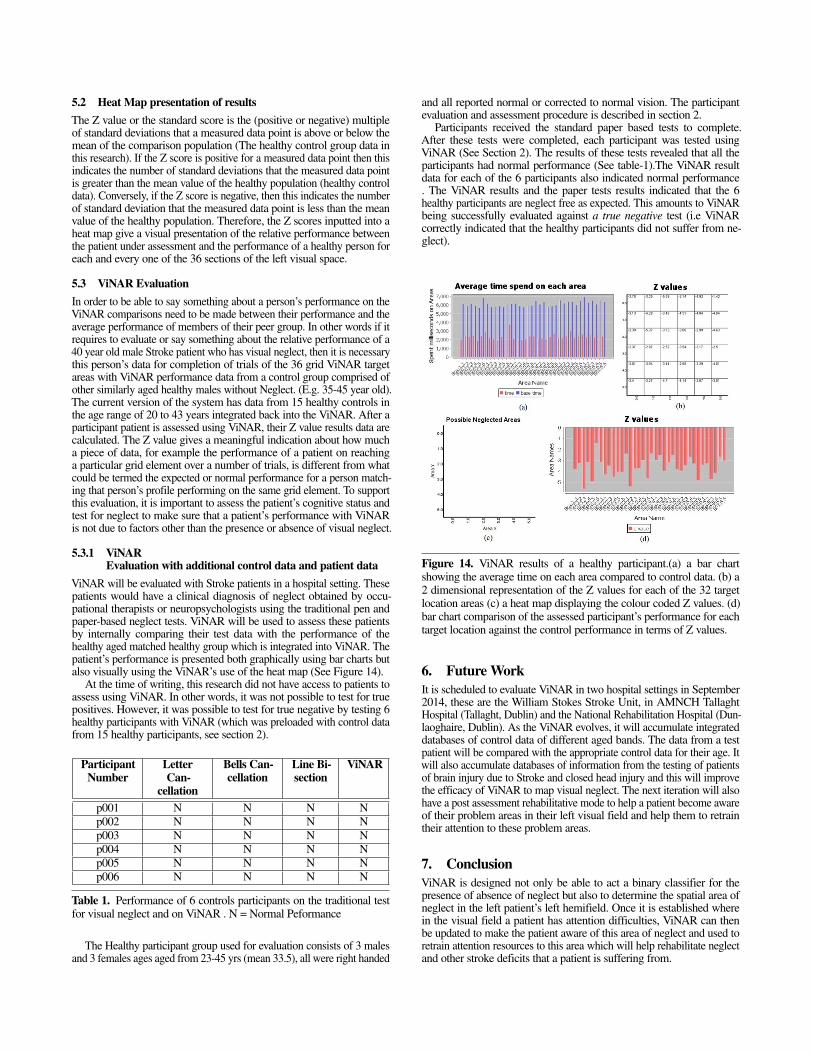
4.5 Measuring Patient PerformanceThe task measure for the ViNAR assessment is time taken for the ballto reach the target grid element on the left. More specifically, ViNARmeasures the time from T0 until the ball has at least settled in the boxfor 0.5 seconds (See Figure 11). A person recovering from motor paresis(whose fingers shake when they attempt to move them) may reach thebox but have difficulty settling in the box and therefore record a timeindicating that there is visual neglect when no neglect is present (The nextiteration of ViNAR which will be implemented include a feature to tuneout this motor effect the patient results).
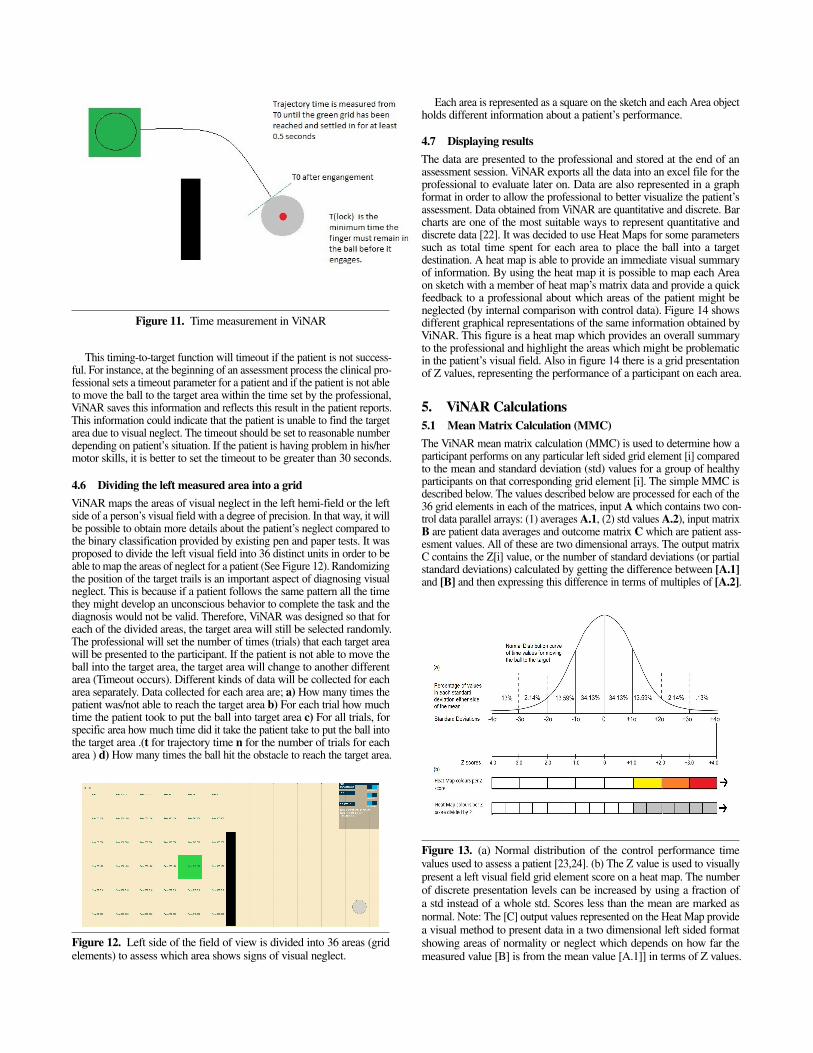
Figure 11. Time measurement in ViNAR
This timing-to-target function will timeout if the patient is not success-ful. For instance, at the beginning of an assessment process the clinical pro-fessional sets a timeout parameter for a patient and if the patient is not ableto move the ball to the target area within the time set by the professional,ViNAR saves this information and reflects this result in the patient reports.This information could indicate that the patient is unable to find the targetarea due to visual neglect. The timeout should be set to reasonable numberdepending on patient’s situation. If the patient is having problem in his/hermotor skills, it is better to set the timeout to be greater than 30 seconds.
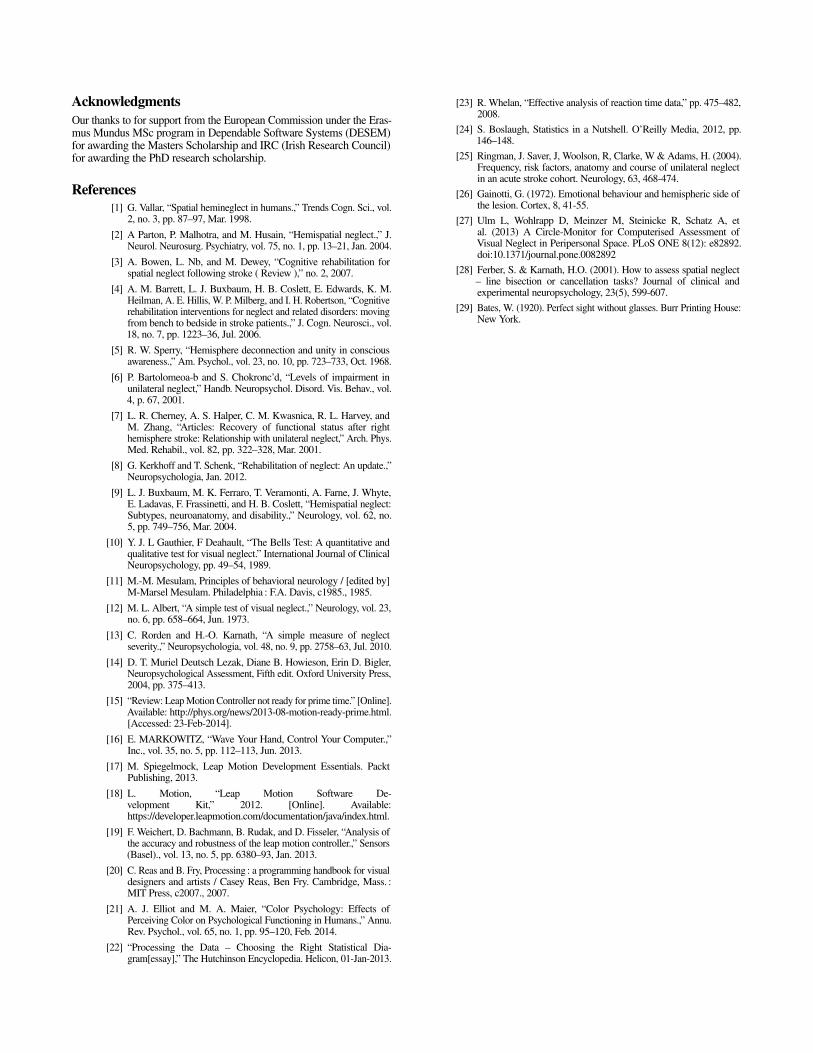
4.6 Dividing the left measured area into a gridViNAR maps the areas of visual neglect in the left hemi-field or the leftside of a person’s visual field with a degree of precision. In that way, it willbe possible to obtain more details about the patient’s neglect compared tothe binary classification provided by existing pen and paper tests. It wasproposed to divide the left visual field into 36 distinct units in order to beable to map the areas of neglect for a patient (See Figure 12). Randomizingthe position of the target trails is an important aspect of diagnosing visualneglect. This is because if a patient follows the same pattern all the timethey might develop an unconscious behavior to complete the task and thediagnosis would not be valid. Therefore, ViNAR was designed so that foreach of the divided areas, the target area will still be selected randomly.The professional will set the number of times (trials) that each target areawill be presented to the participant. If the patient is not able to move theball into the target area, the target area will change to another differentarea (Timeout occurs). Different kinds of data will be collected for eacharea separately. Data collected for each area are; a) How many times thepatient was/not able to reach the target area b) For each trial how muchtime the patient took to put the ball into target area c) For all trials, forspecific area how much time did it take the patient take to put the ball intothe target area .(t for trajectory time n for the number of trials for eacharea ) d) How many times the ball hit the obstacle to reach the target area.
Figure 12. Left side of the field of view is divided into 36 areas (gridelements) to assess which area shows signs of visual neglect.
Each area is represented as a square on the sketch and each Area objectholds different information about a patient’s performance.
4.7 Displaying resultsThe data are presented to the professional and stored at the end of anassessment session. ViNAR exports all the data into an excel file for theprofessional to evaluate later on. Data are also represented in a graphformat in order to allow the professional to better visualize the patient’sassessment. Data obtained from ViNAR are quantitative and discrete. Barcharts are one of the most suitable ways to represent quantitative anddiscrete data [22]. It was decided to use Heat Maps for some parameterssuch as total time spent for each area to place the ball into a targetdestination. A heat map is able to provide an immediate visual summaryof information. By using the heat map it is possible to map each Areaon sketch with a member of heat map’s matrix data and provide a quickfeedback to a professional about which areas of the patient might beneglected (by internal comparison with control data). Figure 14 showsdifferent graphical representations of the same information obtained byViNAR. This figure is a heat map which provides an overall summaryto the professional and highlight the areas which might be problematicin the patient’s visual field. Also in figure 14 there is a grid presentationof Z values, representing the performance of a participant on each area.
5. ViNAR Calculations5.1 Mean Matrix Calculation (MMC)The ViNAR mean matrix calculation (MMC) is used to determine how aparticipant performs on any particular left sided grid element [i] comparedto the mean and standard deviation (std) values for a group of healthyparticipants on that corresponding grid element [i]. The simple MMC isdescribed below. The values described below are processed for each of the36 grid elements in each of the matrices, input A which contains two con-trol data parallel arrays: (1) averages A.1, (2) std values A.2), input matrixB are patient data averages and outcome matrix C which are patient ass-esment values. All of these are two dimensional arrays. The output matrixC contains the Z[i] value, or the number of standard deviations (or partialstandard deviations) calculated by getting the difference between [A.1]and [B] and then expressing this difference in terms of multiples of [A.2].
Figure 13. (a) Normal distribution of the control performance timevalues used to assess a patient [23,24]. (b) The Z value is used to visuallypresent a left visual field grid element score on a heat map. The numberof discrete presentation levels can be increased by using a fraction ofa std instead of a whole std. Scores less than the mean are marked asnormal. Note: The [C] output values represented on the Heat Map providea visual method to present data in a two dimensional left sided formatshowing areas of normality or neglect which depends on how far themeasured value [B] is from the mean value [A.1]] in terms of Z values.
5.2 Heat Map presentation of resultsThe Z value or the standard score is the (positive or negative) multipleof standard deviations that a measured data point is above or below themean of the comparison population (The healthy control group data inthis research). If the Z score is positive for a measured data point then thisindicates the number of standard deviations that the measured data pointis greater than the mean value of the healthy population (healthy controldata). Conversely, if the Z score is negative, then this indicates the numberof standard deviation that the measured data point is less than the meanvalue of the healthy population. Therefore, the Z scores inputted into aheat map give a visual presentation of the relative performance betweenthe patient under assessment and the performance of a healthy person foreach and every one of the 36 sections of the left visual space.
5.3 ViNAR EvaluationIn order to be able to say something about a person’s performance on theViNAR comparisons need to be made between their performance and theaverage performance of members of their peer group. In other words if itrequires to evaluate or say something about the relative performance of a40 year old male Stroke patient who has visual neglect, then it is necessarythis person’s data for completion of trials of the 36 grid ViNAR targetareas with ViNAR performance data from a control group comprised ofother similarly aged healthy males without Neglect. (E.g. 35-45 year old).The current version of the system has data from 15 healthy controls inthe age range of 20 to 43 years integrated back into the ViNAR. After aparticipant patient is assessed using ViNAR, their Z value results data arecalculated. The Z value gives a meaningful indication about how mucha piece of data, for example the performance of a patient on reachinga particular grid element over a number of trials, is different from whatcould be termed the expected or normal performance for a person match-ing that person’s profile performing on the same grid element. To supportthis evaluation, it is important to assess the patient’s cognitive status andtest for neglect to make sure that a patient’s performance with ViNARis not due to factors other than the presence or absence of visual neglect.
5.3.1 ViNAREvaluation with additional control data and patient data
ViNAR will be evaluated with Stroke patients in a hospital setting. Thesepatients would have a clinical diagnosis of neglect obtained by occu-pational therapists or neuropsychologists using the traditional pen andpaper-based neglect tests. ViNAR will be used to assess these patientsby internally comparing their test data with the performance of thehealthy aged matched healthy group which is integrated into ViNAR. Thepatient’s performance is presented both graphically using bar charts butalso visually using the ViNAR’s use of the heat map (See Figure 14).
At the time of writing, this research did not have access to patients toassess using ViNAR. In other words, it was not possible to test for truepositives. However, it was possible to test for true negative by testing 6healthy participants with ViNAR (which was preloaded with control datafrom 15 healthy participants, see section 2).
ParticipantNumber
LetterCan-
cellation
Bells Can-cellation
Line Bi-section
ViNAR
p001 N N N Np002 N N N Np003 N N N Np004 N N N Np005 N N N Np006 N N N N
Table 1. Performance of 6 controls participants on the traditional testfor visual neglect and on ViNAR . N = Normal Peformance
The Healthy participant group used for evaluation consists of 3 malesand 3 females ages aged from 23-45 yrs (mean 33.5), all were right handed
and all reported normal or corrected to normal vision. The participantevaluation and assessment procedure is described in section 2.
Participants received the standard paper based tests to complete.After these tests were completed, each participant was tested usingViNAR (See Section 2). The results of these tests revealed that all theparticipants had normal performance (See table-1).The ViNAR resultdata for each of the 6 participants also indicated normal performance. The ViNAR results and the paper tests results indicated that the 6healthy participants are neglect free as expected. This amounts to ViNARbeing successfully evaluated against a true negative test (i.e ViNARcorrectly indicated that the healthy participants did not suffer from ne-glect).
Figure 14. ViNAR results of a healthy participant.(a) a bar chartshowing the average time on each area compared to control data. (b) a2 dimensional representation of the Z values for each of the 32 targetlocation areas (c) a heat map displaying the colour coded Z values. (d)bar chart comparison of the assessed participant’s performance for eachtarget location against the control performance in terms of Z values.
6. Future WorkIt is scheduled to evaluate ViNAR in two hospital settings in September2014, these are the William Stokes Stroke Unit, in AMNCH TallaghtHospital (Tallaght, Dublin) and the National Rehabilitation Hospital (Dun-laoghaire, Dublin). As the ViNAR evolves, it will accumulate integrateddatabases of control data of different aged bands. The data from a testpatient will be compared with the appropriate control data for their age. Itwill also accumulate databases of information from the testing of patientsof brain injury due to Stroke and closed head injury and this will improvethe efficacy of ViNAR to map visual neglect. The next iteration will alsohave a post assessment rehabilitative mode to help a patient become awareof their problem areas in their left visual field and help them to retraintheir attention to these problem areas.
7. ConclusionViNAR is designed not only be able to act a binary classifier for thepresence of absence of neglect but also to determine the spatial area ofneglect in the left patient’s left hemifield. Once it is established wherein the visual field a patient has attention difficulties, ViNAR can thenbe updated to make the patient aware of this area of neglect and used toretrain attention resources to this area which will help rehabilitate neglectand other stroke deficits that a patient is suffering from.
AcknowledgmentsOur thanks to for support from the European Commission under the Eras-mus Mundus MSc program in Dependable Software Systems (DESEM)for awarding the Masters Scholarship and IRC (Irish Research Council)for awarding the PhD research scholarship.
References[1] G. Vallar, “Spatial hemineglect in humans.,” Trends Cogn. Sci., vol.
2, no. 3, pp. 87–97, Mar. 1998.[2] A Parton, P. Malhotra, and M. Husain, “Hemispatial neglect.,” J.
Neurol. Neurosurg. Psychiatry, vol. 75, no. 1, pp. 13–21, Jan. 2004.[3] A. Bowen, L. Nb, and M. Dewey, “Cognitive rehabilitation for
spatial neglect following stroke ( Review ),” no. 2, 2007.[4] A. M. Barrett, L. J. Buxbaum, H. B. Coslett, E. Edwards, K. M.
Heilman, A. E. Hillis, W. P. Milberg, and I. H. Robertson, “Cognitiverehabilitation interventions for neglect and related disorders: movingfrom bench to bedside in stroke patients.,” J. Cogn. Neurosci., vol.18, no. 7, pp. 1223–36, Jul. 2006.
[5] R. W. Sperry, “Hemisphere deconnection and unity in consciousawareness.,” Am. Psychol., vol. 23, no. 10, pp. 723–733, Oct. 1968.
[6] P. Bartolomeoa-b and S. Chokronc’d, “Levels of impairment inunilateral neglect,” Handb. Neuropsychol. Disord. Vis. Behav., vol.4, p. 67, 2001.
[7] L. R. Cherney, A. S. Halper, C. M. Kwasnica, R. L. Harvey, andM. Zhang, “Articles: Recovery of functional status after righthemisphere stroke: Relationship with unilateral neglect,” Arch. Phys.Med. Rehabil., vol. 82, pp. 322–328, Mar. 2001.
[8] G. Kerkhoff and T. Schenk, “Rehabilitation of neglect: An update.,”Neuropsychologia, Jan. 2012.
[9] L. J. Buxbaum, M. K. Ferraro, T. Veramonti, A. Farne, J. Whyte,E. Ladavas, F. Frassinetti, and H. B. Coslett, “Hemispatial neglect:Subtypes, neuroanatomy, and disability.,” Neurology, vol. 62, no.5, pp. 749–756, Mar. 2004.
[10] Y. J. L Gauthier, F Deahault, “The Bells Test: A quantitative andqualitative test for visual neglect.” International Journal of ClinicalNeuropsychology, pp. 49–54, 1989.
[11] M.-M. Mesulam, Principles of behavioral neurology / [edited by]M-Marsel Mesulam. Philadelphia : F.A. Davis, c1985., 1985.
[12] M. L. Albert, “A simple test of visual neglect.,” Neurology, vol. 23,no. 6, pp. 658–664, Jun. 1973.
[13] C. Rorden and H.-O. Karnath, “A simple measure of neglectseverity.,” Neuropsychologia, vol. 48, no. 9, pp. 2758–63, Jul. 2010.
[14] D. T. Muriel Deutsch Lezak, Diane B. Howieson, Erin D. Bigler,Neuropsychological Assessment, Fifth edit. Oxford University Press,2004, pp. 375–413.
[15] “Review: Leap Motion Controller not ready for prime time.” [Online].Available: http://phys.org/news/2013-08-motion-ready-prime.html.[Accessed: 23-Feb-2014].
[16] E. MARKOWITZ, “Wave Your Hand, Control Your Computer.,”Inc., vol. 35, no. 5, pp. 112–113, Jun. 2013.
[17] M. Spiegelmock, Leap Motion Development Essentials. PacktPublishing, 2013.
[18] L. Motion, “Leap Motion Software De-velopment Kit,” 2012. [Online]. Available:https://developer.leapmotion.com/documentation/java/index.html.
[19] F. Weichert, D. Bachmann, B. Rudak, and D. Fisseler, “Analysis ofthe accuracy and robustness of the leap motion controller.,” Sensors(Basel)., vol. 13, no. 5, pp. 6380–93, Jan. 2013.
[20] C. Reas and B. Fry, Processing : a programming handbook for visualdesigners and artists / Casey Reas, Ben Fry. Cambridge, Mass. :MIT Press, c2007., 2007.
[21] A. J. Elliot and M. A. Maier, “Color Psychology: Effects ofPerceiving Color on Psychological Functioning in Humans.,” Annu.Rev. Psychol., vol. 65, no. 1, pp. 95–120, Feb. 2014.
[22] “Processing the Data – Choosing the Right Statistical Dia-gram[essay],” The Hutchinson Encyclopedia. Helicon, 01-Jan-2013.
[23] R. Whelan, “Effective analysis of reaction time data,” pp. 475–482,2008.
[24] S. Boslaugh, Statistics in a Nutshell. O’Reilly Media, 2012, pp.146–148.
[25] Ringman, J. Saver, J, Woolson, R, Clarke, W & Adams, H. (2004).Frequency, risk factors, anatomy and course of unilateral neglectin an acute stroke cohort. Neurology, 63, 468-474.
[26] Gainotti, G. (1972). Emotional behaviour and hemispheric side ofthe lesion. Cortex, 8, 41-55.
[27] Ulm L, Wohlrapp D, Meinzer M, Steinicke R, Schatz A, etal. (2013) A Circle-Monitor for Computerised Assessment ofVisual Neglect in Peripersonal Space. PLoS ONE 8(12): e82892.doi:10.1371/journal.pone.0082892
[28] Ferber, S. & Karnath, H.O. (2001). How to assess spatial neglect– line bisection or cancellation tasks? Journal of clinical andexperimental neuropsychology, 23(5), 599-607.
[29] Bates, W. (1920). Perfect sight without glasses. Burr Printing House:New York.
Related Documents