Introducing the JPMorgan Commodity Curve Index (JPMCCI) Capturing investment opportunities across commodity futures curves Global Commodity Research J.P. Morgan Securities Ltd. London, November 9, 2007 Jennie Byun AC (44-20) 7777-0070 [email protected] Gerald Tan (44-20) 7777-3672 [email protected] John Normand (44-20) 7325-5222 [email protected] Katherine Spector (1-212) 834-2031 [email protected] www.morganmarkets.com The certifying analyst is indicated by an AC . See page 60 for analyst certification and important legal and regulatory disclosures. Contents Why a New Commodity Index 2 Methodology: Single Commodity Curve Indices 3 JPMCCI Single Commodity Performance 7 Methodology: JPMCCI Aggregate Index 8 JPMCCI Aggregate Performance 9 JPMCCI Diversification Benefits 9 Sourcing JPMCCI 12 Appendix 17 • The JPMorgan Commodity Curve Index (JPMCCI) is a new index family offering a diversified and representative approach to passive commodity investing. • Unlike traditional indices which focus exposure at a single maturity, JPMCCI holds exposure along the entire futures curve in proportion to the open interest of each tenor. • JPMCCI adopts a neutral and representative approach to index construc- tion, analogous to a bond market index which invests in line with market outstandings. • JPMCCI aggregate, sector and single commodity indices are available in excess and total return form. JPMCCI includes 33 USD-denominated exchange-based single commodities, and has a much broader coverage of commodities than traditional indices (24 commodities in S&P GSCI and 19 in DJ-AIGCI). Additional commodities include NYMEX platinum, NYMEX palladium, CBOT soybean meal, NYBOT orange juice, LIFFE robusta coffee, LIFFE white sugar and MGE spring wheat. • JPMCCI is an aggregate market index which weights individual com- modities by their open interest. This implies an allocation of approximately 46% energy, 25% industrial metals, 8% precious metals, 19% agriculture and 3% livestock (as of September 28, 2007). Using open interest to determine allocation allows the index to reflect the financial deepening and broadening of these markets. It also yields sector weights which are more balanced than production-weighted indices (S&P GSCI), while avoiding arbitrary sector caps (DJ-AIGCI). • JPMCCI has generated average annual total returns of 9.4% on a volatility of 12.8%. The resulting Sharpe ratio of 0.39 compares to 0.11 on the S&P GSCI and 0.29 on the DJ-AIGCI (Jan 91 - Sep 07). • JPMCCI reduces the drag from negative roll yield in contangoed markets, as well as overall roll return volatility. Roll return on the JPMCCI has averaged -0.5% per annum since 1991, compared to -3.3% and -4.1% on S&P GSCI and DJ-AIGCI, respectively. • JPMorgan also provides the capability to use the JPMCCI single commodity subindices as building blocks to create customized indices tailored to investor objectives. Chart 1: Index performance excess return Source: JPMorgan and Index Sponsors We thank Eynour Boutia, Theodoros Chiotis, Amine Choukir, Jean- Baptiste Germain, Lewis Hagedorn, Magnus Hyll, Michael Jansen, Sara Lumbreras, Francois Mantion, Sauli Nathan, Tim Owens, Nicolas Robin, Santiago Tavolaro, and Alvin Ying for their contribution. 50 100 150 200 250 Dec-90 Dec-94 Dec-98 Dec-02 Dec-06 JPMCCI S&P GSCI DJ-AIGCI 50 100 150 200 250 Dec-90 Dec-94 Dec-98 Dec-02 Dec-06 JPMCCI S&P GSCI DJ-AIGCI

Welcome message from author
This document is posted to help you gain knowledge. Please leave a comment to let me know what you think about it! Share it to your friends and learn new things together.
Transcript

Introducing the JPMorgan Commodity Curve Index(JPMCCI)Capturing investment opportunities across commodity futures curves
Global Commodity ResearchJ.P. Morgan Securities Ltd.London, November 9, 2007
Jennie ByunAC
(44-20) [email protected]
Gerald Tan(44-20) [email protected]
John Normand(44-20) [email protected]
Katherine Spector(1-212) [email protected]
www.morganmarkets.comThe certifying analyst is indicated by an AC. See page 60 for analystcertification and important legal and regulatory disclosures.
Contents
Why a New Commodity Index 2Methodology: Single Commodity Curve Indices 3JPMCCI Single Commodity Performance 7Methodology: JPMCCI Aggregate Index 8JPMCCI Aggregate Performance 9JPMCCI Diversification Benefits 9Sourcing JPMCCI 12Appendix 17
• The JPMorgan Commodity Curve Index (JPMCCI) is a new index familyoffering a diversified and representative approach to passive commodityinvesting.
• Unlike traditional indices which focus exposure at a single maturity,JPMCCI holds exposure along the entire futures curve in proportion tothe open interest of each tenor.
• JPMCCI adopts a neutral and representative approach to index construc-tion, analogous to a bond market index which invests in line with marketoutstandings.
• JPMCCI aggregate, sector and single commodity indices are available inexcess and total return form. JPMCCI includes 33 USD-denominatedexchange-based single commodities, and has a much broader coverage ofcommodities than traditional indices (24 commodities in S&P GSCI and19 in DJ-AIGCI). Additional commodities include NYMEX platinum,NYMEX palladium, CBOT soybean meal, NYBOT orange juice, LIFFErobusta coffee, LIFFE white sugar and MGE spring wheat.
• JPMCCI is an aggregate market index which weights individual com-modities by their open interest. This implies an allocation ofapproximately 46% energy, 25% industrial metals, 8% preciousmetals, 19% agriculture and 3% livestock (as of September 28, 2007).Using open interest to determine allocation allows the index to reflect thefinancial deepening and broadening of these markets. It also yieldssector weights which are more balanced than production-weightedindices (S&P GSCI), while avoiding arbitrary sector caps (DJ-AIGCI).
• JPMCCI has generated average annual total returns of 9.4% on avolatility of 12.8%. The resulting Sharpe ratio of 0.39 compares to 0.11on the S&P GSCI and 0.29 on the DJ-AIGCI (Jan 91 - Sep 07).
• JPMCCI reduces the drag from negative roll yield in contangoedmarkets, as well as overall roll return volatility. Roll return on theJPMCCI has averaged -0.5% per annum since 1991, compared to -3.3%and -4.1% on S&P GSCI and DJ-AIGCI, respectively.
• JPMorgan also provides the capability to use the JPMCCI singlecommodity subindices as building blocks to create customized indicestailored to investor objectives.
Chart 1: Index performanceexcess return
Source: JPMorgan and Index Sponsors
We thank Eynour Boutia, Theodoros Chiotis, Amine Choukir, Jean-Baptiste Germain, Lewis Hagedorn, Magnus Hyll, Michael Jansen, SaraLumbreras, Francois Mantion, Sauli Nathan, Tim Owens, Nicolas Robin,Santiago Tavolaro, and Alvin Ying for their contribution.
50
100
150
200
250
Dec-90 Dec-94 Dec-98 Dec-02 Dec-06
JPMCCIS&P GSCIDJ-AIGCI
50
100
150
200
250
Dec-90 Dec-94 Dec-98 Dec-02 Dec-06
JPMCCIS&P GSCIDJ-AIGCI

2
Global Commodity ResearchIntroducing the JPMorgan Commodity Curve IndexNovember 9, 2007
Why a New Commodities IndexThe growth of commodity index investment over the pastfive years has been well-documented, as has the inadequacyof traditional index products that limit exposure to the frontend of the futures curve, incurring significant negative carrysince 2005. Attempts to address the roll yield problemtypically have centered on better execution (changing rolldates), buying deferred contracts (to achieve better rollreturns), or optimizing exposure along the curve. While theseapproaches have, in some cases, outperformed traditionalbenchmarks, many run the risk of being over-engineered,and stray increasingly from the concept of a market-neutralbenchmark. Indeed, many are closer to active strategies thanpassive benchmarks.
The JPMorgan Commodity Curve Index (JPMCCI) attemptsto fill this void in passive indexation by borrowing theliquidity and maturity concepts commonly used inJPMorgan’s family of fixed income indices. The JPMCCIadopts a simple, curve-neutral approach, holding exposurealong the commodity futures curve according to the openinterest of each tenor. The JPMCCI also uses open interestto determine the inclusion and relative weights of theindividual commodities, to arrive at a total market benchmarkwhose constituents will grow as the futures market liquiditydeepens and lengthens in coming years.
The JPMCCI offers several advantages over traditionalpassive and semi-active products, including:
• Curve-neutral approach. JPMCCI includes open interest-weighted baskets of commodity contracts across thefutures curves to capture all available investmentopportunities in each market. The chief innovation is thusa curve-neutral approach to gaining commodity exposure.This method reduces the disadvantages of traditional,passive products which concentrate exposure in a singletenor (either front contract or a single deferred contract),or of engineered strategies which choose an optimal
exposure to different parts of the curve over time. Thisadaptability is particularly useful given that investmentopportunities at the long-end are increasing. As chart 2highlights, the share of the investable commodity uni-verse captured by JPMCCI is much higher than bytraditional indices.
• Representativeness. JPMCCI is a representative indexreflecting the available market opportunities, as measuredby open interest. This is analogous to face amountoutstanding in bond markets or shares outstanding inequity markets. Monthly compositions for each commod-ity index are guided by the historical distribution of openinterest of commodity contracts across the futures curvein the same calendar month of the preceding three years,in order to capture shifts in liquidity along the curve.
• Broader coverage. The JPMCCI includes thirty threeexchange commodities, a wider range of products thantraditional indices. Additional commodities includeNYMEX platinum, NYMEX palladium, CBOT soybeanmeal, NYBOT orange juice, LIFFE robusta coffee, LIFFEwhite sugar and MGE spring wheat.
• Lower volatility and higher risk-adjusted returns.JPMCCI avoids the front-end bias associated withtraditional commodity indices and offers substantialdiversification benefits. By investing in multiple contractsper commodity, JPMCCI reduces return volatility andincreases risk-adjusted returns for 24 out of the 25 com-modities included in S&P GSCI and DJ-AIGCI. Moreover,a JPMCCI investment portfolio benefits from greater inter-month composition stability. Although positions may beadjusted monthly, many contracts are held for multiplemonths since deferred liquidity in many commoditiestends to be concentrated in certain months each year. Thisdiffers from traditional indices which may liquidate theircurrent holdings entirely when rolling from one contract toanother.
Chart 2: % of total market open interest captured by investment into JPMCCI vs S&P GSCI commodities
Source: JPMorgan, 2006 average
J.P. Morgan Securities Ltd.Jennie ByunAC (44-20) [email protected]
John Normand (44-20) [email protected]
0%20%40%60%80%
100%
LIFF
E W
hite
Suga
r
NYBO
T Co
coa
NYBO
T Su
gar
NYBO
T Co
tton
NYBO
T Co
ffee
LIFF
E Ro
bust
a Co
ffee
CBOT
Soy
bean
Mea
l
CBOT
Soy
bean
Oil
KCBO
T W
inter
Whe
at
MGE
Spr
ing W
heat
CBOT
Cor
n
CBOT
Soy
bean
CME
Live
Cattl
e
CBOT
Whe
at
NYM
EX P
latinu
m
CME
Lean
Hog
s
NYBO
T Or
ange
Juic
e
NYM
EX P
allad
ium
COM
EX S
ilver
COM
EX G
old
COM
EX C
oppe
r
NYM
EX H
eatin
g Oi
l
NYM
EX G
asoli
ne
NYM
EX C
rude
Oil
CME
Feed
er C
attle
ICE
Gas
Oil
LME
Lead
ICE
Bren
t Cru
de
LME
Zinc
NYM
EX N
atur
al Ga
s
LME
Nick
el
LME
Copp
er
LME
Alum
inium
JPMCCI S&P GSCI
3
Global Commodity ResearchIntroducing the JPMorgan Commodity Curve IndexNovember 9, 2007
0
2
4
6
8
10
12
89 91 93 95 97 99 01 03 05 07
WTI Crude Oil open interest w eighted tenor
S&P GSCI Crude Oil ex posure tenor
Methodology:Single Commodity Curve Indices
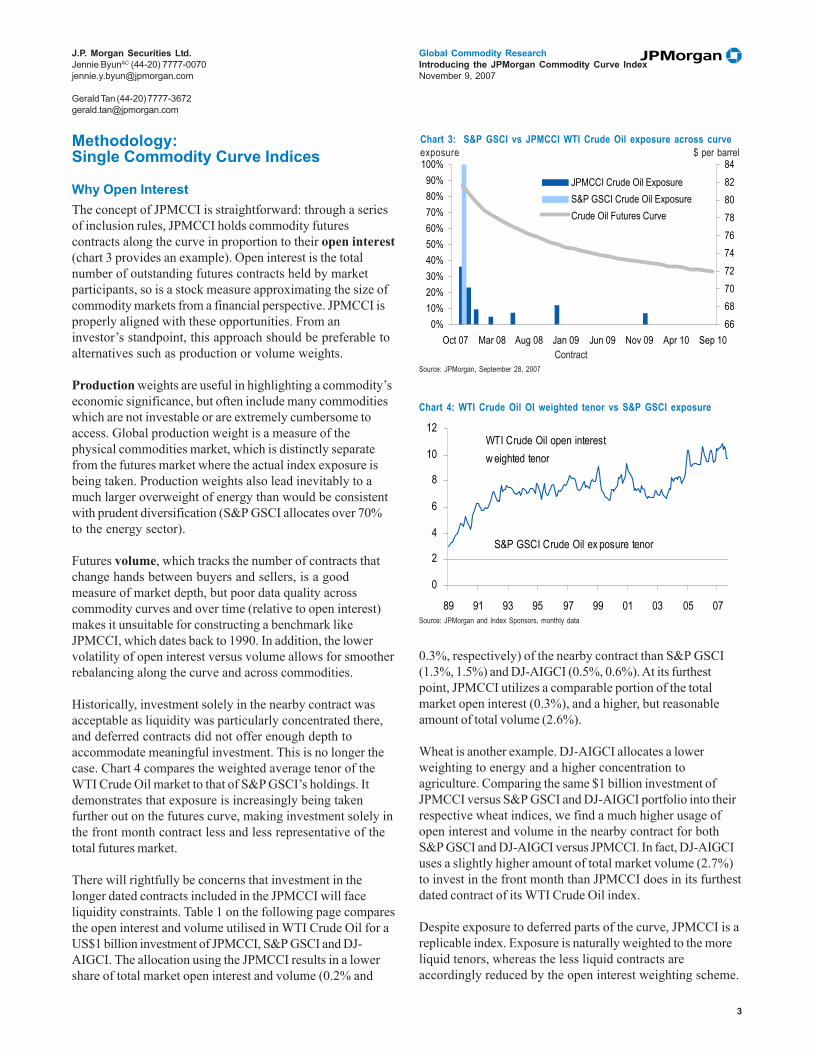
Why Open InterestThe concept of JPMCCI is straightforward: through a seriesof inclusion rules, JPMCCI holds commodity futurescontracts along the curve in proportion to their open interest(chart 3 provides an example). Open interest is the totalnumber of outstanding futures contracts held by marketparticipants, so is a stock measure approximating the size ofcommodity markets from a financial perspective. JPMCCI isproperly aligned with these opportunities. From aninvestor’s standpoint, this approach should be preferable toalternatives such as production or volume weights.
Production weights are useful in highlighting a commodity’seconomic significance, but often include many commoditieswhich are not investable or are extremely cumbersome toaccess. Global production weight is a measure of thephysical commodities market, which is distinctly separatefrom the futures market where the actual index exposure isbeing taken. Production weights also lead inevitably to amuch larger overweight of energy than would be consistentwith prudent diversification (S&P GSCI allocates over 70%to the energy sector).
Futures volume, which tracks the number of contracts thatchange hands between buyers and sellers, is a goodmeasure of market depth, but poor data quality acrosscommodity curves and over time (relative to open interest)makes it unsuitable for constructing a benchmark likeJPMCCI, which dates back to 1990. In addition, the lowervolatility of open interest versus volume allows for smootherrebalancing along the curve and across commodities.
Historically, investment solely in the nearby contract wasacceptable as liquidity was particularly concentrated there,and deferred contracts did not offer enough depth toaccommodate meaningful investment. This is no longer thecase. Chart 4 compares the weighted average tenor of theWTI Crude Oil market to that of S&P GSCI’s holdings. Itdemonstrates that exposure is increasingly being takenfurther out on the futures curve, making investment solely inthe front month contract less and less representative of thetotal futures market.
There will rightfully be concerns that investment in thelonger dated contracts included in the JPMCCI will faceliquidity constraints. Table 1 on the following page comparesthe open interest and volume utilised in WTI Crude Oil for aUS$1 billion investment of JPMCCI, S&P GSCI and DJ-AIGCI. The allocation using the JPMCCI results in a lowershare of total market open interest and volume (0.2% and
Chart 3: S&P GSCI vs JPMCCI WTI Crude Oil exposure across curveexposure $ per barrel
Source: JPMorgan, September 28, 2007
J.P. Morgan Securities Ltd.Jennie ByunAC (44-20) [email protected]
Gerald Tan (44-20) [email protected]
Contract
Chart 4: WTI Crude Oil OI weighted tenor vs S&P GSCI exposure
Source: JPMorgan and Index Sponsors, monthly data
0.3%, respectively) of the nearby contract than S&P GSCI(1.3%, 1.5%) and DJ-AIGCI (0.5%, 0.6%). At its furthestpoint, JPMCCI utilizes a comparable portion of the totalmarket open interest (0.3%), and a higher, but reasonableamount of total volume (2.6%).
Wheat is another example. DJ-AIGCI allocates a lowerweighting to energy and a higher concentration toagriculture. Comparing the same $1 billion investment ofJPMCCI versus S&P GSCI and DJ-AIGCI portfolio into theirrespective wheat indices, we find a much higher usage ofopen interest and volume in the nearby contract for bothS&P GSCI and DJ-AIGCI versus JPMCCI. In fact, DJ-AIGCIuses a slightly higher amount of total market volume (2.7%)to invest in the front month than JPMCCI does in its furthestdated contract of its WTI Crude Oil index.
Despite exposure to deferred parts of the curve, JPMCCI is areplicable index. Exposure is naturally weighted to the moreliquid tenors, whereas the less liquid contracts areaccordingly reduced by the open interest weighting scheme.
0%10%20%30%40%50%60%70%80%90%
100%
Oct 07 Mar 08 Aug 08 Jan 09 Jun 09 Nov 09 Apr 10 Sep 1066687072747678808284
JPMCCI Crude Oil ExposureS&P GSCI Crude Oil ExposureCrude Oil Futures Curve

4
Global Commodity ResearchIntroducing the JPMorgan Commodity Curve IndexNovember 9, 2007
Determining weights along the futures curveThe JPMCCI single commodity indices include multiplecontracts with different expirations of the same commodity.When deriving the composition of a JPMCCI index for aparticular month, the selection of contracts and assignmentof weights ideally should reflect the distribution of openinterest along the futures curve for that month. However,since it is not possible to know this distribution ex-ante, thecomposition is based on the historical distribution of openinterest. Specifically, we derive the composition for aparticular month by averaging the distribution of openinterest in the same calendar month of the previous threeyears, in order to capture both structural and cyclical shiftsin liquidity along the curve. Three years’ history was chosen
as a time span long enough to filter out any short-termanomalies, but short enough to maintain fluidity and reflectchanging market dynamics.
For example, to construct the composition for the month ofJanuary 2007, we average the distribution of open interest ofcontracts along the curve in January 2006, January 2005 andJanuary 2004. The following is the process of constructingthe WTI Crude Oil composition for January 2007.
1. Calculate distribution of OI for each of the precedingthree years. The distribution of open interest for the samecalendar month for each of the preceding three years(January 2004, January 2005 and January 2006) are calcu-lated across the entire futures curve. As Table 2 illustrates,
Table 2: Calculating the distribution of open interest in the preceding three years
Source: JPMorgan
J.P. Morgan Securities Ltd.Jennie ByunAC (44-20) [email protected]
Gerald Tan (44-20) [email protected]
Table 3: Preliminary 2007 composition
Source: JPMorgan
↓ ↓ ↓ ↓ ↓ ↓ ↓ ↓ ↓ ↓ ↓ ↓ ↓ ↓ ↓ ↓ ↓ ↓ ↓ ↓ ↓ ↓ ↓ ↓ ↓ ↓ ↓ ↓ ↓ ↓ ↓ ↓ ↓ ↓
January 2004
Contract
Feb-
04
Mar-0
4
Apr-0
4Ma
y-04
Jun-
04Ju
l-04
Aug-
04Se
p-04
Oct-0
4No
v-04
Dec-0
4Ja
n-05
Feb-
05Ma
r-05
Apr-0
5Ma
y-05
Jun-
05Ju
l-05
Aug-
05Se
p-05
Oct-0
5No
v-05
Dec-0
5Ja
n-06
Feb-
06Ma
r-06
Apr-0
6Ma
y-06
Jun-
06De
c-06
Dec-0
7De
c-08
Dec-0
9De
c-10
Distribution of OI in % 9.6 27.8 9.5 5.2 6.0 4.4 2.5 3.9 2.8 2.0 7.5 2.3 0.8 0.7 0.4 0.3 1.4 0.5 0.3 0.4 0.2 0.2 3.5 0.3 0.1 0.0 0.0 0.0 0.9 2.4 1.4 1.1 0.8 0.7January 2005
Contract
Feb-
05
Mar
-05
Apr-0
5M
ay-0
5Ju
n-05
Jul-0
5Au
g-05
Sep-
05Oc
t-05
Nov-0
5De
c-05
Jan-
06Fe
b-06
Mar
-06
Apr-0
6M
ay-0
6Ju
n-06
Jul-0
6Au
g-06
Sep-
06Oc
t-06
Nov-0
6De
c-06
Jan-
07Fe
b-07
Mar
-07
Apr-0
7M
ay-0
7Ju
n-07
Dec-0
7De
c-08
Dec-0
9De
c-10
Dec-1
1
Distribution of OI in % 9.2 24.9 8.9 4.2 5.4 3.1 1.7 2.1 1.4 2.1 8.1 1.4 0.7 1.3 0.7 0.4 3.5 0.4 0.2 0.5 0.2 0.2 5.8 0.2 0.2 0.1 0.0 0.0 1.6 3.0 3.1 2.4 2.6 0.3January 2006
Contract
Feb-
06
Mar
-06
Apr-0
6M
ay-0
6Ju
n-06
Jul-0
6Au
g-06
Sep-
06Oc
t-06
Nov-0
6De
c-06
Jan-
07Fe
b-07
Mar
-07
Apr-0
7M
ay-0
7Ju
n-07
Jul-0
7Au
g-07
Sep-
07Oc
t-07
Nov-0
7De
c-07
Jan-
08Fe
b-08
Mar
-08
Apr-0
8M
ay-0
8Ju
n-08
Dec-0
8De
c-09
Dec-1
0De
c-11
Dec-1
2
Distribution of OI in % 9.4 27.1 9.2 4.8 6.8 2.0 1.5 2.4 1.0 1.5 6.8 1.7 0.5 0.9 0.6 0.3 2.5 0.3 0.3 0.4 0.3 0.3 6.3 0.2 0.2 0.3 0.1 0.1 1.1 3.7 2.2 3.1 1.4 0.5
Table 1: Open interest and volume utilized to invest $1 billion in JPMCCI, S&P GSCI and DJ-AIGCI WTI and Wheat indices (Sept 28, 2007)
Source: JPMorgan
Contract $ per barrelOpen
Interest VolumeDollar
weightsNo of
contracts % of OI % of volume % of OI % of volume % of OI % of volumeNov 2007 81.66 340,915 294,397 37.2% 824 0.2% 0.3% 1.3% 1.5% 0.5% 0.6%Dec 2007 80.48 231,590 141,522 23.4% 526 0.2% 0.4% - - - -Jan 2008 79.58 87,700 41,186 9.5% 217 0.2% 0.5% - - - -Mar 2008 78.31 45,488 5,382 4.8% 111 0.2% 2.1% - - - -Jun 2008 76.95 54,066 5,983 7.1% 167 0.3% 2.8% - - - -Dec 2008 74.98 156,568 12,406 11.4% 274 0.2% 2.2% - - - -Dec 2009 72.94 57,139 6,186 6.5% 162 0.3% 2.6% - - - -
Contract $ per bushelOpen
Interest VolumeDollar
weightsNo of
contracts % of OI % of volume % of OI % of volume % of OI % of volumeDec 2007 9.39 235,392 60,077 78.6% 510 0.2% 0.8% 0.4% 1.7% 0.7% 2.7%Mar 2008 9.47 57,069 16,253 13.9% 90 0.2% 0.6% - - - -Jul 2008 6.81 62,622 6,116 7.5% 67 0.1% 1.1% - - - -
Crude Oil futures S&P GSCI investment DJ-AIGCI investmentJPMCCI investment
Wheat futures JPMCCI investment S&P GSCI investment DJ-AIGCI investment
3 years average, % 9.4 26.6 9.2 4.7 6.1 3.2 1.9 2.8 1.7 1.9 7.5 1.8 0.7 1.0 0.6 0.3 2.5 0.4 0.3 0.5 0.3 0.2 5.2 0.3 0.2 0.1 0.0 0.0 1.2 3.0 2.2 2.2 1.6 0.5
Assigned to contract
Feb-
07
Mar-0
7
Apr-0
7Ma
y-07
Jun-
07
Jul-0
7
Aug-
07Se
p-07
Oct-0
7
Nov-0
7
Dec-0
7Ja
n-08
Feb-
08
Mar-0
8
Apr-0
8Ma
y-08
Jun-
08
Jul-0
8
Aug-
08Se
p-08
Oct-0
8
Nov-0
8
Dec-0
8Ja
n-09
Feb-
09
Mar-0
9
Apr-0
9Ma
y-09
Jun-
09
Dec-0
9
Dec-1
0De
c-11
Dec-1
2
Dec-1
3
5
Global Commodity ResearchIntroducing the JPMorgan Commodity Curve IndexNovember 9, 2007
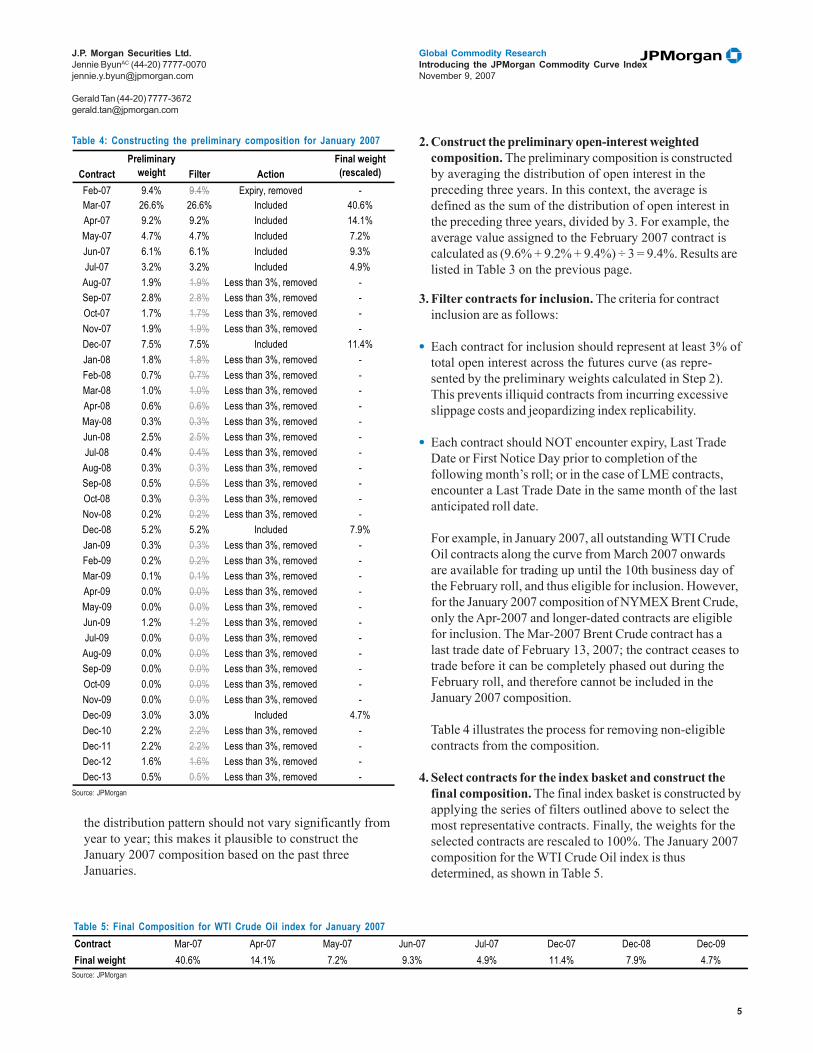
the distribution pattern should not vary significantly fromyear to year; this makes it plausible to construct theJanuary 2007 composition based on the past threeJanuaries.
2. Construct the preliminary open-interest weightedcomposition. The preliminary composition is constructedby averaging the distribution of open interest in thepreceding three years. In this context, the average isdefined as the sum of the distribution of open interest inthe preceding three years, divided by 3. For example, theaverage value assigned to the February 2007 contract iscalculated as (9.6% + 9.2% + 9.4%) ÷ 3 = 9.4%. Results arelisted in Table 3 on the previous page.
3. Filter contracts for inclusion. The criteria for contractinclusion are as follows:
• Each contract for inclusion should represent at least 3% oftotal open interest across the futures curve (as repre-sented by the preliminary weights calculated in Step 2).This prevents illiquid contracts from incurring excessiveslippage costs and jeopardizing index replicability.
• Each contract should NOT encounter expiry, Last TradeDate or First Notice Day prior to completion of thefollowing month’s roll; or in the case of LME contracts,encounter a Last Trade Date in the same month of the lastanticipated roll date.
For example, in January 2007, all outstanding WTI CrudeOil contracts along the curve from March 2007 onwardsare available for trading up until the 10th business day ofthe February roll, and thus eligible for inclusion. However,for the January 2007 composition of NYMEX Brent Crude,only the Apr-2007 and longer-dated contracts are eligiblefor inclusion. The Mar-2007 Brent Crude contract has alast trade date of February 13, 2007; the contract ceases totrade before it can be completely phased out during theFebruary roll, and therefore cannot be included in theJanuary 2007 composition.
Table 4 illustrates the process for removing non-eligiblecontracts from the composition.
4. Select contracts for the index basket and construct thefinal composition. The final index basket is constructed byapplying the series of filters outlined above to select themost representative contracts. Finally, the weights for theselected contracts are rescaled to 100%. The January 2007composition for the WTI Crude Oil index is thusdetermined, as shown in Table 5.
Table 4: Constructing the preliminary composition for January 2007
Source: JPMorgan
J.P. Morgan Securities Ltd.Jennie ByunAC (44-20) [email protected]
Gerald Tan (44-20) [email protected]
Table 5: Final Composition for WTI Crude Oil index for January 2007
Source: JPMorgan
ContractPreliminary
weight Filter ActionFinal weight(rescaled)
Feb-07 9.4% 9.4% Expiry, removed -Mar-07 26.6% 26.6% Included 40.6%Apr-07 9.2% 9.2% Included 14.1%May-07 4.7% 4.7% Included 7.2%Jun-07 6.1% 6.1% Included 9.3%Jul-07 3.2% 3.2% Included 4.9%Aug-07 1.9% 1.9% Less than 3%, removed -Sep-07 2.8% 2.8% Less than 3%, removed -Oct-07 1.7% 1.7% Less than 3%, removed -Nov-07 1.9% 1.9% Less than 3%, removed -Dec-07 7.5% 7.5% Included 11.4%Jan-08 1.8% 1.8% Less than 3%, removed -Feb-08 0.7% 0.7% Less than 3%, removed -Mar-08 1.0% 1.0% Less than 3%, removed -Apr-08 0.6% 0.6% Less than 3%, removed -May-08 0.3% 0.3% Less than 3%, removed -Jun-08 2.5% 2.5% Less than 3%, removed -Jul-08 0.4% 0.4% Less than 3%, removed -Aug-08 0.3% 0.3% Less than 3%, removed -Sep-08 0.5% 0.5% Less than 3%, removed -Oct-08 0.3% 0.3% Less than 3%, removed -Nov-08 0.2% 0.2% Less than 3%, removed -Dec-08 5.2% 5.2% Included 7.9%Jan-09 0.3% 0.3% Less than 3%, removed -Feb-09 0.2% 0.2% Less than 3%, removed -Mar-09 0.1% 0.1% Less than 3%, removed -Apr-09 0.0% 0.0% Less than 3%, removed -May-09 0.0% 0.0% Less than 3%, removed -Jun-09 1.2% 1.2% Less than 3%, removed -Jul-09 0.0% 0.0% Less than 3%, removed -Aug-09 0.0% 0.0% Less than 3%, removed -Sep-09 0.0% 0.0% Less than 3%, removed -Oct-09 0.0% 0.0% Less than 3%, removed -Nov-09 0.0% 0.0% Less than 3%, removed -Dec-09 3.0% 3.0% Included 4.7%Dec-10 2.2% 2.2% Less than 3%, removed -Dec-11 2.2% 2.2% Less than 3%, removed -Dec-12 1.6% 1.6% Less than 3%, removed -Dec-13 0.5% 0.5% Less than 3%, removed -
Contract Mar-07 Apr-07 May-07 Jun-07 Jul-07 Dec-07 Dec-08 Dec-09Final weight 40.6% 14.1% 7.2% 9.3% 4.9% 11.4% 7.9% 4.7%
6
Global Commodity ResearchIntroducing the JPMorgan Commodity Curve IndexNovember 9, 2007
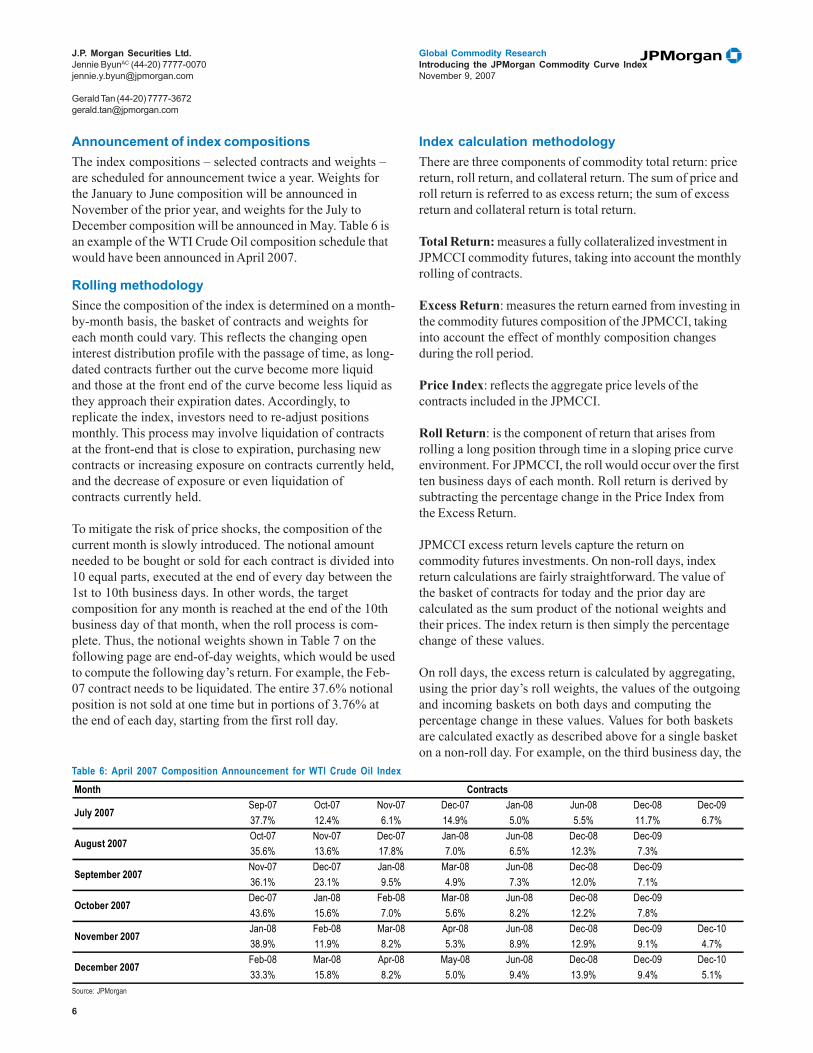
Announcement of index compositionsThe index compositions – selected contracts and weights –are scheduled for announcement twice a year. Weights forthe January to June composition will be announced inNovember of the prior year, and weights for the July toDecember composition will be announced in May. Table 6 isan example of the WTI Crude Oil composition schedule thatwould have been announced in April 2007.
Rolling methodologySince the composition of the index is determined on a month-by-month basis, the basket of contracts and weights foreach month could vary. This reflects the changing openinterest distribution profile with the passage of time, as long-dated contracts further out the curve become more liquidand those at the front end of the curve become less liquid asthey approach their expiration dates. Accordingly, toreplicate the index, investors need to re-adjust positionsmonthly. This process may involve liquidation of contractsat the front-end that is close to expiration, purchasing newcontracts or increasing exposure on contracts currently held,and the decrease of exposure or even liquidation ofcontracts currently held.
To mitigate the risk of price shocks, the composition of thecurrent month is slowly introduced. The notional amountneeded to be bought or sold for each contract is divided into10 equal parts, executed at the end of every day between the1st to 10th business days. In other words, the targetcomposition for any month is reached at the end of the 10thbusiness day of that month, when the roll process is com-plete. Thus, the notional weights shown in Table 7 on thefollowing page are end-of-day weights, which would be usedto compute the following day’s return. For example, the Feb-07 contract needs to be liquidated. The entire 37.6% notionalposition is not sold at one time but in portions of 3.76% atthe end of each day, starting from the first roll day.
Index calculation methodologyThere are three components of commodity total return: pricereturn, roll return, and collateral return. The sum of price androll return is referred to as excess return; the sum of excessreturn and collateral return is total return.
Total Return: measures a fully collateralized investment inJPMCCI commodity futures, taking into account the monthlyrolling of contracts.
Excess Return: measures the return earned from investing inthe commodity futures composition of the JPMCCI, takinginto account the effect of monthly composition changesduring the roll period.
Price Index: reflects the aggregate price levels of thecontracts included in the JPMCCI.
Roll Return: is the component of return that arises fromrolling a long position through time in a sloping price curveenvironment. For JPMCCI, the roll would occur over the firstten business days of each month. Roll return is derived bysubtracting the percentage change in the Price Index fromthe Excess Return.
JPMCCI excess return levels capture the return oncommodity futures investments. On non-roll days, indexreturn calculations are fairly straightforward. The value ofthe basket of contracts for today and the prior day arecalculated as the sum product of the notional weights andtheir prices. The index return is then simply the percentagechange of these values.
On roll days, the excess return is calculated by aggregating,using the prior day’s roll weights, the values of the outgoingand incoming baskets on both days and computing thepercentage change in these values. Values for both basketsare calculated exactly as described above for a single basketon a non-roll day. For example, on the third business day, the
Table 6: April 2007 Composition Announcement for WTI Crude Oil Index
Source: JPMorgan
J.P. Morgan Securities Ltd.Jennie ByunAC (44-20) [email protected]
Gerald Tan (44-20) [email protected]
MonthSep-07 Oct-07 Nov-07 Dec-07 Jan-08 Jun-08 Dec-08 Dec-0937.7% 12.4% 6.1% 14.9% 5.0% 5.5% 11.7% 6.7%Oct-07 Nov-07 Dec-07 Jan-08 Jun-08 Dec-08 Dec-0935.6% 13.6% 17.8% 7.0% 6.5% 12.3% 7.3%Nov-07 Dec-07 Jan-08 Mar-08 Jun-08 Dec-08 Dec-0936.1% 23.1% 9.5% 4.9% 7.3% 12.0% 7.1%Dec-07 Jan-08 Feb-08 Mar-08 Jun-08 Dec-08 Dec-0943.6% 15.6% 7.0% 5.6% 8.2% 12.2% 7.8%Jan-08 Feb-08 Mar-08 Apr-08 Jun-08 Dec-08 Dec-09 Dec-1038.9% 11.9% 8.2% 5.3% 8.9% 12.9% 9.1% 4.7%Feb-08 Mar-08 Apr-08 May-08 Jun-08 Dec-08 Dec-09 Dec-1033.3% 15.8% 8.2% 5.0% 9.4% 13.9% 9.4% 5.1%
December 2007
Contracts
September 2007
October 2007
November 2007
July 2007
August 2007
7
Global Commodity ResearchIntroducing the JPMorgan Commodity Curve IndexNovember 9, 2007
value of the two baskets are aggregated using 80% for theoutgoing basket and 20% for the incoming basket becausethe index invested in that ratio at the end of the secondbusiness day.
The excess return index level, initialized at 100 on 29 Decem-ber 1989, is simply the prior business day’s index levelcompounded with the present day’s excess return.
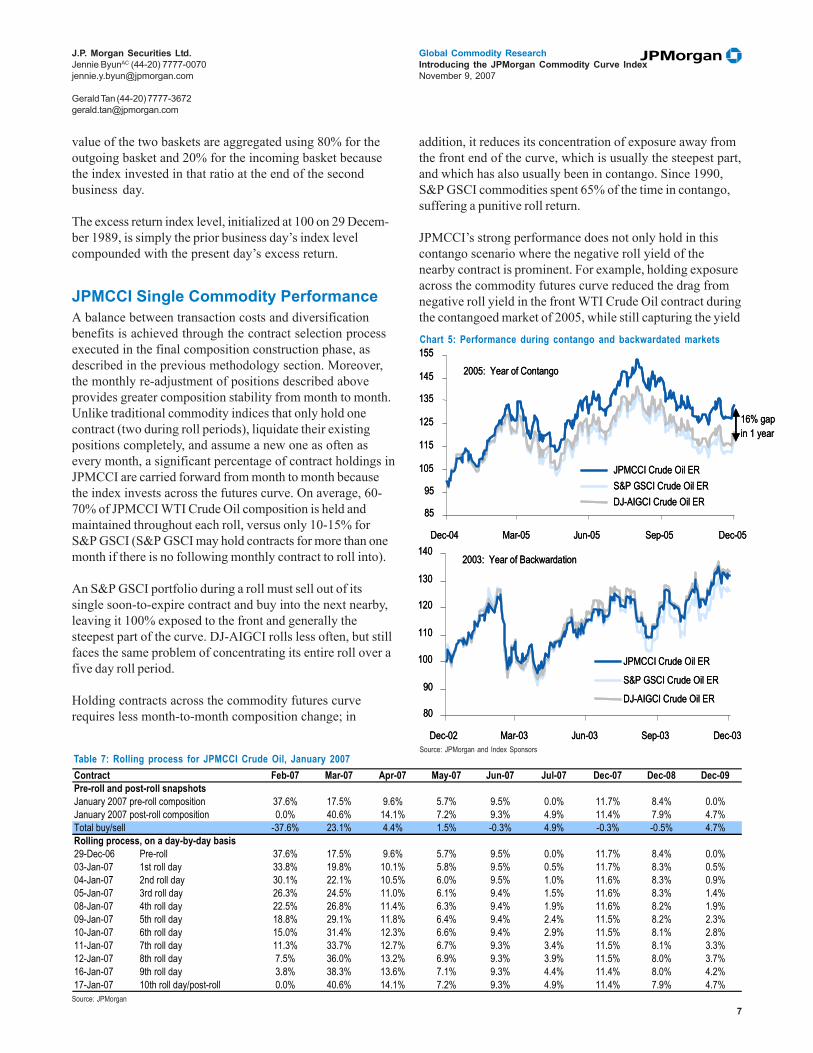
JPMCCI Single Commodity PerformanceA balance between transaction costs and diversificationbenefits is achieved through the contract selection processexecuted in the final composition construction phase, asdescribed in the previous methodology section. Moreover,the monthly re-adjustment of positions described aboveprovides greater composition stability from month to month.Unlike traditional commodity indices that only hold onecontract (two during roll periods), liquidate their existingpositions completely, and assume a new one as often asevery month, a significant percentage of contract holdings inJPMCCI are carried forward from month to month becausethe index invests across the futures curve. On average, 60-70% of JPMCCI WTI Crude Oil composition is held andmaintained throughout each roll, versus only 10-15% forS&P GSCI (S&P GSCI may hold contracts for more than onemonth if there is no following monthly contract to roll into).
An S&P GSCI portfolio during a roll must sell out of itssingle soon-to-expire contract and buy into the next nearby,leaving it 100% exposed to the front and generally thesteepest part of the curve. DJ-AIGCI rolls less often, but stillfaces the same problem of concentrating its entire roll over afive day roll period.
Holding contracts across the commodity futures curverequires less month-to-month composition change; in
addition, it reduces its concentration of exposure away fromthe front end of the curve, which is usually the steepest part,and which has also usually been in contango. Since 1990,S&P GSCI commodities spent 65% of the time in contango,suffering a punitive roll return.
JPMCCI’s strong performance does not only hold in thiscontango scenario where the negative roll yield of thenearby contract is prominent. For example, holding exposureacross the commodity futures curve reduced the drag fromnegative roll yield in the front WTI Crude Oil contract duringthe contangoed market of 2005, while still capturing the yield
Table 7: Rolling process for JPMCCI Crude Oil, January 2007
Source: JPMorgan
J.P. Morgan Securities Ltd.Jennie ByunAC (44-20) [email protected]
Gerald Tan (44-20) [email protected]
Chart 5: Performance during contango and backwardated markets
Source: JPMorgan and Index Sponsors
2005: Year of Contango
85
95
105
115
125
135
145
155
Dec-04 Mar-05 Jun-05 Sep-05 Dec-05
JPMCCI Crude Oil ERS&P GSCI Crude Oil ERDJ-AIGCI Crude Oil ER
16% gapin 1 year
2005: Year of Contango
85
95
105
115
125
135
145
155
Dec-04 Mar-05 Jun-05 Sep-05 Dec-05
JPMCCI Crude Oil ERS&P GSCI Crude Oil ERDJ-AIGCI Crude Oil ER
16% gapin 1 year
2003: Year of Backwardation
80
90
100
110
120
130
140
Dec-02 Mar-03 Jun-03 Sep-03 Dec-03
JPMCCI Crude Oil ER
S&P GSCI Crude Oil ER
DJ-AIGCI Crude Oil ER
2003: Year of Backwardation
80
90
100
110
120
130
140
Dec-02 Mar-03 Jun-03 Sep-03 Dec-03
JPMCCI Crude Oil ER
S&P GSCI Crude Oil ER
DJ-AIGCI Crude Oil ER
Contract Feb-07 Mar-07 Apr-07 May-07 Jun-07 Jul-07 Dec-07 Dec-08 Dec-09Pre-roll and post-roll snapshotsJanuary 2007 pre-roll composition 37.6% 17.5% 9.6% 5.7% 9.5% 0.0% 11.7% 8.4% 0.0%January 2007 post-roll composition 0.0% 40.6% 14.1% 7.2% 9.3% 4.9% 11.4% 7.9% 4.7%Total buy/sell -37.6% 23.1% 4.4% 1.5% -0.3% 4.9% -0.3% -0.5% 4.7%Rolling process, on a day-by-day basis29-Dec-06 Pre-roll 37.6% 17.5% 9.6% 5.7% 9.5% 0.0% 11.7% 8.4% 0.0%03-Jan-07 1st roll day 33.8% 19.8% 10.1% 5.8% 9.5% 0.5% 11.7% 8.3% 0.5%04-Jan-07 2nd roll day 30.1% 22.1% 10.5% 6.0% 9.5% 1.0% 11.6% 8.3% 0.9%05-Jan-07 3rd roll day 26.3% 24.5% 11.0% 6.1% 9.4% 1.5% 11.6% 8.3% 1.4%08-Jan-07 4th roll day 22.5% 26.8% 11.4% 6.3% 9.4% 1.9% 11.6% 8.2% 1.9%09-Jan-07 5th roll day 18.8% 29.1% 11.8% 6.4% 9.4% 2.4% 11.5% 8.2% 2.3%10-Jan-07 6th roll day 15.0% 31.4% 12.3% 6.6% 9.4% 2.9% 11.5% 8.1% 2.8%11-Jan-07 7th roll day 11.3% 33.7% 12.7% 6.7% 9.3% 3.4% 11.5% 8.1% 3.3%12-Jan-07 8th roll day 7.5% 36.0% 13.2% 6.9% 9.3% 3.9% 11.5% 8.0% 3.7%16-Jan-07 9th roll day 3.8% 38.3% 13.6% 7.1% 9.3% 4.4% 11.4% 8.0% 4.2%17-Jan-07 10th roll day/post-roll 0.0% 40.6% 14.1% 7.2% 9.3% 4.9% 11.4% 7.9% 4.7%

8
Global Commodity ResearchIntroducing the JPMorgan Commodity Curve IndexNovember 9, 2007
pickup in the backwardated market of 2003 (see chart 5). Thisis due to the fact that JPMCCI, being invested across thefutures curve, is able to take advantage of the changes alongterm structure.
In 2003, the WTI Crude Oil curve was generally inbackwardation, therefore S&P GSCI was able to generate apositive roll yield; in addition, it gained approximately 4% onprice appreciation. JPMCCI, by holding multiple further-dated contracts, was able to capitalize on the steepening atthe back end of the futures curve which contributed to ahigher price appreciation, while earning additional pickupfrom the roll in long-dated tenors.
By investing in multiple contracts per commodity, JPMCCIoutperforms 24 out of the 25 commodities included in theS&P GSCI and DJ-AIGCI, with reduced roll volatility andincreased risk-adjusted return. Complete details of JPMCCIsingle commodity performance versus other benchmarks areoutlined on pages 13-15.
Methodology: JPMCCI Aggregate IndexThe concept of JPMCCI is to create a comprehensiveportfolio of commodities that represents a transparent,diversified, and investable commodities market place. Weconsider commodities which meet the following requirementsfor inclusion in the JPMCCI each year:
• Only publicly exchange-traded physical commodities areconsidered for inclusion
• The exchange on which the commodity is traded must be avalid US or UK exchange
• The commodity must be USD-denominated
• The commodity must have traded for at least one yearbefore inclusion
• The commodity must have a minimum estimated marketsize of US$250 million
Estimated market size is defined as the 3-year historicalaverage open interest as reported by the Futures IndustryAssociation, multiplied by the commodity’s first nearbyfutures price, as of the last business day in October prior tothe new composition year. Once a commodity is includedinto the JPMCCI, it will remain in the index until its estimatedmarket size falls below US$150 million, at which point it willbe removed at the next rebalancing. This is to prevent thechurning of commodities that border the US$250 millionmark.
J.P. Morgan Securities Ltd.Jennie ByunAC (44-20) [email protected]
Gerald Tan (44-20) [email protected]
Table 8: JPMCCI commodities vs other indices
Source: JPMorgan and Index Sponsors
Chart 6: Sector weights across indices (as of Sept 28, 2007)
Source: JPMorgan and Index Sponsors
JPMCCI S&P GSCI DJ-AIGCI33 commodities 24 commodities 19 commodities
EnergyICE Brent Crude 7.4% 14.7% -ICE Gas Oil 3.6% 5.2% -NYMEX Crude Oil 17.8% 37.1% 14.7%NYMEX Gasoline 3.1% 1.3% 4.3%NYMEX Heating Oil 4.1% 5.8% 4.3%NYMEX Natural Gas 10.0% 6.3% 10.7%Industrial MetalsCOMEX Copper 2.1% - 7.2%LME Aluminum 6.9% 2.6% 5.3%LME Copper 9.8% 3.9% -LME Lead 1.2% 0.7% -LME Nickel 2.0% 1.1% 2.1%LME Zinc 2.7% 0.9% 1.9%Precious MetalsCOMEX Gold 5.8% 2.0% 6.8%COMEX Silver 2.0% 0.3% 2.1%NYMEX Palladium 0.1% - -NYMEX Platinum 0.2% - -AgricultureCBOT Corn 3.9% 2.9% 4.7%CBOT Soybean 3.5% 2.0% 9.2%CBOT Soybean Meal 1.1% - -CBOT Soybean Oil 1.1% - 3.2%CBOT Wheat 3.0% 4.7% 7.7%NYBOT Cocoa 0.6% 0.2% -NYBOT Coffee 1.2% 0.7% 2.6%NYBOT Cotton 0.9% 0.9% 3.0%NYBOT Sugar 1.1% 1.0% 2.3%NYBOT Orange Juice 0.2% - -LIFFE White Sugar 0.1% - -LIFFE Robusta Coffee 0.3% - -KCBOT Winter Wheat 1.1% 1.6% -MGE Spring Wheat 0.4% - -LivestockCME Feeder Cattle 0.3% 0.6% -CME Live Cattle 1.6% 2.5% 5.3%CME Lean Hogs 0.7% 1.2% 2.5%
46%
25%
8%
18%
3%
71%
9%2%
14%
4%
16%9%
33%
8%
34%
Energy IndustrialMetals
PreciousMetals
Agriculture Livestock
JPMCCIS&P GSCIDJ-AIGCI
9
Global Commodity ResearchIntroducing the JPMorgan Commodity Curve IndexNovember 9, 2007
-1.0
-0.5
0.0
0.5
1.0
92 94 96 98 00 02 04 06
U.S. TreasuriesLehman AggregateS&P 500
50
100
150
200
250
Dec-90 Dec-94 Dec-98 Dec-02 Dec-06
JPMCCIS&P GSCIDJ-AIGCI
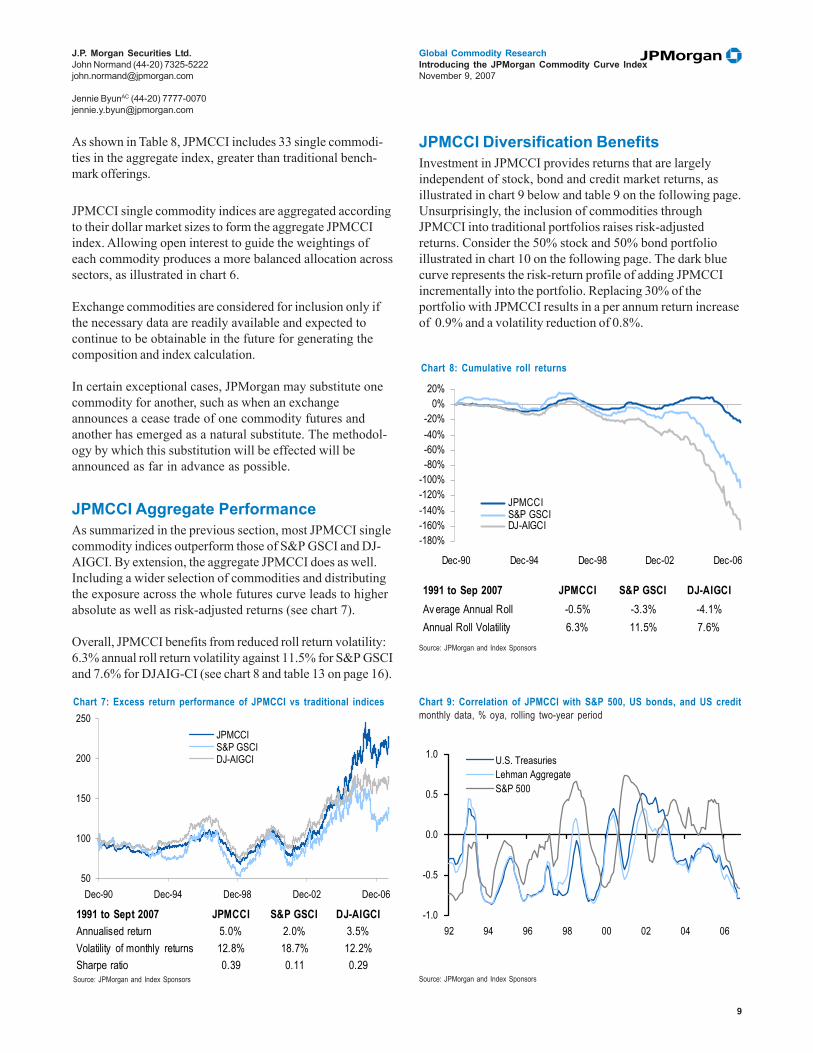
As shown in Table 8, JPMCCI includes 33 single commodi-ties in the aggregate index, greater than traditional bench-mark offerings.
JPMCCI single commodity indices are aggregated accordingto their dollar market sizes to form the aggregate JPMCCIindex. Allowing open interest to guide the weightings ofeach commodity produces a more balanced allocation acrosssectors, as illustrated in chart 6.
Exchange commodities are considered for inclusion only ifthe necessary data are readily available and expected tocontinue to be obtainable in the future for generating thecomposition and index calculation.
In certain exceptional cases, JPMorgan may substitute onecommodity for another, such as when an exchangeannounces a cease trade of one commodity futures andanother has emerged as a natural substitute. The methodol-ogy by which this substitution will be effected will beannounced as far in advance as possible.
JPMCCI Aggregate PerformanceAs summarized in the previous section, most JPMCCI singlecommodity indices outperform those of S&P GSCI and DJ-AIGCI. By extension, the aggregate JPMCCI does as well.Including a wider selection of commodities and distributingthe exposure across the whole futures curve leads to higherabsolute as well as risk-adjusted returns (see chart 7).
Overall, JPMCCI benefits from reduced roll return volatility:6.3% annual roll return volatility against 11.5% for S&P GSCIand 7.6% for DJAIG-CI (see chart 8 and table 13 on page 16).
J.P. Morgan Securities Ltd.John Normand (44-20) [email protected]
Jennie ByunAC (44-20) [email protected]
Source: JPMorgan and Index Sponsors
Chart 7: Excess return performance of JPMCCI vs traditional indices
JPMCCI Diversification BenefitsInvestment in JPMCCI provides returns that are largelyindependent of stock, bond and credit market returns, asillustrated in chart 9 below and table 9 on the following page.Unsurprisingly, the inclusion of commodities throughJPMCCI into traditional portfolios raises risk-adjustedreturns. Consider the 50% stock and 50% bond portfolioillustrated in chart 10 on the following page. The dark bluecurve represents the risk-return profile of adding JPMCCIincrementally into the portfolio. Replacing 30% of theportfolio with JPMCCI results in a per annum return increaseof 0.9% and a volatility reduction of 0.8%.
Chart 8: Cumulative roll returns
Source: JPMorgan and Index Sponsors
Source: JPMorgan and Index Sponsors
Chart 9: Correlation of JPMCCI with S&P 500, US bonds, and US creditmonthly data, % oya, rolling two-year period
-180%-160%-140%-120%-100%-80%-60%-40%-20%
0%20%
Dec-90 Dec-94 Dec-98 Dec-02 Dec-06
JPMCCIS&P GSCIDJ-AIGCI
1991 to Sept 2007 JPMCCI S&P GSCI DJ-AIGCIAnnualised return 5.0% 2.0% 3.5%Volatility of monthly returns 12.8% 18.7% 12.2%Sharpe ratio 0.39 0.11 0.29
1991 to Sep 2007 JPMCCI S&P GSCI DJ-AIGCIAv erage Annual Roll -0.5% -3.3% -4.1%Annual Roll Volatility 6.3% 11.5% 7.6%

10
Global Commodity ResearchIntroducing the JPMorgan Commodity Curve IndexNovember 9, 2007
J.P. Morgan Securities Ltd.John Normand (44-20) [email protected]
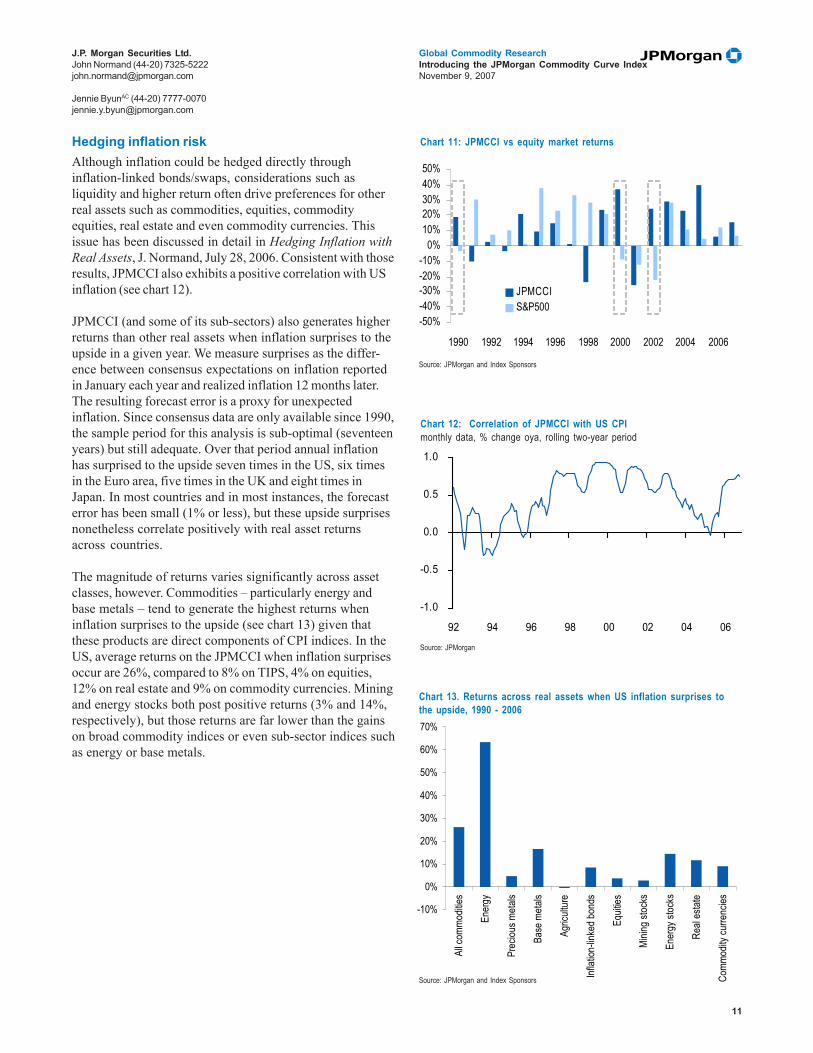
Hedging equity market declinesIn addition to long-run diversification, some investors arealso concerned with hedging declines in core markets overdiscrete periods, such as an annual holding period. Com-modities can provide insurance for this under two circum-stances: (1) when the cause of an equity market decline is ageopolitical event/supply shock (1973, 1974, 1977, 1990); or(2) when a commodity price rise contributes to the inflationtrend motivating central bank tightening and eventualgrowth slowdown (1994, 2000). It should therefore beunsurprising that commodity indices have generatedpositive returns in the majority of years when equitiesdecline. Since inception in 1990, JPMCCI has as well (seechart 11 on following page).
Table 9: Performance of JPMCCI and other commodity benchmarks versus other asset classes
Source: JPMorgan and Index Sponsors; *Figures based on monthly returns from January 1991 to September 2007, to accomodate comparison with DJ-AIGCI. Correlations are based on monthly returns.
Jennie ByunAC (44-20) [email protected]
Chart 10: Risk Return profile as part of 50/50 Equity/Bond portfolioannualised monthly returns from Jan 1996 to Sept 2007
Source: JPMorgan and Index Sponsors. Data from Jan 1996 to Sep 2007Bond Investment : Lehman US Aggregate. Stock Investment : S&P 500.
Total Returns JPMCCI S&P GSCI DJ-AIGCI S&P 500 U.S. Treas Lehman US Credit Lehman US Agg EM Bonds1990 19.2% 29.1% - -3.1% 8.6% 7.1% 9.0% -1991 -10.3% -6.1% -5.8% 30.5% 14.8% 18.5% 16.0% 38.8%1992 2.8% 4.4% 3.7% 7.6% 7.2% 8.7% 7.4% 7.0%1993 -3.3% -12.3% -1.1% 10.1% 10.1% 12.2% 9.7% 44.2%1994 20.6% 5.3% 16.6% 1.3% -2.9% -3.9% -2.9% -19.3%1995 9.3% 20.3% 15.2% 37.6% 17.3% 22.2% 18.5% 27.3%1996 14.8% 33.9% 23.2% 23.0% 2.9% 3.3% 3.6% 37.8%1997 1.6% -14.1% -3.4% 33.4% 10.0% 10.2% 9.7% 10.8%1998 -23.3% -35.7% -27.0% 28.6% 10.3% 8.6% 8.7% -8.1%1999 23.7% 40.9% 24.3% 21.0% -2.9% -2.0% -0.8% 19.6%2000 37.5% 49.7% 31.8% -8.1% 13.9% 9.1% 11.6% 12.7%2001 -25.6% -31.9% -19.5% -12.8% 6.6% 10.3% 8.4% 9.7%2002 24.4% 32.1% 25.9% -22.1% 12.2% 10.1% 10.3% 13.7%2003 28.8% 20.7% 23.9% 28.7% 2.4% 8.2% 4.1% 22.2%2004 23.1% 17.3% 9.1% 10.9% 3.7% 5.4% 4.3% 11.6%2005 39.8% 25.6% 21.4% 4.9% 2.9% 1.7% 2.4% 10.2%2006 5.8% -15.1% 2.1% 15.8% 3.1% 4.3% 4.3% 9.9%2007 YTD 15.3% 18.8% 11.0% 9.1% 4.9% 2.5% 3.8% 3.3%Cum Return* 347.3% 173.9% 248.5% 548.9% 201.6% 238.0% 210.0% 784.5%Annualized Return* 9.4% 6.2% 7.7% 11.8% 6.8% 7.5% 7.0% 13.9%Volatility * 12.8% 18.7% 12.2% 13.5% 4.4% 4.7% 3.7% 12.9%Sharpe Ratio* 0.39 0.11 0.29 0.56 0.61 0.72 0.78 0.74
Correlations* JPMCCI S&P GSCI DJ-AIGCI S&P 500 U.S. Treas Lehman US Credit Lehman US Agg EMBIGDJPMCCI 1.00S&P GSCI 0.88 1.00DJ-AIGCI 0.95 0.89 1.00S&P 500 0.07 -0.01 0.09 1.00U.S. Treas -0.01 0.06 0.01 -0.06 1.00Lehman US Credit 0.00 0.05 0.04 0.18 0.89 1.00Lehman US Agg 0.02 0.07 0.03 0.07 0.95 0.94 1.00EM Bonds 0.12 0.07 0.16 0.50 0.19 0.37 0.27 1.00
5%6%7%8%9%
10%11%12%13%
2% 4% 6% 8% 10% 12% 14% 16%Volatility
Retur
n
50% Bond50% Equity
100% JPMCCI
100% Equity30% JPMCCI70% Bond / Equity
100% Bond
11
Global Commodity ResearchIntroducing the JPMorgan Commodity Curve IndexNovember 9, 2007
-10%
0%
10%
20%
30%
40%
50%
60%
70%
All c
ommo
dities
Ener
gy
Prec
ious m
etals
Base
meta
ls
Agric
ultur
e
Inflat
ion-lin
ked b
onds
Equit
ies
Minin
g stoc
ks
Ener
gy st
ocks
Real
estat
e
Comm
odity
curre
ncies
J.P. Morgan Securities Ltd.John Normand (44-20) [email protected]
Jennie ByunAC (44-20) [email protected]
Hedging inflation riskAlthough inflation could be hedged directly throughinflation-linked bonds/swaps, considerations such asliquidity and higher return often drive preferences for otherreal assets such as commodities, equities, commodityequities, real estate and even commodity currencies. Thisissue has been discussed in detail in Hedging Inflation withReal Assets, J. Normand, July 28, 2006. Consistent with thoseresults, JPMCCI also exhibits a positive correlation with USinflation (see chart 12).
JPMCCI (and some of its sub-sectors) also generates higherreturns than other real assets when inflation surprises to theupside in a given year. We measure surprises as the differ-ence between consensus expectations on inflation reportedin January each year and realized inflation 12 months later.The resulting forecast error is a proxy for unexpectedinflation. Since consensus data are only available since 1990,the sample period for this analysis is sub-optimal (seventeenyears) but still adequate. Over that period annual inflationhas surprised to the upside seven times in the US, six timesin the Euro area, five times in the UK and eight times inJapan. In most countries and in most instances, the forecasterror has been small (1% or less), but these upside surprisesnonetheless correlate positively with real asset returnsacross countries.
The magnitude of returns varies significantly across assetclasses, however. Commodities – particularly energy andbase metals – tend to generate the highest returns wheninflation surprises to the upside (see chart 13) given thatthese products are direct components of CPI indices. In theUS, average returns on the JPMCCI when inflation surprisesoccur are 26%, compared to 8% on TIPS, 4% on equities,12% on real estate and 9% on commodity currencies. Miningand energy stocks both post positive returns (3% and 14%,respectively), but those returns are far lower than the gainson broad commodity indices or even sub-sector indices suchas energy or base metals.
Chart 13. Returns across real assets when US inflation surprises tothe upside, 1990 - 2006
Source: JPMorgan and Index Sponsors
Source: JPMorgan
Chart 12: Correlation of JPMCCI with US CPImonthly data, % change oya, rolling two-year period
Source: JPMorgan and Index Sponsors
Chart 11: JPMCCI vs equity market returns
-50%-40%-30%-20%-10%
0%10%20%30%40%50%
1990 1992 1994 1996 1998 2000 2002 2004 2006
JPMCCIS&P500
-1.0
-0.5
0.0
0.5
1.0
92 94 96 98 00 02 04 06

12
Global Commodity ResearchIntroducing the JPMorgan Commodity Curve IndexNovember 9, 2007
J.P. Morgan Securities Ltd.Jennie ByunAC (44-20) [email protected]
Gerald Tan (44-20) [email protected]
Sourcing JPMCCIJPMCCI index levels are calculated and published for everyIndex Valuation Day, defined as a day where at least half ofthe exchange commodities are open and scheduled fortrading. Settlement prices are used to calculate officialclosing levels.
Disrupted DaysA day is considered a Disrupted Day for a commodity if:
• the settlement price for any contract in the portfolio of a JPMCCI single commodity is not obtainable
• the settlement price for a contract in the JPMCCI single commodity is a limit price
To allow for marking-to-market, closing index levels will stillbe published on a Disrupted Day if it is an Index ValuationDay, using exchange-published official settlement prices. If asettlement price is not obtainable, then the previous day’slevel will be used for index level calculation. If the settlementprice is a limit price, the limit price will be used to calculatethe index.
However, if a contract experiences a disruption during theroll period, the roll for the commodity on the Disrupted Daywill be postponed until the next Index Valuation Day when allcontract settlement prices are available, and which is not aDisrupted Day. The portion of the roll that would haveotherwise taken place is made up on the next valid roll day.For example, if the first business day of the month was aDisrupted Day, the 10% that would have rolled is postponeduntil the next valid roll day, at which point 20% (10% of thepostponed roll plus 10% of the scheduled roll for the currentday) of the holdings will be rolled.
Accessing JPMCCIJPMCCI information is available through a variety of sourceswhich makes tracking and benchmarking the index easy forinvestors.
MorganMarketswww.morganmarkets.com
Users can access JPMCCI using their MorganMarkets IDand password (these can be obtained from JPMorgan salesrepresentatives). The website is accessed using the Com-modities link on the MorganMarkets home page. This siteprovides comprehensive index information, available fordownload for the aggregate, sector, and single commodityJPMCCI indices:
• Excess Return Index Levels
• Price Index Levels
• Total Return Index Levels
• Weights
• Average Maturity
DataQueryhttp://dataquery.jpmorgan.com
DataQuery is a web-based application for reporting andanalyzing research data. JPMCCI information is availableusing this tool, which enables users to view and downloadindex levels, returns and statistics at single commodity,sector and aggregate levels.
BloombergTicker: <JMCX>
Aggregate, sector and individual market index levels andstatistics are available by typing JMCX <Go> on yourBloomberg terminal.
Monthly publicationsThe monthly Commodities Index Monitor contains JPMCCIindex levels and statistics, including return decomposition,weights, and average maturity. It also includes performanceacross commodity indices and other real asset classes.
13
Global Commodity ResearchIntroducing the JPMorgan Commodity Curve IndexNovember 9, 2007
J.P. Morgan Securities Ltd.Jennie ByunAC (44-20) [email protected]
Gerald Tan (44-20) [email protected]
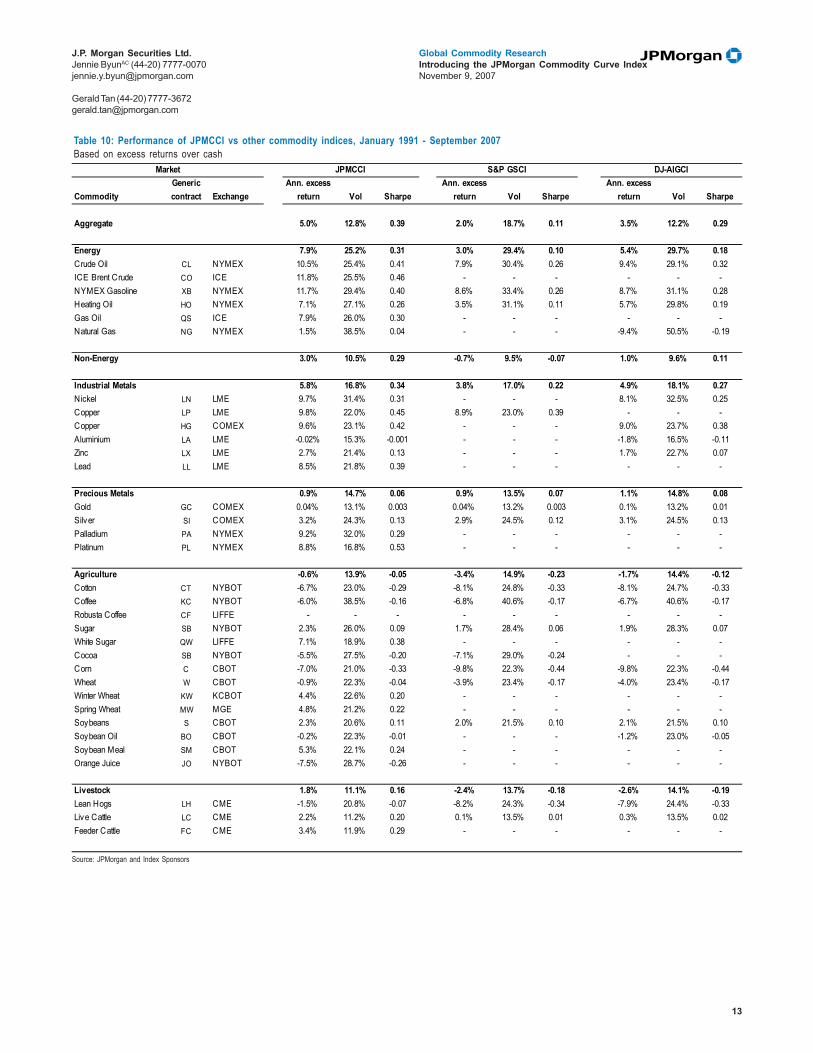
Table 10: Performance of JPMCCI vs other commodity indices, January 1991 - September 2007Based on excess returns over cash
Source: JPMorgan and Index Sponsors
Commodity Exchange Vol Sharpe Vol Sharpe Vol Sharpe
Aggregate 5.0% 12.8% 0.39 2.0% 18.7% 0.11 3.5% 12.2% 0.29
Energy 7.9% 25.2% 0.31 3.0% 29.4% 0.10 5.4% 29.7% 0.18Crude Oil CL NYMEX 10.5% 25.4% 0.41 7.9% 30.4% 0.26 9.4% 29.1% 0.32ICE Brent Crude CO ICE 11.8% 25.5% 0.46 - - - - - -NYMEX Gasoline XB NYMEX 11.7% 29.4% 0.40 8.6% 33.4% 0.26 8.7% 31.1% 0.28Heating Oil HO NYMEX 7.1% 27.1% 0.26 3.5% 31.1% 0.11 5.7% 29.8% 0.19Gas Oil QS ICE 7.9% 26.0% 0.30 - - - - - -Natural Gas NG NYMEX 1.5% 38.5% 0.04 - - - -9.4% 50.5% -0.19
Non-Energy 3.0% 10.5% 0.29 -0.7% 9.5% -0.07 1.0% 9.6% 0.11
Industrial Metals 5.8% 16.8% 0.34 3.8% 17.0% 0.22 4.9% 18.1% 0.27Nickel LN LME 9.7% 31.4% 0.31 - - - 8.1% 32.5% 0.25Copper LP LME 9.8% 22.0% 0.45 8.9% 23.0% 0.39 - - -Copper HG COMEX 9.6% 23.1% 0.42 - - - 9.0% 23.7% 0.38Aluminium LA LME -0.02% 15.3% -0.001 - - - -1.8% 16.5% -0.11Zinc LX LME 2.7% 21.4% 0.13 - - - 1.7% 22.7% 0.07Lead LL LME 8.5% 21.8% 0.39 - - - - - -
Precious Metals 0.9% 14.7% 0.06 0.9% 13.5% 0.07 1.1% 14.8% 0.08Gold GC COMEX 0.04% 13.1% 0.003 0.04% 13.2% 0.003 0.1% 13.2% 0.01Silver SI COMEX 3.2% 24.3% 0.13 2.9% 24.5% 0.12 3.1% 24.5% 0.13Palladium PA NYMEX 9.2% 32.0% 0.29 - - - - - -Platinum PL NYMEX 8.8% 16.8% 0.53 - - - - - -
Agriculture -0.6% 13.9% -0.05 -3.4% 14.9% -0.23 -1.7% 14.4% -0.12Cotton CT NYBOT -6.7% 23.0% -0.29 -8.1% 24.8% -0.33 -8.1% 24.7% -0.33Coffee KC NYBOT -6.0% 38.5% -0.16 -6.8% 40.6% -0.17 -6.7% 40.6% -0.17Robusta Coffee CF LIFFE - - - - - - - - -Sugar SB NYBOT 2.3% 26.0% 0.09 1.7% 28.4% 0.06 1.9% 28.3% 0.07White Sugar QW LIFFE 7.1% 18.9% 0.38 - - - - - -Cocoa SB NYBOT -5.5% 27.5% -0.20 -7.1% 29.0% -0.24 - - -Corn C CBOT -7.0% 21.0% -0.33 -9.8% 22.3% -0.44 -9.8% 22.3% -0.44Wheat W CBOT -0.9% 22.3% -0.04 -3.9% 23.4% -0.17 -4.0% 23.4% -0.17Winter Wheat KW KCBOT 4.4% 22.6% 0.20 - - - - - -Spring Wheat MW MGE 4.8% 21.2% 0.22 - - - - - -Soybeans S CBOT 2.3% 20.6% 0.11 2.0% 21.5% 0.10 2.1% 21.5% 0.10Soybean Oil BO CBOT -0.2% 22.3% -0.01 - - - -1.2% 23.0% -0.05Soybean Meal SM CBOT 5.3% 22.1% 0.24 - - - - - -Orange Juice JO NYBOT -7.5% 28.7% -0.26 - - - - - - Livestock 1.8% 11.1% 0.16 -2.4% 13.7% -0.18 -2.6% 14.1% -0.19Lean Hogs LH CME -1.5% 20.8% -0.07 -8.2% 24.3% -0.34 -7.9% 24.4% -0.33Live Cattle LC CME 2.2% 11.2% 0.20 0.1% 13.5% 0.01 0.3% 13.5% 0.02Feeder Cattle FC CME 3.4% 11.9% 0.29 - - - - - -
Generic contract
Ann. excess return
Ann. excess return
Ann. excess return
Market JPMCCI S&P GSCI DJ-AIGCI

14
Global Commodity ResearchIntroducing the JPMorgan Commodity Curve IndexNovember 9, 2007
J.P. Morgan Securities Ltd.Jennie ByunAC (44-20) [email protected]
Gerald Tan (44-20) [email protected]
Table 11: Performance of JPMCCI vs other commodity indices, January 1997 - September 2007Based on excess returns over cash
Source: JPMorgan and Index Sponsors
Commodity Exchange Vol Sharpe Vol Sharpe Vol Sharpe
Aggregate 7.7% 14.9% 0.52 2.2% 21.7% 0.10 3.6% 14.2% 0.25
Energy 10.9% 28.4% 0.38 4.5% 32.8% 0.14 4.2% 33.9% 0.12Crude Oil CL NYMEX 14.2% 27.9% 0.51 7.5% 33.5% 0.22 9.2% 32.7% 0.28ICE Brent Crude CO ICE 16.2% 27.5% 0.59 - - - - - -NYMEX Gasoline XB NYMEX 15.8% 34.1% 0.46 11.5% 38.7% 0.30 10.5% 36.1% 0.29Heating Oil HO NYMEX 10.8% 30.5% 0.36 4.5% 34.6% 0.13 6.8% 33.5% 0.20Gas Oil QS ICE 12.3% 28.9% 0.43 - - - - - -Natural Gas NG NYMEX 1.9% 43.6% 0.04 -20.5% 59.8% -0.34 -14.0% 55.4% -0.25
Non-Energy 5.2% 11.6% 0.44 -1.9% 10.4% -0.18 1.1% 10.7% 0.10
Industrial Metals 11.0% 17.9% 0.62 8.3% 17.7% 0.47 9.1% 19.4% 0.47Nickel LN LME 20.1% 34.8% 0.58 18.1% 35.8% 0.51 18.6% 36.0% 0.52Copper LP LME 15.7% 23.4% 0.67 13.9% 24.2% 0.57 - - -Copper HG COMEX 13.6% 25.0% 0.55 - - - 12.4% 25.4% 0.49Aluminium LA LME 3.3% 14.4% 0.23 0.5% 15.7% 0.03 1.5% 15.5% 0.10Zinc LX LME 8.1% 23.9% 0.34 5.6% 25.0% 0.22 6.5% 24.9% 0.26Lead LL LME 16.6% 22.9% 0.72 13.6% 24.9% 0.55 - - -
Precious Metals 4.1% 15.9% 0.26 4.2% 14.7% 0.29 4.2% 15.9% 0.26Gold GC COMEX 3.0% 14.6% 0.21 3.0% 14.7% 0.20 3.0% 14.7% 0.20Silver SI COMEX 7.0% 25.9% 0.27 6.6% 26.1% 0.25 6.6% 26.1% 0.25Palladium PA NYMEX 11.0% 37.5% 0.29 - - - - - -Platinum PL NYMEX 16.3% 18.0% 0.90 - - - - - -
Agriculture -2.0% 15.5% -0.13 -7.3% 16.2% -0.45 -4.0% 15.9% -0.25Cotton CT NYBOT -12.9% 24.7% -0.52 -15.4% 26.2% -0.59 -15.4% 26.2% -0.59Coffee KC NYBOT -7.6% 36.0% -0.21 -9.0% 37.9% -0.24 -9.0% 38.0% -0.24Robusta Coffee CF LIFFE -0.6% 33.7% -0.02 - - - - - -Sugar SB NYBOT -1.5% 28.7% -0.05 -3.1% 31.0% -0.10 -3.1% 31.0% -0.10White Sugar QW LIFFE 3.8% 20.5% 0.19 - - - - - -Cocoa SB NYBOT -2.9% 30.4% -0.09 -3.8% 32.0% -0.12 - - -Corn C CBOT -9.9% 22.3% -0.44 -13.1% 23.8% -0.55 -13.1% 23.8% -0.55Wheat W CBOT -6.1% 23.7% -0.26 -9.6% 24.6% -0.39 -9.6% 24.5% -0.39Winter Wheat KW KCBOT -0.1% 23.4% 0.00 - - - - - -Spring Wheat MW MGE 1.8% 21.4% 0.08 - - - - - -Soybeans S CBOT 4.3% 23.3% 0.19 4.0% 24.4% 0.17 4.0% 24.4% 0.17Soybean Oil BO CBOT 0.2% 24.9% 0.01 - - - -1.2% 25.7% -0.05Soybean Meal SM CBOT 8.3% 25.4% 0.33 - - - - - -Orange Juice JO NYBOT -5.6% 26.9% -0.21 - - - - - - Livestock 0.9% 12.0% 0.07 -4.5% 14.5% -0.31 -5.3% 15.0% -0.35Lean Hogs LH CME -4.2% 22.4% -0.19 -12.9% 26.5% -0.49 -12.7% 26.4% -0.48Live Cattle LC CME 1.6% 12.2% 0.13 -1.0% 14.2% -0.07 -0.9% 14.2% -0.06Feeder Cattle FC CME 4.6% 12.5% 0.36 - - - - - -
Generic contract
Ann. excess return
Ann. excess return
Ann. excess return
Market JPMCCI S&P GSCI DJ-AIGCI

15
Global Commodity ResearchIntroducing the JPMorgan Commodity Curve IndexNovember 9, 2007
J.P. Morgan Securities Ltd.Jennie ByunAC (44-20) [email protected]
Gerald Tan (44-20) [email protected]
Table 12: Performance of JPMCCI vs other commodity indices, January 2002 - September 2007Based on excess returns over cash
Source: JPMorgan and Index Sponsors
Commodity Exchange Vol Sharpe Vol Sharpe Vol Sharpe
Aggregate 20.2% 15.4% 1.31 13.1% 21.8% 0.60 12.8% 13.7% 0.94
Energy 21.7% 27.7% 0.79 16.0% 30.6% 0.52 11.7% 32.7% 0.36Crude Oil CL NYMEX 28.3% 25.3% 1.12 21.5% 29.0% 0.74 25.1% 28.3% 0.88ICE Brent Crude CO ICE 31.3% 24.0% 1.30 25.9% 27.0% 0.96 - - -NYMEX Gasoline XB NYMEX 27.5% 33.6% 0.82 21.4% 38.3% 0.56 20.9% 35.0% 0.60Heating Oil HO NYMEX 26.9% 27.9% 0.96 19.0% 31.5% 0.60 22.8% 30.1% 0.76Gas Oil QS ICE 30.4% 27.1% 1.12 27.7% 30.4% 0.91 - - -Natural Gas NG NYMEX 4.4% 41.6% 0.11 -19.6% 58.6% -0.33 -12.9% 52.2% -0.25
Non-Energy 19.2% 12.1% 1.59 8.7% 10.5% 0.83 11.9% 11.0% 1.08
Industrial Metals 29.3% 19.1% 1.54 25.3% 18.8% 1.35 26.1% 20.1% 1.29Nickel LN LME 43.5% 38.5% 1.13 39.6% 39.7% 1.00 40.1% 39.9% 1.00Copper LP LME 41.8% 25.7% 1.63 40.3% 26.2% 1.54 - - -Copper HG COMEX 38.4% 27.0% 1.42 - - - 36.5% 27.3% 1.33Aluminium LA LME 12.0% 14.0% 0.86 8.4% 15.2% 0.56 9.3% 15.1% 0.62Zinc LX LME 25.1% 28.1% 0.89 21.2% 28.9% 0.73 21.9% 28.9% 0.76Lead LL LME 46.2% 26.8% 1.72 42.8% 28.5% 1.50 - - -
Precious Metals 15.6% 16.8% 0.93 15.2% 15.4% 0.98 15.5% 16.9% 0.92Gold GC COMEX 15.0% 14.9% 1.01 14.8% 14.9% 0.99 14.8% 14.9% 0.99Silver SI COMEX 17.8% 27.8% 0.64 17.3% 27.8% 0.62 17.3% 27.8% 0.62Palladium PA NYMEX -7.1% 31.4% -0.23 - - - - - -Platinum PL NYMEX 22.2% 15.8% 1.40 - - - - - -
Agriculture 8.4% 16.4% 0.51 2.6% 16.9% 0.15 5.9% 16.5% 0.36Cotton CT NYBOT -5.7% 25.8% -0.22 -8.2% 27.4% -0.30 -8.3% 27.4% -0.30Coffee KC NYBOT 0.6% 31.4% 0.02 -1.2% 32.4% -0.04 -1.2% 32.4% -0.04Robusta Coffee CF LIFFE 20.3% 30.4% 0.67 - - - - - -Sugar SB NYBOT 4.9% 26.8% 0.18 1.0% 28.8% 0.03 1.0% 28.8% 0.03White Sugar QW LIFFE 10.9% 20.7% 0.53 - - - - - -Cocoa SB NYBOT 5.6% 30.3% 0.19 5.0% 31.5% 0.16 - - -Corn C CBOT -3.7% 24.1% -0.15 -7.9% 25.9% -0.31 -7.9% 25.9% -0.31Wheat W CBOT 9.0% 24.7% 0.37 5.1% 25.9% 0.19 5.1% 25.8% 0.20Winter Wheat KW KCBOT 17.4% 24.6% 0.71 14.7% 25.7% 0.57 - - -Spring Wheat MW MGE 16.2% 24.3% 0.67 - - - - - -Soybeans S CBOT 18.1% 24.8% 0.73 16.7% 26.1% 0.64 16.7% 26.2% 0.64Soybean Oil BO CBOT 16.5% 25.4% 0.65 - - - 14.4% 26.5% 0.54Soybean Meal SM CBOT 18.0% 26.9% 0.67 - - - - - -Orange Juice JO NYBOT -2.0% 26.6% -0.07 - - - - - - Livestock 5.7% 13.4% 0.42 -1.0% 15.6% -0.06 -2.7% 16.2% -0.17Lean Hogs LH CME -1.3% 23.2% -0.05 -12.3% 26.6% -0.46 -12.1% 26.6% -0.46Live Cattle LC CME 7.2% 14.0% 0.52 4.0% 16.3% 0.25 4.2% 16.3% 0.26Feeder Cattle FC CME 9.4% 14.3% 0.66 6.2% 15.4% 0.40 - - -
Generic contract
Ann. excess return
Ann. excess return
Ann. excess return
Market JPMCCI S&P GSCI DJ-AIGCI

16
Global Commodity ResearchIntroducing the JPMorgan Commodity Curve IndexNovember 9, 2007
J.P. Morgan Securities Ltd.Jennie ByunAC (44-20) [email protected]
Gerald Tan (44-20) [email protected]
Table 13: Decomposition of excess returns of JPMCCI vs other commodity indicesreturns
Source: JPMorgan and Index Sponsors
AnnualReturns JPMCCI S&P GSCI DJ-AIGCI JPMCCI S&P GSCI DJ-AIGCI JPMCCI S&P GSCI DJ-AIGCI1990 10.4% 19.5% – 6.1% 6.1% – 4.2% 13.3% –1991 -15.1% -11.2% -10.8% -16.2% -19.6% -10.6% 1.0% 8.4% -0.2%1992 -0.7% 0.8% 0.1% 2.0% 2.3% 1.0% -2.7% -1.5% -0.9%1993 -6.2% -15.0% -4.0% -1.1% -9.6% 2.5% -5.1% -5.3% -6.6%1994 15.5% 0.8% 11.7% 18.4% 10.5% 16.5% -2.9% -9.7% -4.8%1995 3.3% 13.8% 8.9% 1.0% 12.6% 8.3% 2.3% 1.2% 0.7%1996 9.0% 27.2% 17.0% -2.0% 5.8% 3.8% 11.0% 21.4% 13.2%1997 -3.6% -18.4% -8.2% -8.2% -18.4% -9.8% 4.7% 0.0% 1.6%1998 -27.0% -38.8% -30.5% -19.5% -24.3% -19.8% -7.5% -14.6% -10.8%1999 18.0% 34.4% 18.6% 24.3% 46.2% 27.2% -6.4% -11.9% -8.6%2000 29.5% 41.1% 24.2% 21.8% 26.9% 21.2% 7.7% 14.2% 3.0%2001 -28.2% -34.3% -22.3% -27.3% -31.5% -18.2% -1.0% -2.8% -4.1%2002 22.3% 29.9% 23.9% 26.6% 39.0% 33.3% -4.3% -9.1% -9.4%2003 27.5% 19.5% 22.7% 18.8% 10.8% 19.0% 8.7% 8.7% 3.7%2004 21.4% 15.7% 7.6% 16.4% 19.2% 12.4% 5.1% -3.5% -4.7%2005 35.4% 21.6% 17.5% 37.1% 39.1% 30.2% -1.7% -17.4% -12.7%2006 0.8% -19.1% -2.7% 11.3% 0.4% 14.8% -10.5% -19.5% -17.6%Sep 2007 11.2% 14.6% 7.1% 16.6% 25.9% 16.3% -5.4% -11.3% -9.3%
1991 to Sep 2007Cum return 127.9% 39.8% 78.3% 151.2% 148.3% 242.7% -23.2% -108.5% -164.5%Annualised return 5.0% 2.0% 3.5% 5.7% 5.6% 7.6% – – –Volatility 12.8% 18.7% 12.2% 12.8% 18.6% 12.4% 2.2% 4.2% 3.6%Sharpe ratio 0.39 0.11 0.29 – – – – – –
1997 to Sep 2007Cum return 121.8% 25.9% 46.1% 153.4% 153.7% 182.7% -31.6% -127.8% -136.7%Annualised return 7.7% 2.2% 3.6% 9.0% 9.0% 10.2% – – –Volatility 14.9% 21.7% 14.2% 14.9% 21.5% 14.3% 2.3% 3.9% 3.5%Sharpe ratio 0.52 0.10 0.25 – – – – – –
2002 to Sep 2007Cum return 187.5% 102.5% 100.2% 211.4% 222.9% 203.4% -23.9% -120.3% -103.2%Annualised return 20.2% 13.1% 12.8% 21.8% 22.6% 21.3% – – –Volatility 15.4% 21.8% 13.7% 15.4% 21.6% 13.7% 2.1% 3.7% 3.7%Sharpe ratio 1.31 0.60 0.94 – – – – – –
Roll ReturnExcess Return Spot Price

17
Global Commodity ResearchIntroducing the JPMorgan Commodity Curve IndexNovember 9, 2007
J.P. Morgan Securities Ltd.Jennie ByunAC (44-20) [email protected]
Gerald Tan (44-20) [email protected]
JPMCCI Aggregate
• Performance. JPMCCI Aggregate produced an annualizedexcess return of 20.2% from 2002 to September 2007 with avolatility of 15.4%. This results in a Sharpe ratio of 1.31 forJPMCCI, compared to S&P GSCI (0.60) and DJ-AIGCI(0.94). This outperformance is not due to any one sectorbut occurred broadly accross energy, industrial metal,agriculture and livestock.
• Roll return. JPMCCI Aggregate average annual roll returnwas -1.6% from 2002 to September 2007. This compares to-9.3% for S&P GSCI. JPMCCI Aggregate average annualroll returns were -1.1% from 1997 to September 2007 and-0.5% from 1991 to September 2007.
• Sector Weights. JPMCCI is an aggregate market index bywhich individual commodities are weighted by their openinterest. This implies a current allocation of approximately46% energy, 25% industrial metals, 9% precious metals,18% agriculture and 3% livestock. Letting the stock ofopen interest naturally drive allocation results in sectorweights that are more balanced than production-weightedindices (S&P GSCI), and without the imposition ofdiscretionary caps (DJ-AIGCI).
Aggregate: sector weights across indices (Sep 2007)
Source: JPMorgan
0% 20% 40% 60% 80% 100%
DJ-AIGCI
S&P GSCI
JPMCCI
Energy Industrial metals Precious metals Agriculture Liv estock
JPMCCI Aggregate: roll return vs other indicesJPMCCI S&P GSCI DJ-AIGCI
1991 to Sep 2007Cum Roll -23.2% -108.5% -164.5%Average Ann Roll -0.5% -3.3% -4.1%Ann Roll Volatility 6.3% 11.5% 7.6%Source: JPMorgan and index sponsors
JPMCCI Aggregate: performance vs other indicesexcess returns
JPMCCI S&P GSCI DJ-AIGCIAnnual returns1990 10.4% 19.5% –1991 -15.1% -11.2% -10.8%1992 -0.7% 0.8% 0.1%1993 -6.2% -15.0% -4.0%1994 15.5% 0.8% 11.7%1995 3.3% 13.8% 8.9%1996 9.0% 27.2% 17.0%1997 -3.6% -18.4% -8.2%1998 -27.0% -38.8% -30.5%1999 18.0% 34.4% 18.6%2000 29.5% 41.1% 24.2%2001 -28.2% -34.3% -22.3%2002 22.3% 29.9% 23.9%2003 27.5% 19.5% 22.7%2004 21.4% 15.7% 7.6%2005 35.4% 21.6% 17.5%2006 0.8% -19.1% -2.7%Sep 2007 11.2% 14.6% 7.1%1991 to Sep 2007Cum return 127.9% 39.8% 78.3%Ann return 5.0% 2.0% 3.5%Volatility 12.8% 18.7% 12.2%Sharpe ratio 0.39 0.11 0.291997 to Sep 2007Cum return 121.8% 25.9% 46.1%Ann return 7.7% 2.2% 3.6%Volatility 14.9% 21.7% 14.2%Sharpe ratio 0.52 0.10 0.252002 to Sep 2007Cum return 187.5% 102.5% 100.2%Ann return 20.2% 13.1% 12.8%Volatility 15.4% 21.8% 13.7%Sharpe ratio 1.31 0.60 0.94Source: JPMorgan and index sponsors
JPMCCI Aggregate: performance vs other indicesindex, excess returns
Source: JPMorgan and index sponsors
0
50
100
150
200
250
300
91 94 97 00 03 06
JPMCCI S&P GSCI DJ-AIGCI

18
Global Commodity ResearchIntroducing the JPMorgan Commodity Curve IndexNovember 9, 2007
J.P. Morgan Securities Ltd.Jennie ByunAC (44-20) [email protected]
Gerald Tan (44-20) [email protected]
Energy sub-index
JPMCCI Energy: commodity weights (Sep 2007)
JPMCCI Energy: roll return vs other indices
• Performance. JPMCCI Energy produced an annualizedexcess return of 21.7% from 2002 to September 2007, with avolatility of 27.7%. This results in a Sharpe ratio of 0.79 forJPMCCI, compared to S&P GSCI (0.52) and DJ-AIGCI(0.36).
• Roll return. JPMCCI Energy average roll returns, on anannual basis, was -2.8% from 2002 to September 2007. Thedeferred part of the crude oil curve has remained inbackwardation even as the front end was in contango(2004 - July 2007); JPMCCI captures the benefits of thebackwardation at the back end while most indices do not.JPMCCI Energy average annual roll returns were 0.9%from 1997 to September 2007 and 2.3% from 1991 toSeptember 2007.
JPMCCI S&P GSCI DJ-AIGCI1991 to Sep 2007Cum Roll 32.1% -123.6% -163.9%Average Ann Roll 2.3% -1.9% -0.4%Ann Roll Volatility 15.6% 18.1% 21.3%Source: JPMorgan and index sponsors
cumulative roll returns
Source: JPMorgan and index sponsors
-200%
-150%
-100%
-50%
0%
50%
100%
150%
200%
91 94 97 00 03 06
JPMCCI S&P GSCI DJ-AIGCI
JPMCCI Energy: performance vs other indicesexcess returns
JPMCCI S&P GSCI DJ-AIGCIAnnual returns1990 43.1% 34.5% –1991 -23.0% -17.5% -16.0%1992 8.1% -2.5% 9.5%1993 -20.4% -35.7% -26.9%1994 2.7% 2.9% 10.9%1995 9.8% 21.2% 17.6%1996 58.5% 58.2% 78.2%1997 -14.2% -27.1% -26.5%1998 -40.1% -49.4% -48.7%1999 61.4% 83.5% 73.3%2000 101.7% 76.7% 107.6%2001 -41.5% -42.5% -39.3%2002 44.6% 48.3% 52.6%2003 30.2% 23.3% 30.4%2004 34.4% 24.3% 17.5%2005 50.4% 27.1% 37.7%2006 -27.1% -30.2% -44.2%Sep 2007 11.6% 16.3% 5.1%1991 to Sep 2007Cum return 258.8% 64.7% 143.1%Ann return 7.9% 3.0% 5.4%Volatility 25.2% 29.4% 29.7%Sharpe ratio 0.31 0.10 0.181997 to Sep 2007Cum return 203.2% 61.3% 55.5%Ann return 10.9% 4.5% 4.2%Volatility 28.4% 32.8% 33.9%Sharpe ratio 0.38 0.14 0.122002 to Sep 2007Cum return 209.8% 134.4% 88.9%Ann return 21.7% 16.0% 11.7%Volatility 27.7% 30.6% 32.7%Sharpe ratio 0.79 0.52 0.36Source: JPMorgan and index sponsors
JPMCCI Energy: performance vs other indicesindex, excess returns
Source: JPMorgan and index sponsors
050
100150200250300350400450500550600
91 94 97 00 03 06
JPMCCI S&P GSCI DJ-AIGCI
Source: JPMorgan
Crude Oil, 38.8%
Gasoline, 6.7%
Gas Oil, 7.8%
Heating Oil, 8.9%
Brent Crude, 16.0%
Natural Gas, 21.8%
19
Global Commodity ResearchIntroducing the JPMorgan Commodity Curve IndexNovember 9, 2007
J.P. Morgan Securities Ltd.Jennie ByunAC (44-20) [email protected]
Gerald Tan (44-20) [email protected]
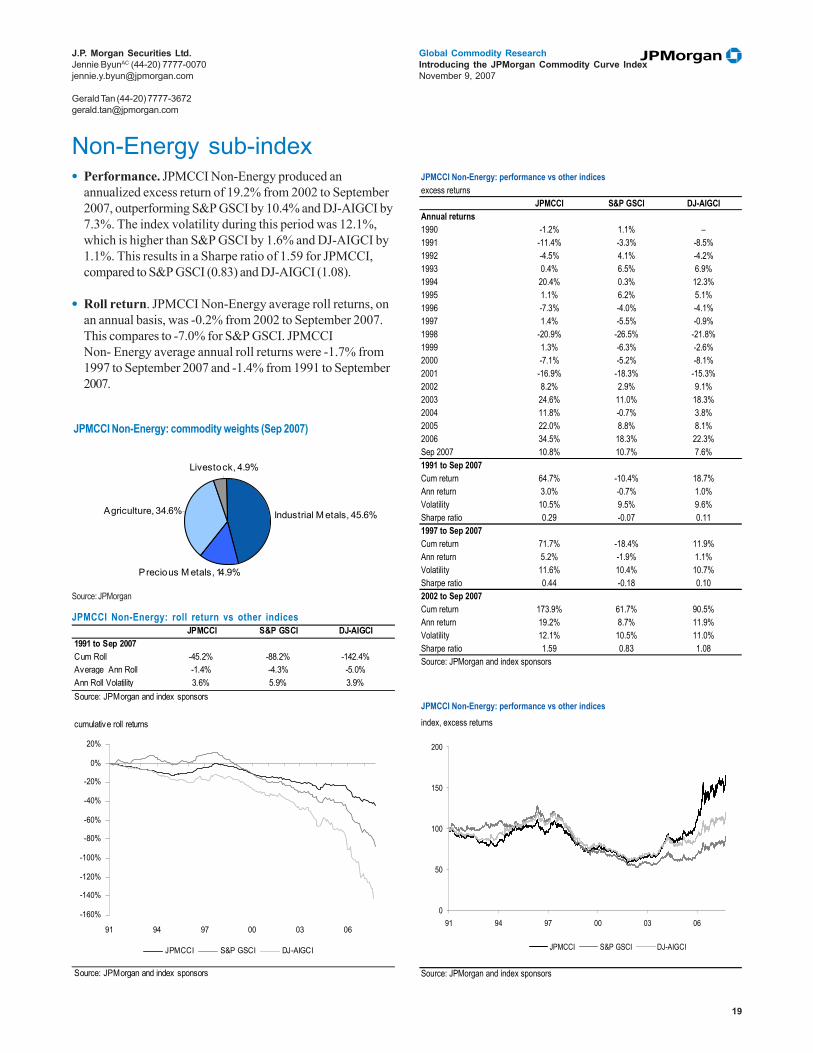
Non-Energy sub-index• Performance. JPMCCI Non-Energy produced an
annualized excess return of 19.2% from 2002 to September2007, outperforming S&P GSCI by 10.4% and DJ-AIGCI by7.3%. The index volatility during this period was 12.1%,which is higher than S&P GSCI by 1.6% and DJ-AIGCI by1.1%. This results in a Sharpe ratio of 1.59 for JPMCCI,compared to S&P GSCI (0.83) and DJ-AIGCI (1.08).
• Roll return. JPMCCI Non-Energy average roll returns, onan annual basis, was -0.2% from 2002 to September 2007.This compares to -7.0% for S&P GSCI. JPMCCINon- Energy average annual roll returns were -1.7% from1997 to September 2007 and -1.4% from 1991 to September2007.
JPMCCI Non-Energy: roll return vs other indices
JPMCCI Non-Energy: commodity weights (Sep 2007)
JPMCCI Non-Energy: performance vs other indicesexcess returns
JPMCCI S&P GSCI DJ-AIGCIAnnual returns1990 -1.2% 1.1% –1991 -11.4% -3.3% -8.5%1992 -4.5% 4.1% -4.2%1993 0.4% 6.5% 6.9%1994 20.4% 0.3% 12.3%1995 1.1% 6.2% 5.1%1996 -7.3% -4.0% -4.1%1997 1.4% -5.5% -0.9%1998 -20.9% -26.5% -21.8%1999 1.3% -6.3% -2.6%2000 -7.1% -5.2% -8.1%2001 -16.9% -18.3% -15.3%2002 8.2% 2.9% 9.1%2003 24.6% 11.0% 18.3%2004 11.8% -0.7% 3.8%2005 22.0% 8.8% 8.1%2006 34.5% 18.3% 22.3%Sep 2007 10.8% 10.7% 7.6%1991 to Sep 2007Cum return 64.7% -10.4% 18.7%Ann return 3.0% -0.7% 1.0%Volatility 10.5% 9.5% 9.6%Sharpe ratio 0.29 -0.07 0.111997 to Sep 2007Cum return 71.7% -18.4% 11.9%Ann return 5.2% -1.9% 1.1%Volatility 11.6% 10.4% 10.7%Sharpe ratio 0.44 -0.18 0.102002 to Sep 2007Cum return 173.9% 61.7% 90.5%Ann return 19.2% 8.7% 11.9%Volatility 12.1% 10.5% 11.0%Sharpe ratio 1.59 0.83 1.08Source: JPMorgan and index sponsors
JPMCCI Non-Energy: performance vs other indicesindex, excess returns
Source: JPMorgan and index sponsors
0
50
100
150
200
91 94 97 00 03 06
JPMCCI S&P GSCI DJ-AIGCI
JPMCCI S&P GSCI DJ-AIGCI1991 to Sep 2007Cum Roll -45.2% -88.2% -142.4%Average Ann Roll -1.4% -4.3% -5.0%Ann Roll Volatility 3.6% 5.9% 3.9%Source: JPMorgan and index sponsors
cumulative roll returns
Source: JPMorgan and index sponsors
-160%
-140%
-120%
-100%
-80%
-60%
-40%
-20%
0%
20%
91 94 97 00 03 06
JPMCCI S&P GSCI DJ-AIGCI
Source: JPMorgan
Precious M etals, 14.9%
Industrial M etals, 45.6%
Livestock, 4.9%
Agriculture, 34.6%

20
Global Commodity ResearchIntroducing the JPMorgan Commodity Curve IndexNovember 9, 2007
J.P. Morgan Securities Ltd.Jennie ByunAC (44-20) [email protected]
Gerald Tan (44-20) [email protected]
Precious Metals sub-index• Performance. JPMCCI Precious Metals produced an
annualized excess return of 15.6% from 2002 to September2007, outperforming S&P GSCI by 0.4% and similar to DJ-AIGCI. The index volatility during this period was 16.8%,higher than S&P GSCI by 1.4% and similar to DJ-AIGCI.This results in a Sharpe ratio of 0.93 for JPMCCI,compared to S&P GSCI (0.98) & DJ-AIGCI (0.92).
• Roll return. JPMCCI Precious Metals average roll return,on an annual basis, was -3.8% from 2002 to September2007. This compares to -4.0% for S&P GSCI. JPMCCIPrecious Metals average annual roll returns were -3.6%from 1997 to September 2007 and -3.8% from 1991 toSeptember 2007. The similar performance of the sectoracross indices is driven by the linear curve shape of goldand silver, which is primarily set off LIBOR interest rates.
JPMCCI Precious Metals: commodity weights (Sep 2007)
JPMCCI Precious Metals: performance vs other indicesexcess returns
JPMCCI S&P GSCI DJ-AIGCIAnnual returns1990 -13.9% -12.4% –1991 -15.0% -15.6% -13.3%1992 -9.6% -7.6% -9.2%1993 18.9% 16.0% 20.2%1994 -6.3% -5.4% -7.2%1995 -3.5% -3.6% -2.7%1996 -9.4% -8.9% -9.6%1997 -13.3% -18.4% -12.0%1998 -8.4% -5.5% -8.1%1999 -0.1% -0.9% -1.0%2000 -12.9% -6.9% -13.1%2001 -2.9% -3.0% -2.3%2002 16.6% 21.3% 16.9%2003 19.2% 18.3% 19.1%2004 6.2% 4.2% 5.9%2005 16.9% 14.9% 16.7%2006 21.7% 18.3% 21.2%Sep 2007 9.7% 11.0% 9.8%1991 to Sep 2007Cum return 15.7% 17.0% 20.3%Ann return 0.9% 0.9% 1.1%Volatility 14.7% 13.5% 14.8%Sharpe ratio 0.06 0.07 0.081997 to Sep 2007Cum return 54.5% 55.6% 55.7%Ann return 4.1% 4.2% 4.2%Volatility 15.9% 14.7% 15.9%Sharpe ratio 0.26 0.29 0.262002 to Sep 2007Cum return 130.3% 125.4% 128.9%Ann return 15.6% 15.2% 15.5%Volatility 16.8% 15.4% 16.9%Sharpe ratio 0.93 0.98 0.92Source: JPMorgan and index sponsors
JPMCCI Precious Metals: performance vs other indicesindex, excess returns
Source: JPMorgan and index sponsors
0
50
100
150
91 94 97 00 03 06
JPMCCI S&P GSCI DJ-AIGCI
JPMCCI S&P GSCI DJ-AIGCI1991 to Sep 2007Cum Roll -99.6% -91.5% -111.6%Average Ann Roll -3.8% -3.6% -4.1%Ann Roll Volatility 1.5% 1.6% 1.5%Source: JPMorgan and index sponsors
cumulative roll returns
Source: JPMorgan and index sponsors
-120%
-100%
-80%
-60%
-40%
-20%
0%
91 94 97 00 03 06
JPMCCI S&P GSCI DJ-AIGCI
JPMCCI Precious Metals: roll return vs other indices
Source: JPMorgan
Silver, 24.8%
Gold, 71.9%
Palladium, 1.3%Platinum, 2.0%
21
Global Commodity ResearchIntroducing the JPMorgan Commodity Curve IndexNovember 9, 2007
J.P. Morgan Securities Ltd.Jennie ByunAC (44-20) [email protected]
Gerald Tan (44-20) [email protected]
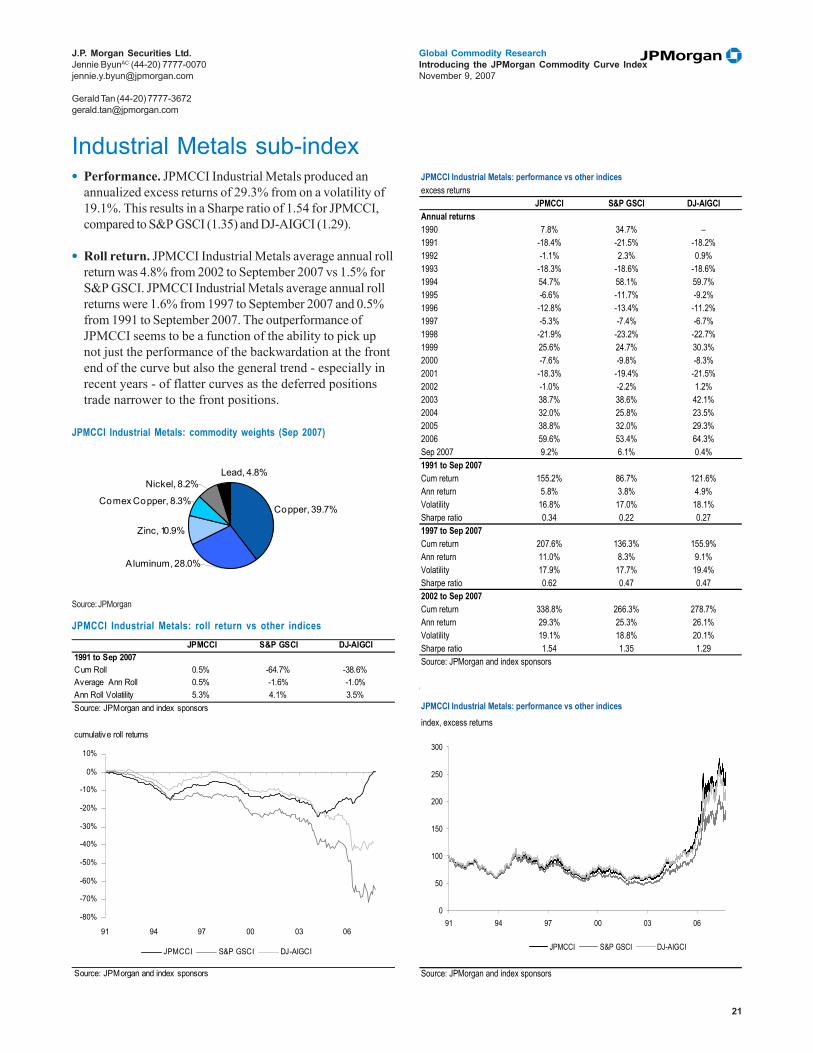
Industrial Metals sub-index
JPMCCI Industrial Metals: roll return vs other indices
• Performance. JPMCCI Industrial Metals produced anannualized excess returns of 29.3% from on a volatility of19.1%. This results in a Sharpe ratio of 1.54 for JPMCCI,compared to S&P GSCI (1.35) and DJ-AIGCI (1.29).
• Roll return. JPMCCI Industrial Metals average annual rollreturn was 4.8% from 2002 to September 2007 vs 1.5% forS&P GSCI. JPMCCI Industrial Metals average annual rollreturns were 1.6% from 1997 to September 2007 and 0.5%from 1991 to September 2007. The outperformance ofJPMCCI seems to be a function of the ability to pick upnot just the performance of the backwardation at the frontend of the curve but also the general trend - especially inrecent years - of flatter curves as the deferred positionstrade narrower to the front positions.
JPMCCI Industrial Metals: Commodity weights (Sep 2007)
JPMCCI Industrial Metals: performance vs other indicesexcess returns
JPMCCI S&P GSCI DJ-AIGCIAnnual returns1990 7.8% 34.7% –1991 -18.4% -21.5% -18.2%1992 -1.1% 2.3% 0.9%1993 -18.3% -18.6% -18.6%1994 54.7% 58.1% 59.7%1995 -6.6% -11.7% -9.2%1996 -12.8% -13.4% -11.2%1997 -5.3% -7.4% -6.7%1998 -21.9% -23.2% -22.7%1999 25.6% 24.7% 30.3%2000 -7.6% -9.8% -8.3%2001 -18.3% -19.4% -21.5%2002 -1.0% -2.2% 1.2%2003 38.7% 38.6% 42.1%2004 32.0% 25.8% 23.5%2005 38.8% 32.0% 29.3%2006 59.6% 53.4% 64.3%Sep 2007 9.2% 6.1% 0.4%1991 to Sep 2007Cum return 155.2% 86.7% 121.6%Ann return 5.8% 3.8% 4.9%Volatility 16.8% 17.0% 18.1%Sharpe ratio 0.34 0.22 0.271997 to Sep 2007Cum return 207.6% 136.3% 155.9%Ann return 11.0% 8.3% 9.1%Volatility 17.9% 17.7% 19.4%Sharpe ratio 0.62 0.47 0.472002 to Sep 2007Cum return 338.8% 266.3% 278.7%Ann return 29.3% 25.3% 26.1%Volatility 19.1% 18.8% 20.1%Sharpe ratio 1.54 1.35 1.29Source: JPMorgan and index sponsors
JPMCCI Industrial Metals: performance vs other indicesindex, excess returns
Source: JPMorgan and index sponsors
0
50
100
150
200
250
300
91 94 97 00 03 06
JPMCCI S&P GSCI DJ-AIGCI
JPMCCI S&P GSCI DJ-AIGCI1991 to Sep 2007Cum Roll 0.5% -64.7% -38.6%Average Ann Roll 0.5% -1.6% -1.0%Ann Roll Volatility 5.3% 4.1% 3.5%Source: JPMorgan and index sponsors
cumulative roll returns
Source: JPMorgan and index sponsors
-80%
-70%
-60%
-50%
-40%
-30%
-20%
-10%
0%
10%
91 94 97 00 03 06
JPMCCI S&P GSCI DJ-AIGCI
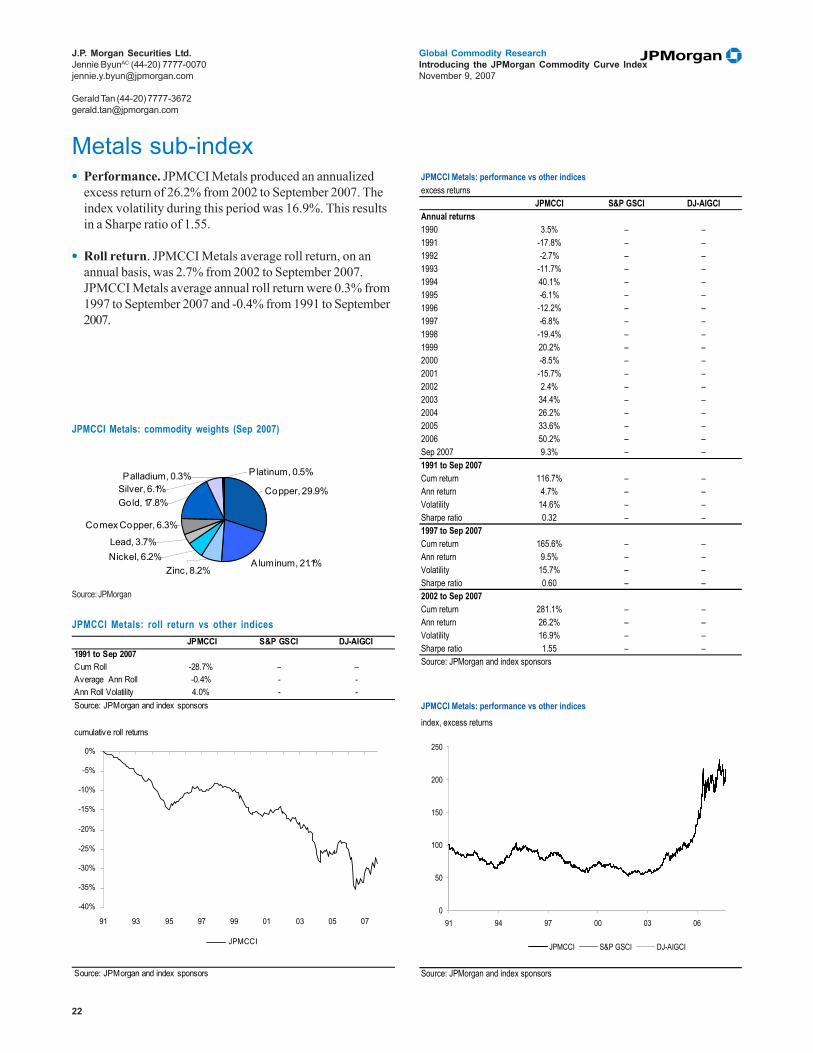
JPMCCI Industrial Metals: commodity weights (Sep 2007)
Source: JPMorgan
Aluminum, 28.0%
Zinc, 10.9%
Comex Copper, 8.3%
Nickel, 8.2%Lead, 4.8%
Copper, 39.7%
22
Global Commodity ResearchIntroducing the JPMorgan Commodity Curve IndexNovember 9, 2007
J.P. Morgan Securities Ltd.Jennie ByunAC (44-20) [email protected]
Gerald Tan (44-20) [email protected]
Metals sub-index• Performance. JPMCCI Metals produced an annualized
excess return of 26.2% from 2002 to September 2007. Theindex volatility during this period was 16.9%. This resultsin a Sharpe ratio of 1.55.
• Roll return. JPMCCI Metals average roll return, on anannual basis, was 2.7% from 2002 to September 2007.JPMCCI Metals average annual roll return were 0.3% from1997 to September 2007 and -0.4% from 1991 to September2007.
JPMCCI Metals: roll return vs other indices
JPMCCI Metals: commodity weights (Sep 2007)
JPMCCI Metals: performance vs other indicesexcess returns
JPMCCI S&P GSCI DJ-AIGCIAnnual returns1990 3.5% – –1991 -17.8% – –1992 -2.7% – –1993 -11.7% – –1994 40.1% – –1995 -6.1% – –1996 -12.2% – –1997 -6.8% – –1998 -19.4% – –1999 20.2% – –2000 -8.5% – –2001 -15.7% – –2002 2.4% – –2003 34.4% – –2004 26.2% – –2005 33.6% – –2006 50.2% – –Sep 2007 9.3% – –1991 to Sep 2007Cum return 116.7% – –Ann return 4.7% – –Volatility 14.6% – –Sharpe ratio 0.32 – –1997 to Sep 2007Cum return 165.6% – –Ann return 9.5% – –Volatility 15.7% – –Sharpe ratio 0.60 – –2002 to Sep 2007Cum return 281.1% – –Ann return 26.2% – –Volatility 16.9% – –Sharpe ratio 1.55 – –Source: JPMorgan and index sponsors
JPMCCI Metals: performance vs other indicesindex, excess returns
Source: JPMorgan and index sponsors
0
50
100
150
200
250
91 94 97 00 03 06
JPMCCI S&P GSCI DJ-AIGCI
Source: JPMorgan
JPMCCI S&P GSCI DJ-AIGCI1991 to Sep 2007Cum Roll -28.7% – –Average Ann Roll -0.4% - -Ann Roll Volatility 4.0% - -Source: JPMorgan and index sponsors
cumulative roll returns
Source: JPMorgan and index sponsors
-40%
-35%
-30%
-25%
-20%
-15%
-10%
-5%
0%
91 93 95 97 99 01 03 05 07
JPMCCI
Aluminum, 21.1%Zinc, 8.2%
Nickel, 6.2%Lead, 3.7%
Silver, 6.1%
Comex Copper, 6.3%
Gold, 17.8%Copper, 29.9%
Platinum, 0.5%Palladium, 0.3%
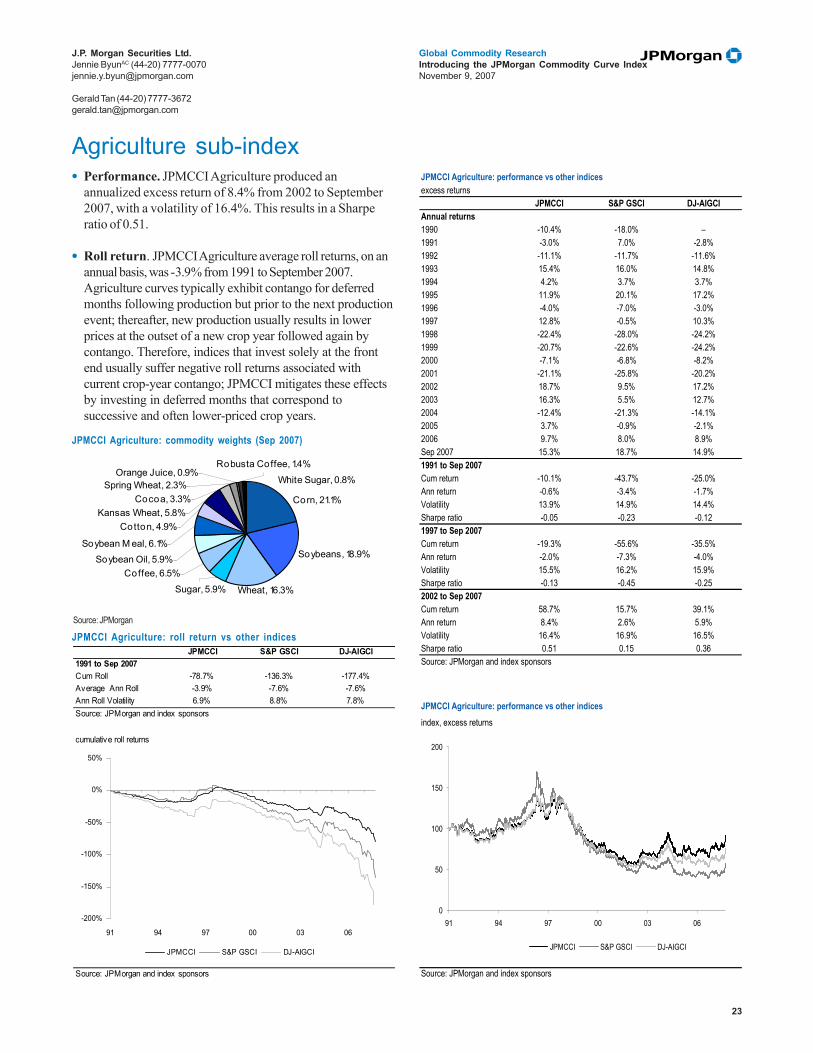
23
Global Commodity ResearchIntroducing the JPMorgan Commodity Curve IndexNovember 9, 2007
J.P. Morgan Securities Ltd.Jennie ByunAC (44-20) [email protected]
Gerald Tan (44-20) [email protected]
Agriculture sub-index• Performance. JPMCCI Agriculture produced an
annualized excess return of 8.4% from 2002 to September2007, with a volatility of 16.4%. This results in a Sharperatio of 0.51.
• Roll return. JPMCCI Agriculture average roll returns, on anannual basis, was -3.9% from 1991 to September 2007.Agriculture curves typically exhibit contango for deferredmonths following production but prior to the next productionevent; thereafter, new production usually results in lowerprices at the outset of a new crop year followed again bycontango. Therefore, indices that invest solely at the frontend usually suffer negative roll returns associated withcurrent crop-year contango; JPMCCI mitigates these effectsby investing in deferred months that correspond tosuccessive and often lower-priced crop years.
JPMCCI Agriculture: roll return vs other indices
JPMCCI Agriculture: commodity weights (Sep 2007)
JPMCCI Agriculture: performance vs other indicesexcess returns
JPMCCI S&P GSCI DJ-AIGCIAnnual returns1990 -10.4% -18.0% –1991 -3.0% 7.0% -2.8%1992 -11.1% -11.7% -11.6%1993 15.4% 16.0% 14.8%1994 4.2% 3.7% 3.7%1995 11.9% 20.1% 17.2%1996 -4.0% -7.0% -3.0%1997 12.8% -0.5% 10.3%1998 -22.4% -28.0% -24.2%1999 -20.7% -22.6% -24.2%2000 -7.1% -6.8% -8.2%2001 -21.1% -25.8% -20.2%2002 18.7% 9.5% 17.2%2003 16.3% 5.5% 12.7%2004 -12.4% -21.3% -14.1%2005 3.7% -0.9% -2.1%2006 9.7% 8.0% 8.9%Sep 2007 15.3% 18.7% 14.9%1991 to Sep 2007Cum return -10.1% -43.7% -25.0%Ann return -0.6% -3.4% -1.7%Volatility 13.9% 14.9% 14.4%Sharpe ratio -0.05 -0.23 -0.121997 to Sep 2007Cum return -19.3% -55.6% -35.5%Ann return -2.0% -7.3% -4.0%Volatility 15.5% 16.2% 15.9%Sharpe ratio -0.13 -0.45 -0.252002 to Sep 2007Cum return 58.7% 15.7% 39.1%Ann return 8.4% 2.6% 5.9%Volatility 16.4% 16.9% 16.5%Sharpe ratio 0.51 0.15 0.36Source: JPMorgan and index sponsors
JPMCCI Agriculture: performance vs other indicesindex, excess returns
Source: JPMorgan and index sponsors
0
50
100
150
200
91 94 97 00 03 06
JPMCCI S&P GSCI DJ-AIGCI
JPMCCI S&P GSCI DJ-AIGCI1991 to Sep 2007Cum Roll -78.7% -136.3% -177.4%Average Ann Roll -3.9% -7.6% -7.6%Ann Roll Volatility 6.9% 8.8% 7.8%Source: JPMorgan and index sponsors
cumulative roll returns
Source: JPMorgan and index sponsors
-200%
-150%
-100%
-50%
0%
50%
91 94 97 00 03 06
JPMCCI S&P GSCI DJ-AIGCI
Source: JPMorgan
Soybeans, 18.9%
Wheat, 16.3%Sugar, 5.9%
Coffee, 6.5%
Cotton, 4.9%
Soybean Oil, 5.9%Soybean M eal, 6.1%
Corn, 21.1%Kansas Wheat, 5.8%
Robusta Coffee, 1.4%Orange Juice, 0.9%
Cocoa, 3.3%Spring Wheat, 2.3% White Sugar, 0.8%
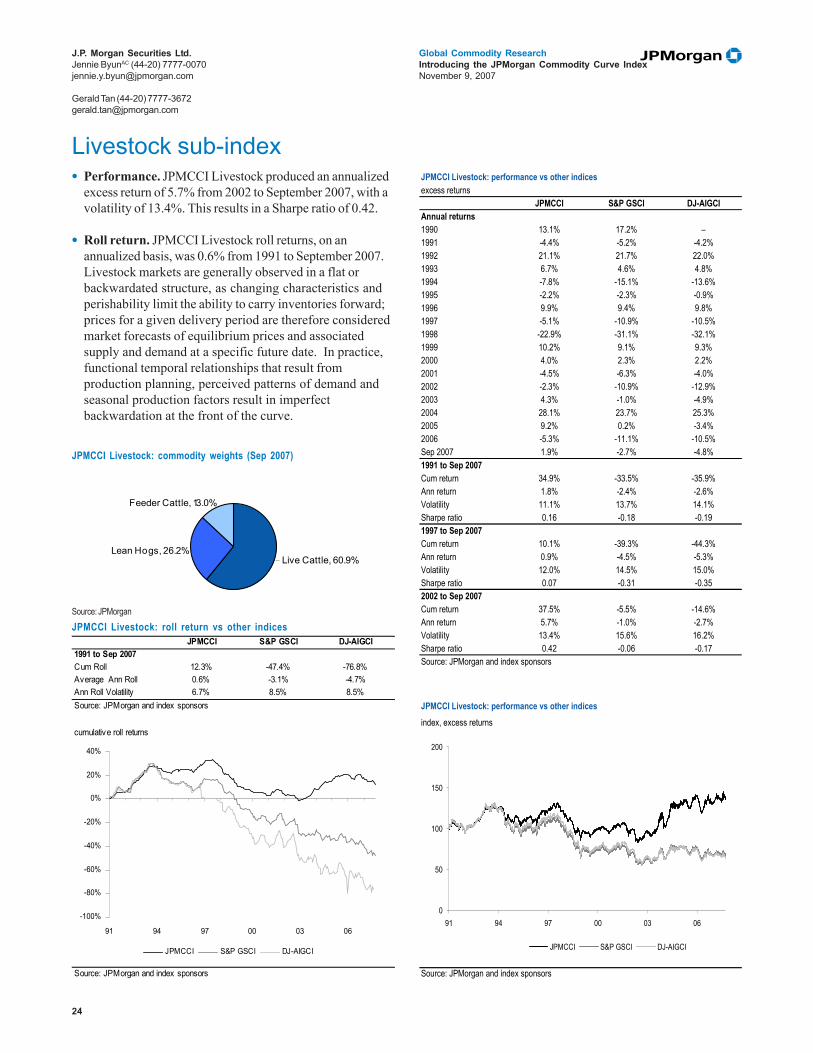
24
Global Commodity ResearchIntroducing the JPMorgan Commodity Curve IndexNovember 9, 2007
J.P. Morgan Securities Ltd.Jennie ByunAC (44-20) [email protected]
Gerald Tan (44-20) [email protected]
Livestock sub-index
JPMCCI Livestock: roll return vs other indices
• Performance. JPMCCI Livestock produced an annualizedexcess return of 5.7% from 2002 to September 2007, with avolatility of 13.4%. This results in a Sharpe ratio of 0.42.
• Roll return. JPMCCI Livestock roll returns, on anannualized basis, was 0.6% from 1991 to September 2007.Livestock markets are generally observed in a flat orbackwardated structure, as changing characteristics andperishability limit the ability to carry inventories forward;prices for a given delivery period are therefore consideredmarket forecasts of equilibrium prices and associatedsupply and demand at a specific future date. In practice,functional temporal relationships that result fromproduction planning, perceived patterns of demand andseasonal production factors result in imperfectbackwardation at the front of the curve.
JPMCCI Livestock: commodity weights (Sep 2007)
Source: JPMorgan
JPMCCI S&P GSCI DJ-AIGCI1991 to Sep 2007Cum Roll 12.3% -47.4% -76.8%Average Ann Roll 0.6% -3.1% -4.7%Ann Roll Volatility 6.7% 8.5% 8.5%Source: JPMorgan and index sponsors
cumulative roll returns
Source: JPMorgan and index sponsors
-100%
-80%
-60%
-40%
-20%
0%
20%
40%
91 94 97 00 03 06
JPMCCI S&P GSCI DJ-AIGCI
JPMCCI Livestock: performance vs other indicesexcess returns
JPMCCI S&P GSCI DJ-AIGCIAnnual returns1990 13.1% 17.2% –1991 -4.4% -5.2% -4.2%1992 21.1% 21.7% 22.0%1993 6.7% 4.6% 4.8%1994 -7.8% -15.1% -13.6%1995 -2.2% -2.3% -0.9%1996 9.9% 9.4% 9.8%1997 -5.1% -10.9% -10.5%1998 -22.9% -31.1% -32.1%1999 10.2% 9.1% 9.3%2000 4.0% 2.3% 2.2%2001 -4.5% -6.3% -4.0%2002 -2.3% -10.9% -12.9%2003 4.3% -1.0% -4.9%2004 28.1% 23.7% 25.3%2005 9.2% 0.2% -3.4%2006 -5.3% -11.1% -10.5%Sep 2007 1.9% -2.7% -4.8%1991 to Sep 2007Cum return 34.9% -33.5% -35.9%Ann return 1.8% -2.4% -2.6%Volatility 11.1% 13.7% 14.1%Sharpe ratio 0.16 -0.18 -0.191997 to Sep 2007Cum return 10.1% -39.3% -44.3%Ann return 0.9% -4.5% -5.3%Volatility 12.0% 14.5% 15.0%Sharpe ratio 0.07 -0.31 -0.352002 to Sep 2007Cum return 37.5% -5.5% -14.6%Ann return 5.7% -1.0% -2.7%Volatility 13.4% 15.6% 16.2%Sharpe ratio 0.42 -0.06 -0.17Source: JPMorgan and index sponsors
JPMCCI Livestock: performance vs other indicesindex, excess returns
Source: JPMorgan and index sponsors
0
50
100
150
200
91 94 97 00 03 06
JPMCCI S&P GSCI DJ-AIGCI
Lean Hogs, 26.2%Live Cattle, 60.9%
Feeder Cattle, 13.0%

25
Global Commodity ResearchIntroducing the JPMorgan Commodity Curve IndexNovember 9, 2007
J.P. Morgan Securities Ltd.Jennie ByunAC (44-20) [email protected]
Gerald Tan (44-20) [email protected]
Energy – NYMEX Crude Oil
• Distribution along the curve. Open interest grew by 6.4%from 1996 to 2001, and grew by 110.5% from 2001 to 2006,based on the 12 frontmost contracts. In the later period,open interest grew the most in the middle part of thecurve. In 2006, open interest in the two frontmostcontracts accounted for 50.6% of open interest in the 12frontmost contracts, virtually similar to 2001, suggestingthat the concentration of positions at the front end of thecurve has not changed meaningfully.
• Performance. JPMCCI Crude Oil produced an annualizedexcess return of 28.3% from 2002 to September 2007,outperforming S&P GSCI by 6.8% and DJ-AIGCI by 3.3%.The index volatility during this period was 25.3%, which islower than S&P GSCI by 3.7% and DJ-AIGCI by 3.1%.This results in a Sharpe ratio of 1.12 for JPMCCI,compared to S&P GSCI (0.74) and DJ-AIGCI (0.88).
• Roll return. JPMCCI Crude Oil average roll returns, on anannual basis, was 1.8% from 2002 to September 2007. Thiscompares to -6.0% for S&P GSCI. JPMCCI Crude Oilaverage annual roll returns were 4.0% from 1997 toSeptember 2007 and 5.5% from 1991 to September 2007.
Crude Oil: average of daily open interest along the curvethousand contracts
Source: JPMorgan, Bloomberg
0
50
100
150
200
250
CL1 CL2 CL3 CL4 CL5 CL6 CL7 CL8 CL9 CL10 CL11 CL12
1996 2001 2006
JPMCCI Crude Oil: performance vs other indicesexcess returns
JPMCCI S&P GSCI DJ-AIGCIAnnual returns1990 36.1% 35.6% –1991 -19.9% -21.1% -13.5%1992 3.0% 0.1% 2.9%1993 -31.1% -37.2% -34.4%1994 20.1% 32.9% 25.4%1995 12.1% 26.3% 21.6%1996 66.1% 97.8% 98.5%1997 -23.1% -34.5% -32.4%1998 -43.1% -50.1% -50.4%1999 97.9% 112.4% 111.4%2000 38.7% 42.0% 33.0%2001 -17.4% -28.0% -24.9%2002 50.5% 55.7% 55.0%2003 31.9% 26.2% 33.2%2004 52.8% 42.8% 47.2%2005 33.7% 17.4% 21.9%2006 -11.1% -20.8% -16.7%Sep 2007 16.5% 17.7% 17.2%1991 to Sep 2007Cum return 428.7% 258.0% 353.1%Ann return 10.5% 7.9% 9.4%Volatility 25.4% 30.4% 29.4%Sharpe ratio 0.41 0.26 0.321997 to Sep 2007Cum return 315.7% 117.3% 156.5%Ann return 14.2% 7.5% 9.2%Volatility 27.9% 33.5% 32.7%Sharpe ratio 0.51 0.22 0.282002 to Sep 2007Cum return 319.5% 206.7% 261.7%Ann return 28.3% 21.5% 25.1%Volatility 25.3% 29.0% 28.3%Sharpe ratio 1.12 0.74 0.88Source: JPMorgan and index sponsors
JPMCCI Crude Oil: performance vs other indicesindex, excess returns
Source: JPMorgan and index sponsors
0
50
100
150
200
250
300
350
400
450
500
Dec 01 Dec 02 Dec 03 Dec 04 Dec 05 Dec 06
JPMCCI S&P GSCI DJ-AIGCI
JPMCCI S&P GSCI DJ-AIGCI1991 to Sep 2007Cum Roll 240.9% 70.8% –Average Ann Roll 5.5% 4.0% –Ann Roll Volatility 14.9% 22.8% –Source: JPMorgan and index sponsors
JPMCCI Crude Oil: roll return vs other indices
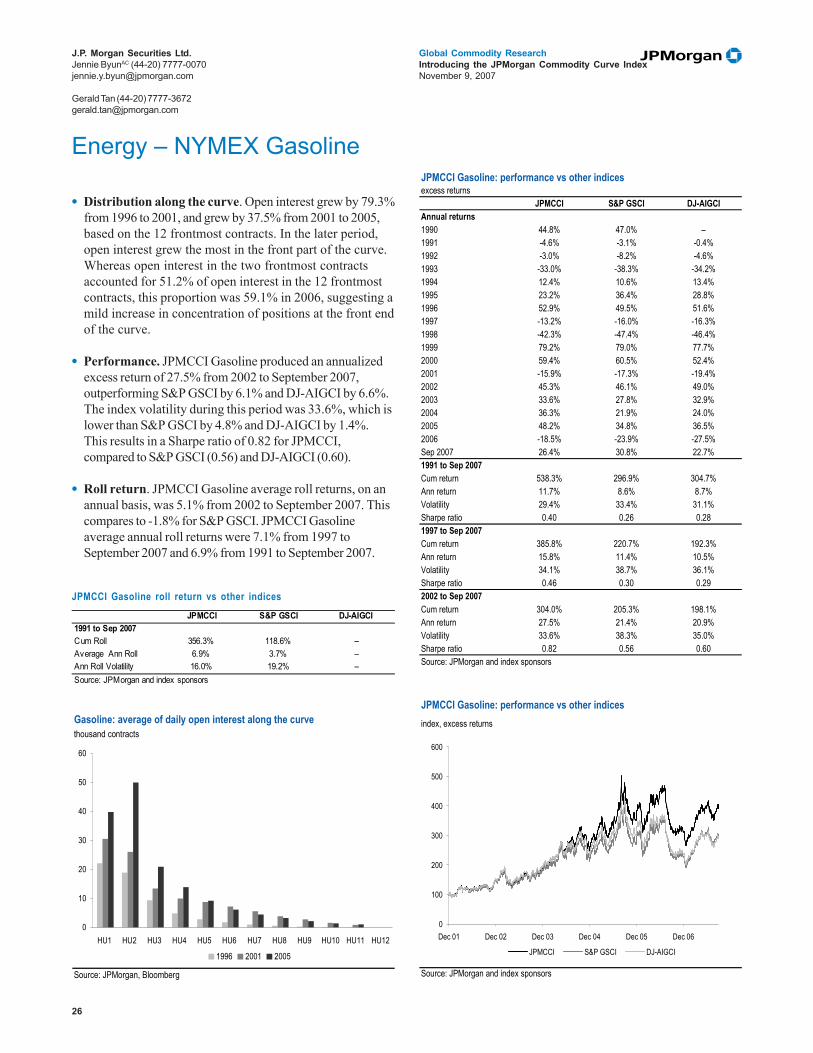
26
Global Commodity ResearchIntroducing the JPMorgan Commodity Curve IndexNovember 9, 2007
J.P. Morgan Securities Ltd.Jennie ByunAC (44-20) [email protected]
Gerald Tan (44-20) [email protected]
Energy – NYMEX Gasoline
• Distribution along the curve. Open interest grew by 79.3%from 1996 to 2001, and grew by 37.5% from 2001 to 2005,based on the 12 frontmost contracts. In the later period,open interest grew the most in the front part of the curve.Whereas open interest in the two frontmost contractsaccounted for 51.2% of open interest in the 12 frontmostcontracts, this proportion was 59.1% in 2006, suggesting amild increase in concentration of positions at the front endof the curve.
• Performance. JPMCCI Gasoline produced an annualizedexcess return of 27.5% from 2002 to September 2007,outperforming S&P GSCI by 6.1% and DJ-AIGCI by 6.6%.The index volatility during this period was 33.6%, which islower than S&P GSCI by 4.8% and DJ-AIGCI by 1.4%.This results in a Sharpe ratio of 0.82 for JPMCCI,compared to S&P GSCI (0.56) and DJ-AIGCI (0.60).
• Roll return. JPMCCI Gasoline average roll returns, on anannual basis, was 5.1% from 2002 to September 2007. Thiscompares to -1.8% for S&P GSCI. JPMCCI Gasolineaverage annual roll returns were 7.1% from 1997 toSeptember 2007 and 6.9% from 1991 to September 2007.
Gasoline: average of daily open interest along the curvethousand contracts
Source: JPMorgan, Bloomberg
0
10
20
30
40
50
60
HU1 HU2 HU3 HU4 HU5 HU6 HU7 HU8 HU9 HU10 HU11 HU12
1996 2001 2005
JPMCCI Gasoline: performance vs other indicesexcess returns
JPMCCI S&P GSCI DJ-AIGCIAnnual returns1990 44.8% 47.0% –1991 -4.6% -3.1% -0.4%1992 -3.0% -8.2% -4.6%1993 -33.0% -38.3% -34.2%1994 12.4% 10.6% 13.4%1995 23.2% 36.4% 28.8%1996 52.9% 49.5% 51.6%1997 -13.2% -16.0% -16.3%1998 -42.3% -47.4% -46.4%1999 79.2% 79.0% 77.7%2000 59.4% 60.5% 52.4%2001 -15.9% -17.3% -19.4%2002 45.3% 46.1% 49.0%2003 33.6% 27.8% 32.9%2004 36.3% 21.9% 24.0%2005 48.2% 34.8% 36.5%2006 -18.5% -23.9% -27.5%Sep 2007 26.4% 30.8% 22.7%1991 to Sep 2007Cum return 538.3% 296.9% 304.7%Ann return 11.7% 8.6% 8.7%Volatility 29.4% 33.4% 31.1%Sharpe ratio 0.40 0.26 0.281997 to Sep 2007Cum return 385.8% 220.7% 192.3%Ann return 15.8% 11.4% 10.5%Volatility 34.1% 38.7% 36.1%Sharpe ratio 0.46 0.30 0.292002 to Sep 2007Cum return 304.0% 205.3% 198.1%Ann return 27.5% 21.4% 20.9%Volatility 33.6% 38.3% 35.0%Sharpe ratio 0.82 0.56 0.60Source: JPMorgan and index sponsors
JPMCCI Gasoline: performance vs other indicesindex, excess returns
Source: JPMorgan and index sponsors
0
100
200
300
400
500
600
Dec 01 Dec 02 Dec 03 Dec 04 Dec 05 Dec 06
JPMCCI S&P GSCI DJ-AIGCI
JPMCCI S&P GSCI DJ-AIGCI1991 to Sep 2007Cum Roll 356.3% 118.6% –Average Ann Roll 6.9% 3.7% –Ann Roll Volatility 16.0% 19.2% –Source: JPMorgan and index sponsors
JPMCCI Gasoline roll return vs other indices

27
Global Commodity ResearchIntroducing the JPMorgan Commodity Curve IndexNovember 9, 2007
J.P. Morgan Securities Ltd.Jennie ByunAC (44-20) [email protected]
Gerald Tan (44-20) [email protected]
Energy – NYMEX Heating Oil
• Distribution along the curve. Open interest grew by 25.1%from 1996 to 2001, and grew by 28.9% from 2001 to 2006,based on the 12 frontmost contracts. In the later period,open interest grew the most in the front part of the curve.Whereas open interest in the two frontmost contractsaccounted for 42.0% of open interest in the 12 frontmostcontracts, this proportion was 51.8% in 2006, suggesting amild increase in concentration of positions at the front endof the curve.
• Performance. JPMCCI Heating Oil produced anannualized excess return of 26.9% from 2002 to September2007, outperforming S&P GSCI by 7.9% and DJ-AIGCI by4.1%. The index volatility during this period was 27.9%,which is lower than S&P GSCI by 3.5% and DJ-AIGCI by2.2%. This results in a Sharpe ratio of 0.96 for JPMCCI,compared to S&P GSCI (0.60) and DJ-AIGCI (0.76).
• Roll return. JPMCCI Heating Oil average roll returns, onan annual basis, was 0.2% from 2002 to September 2007.This compares to -7.5% for S&P GSCI. JPMCCI HeatingOil average annual roll returns were 0.8% from 1997 toSeptember 2007 and 1.8% from 1991 to September 2007.
Heating Oil: average of daily open interest along the curvethousand contracts
Source: JPMorgan, Bloomberg
0
10
20
30
40
50
60
70
HO1 HO2 HO3 HO4 HO5 HO6 HO7 HO8 HO9 HO10 HO11 HO12
1996 2001 2006
JPMCCI Heating Oil: performance vs other indicesexcess returns
JPMCCI S&P GSCI DJ-AIGCIAnnual returns1990 26.1% 22.7% –1991 -23.7% -27.5% -16.6%1992 4.7% 1.8% 3.5%1993 -27.8% -31.0% -30.8%1994 9.9% 20.0% 14.0%1995 4.9% 7.7% 8.2%1996 56.9% 67.4% 69.7%1997 -27.3% -35.1% -31.1%1998 -46.1% -50.5% -50.9%1999 68.2% 73.9% 68.2%2000 62.6% 66.7% 64.5%2001 -28.2% -36.6% -33.5%2002 43.4% 41.4% 43.3%2003 29.0% 21.9% 28.6%2004 53.0% 39.5% 45.1%2005 43.4% 25.8% 32.0%2006 -21.1% -29.4% -26.2%Sep 2007 22.8% 27.1% 24.8%1991 to Sep 2007Cum return 216.0% 76.7% 153.6%Ann return 7.1% 3.5% 5.7%Volatility 27.1% 31.1% 29.8%Sharpe ratio 0.26 0.11 0.191997 to Sep 2007Cum return 202.6% 60.3% 102.7%Ann return 10.8% 4.5% 6.8%Volatility 30.5% 34.6% 33.5%Sharpe ratio 0.36 0.13 0.202002 to Sep 2007Cum return 293.5% 171.4% 225.3%Ann return 26.9% 19.0% 22.8%Volatility 27.9% 31.5% 30.1%Sharpe ratio 0.96 0.60 0.76Source: JPMorgan and index sponsors
JPMCCI Heating Oil: performance vs other indicesindex, excess returns
Source: JPMorgan and index sponsors
0
100
200
300
400
500
600
Dec 01 Dec 02 Dec 03 Dec 04 Dec 05 Dec 06
JPMCCI S&P GSCI DJ-AIGCI
JPMCCI S&P GSCI DJ-AIGCI1991 to Sep 2007Cum Roll 22.1% -104.4% –Average Ann Roll 1.8% -1.4% –Ann Roll Volatility 16.1% 19.2% –Source: JPMorgan and index sponsors
JPMCCI Heating Oil: roll return vs other indices
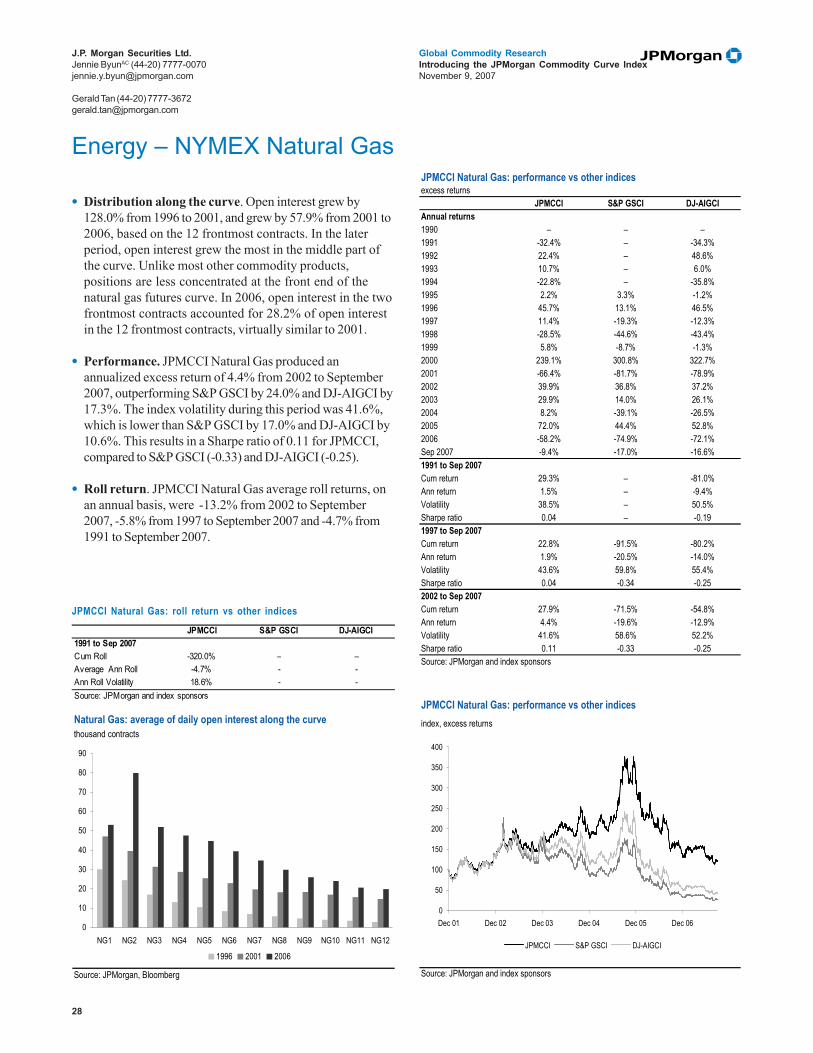
28
Global Commodity ResearchIntroducing the JPMorgan Commodity Curve IndexNovember 9, 2007
J.P. Morgan Securities Ltd.Jennie ByunAC (44-20) [email protected]
Gerald Tan (44-20) [email protected]
Energy – NYMEX Natural Gas
• Distribution along the curve. Open interest grew by128.0% from 1996 to 2001, and grew by 57.9% from 2001 to2006, based on the 12 frontmost contracts. In the laterperiod, open interest grew the most in the middle part ofthe curve. Unlike most other commodity products,positions are less concentrated at the front end of thenatural gas futures curve. In 2006, open interest in the twofrontmost contracts accounted for 28.2% of open interestin the 12 frontmost contracts, virtually similar to 2001.
• Performance. JPMCCI Natural Gas produced anannualized excess return of 4.4% from 2002 to September2007, outperforming S&P GSCI by 24.0% and DJ-AIGCI by17.3%. The index volatility during this period was 41.6%,which is lower than S&P GSCI by 17.0% and DJ-AIGCI by10.6%. This results in a Sharpe ratio of 0.11 for JPMCCI,compared to S&P GSCI (-0.33) and DJ-AIGCI (-0.25).
• Roll return. JPMCCI Natural Gas average roll returns, onan annual basis, were -13.2% from 2002 to September2007, -5.8% from 1997 to September 2007 and -4.7% from1991 to September 2007.
Natural Gas: average of daily open interest along the curvethousand contracts
Source: JPMorgan, Bloomberg
0
10
20
30
40
50
60
70
80
90
NG1 NG2 NG3 NG4 NG5 NG6 NG7 NG8 NG9 NG10 NG11 NG12
1996 2001 2006
JPMCCI S&P GSCI DJ-AIGCI1991 to Sep 2007Cum Roll -320.0% – –Average Ann Roll -4.7% - -Ann Roll Volatility 18.6% - -Source: JPMorgan and index sponsors
JPMCCI Natural Gas: roll return vs other indices
JPMCCI Natural Gas: performance vs other indicesexcess returns
JPMCCI S&P GSCI DJ-AIGCIAnnual returns1990 – – –1991 -32.4% – -34.3%1992 22.4% – 48.6%1993 10.7% – 6.0%1994 -22.8% – -35.8%1995 2.2% 3.3% -1.2%1996 45.7% 13.1% 46.5%1997 11.4% -19.3% -12.3%1998 -28.5% -44.6% -43.4%1999 5.8% -8.7% -1.3%2000 239.1% 300.8% 322.7%2001 -66.4% -81.7% -78.9%2002 39.9% 36.8% 37.2%2003 29.9% 14.0% 26.1%2004 8.2% -39.1% -26.5%2005 72.0% 44.4% 52.8%2006 -58.2% -74.9% -72.1%Sep 2007 -9.4% -17.0% -16.6%1991 to Sep 2007Cum return 29.3% – -81.0%Ann return 1.5% – -9.4%Volatility 38.5% – 50.5%Sharpe ratio 0.04 – -0.191997 to Sep 2007Cum return 22.8% -91.5% -80.2%Ann return 1.9% -20.5% -14.0%Volatility 43.6% 59.8% 55.4%Sharpe ratio 0.04 -0.34 -0.252002 to Sep 2007Cum return 27.9% -71.5% -54.8%Ann return 4.4% -19.6% -12.9%Volatility 41.6% 58.6% 52.2%Sharpe ratio 0.11 -0.33 -0.25Source: JPMorgan and index sponsors
JPMCCI Natural Gas: performance vs other indicesindex, excess returns
Source: JPMorgan and index sponsors
0
50
100
150
200
250
300
350
400
Dec 01 Dec 02 Dec 03 Dec 04 Dec 05 Dec 06
JPMCCI S&P GSCI DJ-AIGCI
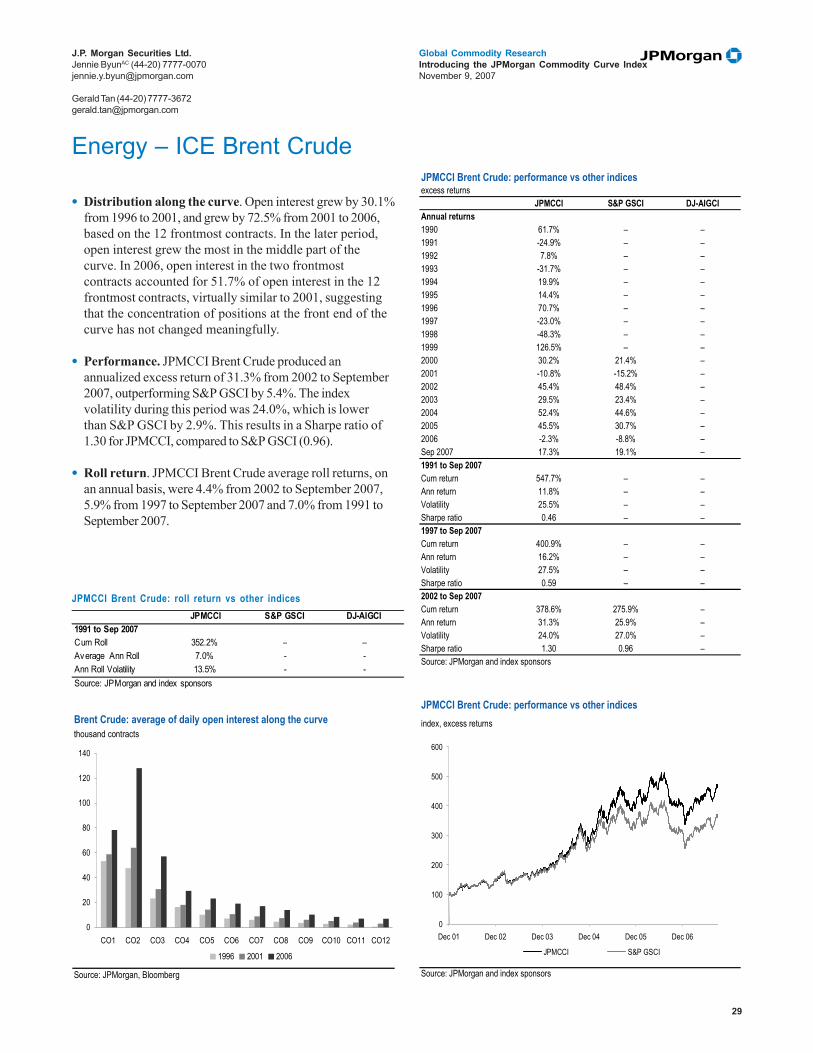
29
Global Commodity ResearchIntroducing the JPMorgan Commodity Curve IndexNovember 9, 2007
J.P. Morgan Securities Ltd.Jennie ByunAC (44-20) [email protected]
Gerald Tan (44-20) [email protected]
Brent Crude: average of daily open interest along the curvethousand contracts
Source: JPMorgan, Bloomberg
0
20
40
60
80
100
120
140
CO1 CO2 CO3 CO4 CO5 CO6 CO7 CO8 CO9 CO10 CO11 CO12
1996 2001 2006
JPMCCI Brent Crude: performance vs other indicesexcess returns
JPMCCI S&P GSCI DJ-AIGCIAnnual returns1990 61.7% – –1991 -24.9% – –1992 7.8% – –1993 -31.7% – –1994 19.9% – –1995 14.4% – –1996 70.7% – –1997 -23.0% – –1998 -48.3% – –1999 126.5% – –2000 30.2% 21.4% –2001 -10.8% -15.2% –2002 45.4% 48.4% –2003 29.5% 23.4% –2004 52.4% 44.6% –2005 45.5% 30.7% –2006 -2.3% -8.8% –Sep 2007 17.3% 19.1% –1991 to Sep 2007Cum return 547.7% – –Ann return 11.8% – –Volatility 25.5% – –Sharpe ratio 0.46 – –1997 to Sep 2007Cum return 400.9% – –Ann return 16.2% – –Volatility 27.5% – –Sharpe ratio 0.59 – –2002 to Sep 2007Cum return 378.6% 275.9% –Ann return 31.3% 25.9% –Volatility 24.0% 27.0% –Sharpe ratio 1.30 0.96 –Source: JPMorgan and index sponsors
JPMCCI Brent Crude: performance vs other indicesindex, excess returns
Source: JPMorgan and index sponsors
0
100
200
300
400
500
600
Dec 01 Dec 02 Dec 03 Dec 04 Dec 05 Dec 06
JPMCCI S&P GSCI
JPMCCI S&P GSCI DJ-AIGCI1991 to Sep 2007Cum Roll 352.2% – –Average Ann Roll 7.0% - -Ann Roll Volatility 13.5% - -Source: JPMorgan and index sponsors
Energy – ICE Brent Crude
• Distribution along the curve. Open interest grew by 30.1%from 1996 to 2001, and grew by 72.5% from 2001 to 2006,based on the 12 frontmost contracts. In the later period,open interest grew the most in the middle part of thecurve. In 2006, open interest in the two frontmostcontracts accounted for 51.7% of open interest in the 12frontmost contracts, virtually similar to 2001, suggestingthat the concentration of positions at the front end of thecurve has not changed meaningfully.
• Performance. JPMCCI Brent Crude produced anannualized excess return of 31.3% from 2002 to September2007, outperforming S&P GSCI by 5.4%. The indexvolatility during this period was 24.0%, which is lowerthan S&P GSCI by 2.9%. This results in a Sharpe ratio of1.30 for JPMCCI, compared to S&P GSCI (0.96).
• Roll return. JPMCCI Brent Crude average roll returns, onan annual basis, were 4.4% from 2002 to September 2007,5.9% from 1997 to September 2007 and 7.0% from 1991 toSeptember 2007.
JPMCCI Brent Crude: roll return vs other indices
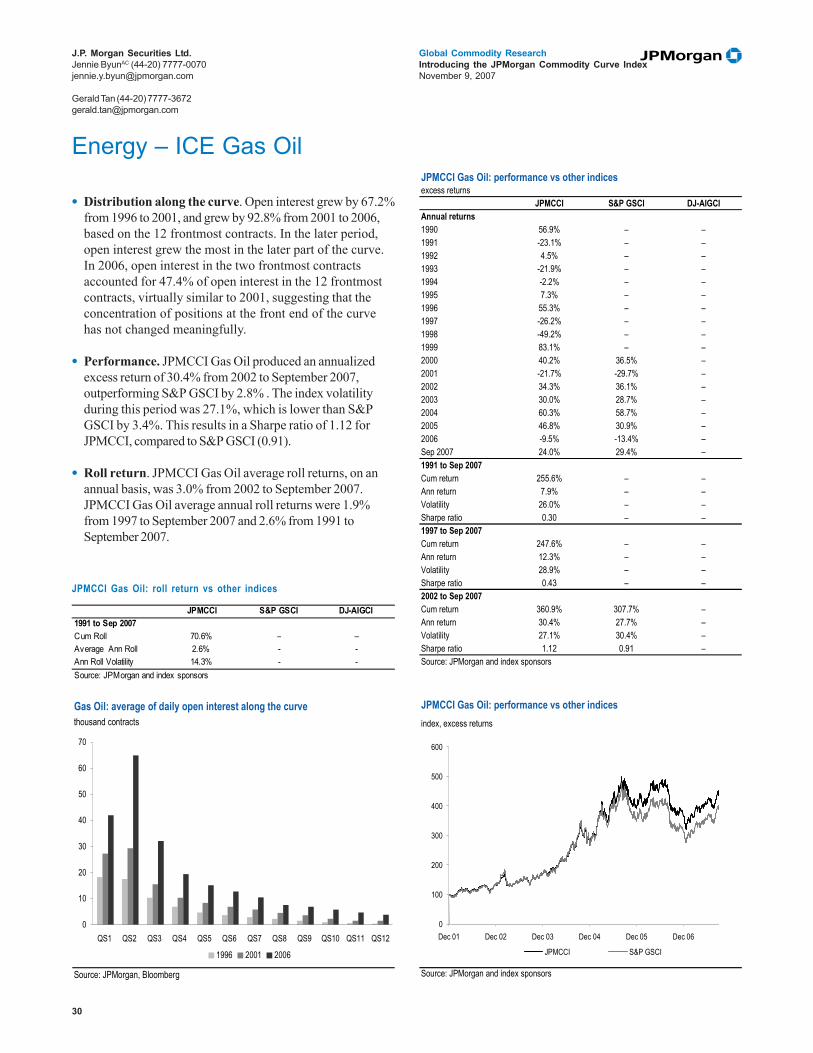
30
Global Commodity ResearchIntroducing the JPMorgan Commodity Curve IndexNovember 9, 2007
J.P. Morgan Securities Ltd.Jennie ByunAC (44-20) [email protected]
Gerald Tan (44-20) [email protected]
Energy – ICE Gas Oil
• Distribution along the curve. Open interest grew by 67.2%from 1996 to 2001, and grew by 92.8% from 2001 to 2006,based on the 12 frontmost contracts. In the later period,open interest grew the most in the later part of the curve.In 2006, open interest in the two frontmost contractsaccounted for 47.4% of open interest in the 12 frontmostcontracts, virtually similar to 2001, suggesting that theconcentration of positions at the front end of the curvehas not changed meaningfully.
• Performance. JPMCCI Gas Oil produced an annualizedexcess return of 30.4% from 2002 to September 2007,outperforming S&P GSCI by 2.8% . The index volatilityduring this period was 27.1%, which is lower than S&PGSCI by 3.4%. This results in a Sharpe ratio of 1.12 forJPMCCI, compared to S&P GSCI (0.91).
• Roll return. JPMCCI Gas Oil average roll returns, on anannual basis, was 3.0% from 2002 to September 2007.JPMCCI Gas Oil average annual roll returns were 1.9%from 1997 to September 2007 and 2.6% from 1991 toSeptember 2007.
Gas Oil: average of daily open interest along the curvethousand contracts
Source: JPMorgan, Bloomberg
0
10
20
30
40
50
60
70
QS1 QS2 QS3 QS4 QS5 QS6 QS7 QS8 QS9 QS10 QS11 QS12
1996 2001 2006
JPMCCI Gas Oil: performance vs other indicesexcess returns
JPMCCI S&P GSCI DJ-AIGCIAnnual returns1990 56.9% – –1991 -23.1% – –1992 4.5% – –1993 -21.9% – –1994 -2.2% – –1995 7.3% – –1996 55.3% – –1997 -26.2% – –1998 -49.2% – –1999 83.1% – –2000 40.2% 36.5% –2001 -21.7% -29.7% –2002 34.3% 36.1% –2003 30.0% 28.7% –2004 60.3% 58.7% –2005 46.8% 30.9% –2006 -9.5% -13.4% –Sep 2007 24.0% 29.4% –1991 to Sep 2007Cum return 255.6% – –Ann return 7.9% – –Volatility 26.0% – –Sharpe ratio 0.30 – –1997 to Sep 2007Cum return 247.6% – –Ann return 12.3% – –Volatility 28.9% – –Sharpe ratio 0.43 – –2002 to Sep 2007Cum return 360.9% 307.7% –Ann return 30.4% 27.7% –Volatility 27.1% 30.4% –Sharpe ratio 1.12 0.91 –Source: JPMorgan and index sponsors
JPMCCI Gas Oil: performance vs other indicesindex, excess returns
Source: JPMorgan and index sponsors
0
100
200
300
400
500
600
Dec 01 Dec 02 Dec 03 Dec 04 Dec 05 Dec 06
JPMCCI S&P GSCI
JPMCCI S&P GSCI DJ-AIGCI1991 to Sep 2007Cum Roll 70.6% – –Average Ann Roll 2.6% - -Ann Roll Volatility 14.3% - -Source: JPMorgan and index sponsors
JPMCCI Gas Oil: roll return vs other indices

31
Global Commodity ResearchIntroducing the JPMorgan Commodity Curve IndexNovember 9, 2007
J.P. Morgan Securities Ltd.Jennie ByunAC (44-20) [email protected]
Gerald Tan (44-20) [email protected]
• Distribution along the curve. Open interest shrank by33.8% from 1996 to 2001, but grew by 181.4% from 2001 to2006, based on the 12 frontmost contracts. In the laterperiod, open interest grew the most in the later part of thecurve. Whereas open interest in the two frontmostcontracts accounted for 70.3% of open interest in the 12frontmost contracts, this proportion was 65.1% in 2006,suggesting a mild increase in dispersion of positionsacross the curve.
• Performance. JPMCCI Gold produced an annualizedexcess return of 15.0% from 2002 to September 2007,outperforming S&P GSCI by 0.2% and DJ-AIGCI by 0.2%.The index volatility during this period was 14.9%, which issimilar to S&P GSCI and DJ-AIGCI. This results in aSharpe ratio of 1.01 for JPMCCI, compared to S&P GSCI(0.99) and DJ-AIGCI (0.99).
• Roll return. JPMCCI Gold average roll returns, on anannual basis, was -3.9% from 2002 to September 2007. Thiscompares to -4.1% for S&P GSCI. JPMCCI Gold averageannual roll returns were -3.8% from 1997 to September2007 and -3.8% from 1991 to September 2007.
Gold: average of daily open interest along the curvethousand contracts
Source: JPMorgan, Bloomberg
0
20
40
60
80
100
120
140
GC1 GC2 GC3 GC4 GC5 GC6 GC7 GC8 GC9 GC10 GC11 GC12
1996 2001 2006
JPMCCI Gold: performance vs other indicesexcess returns
JPMCCI S&P GSCI DJ-AIGCIAnnual returns1990 -9.4% -9.0% –1991 -15.2% -14.8% -13.6%1992 -9.5% -9.1% -9.1%1993 14.6% 14.5% 14.7%1994 -5.5% -6.1% -6.3%1995 -4.5% -3.7% -3.7%1996 -8.1% -8.4% -8.4%1997 -24.4% -24.1% -24.1%1998 -4.1% -4.2% -4.2%1999 -3.2% -3.3% -3.3%2000 -10.4% -10.8% -10.8%2001 -1.7% -1.0% -1.0%2002 22.7% 22.5% 22.5%2003 18.1% 17.8% 17.8%2004 3.7% 3.4% 3.4%2005 14.1% 13.8% 13.8%2006 16.3% 16.0% 16.0%Sep 2007 12.1% 12.1% 12.1%1991 to Sep 2007Cum return 0.7% 0.7% 2.0%Ann return 0.0% 0.0% 0.1%Volatility 13.1% 13.2% 13.2%Sharpe ratio 0.00 0.00 0.011997 to Sep 2007Cum return 38.1% 37.0% 37.0%Ann return 3.0% 3.0% 3.0%Volatility 14.6% 14.7% 14.7%Sharpe ratio 0.21 0.20 0.202002 to Sep 2007Cum return 123.2% 120.8% 120.7%Ann return 15.0% 14.8% 14.8%Volatility 14.9% 14.9% 14.9%Sharpe ratio 1.01 0.99 0.99Source: JPMorgan and index sponsors
JPMCCI Gold: performance vs other indicesindex, excess returns
Source: JPMorgan and index sponsors
0
50
100
150
200
250
Dec 01 Dec 02 Dec 03 Dec 04 Dec 05 Dec 06
JPMCCI S&P GSCI DJ-AIGCI
Precious Metals – COMEX Gold
JPMCCI S&P GSCI DJ-AIGCI1991 to Sep 2007Cum Roll -86.6% -88.6% –Average Ann Roll -3.8% -3.9% -Ann Roll Volatility 1.6% 1.6% -Source: JPMorgan and index sponsors
JPMCCI Gold: roll return vs other indices
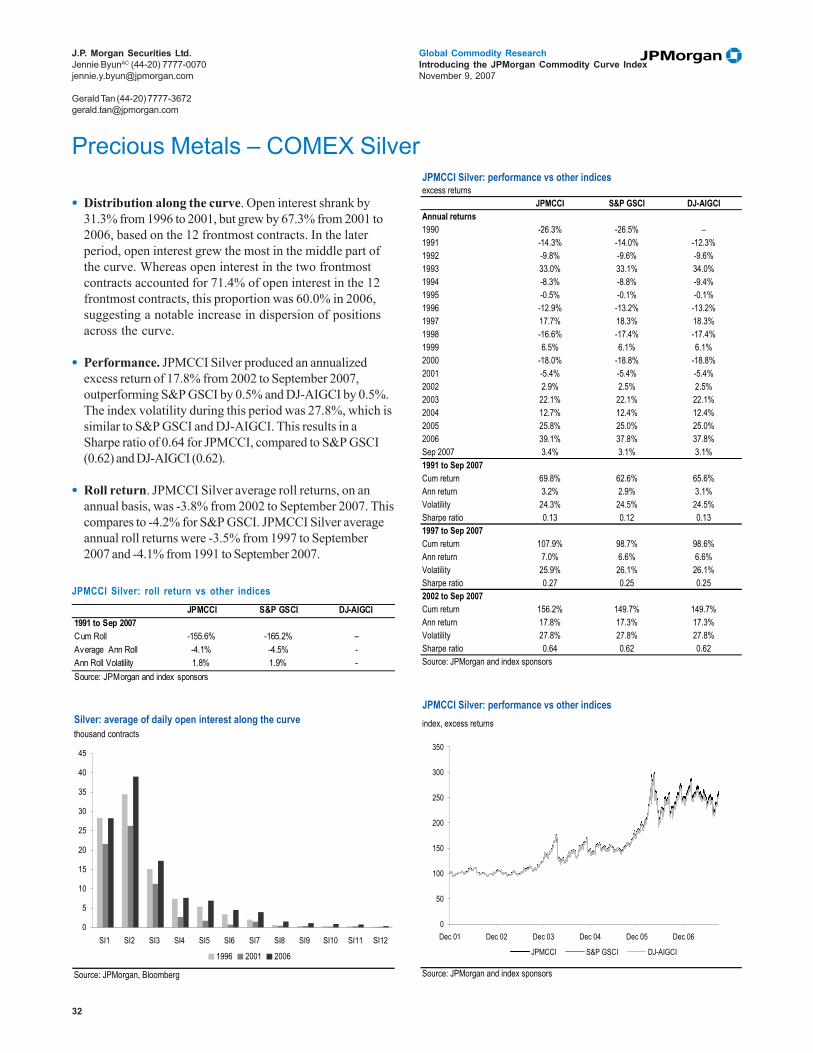
32
Global Commodity ResearchIntroducing the JPMorgan Commodity Curve IndexNovember 9, 2007
J.P. Morgan Securities Ltd.Jennie ByunAC (44-20) [email protected]
Gerald Tan (44-20) [email protected]
• Distribution along the curve. Open interest shrank by31.3% from 1996 to 2001, but grew by 67.3% from 2001 to2006, based on the 12 frontmost contracts. In the laterperiod, open interest grew the most in the middle part ofthe curve. Whereas open interest in the two frontmostcontracts accounted for 71.4% of open interest in the 12frontmost contracts, this proportion was 60.0% in 2006,suggesting a notable increase in dispersion of positionsacross the curve.
• Performance. JPMCCI Silver produced an annualizedexcess return of 17.8% from 2002 to September 2007,outperforming S&P GSCI by 0.5% and DJ-AIGCI by 0.5%.The index volatility during this period was 27.8%, which issimilar to S&P GSCI and DJ-AIGCI. This results in aSharpe ratio of 0.64 for JPMCCI, compared to S&P GSCI(0.62) and DJ-AIGCI (0.62).
• Roll return. JPMCCI Silver average roll returns, on anannual basis, was -3.8% from 2002 to September 2007. Thiscompares to -4.2% for S&P GSCI. JPMCCI Silver averageannual roll returns were -3.5% from 1997 to September2007 and -4.1% from 1991 to September 2007.
Silver: average of daily open interest along the curvethousand contracts
Source: JPMorgan, Bloomberg
0
5
10
15
20
25
30
35
40
45
SI1 SI2 SI3 SI4 SI5 SI6 SI7 SI8 SI9 SI10 SI11 SI12
1996 2001 2006
JPMCCI Silver: performance vs other indicesexcess returns
JPMCCI S&P GSCI DJ-AIGCIAnnual returns1990 -26.3% -26.5% –1991 -14.3% -14.0% -12.3%1992 -9.8% -9.6% -9.6%1993 33.0% 33.1% 34.0%1994 -8.3% -8.8% -9.4%1995 -0.5% -0.1% -0.1%1996 -12.9% -13.2% -13.2%1997 17.7% 18.3% 18.3%1998 -16.6% -17.4% -17.4%1999 6.5% 6.1% 6.1%2000 -18.0% -18.8% -18.8%2001 -5.4% -5.4% -5.4%2002 2.9% 2.5% 2.5%2003 22.1% 22.1% 22.1%2004 12.7% 12.4% 12.4%2005 25.8% 25.0% 25.0%2006 39.1% 37.8% 37.8%Sep 2007 3.4% 3.1% 3.1%1991 to Sep 2007Cum return 69.8% 62.6% 65.6%Ann return 3.2% 2.9% 3.1%Volatility 24.3% 24.5% 24.5%Sharpe ratio 0.13 0.12 0.131997 to Sep 2007Cum return 107.9% 98.7% 98.6%Ann return 7.0% 6.6% 6.6%Volatility 25.9% 26.1% 26.1%Sharpe ratio 0.27 0.25 0.252002 to Sep 2007Cum return 156.2% 149.7% 149.7%Ann return 17.8% 17.3% 17.3%Volatility 27.8% 27.8% 27.8%Sharpe ratio 0.64 0.62 0.62Source: JPMorgan and index sponsors
JPMCCI Silver: performance vs other indicesindex, excess returns
Source: JPMorgan and index sponsors
0
50
100
150
200
250
300
350
Dec 01 Dec 02 Dec 03 Dec 04 Dec 05 Dec 06
JPMCCI S&P GSCI DJ-AIGCI
Precious Metals – COMEX Silver
JPMCCI S&P GSCI DJ-AIGCI1991 to Sep 2007Cum Roll -155.6% -165.2% –Average Ann Roll -4.1% -4.5% -Ann Roll Volatility 1.8% 1.9% -Source: JPMorgan and index sponsors
JPMCCI Silver: roll return vs other indices
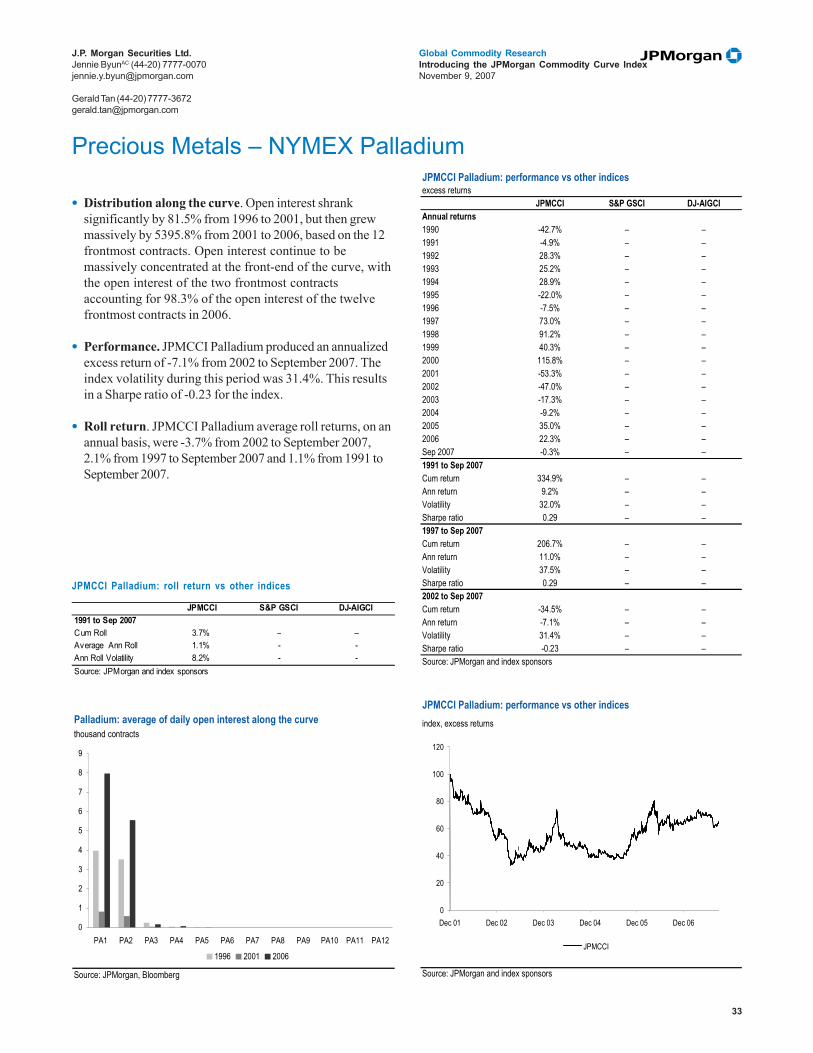
33
Global Commodity ResearchIntroducing the JPMorgan Commodity Curve IndexNovember 9, 2007
J.P. Morgan Securities Ltd.Jennie ByunAC (44-20) [email protected]
Gerald Tan (44-20) [email protected]
• Distribution along the curve. Open interest shranksignificantly by 81.5% from 1996 to 2001, but then grewmassively by 5395.8% from 2001 to 2006, based on the 12frontmost contracts. Open interest continue to bemassively concentrated at the front-end of the curve, withthe open interest of the two frontmost contractsaccounting for 98.3% of the open interest of the twelvefrontmost contracts in 2006.
• Performance. JPMCCI Palladium produced an annualizedexcess return of -7.1% from 2002 to September 2007. Theindex volatility during this period was 31.4%. This resultsin a Sharpe ratio of -0.23 for the index.
• Roll return. JPMCCI Palladium average roll returns, on anannual basis, were -3.7% from 2002 to September 2007,2.1% from 1997 to September 2007 and 1.1% from 1991 toSeptember 2007.
Palladium: average of daily open interest along the curvethousand contracts
Source: JPMorgan, Bloomberg
0
1
2
3
4
5
6
7
8
9
PA1 PA2 PA3 PA4 PA5 PA6 PA7 PA8 PA9 PA10 PA11 PA12
1996 2001 2006
JPMCCI Palladium: performance vs other indicesexcess returns
JPMCCI S&P GSCI DJ-AIGCIAnnual returns1990 -42.7% – –1991 -4.9% – –1992 28.3% – –1993 25.2% – –1994 28.9% – –1995 -22.0% – –1996 -7.5% – –1997 73.0% – –1998 91.2% – –1999 40.3% – –2000 115.8% – –2001 -53.3% – –2002 -47.0% – –2003 -17.3% – –2004 -9.2% – –2005 35.0% – –2006 22.3% – –Sep 2007 -0.3% – –1991 to Sep 2007Cum return 334.9% – –Ann return 9.2% – –Volatility 32.0% – –Sharpe ratio 0.29 – –1997 to Sep 2007Cum return 206.7% – –Ann return 11.0% – –Volatility 37.5% – –Sharpe ratio 0.29 – –2002 to Sep 2007Cum return -34.5% – –Ann return -7.1% – –Volatility 31.4% – –Sharpe ratio -0.23 – –Source: JPMorgan and index sponsors
JPMCCI Palladium: performance vs other indicesindex, excess returns
Source: JPMorgan and index sponsors
0
20
40
60
80
100
120
Dec 01 Dec 02 Dec 03 Dec 04 Dec 05 Dec 06
JPMCCI
u
Precious Metals – NYMEX Palladium
JPMCCI S&P GSCI DJ-AIGCI1991 to Sep 2007Cum Roll 3.7% – –Average Ann Roll 1.1% - -Ann Roll Volatility 8.2% - -Source: JPMorgan and index sponsors
JPMCCI Palladium: roll return vs other indices
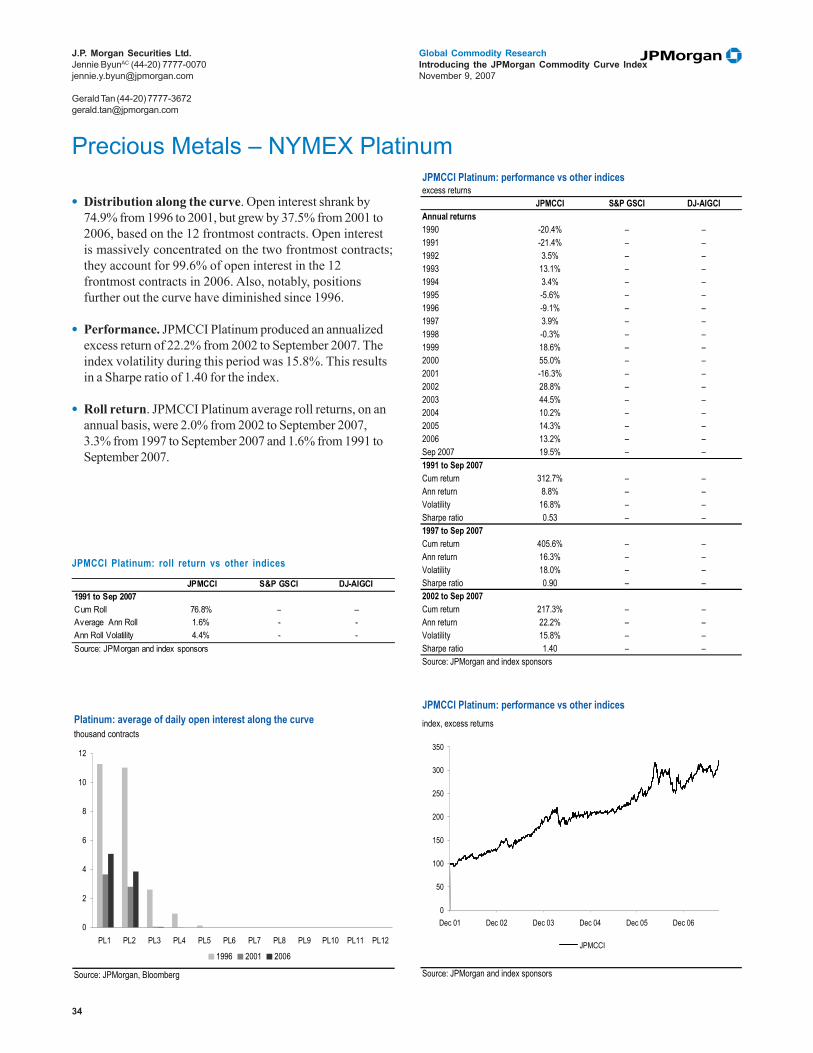
34
Global Commodity ResearchIntroducing the JPMorgan Commodity Curve IndexNovember 9, 2007
J.P. Morgan Securities Ltd.Jennie ByunAC (44-20) [email protected]
Gerald Tan (44-20) [email protected]
• Distribution along the curve. Open interest shrank by74.9% from 1996 to 2001, but grew by 37.5% from 2001 to2006, based on the 12 frontmost contracts. Open interestis massively concentrated on the two frontmost contracts;they account for 99.6% of open interest in the 12frontmost contracts in 2006. Also, notably, positionsfurther out the curve have diminished since 1996.
• Performance. JPMCCI Platinum produced an annualizedexcess return of 22.2% from 2002 to September 2007. Theindex volatility during this period was 15.8%. This resultsin a Sharpe ratio of 1.40 for the index.
• Roll return. JPMCCI Platinum average roll returns, on anannual basis, were 2.0% from 2002 to September 2007,3.3% from 1997 to September 2007 and 1.6% from 1991 toSeptember 2007.
Platinum: average of daily open interest along the curvethousand contracts
Source: JPMorgan, Bloomberg
0
2
4
6
8
10
12
PL1 PL2 PL3 PL4 PL5 PL6 PL7 PL8 PL9 PL10 PL11 PL12
1996 2001 2006
JPMCCI Platinum: performance vs other indicesexcess returns
JPMCCI S&P GSCI DJ-AIGCIAnnual returns1990 -20.4% – –1991 -21.4% – –1992 3.5% – –1993 13.1% – –1994 3.4% – –1995 -5.6% – –1996 -9.1% – –1997 3.9% – –1998 -0.3% – –1999 18.6% – –2000 55.0% – –2001 -16.3% – –2002 28.8% – –2003 44.5% – –2004 10.2% – –2005 14.3% – –2006 13.2% – –Sep 2007 19.5% – –1991 to Sep 2007Cum return 312.7% – –Ann return 8.8% – –Volatility 16.8% – –Sharpe ratio 0.53 – –1997 to Sep 2007Cum return 405.6% – –Ann return 16.3% – –Volatility 18.0% – –Sharpe ratio 0.90 – –2002 to Sep 2007Cum return 217.3% – –Ann return 22.2% – –Volatility 15.8% – –Sharpe ratio 1.40 – –Source: JPMorgan and index sponsors
JPMCCI Platinum: performance vs other indicesindex, excess returns
Source: JPMorgan and index sponsors
0
50
100
150
200
250
300
350
Dec 01 Dec 02 Dec 03 Dec 04 Dec 05 Dec 06
JPMCCI
Precious Metals – NYMEX Platinum
JPMCCI S&P GSCI DJ-AIGCI1991 to Sep 2007Cum Roll 76.8% – –Average Ann Roll 1.6% - -Ann Roll Volatility 4.4% - -Source: JPMorgan and index sponsors
JPMCCI Platinum: roll return vs other indices
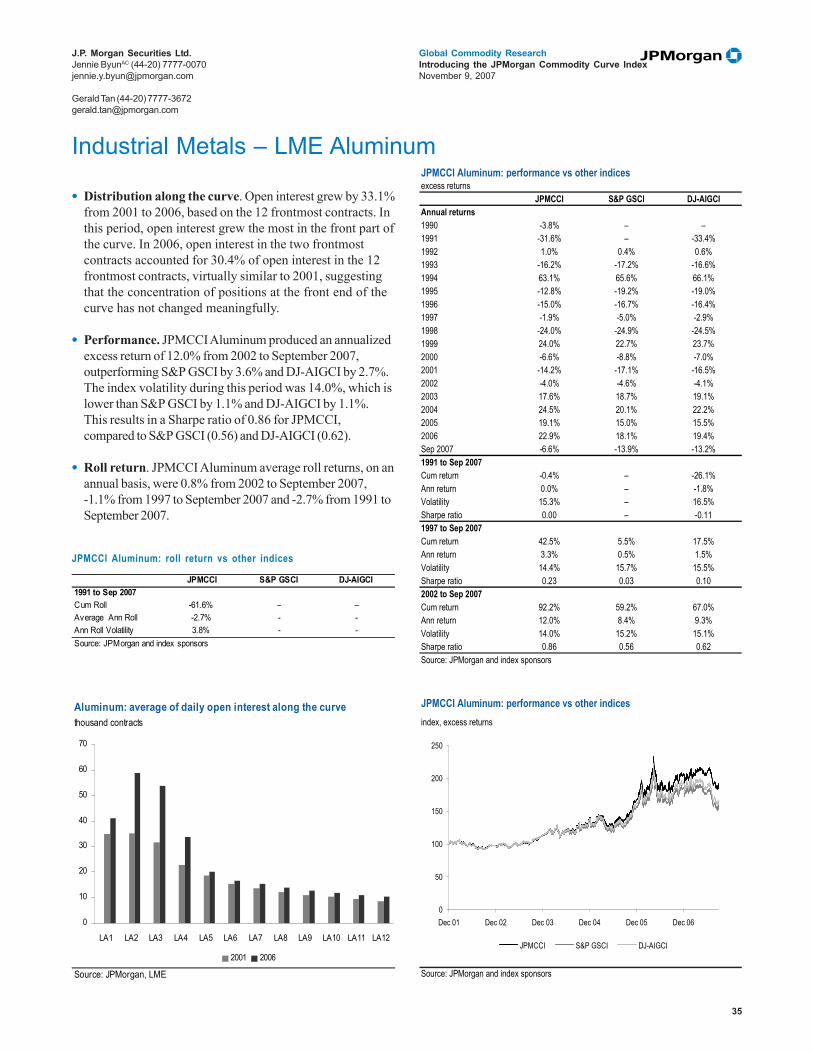
35
Global Commodity ResearchIntroducing the JPMorgan Commodity Curve IndexNovember 9, 2007
J.P. Morgan Securities Ltd.Jennie ByunAC (44-20) [email protected]
Gerald Tan (44-20) [email protected]
• Distribution along the curve. Open interest grew by 33.1%from 2001 to 2006, based on the 12 frontmost contracts. Inthis period, open interest grew the most in the front part ofthe curve. In 2006, open interest in the two frontmostcontracts accounted for 30.4% of open interest in the 12frontmost contracts, virtually similar to 2001, suggestingthat the concentration of positions at the front end of thecurve has not changed meaningfully.
• Performance. JPMCCI Aluminum produced an annualizedexcess return of 12.0% from 2002 to September 2007,outperforming S&P GSCI by 3.6% and DJ-AIGCI by 2.7%.The index volatility during this period was 14.0%, which islower than S&P GSCI by 1.1% and DJ-AIGCI by 1.1%.This results in a Sharpe ratio of 0.86 for JPMCCI,compared to S&P GSCI (0.56) and DJ-AIGCI (0.62).
• Roll return. JPMCCI Aluminum average roll returns, on anannual basis, were 0.8% from 2002 to September 2007,-1.1% from 1997 to September 2007 and -2.7% from 1991 toSeptember 2007.
Industrial Metals – LME AluminumJPMCCI Aluminum: performance vs other indicesexcess returns
JPMCCI S&P GSCI DJ-AIGCIAnnual returns1990 -3.8% – –1991 -31.6% – -33.4%1992 1.0% 0.4% 0.6%1993 -16.2% -17.2% -16.6%1994 63.1% 65.6% 66.1%1995 -12.8% -19.2% -19.0%1996 -15.0% -16.7% -16.4%1997 -1.9% -5.0% -2.9%1998 -24.0% -24.9% -24.5%1999 24.0% 22.7% 23.7%2000 -6.6% -8.8% -7.0%2001 -14.2% -17.1% -16.5%2002 -4.0% -4.6% -4.1%2003 17.6% 18.7% 19.1%2004 24.5% 20.1% 22.2%2005 19.1% 15.0% 15.5%2006 22.9% 18.1% 19.4%Sep 2007 -6.6% -13.9% -13.2%1991 to Sep 2007Cum return -0.4% – -26.1%Ann return 0.0% – -1.8%Volatility 15.3% – 16.5%Sharpe ratio 0.00 – -0.111997 to Sep 2007Cum return 42.5% 5.5% 17.5%Ann return 3.3% 0.5% 1.5%Volatility 14.4% 15.7% 15.5%Sharpe ratio 0.23 0.03 0.102002 to Sep 2007Cum return 92.2% 59.2% 67.0%Ann return 12.0% 8.4% 9.3%Volatility 14.0% 15.2% 15.1%Sharpe ratio 0.86 0.56 0.62Source: JPMorgan and index sponsors
JPMCCI Aluminum: performance vs other indicesindex, excess returns
Source: JPMorgan and index sponsors
0
50
100
150
200
250
Dec 01 Dec 02 Dec 03 Dec 04 Dec 05 Dec 06
JPMCCI S&P GSCI DJ-AIGCI
Aluminum: average of daily open interest along the curvethousand contracts
Source: JPMorgan, LME
0
10
20
30
40
50
60
70
LA1 LA2 LA3 LA4 LA5 LA6 LA7 LA8 LA9 LA10 LA11 LA12
2001 2006
JPMCCI S&P GSCI DJ-AIGCI1991 to Sep 2007Cum Roll -61.6% – –Average Ann Roll -2.7% - -Ann Roll Volatility 3.8% - -Source: JPMorgan and index sponsors
JPMCCI Aluminum: roll return vs other indices

36
Global Commodity ResearchIntroducing the JPMorgan Commodity Curve IndexNovember 9, 2007
J.P. Morgan Securities Ltd.Jennie ByunAC (44-20) [email protected]
Gerald Tan (44-20) [email protected]
• Distribution along the curve. Open interest grew by 9.9%from 2001 to 2006, based on the 12 frontmost contracts. Inthis period, open interest grew the most in the later part ofthe curve. Whereas open interest in the two frontmostcontracts accounted for 39.5% of open interest in the 12frontmost contracts, this proportion was 27.8% in 2006,suggesting a notable increase in dispersion of positionsacross the curve.
• Performance. JPMCCI LME Copper produced anannualized excess return of 41.8% from 2002 to September2007, outperforming S&P GSCI by 1.5%. The indexvolatility during this period was 25.7%, which is lowerthan S&P GSCI by 0.5%. This results in a Sharpe ratio of1.63 for JPMCCI, compared to S&P GSCI (1.54).
• Roll return. JPMCCI LME Copper average roll returns, onan annual basis, was 9.2% from 2002 to September 2007.This compares to 6.8% for S&P GSCI. JPMCCI LMECopper average annual roll returns were 4.1% from 1997 toSeptember 2007 and 3.6% from 1991 to September 2007.
Industrial Metals – LME CopperJPMCCI LME Copper: performance vs other indicesexcess returns
JPMCCI S&P GSCI DJ-AIGCIAnnual returns1990 17.2% 34.7% –1991 -10.0% -11.8% –1992 0.7% 4.0% –1993 -22.4% -25.6% –1994 60.4% 68.7% –1995 1.0% 0.0% –1996 -12.3% -10.2% –1997 -10.1% -14.1% –1998 -17.2% -18.5% –1999 18.4% 16.6% –2000 -7.0% -8.5% –2001 -21.2% -22.9% –2002 0.6% 0.0% –2003 43.8% 44.2% –2004 51.1% 51.8% –2005 67.9% 68.4% –2006 56.4% 46.9% –Sep 2007 29.8% 29.6% –1991 to Sep 2007Cum return 380.5% 318.2% –Ann return 9.8% 8.9% –Volatility 22.0% 23.0% –Sharpe ratio 0.45 0.39 –1997 to Sep 2007Cum return 381.2% 304.6% –Ann return 15.7% 13.9% –Volatility 23.4% 24.2% –Sharpe ratio 0.67 0.57 –2002 to Sep 2007Cum return 644.8% 602.1% –Ann return 41.8% 40.3% –Volatility 25.7% 26.2% –Sharpe ratio 1.63 1.54 –Source: JPMorgan and index sponsors
JPMCCI LME Copper: performance vs other indicesindex, excess returns
Source: JPMorgan and index sponsors
0
100
200
300
400
500
600
700
800
Dec 01 Dec 02 Dec 03 Dec 04 Dec 05 Dec 06
JPMCCI S&P GSCI
LME Copper: average of daily open interest along the curvethousand contracts
Source: JPMorgan, LME
0
5
10
15
20
25
30
LP1 LP2 LP3 LP4 LP5 LP6 LP7 LP8 LP9 LP10 LP11 LP12
2001 2006
JPMCCI S&P GSCI DJ-AIGCI1991 to Sep 2007Cum Roll 168.7% 109.2% –Average Ann Roll 3.6% 2.6% -Ann Roll Volatility 9.1% 9.5% -Source: JPMorgan and index sponsors
JPMCCI Copper: roll return vs other indices

37
Global Commodity ResearchIntroducing the JPMorgan Commodity Curve IndexNovember 9, 2007
J.P. Morgan Securities Ltd.Jennie ByunAC (44-20) [email protected]
Gerald Tan (44-20) [email protected]
• Distribution along the curve. Open interest grew by 87.1%from 2001 to 2006, based on the 12 frontmost contracts. Inthis period, open interest grew the most in the middle partof the curve. Whereas open interest in the two frontmostcontracts accounted for 40.6% of open interest in the 12frontmost contracts, this proportion was 37.0% in 2006,suggesting a very slight increase in dispersion ofpositions across the curve.
• Performance. JPMCCI Lead produced an annualizedexcess return of 46.2% from 2002 to September 2007,outperforming S&P GSCI by 3.4%. The index volatilityduring this period was 26.8%, which is lower than S&PGSCI by 1.7%. This results in a Sharpe ratio of 1.72 forJPMCCI, compared to S&P GSCI (1.50).
• Roll return. JPMCCI Lead average roll returns, on anannual basis, were7.9% from 2002 to September 2007, 2.6%from 1997 to September 2007 and -0.4% from 1991 toSeptember 2007.
Lead: average of daily open interest along the curvethousand contracts
Source: JPMorgan, LME
0
1
2
3
4
5
6
7
8
9
LL1 LL2 LL3 LL4 LL5 LL6 LL7 LL8 LL9 LL10 LL11 LL12
2001 2006
Industrial Metals – LME Lead
JPMCCI S&P GSCI DJ-AIGCI1991 to Sep 2007Cum Roll -135.3% – –Average Ann Roll -0.4% - -Ann Roll Volatility 9.0% - -Source: JPMorgan and index sponsors
JPMCCI Lead: roll return vs other indices
JPMCCI Lead: performance vs other indicesexcess returns
JPMCCI S&P GSCI DJ-AIGCIAnnual returns1990 -0.7% – –1991 -20.1% – –1992 -22.7% – –1993 -5.1% – –1994 24.4% – –1995 3.1% – –1996 0.2% 1.1% –1997 -20.6% -24.2% –1998 -18.9% -18.9% –1999 2.1% -2.8% –2000 -9.2% -12.8% –2001 -1.9% -2.3% –2002 -17.2% -20.3% –2003 61.0% 63.0% –2004 61.3% 55.3% –2005 16.6% 15.6% –2006 64.5% 59.2% –Sep 2007 115.3% 108.8% –1991 to Sep 2007Cum return 291.2% – –Ann return 8.5% – –Volatility 21.8% – –Sharpe ratio 0.39 – –1997 to Sep 2007Cum return 419.1% 294.6% –Ann return 16.6% 13.6% –Volatility 22.9% 24.9% –Sharpe ratio 0.72 0.55 –2002 to Sep 2007Cum return 787.0% 676.0% –Ann return 46.2% 42.8% –Volatility 26.8% 28.5% –Sharpe ratio 1.72 1.50 –Source: JPMorgan and index sponsors
JPMCCI Lead: performance vs other indicesindex, excess returns
Source: JPMorgan and index sponsors
0
100
200
300
400
500
600
700
800
900
1000
Dec 01 Dec 02 Dec 03 Dec 04 Dec 05 Dec 06JPMCCI S&P GSCI

38
Global Commodity ResearchIntroducing the JPMorgan Commodity Curve IndexNovember 9, 2007
J.P. Morgan Securities Ltd.Jennie ByunAC (44-20) [email protected]
Gerald Tan (44-20) [email protected]
• Distribution along the curve. Open interest grew by 44.1%from 2001 to 2006, based on the 12 frontmost contracts. Inthis period, open interest grew the most in the front part ofthe curve. Whereas open interest in the two frontmostcontracts accounted for 35.3% of open interest in the 12frontmost contracts, this proportion was 38.8% in 2006,suggesting a very slight increase in concentration ofpositions at the front end of the curve.
• Performance. JPMCCI Nickel produced an annualizedexcess return of 43.5% from 2002 to September 2007,outperforming S&P GSCI by 3.9% and DJ-AIGCI by 3.4%.The index volatility during this period was 38.5%, which islower than S&P GSCI by 1.2% and DJ-AIGCI by 1.4%.This results in a Sharpe ratio of 1.13 for JPMCCI,compared to S&P GSCI (1.00) and DJ-AIGCI (1.00).
• Roll return. JPMCCI Nickel average roll returns, on anannual basis, were 10.6% from 2002 to September 2007,6.1% from 1997 to September 2007 and 2.8% from 1991 toSeptember 2007.
Nickel: average of daily open interest along the curvethousand contracts
Source: JPMorgan, LME
0
1
2
3
4
5
6
7
8
9
LN1 LN2 LN3 LN4 LN5 LN6 LN7 LN8 LN9 LN10 LN11 LN12
2001 2006
JPMCCI Nickel: performance vs other indicesexcess returns
JPMCCI S&P GSCI DJ-AIGCIAnnual returns1990 9.6% – –1991 -11.2% – -14.1%1992 -20.2% – -20.8%1993 -12.6% – -15.2%1994 56.6% 59.6% 60.0%1995 -13.4% -16.5% -16.4%1996 -21.6% -23.4% -23.1%1997 -10.6% -11.6% -11.3%1998 -36.2% -36.7% -36.5%1999 100.0% 99.9% 100.7%2000 -8.4% -8.6% -8.5%2001 -13.8% -14.0% -13.3%2002 29.1% 28.4% 30.1%2003 135.3% 134.8% 136.0%2004 -0.9% -8.8% -5.6%2005 -5.6% -6.3% -8.1%2006 174.5% 170.0% 167.2%Sep 2007 2.4% -2.0% -2.3%1991 to Sep 2007Cum return 372.3% – 270.2%Ann return 9.7% – 8.1%Volatility 31.4% – 32.5%Sharpe ratio 0.31 – 0.251997 to Sep 2007Cum return 618.0% 499.2% 523.5%Ann return 20.1% 18.1% 18.6%Volatility 34.8% 35.8% 36.0%Sharpe ratio 0.58 0.51 0.522002 to Sep 2007Cum return 698.3% 581.5% 595.7%Ann return 43.5% 39.6% 40.1%Volatility 38.5% 39.7% 39.9%Sharpe ratio 1.13 1.00 1.00Source: JPMorgan and index sponsors
JPMCCI Nickel: performance vs other indicesindex, excess returns
Source: JPMorgan and index sponsors
0
200
400
600
800
1000
1200
1400
Dec 01 Dec 02 Dec 03 Dec 04 Dec 05 Dec 06
JPMCCI S&P GSCI DJ-AIGCI
Industrial Metals – LME Nickel
JPMCCI S&P GSCI DJ-AIGCI1991 to Sep 2007Cum Roll 99.6% – –Average Ann Roll 2.8% - -Ann Roll Volatility 9.0% - -Source: JPMorgan and index sponsors
JPMCCI Nickel: roll return vs other indices

39
Global Commodity ResearchIntroducing the JPMorgan Commodity Curve IndexNovember 9, 2007
J.P. Morgan Securities Ltd.Jennie ByunAC (44-20) [email protected]
Gerald Tan (44-20) [email protected]
• Distribution along the curve. Open interest grew by 64.5%from 2001 to 2006, based on the 12 frontmost contracts. Inthis period, open interest grew the most in the front part ofthe curve. In 2006, open interest in the two frontmostcontracts accounted for 34.3% of open interest in the 12frontmost contracts, virtually similar to 2001, suggestingthat the concentration of positions at the front end of thecurve has not changed meaningfully.
• Performance. JPMCCI Zinc produced an annualizedexcess return of 25.1% from 2002 to September 2007,outperforming S&P GSCI by 3.9% and DJ-AIGCI by 3.2%.The index volatility during this period was 28.1%, which islower than S&P GSCI by 0.8% and DJ-AIGCI by 0.7%.This results in a Sharpe ratio of 0.89 for JPMCCI,compared to S&P GSCI (0.73) and DJ-AIGCI (0.76).
• Roll return. JPMCCI Zinc average roll returns, on anannual basis, were 0.3% from 2002 to September 2007,-1.1% from 1997 to September 2007 and -2.0% from 1991 toSeptember 2007.
Zinc: average of daily open interest along the curvethousand contracts
Source: JPMorgan, LME
0
5
10
15
20
25
LX1 LX2 LX3 LX4 LX5 LX6 LX7 LX8 LX9 LX10 LX11 LX12
2001 2006
Industrial Metals – LME ZincJPMCCI Zinc: performance vs other indicesexcess returns
JPMCCI S&P GSCI DJ-AIGCIAnnual returns1990 11.1% – –1991 -10.4% – -7.8%1992 -0.7% -8.7% 4.0%1993 -13.0% -11.5% -10.7%1994 7.7% 2.9% 3.6%1995 -15.9% -19.9% -19.7%1996 -3.7% -5.5% -5.4%1997 6.7% 7.7% 9.1%1998 -21.5% -22.8% -21.8%1999 26.6% 25.8% 27.2%2000 -15.2% -18.3% -17.0%2001 -29.2% -30.2% -29.9%2002 -10.5% -11.4% -11.0%2003 25.4% 22.4% 23.9%2004 19.8% 14.9% 16.7%2005 50.2% 46.4% 45.2%2006 137.7% 125.7% 127.2%Sep 2007 -24.6% -26.8% -26.6%1991 to Sep 2007Cum return 55.7% – 32.5%Ann return 2.7% – 1.7%Volatility 21.4% – 22.7%Sharpe ratio 0.13 – 0.071997 to Sep 2007Cum return 130.4% 79.7% 96.6%Ann return 8.1% 5.6% 6.5%Volatility 23.9% 25.0% 24.9%Sharpe ratio 0.34 0.22 0.262002 to Sep 2007Cum return 261.9% 201.3% 211.6%Ann return 25.1% 21.1% 21.9%Volatility 28.1% 28.9% 28.9%Sharpe ratio 0.89 0.73 0.76Source: JPMorgan and index sponsors
JPMCCI Zinc: performance vs other indicesindex, excess returns
Source: JPMorgan and index sponsors
0
100
200
300
400
500
600
Dec 01 Dec 02 Dec 03 Dec 04 Dec 05 Dec 06
JPMCCI S&P GSCI DJ-AIGCI
JPMCCI S&P GSCI DJ-AIGCI1991 to Sep 2007Cum Roll -86.9% – –Average Ann Roll -2.0% - -Ann Roll Volatility 5.8% - -Source: JPMorgan and index sponsors
JPMCCI Zinc: roll return vs other indices
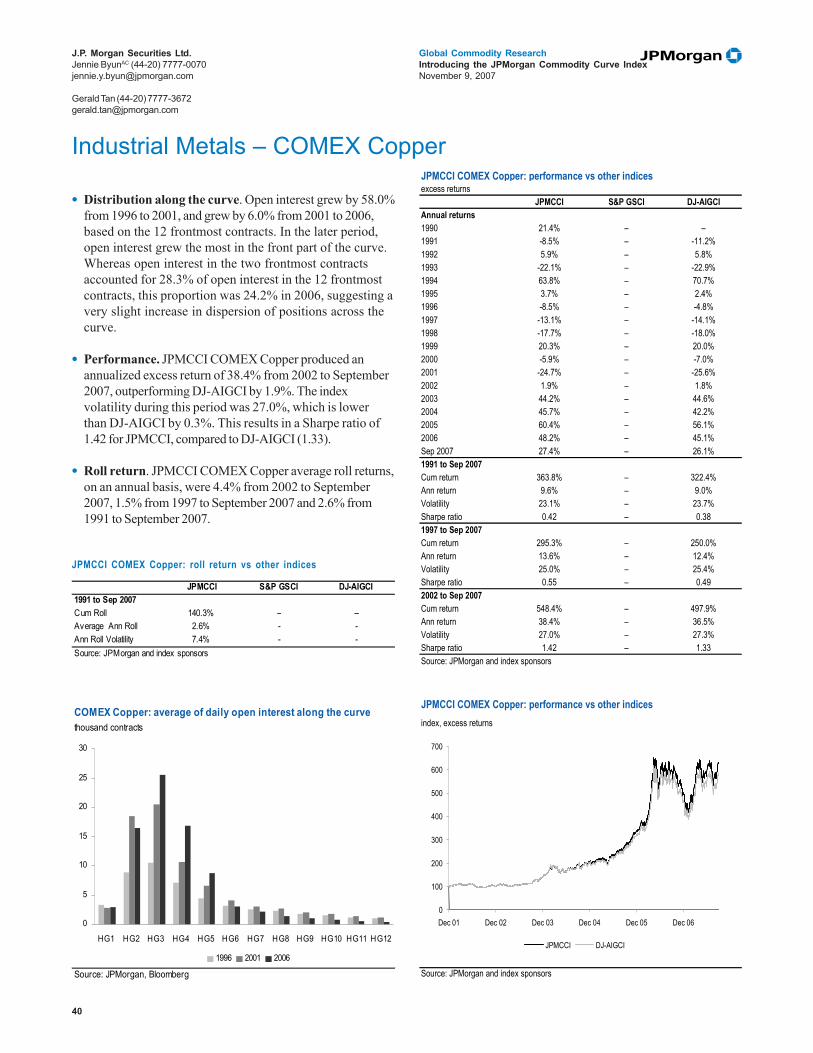
40
Global Commodity ResearchIntroducing the JPMorgan Commodity Curve IndexNovember 9, 2007
J.P. Morgan Securities Ltd.Jennie ByunAC (44-20) [email protected]
Gerald Tan (44-20) [email protected]
• Distribution along the curve. Open interest grew by 58.0%from 1996 to 2001, and grew by 6.0% from 2001 to 2006,based on the 12 frontmost contracts. In the later period,open interest grew the most in the front part of the curve.Whereas open interest in the two frontmost contractsaccounted for 28.3% of open interest in the 12 frontmostcontracts, this proportion was 24.2% in 2006, suggesting avery slight increase in dispersion of positions across thecurve.
• Performance. JPMCCI COMEX Copper produced anannualized excess return of 38.4% from 2002 to September2007, outperforming DJ-AIGCI by 1.9%. The indexvolatility during this period was 27.0%, which is lowerthan DJ-AIGCI by 0.3%. This results in a Sharpe ratio of1.42 for JPMCCI, compared to DJ-AIGCI (1.33).
• Roll return. JPMCCI COMEX Copper average roll returns,on an annual basis, were 4.4% from 2002 to September2007, 1.5% from 1997 to September 2007 and 2.6% from1991 to September 2007.
COMEX Copper: average of daily open interest along the curvethousand contracts
Source: JPMorgan, Bloomberg
0
5
10
15
20
25
30
HG1 HG2 HG3 HG4 HG5 HG6 HG7 HG8 HG9 HG10 HG11 HG12
1996 2001 2006
Industrial Metals – COMEX CopperJPMCCI COMEX Copper: performance vs other indicesexcess returns
JPMCCI S&P GSCI DJ-AIGCIAnnual returns1990 21.4% – –1991 -8.5% – -11.2%1992 5.9% – 5.8%1993 -22.1% – -22.9%1994 63.8% – 70.7%1995 3.7% – 2.4%1996 -8.5% – -4.8%1997 -13.1% – -14.1%1998 -17.7% – -18.0%1999 20.3% – 20.0%2000 -5.9% – -7.0%2001 -24.7% – -25.6%2002 1.9% – 1.8%2003 44.2% – 44.6%2004 45.7% – 42.2%2005 60.4% – 56.1%2006 48.2% – 45.1%Sep 2007 27.4% – 26.1%1991 to Sep 2007Cum return 363.8% – 322.4%Ann return 9.6% – 9.0%Volatility 23.1% – 23.7%Sharpe ratio 0.42 – 0.381997 to Sep 2007Cum return 295.3% – 250.0%Ann return 13.6% – 12.4%Volatility 25.0% – 25.4%Sharpe ratio 0.55 – 0.492002 to Sep 2007Cum return 548.4% – 497.9%Ann return 38.4% – 36.5%Volatility 27.0% – 27.3%Sharpe ratio 1.42 – 1.33Source: JPMorgan and index sponsors
JPMCCI COMEX Copper: performance vs other indicesindex, excess returns
Source: JPMorgan and index sponsors
0
100
200
300
400
500
600
700
Dec 01 Dec 02 Dec 03 Dec 04 Dec 05 Dec 06
JPMCCI DJ-AIGCI
JPMCCI S&P GSCI DJ-AIGCI1991 to Sep 2007Cum Roll 140.3% – –Average Ann Roll 2.6% - -Ann Roll Volatility 7.4% - -Source: JPMorgan and index sponsors
JPMCCI COMEX Copper: roll return vs other indices

41
Global Commodity ResearchIntroducing the JPMorgan Commodity Curve IndexNovember 9, 2007
J.P. Morgan Securities Ltd.Jennie ByunAC (44-20) [email protected]
Gerald Tan (44-20) [email protected]
• Distribution along the curve. Open interest grew by 64.3%from 1996 to 2001, and grew by 189.8% from 2001 to 2006,based on the 12 frontmost contracts. In the later period,open interest grew the most in the later part of the curve.Whereas open interest in the two frontmost contractsaccounted for 65.2% of open interest in the 12 frontmostcontracts, this proportion was 56.1% in 2006, suggesting amild increase in dispersion of positions across the curve.In tandem with this, positions appear to be increasing inabsolute terms further out the curve.
• Performance. JPMCCI Corn produced an annualizedexcess return of -3.7% from 2002 to September 2007,outperforming S&P GSCI by 4.2% and DJ-AIGCI by 4.2%.The index volatility during this period was 24.1%, which islower than S&P GSCI by 1.8% and DJ-AIGCI by 1.8%.This results in a Sharpe ratio of -0.15 for JPMCCI,compared to S&P GSCI (-0.31) and DJ-AIGCI (-0.31).
• Roll return. JPMCCI Corn average roll returns, on anannual basis, was -15.2% from 2002 to September 2007.This compares to -19.7% for S&P GSCI. JPMCCI Cornaverage annual roll returns were -14.0% from 1997 toSeptember 2007 and -10.7% from 1991 to September 2007.
Corn: average of daily open interest along the curvethousand contracts
Source: JPMorgan, Bloomberg
0
50
100
150
200
250
300
350
400
450
C 1 C 2 C 3 C 4 C 5 C 6 C 7 C 8 C 9 C 10 C 11 C 12
1996 2001 2006
JPMCCI Corn: performance vs other indicesexcess returns
JPMCCI S&P GSCI DJ-AIGCIAnnual returns1990 -6.9% -7.2% –1991 -1.6% -4.4% -4.4%1992 -20.9% -23.6% -23.6%1993 21.9% 23.1% 23.2%1994 -25.4% -30.3% -30.3%1995 42.9% 43.8% 43.8%1996 -10.7% -10.6% -10.1%1997 4.0% 2.2% 2.3%1998 -29.3% -32.2% -32.2%1999 -18.7% -20.7% -20.6%2000 -7.9% -10.5% -10.5%2001 -26.4% -28.1% -28.1%2002 -2.2% -4.1% -4.1%2003 -2.4% -3.7% -3.7%2004 -23.4% -29.3% -29.4%2005 -14.8% -18.4% -18.4%2006 43.4% 40.0% 40.0%Sep 2007 -9.9% -16.4% -16.4%1991 to Sep 2007Cum return -70.5% -82.2% -82.1%Ann return -7.0% -9.8% -9.8%Volatility 21.0% 22.3% 22.3%Sharpe ratio -0.33 -0.44 -0.441997 to Sep 2007Cum return -67.3% -78.0% -77.9%Ann return -9.9% -13.1% -13.1%Volatility 22.3% 23.8% 23.8%Sharpe ratio -0.44 -0.55 -0.552002 to Sep 2007Cum return -19.4% -37.7% -37.7%Ann return -3.7% -7.9% -7.9%Volatility 24.1% 25.9% 25.9%Sharpe ratio -0.15 -0.31 -0.31Source: JPMorgan and index sponsors
JPMCCI Corn: performance vs other indicesindex, excess returns
Source: JPMorgan and index sponsors
0
20
40
60
80
100
120
140
Dec 01 Dec 02 Dec 03 Dec 04 Dec 05 Dec 06
JPMCCI S&P GSCI DJ-AIGCI
Agriculture – CBOT Corn
JPMCCI S&P GSCI DJ-AIGCI1991 to Sep 2007Cum Roll -132.4% -143.2% –Average Ann Roll -10.7% -13.7% -Ann Roll Volatility 10.5% 12.3% -Source: JPMorgan and index sponsors
JPMCCI Corn: roll return vs other indices
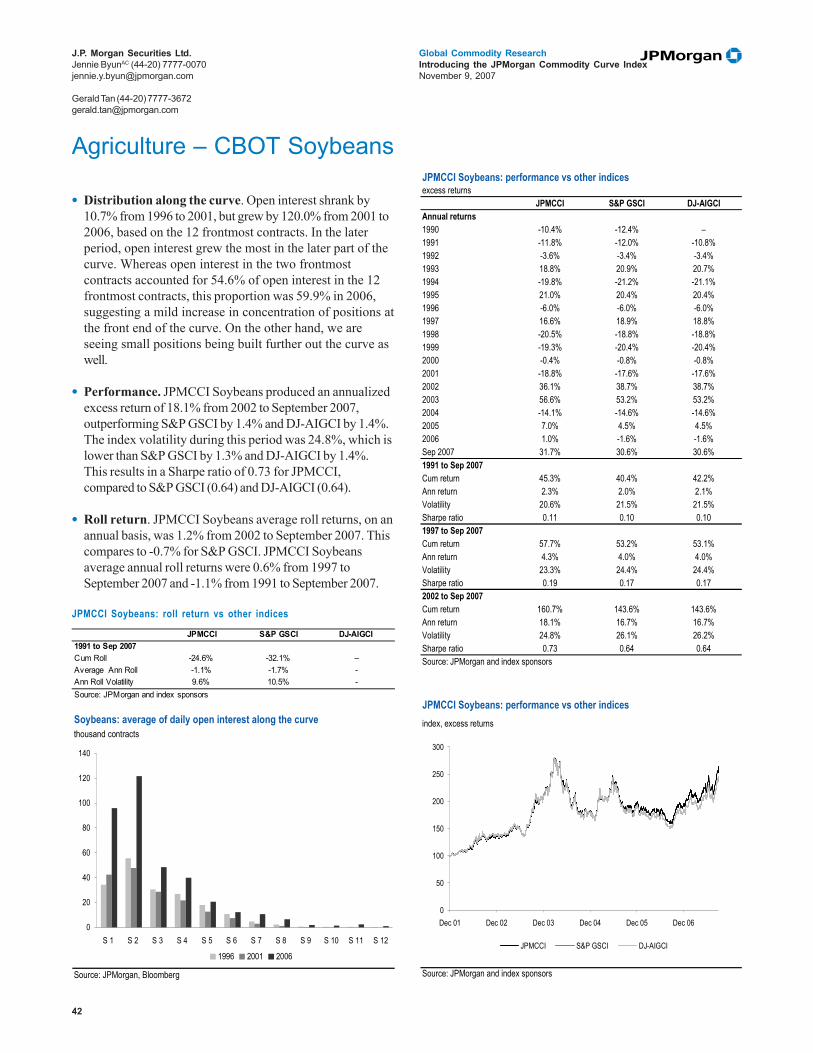
42
Global Commodity ResearchIntroducing the JPMorgan Commodity Curve IndexNovember 9, 2007
J.P. Morgan Securities Ltd.Jennie ByunAC (44-20) [email protected]
Gerald Tan (44-20) [email protected]
• Distribution along the curve. Open interest shrank by10.7% from 1996 to 2001, but grew by 120.0% from 2001 to2006, based on the 12 frontmost contracts. In the laterperiod, open interest grew the most in the later part of thecurve. Whereas open interest in the two frontmostcontracts accounted for 54.6% of open interest in the 12frontmost contracts, this proportion was 59.9% in 2006,suggesting a mild increase in concentration of positions atthe front end of the curve. On the other hand, we areseeing small positions being built further out the curve aswell.
• Performance. JPMCCI Soybeans produced an annualizedexcess return of 18.1% from 2002 to September 2007,outperforming S&P GSCI by 1.4% and DJ-AIGCI by 1.4%.The index volatility during this period was 24.8%, which islower than S&P GSCI by 1.3% and DJ-AIGCI by 1.4%.This results in a Sharpe ratio of 0.73 for JPMCCI,compared to S&P GSCI (0.64) and DJ-AIGCI (0.64).
• Roll return. JPMCCI Soybeans average roll returns, on anannual basis, was 1.2% from 2002 to September 2007. Thiscompares to -0.7% for S&P GSCI. JPMCCI Soybeansaverage annual roll returns were 0.6% from 1997 toSeptember 2007 and -1.1% from 1991 to September 2007.
Soybeans: average of daily open interest along the curvethousand contracts
Source: JPMorgan, Bloomberg
0
20
40
60
80
100
120
140
S 1 S 2 S 3 S 4 S 5 S 6 S 7 S 8 S 9 S 10 S 11 S 12
1996 2001 2006
JPMCCI Soybeans: performance vs other indicesexcess returns
JPMCCI S&P GSCI DJ-AIGCIAnnual returns1990 -10.4% -12.4% –1991 -11.8% -12.0% -10.8%1992 -3.6% -3.4% -3.4%1993 18.8% 20.9% 20.7%1994 -19.8% -21.2% -21.1%1995 21.0% 20.4% 20.4%1996 -6.0% -6.0% -6.0%1997 16.6% 18.9% 18.8%1998 -20.5% -18.8% -18.8%1999 -19.3% -20.4% -20.4%2000 -0.4% -0.8% -0.8%2001 -18.8% -17.6% -17.6%2002 36.1% 38.7% 38.7%2003 56.6% 53.2% 53.2%2004 -14.1% -14.6% -14.6%2005 7.0% 4.5% 4.5%2006 1.0% -1.6% -1.6%Sep 2007 31.7% 30.6% 30.6%1991 to Sep 2007Cum return 45.3% 40.4% 42.2%Ann return 2.3% 2.0% 2.1%Volatility 20.6% 21.5% 21.5%Sharpe ratio 0.11 0.10 0.101997 to Sep 2007Cum return 57.7% 53.2% 53.1%Ann return 4.3% 4.0% 4.0%Volatility 23.3% 24.4% 24.4%Sharpe ratio 0.19 0.17 0.172002 to Sep 2007Cum return 160.7% 143.6% 143.6%Ann return 18.1% 16.7% 16.7%Volatility 24.8% 26.1% 26.2%Sharpe ratio 0.73 0.64 0.64Source: JPMorgan and index sponsors
JPMCCI Soybeans: performance vs other indicesindex, excess returns
Source: JPMorgan and index sponsors
0
50
100
150
200
250
300
Dec 01 Dec 02 Dec 03 Dec 04 Dec 05 Dec 06
JPMCCI S&P GSCI DJ-AIGCI
Agriculture – CBOT Soybeans
JPMCCI S&P GSCI DJ-AIGCI1991 to Sep 2007Cum Roll -24.6% -32.1% –Average Ann Roll -1.1% -1.7% -Ann Roll Volatility 9.6% 10.5% -Source: JPMorgan and index sponsors
JPMCCI Soybeans: roll return vs other indices
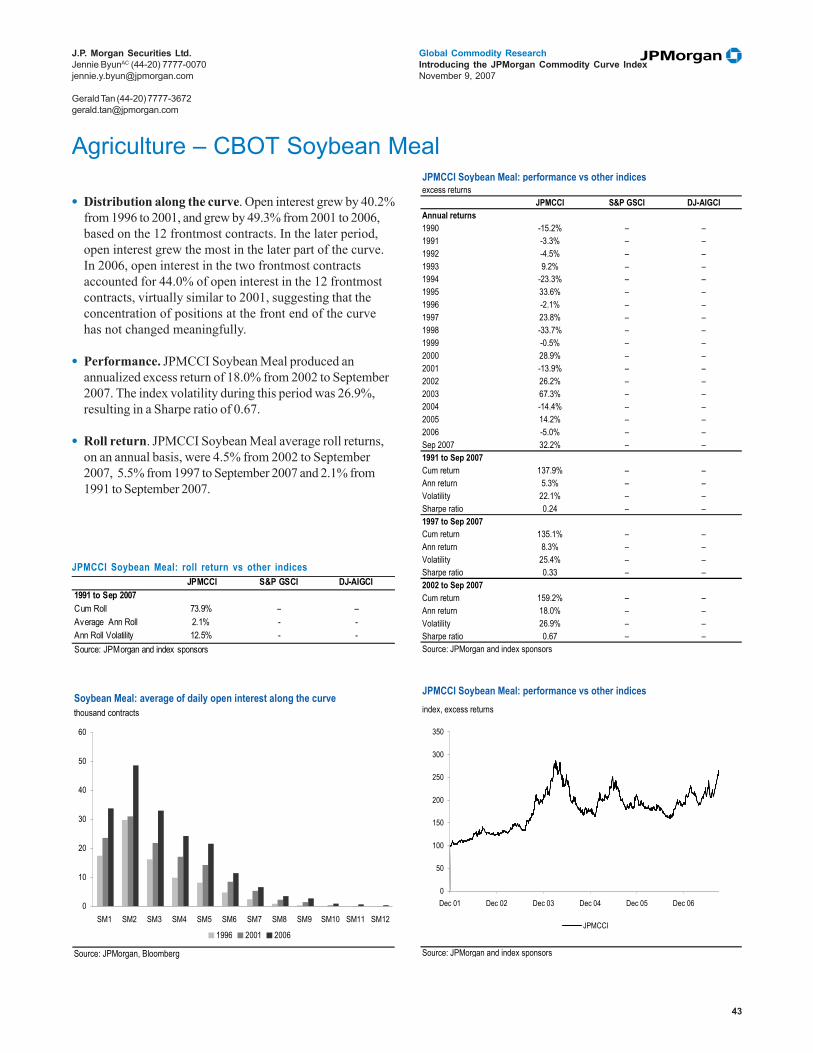
43
Global Commodity ResearchIntroducing the JPMorgan Commodity Curve IndexNovember 9, 2007
J.P. Morgan Securities Ltd.Jennie ByunAC (44-20) [email protected]
Gerald Tan (44-20) [email protected]
• Distribution along the curve. Open interest grew by 40.2%from 1996 to 2001, and grew by 49.3% from 2001 to 2006,based on the 12 frontmost contracts. In the later period,open interest grew the most in the later part of the curve.In 2006, open interest in the two frontmost contractsaccounted for 44.0% of open interest in the 12 frontmostcontracts, virtually similar to 2001, suggesting that theconcentration of positions at the front end of the curvehas not changed meaningfully.
• Performance. JPMCCI Soybean Meal produced anannualized excess return of 18.0% from 2002 to September2007. The index volatility during this period was 26.9%,resulting in a Sharpe ratio of 0.67.
• Roll return. JPMCCI Soybean Meal average roll returns,on an annual basis, were 4.5% from 2002 to September2007, 5.5% from 1997 to September 2007 and 2.1% from1991 to September 2007.
Soybean Meal: average of daily open interest along the curvethousand contracts
Source: JPMorgan, Bloomberg
0
10
20
30
40
50
60
SM1 SM2 SM3 SM4 SM5 SM6 SM7 SM8 SM9 SM10 SM11 SM12
1996 2001 2006
JPMCCI Soybean Meal: performance vs other indicesexcess returns
JPMCCI S&P GSCI DJ-AIGCIAnnual returns1990 -15.2% – –1991 -3.3% – –1992 -4.5% – –1993 9.2% – –1994 -23.3% – –1995 33.6% – –1996 -2.1% – –1997 23.8% – –1998 -33.7% – –1999 -0.5% – –2000 28.9% – –2001 -13.9% – –2002 26.2% – –2003 67.3% – –2004 -14.4% – –2005 14.2% – –2006 -5.0% – –Sep 2007 32.2% – –1991 to Sep 2007Cum return 137.9% – –Ann return 5.3% – –Volatility 22.1% – –Sharpe ratio 0.24 – –1997 to Sep 2007Cum return 135.1% – –Ann return 8.3% – –Volatility 25.4% – –Sharpe ratio 0.33 – –2002 to Sep 2007Cum return 159.2% – –Ann return 18.0% – –Volatility 26.9% – –Sharpe ratio 0.67 – –Source: JPMorgan and index sponsors
JPMCCI Soybean Meal: performance vs other indicesindex, excess returns
Source: JPMorgan and index sponsors
0
50
100
150
200
250
300
350
Dec 01 Dec 02 Dec 03 Dec 04 Dec 05 Dec 06
JPMCCI
Agriculture – CBOT Soybean Meal
JPMCCI S&P GSCI DJ-AIGCI1991 to Sep 2007Cum Roll 73.9% – –Average Ann Roll 2.1% - -Ann Roll Volatility 12.5% - -Source: JPMorgan and index sponsors
JPMCCI Soybean Meal: roll return vs other indices

44
Global Commodity ResearchIntroducing the JPMorgan Commodity Curve IndexNovember 9, 2007
J.P. Morgan Securities Ltd.Jennie ByunAC (44-20) [email protected]
Gerald Tan (44-20) [email protected]
• Distribution along the curve. Open interest grew by 67.8%from 1996 to 2001, and grew by 58.2% from 2001 to 2006,based on the 12 frontmost contracts. In the later period,open interest grew the most in the later part of the curve;the increase in open interest in the 9th to 12th contract,although low in absolute terms, are, in 2006, five times thelevel seen in 2001. In 2006, open interest in the twofrontmost contracts accounted for 47.5% of open interestin the 12 frontmost contracts, virtually similar to 2001,suggesting that the concentration of positions at the frontend of the curve has not changed meaningfully.
• Performance. JPMCCI Soybean Oil produced anannualized excess return of 16.5% from 2002 to September2007, outperforming DJ-AIGCI by 2.1%. The indexvolatility during this period was 25.4%, which is higherthan DJ-AIGCI by 1.1%. This results in a Sharpe ratio of0.65 for JPMCCI, compared to DJ-AIGCI (0.54).
• Roll return. JPMCCI Soybean Oil average roll returns, onan annual basis, were -2.6% from 2002 to September 2007,-5.1% from 1997 to September 2007 and -4.2% from 1991 toSeptember 2007.
Soybean Oil: average of daily open interest along the curvethousand contracts
Source: JPMorgan, Bloomberg
0
10
20
30
40
50
60
70
80
BO1 BO2 BO3 BO4 BO5 BO6 BO7 BO8 BO9 BO10 BO11 BO12
1996 2001 2006
JPMCCI Soybean Oil: performance vs other indicesexcess returns
JPMCCI S&P GSCI DJ-AIGCIAnnual returns1990 5.6% – –1991 -18.3% – -18.0%1992 1.3% – 1.7%1993 34.8% – 35.3%1994 4.6% – 5.0%1995 -3.6% – -6.5%1996 -15.9% – -16.3%1997 1.5% – 0.0%1998 -11.5% – -12.3%1999 -37.0% – -37.6%2000 -18.8% – -19.7%2001 -7.8% – -8.0%2002 30.5% – 30.1%2003 36.4% – 32.9%2004 -14.5% – -16.3%2005 1.0% – -1.7%2006 23.8% 21.6% 21.2%Sep 2007 26.3% 25.6% 25.6%1991 to Sep 2007Cum return -3.9% – -18.8%Ann return -0.2% – -1.2%Volatility 22.3% – 23.0%Sharpe ratio -0.01 – -0.051997 to Sep 2007Cum return 1.7% – -12.4%Ann return 0.2% – -1.2%Volatility 24.9% – 25.7%Sharpe ratio 0.01 – -0.052002 to Sep 2007Cum return 140.3% – 116.4%Ann return 16.5% – 14.4%Volatility 25.4% – 26.5%Sharpe ratio 0.65 – 0.54Source: JPMorgan and index sponsors
JPMCCI Soybean Oil: performance vs other indicesindex, excess returns
Source: JPMorgan and index sponsors
0
50
100
150
200
250
300
Dec 01 Dec 02 Dec 03 Dec 04 Dec 05 Dec 06
JPMCCI DJ-AIGCI
Agriculture – CBOT Soybean Oil
JPMCCI S&P GSCI DJ-AIGCI1991 to Sep 2007Cum Roll -93.8% – –Average Ann Roll -4.2% - -Ann Roll Volatility 7.3% - -Source: JPMorgan and index sponsors
JPMCCI Soybean Oil: roll return vs other indices
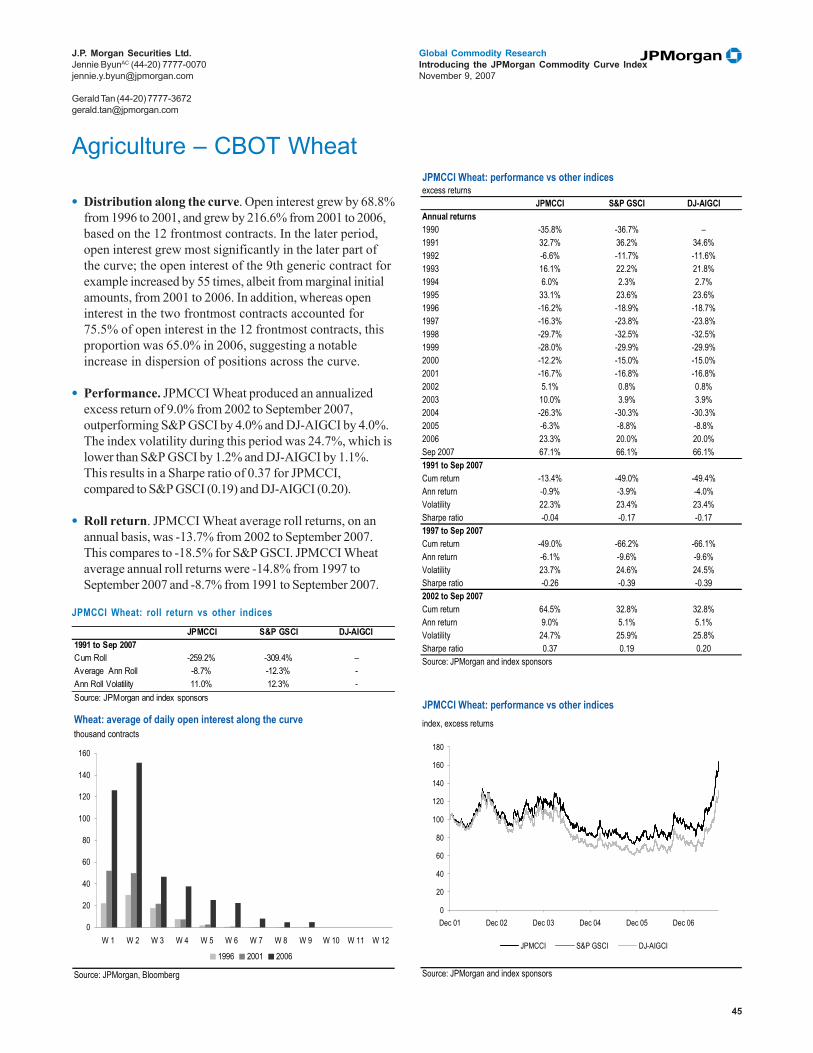
45
Global Commodity ResearchIntroducing the JPMorgan Commodity Curve IndexNovember 9, 2007
J.P. Morgan Securities Ltd.Jennie ByunAC (44-20) [email protected]
Gerald Tan (44-20) [email protected]
• Distribution along the curve. Open interest grew by 68.8%from 1996 to 2001, and grew by 216.6% from 2001 to 2006,based on the 12 frontmost contracts. In the later period,open interest grew most significantly in the later part ofthe curve; the open interest of the 9th generic contract forexample increased by 55 times, albeit from marginal initialamounts, from 2001 to 2006. In addition, whereas openinterest in the two frontmost contracts accounted for75.5% of open interest in the 12 frontmost contracts, thisproportion was 65.0% in 2006, suggesting a notableincrease in dispersion of positions across the curve.
• Performance. JPMCCI Wheat produced an annualizedexcess return of 9.0% from 2002 to September 2007,outperforming S&P GSCI by 4.0% and DJ-AIGCI by 4.0%.The index volatility during this period was 24.7%, which islower than S&P GSCI by 1.2% and DJ-AIGCI by 1.1%.This results in a Sharpe ratio of 0.37 for JPMCCI,compared to S&P GSCI (0.19) and DJ-AIGCI (0.20).
• Roll return. JPMCCI Wheat average roll returns, on anannual basis, was -13.7% from 2002 to September 2007.This compares to -18.5% for S&P GSCI. JPMCCI Wheataverage annual roll returns were -14.8% from 1997 toSeptember 2007 and -8.7% from 1991 to September 2007.
Wheat: average of daily open interest along the curvethousand contracts
Source: JPMorgan, Bloomberg
0
20
40
60
80
100
120
140
160
W 1 W 2 W 3 W 4 W 5 W 6 W 7 W 8 W 9 W 10 W 11 W 12
1996 2001 2006
JPMCCI Wheat: performance vs other indicesexcess returns
JPMCCI S&P GSCI DJ-AIGCIAnnual returns1990 -35.8% -36.7% –1991 32.7% 36.2% 34.6%1992 -6.6% -11.7% -11.6%1993 16.1% 22.2% 21.8%1994 6.0% 2.3% 2.7%1995 33.1% 23.6% 23.6%1996 -16.2% -18.9% -18.7%1997 -16.3% -23.8% -23.8%1998 -29.7% -32.5% -32.5%1999 -28.0% -29.9% -29.9%2000 -12.2% -15.0% -15.0%2001 -16.7% -16.8% -16.8%2002 5.1% 0.8% 0.8%2003 10.0% 3.9% 3.9%2004 -26.3% -30.3% -30.3%2005 -6.3% -8.8% -8.8%2006 23.3% 20.0% 20.0%Sep 2007 67.1% 66.1% 66.1%1991 to Sep 2007Cum return -13.4% -49.0% -49.4%Ann return -0.9% -3.9% -4.0%Volatility 22.3% 23.4% 23.4%Sharpe ratio -0.04 -0.17 -0.171997 to Sep 2007Cum return -49.0% -66.2% -66.1%Ann return -6.1% -9.6% -9.6%Volatility 23.7% 24.6% 24.5%Sharpe ratio -0.26 -0.39 -0.392002 to Sep 2007Cum return 64.5% 32.8% 32.8%Ann return 9.0% 5.1% 5.1%Volatility 24.7% 25.9% 25.8%Sharpe ratio 0.37 0.19 0.20Source: JPMorgan and index sponsors
JPMCCI Wheat: performance vs other indicesindex, excess returns
Source: JPMorgan and index sponsors
0
20
40
60
80
100
120
140
160
180
Dec 01 Dec 02 Dec 03 Dec 04 Dec 05 Dec 06
JPMCCI S&P GSCI DJ-AIGCI
Agriculture – CBOT Wheat
JPMCCI S&P GSCI DJ-AIGCI1991 to Sep 2007Cum Roll -259.2% -309.4% –Average Ann Roll -8.7% -12.3% -Ann Roll Volatility 11.0% 12.3% -Source: JPMorgan and index sponsors
JPMCCI Wheat: roll return vs other indices
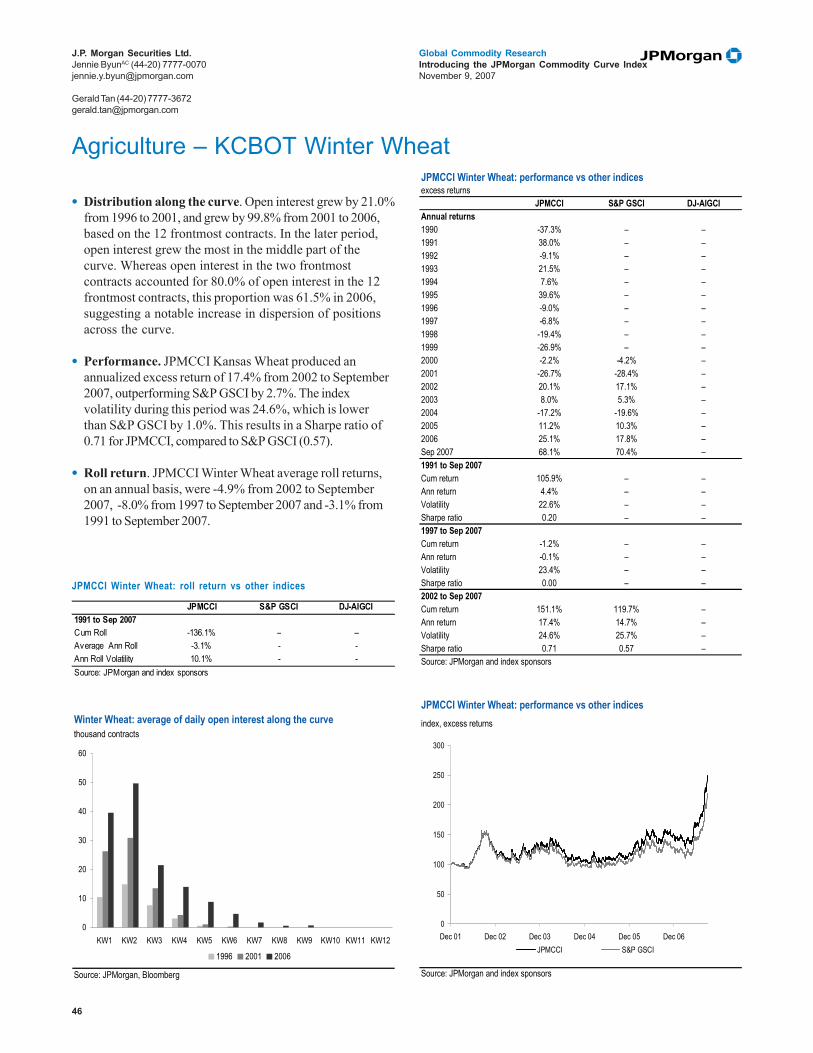
46
Global Commodity ResearchIntroducing the JPMorgan Commodity Curve IndexNovember 9, 2007
J.P. Morgan Securities Ltd.Jennie ByunAC (44-20) [email protected]
Gerald Tan (44-20) [email protected]
• Distribution along the curve. Open interest grew by 21.0%from 1996 to 2001, and grew by 99.8% from 2001 to 2006,based on the 12 frontmost contracts. In the later period,open interest grew the most in the middle part of thecurve. Whereas open interest in the two frontmostcontracts accounted for 80.0% of open interest in the 12frontmost contracts, this proportion was 61.5% in 2006,suggesting a notable increase in dispersion of positionsacross the curve.
• Performance. JPMCCI Kansas Wheat produced anannualized excess return of 17.4% from 2002 to September2007, outperforming S&P GSCI by 2.7%. The indexvolatility during this period was 24.6%, which is lowerthan S&P GSCI by 1.0%. This results in a Sharpe ratio of0.71 for JPMCCI, compared to S&P GSCI (0.57).
• Roll return. JPMCCI Winter Wheat average roll returns,on an annual basis, were -4.9% from 2002 to September2007, -8.0% from 1997 to September 2007 and -3.1% from1991 to September 2007.
Agriculture – KCBOT Winter Wheat
JPMCCI S&P GSCI DJ-AIGCI1991 to Sep 2007Cum Roll -136.1% – –Average Ann Roll -3.1% - -Ann Roll Volatility 10.1% - -Source: JPMorgan and index sponsors
Winter Wheat: average of daily open interest along the curvethousand contracts
Source: JPMorgan, Bloomberg
0
10
20
30
40
50
60
KW1 KW2 KW3 KW4 KW5 KW6 KW7 KW8 KW9 KW10 KW11 KW12
1996 2001 2006
JPMCCI Winter Wheat: roll return vs other indices
JPMCCI Winter Wheat: performance vs other indicesexcess returns
JPMCCI S&P GSCI DJ-AIGCIAnnual returns1990 -37.3% – –1991 38.0% – –1992 -9.1% – –1993 21.5% – –1994 7.6% – –1995 39.6% – –1996 -9.0% – –1997 -6.8% – –1998 -19.4% – –1999 -26.9% – –2000 -2.2% -4.2% –2001 -26.7% -28.4% –2002 20.1% 17.1% –2003 8.0% 5.3% –2004 -17.2% -19.6% –2005 11.2% 10.3% –2006 25.1% 17.8% –Sep 2007 68.1% 70.4% –1991 to Sep 2007Cum return 105.9% – –Ann return 4.4% – –Volatility 22.6% – –Sharpe ratio 0.20 – –1997 to Sep 2007Cum return -1.2% – –Ann return -0.1% – –Volatility 23.4% – –Sharpe ratio 0.00 – –2002 to Sep 2007Cum return 151.1% 119.7% –Ann return 17.4% 14.7% –Volatility 24.6% 25.7% –Sharpe ratio 0.71 0.57 –Source: JPMorgan and index sponsors
JPMCCI Winter Wheat: performance vs other indicesindex, excess returns
Source: JPMorgan and index sponsors
0
50
100
150
200
250
300
Dec 01 Dec 02 Dec 03 Dec 04 Dec 05 Dec 06JPMCCI S&P GSCI

47
Global Commodity ResearchIntroducing the JPMorgan Commodity Curve IndexNovember 9, 2007
J.P. Morgan Securities Ltd.Jennie ByunAC (44-20) [email protected]
Gerald Tan (44-20) [email protected]
• Distribution along the curve. Open interest grew by 21.0%from 1996 to 2001, and grew by 99.8% from 2001 to 2006,based on the 12 frontmost contracts. In the later period,open interest grew the most in the middle part of thecurve. Whereas open interest in the two frontmostcontracts accounted for 80.0% of open interest in the 12frontmost contracts, this proportion was 61.5% in 2006,suggesting a notable increase in dispersion of positionsacross the curve.
• Performance. JPMCCI Spring Wheat produced anannualized excess return of 16.2% from 2002 to September2007. The index volatility during this period was 24.3%,resulting in a Sharpe ratio of 0.67.
• Roll return. JPMCCI Spring Wheat average roll returns,on an annual basis, were -5.1% from 2002 to September2007, -6.5% from 1997 to September 2007 and -3.2% from1991 to September 2007.
JPMCCI Spring Wheat: performance vs other indicesexcess returns
JPMCCI S&P GSCI DJ-AIGCIAnnual returns1990 -37.5% – –1991 29.7% – –1992 -7.1% – –1993 31.2% – –1994 2.2% – –1995 27.6% – –1996 -12.4% – –1997 1.1% – –1998 -8.2% – –1999 -19.9% – –2000 -13.7% – –2001 -20.4% – –2002 15.2% – –2003 6.5% – –2004 -12.5% – –2005 7.6% – –2006 23.7% – –Sep 2007 65.7% – –1991 to Sep 2007Cum return 118.0% – –Ann return 4.8% – –Volatility 21.2% – –Sharpe ratio 0.22 – –1997 to Sep 2007Cum return 20.8% – –Ann return 1.8% – –Volatility 21.4% – –Sharpe ratio 0.08 – –2002 to Sep 2007Cum return 136.8% – –Ann return 16.2% – –Volatility 24.3% – –Sharpe ratio 0.67 – –Source: JPMorgan and index sponsors
JPMCCI Spring Wheat: performance vs other indicesindex, excess returns
Source: JPMorgan and index sponsors
0
50
100
150
200
250
Dec 01 Dec 02 Dec 03 Dec 04 Dec 05 Dec 06
JPMCCI
Spring Wheat: average of daily open interest along the curvethousand contracts
Source: JPMorgan, Bloomberg
0
2
4
6
8
10
12
14
16
18
20
M W1 M W2 M W3 M W4 M W5 M W6 M W7 M W8 M W9 M W10 M W11 M W12
1996 2001 2006
Agriculture – MGE Spring Wheat
JPMCCI S&P GSCI DJ-AIGCI1991 to Sep 2007Cum Roll -126.1% – –Average Ann Roll -3.2% - -Ann Roll Volatility 9.1% - -Source: JPMorgan and index sponsors
JPMCCI Spring Wheat: roll return vs other indices
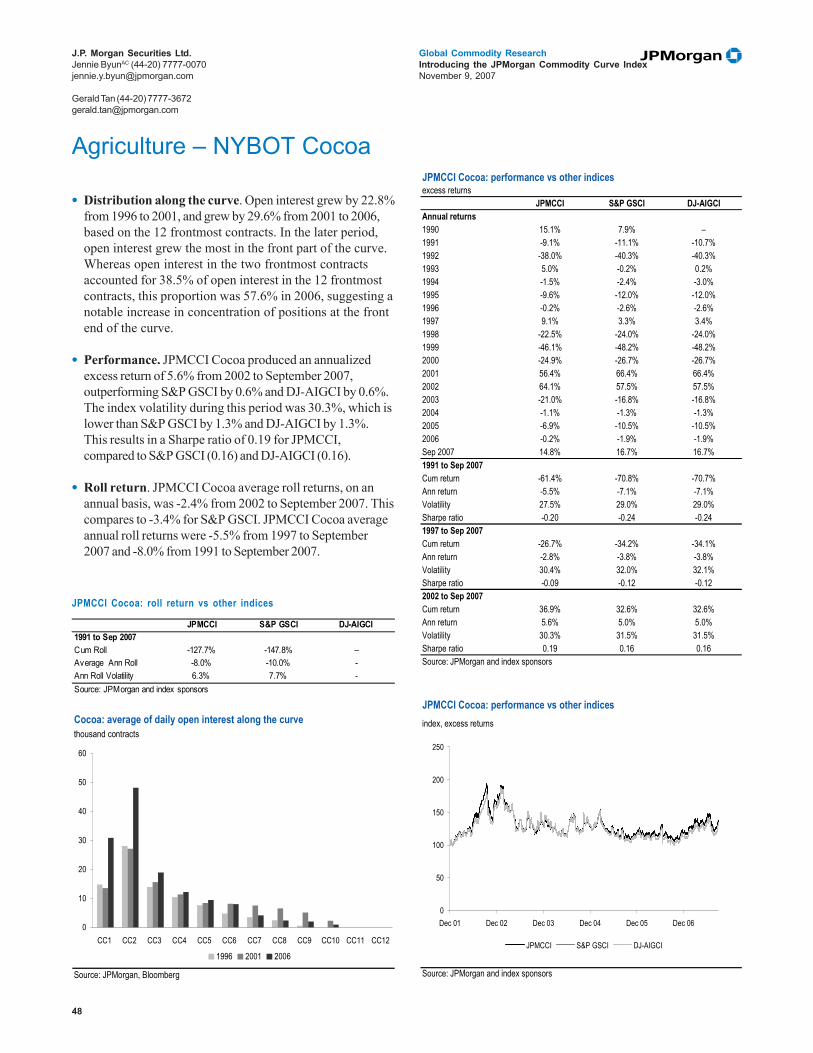
48
Global Commodity ResearchIntroducing the JPMorgan Commodity Curve IndexNovember 9, 2007
J.P. Morgan Securities Ltd.Jennie ByunAC (44-20) [email protected]
Gerald Tan (44-20) [email protected]
• Distribution along the curve. Open interest grew by 22.8%from 1996 to 2001, and grew by 29.6% from 2001 to 2006,based on the 12 frontmost contracts. In the later period,open interest grew the most in the front part of the curve.Whereas open interest in the two frontmost contractsaccounted for 38.5% of open interest in the 12 frontmostcontracts, this proportion was 57.6% in 2006, suggesting anotable increase in concentration of positions at the frontend of the curve.
• Performance. JPMCCI Cocoa produced an annualizedexcess return of 5.6% from 2002 to September 2007,outperforming S&P GSCI by 0.6% and DJ-AIGCI by 0.6%.The index volatility during this period was 30.3%, which islower than S&P GSCI by 1.3% and DJ-AIGCI by 1.3%.This results in a Sharpe ratio of 0.19 for JPMCCI,compared to S&P GSCI (0.16) and DJ-AIGCI (0.16).
• Roll return. JPMCCI Cocoa average roll returns, on anannual basis, was -2.4% from 2002 to September 2007. Thiscompares to -3.4% for S&P GSCI. JPMCCI Cocoa averageannual roll returns were -5.5% from 1997 to September2007 and -8.0% from 1991 to September 2007.
Cocoa: average of daily open interest along the curvethousand contracts
Source: JPMorgan, Bloomberg
0
10
20
30
40
50
60
CC1 CC2 CC3 CC4 CC5 CC6 CC7 CC8 CC9 CC10 CC11 CC12
1996 2001 2006
JPMCCI Cocoa: performance vs other indicesexcess returns
JPMCCI S&P GSCI DJ-AIGCIAnnual returns1990 15.1% 7.9% –1991 -9.1% -11.1% -10.7%1992 -38.0% -40.3% -40.3%1993 5.0% -0.2% 0.2%1994 -1.5% -2.4% -3.0%1995 -9.6% -12.0% -12.0%1996 -0.2% -2.6% -2.6%1997 9.1% 3.3% 3.4%1998 -22.5% -24.0% -24.0%1999 -46.1% -48.2% -48.2%2000 -24.9% -26.7% -26.7%2001 56.4% 66.4% 66.4%2002 64.1% 57.5% 57.5%2003 -21.0% -16.8% -16.8%2004 -1.1% -1.3% -1.3%2005 -6.9% -10.5% -10.5%2006 -0.2% -1.9% -1.9%Sep 2007 14.8% 16.7% 16.7%1991 to Sep 2007Cum return -61.4% -70.8% -70.7%Ann return -5.5% -7.1% -7.1%Volatility 27.5% 29.0% 29.0%Sharpe ratio -0.20 -0.24 -0.241997 to Sep 2007Cum return -26.7% -34.2% -34.1%Ann return -2.8% -3.8% -3.8%Volatility 30.4% 32.0% 32.1%Sharpe ratio -0.09 -0.12 -0.122002 to Sep 2007Cum return 36.9% 32.6% 32.6%Ann return 5.6% 5.0% 5.0%Volatility 30.3% 31.5% 31.5%Sharpe ratio 0.19 0.16 0.16Source: JPMorgan and index sponsors
JPMCCI Cocoa: performance vs other indicesindex, excess returns
Source: JPMorgan and index sponsors
0
50
100
150
200
250
Dec 01 Dec 02 Dec 03 Dec 04 Dec 05 Dec 06
JPMCCI S&P GSCI DJ-AIGCI
Agriculture – NYBOT Cocoa
JPMCCI S&P GSCI DJ-AIGCI1991 to Sep 2007Cum Roll -127.7% -147.8% –Average Ann Roll -8.0% -10.0% -Ann Roll Volatility 6.3% 7.7% -Source: JPMorgan and index sponsors
JPMCCI Cocoa: roll return vs other indices
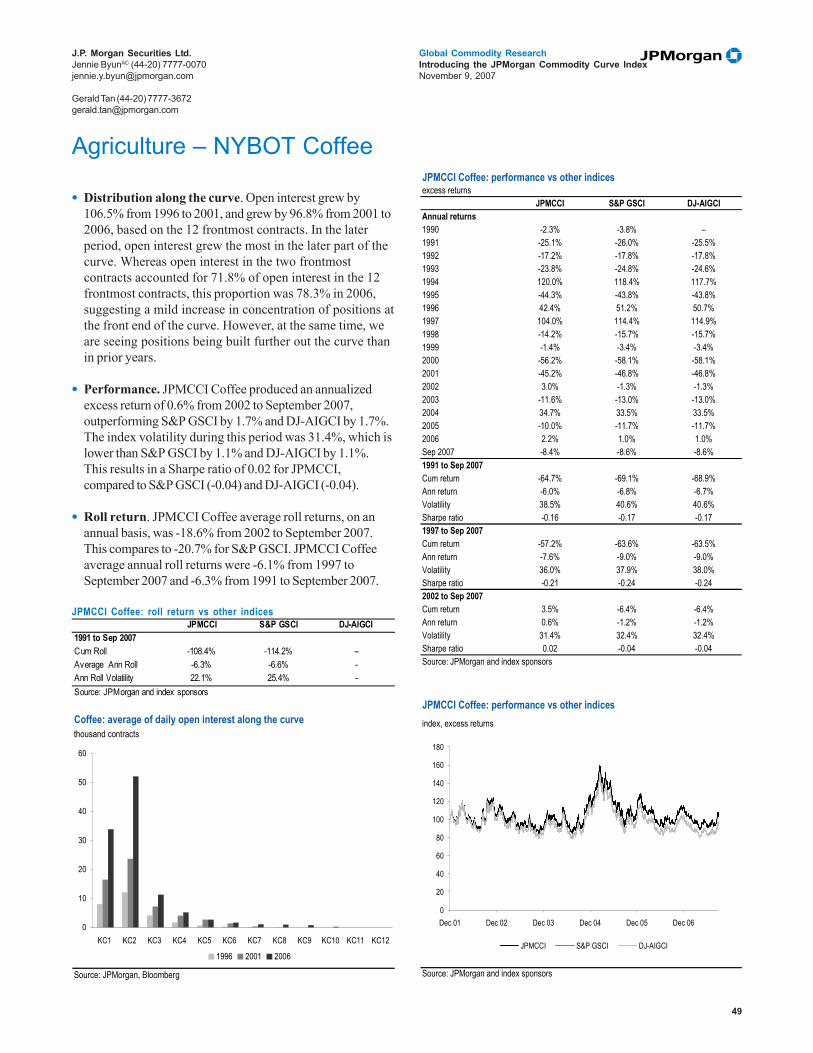
49
Global Commodity ResearchIntroducing the JPMorgan Commodity Curve IndexNovember 9, 2007
J.P. Morgan Securities Ltd.Jennie ByunAC (44-20) [email protected]
Gerald Tan (44-20) [email protected]
• Distribution along the curve. Open interest grew by106.5% from 1996 to 2001, and grew by 96.8% from 2001 to2006, based on the 12 frontmost contracts. In the laterperiod, open interest grew the most in the later part of thecurve. Whereas open interest in the two frontmostcontracts accounted for 71.8% of open interest in the 12frontmost contracts, this proportion was 78.3% in 2006,suggesting a mild increase in concentration of positions atthe front end of the curve. However, at the same time, weare seeing positions being built further out the curve thanin prior years.
• Performance. JPMCCI Coffee produced an annualizedexcess return of 0.6% from 2002 to September 2007,outperforming S&P GSCI by 1.7% and DJ-AIGCI by 1.7%.The index volatility during this period was 31.4%, which islower than S&P GSCI by 1.1% and DJ-AIGCI by 1.1%.This results in a Sharpe ratio of 0.02 for JPMCCI,compared to S&P GSCI (-0.04) and DJ-AIGCI (-0.04).
• Roll return. JPMCCI Coffee average roll returns, on anannual basis, was -18.6% from 2002 to September 2007.This compares to -20.7% for S&P GSCI. JPMCCI Coffeeaverage annual roll returns were -6.1% from 1997 toSeptember 2007 and -6.3% from 1991 to September 2007.
Coffee: average of daily open interest along the curvethousand contracts
Source: JPMorgan, Bloomberg
0
10
20
30
40
50
60
KC1 KC2 KC3 KC4 KC5 KC6 KC7 KC8 KC9 KC10 KC11 KC12
1996 2001 2006
JPMCCI Coffee: performance vs other indicesexcess returns
JPMCCI S&P GSCI DJ-AIGCIAnnual returns1990 -2.3% -3.8% –1991 -25.1% -26.0% -25.5%1992 -17.2% -17.8% -17.8%1993 -23.8% -24.8% -24.6%1994 120.0% 118.4% 117.7%1995 -44.3% -43.8% -43.8%1996 42.4% 51.2% 50.7%1997 104.0% 114.4% 114.9%1998 -14.2% -15.7% -15.7%1999 -1.4% -3.4% -3.4%2000 -56.2% -58.1% -58.1%2001 -45.2% -46.8% -46.8%2002 3.0% -1.3% -1.3%2003 -11.6% -13.0% -13.0%2004 34.7% 33.5% 33.5%2005 -10.0% -11.7% -11.7%2006 2.2% 1.0% 1.0%Sep 2007 -8.4% -8.6% -8.6%1991 to Sep 2007Cum return -64.7% -69.1% -68.9%Ann return -6.0% -6.8% -6.7%Volatility 38.5% 40.6% 40.6%Sharpe ratio -0.16 -0.17 -0.171997 to Sep 2007Cum return -57.2% -63.6% -63.5%Ann return -7.6% -9.0% -9.0%Volatility 36.0% 37.9% 38.0%Sharpe ratio -0.21 -0.24 -0.242002 to Sep 2007Cum return 3.5% -6.4% -6.4%Ann return 0.6% -1.2% -1.2%Volatility 31.4% 32.4% 32.4%Sharpe ratio 0.02 -0.04 -0.04Source: JPMorgan and index sponsors
JPMCCI Coffee: performance vs other indicesindex, excess returns
Source: JPMorgan and index sponsors
0
20
40
60
80
100
120
140
160
180
Dec 01 Dec 02 Dec 03 Dec 04 Dec 05 Dec 06
JPMCCI S&P GSCI DJ-AIGCI
Agriculture – NYBOT Coffee
JPMCCI S&P GSCI DJ-AIGCI1991 to Sep 2007Cum Roll -108.4% -114.2% –Average Ann Roll -6.3% -6.6% -Ann Roll Volatility 22.1% 25.4% -Source: JPMorgan and index sponsors
JPMCCI Coffee: roll return vs other indices
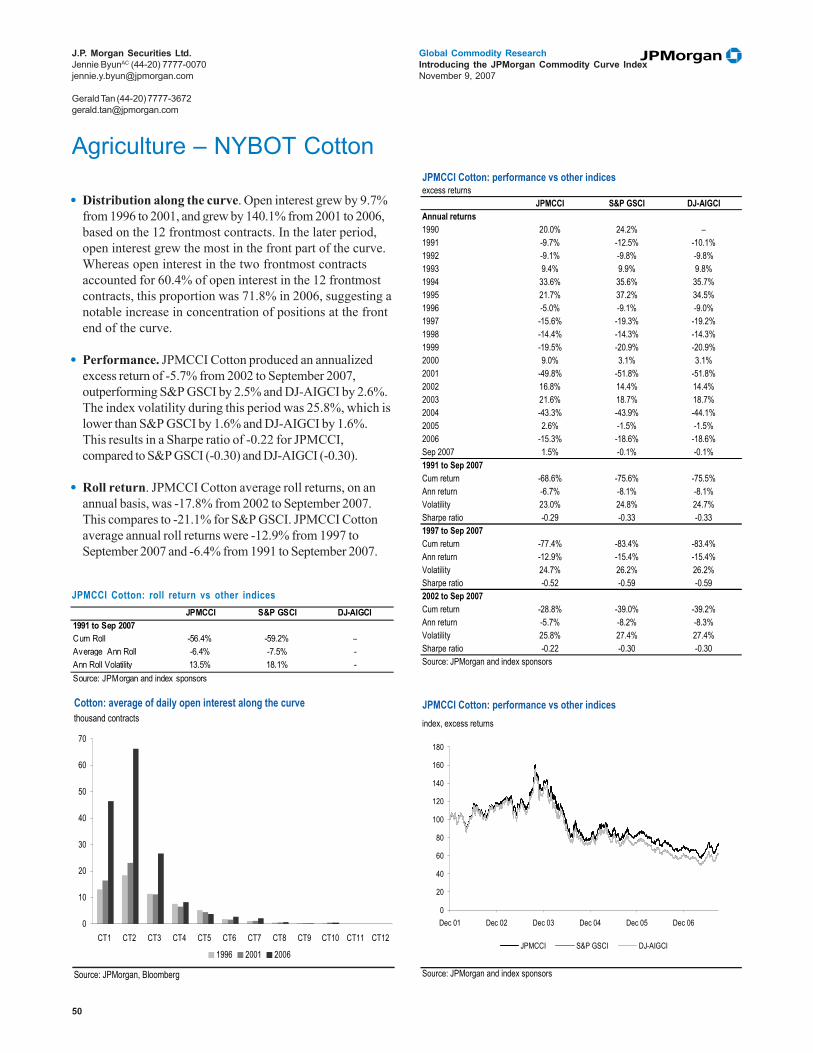
50
Global Commodity ResearchIntroducing the JPMorgan Commodity Curve IndexNovember 9, 2007
J.P. Morgan Securities Ltd.Jennie ByunAC (44-20) [email protected]
Gerald Tan (44-20) [email protected]
• Distribution along the curve. Open interest grew by 9.7%from 1996 to 2001, and grew by 140.1% from 2001 to 2006,based on the 12 frontmost contracts. In the later period,open interest grew the most in the front part of the curve.Whereas open interest in the two frontmost contractsaccounted for 60.4% of open interest in the 12 frontmostcontracts, this proportion was 71.8% in 2006, suggesting anotable increase in concentration of positions at the frontend of the curve.
• Performance. JPMCCI Cotton produced an annualizedexcess return of -5.7% from 2002 to September 2007,outperforming S&P GSCI by 2.5% and DJ-AIGCI by 2.6%.The index volatility during this period was 25.8%, which islower than S&P GSCI by 1.6% and DJ-AIGCI by 1.6%.This results in a Sharpe ratio of -0.22 for JPMCCI,compared to S&P GSCI (-0.30) and DJ-AIGCI (-0.30).
• Roll return. JPMCCI Cotton average roll returns, on anannual basis, was -17.8% from 2002 to September 2007.This compares to -21.1% for S&P GSCI. JPMCCI Cottonaverage annual roll returns were -12.9% from 1997 toSeptember 2007 and -6.4% from 1991 to September 2007.
Cotton: average of daily open interest along the curvethousand contracts
Source: JPMorgan, Bloomberg
0
10
20
30
40
50
60
70
CT1 CT2 CT3 CT4 CT5 CT6 CT7 CT8 CT9 CT10 CT11 CT12
1996 2001 2006
JPMCCI Cotton: performance vs other indicesexcess returns
JPMCCI S&P GSCI DJ-AIGCIAnnual returns1990 20.0% 24.2% –1991 -9.7% -12.5% -10.1%1992 -9.1% -9.8% -9.8%1993 9.4% 9.9% 9.8%1994 33.6% 35.6% 35.7%1995 21.7% 37.2% 34.5%1996 -5.0% -9.1% -9.0%1997 -15.6% -19.3% -19.2%1998 -14.4% -14.3% -14.3%1999 -19.5% -20.9% -20.9%2000 9.0% 3.1% 3.1%2001 -49.8% -51.8% -51.8%2002 16.8% 14.4% 14.4%2003 21.6% 18.7% 18.7%2004 -43.3% -43.9% -44.1%2005 2.6% -1.5% -1.5%2006 -15.3% -18.6% -18.6%Sep 2007 1.5% -0.1% -0.1%1991 to Sep 2007Cum return -68.6% -75.6% -75.5%Ann return -6.7% -8.1% -8.1%Volatility 23.0% 24.8% 24.7%Sharpe ratio -0.29 -0.33 -0.331997 to Sep 2007Cum return -77.4% -83.4% -83.4%Ann return -12.9% -15.4% -15.4%Volatility 24.7% 26.2% 26.2%Sharpe ratio -0.52 -0.59 -0.592002 to Sep 2007Cum return -28.8% -39.0% -39.2%Ann return -5.7% -8.2% -8.3%Volatility 25.8% 27.4% 27.4%Sharpe ratio -0.22 -0.30 -0.30Source: JPMorgan and index sponsors
JPMCCI Cotton: performance vs other indicesindex, excess returns
Source: JPMorgan and index sponsors
0
20
40
60
80
100
120
140
160
180
Dec 01 Dec 02 Dec 03 Dec 04 Dec 05 Dec 06
JPMCCI S&P GSCI DJ-AIGCI
Agriculture – NYBOT Cotton
JPMCCI S&P GSCI DJ-AIGCI1991 to Sep 2007Cum Roll -56.4% -59.2% –Average Ann Roll -6.4% -7.5% -Ann Roll Volatility 13.5% 18.1% -Source: JPMorgan and index sponsors
JPMCCI Cotton: roll return vs other indices
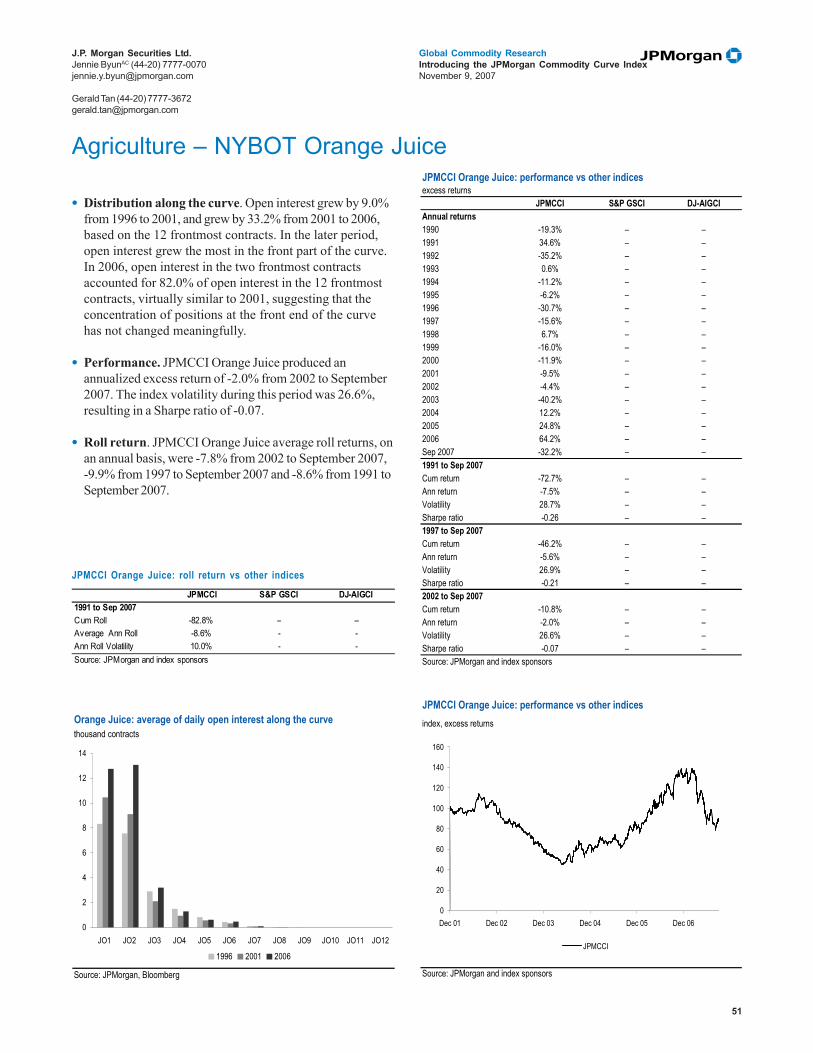
51
Global Commodity ResearchIntroducing the JPMorgan Commodity Curve IndexNovember 9, 2007
J.P. Morgan Securities Ltd.Jennie ByunAC (44-20) [email protected]
Gerald Tan (44-20) [email protected]
• Distribution along the curve. Open interest grew by 9.0%from 1996 to 2001, and grew by 33.2% from 2001 to 2006,based on the 12 frontmost contracts. In the later period,open interest grew the most in the front part of the curve.In 2006, open interest in the two frontmost contractsaccounted for 82.0% of open interest in the 12 frontmostcontracts, virtually similar to 2001, suggesting that theconcentration of positions at the front end of the curvehas not changed meaningfully.
• Performance. JPMCCI Orange Juice produced anannualized excess return of -2.0% from 2002 to September2007. The index volatility during this period was 26.6%,resulting in a Sharpe ratio of -0.07.
• Roll return. JPMCCI Orange Juice average roll returns, onan annual basis, were -7.8% from 2002 to September 2007,-9.9% from 1997 to September 2007 and -8.6% from 1991 toSeptember 2007.
Orange Juice: average of daily open interest along the curvethousand contracts
Source: JPMorgan, Bloomberg
0
2
4
6
8
10
12
14
JO1 JO2 JO3 JO4 JO5 JO6 JO7 JO8 JO9 JO10 JO11 JO12
1996 2001 2006
JPMCCI Orange Juice: performance vs other indicesexcess returns
JPMCCI S&P GSCI DJ-AIGCIAnnual returns1990 -19.3% – –1991 34.6% – –1992 -35.2% – –1993 0.6% – –1994 -11.2% – –1995 -6.2% – –1996 -30.7% – –1997 -15.6% – –1998 6.7% – –1999 -16.0% – –2000 -11.9% – –2001 -9.5% – –2002 -4.4% – –2003 -40.2% – –2004 12.2% – –2005 24.8% – –2006 64.2% – –Sep 2007 -32.2% – –1991 to Sep 2007Cum return -72.7% – –Ann return -7.5% – –Volatility 28.7% – –Sharpe ratio -0.26 – –1997 to Sep 2007Cum return -46.2% – –Ann return -5.6% – –Volatility 26.9% – –Sharpe ratio -0.21 – –2002 to Sep 2007Cum return -10.8% – –Ann return -2.0% – –Volatility 26.6% – –Sharpe ratio -0.07 – –Source: JPMorgan and index sponsors
JPMCCI Orange Juice: performance vs other indicesindex, excess returns
Source: JPMorgan and index sponsors
0
20
40
60
80
100
120
140
160
Dec 01 Dec 02 Dec 03 Dec 04 Dec 05 Dec 06
JPMCCI
Agriculture – NYBOT Orange Juice
JPMCCI S&P GSCI DJ-AIGCI1991 to Sep 2007Cum Roll -82.8% – –Average Ann Roll -8.6% - -Ann Roll Volatility 10.0% - -Source: JPMorgan and index sponsors
JPMCCI Orange Juice: roll return vs other indices
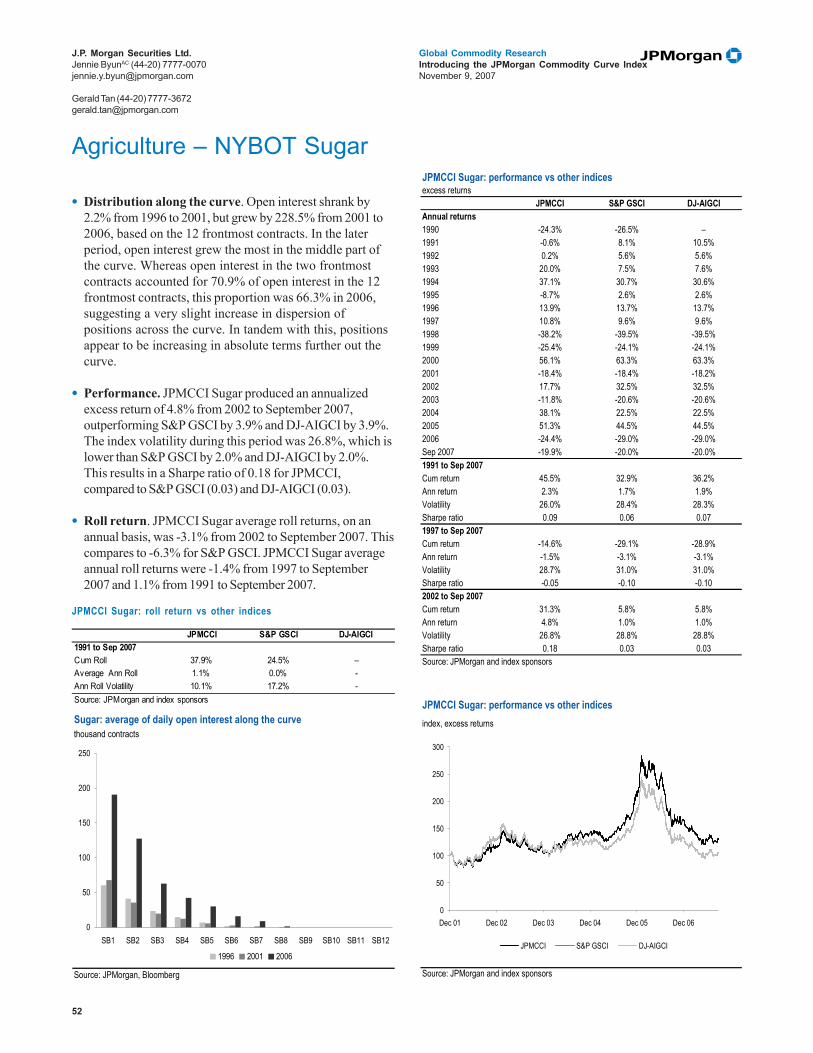
52
Global Commodity ResearchIntroducing the JPMorgan Commodity Curve IndexNovember 9, 2007
J.P. Morgan Securities Ltd.Jennie ByunAC (44-20) [email protected]
Gerald Tan (44-20) [email protected]
• Distribution along the curve. Open interest shrank by2.2% from 1996 to 2001, but grew by 228.5% from 2001 to2006, based on the 12 frontmost contracts. In the laterperiod, open interest grew the most in the middle part ofthe curve. Whereas open interest in the two frontmostcontracts accounted for 70.9% of open interest in the 12frontmost contracts, this proportion was 66.3% in 2006,suggesting a very slight increase in dispersion ofpositions across the curve. In tandem with this, positionsappear to be increasing in absolute terms further out thecurve.
• Performance. JPMCCI Sugar produced an annualizedexcess return of 4.8% from 2002 to September 2007,outperforming S&P GSCI by 3.9% and DJ-AIGCI by 3.9%.The index volatility during this period was 26.8%, which islower than S&P GSCI by 2.0% and DJ-AIGCI by 2.0%.This results in a Sharpe ratio of 0.18 for JPMCCI,compared to S&P GSCI (0.03) and DJ-AIGCI (0.03).
• Roll return. JPMCCI Sugar average roll returns, on anannual basis, was -3.1% from 2002 to September 2007. Thiscompares to -6.3% for S&P GSCI. JPMCCI Sugar averageannual roll returns were -1.4% from 1997 to September2007 and 1.1% from 1991 to September 2007.
Sugar: average of daily open interest along the curvethousand contracts
Source: JPMorgan, Bloomberg
0
50
100
150
200
250
SB1 SB2 SB3 SB4 SB5 SB6 SB7 SB8 SB9 SB10 SB11 SB12
1996 2001 2006
JPMCCI Sugar: performance vs other indicesexcess returns
JPMCCI S&P GSCI DJ-AIGCIAnnual returns1990 -24.3% -26.5% –1991 -0.6% 8.1% 10.5%1992 0.2% 5.6% 5.6%1993 20.0% 7.5% 7.6%1994 37.1% 30.7% 30.6%1995 -8.7% 2.6% 2.6%1996 13.9% 13.7% 13.7%1997 10.8% 9.6% 9.6%1998 -38.2% -39.5% -39.5%1999 -25.4% -24.1% -24.1%2000 56.1% 63.3% 63.3%2001 -18.4% -18.4% -18.2%2002 17.7% 32.5% 32.5%2003 -11.8% -20.6% -20.6%2004 38.1% 22.5% 22.5%2005 51.3% 44.5% 44.5%2006 -24.4% -29.0% -29.0%Sep 2007 -19.9% -20.0% -20.0%1991 to Sep 2007Cum return 45.5% 32.9% 36.2%Ann return 2.3% 1.7% 1.9%Volatility 26.0% 28.4% 28.3%Sharpe ratio 0.09 0.06 0.071997 to Sep 2007Cum return -14.6% -29.1% -28.9%Ann return -1.5% -3.1% -3.1%Volatility 28.7% 31.0% 31.0%Sharpe ratio -0.05 -0.10 -0.102002 to Sep 2007Cum return 31.3% 5.8% 5.8%Ann return 4.8% 1.0% 1.0%Volatility 26.8% 28.8% 28.8%Sharpe ratio 0.18 0.03 0.03Source: JPMorgan and index sponsors
JPMCCI Sugar: performance vs other indicesindex, excess returns
Source: JPMorgan and index sponsors
0
50
100
150
200
250
300
Dec 01 Dec 02 Dec 03 Dec 04 Dec 05 Dec 06
JPMCCI S&P GSCI DJ-AIGCI
Agriculture – NYBOT Sugar
JPMCCI S&P GSCI DJ-AIGCI1991 to Sep 2007Cum Roll 37.9% 24.5% –Average Ann Roll 1.1% 0.0% -Ann Roll Volatility 10.1% 17.2% -Source: JPMorgan and index sponsors
JPMCCI Sugar: roll return vs other indices
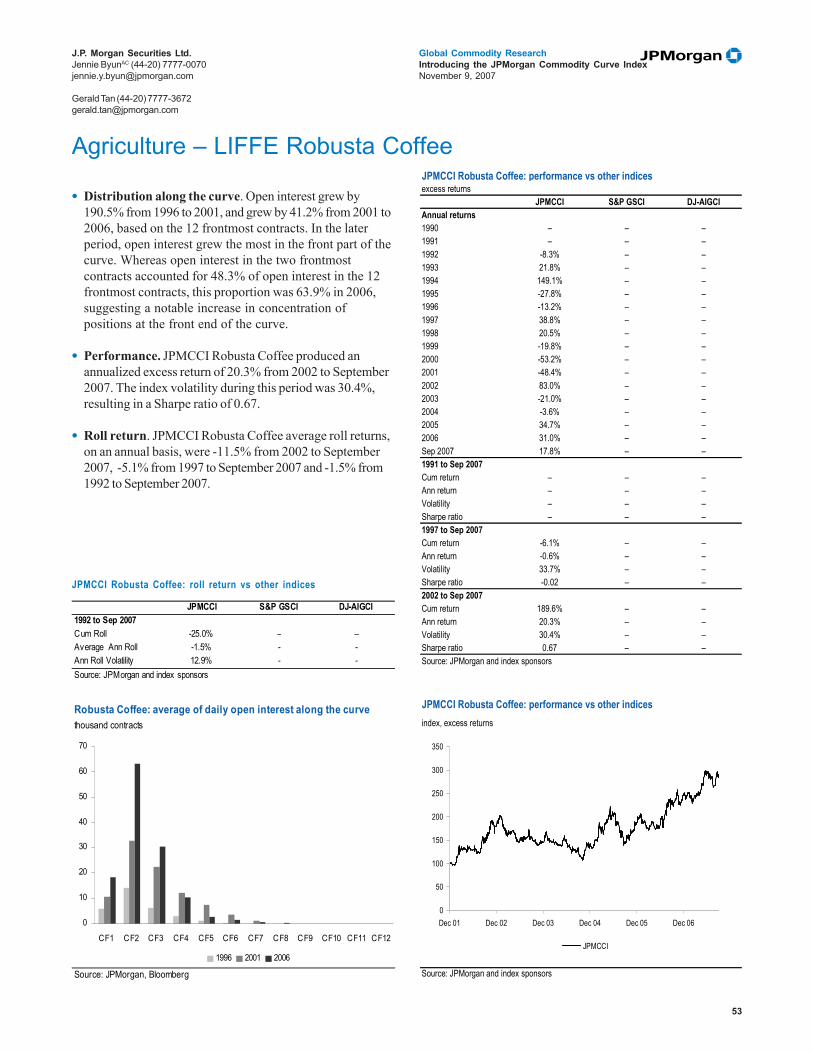
53
Global Commodity ResearchIntroducing the JPMorgan Commodity Curve IndexNovember 9, 2007
J.P. Morgan Securities Ltd.Jennie ByunAC (44-20) [email protected]
Gerald Tan (44-20) [email protected]
• Distribution along the curve. Open interest grew by190.5% from 1996 to 2001, and grew by 41.2% from 2001 to2006, based on the 12 frontmost contracts. In the laterperiod, open interest grew the most in the front part of thecurve. Whereas open interest in the two frontmostcontracts accounted for 48.3% of open interest in the 12frontmost contracts, this proportion was 63.9% in 2006,suggesting a notable increase in concentration ofpositions at the front end of the curve.
• Performance. JPMCCI Robusta Coffee produced anannualized excess return of 20.3% from 2002 to September2007. The index volatility during this period was 30.4%,resulting in a Sharpe ratio of 0.67.
• Roll return. JPMCCI Robusta Coffee average roll returns,on an annual basis, were -11.5% from 2002 to September2007, -5.1% from 1997 to September 2007 and -1.5% from1992 to September 2007.
Robusta Coffee: average of daily open interest along the curvethousand contracts
Source: JPMorgan, Bloomberg
0
10
20
30
40
50
60
70
CF1 CF2 CF3 CF4 CF5 CF6 CF7 CF8 CF9 CF10 CF11 CF12
1996 2001 2006
JPMCCI Robusta Coffee: performance vs other indicesexcess returns
JPMCCI S&P GSCI DJ-AIGCIAnnual returns1990 – – –1991 – – –1992 -8.3% – –1993 21.8% – –1994 149.1% – –1995 -27.8% – –1996 -13.2% – –1997 38.8% – –1998 20.5% – –1999 -19.8% – –2000 -53.2% – –2001 -48.4% – –2002 83.0% – –2003 -21.0% – –2004 -3.6% – –2005 34.7% – –2006 31.0% – –Sep 2007 17.8% – –1991 to Sep 2007Cum return – – –Ann return – – –Volatility – – –Sharpe ratio – – –1997 to Sep 2007Cum return -6.1% – –Ann return -0.6% – –Volatility 33.7% – –Sharpe ratio -0.02 – –2002 to Sep 2007Cum return 189.6% – –Ann return 20.3% – –Volatility 30.4% – –Sharpe ratio 0.67 – –Source: JPMorgan and index sponsors
JPMCCI Robusta Coffee: performance vs other indicesindex, excess returns
Source: JPMorgan and index sponsors
0
50
100
150
200
250
300
350
Dec 01 Dec 02 Dec 03 Dec 04 Dec 05 Dec 06
JPMCCI
Agriculture – LIFFE Robusta Coffee
JPMCCI S&P GSCI DJ-AIGCI1992 to Sep 2007Cum Roll -25.0% – –Average Ann Roll -1.5% - -Ann Roll Volatility 12.9% - -Source: JPMorgan and index sponsors
JPMCCI Robusta Coffee: roll return vs other indices
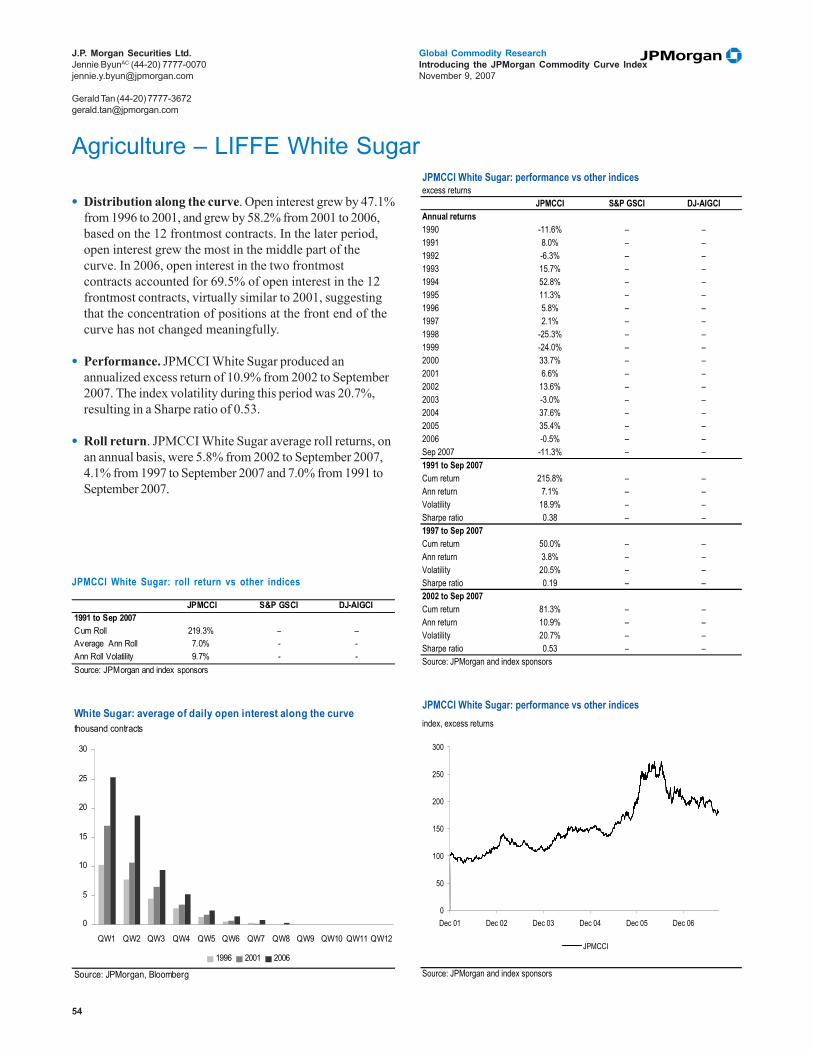
54
Global Commodity ResearchIntroducing the JPMorgan Commodity Curve IndexNovember 9, 2007
J.P. Morgan Securities Ltd.Jennie ByunAC (44-20) [email protected]
Gerald Tan (44-20) [email protected]
• Distribution along the curve. Open interest grew by 47.1%from 1996 to 2001, and grew by 58.2% from 2001 to 2006,based on the 12 frontmost contracts. In the later period,open interest grew the most in the middle part of thecurve. In 2006, open interest in the two frontmostcontracts accounted for 69.5% of open interest in the 12frontmost contracts, virtually similar to 2001, suggestingthat the concentration of positions at the front end of thecurve has not changed meaningfully.
• Performance. JPMCCI White Sugar produced anannualized excess return of 10.9% from 2002 to September2007. The index volatility during this period was 20.7%,resulting in a Sharpe ratio of 0.53.
• Roll return. JPMCCI White Sugar average roll returns, onan annual basis, were 5.8% from 2002 to September 2007,4.1% from 1997 to September 2007 and 7.0% from 1991 toSeptember 2007.
White Sugar: average of daily open interest along the curvethousand contracts
Source: JPMorgan, Bloomberg
0
5
10
15
20
25
30
QW1 QW2 QW3 QW4 QW5 QW6 QW7 QW8 QW9 QW10 QW11 QW12
1996 2001 2006
JPMCCI White Sugar: performance vs other indicesexcess returns
JPMCCI S&P GSCI DJ-AIGCIAnnual returns1990 -11.6% – –1991 8.0% – –1992 -6.3% – –1993 15.7% – –1994 52.8% – –1995 11.3% – –1996 5.8% – –1997 2.1% – –1998 -25.3% – –1999 -24.0% – –2000 33.7% – –2001 6.6% – –2002 13.6% – –2003 -3.0% – –2004 37.6% – –2005 35.4% – –2006 -0.5% – –Sep 2007 -11.3% – –1991 to Sep 2007Cum return 215.8% – –Ann return 7.1% – –Volatility 18.9% – –Sharpe ratio 0.38 – –1997 to Sep 2007Cum return 50.0% – –Ann return 3.8% – –Volatility 20.5% – –Sharpe ratio 0.19 – –2002 to Sep 2007Cum return 81.3% – –Ann return 10.9% – –Volatility 20.7% – –Sharpe ratio 0.53 – –Source: JPMorgan and index sponsors
JPMCCI White Sugar: performance vs other indicesindex, excess returns
Source: JPMorgan and index sponsors
0
50
100
150
200
250
300
Dec 01 Dec 02 Dec 03 Dec 04 Dec 05 Dec 06
JPMCCI
Agriculture – LIFFE White Sugar
JPMCCI S&P GSCI DJ-AIGCI1991 to Sep 2007Cum Roll 219.3% – –Average Ann Roll 7.0% - -Ann Roll Volatility 9.7% - -Source: JPMorgan and index sponsors
JPMCCI White Sugar: roll return vs other indices
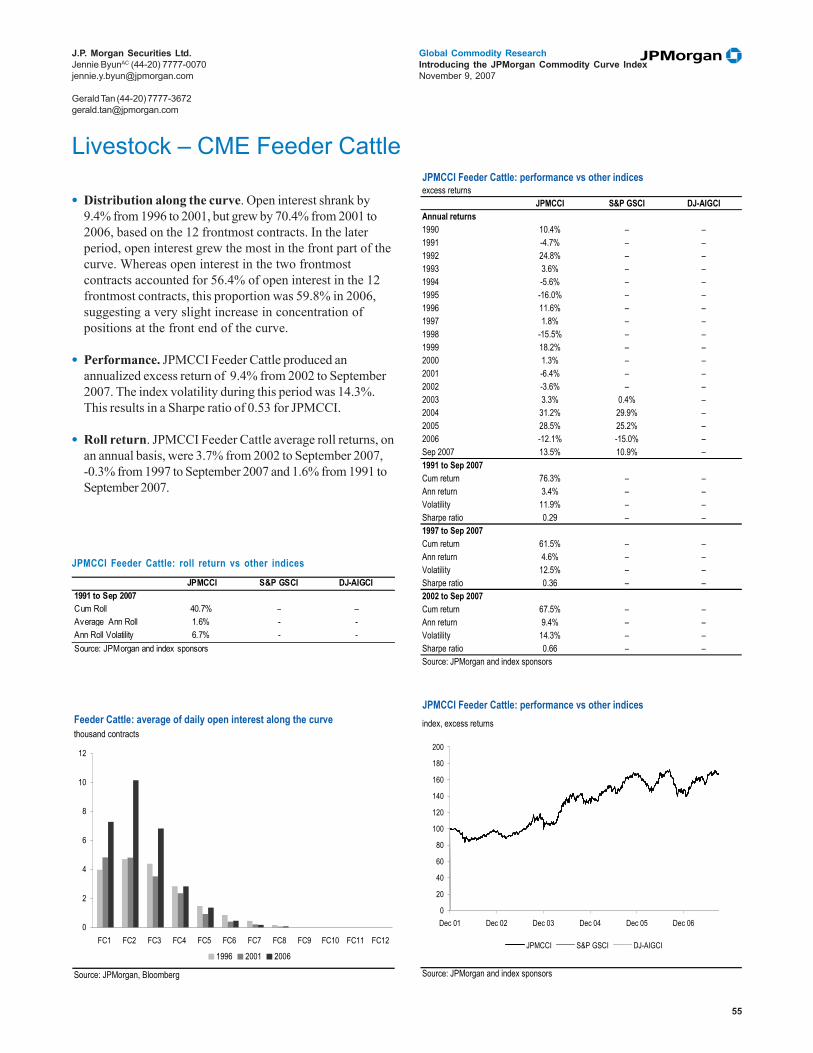
55
Global Commodity ResearchIntroducing the JPMorgan Commodity Curve IndexNovember 9, 2007
J.P. Morgan Securities Ltd.Jennie ByunAC (44-20) [email protected]
Gerald Tan (44-20) [email protected]
• Distribution along the curve. Open interest shrank by9.4% from 1996 to 2001, but grew by 70.4% from 2001 to2006, based on the 12 frontmost contracts. In the laterperiod, open interest grew the most in the front part of thecurve. Whereas open interest in the two frontmostcontracts accounted for 56.4% of open interest in the 12frontmost contracts, this proportion was 59.8% in 2006,suggesting a very slight increase in concentration ofpositions at the front end of the curve.
• Performance. JPMCCI Feeder Cattle produced anannualized excess return of 9.4% from 2002 to September2007. The index volatility during this period was 14.3%.This results in a Sharpe ratio of 0.53 for JPMCCI.
• Roll return. JPMCCI Feeder Cattle average roll returns, onan annual basis, were 3.7% from 2002 to September 2007,-0.3% from 1997 to September 2007 and 1.6% from 1991 toSeptember 2007.
Feeder Cattle: average of daily open interest along the curvethousand contracts
Source: JPMorgan, Bloomberg
0
2
4
6
8
10
12
FC1 FC2 FC3 FC4 FC5 FC6 FC7 FC8 FC9 FC10 FC11 FC12
1996 2001 2006
JPMCCI Feeder Cattle: performance vs other indicesexcess returns
JPMCCI S&P GSCI DJ-AIGCIAnnual returns1990 10.4% – –1991 -4.7% – –1992 24.8% – –1993 3.6% – –1994 -5.6% – –1995 -16.0% – –1996 11.6% – –1997 1.8% – –1998 -15.5% – –1999 18.2% – –2000 1.3% – –2001 -6.4% – –2002 -3.6% – –2003 3.3% 0.4% –2004 31.2% 29.9% –2005 28.5% 25.2% –2006 -12.1% -15.0% –Sep 2007 13.5% 10.9% –1991 to Sep 2007Cum return 76.3% – –Ann return 3.4% – –Volatility 11.9% – –Sharpe ratio 0.29 – –1997 to Sep 2007Cum return 61.5% – –Ann return 4.6% – –Volatility 12.5% – –Sharpe ratio 0.36 – –2002 to Sep 2007Cum return 67.5% – –Ann return 9.4% – –Volatility 14.3% – –Sharpe ratio 0.66 – –Source: JPMorgan and index sponsors
JPMCCI Feeder Cattle: performance vs other indicesindex, excess returns
Source: JPMorgan and index sponsors
0
20
40
60
80
100
120
140
160
180
200
Dec 01 Dec 02 Dec 03 Dec 04 Dec 05 Dec 06
JPMCCI S&P GSCI DJ-AIGCI
Livestock – CME Feeder Cattle
JPMCCI S&P GSCI DJ-AIGCI1991 to Sep 2007Cum Roll 40.7% – –Average Ann Roll 1.6% - -Ann Roll Volatility 6.7% - -Source: JPMorgan and index sponsors
JPMCCI Feeder Cattle: roll return vs other indices

56
Global Commodity ResearchIntroducing the JPMorgan Commodity Curve IndexNovember 9, 2007
J.P. Morgan Securities Ltd.Jennie ByunAC (44-20) [email protected]
Gerald Tan (44-20) [email protected]
• Distribution along the curve. Open interest grew by 16.7%from 1996 to 2001, and grew by 283.7% from 2001 to 2006,based on the 12 frontmost contracts. In the later period,open interest grew the most in the later part of the curve.Whereas open interest in the two frontmost contractsaccounted for 69.2% of open interest in the 12 frontmostcontracts, this proportion was 60.9% in 2006, suggesting amild increase in dispersion of positions across the curve.
• Performance. JPMCCI Lean Hogs produced an annualizedexcess return of -1.3% from 2002 to September 2007,outperforming S&P GSCI by 11.1% and DJ-AIGCI by10.8%. The index volatility during this period was 23.2%,which is lower than S&P GSCI by 3.4% and DJ-AIGCI by3.4%. This results in a Sharpe ratio of -0.05 for JPMCCI,compared to S&P GSCI (-0.46) and DJ-AIGCI (-0.45).
• Roll return. JPMCCI Lean Hogs average roll returns, onan annual basis, was -1.7% from 2002 to September 2007.This compares to -13.0% for S&P GSCI. JPMCCI LeanHogs average annual roll returns were -2.2% from 1997 toSeptember 2007 and -1.1% from 1991 to September 2007.
Lean Hogs: average of daily open interest along the curvethousand contracts
Source: JPMorgan, Bloomberg
0
10
20
30
40
50
60
70
LH1 LH2 LH3 LH4 LH5 LH6 LH7 LH8 LH9 LH10 LH11 LH12
1996 2001 2006
JPMCCI Lean Hogs: performance vs other indicesexcess returns
JPMCCI S&P GSCI DJ-AIGCIAnnual returns1990 22.9% 18.5% –1991 -8.1% -5.8% -3.8%1992 17.4% 19.6% 19.3%1993 12.7% 4.4% 4.7%1994 -23.0% -31.1% -31.0%1995 6.0% 3.6% 3.5%1996 24.7% 25.6% 25.7%1997 -13.2% -22.4% -22.2%1998 -45.9% -52.7% -52.7%1999 10.8% 17.4% 17.2%2000 10.3% 1.2% 1.8%2001 17.8% 10.4% 11.2%2002 -19.0% -31.1% -31.1%2003 -12.8% -23.9% -23.9%2004 59.6% 43.0% 43.0%2005 -5.2% -13.9% -13.5%2006 -5.1% -15.8% -14.7%Sep 2007 -8.4% -13.8% -14.0%1991 to Sep 2007Cum return -22.2% -76.2% -74.9%Ann return -1.5% -8.2% -7.9%Volatility 20.8% 24.3% 24.4%Sharpe ratio -0.07 -0.34 -0.331997 to Sep 2007Cum return -37.1% -77.4% -76.8%Ann return -4.2% -12.9% -12.7%Volatility 22.4% 26.5% 26.4%Sharpe ratio -0.19 -0.49 -0.482002 to Sep 2007Cum return -7.0% -53.1% -52.4%Ann return -1.3% -12.3% -12.1%Volatility 23.2% 26.6% 26.6%Sharpe ratio -0.05 -0.46 -0.45Source: JPMorgan and index sponsors
JPMCCI Lean Hogs: performance vs other indicesindex, excess returns
Source: JPMorgan and index sponsors
0
20
40
60
80
100
120
140
Dec 01 Dec 02 Dec 03 Dec 04 Dec 05 Dec 06
JPMCCI S&P GSCI DJ-AIGCI
Livestock – CME Lean Hogs
JPMCCI S&P GSCI DJ-AIGCI1991 to Sep 2007Cum Roll -19.5% -67.9% –Average Ann Roll -1.1% -7.8% -Ann Roll Volatility 15.1% 16.6% -Source: JPMorgan and index sponsors
JPMCCI Lean Hogs: roll return vs other indices
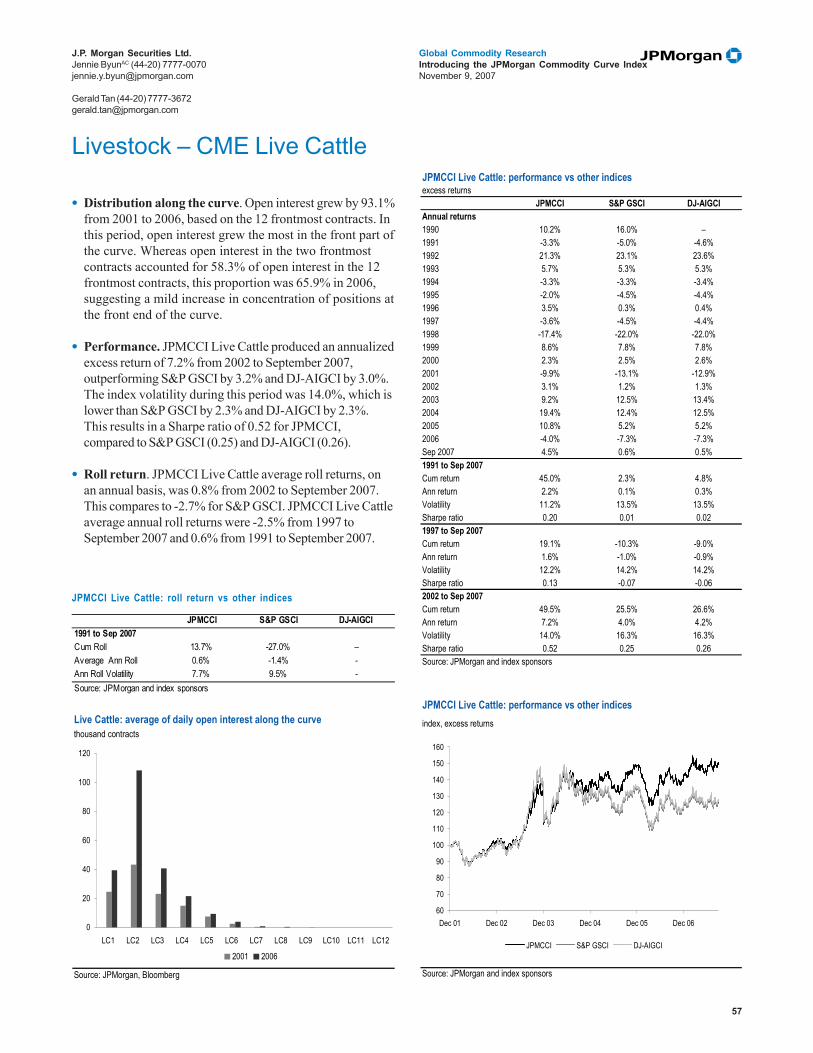
57
Global Commodity ResearchIntroducing the JPMorgan Commodity Curve IndexNovember 9, 2007
J.P. Morgan Securities Ltd.Jennie ByunAC (44-20) [email protected]
Gerald Tan (44-20) [email protected]
Livestock – CME Live Cattle
Live Cattle: average of daily open interest along the curvethousand contracts
Source: JPMorgan, Bloomberg
0
20
40
60
80
100
120
LC1 LC2 LC3 LC4 LC5 LC6 LC7 LC8 LC9 LC10 LC11 LC12
2001 2006
JPMCCI Live Cattle: performance vs other indicesexcess returns
JPMCCI S&P GSCI DJ-AIGCIAnnual returns1990 10.2% 16.0% –1991 -3.3% -5.0% -4.6%1992 21.3% 23.1% 23.6%1993 5.7% 5.3% 5.3%1994 -3.3% -3.3% -3.4%1995 -2.0% -4.5% -4.4%1996 3.5% 0.3% 0.4%1997 -3.6% -4.5% -4.4%1998 -17.4% -22.0% -22.0%1999 8.6% 7.8% 7.8%2000 2.3% 2.5% 2.6%2001 -9.9% -13.1% -12.9%2002 3.1% 1.2% 1.3%2003 9.2% 12.5% 13.4%2004 19.4% 12.4% 12.5%2005 10.8% 5.2% 5.2%2006 -4.0% -7.3% -7.3%Sep 2007 4.5% 0.6% 0.5%1991 to Sep 2007Cum return 45.0% 2.3% 4.8%Ann return 2.2% 0.1% 0.3%Volatility 11.2% 13.5% 13.5%Sharpe ratio 0.20 0.01 0.021997 to Sep 2007Cum return 19.1% -10.3% -9.0%Ann return 1.6% -1.0% -0.9%Volatility 12.2% 14.2% 14.2%Sharpe ratio 0.13 -0.07 -0.062002 to Sep 2007Cum return 49.5% 25.5% 26.6%Ann return 7.2% 4.0% 4.2%Volatility 14.0% 16.3% 16.3%Sharpe ratio 0.52 0.25 0.26Source: JPMorgan and index sponsors
JPMCCI Live Cattle: performance vs other indicesindex, excess returns
Source: JPMorgan and index sponsors
60
70
80
90
100
110
120
130
140
150
160
Dec 01 Dec 02 Dec 03 Dec 04 Dec 05 Dec 06
JPMCCI S&P GSCI DJ-AIGCI
• Distribution along the curve. Open interest grew by 93.1%from 2001 to 2006, based on the 12 frontmost contracts. Inthis period, open interest grew the most in the front part ofthe curve. Whereas open interest in the two frontmostcontracts accounted for 58.3% of open interest in the 12frontmost contracts, this proportion was 65.9% in 2006,suggesting a mild increase in concentration of positions atthe front end of the curve.
• Performance. JPMCCI Live Cattle produced an annualizedexcess return of 7.2% from 2002 to September 2007,outperforming S&P GSCI by 3.2% and DJ-AIGCI by 3.0%.The index volatility during this period was 14.0%, which islower than S&P GSCI by 2.3% and DJ-AIGCI by 2.3%.This results in a Sharpe ratio of 0.52 for JPMCCI,compared to S&P GSCI (0.25) and DJ-AIGCI (0.26).
• Roll return. JPMCCI Live Cattle average roll returns, onan annual basis, was 0.8% from 2002 to September 2007.This compares to -2.7% for S&P GSCI. JPMCCI Live Cattleaverage annual roll returns were -2.5% from 1997 toSeptember 2007 and 0.6% from 1991 to September 2007.
JPMCCI S&P GSCI DJ-AIGCI1991 to Sep 2007Cum Roll 13.7% -27.0% –Average Ann Roll 0.6% -1.4% -Ann Roll Volatility 7.7% 9.5% -Source: JPMorgan and index sponsors
JPMCCI Live Cattle: roll return vs other indices

58
Global Commodity ResearchIntroducing the JPMorgan Commodity Curve IndexNovember 9, 2007
J.P. Morgan Securities Ltd.Jennie ByunAC (44-20) [email protected]
Gerald Tan (44-20) [email protected]
** Page intentionally left blank **

59
Global Commodity ResearchIntroducing the JPMorgan Commodity Curve IndexNovember 9, 2007
J.P. Morgan Securities Ltd.Jennie ByunAC (44-20) [email protected]
Gerald Tan (44-20) [email protected]
** Page intentionally left blank **

60
Global Commodity ResearchIntroducing the JPMorgan Commodity Curve IndexNovember 9, 2007
J.P. Morgan Securities Ltd.Jennie ByunAC (44-20) [email protected]
Gerald Tan (44-20) [email protected]
Analyst certification: The research analyst(s) denoted by an “AC” on the cover of this report (or, where multiple research analysts are primarily responsible for this report, the researchanalyst denoted by an “AC” on the cover or within the document individually certifies, with respect to each security or issuer that the research analyst covers in this research) that:(1) all of the views expressed in this report accurately reflect his or her personal views about any and all of the subject securities or issuers; and (2) no part of any of the research analyst’scompensation was, is, or will be directly or indirectly related to the specific recommendations or views expressed by the research analyst(s) in this report. Explanation of Ratings:Ratings System: JPMorgan uses the following sector/issuer portfolio weightings: Overweight (over the next three months, the recommended risk position is expected to outperformthe relevant index, sector, or benchmark), Neutral (over the next three months, the recommended risk position is expected to perform in line with the relevant index, sector, or benchmark),and Underweight (over the next three months, the recommended risk position is expected to underperform the relevant index, sector, or benchmark). JPMorgan’s Emerging Marketresearch uses a rating of Marketweight, which is equivalent to a Neutral rating. Valuation & Methodology: In JPMorgan’s credit research, we assign a rating to each issuer(Overweight, Underweight or Neutral) based on our credit view of the issuer and the relative value of its securities, taking into account the ratings assigned to the issuer by creditrating agencies and the market prices for the issuer’s securities. Our credit view of an issuer is based upon our opinion as to whether the issuer will be able service its debt obligationswhen they become due and payable. We assess this by analyzing, among other things, the issuer’s credit position using standard credit ratios such as cash flow to debt and fixed chargecoverage (including and excluding capital investment). We also analyze the issuer’s ability to generate cash flow by reviewing standard operational measures for comparablecompanies in the sector, such as revenue and earnings growth rates, margins, and the composition of the issuer’s balance sheet relative to the operational leverage in its business.Analysts’ Compensation: The research analysts responsible for the preparation of this report receive compensation based upon various factors, including the quality and accuracyof research, client feedback, competitive factors and overall firm revenues. The firm’s overall revenues include revenues from its investment banking and fixed income business units.
Other Disclosures: Options related research: If the information contained herein regards options related research, such information is available only to persons who have receivedthe proper option risk disclosure documents. For a copy of the Option Clearing Corporation’s Characteristics and Risks of Standardized Options, please contact your JPMorganRepresentative or visit the OCC’s website at http://www.optionsclearing.com/publications/risks/riskstoc.pdf. Legal Entities Disclosures: U.S.: JPMSI is a member of NYSE,FINRA and SIPC. J.P. Morgan Futures Inc. is a member of the NFA. JPMorgan Chase Bank, N.A. is a member of FDIC and is authorized and regulated in the UK by the Financial ServicesAuthority. U.K.: J.P. Morgan Securities Ltd. (JPMSL) is a member of the London Stock Exchange and is authorised and regulated by the Financial Services Authority. Registeredin England & Wales No. 2711006. Registered Office 125 London Wall, London EC2Y 5AJ. South Africa: J.P. Morgan Equities Limited is a member of the Johannesburg SecuritiesExchange and is regulated by the FSB. Hong Kong: J.P. Morgan Securities (Asia Pacific) Limited (CE number AAJ321) is regulated by the Hong Kong Monetary Authority and theSecurities and Futures Commission in Hong Kong. Korea: J.P. Morgan Securities (Far East) Ltd, Seoul branch, is regulated by the Korea Financial Supervisory Service. Australia:J.P. Morgan Australia Limited (ABN 52 002 888 011/AFS Licence No: 238188) is regulated by ASIC and J.P. Morgan Securities Australia Limited (ABN 61 003 245 234/AFSLicence No: 238066) is a Market Participant with the ASX and regulated by ASIC. Taiwan: J.P.Morgan Securities (Taiwan) Limited is a participant of the Taiwan Stock Exchange(company-type) and regulated by the Taiwan Securities and Futures Commission. India: J.P. Morgan India Private Limited is a member of the National Stock Exchange of India Limitedand The Stock Exchange, Mumbai and is regulated by the Securities and Exchange Board of India. Thailand: JPMorgan Securities (Thailand) Limited is a member of the Stock Exchangeof Thailand and is regulated by the Ministry of Finance and the Securities and Exchange Commission. Indonesia: PT J.P. Morgan Securities Indonesia is a member of the Jakarta StockExchange and Surabaya Stock Exchange and is regulated by the BAPEPAM. Philippines: J.P. Morgan Securities Philippines Inc. is a member of the Philippine Stock Exchange andis regulated by the Securities and Exchange Commission. Brazil: Banco J.P. Morgan S.A. is regulated by the Comissao de Valores Mobiliarios (CVM) and by the Central Bank of Brazil.Mexico: J.P. Morgan Casa de Bolsa, S.A. de C.V., J.P. Morgan Grupo Financiero is a member of the Mexican Stock Exchange and authorized to act as a broker dealer by the NationalBanking and Securities Exchange Commission. Singapore: This material is issued and distributed in Singapore by J.P. Morgan Securities Singapore Private Limited (JPMSS) [mica(p) 030/09/2007 and Co. Reg. No.: 199405335R] which is a member of the Singapore Exchange Securities Trading Limited and is regulated by the Monetary Authority of Singapore(MAS) and/or JPMorgan Chase Bank, N.A., Singapore branch (JPMCB Singapore) which is regulated by the MAS. Malaysia: This material is issued and distributed in Malaysia byJPMorgan Securities (Malaysia) Sdn Bhd (18146-x) which is a Participating Organization of Bursa Malaysia Securities Bhd and is licensed as a dealer by the Securities Commissionin Malaysia. Pakistan: J. P. Morgan Pakistan Broking (Pvt.) Ltd is a member of the Karachi Stock Exchange and regulated by the Securities and Exchange Commission of Pakistan.Country and Region Specific Disclosures: U.K. and European Economic Area (EEA): Issued and approved for distribution in the U.K. and the EEA by JPMSL. Investmentresearch issued by JPMSL has been prepared in accordance with JPMSL’s Policies for Managing Conflicts of Interest in Connection with Investment Research which outline theeffective organisational and administrative arrangements set up within JPMSL for the prevention and avoidance of conflicts of interest with respect to research recommendations,including information barriers, and can be found at http://www.jpmorgan.com/pdfdoc/research/ConflictManagementPolicy.pdf. This report has been issued in the U.K. only topersons of a kind described in Article 19 (5), 38, 47 and 49 of the Financial Services and Markets Act 2000 (Financial Promotion) Order 2005 (all such persons being referred to as“relevant persons”). This document must not be acted on or relied on by persons who are not relevant persons. Any investment or investment activity to which this document relatesis only available to relevant persons and will be engaged in only with relevant persons. In other EEA countries, the report has been issued to persons regarded as professionalinvestors (or equivalent) in their home jurisdiction Germany: This material is distributed in Germany by J.P. Morgan Securities Ltd. Frankfurt Branch and JPMorgan Chase Bank,N.A., Frankfurt Branch who are regulated by the Bundesanstalt für Finanzdienstleistungsaufsicht. Australia: This material is issued and distributed by JPMSAL in Australia to“wholesale clients” only. JPMSAL does not issue or distribute this material to “retail clients.” The recipient of this material must not distribute it to any third party or outsideAustralia without the prior written consent of JPMSAL. For the purposes of this paragraph the terms “wholesale client” and “retail client” have the meanings given to them in section761G of the Corporations Act 2001. Hong Kong: The 1% ownership disclosure as of the previous month end satisfies the requirements under Paragraph 16.5(a) of the Hong KongCode of Conduct for persons licensed by or registered with the Securities and Futures Commission. (For research published within the first ten days of the month, the disclosure maybe based on the month end data from two months’ prior.) J.P. Morgan Broking (Hong Kong) Limited is the liquidity provider for derivative warrants issued by J.P. Morgan InternationalDerivatives Ltd and listed on The Stock Exchange of Hong Kong Limited. An updated list can be found on HKEx website: http://www.hkex.com.hk/prod/dw/Lp.htm. Japan: Thereis a risk that a loss may occur due to a change in the price of the shares in the case of share trading, and that a loss may occur due to the exchange rate in the case of foreign share trading.In the case of share trading, JPMorgan Securities Japan Co., Ltd., will be receiving a brokerage fee and consumption tax (shouhizei) calculated by multiplying the executed price bythe commission rate which was individually agreed between JPMorgan Securities Japan Co., Ltd., and the customer in advance. Financial Instruments Firms: JPMorgan SecuritiesJapan Co., Ltd., Kanto Local Finance Bureau (kinsho) No. [82] Participating Association / Japan Securities Dealers Association, The Financial Futures Association of Japan. Korea:This report may have been edited or contributed to from time to time by affiliates of J.P. Morgan Securities (Far East) Ltd, Seoul branch. Singapore: JPMSI and/or its affiliates mayhave a holding in any of the securities discussed in this report; for securities where the holding is 1% or greater, the specific holding is disclosed in the Legal Disclosures sectionabove. India: For private circulation only not for sale. Pakistan: For private circulation only not for sale. New Zealand: This material is issued and distributed by JPMSAL in NewZealand only to persons whose principal business is the investment of money or who, in the course of and for the purposes of their business, habitually invest money. JPMSAL doesnot issue or distribute this material to members of “the public” as determined in accordance with section 3 of the Securities Act 1978. The recipient of this material must not distributeit to any third party or outside New Zealand without the prior written consent of JPMSAL. General: Additional information is available upon request. Information has been obtainedfrom sources believed to be reliable but JPMorgan Chase & Co. or its affiliates and/or subsidiaries (collectively JPMorgan) do not warrant its completeness or accuracy except withrespect to any disclosures relative to JPMSI and/or its affiliates and the analyst’s involvement with the issuer that is the subject of the research. All pricing is as of the close of marketfor the securities discussed, unless otherwise stated. Opinions and estimates constitute our judgment as of the date of this material and are subject to change without notice. Pastperformance is not indicative of future results. This material is not intended as an offer or solicitation for the purchase or sale of any financial instrument. The opinions and recommen-dations herein do not take into account individual client circumstances, objectives, or needs and are not intended as recommendations of particular securities, financial instrumentsor strategies to particular clients. The recipient of this report must make its own independent decisions regarding any securities or financial instruments mentioned herein. JPMSIdistributes in the U.S. research published by non-U.S. affiliates and accepts responsibility for its contents. Periodic updates may be provided on companies/industries based oncompany specific developments or announcements, market conditions or any other publicly available information. Clients should contact analysts and execute transactions througha JPMorgan subsidiary or affiliate in their home jurisdiction unless governing law permits otherwise. “Other Disclosures” last revised November 5, 2007. Copyright 2007JPMorgan Chase & Co. All rights reserved. This report or any portion hereof may not be reprinted, sold or redistributed without the written consent of JPMorgan.
Related Documents