Making it Pencil: The Math Behind Housing Development April 22 nd , 2021

Welcome message from author
This document is posted to help you gain knowledge. Please leave a comment to let me know what you think about it! Share it to your friends and learn new things together.
Transcript

Making it Pencil: The Math Behind Housing Development
April 22nd, 2021

Making it Pencil – The Math Behind Development
What are the various costs that
go into the development of new housing?
How are new housing
developments financed? What are the benchmarks
required by financial institutions and capital sources to invest in new housing?
How do various requirements
impact the ability of developers to deliver projects?

The Realities of Housing Development Math
• Market rate building – East Bay
• 120 units: • (48) studios • (40) 1 bdrm apartments • (32) 2 bdrm apartments
TERNER CENTER FOR HOUSING INNOVATION UC BERKELEY
“Terner Terrace” characteristics
• 120 parking spaces
• 1,500 square feet of retail
• 5 over 1 construction (stick over podium)
Photograph courtesy of BRIDGE Housing
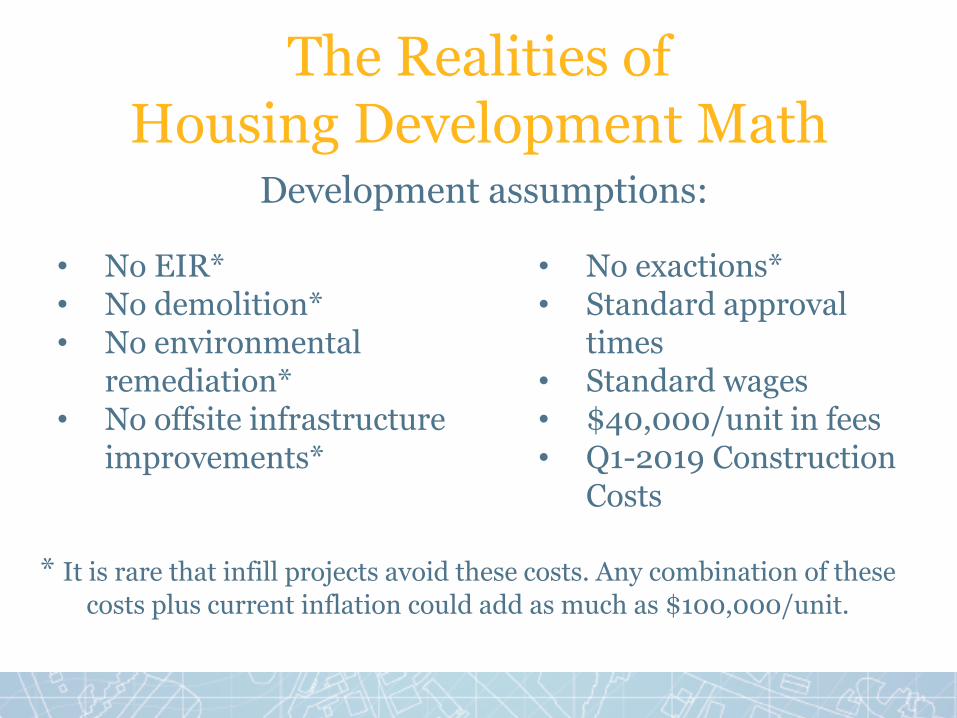
The Realities of Housing Development Math
Development assumptions:
TERNER CENTER FOR HOUSING INNOVATION UC BERKELEY
• No EIR* • No demolition* • No environmental
remediation* • No offsite infrastructure
improvements*
• No exactions* • Standard approval
times • Standard wages • $40,000/unit in fees • Q1-2019 Construction
Costs
* It is rare that infill projects avoid these costs. Any combination of these
costs plus current inflation could add as much as $100,000/unit.

Total Cost to Build East Bay Prototype: $68,828,255
$7,858,500
$46,169,455
$5,400,000
$6,394,660
$2,298,271
$707,369
$0
$10,000,000
$20,000,000
$30,000,000
$40,000,000
$50,000,000
$60,000,000
$70,000,000
East BayLand Cost Hard Cost Fees Financing Consultants Tax, Title, Insurance

Total Cost to Build East Bay Prototype: $573,569/unit
$65,488
$384,745
$45,000
$53,289
$19,152
$5,895
$0
$100,000
$200,000
$300,000
$400,000
$500,000
$600,000
East Bay
Land Cost Hard Cost Fees Financing Consultants Tax, Title, Insurance
68%
22%
10%

What are the financing requirements to make this project feasible?

0
0.2
0.4
0.6
0.8
1
1.2
1.4
DSCR 1 DSCR 1.3
Debt Net Operating Income (NOI)
Terner Terrace Financing Requirements
TERNER CENTER FOR HOUSING INNOVATION UC BERKELEY
How much debt can I raise?
Debt Service Coverage Ratio (DSCR) is the Debt to Net Operating Income (NOI) required by our bank

Terner Terrace Financing Requirements
TERNER CENTER FOR HOUSING INNOVATION UC BERKELEY
How much debt can I raise?
Financing breakdown for a 65% “Loan to Cost”:
$51,985,347 in debt (at 5% interest rate)
$27,106,654 in equity needed
Debt, $44,738,365
Equity, $24,089,889

Terner Terrace Equity Requirements
TERNER CENTER FOR HOUSING INNOVATION UC BERKELEY
4.30%
5.46%
0.00%
1.00%
2.00%
3.00%
4.00%
5.00%
6.00%
East Bay
Prototype ROC/Cap Rate Spread
Cap Rates Return on Cost
15.4%
0.0%
2.0%
4.0%
6.0%
8.0%
10.0%
12.0%
14.0%
16.0%
18.0%
20.0%
East Bay
Internal Rate of Return
Internal Rate of Return

The Result: High Rents To meet debt, operating expense, and investor
requirements, Terner Terrace monthly rents must be:
TERNER CENTER FOR HOUSING INNOVATION UC BERKELEY
$0
$1,000
$2,000
$3,000
$4,000
$5,000
Studio 1 bedroom 2 bedroom
$2,138
$3,366 $4,441
$5.70/sf
$5.30/sf $4.75/sf

5.46%
0.00%
1.00%
2.00%
3.00%
4.00%
5.00%
6.00%
East Bay ROC
Baseline
Cumulative Policy Impacts on Terner Terrace
TERNER CENTER FOR HOUSING INNOVATION UC BERKELEY
The layering of many common city policies can result in either higher rents or stopping projects altogether

5.46%
5.02%
0.00%
1.00%
2.00%
3.00%
4.00%
5.00%
6.00%
East Bay ROC
Baseline
2:1 Parking
Cumulative Policy Impacts on Terner Terrace
The layering of many common city policies can result in either higher rents or stopping projects altogether

5.46%
5.02% 4.84%
0.00%
1.00%
2.00%
3.00%
4.00%
5.00%
6.00%
East Bay ROC
Baseline
2:1 Parking
2:1 Parking, $60k/UnitFees
Cumulative Policy Impacts on Terner Terrace
The layering of many common city policies can result in either higher rents or stopping projects altogether

5.46%
5.02% 4.84%
4.46%
0.00%
1.00%
2.00%
3.00%
4.00%
5.00%
6.00%
East Bay ROC
Baseline
2:1 Parking
2:1 Parking, $60k/UnitFees
2:1 Parking, $60k/UnitFees, 15% Inclusionary(60% AMI)
Cumulative Policy Impacts on Terner Terrace
TERNER CENTER FOR HOUSING INNOVATION UC BERKELEY
The layering of many common city policies can result in either higher rents or stopping projects altogether

5.04%
0.00%
1.00%
2.00%
3.00%
4.00%
5.00%
6.00%
East Bay ROC
15% Inclusionary (60%AMI)
Cumulative Policy Impacts on Terner Terrace
TERNER CENTER FOR HOUSING INNOVATION UC BERKELEY
Calibrating policies to work with the market can help projects pencil while achieving important goals

5.04% 5.31%
0.00%
1.00%
2.00%
3.00%
4.00%
5.00%
6.00%
East Bay ROC
15% Inclusionary (60%AMI)
15% Inclusionary (60%AMI), $20k/Unit Fees
Cumulative Policy Impacts on Terner Terrace
TERNER CENTER FOR HOUSING INNOVATION UC BERKELEY
Calibrating policies to work with the market can help projects pencil while achieving important goals

5.04% 5.31% 5.55%
0.00%
1.00%
2.00%
3.00%
4.00%
5.00%
6.00%
East Bay ROC
15% Inclusionary (60%AMI)
15% Inclusionary (60%AMI), $20k/Unit Fees
15% Inclusionary (60%AMI), $20k/Unit Fees,.5:1 Parking
Cumulative Policy Impacts on Terner Terrace
TERNER CENTER FOR HOUSING INNOVATION UC BERKELEY
Calibrating policies to work with the market can help projects pencil while achieving important goals

5.04% 5.31% 5.55% 5.72%
0.00%
1.00%
2.00%
3.00%
4.00%
5.00%
6.00%
East Bay ROC
15% Inclusionary (60%AMI)
15% Inclusionary (60%AMI), $20k/Unit Fees
15% Inclusionary (60%AMI), $20k/Unit Fees,.5:1 Parking
15% Inclusionary (60%AMI), $20k/Unit Fees,.5:1 Parking, TaxExempt IZ units
Cumulative Policy Impacts on Terner Terrace
TERNER CENTER FOR HOUSING INNOVATION UC BERKELEY
Calibrating policies to work with the market can help projects pencil while achieving important goals

Please visit www.ternercenter.berkeley.edu
for more information on our Cost of Building Housing Research Series and our other work.
Thank you!
Related Documents