Introducing SENSEnews
Jul 19, 2015
Welcome message from author
This document is posted to help you gain knowledge. Please leave a comment to let me know what you think about it! Share it to your friends and learn new things together.
Transcript

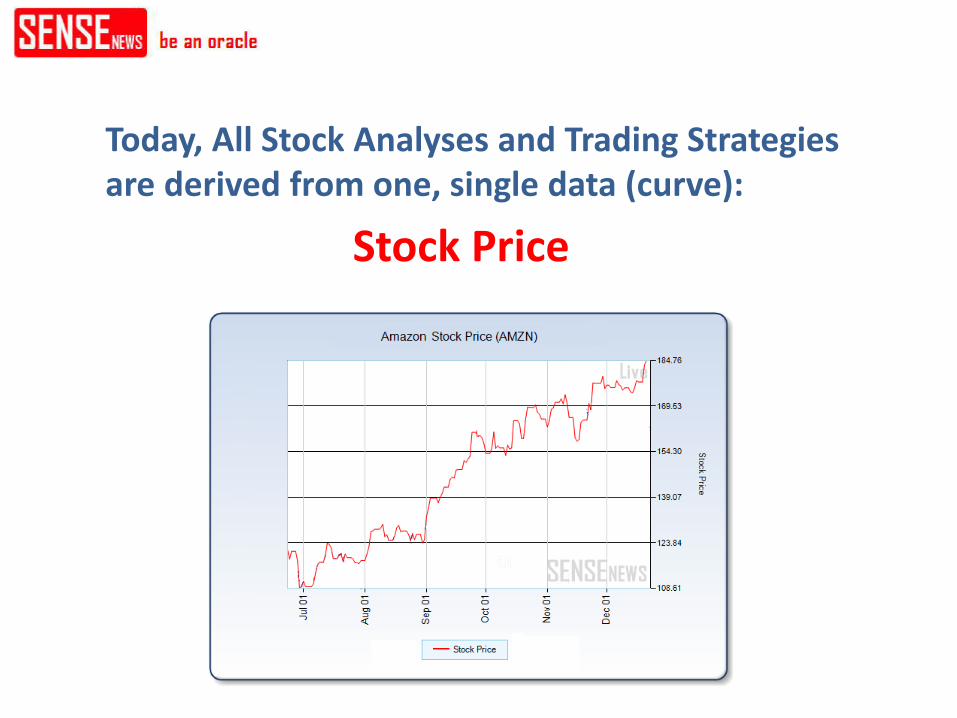
Today, All Stock Analyses and Trading Strategies are derived from one, single data (curve):
Stock Price
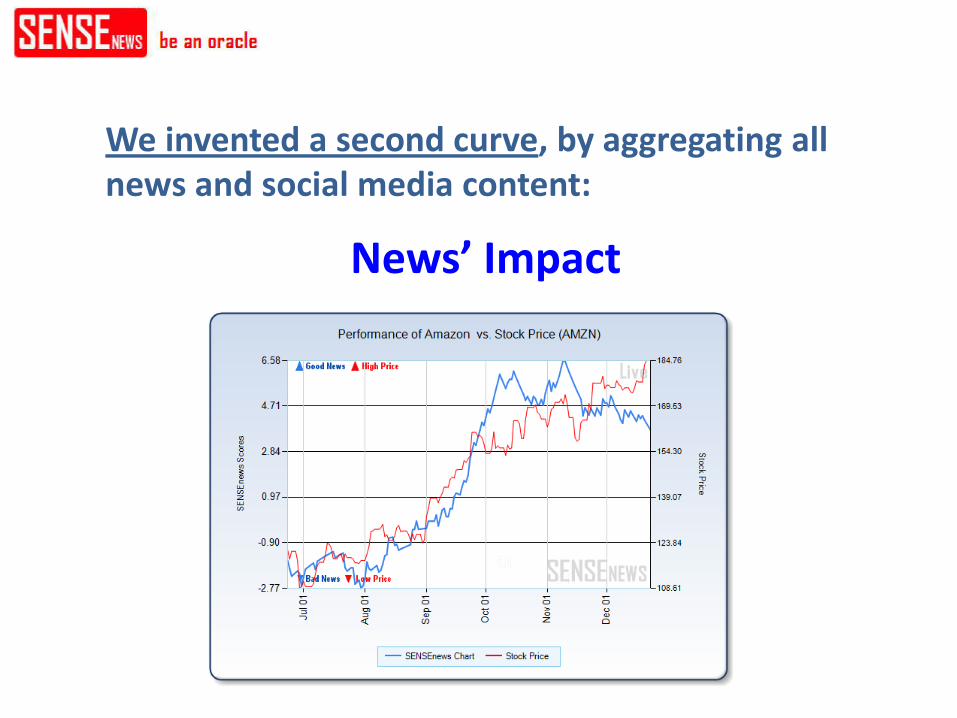
We invented a second curve, by aggregating all news and social media content:
News’ Impact

The second curve, News’ Impact, is the driving force behind stock prices, which is visibly correlated.

More...

This invention led to:
A new Stock Indicator
Stock Indicator

and its effectiveness is proven by yielding higher returns than that of DJIA and S&P 500 when used as a trading signal
Stock Indicator

With it, we can offer “best-stocks-picks” for the current market conditions.
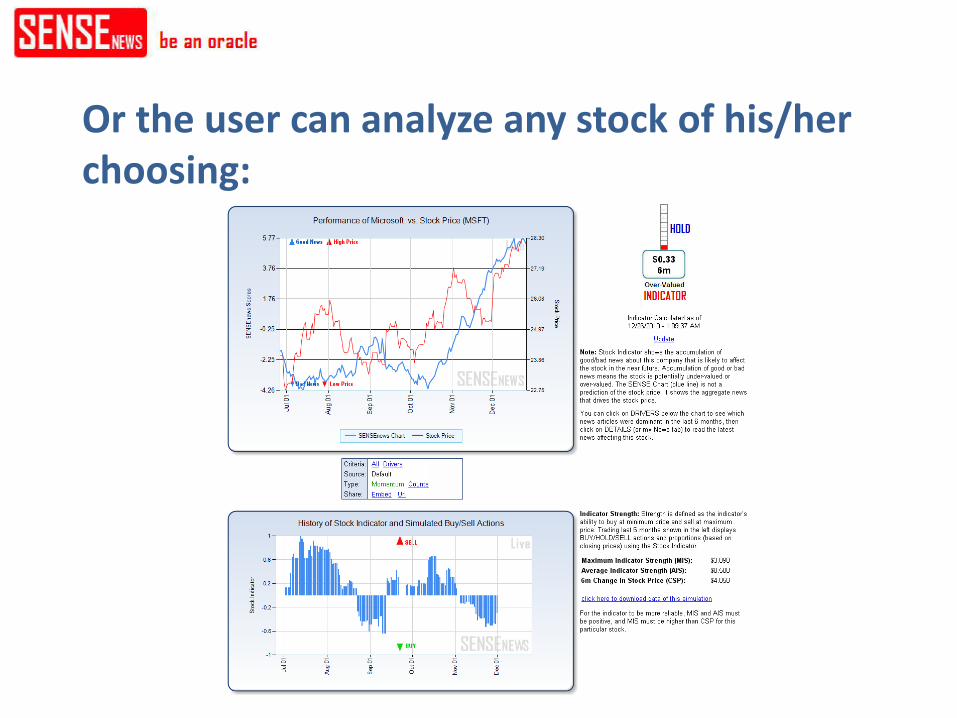
Or the user can analyze any stock of his/her choosing:
This is the first system (in the open literature) that can value stocks entirely based on available information on news and social media. In financial economics, this is known as “efficient market hypothesis” if it could be done by all human traders. We built a computerized version of it.

Also applied to phenomena where asset prices are not involved: Indexes

These are also first in the world!

A More Detailed Look: How Does it Work?
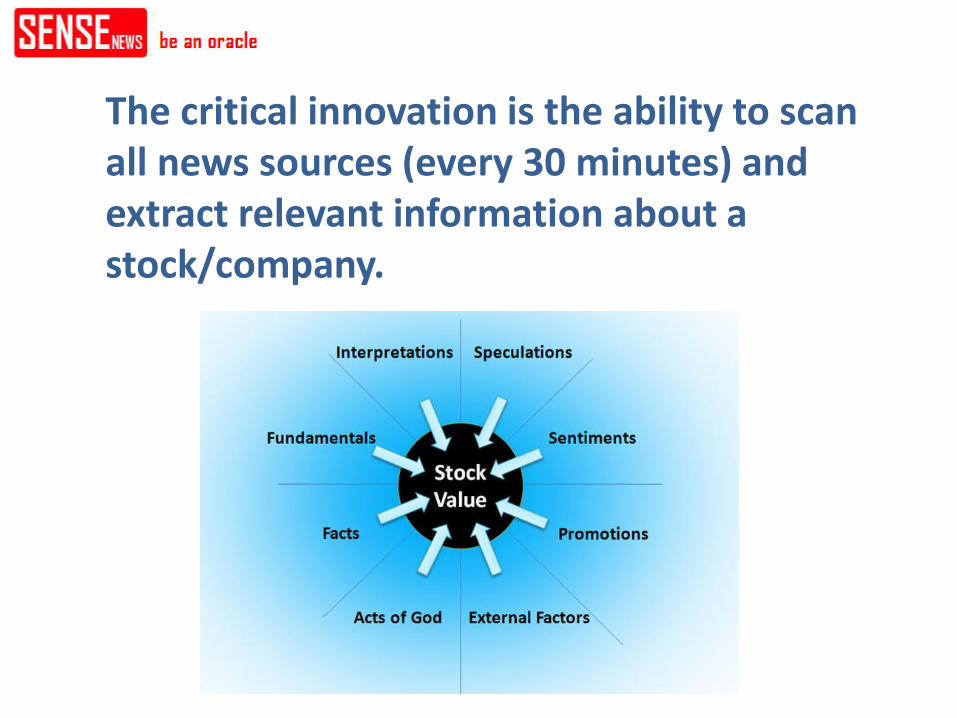
The critical innovation is the ability to scan all news sources (every 30 minutes) and extract relevant information about a stock/company.
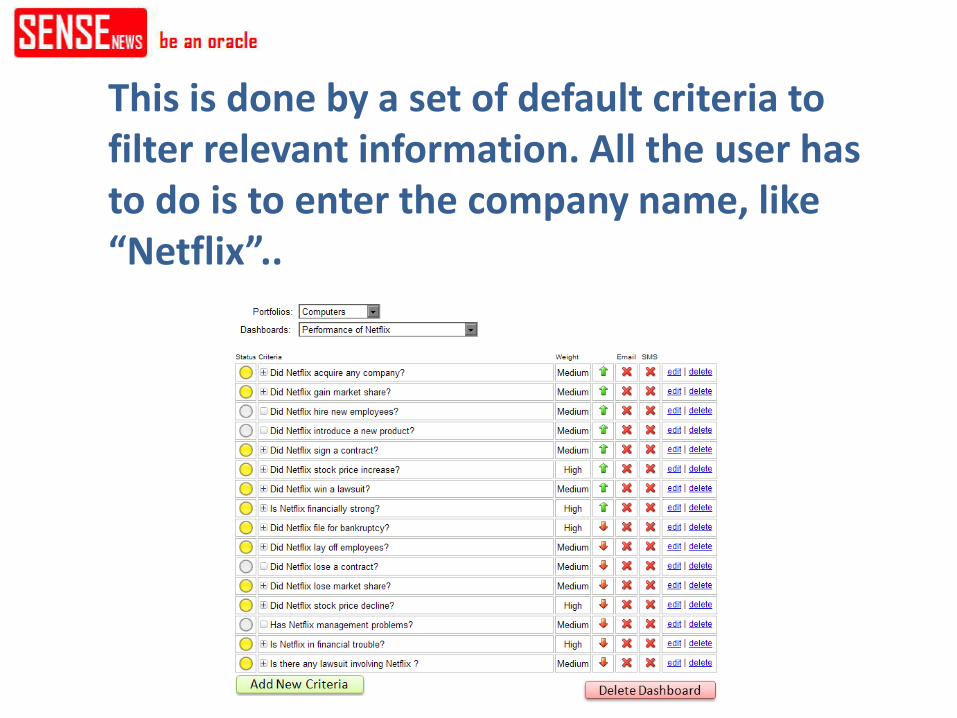
This is done by a set of default criteria to filter relevant information. All the user has to do is to enter the company name, like “Netflix”..
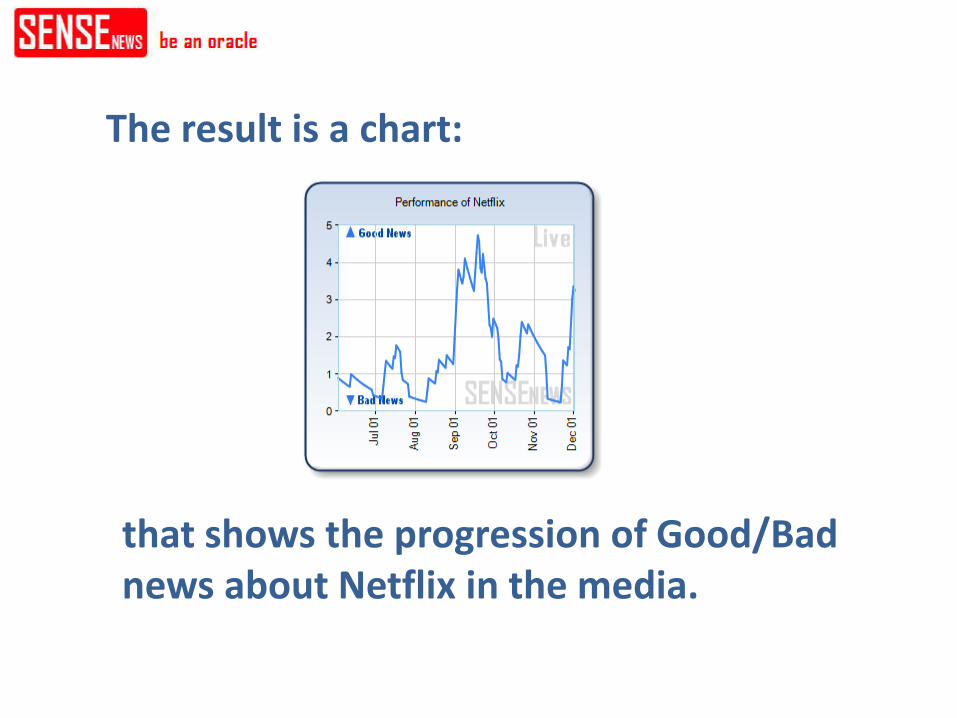
The result is a chart:
that shows the progression of Good/Bad news about Netflix in the media.
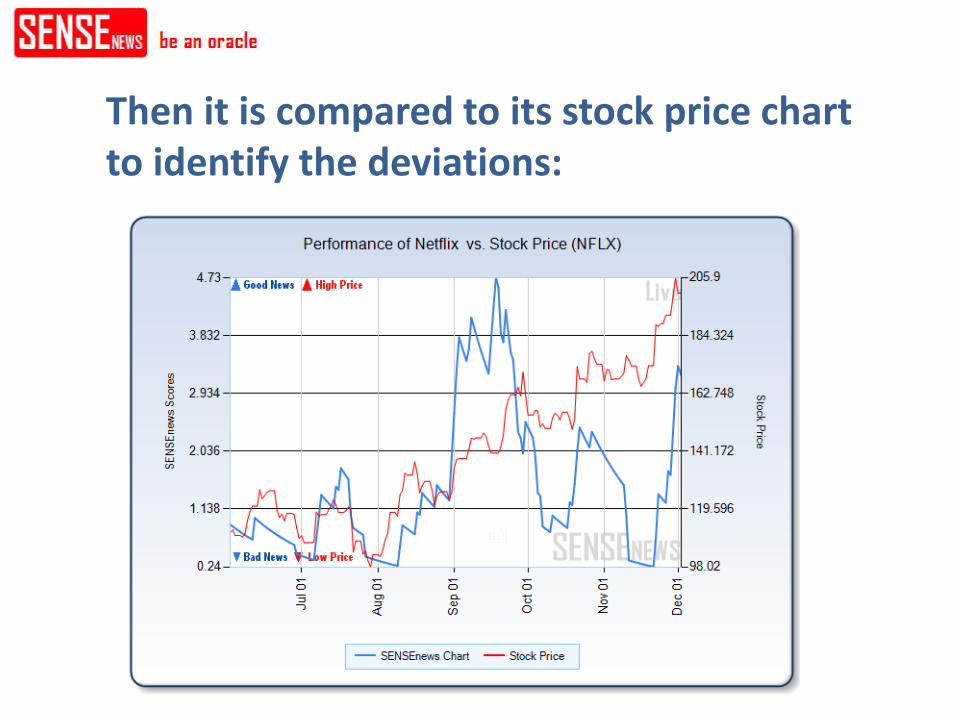
Then it is compared to its stock price chart to identify the deviations:

Good news pumped, stock price has not yet reacted: UNDER-VALUED Stock

Bad news accumulated, stock price has not yet reacted: OVER-VALUED Stock

Supported by a 6 months simulation of the Stock Indicator, showing the strength of the signal.
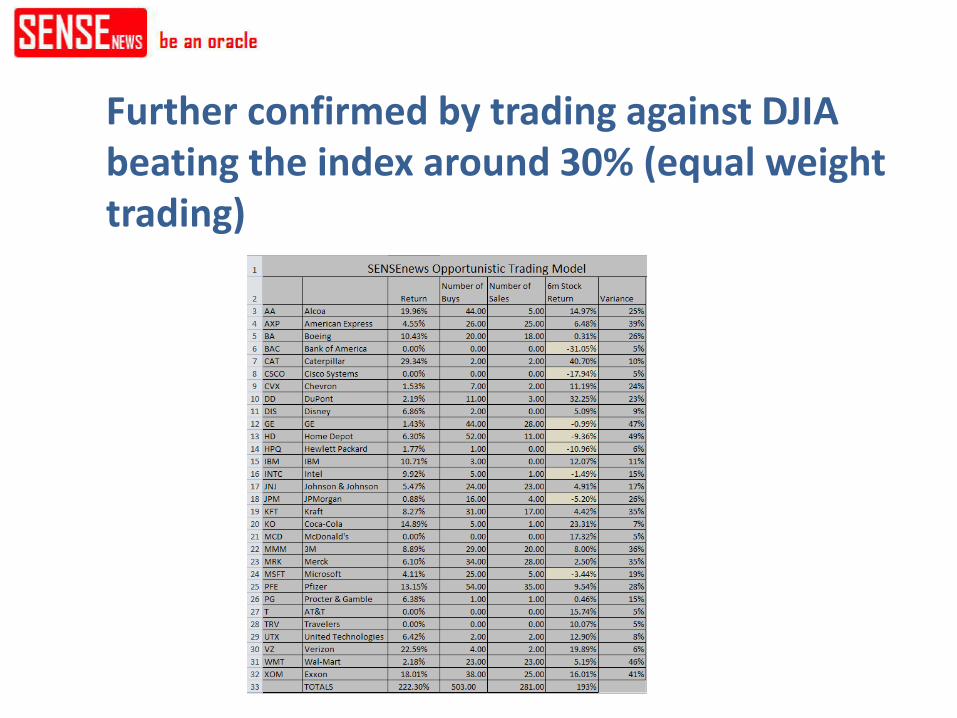
Further confirmed by trading against DJIA beating the index around 30% (equal weight trading)

and 14.6 times higher return from S&P 100 stocks
Using the Stock Indicator to beat the known indices is a proof that: 1- The underlying mechanism of the Stock Indicator works 2- Aggregating news and scoring via semantic technology produce valid correlations

The user can dig down, read news articles, get alerts, and adjust the scoring system.

SENSEnews is a Subscription Service. Number of subscriptions is limited not to dilute the trading advantage.
Related Documents