Introducing Auto- Support/Resistance Intraday Scans Himanshu Patil email : [email protected] twitter : himanshugpatil Copyright © 2009-2015 Proseon Technologies May not be reproduced without permission

Welcome message from author
This document is posted to help you gain knowledge. Please leave a comment to let me know what you think about it! Share it to your friends and learn new things together.
Transcript

Introducing Auto-Support/Resistance
Intraday Scans
Himanshu Patil email : [email protected] twitter : himanshugpatil
Copyright © 2009-2015 Proseon Technologies May not be
reproduced without permission
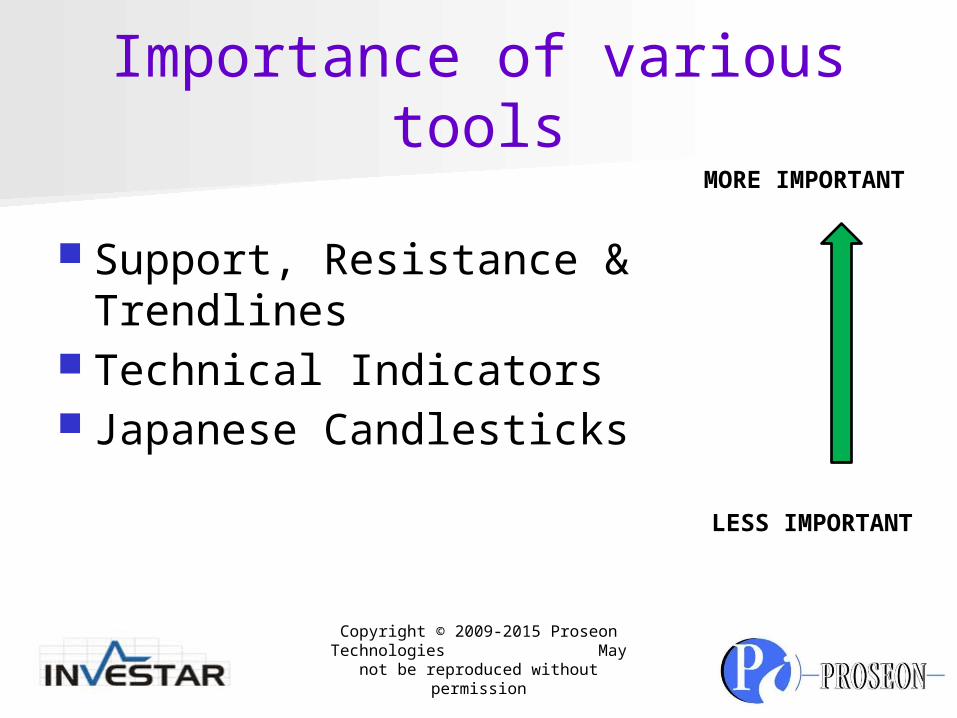
Importance of various tools
Support, Resistance & Trendlines Technical Indicators Japanese Candlesticks
MORE IMPORTANT
LESS IMPORTANT
Copyright © 2009-2015 Proseon Technologies May not be
reproduced without permission
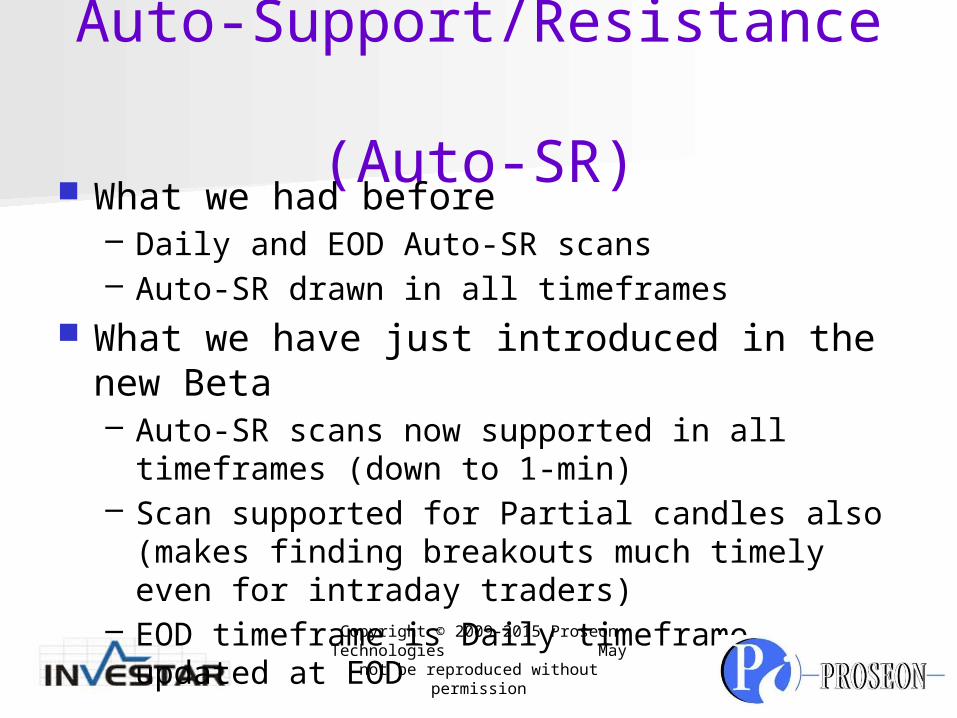
Auto-Support/Resistance (Auto-SR)
What we had before– Daily and EOD Auto-SR scans– Auto-SR drawn in all timeframes
What we have just introduced in the new Beta– Auto-SR scans now supported in all timeframes
(down to 1-min)– Scan supported for Partial candles also (makes
finding breakouts much timely even for intraday traders)
– EOD timeframe is Daily timeframe updated at EOD
Copyright © 2009-2015 Proseon Technologies May not be
reproduced without permission

Partial/Full Candle Scans What are partial and full candles? E.g., 5-min timeframe chart:
– At 10:17 am, the last candle contains only 2 minutes of data, hence we call it partial
– The candle will become “full” only at 10:20 am. Till now all scans were full candle
based, except Daily for which we had EOD and Daily timeframe scans (updated every 1 min)
Copyright © 2009-2015 Proseon Technologies May not be
reproduced without permission
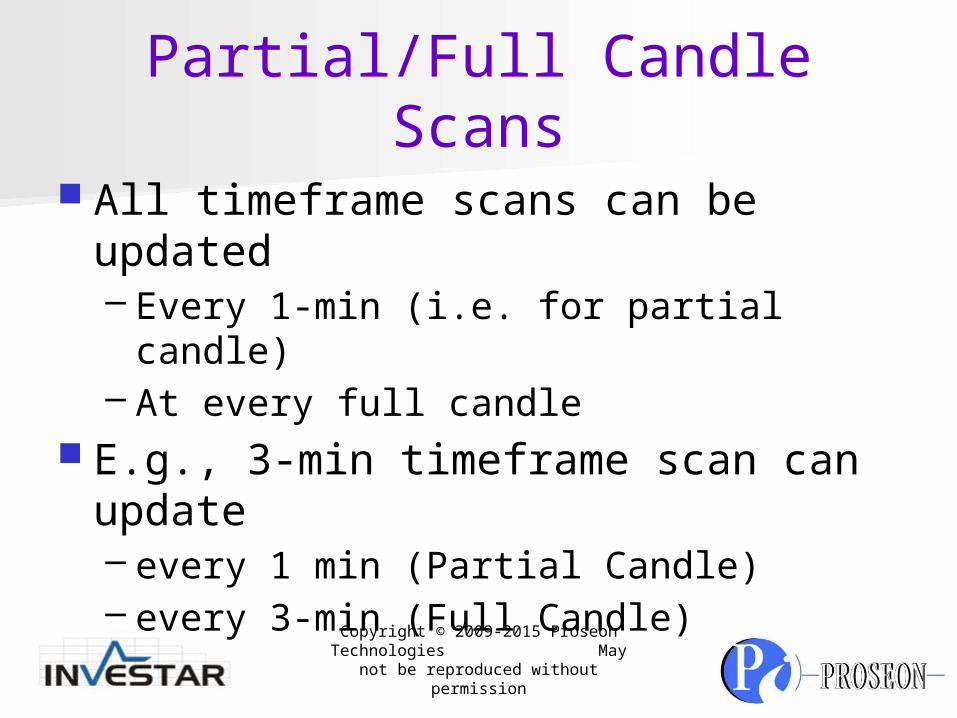
Partial/Full Candle Scans All timeframe scans can be updated
– Every 1-min (i.e. for partial candle)– At every full candle
E.g., 3-min timeframe scan can update– every 1 min (Partial Candle)– every 3-min (Full Candle)
Copyright © 2009-2015 Proseon Technologies May not be
reproduced without permission

Scan Alerts are generated on partial or full candle– Either first time in a partial candle– At end of every full candle (just like in
Investar 5.1 today)
Partial/Full Scan Alerts
Copyright © 2009-2015 Proseon Technologies May not be
reproduced without permission
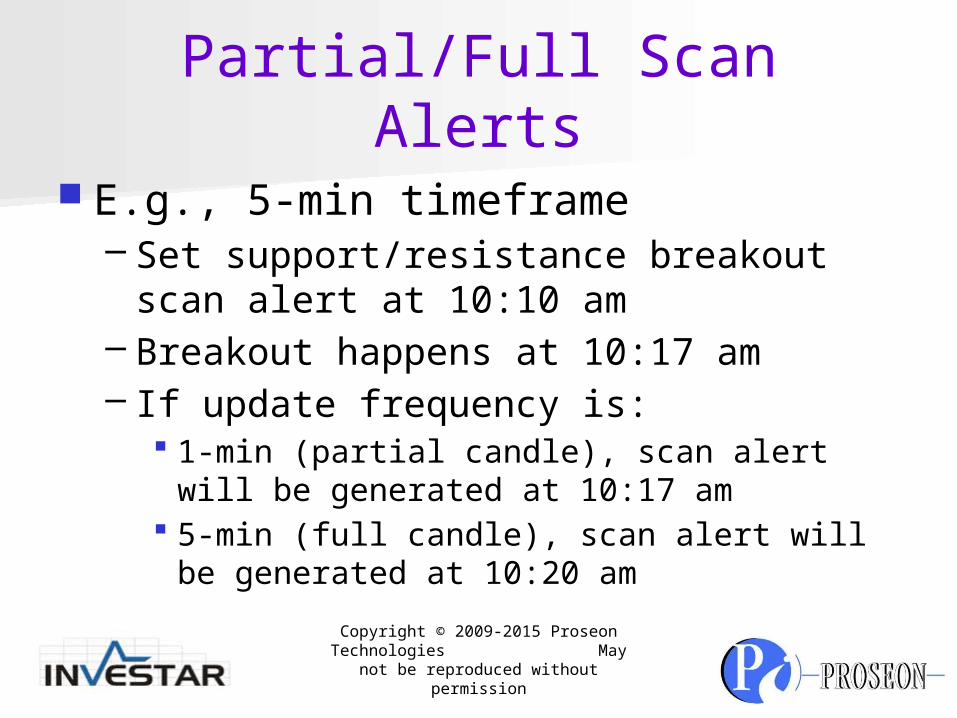
Partial/Full Scan Alerts E.g., 5-min timeframe
– Set support/resistance breakout scan alert at 10:10 am
– Breakout happens at 10:17 am– If update frequency is:
1-min (partial candle), scan alert will be generated at 10:17 am
5-min (full candle), scan alert will be generated at 10:20 am
Copyright © 2009-2015 Proseon Technologies May not be
reproduced without permission

Determining the Strength of a Trendline or
Support/Resistance How many peaks or troughs does it touch?– The more the touches, the stronger it is.
At what angle is the trendline?– The flatter the trendline the stronger it is.
Volume accompanied by trendline break?– The stronger the volume, stronger is the
trendline. How recent are the touches on the
trendline?– The more recent the touches the stronger it is.
How long is the trendline?– The longer it is, the stronger it is.Copyright © 2009-2015 Proseon
Technologies May not be reproduced without permission
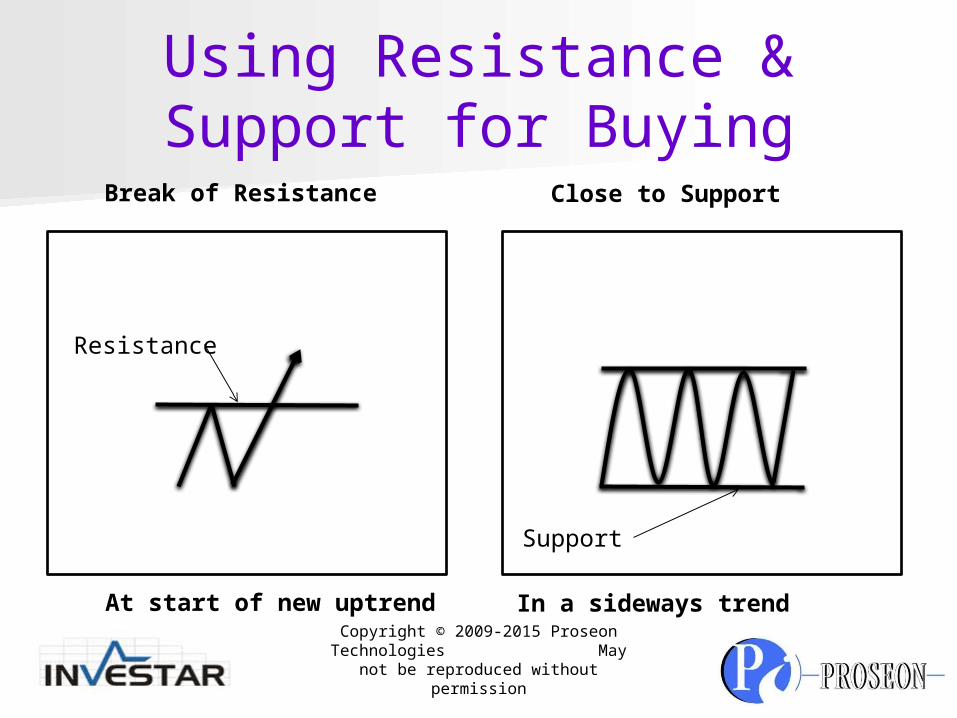
Using Resistance & Support for Buying
Resistance
Support
Break of Resistance Close to Support
Copyright © 2009-2015 Proseon Technologies May not be
reproduced without permission
At start of new uptrend In a sideways trend
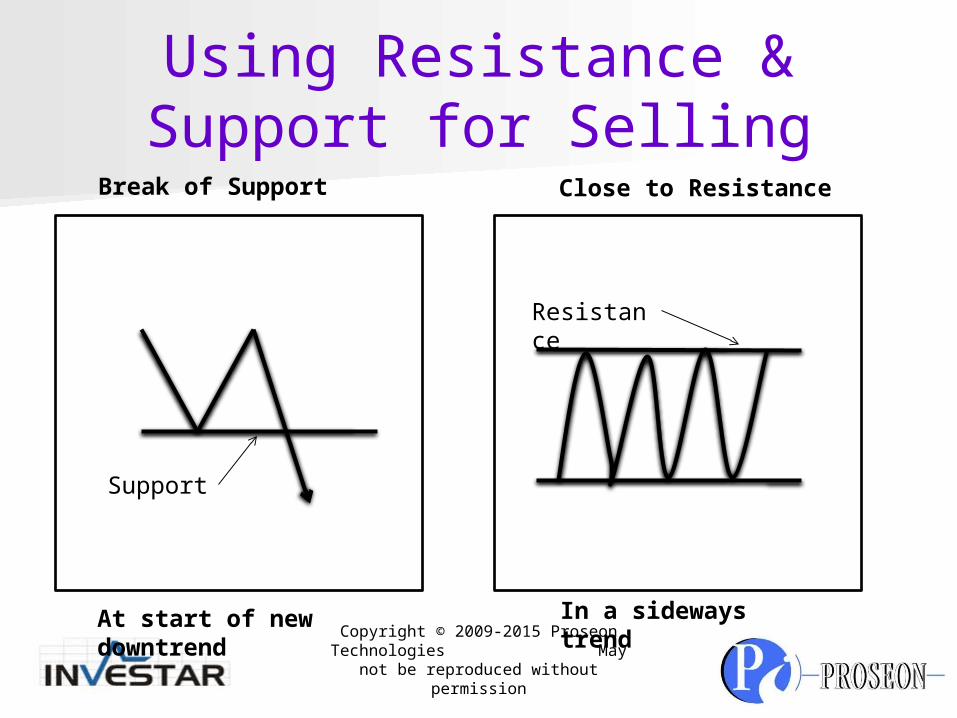
Using Resistance & Support for Selling
Support
Resistance
Break of Support Close to Resistance
Copyright © 2009-2015 Proseon Technologies May not be
reproduced without permission
At start of new downtrend In a sideways trend

Auto-Support/Resistance Investar automatically draws the
automatic support/resistance levels and rates them based on:– No of touches– Recency– Length
Copyright © 2009-2015 Proseon Technologies May not be
reproduced without permission

Auto-SR Top 20 %ile - Very Strong
Support/Resistance Next 20 %ile - Strong Support/Resistance and so on…
Copyright © 2009-2015 Proseon Technologies May not be
reproduced without permission

Tips for using Auto-SR Keep the default settings – scans are done
using the default settings Make sure your chart duration has the
number of bars that you have selected in Tools->Options. E.g., if you have 240, then you should have at least a one year duration.
Copyright © 2009-2015 Proseon Technologies May not be
reproduced without permission
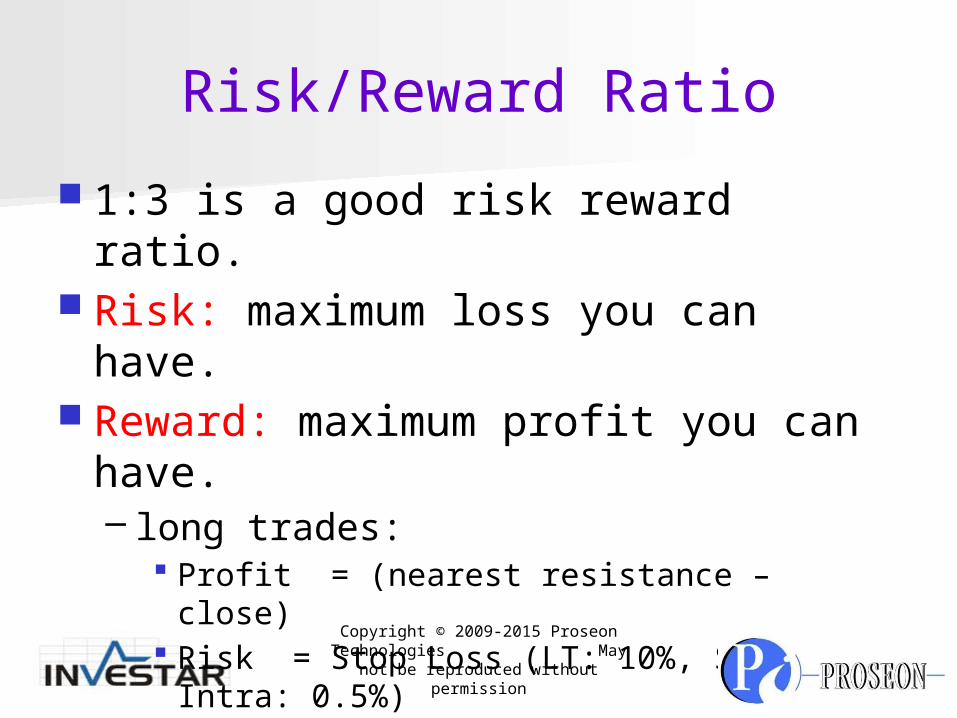
Risk/Reward Ratio 1:3 is a good risk reward ratio. Risk: maximum loss you can have. Reward: maximum profit you can
have.– long trades:
Profit = (nearest resistance – close) Risk = Stop Loss (LT: 10%, ST: 5%, Intra:
0.5%)– short trades:
Profit = (close – nearest support) Risk = Stop Loss (LT: 10%, ST: 5%, Intra:
0.5%)
Copyright © 2009-2015 Proseon Technologies May not be
reproduced without permission
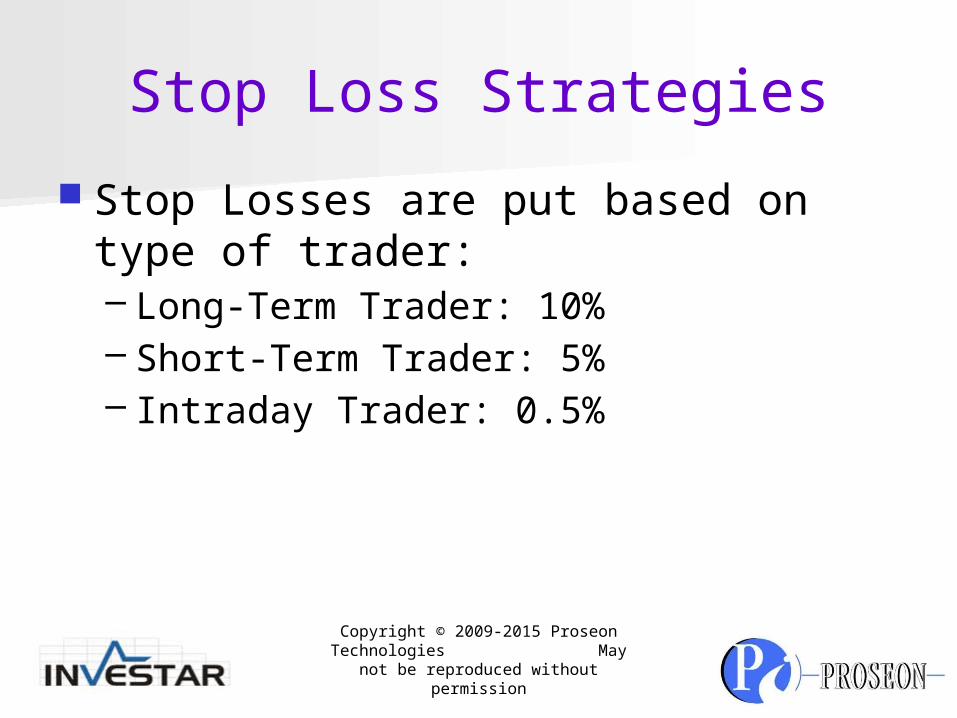
Stop Loss Strategies Stop Losses are put based on type of
trader:– Long-Term Trader: 10%– Short-Term Trader: 5%– Intraday Trader: 0.5%
Copyright © 2009-2015 Proseon Technologies May not be
reproduced without permission
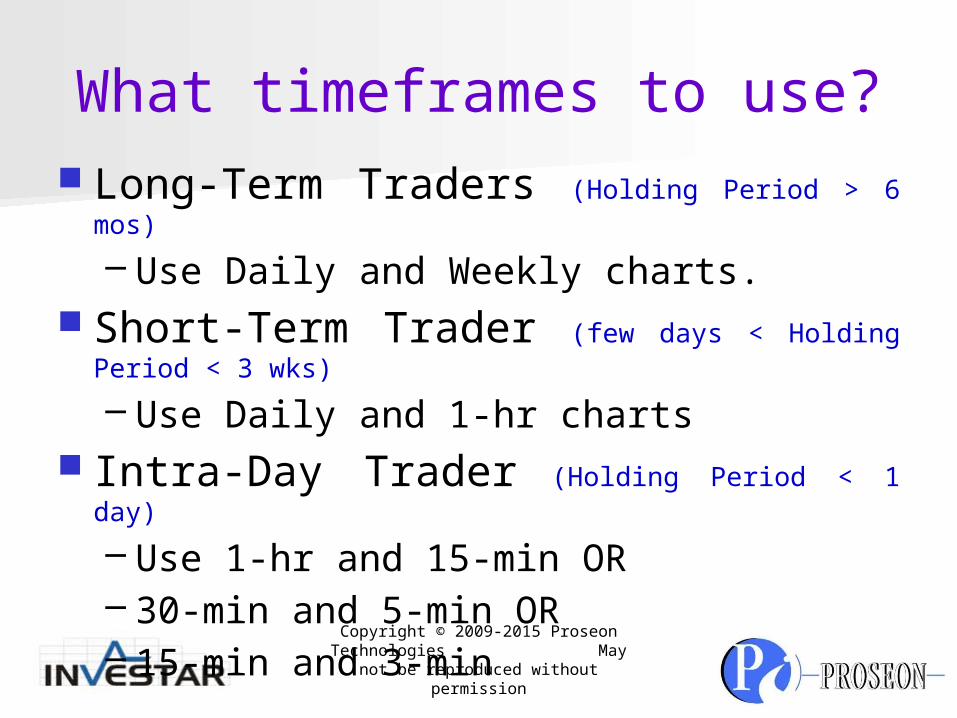
What timeframes to use? Long-Term Traders (Holding Period > 6 mos)
– Use Daily and Weekly charts. Short-Term Trader (few days < Holding Period <
3 wks)– Use Daily and 1-hr charts
Intra-Day Trader (Holding Period < 1 day)– Use 1-hr and 15-min OR– 30-min and 5-min OR– 15-min and 3-min
Copyright © 2009-2015 Proseon Technologies May not be
reproduced without permission
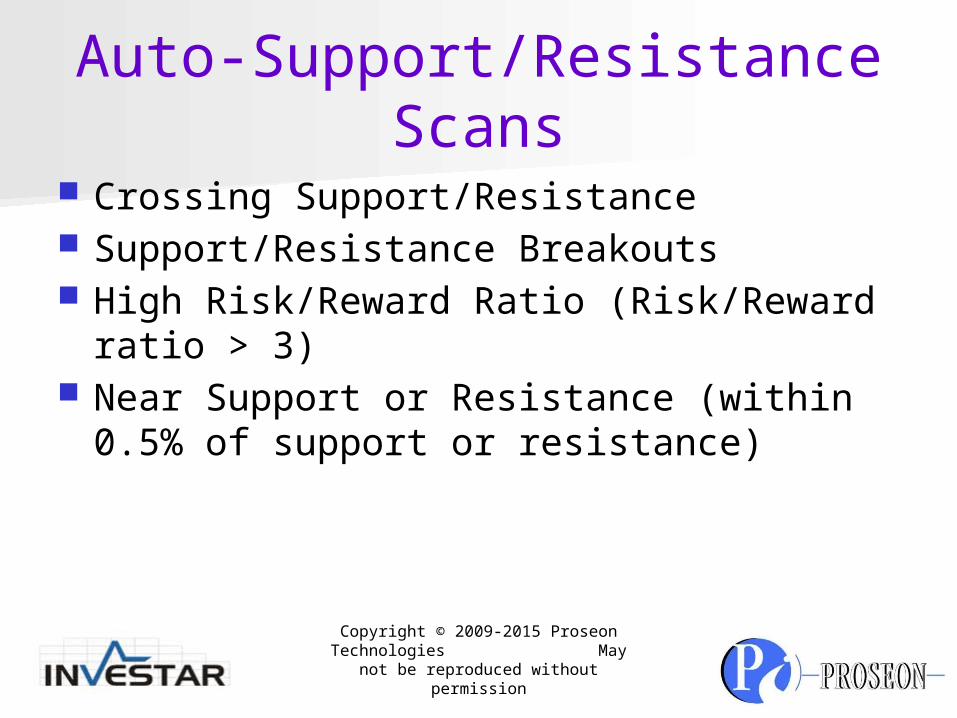
Auto-Support/Resistance Scans
Crossing Support/Resistance Support/Resistance Breakouts High Risk/Reward Ratio (Risk/Reward ratio
> 3) Near Support or Resistance (within 0.5% of
support or resistance)
Copyright © 2009-2015 Proseon Technologies May not be
reproduced without permission
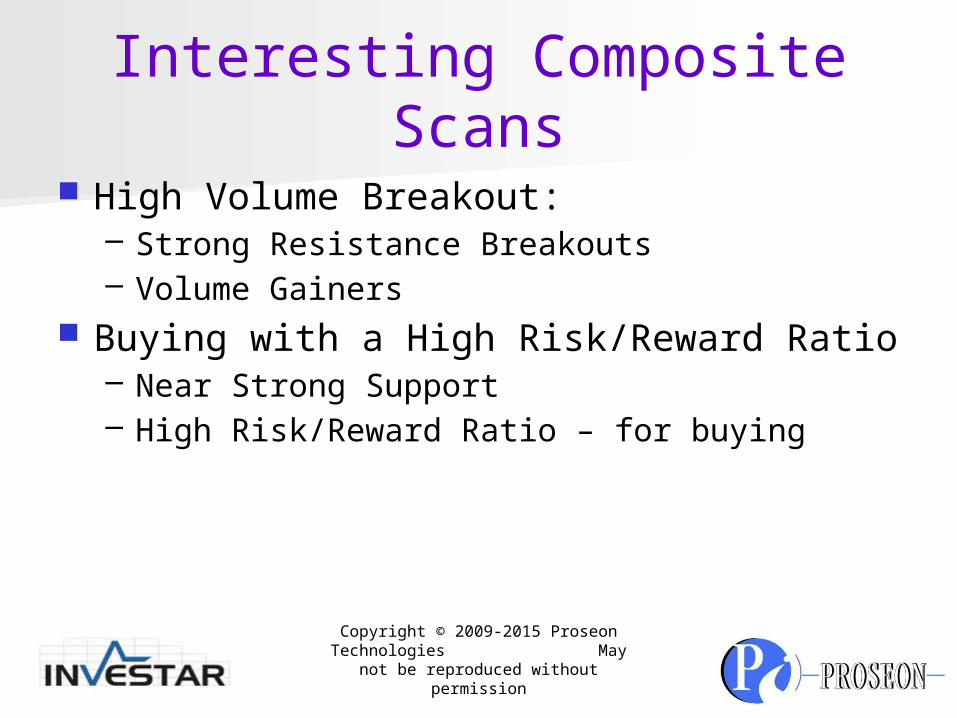
Interesting Composite Scans High Volume Breakout:
– Strong Resistance Breakouts– Volume Gainers
Buying with a High Risk/Reward Ratio– Near Strong Support– High Risk/Reward Ratio – for buying
Copyright © 2009-2015 Proseon Technologies May not be
reproduced without permission
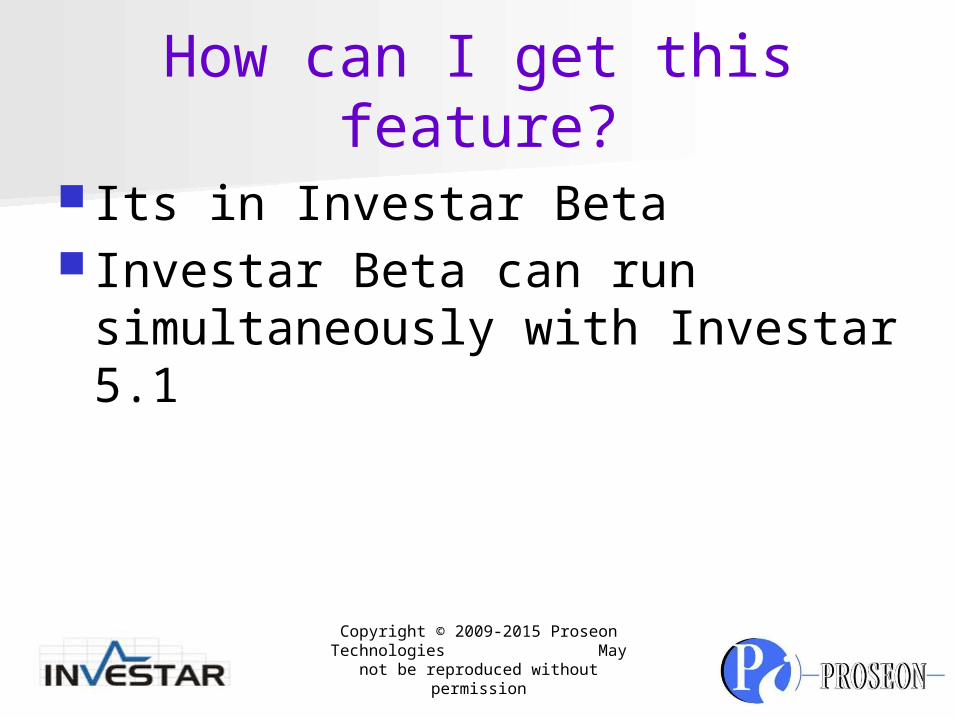
How can I get this feature? Its in Investar Beta Investar Beta can run
simultaneously with Investar 5.1
Copyright © 2009-2015 Proseon Technologies May not be
reproduced without permission

Future WebinarsSupport/Resistance Strategies
(TBD)Basics of Technical Analysis (16th
Jan)
Copyright © 2009-2015 Proseon Technologies May not be
reproduced without permission
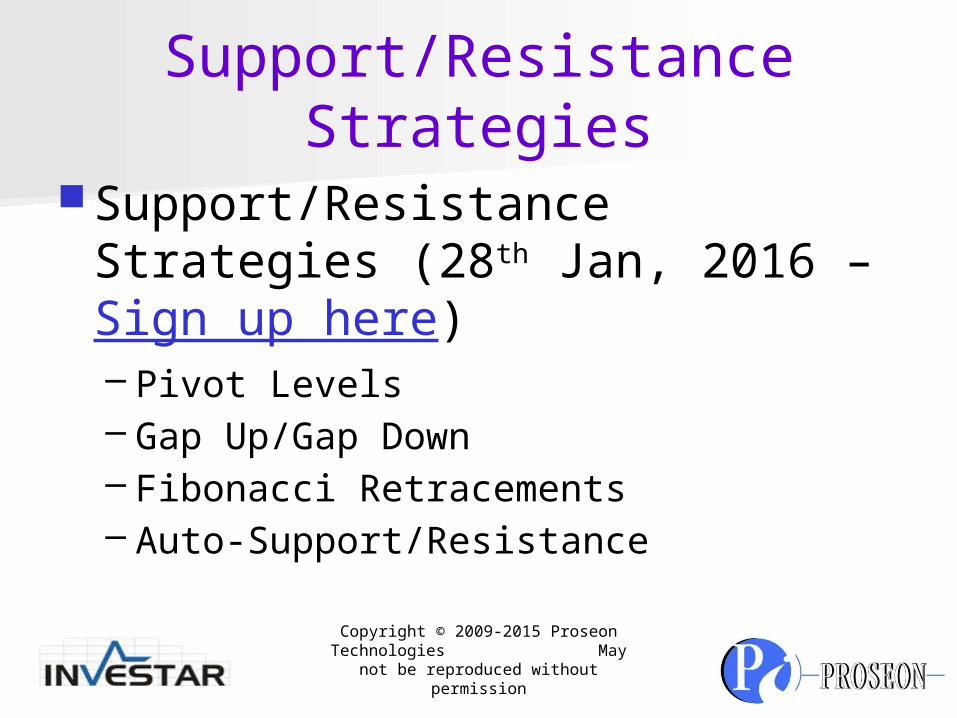
Support/Resistance Strategies
Support/Resistance Strategies (28th Jan, 2016 – Sign up here) – Pivot Levels– Gap Up/Gap Down– Fibonacci Retracements– Auto-Support/Resistance
Copyright © 2009-2015 Proseon Technologies May not be
reproduced without permission

Liked Auto-Support/Resistance?
Follow us on twitter:@himanshugpatil@investarindia Tweet with hashtag #AutoSR
Copyright © 2009-2015 Proseon Technologies May not be
reproduced without permission
THANK YOU
Thank You for Attending!
Copyright © 2009-2015 Proseon Technologies May not be
reproduced without permission
Related Documents