Intro Stats Lesson 2.1 B Objective: SSBAT construct an expanded frequency distribution chart. Standards: S2.5B

Intro Stats Lesson 2.1 B Objective: SSBAT construct an expanded frequency distribution chart. Standards: S2.5B.
Dec 31, 2015
Welcome message from author
This document is posted to help you gain knowledge. Please leave a comment to let me know what you think about it! Share it to your friends and learn new things together.
Transcript

Intro Stats
Lesson 2.1 B
Objective: SSBAT construct an expanded frequency distribution chart.
Standards: S2.5B

Expanded Frequency Distribution
Adds 3 more columns to the frequency distribution from yesterday - Midpoints, Relative Frequency, and Cumulative Frequency
These 3 columns will help to provide a better understanding of the data
Midpoint of a Class
The Average of the lower and upper limit of each class
Midpoint of Class =
You will use this formula for each row of the frequency distribution

Relative Frequency
The portion or percentage of the data that falls in that class
Divide the Frequency of that Class by the number of data entries
Relative Frequency =

Cumulative Frequency
The sum of the Frequency for that class and all previous class frequencies


1. Find the Midpoints, Relative Frequency and Cumulative Frequency for the following.
Class Tally Frequency (f)
Midpoint Relative Frequency
Cumulative Frequency
2 – 7 lllllll 7
8 – 13 lllllllllll 11
14 – 19 lllllll 7
20 – 25 lllllll 7
26 – 31 llll 4
Σf = 36
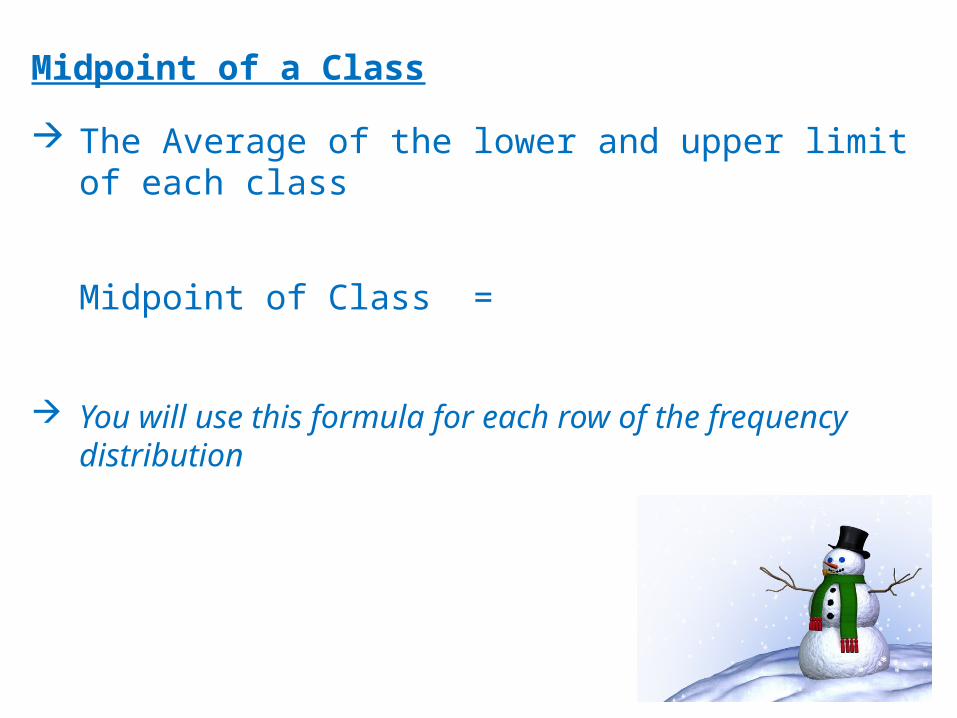
Problem 1 continued.
Midpoints
= 4.5
= 10.5
= 16.5
= 22.5
= 28.5

Class Tally Frequency (f)
Midpoint Relative Frequency
Cumulative Frequency
2 – 7 lllllll 7 4.5
8 – 13 lllllllllll 11 10.5
14 – 19 lllllll 7 16.5
20 – 25 lllllll 7 22.5
26 – 31 llll 4 28.5
Σf = 36
Problem 1 continued.

Relative Frequency =
Class Tally Frequency (f)
Midpoint Relative Frequency
Cumulative Frequency
2 – 7 lllllll 7 4.5
8 – 13 lllllllllll 11 10.5
14 – 19 lllllll 7 16.5
20 – 25 lllllll 7 22.5
26 – 31 llll 4 28.5
Σf = 36
.19
.31
.19
.19
.11
Problem 1 continued.

Cumulative Frequency The sum of the Frequency for that class and all previous classes
Class Tally Frequency (f)
Midpoint Relative Frequency
Cumulative Frequency
2 – 7 lllllll 7 4.5 .19
8 – 13 lllllllllll 11 10.5 .31
14 – 19 lllllll 7 16.5 .19
20 – 25 lllllll 7 22.5 .19
26 – 31 llll 4 28.5 .11
Σf = 36
718253236
Problem 1 continued.


2. Find the Midpoints, Relative Frequency and Cumulative Frequency for the following.
Class Frequency Midpoint Relative Frequency
Cumulative Frequency
7 – 18 6 19 – 30 10 31 – 42 13 43 – 54 8 55 – 66 5 67 – 78 6 79 – 90 2
∑f = 50
12.524.5
36.5
48.5
60.5
72.584.5

2. Relative Frequency Frequency ÷ Total #
Class Frequency Midpoint Relative Frequency
Cumulative Frequency
7 – 18 6 19 – 30 10 31 – 42 13 43 – 54 8 55 – 66 5 67 – 78 6 79 – 90 2
∑f = 50
12.524.5
36.5
48.560.5
72.584.5
.12.2
.26
.16
.1
.12
.04

2. Cumulative Frequency Class Frequency + Above Frequencies
Class Frequency Midpoint Relative Frequency
Cumulative Frequency
7 – 18 6 19 – 30 10 31 – 42 13 43 – 54 8 55 – 66 5 67 – 78 6 79 – 90 2
∑f = 50
12.524.5
36.5
48.5
60.5
72.5
84.5
.12.2
.26
.16
.1
.12
.04
616
29
37
42
48
50

Example Three is worksheet 2.1 B
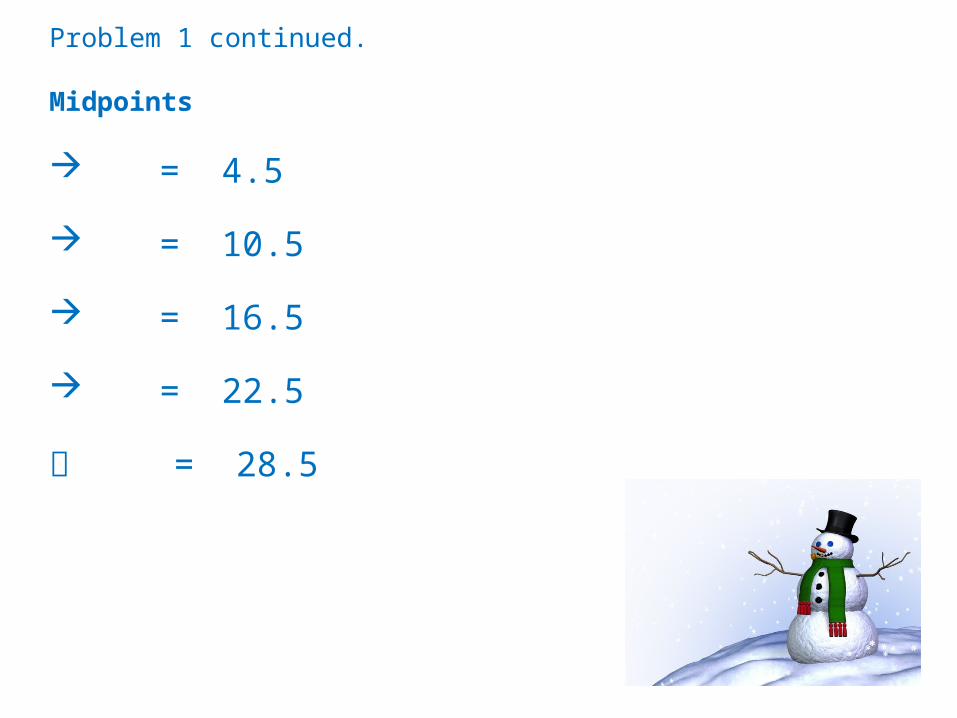
Class Frequency Midpoint Relative Frequency
Cumulative Frequency
1 – 5 5 6 – 10 8
11 – 15 4 16 – 20 7 21 – 25 6 26 – 30 4
∑f = 34
4. Find the Midpoints, Relative Frequency and Cumulative Frequency for the following.

4. Answers to #3
Class Frequency Midpoint Relative Frequency
Cumulative Frequency
1 – 5 5 3 .15 5 6 – 10 8 8 .24 13
11 – 15 4 13 .12 1716 – 20 7 18 .21 2421 – 25 6 23 .18 3026 – 30 4 28 .12 34
∑f = 34
Homework
Worksheet 2.1 B
Related Documents