Intrinsic Point Defects in Zinc Oxide: Modeling of Structural, Electronic, Thermodynamic and Kinetic Properties Vom Fachbereich Material- und Geowissenschaften der Technischen Universit¨ at Darmstadt zur Erlangung des Grades Doktor-Ingenieur genehmigte Dissertation vorgelegt von Paul Erhart Referent: Prof. Karsten Albe Korreferent: Prof. Heinz von Seggern Tag der Einreichung: 18. Mai 2006 Tag der m¨ undlichen Pr¨ ufung: 5. Juli 2006 Darmstadt, 2006 D17

Welcome message from author
This document is posted to help you gain knowledge. Please leave a comment to let me know what you think about it! Share it to your friends and learn new things together.
Transcript
Intrinsic Point Defects in Zinc Oxide:
Modeling of Structural, Electronic, Thermodynamic
and Kinetic Properties
Vom Fachbereich
Material- und Geowissenschaften
der Technischen Universitat Darmstadt
zur Erlangung des Grades Doktor-Ingenieur
genehmigte Dissertation
vorgelegt von
Paul Erhart
Referent: Prof. Karsten Albe
Korreferent: Prof. Heinz von Seggern
Tag der Einreichung: 18. Mai 2006
Tag der mundlichen Prufung: 5. Juli 2006
Darmstadt, 2006
D17

Contents
List of Figures V
List of Tables VII
List of Abbreviations IX
Abstract XIII
I. Introduction 1
1. Motivation 3
2. Modeling of materials 7
2.1. Simulation techniques in atomic scale modeling . . . . . . . . . . . . . . . 7
2.2. Bridging length and time scales . . . . . . . . . . . . . . . . . . . . . . . . 9
II. Quantum mechanical modeling of intrinsic point defects 13
3. Density functional theory 15
3.1. General aspects . . . . . . . . . . . . . . . . . . . . . . . . . . . . . . . . . 15
3.2. Exchange-correlation functional . . . . . . . . . . . . . . . . . . . . . . . . 16
3.3. Plane wave basis sets and pseudopotentials . . . . . . . . . . . . . . . . . . 17
4. Structure and stability of vacancies and oxygen interstitials 19
4.1. Introduction . . . . . . . . . . . . . . . . . . . . . . . . . . . . . . . . . . . 19
I

Contents
4.2. Methodology . . . . . . . . . . . . . . . . . . . . . . . . . . . . . . . . . . 20
4.3. Results . . . . . . . . . . . . . . . . . . . . . . . . . . . . . . . . . . . . . . 25
4.4. Discussion . . . . . . . . . . . . . . . . . . . . . . . . . . . . . . . . . . . . 35
4.5. Conclusions . . . . . . . . . . . . . . . . . . . . . . . . . . . . . . . . . . . 36
5. Role of band structure, volume relaxation and finite size effects 37
5.1. Introduction . . . . . . . . . . . . . . . . . . . . . . . . . . . . . . . . . . . 37
5.2. Band structure of zinc oxide . . . . . . . . . . . . . . . . . . . . . . . . . . 39
5.3. Methodology . . . . . . . . . . . . . . . . . . . . . . . . . . . . . . . . . . 40
5.4. Results . . . . . . . . . . . . . . . . . . . . . . . . . . . . . . . . . . . . . . 44
5.5. Discussion . . . . . . . . . . . . . . . . . . . . . . . . . . . . . . . . . . . . 49
5.6. Conclusions . . . . . . . . . . . . . . . . . . . . . . . . . . . . . . . . . . . 54
6. Migration mechanisms and diffusion of intrinsic defects 55
6.1. Introduction . . . . . . . . . . . . . . . . . . . . . . . . . . . . . . . . . . . 55
6.2. Background . . . . . . . . . . . . . . . . . . . . . . . . . . . . . . . . . . . 57
6.3. Methodology . . . . . . . . . . . . . . . . . . . . . . . . . . . . . . . . . . 57
6.4. Oxygen . . . . . . . . . . . . . . . . . . . . . . . . . . . . . . . . . . . . . 61
6.5. Zinc . . . . . . . . . . . . . . . . . . . . . . . . . . . . . . . . . . . . . . . 75
6.6. Potential sources of error . . . . . . . . . . . . . . . . . . . . . . . . . . . . 80
6.7. Conclusions . . . . . . . . . . . . . . . . . . . . . . . . . . . . . . . . . . . 81
III. Interatomic bond-order potential for zinc oxide 85
7. Review of potential schemes 87
7.1. Introduction . . . . . . . . . . . . . . . . . . . . . . . . . . . . . . . . . . . 87
7.2. Metallic and covalent bonding . . . . . . . . . . . . . . . . . . . . . . . . . 88
7.3. Bonding in compounds . . . . . . . . . . . . . . . . . . . . . . . . . . . . . 89
8. Pontifix/Pinguin: A code for fitting analytic bond-order potentials 93
8.1. Introduction . . . . . . . . . . . . . . . . . . . . . . . . . . . . . . . . . . . 93
8.2. Analytic bond-order potential formalism . . . . . . . . . . . . . . . . . . . 95
8.3. Fitting methodology . . . . . . . . . . . . . . . . . . . . . . . . . . . . . . 96
8.4. Features of Pontifix . . . . . . . . . . . . . . . . . . . . . . . . . . . . . 97
II

8.5. An illustrative example . . . . . . . . . . . . . . . . . . . . . . . . . . . . . 100
8.6. Conclusions . . . . . . . . . . . . . . . . . . . . . . . . . . . . . . . . . . . 101
9. Bond-order potential for zinc oxide 103
9.1. Introduction . . . . . . . . . . . . . . . . . . . . . . . . . . . . . . . . . . . 103
9.2. Methodology . . . . . . . . . . . . . . . . . . . . . . . . . . . . . . . . . . 104
9.3. Zinc oxide . . . . . . . . . . . . . . . . . . . . . . . . . . . . . . . . . . . . 105
9.4. Zinc . . . . . . . . . . . . . . . . . . . . . . . . . . . . . . . . . . . . . . . 110
9.5. Oxygen . . . . . . . . . . . . . . . . . . . . . . . . . . . . . . . . . . . . . 113
9.6. Point defects, thermal properties, and cutoff parameters . . . . . . . . . . 115
9.7. Irradiation of bulk zinc oxide . . . . . . . . . . . . . . . . . . . . . . . . . . 117
9.8. Conclusions . . . . . . . . . . . . . . . . . . . . . . . . . . . . . . . . . . . 120
9.9. Appendix: Total energy calculations . . . . . . . . . . . . . . . . . . . . . 120
Conclusions 123
Outlook 125
A. Appendix: Methods 129
A.1. Molecular dynamics simulations . . . . . . . . . . . . . . . . . . . . . . . . 129
A.2. Phonon dispersion relations . . . . . . . . . . . . . . . . . . . . . . . . . . 130
A.3. Overview of external codes . . . . . . . . . . . . . . . . . . . . . . . . . . . 131
Danksagung – Acknowledgments 133
Erklarung – Disclaimer 135
Curriculum vitae 137
Bibliography 141


List of Figures
4.1. Geometric structure of oxygen and zinc vacancies . . . . . . . . . . . . . . 24
4.2. Geometric structure of oxygen interstitial configurations . . . . . . . . . . 25
4.3. Variation of point defect formation enthalpies with Fermi level . . . . . . 26
4.4. Electron density of oxygen vacancy configurations . . . . . . . . . . . . . . 30
4.5. Geometry and electron density of dumbbell interstitial configuration . . . 31
4.6. Simplified molecular orbitals scheme of oxygen dumbbell bond . . . . . . . 32
4.7. Relative net charge and variation of oxygen separation with charge state . 33
4.8. Electron counting scheme for rotated dumbbell oxygen interstitial . . . . . 34
5.1. Band structure calculations with the GGA+U method . . . . . . . . . . . 41
5.2. Comparison of band structure calculations for zinc oxide . . . . . . . . . . 42
5.3. Scaling behavior of formation enthalpies with concentration . . . . . . . . 45
5.4. Variation of point defect formation volumes with charge state . . . . . . . 48
5.5. Variation of point defect formation enthalpies with Fermi level . . . . . . 50
5.6. Stability map of intrinsic point defects . . . . . . . . . . . . . . . . . . . . 51
5.7. Comparison of point defect transition levels . . . . . . . . . . . . . . . . . 52
5.8. Variation of equilibrium defect transition levels with isostatic pressure . . 53
6.1. Schematic of a one-dimensional potential energy surface . . . . . . . . . . . 58
6.2. Schematic illustration of the nudged elastic band and the dimer method . 59
6.3. Vacancy migration paths . . . . . . . . . . . . . . . . . . . . . . . . . . . 61
6.4. Energy pathway for oxygen vacancy in-plane migration . . . . . . . . . . . 62
6.5. Oxygen interstitial migration paths . . . . . . . . . . . . . . . . . . . . . . 64
6.6. Charge state dependence of oxygen interstitial migration enthalpies . . . . 66
6.7. Schematic of the energy surface for oxygen interstitial migration . . . . . . 67
V

6.8. Modified migration paths for negatively charged oxygen interstitials . . . . 71
6.9. Dependence of oxygen diffusivity on chemical potential and Fermi level . . 72
6.10. Temperature dependence of oxygen self-diffusion coefficient . . . . . . . . 73
6.11. Charge state dependence of migration enthalpies for zinc diffusion . . . . . 74
6.12. Zinc interstitial migration paths . . . . . . . . . . . . . . . . . . . . . . . 76
6.13. Site-projected density of states for zinc interstitial migration . . . . . . . . 77
6.14. Dependence of zinc diffusivity on chemical potential, Fermi level and tem-
perature . . . . . . . . . . . . . . . . . . . . . . . . . . . . . . . . . . . . . 79
8.1. Flow chart of the Pontifix fitting algorithm . . . . . . . . . . . . . . . . 98
8.2. Pauling plot for silicon . . . . . . . . . . . . . . . . . . . . . . . . . . . . . 101
9.1. Pauling plot for zinc oxide . . . . . . . . . . . . . . . . . . . . . . . . . . . 106
9.2. Energy-volume curves for bulk phases of zinc oxide . . . . . . . . . . . . . 108
9.3. Phonon dispersion relations for zinc oxide . . . . . . . . . . . . . . . . . . 109
9.4. Energy-volume curves for bulk phases of zinc . . . . . . . . . . . . . . . . 111
9.5. Pauling plot for oxygen . . . . . . . . . . . . . . . . . . . . . . . . . . . . 113
9.6. Probability to form a defect during a recoil event as a function of energy . 119
A.1. Flow chart of molecular dynamics simulation . . . . . . . . . . . . . . . . . 130

List of Tables
4.1. Formation enthalpies of intrinsic point defects . . . . . . . . . . . . . . . . 28
4.2. First and second nearest neighbor relaxations around the oxygen vacancy 29
5.1. Formation enthalpies of intrinsic point defects . . . . . . . . . . . . . . . . 47
5.2. Formation volumes of intrinsic point defects . . . . . . . . . . . . . . . . . 49
6.1. Energy barriers for oxygen vacancy and interstitial migration . . . . . . . 63
6.2. Parameters for derivation of oxygen defect diffusivities . . . . . . . . . . . 70
6.3. Energy barriers for zinc vacancy and interstitial migration . . . . . . . . . 75
9.1. Analytic bond-order potential parameter sets for zinc oxide . . . . . . . . . 104
9.2. Summary of properties of the ZnO dimer . . . . . . . . . . . . . . . . . . . 105
9.3. Summary of bulk properties of zinc oxide . . . . . . . . . . . . . . . . . . . 107
9.4. Summary of bulk properties of zinc . . . . . . . . . . . . . . . . . . . . . . 112
9.5. Summary of properties of oxygen molecules and bulk phases . . . . . . . . 114
VII


List of Abbreviations
Abinit computer code for DFT calculations (Sec. A.3)
ABOP analytic bond-order potential (Chapter 7)
bcc body-centered cubic
BLYP Becke, Lee, Yang, and Parr exchange-correlation functional (Sec. 3.2)
B3LYP Becke 3-Parameter (Exchange), Lee, Yang, and Parr exchange-
correlation functional (Sec. 3.2)
CBM conduction band minimum
CI-NEB climbing image nudged elastic band (Sec. 6.3.1)
DFT density functional theory (Chapter 3)
dia diamond
DOS density of states
EAM embedded atom method (Chapter 7)
EBE extrinsic bond energy
fcc face-centered cubic
f.u. formula unit
GGA generalized gradient approximation (Sec. 3.2)
GGA+U GGA with semi-empirical self-interaction corrections (see Sec. 3.2 and
Sec. 5.3.1)
GGSA spin-polarized GGA
Gulp general utility lattice program (Sec. A.3)
hcp hexagonal-close packed
HF Hartree-Fock
IX
IBE intrinsic bond energy
KMC kinetic Monte-Carlo
LAPW linearized augmented-plane waves
LCAO linear combination of atomic orbitals
LC Lewis-Catlow shell-model potential
LDA local density approximation (Sec. 3.2)
LDA+U LDA with semi-empirical self-interaction corrections (see Sec. 3.2 and
Sec. 5.3.1)
MC Monte-Carlo
MD molecular dynamics (Sec. A.1)
MEAM modified embedded atom method (Chapter 7)
MEP minimum energy path (Sec. 6.3.1)
MO molecular orbitals
NEB nudged-elastic band (Sec. 6.3.1)
Oi oxygen interstitial
PAW projector augmented wave(s)
PES potential energy surface
PP pseudopotential
PW91 Perdew-Wang parameterization of the GGA exchange-correlation func-
tional (Sec. 3.2)
PWPP plane wave-pseudopotential (Chapter 3)
PW plane wave(s) (Chapter 3)
QM quantum mechanical
sc simple cubic
SIC self-interaction corrections
SIRC self-interaction and electronic relaxation corrections (Sec. 5.2)
TB tight-binding
Vasp Vienna ab-initio simulation package (Sec. A.3)
VBM valence band maximum
VO oxygen vacancy

VZn zinc vacancy
XC exchange-correlation (Sec. 3.2)
Zni zinc interstitial


Abstract
The present dissertation deals with the modeling of zinc oxide on the atomic scale employ-
ing both quantum mechanical as well as atomistic methods.
The first part describes quantum mechanical calculations based on density functional
theory of intrinsic point defects in ZnO. To begin with, the geometric and electronic struc-
ture of vacancies and oxygen interstitials is explored. In equilibrium oxygen interstitials
are found to adopt dumbbell and split interstitial configurations in positive and negative
charge states, respectively. Semi-empirical self-interaction corrections allow to improve the
agreement between the experimental and the calculated band structure significantly; errors
due to the limited size of the supercells can be corrected by employing finite-size scaling.
The effect of both band structure corrections and finite-size scaling on defect formation
enthalpies and transition levels is explored. Finally, transition paths and barriers for the
migration of zinc as well as oxygen vacancies and interstitials are determined. The re-
sults allow to interpret diffusion experiments and provide a consistent basis for developing
models for device simulation.
In the second part an interatomic potential for zinc oxide is derived. To this end, the
Pontifix computer code is developed which allows to fit analytic bond-order potentials.
The code is subsequently employed to obtain interatomic potentials for Zn–O, Zn–Zn, and
O–O interactions. To demonstrate the applicability of the potentials, simulations on defect
production by ion irradiation are carried out.
XIII


Part I.
Introduction
1


1. Motivation
Zinc oxide is a transparent semiconductor with a direct band gap of 3.4 eV. It can be degen-
erately doped n-type and free electron concentrations in excess of 1021 cm−3 are achievable
[7]. It has long been believed that p-type doping of zinc oxide is impossible due to com-
pensating intrinsic defects, in recent years p-type doping has, however, been reported by
several groups (see Ref. [8] and references therein). The ambipolar dopability and the high
exciton binding energy render ZnO an interesting material for transparent electronics and
blue light emitting devices [9]. More recently, ZnO nanostructures such as rods, wires,
belts, and rings have attracted a lot of attention since they open the way for developments
of new devices [10, 11].
In order to improve the understanding of the physical and chemical properties of zinc
oxide, computer simulations can be a valuable tool complementing and aiding the interpre-
tation of experiments. Quantum-mechanical methods such as Hartree-Fock (HF) or density
functional theory (DFT) have been extensively used to investigate e.g., surfaces [12, 13],
high-pressure phase transitions [14, 15, 16], elastic properties [16], phonon dispersion [17],
and point defects (see e.g., Refs. [18, 19, 20]). While such methods are highly transferable
and allow for accurate and reliable calculations, they are severely limited in terms of length
and time scales. On the other hand, by averaging out the electronic degrees of freedom and
by considering interactions between individual atoms instead, analytic potentials achieve
a superior computational efficiency and thereby create the possibility to study much more
extended systems on time scales up to microseconds. In the present dissertation, both
quantum mechanical methods and analytic potentials are employed.
Although a number of theoretical studies addressed the nature and the thermodynamics
of intrinsic point defects in zinc oxide [18, 19, 20, 21, 22, 23], the understanding is still
incomplete. In particular, the role of oxygen interstitials has been insufficiently analyzed.
3
1. Motivation
For a Fermi level close to the valence band maximum the redox potential is sufficiently
positive to allow the oxidation of oxygen. This can be achieved for example by placing
O2−2 ions on regular lattice sites equivalent to the formation of interstitial-like defects. In
the first part of this dissertation density functional theory calculations are described which
have been performed to investigate the existence and the properties of such defects. In
addition, the ground state configurations of vacancies and oxygen interstitials are identified
and characterized, both structurally and electronically. While previous studies have focused
on oxygen interstitials in high-symmetry configurations, in the present work it is shown
that dumbbell-like configurations have significantly lower formation enthalpies (Chapter 4).
DFT calculations rely on approximations for the exchange-correlation functional (see
Sec. 3.2). Conventional choices such as the local density (LDA) [24] or generalized gradient
approximations (GGA) [25] often provide an insufficient description of strongly localized
electrons – such as the d-electrons in many transition metal compounds – and typically
underestimate their binding energy [26]. In zinc oxide this leads to a significant overestima-
tion of the covalency of the Zn–O bond and enhances the underestimation of the band gap
intrinsic to DFT. Because of computational constraints DFT calculations are limited with
respect to the system size. Periodic boundary conditions are used to remove surface effects
but lead to interactions between periodic images, which are not always properly accounted
for. Moreover, defect formation volumes, which describe the pressure dependence of the
formation enthalpies, have not been calculated for zinc oxide so far.
As part of the present dissertation extensive DFT calculations address the aforemen-
tioned issues. In order to account for the band structure and the role of the Zn- 3d elec-
trons, a semi-empirical correction scheme known as the LDA+U (or equivalently GGA+U)
method [26] is employed. The errors due to the supercell size limitations are corrected by
applying an extensive finite size scaling scheme and by explicitly taking into account the
volume dependence of the formation enthalpies. Thereby, accurate values for the forma-
tion enthalpies and formation volumes are obtained which allows to deduce the equilibrium
transition levels and their pressure dependence. The reliability of the data is assessed by
comparison with GGA calculations and by extrapolation to the experimental band gap,
which permits to interpret the results on a semi-quantitative basis (Chapter 5).
In order to optimize materials properties, it is typically necessary to process the material
under non-equilibrium conditions. In such cases the behavior of the material is no longer
exclusively governed by thermodynamics but kinetic effects become important. In semi-
4
conductors the (electronic) properties are largely determined by the (point) defects present
in the material. Accordingly, point defect mobilities play an important role in optimizing
and tuning the fabrication process. In zinc oxide, point defects mobilities furthermore per-
tain directly to the degradation behavior of varistor devices [27, 28, 29, 30] and are likely
to contribute to the remarkable radiation hardness [31].
Unfortunately, in the past experimental measurements of self-diffusion in zinc oxide
have not been able to provide a consistent set of data which renders it impossible to
reliably interpret the results. In view of this situation a theoretical investigation is highly
desirable in order to obtain an atomistic picture of the diffusion process and to be able to
separate the contributions to the activation barrier. In Chapter 6 it is demonstrated how
by combining quantum mechanical calculations with thermodynamic principles (Einstein
relation) one can deduce point defect migration paths, identify mobile species, and derive
diffusion coefficients. This approach is employed to study the migration of zinc and oxygen
vacancies as well as interstitials. In combination with the formation enthalpies determined
in Chapter 5 the dependence of the self-diffusivities on Fermi level and chemical potentials
is derived which allows the (re-)interpretation of diffusion experiments (Chapter 6).
While DFT calculations are highly transferable and provide a wealth of detailed infor-
mation, they are also computationally very expensive. In fact, many interesting problems
in chemistry, condensed matter, and materials science occur on length and time scales
which largely exceed the range of quantum mechanical calculations. On the other hand,
analytic potentials deliver the computational efficiency required to deal with such problems
(Chapter 7). They achieve this goal by sacrificing the details of the electronic structure and
consider effective interactions between individual atoms instead. Obviously, some details
are lost by such a coarse-graining procedure, however, a physically motivated and judi-
ciously adapted model is nevertheless capable of describing materials behavior over a wide
range of situations. One such model is the analytic bond-order potential (ABOP) scheme
developed by Abell, Tersoff and others [32, 33]. In the second part of this dissertation,
a computer code is developed which provides a generalized framework for fitting analytic
bond-order potentials (Chapter 8). It is subsequently applied to derive parameter sets
for Zn–O, Zn–Zn, and O–O interactions (Chapter 9). A representative application of the
potential is the simulation of defect production in zinc oxide by ion irradiation.
5


2. Modeling of materials
This chapter provides a concise overview of techniques utilized in atomic scale
modeling and discusses possibilities for bridging length and time scales by combin-
ing different approaches.
2.1. Simulation techniques in atomic scale modeling
A number of methods are available for studying materials on the atomic scale. Molecular
static simulations are used to optimize structures in the zero temperature limit. They rely
on numerical minimization algorithms such as conjugated gradients techniques. Molecular
dynamics (MD) simulations allow to study the dynamics of a system at finite temperatures.
This type of simulations is useful e.g., for studying ion-solid interactions or mechanical
deformation mechanisms. Monte-Carlo (MC) methods, which represent a very efficient
way to sample phase space, provide access to thermodynamic variables and equilibrium
properties. If the transition paths and barriers are known, kinetic Monte-Carlo (KMC)
techniques allow to study the dynamic evolution of a system on time scales of seconds,
minutes or even hours (strongly system-dependent).
Any of these techniques requires a model which allows to calculate the total energy
and/or the forces for arbitrary configurations. From the view point of quantum mechanics,
the cohesion of a material arises from the interaction of the electrons in the field of the
nuclei. This many-body problem is formally described by the Schrodinger equation
HΨ = εiΨ (2.1)
7

2. Modeling of materials
where Ψ and εi denote the wave function and the eigenenergies, respectively. The Hamilton
operator H
H = Te + Tn + Vee + Vnn + Vne︸ ︷︷ ︸
Vext
(2.2)
comprises the contributions due to the kinetic energy of electrons (Te) and nuclei (Tn)
as well as terms arising from electron-electron (Vee), nucleus-nucleus (Vnn), and electron-
nucleus (Vne) interactions.
So-called ab-initio methods seek to find solutions for the many-body problem described
by equations (2.1) and (2.2). In the field of theoretical chemistry, techniques such as sec-
ond order Møller-Plesset perturbation theory, configuration interaction, or coupled cluster
methods have been extensively used in the study of small molecules (see e.g., [34, 35]). An
alternative approach known as quantum Monte-Carlo (QMC) and pioneered by Ceperley
and Alder relies on Monte-Carlo methods to find solutions of the Schrodinger equation
[36]; it has been applied for instance in the study of small silicon clusters [37, 38]. More
recently, thanks to the continuous increase in computer power, it has even become feasible
to employ quantum Monte-Carlo calculations to investigate the electronic structure and
the energetics of defects in silicon [39] and carbon [40].
Unfortunately, pure ab-initio methods are severely restricted in terms of length and
time scales. In order to circumvent these limitations a large variety of methods has been
developed which represent different ways to simplify the original many-particle problem and
which cover different levels of accuracy and efficiency. At the lower end of this scale, with a
minimal number of simplifications, Hartree-Fock (HF) and density functional theory (DFT)
methods [41] are well established and widely used, because they provide a very favorable
compromise between reliability and accuracy on one hand, and computational efficiency on
the other. Still, system sizes are restricted to at most a few thousand (valence) electrons
and the maximum time scale in dynamical simulations does not exceed a few picoseconds.
Tight-binding (TB) methods [42] are based on the linear combination of atomic orbitals
(LCAO) theory. By successively including or neglecting higher order moments of the
electron density the accuracy and the efficiency of the method can be weighted against
each other. While TB techniques extend the length and time scales for simulations in
comparison with HF or DFT, they are still not efficient enough to address many of the
most challenging problems in materials science, chemistry, and condensed matter physics
8

2.2. Bridging length and time scales
which often involve thousands or millions of atoms and time scales in the regime of nano
or microseconds. In order to treat such problems in a computationally efficient manner,
while maintaining atomic resolution, analytic potential models that deliver realistic energies
and interatomic forces are an indispensable tool for bridging the gap between quantum
mechanical methods and mesoscopic continuum models. Instead of treating the electronic
structure explicitly, these models consider cohesion between atoms or ions. The application
and analysis of one particular type of these potential schemes is part of the present work.
A detailed discussion of this subject will be given in chapters 8 and 9.
At the next level of approximation the atomic structure is mapped onto a lattice and the
interactions are described e.g., by means of Ising-like models or cluster expansion methods
which rely on effective parameters. Macroscopic length and time scales are accessible
via continuum methods which owe their efficiency essentially to a neglect of the atomic
structure of the material.
2.2. Bridging length and time scales
As described in the previous section, there exists a trade-off between accuracy and transfer-
ability on one side and computational efficiency on the other. Therefore, a given technique
can rarely be used alone but must be combined and linked with other methods in order
to obtain a reliable as well as efficient description of the system under consideration. In
the past, a number of schemes have been developed to achieve this goal: For instance, Ja-
cobson and coworkers [43] as well as Voter and coworkers [44, 45] coupled MD with KMC
simulations to extend the timescale. The quasicontinuum method pioneered by Tadmor,
Ortiz, and Philips [46, 47, 48] introduces a systematic coarse graining between the atomic
and the continuum scale. Csanyi et al. devised a “learn-on-the-fly” MD algorithm in order
to optimize the transferability and accuracy of the force field [49] by combining analytic
potentials with first-principles methods.
In some cases it is possible to link quantities which are derived on the atomic scale directly
with macroscopic observables. In the present work diffusion constants (D, macroscopically
accessible) are derived based on the knowledge of the migration barriers (∆Gmi ) and the
9

2. Modeling of materials
attempt frequencies (Γ0,i, defined on the atomic scale) using the relations (see Chapter 6
for details)
Γi = Γ0,i exp [−∆Gmi /kBT ] (2.3)
and
D =1
2
∑
i
ζiΓdi |λi|2. (2.4)
The migration barriers can be obtained by refined molecular static techniques (see Sec. 6.3.1)
and the attempt frequencies are related to the vibrational (elastic) properties of the system.
10


Part II.
Quantum mechanical modeling
of intrinsic point defects
13

3. Density functional theory
In this chapter the fundamental concepts and equations of density functional theory
are reviewed. The most important exchange-correlation functionals are briefly
introduced. Finally, the implementation of density functional theory in the plane
wave-pseudopotential approach is outlined.
3.1. General aspects
Density functional theory (DFT) has proven to be a very powerful tool for studying elec-
tronic and structural materials properties. Basically, the method requires the coordinates
and atom types as input parameters. Compared to pure ab-initio methods DFT is signif-
icantly more efficient because it maps the many-body problem described in Sec. 2.1 onto
a set of effective one-particle equations. As the downside of this procedure an a-priori
unknown exchange-correlation functional appears in the equations.
DFT relies on two theorems: Firstly, the total energy can be expressed as a functional
of the electron density and secondly, the electron density which minimizes the energy is
the ground state electron density of the system (variational principle) [50]. The Hamilton
operator for the electronic system in a solid is given by equation (2.2). Defining the
functional
F [n] = minΨ→n
⟨
Ψ|Te + Vee|Ψ⟩
(3.1)
of the electron density
n =
∫
drΨ∗Ψ (3.2)
with the minimum taken over all wave functions Ψ, the basic theorems are expressed as
E[n] =
∫
drVext(r)n(r) + F [n] ≥ E0 (3.3)
15

3. Density functional theory
and
∫
drVext(r)n0(r) + F [n0] = E0 (3.4)
where the index 0 denotes the ground state. Furthermore it can be shown [51] that the
electron density which satisfies these equations is obtained by solving the one-particle
Schrodinger equations
[
Te + Vext +
∫
dr′ n(r′)
|r − r′| + Vxc
]
ψi = εiψi. (3.5)
Here, Vxc denotes the exchange-correlation functional and the total electron density is
n =N∑
i
|ψi|2 (3.6)
where N is the number of electrons.
3.2. Exchange-correlation functional
For the exchange-correlation (XC) functional (Vxc in equation (3.5)) different approxima-
tions have been established in the past. The most simple one is the local density approx-
imation (LDA), in which the XC energy for the charge density n(r) at point r is taken
as the XC energy of a uniform electron gas of the same density [24]. The LDA typically
overestimates the strengths of chemical bonds yielding too large cohesive energies and too
small bond lengths. The generalized gradient approximation (GGA) considers the XC en-
ergy as a function of both the charge density and its gradient. Compared to the LDA, it
tends to soften bonds often∗ leading to a better description of bond energies and lengths.
Hybrid-functionals such as B3LYP [52, 53] combine the exact exchange functional from
Hartree-Fock theory with the exchange part of a DFT XC-functional. They provide an im-
proved description of several properties but due to their functional form are incompatible
with periodic boundary conditions.
An alternative approach originating from the study of transition metal oxides such as
NiO was pioneered by Anisimov and coworkers [26, 54, 55, 56]. The so-called LDA+U
∗While the GGA is often considered superior to the LDA, there are cases in which the LDA performs
better e.g., ferroelectric titanates.
16
3.3. Plane wave basis sets and pseudopotentials
or GGA+U method introduces semi-empirical corrections to account for the artificial self-
interaction intrinsic to the unmodified LDA and GGA functionals. A GGA+U scheme
is employed in Chapter 5 where a more detailed description of this method is given
(Sec. 5.3.1).
3.3. Plane wave basis sets and pseudopotentials
Owing to the periodicity of crystals, DFT calculations of the solid state can be greatly
simplified by using periodic boundary conditions and plane wave basis sets [57]. Bloch’s
theorem [58] states
ψn,k = un exp(ik · r) (3.7)
where un are functions with the same periodicity as the supercell and k is a vector within
the Brillouin zone. Thus, the total wave function is given by
ψn =∑
k
ψn,k. (3.8)
Expanding equation (3.7) into a plane wave basis set and combining it with equation (3.8)
yields
ψn,k =∑
G
cn,k+G exp [i(k +G) · r] (3.9)
where G are vectors proportional to the inverse lattice vectors of the supercell and cn,k+G
are the expansion coefficients. In these equations two important parameters have been
implicitly introduced, which control the numerical convergence of a DFT calculation when
a plane wave basis set is being used. In principle, the sum over G extends to infinity; in
actual implementations of the method it needs, however, to be cut off at some vector Gcut,
which is typically expressed in terms of the plane wave cutoff energy Ecut = ~2G2cut/2me
(me denotes the electron mass). Secondly, the sum over k should extend over the entire
Brillouin zone, while in practice it is replaced by a sum over special k-points [59]. The first
step in any DFT calculation is, therefore, to determine a cutoff energy and a k-point mesh
which provide numerically well-converged results.
The core electrons usually do not significantly contribute to the bonding. Furthermore,
in order to guarantee orthogonality of states with the same orbital momentum (e.g., 1s and
17

3. Density functional theory
2s, 2p and 3p) very large plane wave basis sets are required. For the sake of computational
efficiency it is, therefore, desirable to replace the core electrons by a pseudopotential (PP).
In this work norm-conserving [60] and ultrasoft [61] PPs were employed as well as the
projector augmented wave (PAW) method [62].
All DFT codes used in the present work (see Sec. A.3 for an overview) are implementa-
tions of the plane wave-pseudopotential (PWPP) approach.
18

4. Structure and stability of
vacancies and oxygen interstitials∗
In the present chapter a comparative study of the structure and stability of oxy-
gen defects in ZnO is presented. By means of first-principles calculations based
on local density functional theory vacancies as well as different interstitial con-
figurations of oxygen in various charge states have been investigated. The results
reveal that dumbbell-like structures are thermodynamically the most stable inter-
stitial configurations for neutral and positive charge states due to the formation
of a strong covalent oxygen–oxygen bond. For negative charge states the system
prefers a split-interstitial configuration with two oxygen atoms in almost symmet-
ric positions with respect to the associated perfect lattice site. The calculated defect
formation energies imply that interstitial oxygen atoms may provide both donor-
and acceptor-like defects.
4.1. Introduction
Zinc oxide can be degenerately doped n-type and free electron concentrations in excess of
1021 cm−3 are achievable [7]. In recent years p-type doping has been reported by several
groups (see Ref. [8] and references therein). As a result of self-compensation, however, for
large band gap materials very often only a single conductivity type can be obtained (see
e.g. Refs. [63, 64]). In that case raising the dopant level will not lead to the generation of
free carriers but to the generation of compensating defects.
In order to achieve p-type conductivity the Fermi level needs to be close to the valence
band. Photoelectron spectroscopy reveals that the valence band in ZnO lies about 7 eV
∗Parts of the present chapter have been published in Ref. [6].
19
4. Structure and stability of vacancies and oxygen interstitials
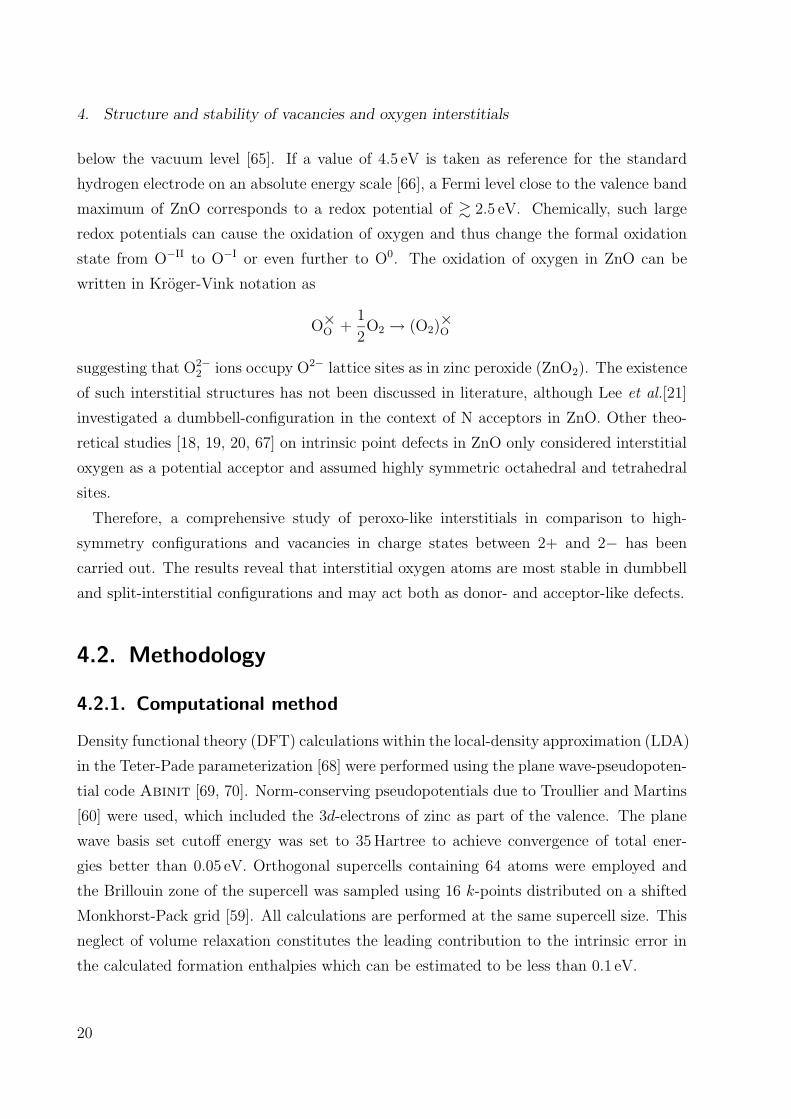
below the vacuum level [65]. If a value of 4.5 eV is taken as reference for the standard
hydrogen electrode on an absolute energy scale [66], a Fermi level close to the valence band
maximum of ZnO corresponds to a redox potential of & 2.5 eV. Chemically, such large
redox potentials can cause the oxidation of oxygen and thus change the formal oxidation
state from O−II to O−I or even further to O0. The oxidation of oxygen in ZnO can be
written in Kroger-Vink notation as
O×O +1
2O2 → (O2)
×O
suggesting that O2−2 ions occupy O2− lattice sites as in zinc peroxide (ZnO2). The existence
of such interstitial structures has not been discussed in literature, although Lee et al.[21]
investigated a dumbbell-configuration in the context of N acceptors in ZnO. Other theo-
retical studies [18, 19, 20, 67] on intrinsic point defects in ZnO only considered interstitial
oxygen as a potential acceptor and assumed highly symmetric octahedral and tetrahedral
sites.
Therefore, a comprehensive study of peroxo-like interstitials in comparison to high-
symmetry configurations and vacancies in charge states between 2+ and 2− has been
carried out. The results reveal that interstitial oxygen atoms are most stable in dumbbell
and split-interstitial configurations and may act both as donor- and acceptor-like defects.
4.2. Methodology
4.2.1. Computational method
Density functional theory (DFT) calculations within the local-density approximation (LDA)
in the Teter-Pade parameterization [68] were performed using the plane wave-pseudopoten-
tial code Abinit [69, 70]. Norm-conserving pseudopotentials due to Troullier and Martins
[60] were used, which included the 3d-electrons of zinc as part of the valence. The plane
wave basis set cutoff energy was set to 35Hartree to achieve convergence of total ener-
gies better than 0.05 eV. Orthogonal supercells containing 64 atoms were employed and
the Brillouin zone of the supercell was sampled using 16 k-points distributed on a shifted
Monkhorst-Pack grid [59]. All calculations are performed at the same supercell size. This
neglect of volume relaxation constitutes the leading contribution to the intrinsic error in
the calculated formation enthalpies which can be estimated to be less than 0.1 eV.
20
4.2. Methodology
The crystallographic parameters for ideal wurtzite zinc oxide were determined as a =
3.200 A and c/a = 1.613 with an internal relaxation of u = 0.379. Within the known
restrictions of the LDA these numbers compare well with the experimental values† of
a = 3.242 A, c/a = 1.600 and u = 0.382. The formation enthalpy of wurtzite zinc oxide
was computed as −4.15 eV/f.u. in reasonable agreement with previous calculations and
the experimental value of −3.56 eV/f.u.. The band gap at the Γ-point is 0.81 eV, which
is considerably below the experimental value of 3.4 eV, but consistent with previous DFT
calculations. (If only the special k-points used in the supercell calculations are considered,
which do not include the Γ-point, the band gap is 1.31 eV). The discrepancy is due to
the well known band gap error of density functional theory. The consequences of this
shortcoming will be addressed in section Sec. 4.3.1 and in Chapter 5.
Furthermore the ground state structures of pure oxygen and zinc have been analyzed,
since their cohesive energies enter the calculation of the formation enthalpy of zinc oxide
as well as the defect formation enthalpies (see equation (4.8) below). In case of zinc the
calculated cohesive energy of −1.801 eV/atom shows the expected overbinding (compare
Sec. 3.2) if compared to the experimental value of −1.359 eV/atom, while the lattice con-
stants a = 2.582 A (2.660 A) and c = 4.791 A (4.863 A) agree nicely with the experimental
numbers (given in brackets). The oxygen dimer has a calculated bond length of 1.241 A
(1.208 A) and a dimer energy of 5.85 eV (5.17 eV).
4.2.2. Formation enthalpies
Qian et al. derived the dependence of surface energies on the chemical environment [76].
This approach has been later generalized to the case of point defects by Zhang and Northrup
[77]. In the following, the formalism is described and the equations for the case of a
stoichiometric binary compound are introduced.
In thermodynamic equilibrium under conditions of constant temperature and pressure
the state of a system is determined by the Gibbs free energy
G = E + TS − pV = H + TS (4.1)
where E and H denote the internal energy and the enthalpy, T and S are the temperature
and the entropy, and p and V represent pressure and volume. In order to derive formation
†The experimental data cited in this section was obtained from Refs. [71, 72, 73, 74, 75].
21

4. Structure and stability of vacancies and oxygen interstitials
entropies of point defects very large supercells (on the order of a few hundred atoms) are
needed, because the entropy converges slowly with supercell size [78]. Since, for the super-
cells accessible within the present computational framework, the reliability of calculated
entropies would be limited, entropic contributions were neglected. Since the temperature
dependent terms tend to cancel for differences between the free enthalpies of condensed
phases, this is a valid approximation. In the present chapter the pressure-volume is, fur-
thermore, assumed to be zero which is an excellent approximation for moderate pressures
while for the calculation of formation volumes in Chapter 5 this contribution is explicitly
included.
The chemical potential is defined as the derivative of G with respect to the number of
particles of type i
µi =∂G
∂ni(4.2)
and in equilibrium is the same for all phases which are in contact. The chemical potentials
are subject to certain constraints ‡: Firstly, µi cannot be more negative than the chemical
potential of the most stable elemental (reference) phase, µbulki (e.g., hcp-Zn or dimeric
oxygen), µi ≥ µbulki . The limit µi = µbulki corresponds to the case when the system under
consideration is in immediate contact with the reference phase. Secondly, the chemical
potentials of the constituents are limited by the formation of mixed phases which in the
case of a binary compound AaBb leads to the constraint
aµA + bµB = µbulkAaBb= aµbulkA + bµbulkB +∆Hf (4.3)
where the equation introduces the formation enthalpy ∆Hf . The constraints can be con-
veniently summarized as
µbulki +∆Hf ≥ µi ≥ µbulki . (4.4)
The equilibrium state of a neutral system is determined by the minimum of the following
function
Gdef (ni)−∑
i
niµi ≈ Hdef (ni)−∑
i
niµi (4.5)
where Gdef and Hdef refer to the system containing the defect. For charged defects one
must furthermore include the electro-chemical potential of the electrons, µe = EVBM+EF .
‡In the present work, cohesive energies are always negative. This is in contrast to Ref. [76].
22

4.2. Methodology
It represents the energy required to transfer an electron from the Fermi level, EF , to the
vacuum, where EF is measured from the valence band maximum, EVBM. In summary, the
formation enthalpy of a defect in charge state q is given by
∆HD = Hdef −∑
i
niµi − q(EVBM + EF ) (4.6)
For a stoichiometric binary system by defining [77]
∆µ = (µZn − µO)− (µbulkZn − µbulkO ) (4.7)
equation (4.6) can be rewritten as
∆HD = Hdef −1
2(nZn + nO)µ
bulkZnO
− 1
2(nZn − nO)(µbulkZn − µbulkO )
− q(EVBM + µe)−1
2(nZn − nO)∆µ. (4.8)
The last but one term describes the variation of the formation enthalpy of charged defects
with the Fermi level which is limited by 0 ≤ EF ≤ EG, where EG is the (calculated) band
gap. The last term describes the variation with the chemical potentials which according
to equations (4.3) and (4.7) is constrained by the formation enthalpy of wurtzite zinc
oxide [20] ∆µ ≤ |∆Hf |; zinc- and oxygen-rich conditions correspond to ∆µ = −∆Hf and
∆µ = ∆Hf , respectively. In the zero temperature limit the reference chemical potentials
equal the cohesive energies of molecular oxygen, hcp-zinc, and wurtzite zinc oxide. For
the following computations the calculated values from Sec. 4.2.1 were used. It should be
noted, however, that the findings are essentially not affected by this particular choice.
4.2.3. Configurations
In order to identify the most stable structure for the oxygen interstitial defect, a number
of initial configurations have been generated. The atomic positions were relaxed using
conjugated gradients minimization until the maximum residual force was less than 4 pN
(2.5meV/A). For the oxygen interstitials (Oi) charge states between 2− and 2+ were
considered. Three distinct configurations corresponding to local minima on the total-energy
surface were identified (see Fig. 4.2). In the following the octahedral interstitial (Oi,oct),
the dumbbell configuration (Oi,db) and the rotated dumbbell configuration (Oi,rot−db) will
23

4. Structure and stability of vacancies and oxygen interstitials
[0001]
[1010]
[1210]
_
_ _
(a) ideal (b) V×O (c) V··O (d) V′′Zn
Figure 4.1.: (a) Ideal wurtzite structure, (b) neutral oxygen vacancy (V×O ), (c) charged oxygenvacancy (V··O), and (d) doubly negatively charged zinc vacancy (V′′
Zn). Yellow and grey spheres
represent zinc and oxygen atoms, respectively.
the distinguished, the particular properties of which are described in detail in Sec. 4.3.2.
Only the highly symmetric octahedral structure [18, 19, 20] has been explicitly considered
before. Lee et al. described a structure similar to the dumbbell interstitial but did not
consider all relevant charge states [21]. The rotated dumbbell (and its split-interstitial
variant described below) have not been reported in the literature so far. It will be shown
below and in Chapter 6 that this defect is, however, of fundamental importance for the
understanding of the electronic and structural behavior as well as the migration of oxygen
interstitials.
For consistency, oxygen and zinc vacancies were also included (see Fig. 4.1). Since
previous first-principles studies [18, 19, 20] have shown the oxygen vacancy (VO) to be a
negative-U center with the q = +1 state being unstable, only the neutral and the doubly
charged oxygen vacancy were considered. The zinc vacancy (VZn) was studied in charge
states 2−, 1− and 0.
4.2.4. Charge analysis
As a means to obtain a simple semi-quantitative measure for comparing different charge
states, partial charges for all atoms in the defective cells were calculated using the Bader
atom-in-molecule method. This scheme identifies extrema and saddle points in the three-
dimensional electron density. Based on this information space is partitioned in polyhedra
each of which is usually associated with one atom which is assigned the charge confined in
the polyhedron volume [79]. For this analysis codes included in the Abinit package were
employed.
24
4.3. Results
[0001]
[1010]
[1210]
_
_ _
(a) ideal (b) Oi,oct (c) Oi,db (d) O×i,rot−db (e) O′′
i,rot−db
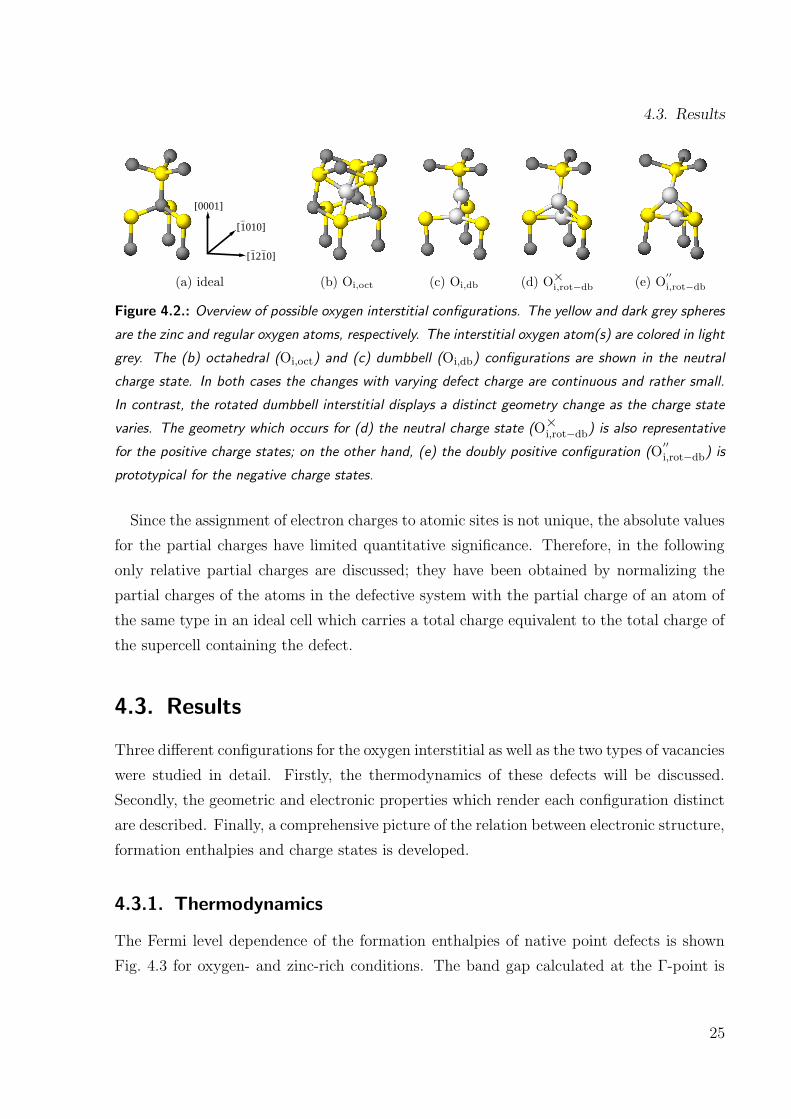
Figure 4.2.: Overview of possible oxygen interstitial configurations. The yellow and dark grey spheres
are the zinc and regular oxygen atoms, respectively. The interstitial oxygen atom(s) are colored in light
grey. The (b) octahedral (Oi,oct) and (c) dumbbell (Oi,db) configurations are shown in the neutral
charge state. In both cases the changes with varying defect charge are continuous and rather small.
In contrast, the rotated dumbbell interstitial displays a distinct geometry change as the charge state
varies. The geometry which occurs for (d) the neutral charge state (O×i,rot−db) is also representativefor the positive charge states; on the other hand, (e) the doubly positive configuration (O
′′
i,rot−db) is
prototypical for the negative charge states.
Since the assignment of electron charges to atomic sites is not unique, the absolute values
for the partial charges have limited quantitative significance. Therefore, in the following
only relative partial charges are discussed; they have been obtained by normalizing the
partial charges of the atoms in the defective system with the partial charge of an atom of
the same type in an ideal cell which carries a total charge equivalent to the total charge of
the supercell containing the defect.
4.3. Results
Three different configurations for the oxygen interstitial as well as the two types of vacancies
were studied in detail. Firstly, the thermodynamics of these defects will be discussed.
Secondly, the geometric and electronic properties which render each configuration distinct
are described. Finally, a comprehensive picture of the relation between electronic structure,
formation enthalpies and charge states is developed.
4.3.1. Thermodynamics
The Fermi level dependence of the formation enthalpies of native point defects is shown
Fig. 4.3 for oxygen- and zinc-rich conditions. The band gap calculated at the Γ-point is
25

4. Structure and stability of vacancies and oxygen interstitials
Figure 4.3: Variation of the formation
enthalpies of several point defects in zinc
oxide with the Fermi level under zinc (left)
and oxygen-rich (right) conditions. The
numbers in the plot indicate the defect
charge state; parallel lines imply equal
charge states. The grey-shaded area in-
dicates the band gap calculated at the Γ-
point. The vertical dotted lines show the
band gap which is obtained if only the spe-
cial k-points used in the supercell calcula-
tions are considered.
−2.0
0.0
2.0
4.0
6.0
8.0
−0.8 0.0 0.8 1.6
Form
atio
n en
ergy
(eV
)
Fermi level (eV)
zinc−rich
O
O
i,db
i,db
O
O
i,db−rot
i,db−rot
O
O
i,oct
i,oct
V
V
Zn
Zn
V
V
O
O
−0.8 0.0 0.8 1.6
oxygen−rich
+2
−2
0
illustrated by the grey-shaded area. The vertical dotted lines indicate the band gap which
is obtained if only the special k-points used in the supercell calculations are considered.
Formation enthalpies for a zinc-rich environment and p-type conducting conditions (µe =
0 eV, VBM) are given in Tab. 4.1 together with results of previous calculations.
Under zinc-rich conditions the oxygen vacancy is the most stable defect for all Fermi
levels. It shows a transition from the double positively charged state (V··O) to the neutral
configuration (V×O ) in the vicinity of the conduction band minimum (CBM).
For oxygen-rich conditions and Fermi levels in the upper half of the band gap, the doubly
negatively charged zinc vacancy (V′′Zn) is the dominant defect type. When the Fermi level
lies, however, in the lower half of the band gap the calculations suggest that oxygen inter-
stitials in dumbbell configurations are the dominating point defect type and due to their
low formation enthalpies should be present in significant amounts. The 2+/1+ and 2+/0
transition levels for the two dumbbell defects lie at the VBM (Fig. 4.3). Furthermore, if the
band gap calculated using the special k-points (vertical dotted lines in Fig. 4.3; compare
Sec. 4.2.1) is considered, the 0/2− transition level for the rotated dumbbell interstitial lies
within the band gap just below the CBM.
In the following sections the implications of these findings will be discussed in more
detail by analyzing both electronic structure and geometry. However, before doing so some
reasoning is required to which extent the results are affected by the underestimation of the
band gap. In the present chapter resort is made to a qualitative discussion following the
26

4.3. Results
lines of previous works (see Ref. [80] and the Appendix of Ref. [19]). A more elaborate
scheme based on an improved description of the band structure is presented in Chapter 5.
The formation enthalpy corrections for donors in the 2+ charge state are typically large
and negative; they are smaller for donors in the 1+ and neutral charge states and sometimes
even positive. In case of acceptors corrections to the formation enthalpies are usually large
and positive and of similar magnitude for different charge states. Thus, the corrections
increase the asymmetry in the formation enthalpies of donor and acceptor-like defects.
These considerations have the following implications on the data presented in Fig. 4.3:
Upon correction of the band gap the formation enthalpies for the 2+ charge states
of the oxygen interstitials (Oi) as well as the oxygen vacancy (VO) are expected to be
significantly lowered; whether the formation enthalpy of the 1+ states are lowered or
raised is unsure. On the other hand the formation enthalpies for the neutral and negatively
charged defects will rise. If the Fermi level is at the VBM, the formation enthalpies for the
oxygen interstitials (Oi) vary only slightly as the charge state changes from 0 to 2+. Based
on the foregoing considerations, one can, therefore, expect the 2+/0 or 2+/1+ oxygen
interstitial transition levels to lie in the band gap near the VBM. The oxygen interstitial
would, thus, effectively act as a donor. In general, the changes which are expected for the
formation enthalpies upon band gap correction support and emphasize the importance of
oxygen interstitials under oxygen-rich conditions.
4.3.2. Geometry and electronic structure
Vacancies
The oxygen vacancy is the most important intrinsic defect in zinc oxide under zinc-rich
conditions. It displays a transition from the neutral state (V×O ) to the doubly positively
charged state (V··O) below the CBM. For the neutral oxygen vacancy (V×O ) the calculations
reveal an inward relaxation of the surrounding zinc atoms of approximately 11% which
form an almost perfect tetrahedron encapsulating the vacant site. On the other hand, a
strong outward relaxation of about 19% is found for the charged vacancy (V··O). Similar
to the case of the neutral vacancy the atomic displacements are almost symmetric with
respect to the vacant lattice site. The configurations are shown in Fig. 4.1. In both
cases, the first nearest neighbor shells exhibit significant relaxation, while the relaxation
of second and farther neighbors is almost negligible. This observation is supported by the
27

4. Structure and stability of vacancies and oxygen interstitials
Table 4.1.: Formation enthalpies of some intrinsic point defects in bulk zinc oxide for zinc-rich and p-
type conducting conditions (µe = 0 eV, VBM). Ref. [19]: DFT, LDA, norm-conserving PPs, Ref. [18]:
DFT, LDA, ultrasoft PPs, Ref. [20]: DFT, GGA, ultrasoft PPs.
Defect Charge This work Ref. [19] Ref. [18] Ref. [20]a
uncorr. corr.
VO 0 0.9 1.5 2.4 0.0
+2 −0.5 −0.5 −3.0 −0.3 −0.9
VZn 0 6.0 5.8 10.6 5.5 ≥ 5.1−1 5.8 5.7 10.1 5.8 5.0
−2 5.9 5.8 10.1 6.6 5.1
Oi,rot−db −2 7.2 [8.2]b
−1 6.6 [7.5]b [≥ 7.1]b
0 5.2 [6.5]b [6.0]b
+1 5.3 [6.5]b
+2 5.4
Oi,oct −2 7.4 7.4c 9.7 7.8 7.8
−1 6.7 6.4c 10.4 6.8 6.9
0 6.2 6.2c 12.1 6.4 6.4
+1 6.3 6.4
+2 6.3
Oi,db −2 9.7
−1 7.4
0 5.1
+1 5.1
+2 5.2
aThe data given here was derived from Fig. 1 in the original reference, since no explicit values are given.bReferences [18] and [20] report formation enthalpies for a “tetrahedral interstitial” configuration but no
details on the geometry of the relaxed configuration are given.cThe geometry of the oxygen interstitial in Ref. [19] is not specified.
28
4.3. Results
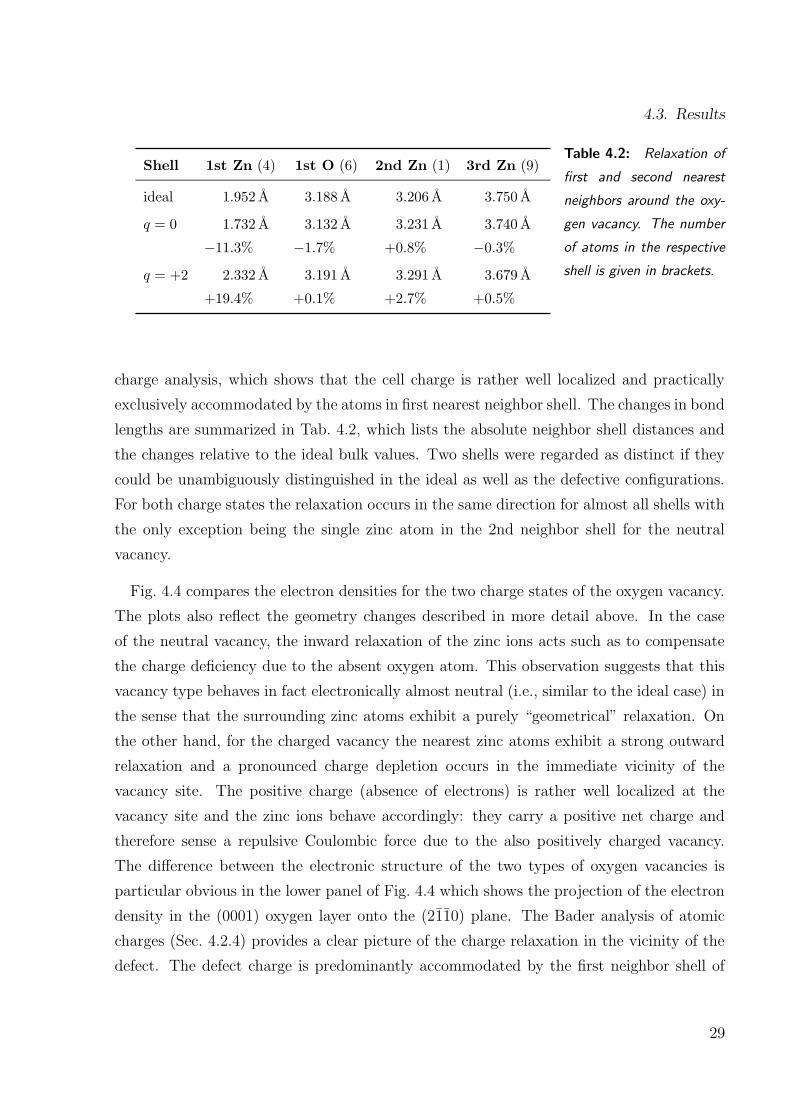
Shell 1st Zn (4) 1st O (6) 2nd Zn (1) 3rd Zn (9)
ideal 1.952 A 3.188 A 3.206 A 3.750 A
q = 0 1.732 A 3.132 A 3.231 A 3.740 A
−11.3% −1.7% +0.8% −0.3%
q = +2 2.332 A 3.191 A 3.291 A 3.679 A
+19.4% +0.1% +2.7% +0.5%
Table 4.2: Relaxation of
first and second nearest
neighbors around the oxy-
gen vacancy. The number
of atoms in the respective
shell is given in brackets.
charge analysis, which shows that the cell charge is rather well localized and practically
exclusively accommodated by the atoms in first nearest neighbor shell. The changes in bond
lengths are summarized in Tab. 4.2, which lists the absolute neighbor shell distances and
the changes relative to the ideal bulk values. Two shells were regarded as distinct if they
could be unambiguously distinguished in the ideal as well as the defective configurations.
For both charge states the relaxation occurs in the same direction for almost all shells with
the only exception being the single zinc atom in the 2nd neighbor shell for the neutral
vacancy.
Fig. 4.4 compares the electron densities for the two charge states of the oxygen vacancy.
The plots also reflect the geometry changes described in more detail above. In the case
of the neutral vacancy, the inward relaxation of the zinc ions acts such as to compensate
the charge deficiency due to the absent oxygen atom. This observation suggests that this
vacancy type behaves in fact electronically almost neutral (i.e., similar to the ideal case) in
the sense that the surrounding zinc atoms exhibit a purely “geometrical” relaxation. On
the other hand, for the charged vacancy the nearest zinc atoms exhibit a strong outward
relaxation and a pronounced charge depletion occurs in the immediate vicinity of the
vacancy site. The positive charge (absence of electrons) is rather well localized at the
vacancy site and the zinc ions behave accordingly: they carry a positive net charge and
therefore sense a repulsive Coulombic force due to the also positively charged vacancy.
The difference between the electronic structure of the two types of oxygen vacancies is
particular obvious in the lower panel of Fig. 4.4 which shows the projection of the electron
density in the (0001) oxygen layer onto the (2110) plane. The Bader analysis of atomic
charges (Sec. 4.2.4) provides a clear picture of the charge relaxation in the vicinity of the
defect. The defect charge is predominantly accommodated by the first neighbor shell of
29
4. Structure and stability of vacancies and oxygen interstitials
1010−
(a) neutral oxygen vacancy (V×O )
1010−
(b) doubly positively charged vacancy (V··O)
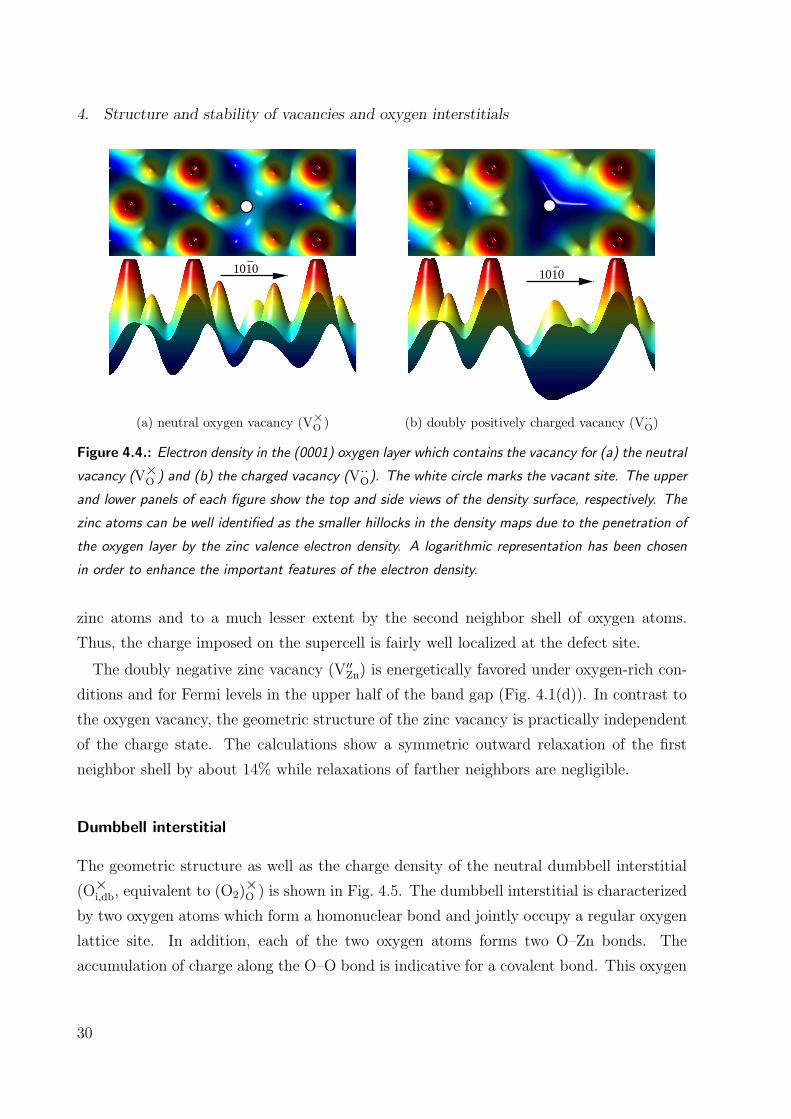
Figure 4.4.: Electron density in the (0001) oxygen layer which contains the vacancy for (a) the neutral
vacancy (V×O ) and (b) the charged vacancy (V··O). The white circle marks the vacant site. The upperand lower panels of each figure show the top and side views of the density surface, respectively. The
zinc atoms can be well identified as the smaller hillocks in the density maps due to the penetration of
the oxygen layer by the zinc valence electron density. A logarithmic representation has been chosen
in order to enhance the important features of the electron density.
zinc atoms and to a much lesser extent by the second neighbor shell of oxygen atoms.
Thus, the charge imposed on the supercell is fairly well localized at the defect site.
The doubly negative zinc vacancy (V′′Zn) is energetically favored under oxygen-rich con-
ditions and for Fermi levels in the upper half of the band gap (Fig. 4.1(d)). In contrast to
the oxygen vacancy, the geometric structure of the zinc vacancy is practically independent
of the charge state. The calculations show a symmetric outward relaxation of the first
neighbor shell by about 14% while relaxations of farther neighbors are negligible.
Dumbbell interstitial
The geometric structure as well as the charge density of the neutral dumbbell interstitial
(O×i,db, equivalent to (O2)×O ) is shown in Fig. 4.5. The dumbbell interstitial is characterized
by two oxygen atoms which form a homonuclear bond and jointly occupy a regular oxygen
lattice site. In addition, each of the two oxygen atoms forms two O–Zn bonds. The
accumulation of charge along the O–O bond is indicative for a covalent bond. This oxygen
30
4.3. Results
[1210]_ _
_[1010]
[0001]
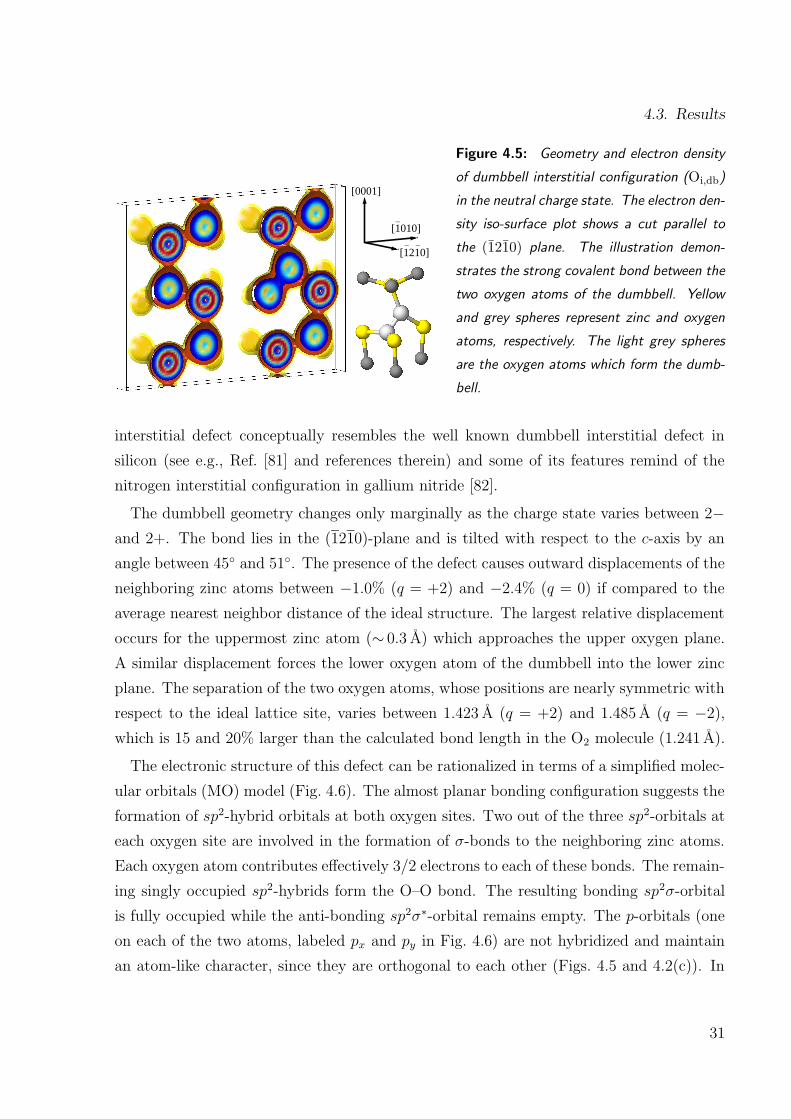
Figure 4.5: Geometry and electron density
of dumbbell interstitial configuration (Oi,db)
in the neutral charge state. The electron den-
sity iso-surface plot shows a cut parallel to
the (1210) plane. The illustration demon-
strates the strong covalent bond between the
two oxygen atoms of the dumbbell. Yellow
and grey spheres represent zinc and oxygen
atoms, respectively. The light grey spheres
are the oxygen atoms which form the dumb-
bell.
interstitial defect conceptually resembles the well known dumbbell interstitial defect in
silicon (see e.g., Ref. [81] and references therein) and some of its features remind of the
nitrogen interstitial configuration in gallium nitride [82].
The dumbbell geometry changes only marginally as the charge state varies between 2−and 2+. The bond lies in the (1210)-plane and is tilted with respect to the c-axis by an
angle between 45 and 51. The presence of the defect causes outward displacements of the
neighboring zinc atoms between −1.0% (q = +2) and −2.4% (q = 0) if compared to the
average nearest neighbor distance of the ideal structure. The largest relative displacement
occurs for the uppermost zinc atom (∼ 0.3 A) which approaches the upper oxygen plane.
A similar displacement forces the lower oxygen atom of the dumbbell into the lower zinc
plane. The separation of the two oxygen atoms, whose positions are nearly symmetric with
respect to the ideal lattice site, varies between 1.423 A (q = +2) and 1.485 A (q = −2),which is 15 and 20% larger than the calculated bond length in the O2 molecule (1.241 A).
The electronic structure of this defect can be rationalized in terms of a simplified molec-
ular orbitals (MO) model (Fig. 4.6). The almost planar bonding configuration suggests the
formation of sp2-hybrid orbitals at both oxygen sites. Two out of the three sp2-orbitals at
each oxygen site are involved in the formation of σ-bonds to the neighboring zinc atoms.
Each oxygen atom contributes effectively 3/2 electrons to each of these bonds. The remain-
ing singly occupied sp2-hybrids form the O–O bond. The resulting bonding sp2σ-orbital
is fully occupied while the anti-bonding sp2σ∗-orbital remains empty. The p-orbitals (one
on each of the two atoms, labeled px and py in Fig. 4.6) are not hybridized and maintain
an atom-like character, since they are orthogonal to each other (Figs. 4.5 and 4.2(c)). In
31

4. Structure and stability of vacancies and oxygen interstitials
Figure 4.6: Formal hybridization of oxygen
atoms prior to formation of the O–O bond
(left). Simplified MO-scheme of the electronic
structure of the oxygen dumbbell configura-
tion (right). The electron population corre-
sponds to the neutral charge state. The grey
shaded orbitals and the electrons therein are
being used for the formation of O–Zn bonds.
pO pO
sO
Osp2
sp
pO pO
xp yp
sp σ2
Osp2 Osp2
sp2σ∗
the case of the neutral dumbbell both of these (non-bonding) orbitals are fully occupied.
In the following, the MO-scheme will turn out to be helpful for interpreting the geometric
and electronic structure changes with charge state.
Fig. 4.7 shows the results of the Bader analysis of atomic charges. Between the defect
charge states 0 and 2+ the net charges decrease continuously. This corresponds to a
continued oxidation of the two oxygen atoms starting from a formal oxidation number −Itowards a formal oxidation number 0, although this limit is eventually not reached. Over
the same range the formation enthalpy stays practically constant (for a Fermi level close
to the VBM, Tab. 4.1) which according to the MO-scheme occurs because the electrons in
the unhybridized, atom-like p-orbitals can be removed at little energetic cost. The slight
decrease of the bond length can be related to a diminishing repulsion between the electron
clouds surrounding on the atoms.
In contrast, if the system is negatively charged the formation enthalpy of the oxygen
dumbbell (again for a Fermi level close to the VBM) increases significantly while the
net charges remain constant. The negative surplus charge is smeared evenly over the
cell. Compensation of the negative surplus charges by the homonuclear oxygen bond is
impossible as it would imply population of the yet unoccupied anti-bonding σ∗-orbital and
thus breakage of the bond. Since surplus electrons cannot be compensated in this geometry,
the oxygen dumbbell interstitial (Oi,db) cannot act as an acceptor.
Rotated dumbbell interstitial
The geometry of the rotated dumbbell (Oi,rot−db) is shown for the neutral charge state in
Fig. 4.2(d) and for the doubly negative charge state in Fig. 4.2(e). For the neutral and
32

4.3. Results
1.0
1.2
1.4
1.6
1.8
2.0
2.2
+2 +2+1 +10 0−1 −1−2 −2O−
O s
epar
atio
n in
uni
ts o
f di
mer
bon
d le
ngth
Defect charge state Defect charge state
0.4
0.5
0.6
0.7
0.8
0.9
1.0
1.1
Rel
ativ
e ne
t cha
rge
per
defe
ct a
tom
dumbbell interstitial
rotated dumbbell interstitial
octahedral interstitial
Figure 4.7.: Relative net charge of oxygen atoms which are directly involved in interstitial configura-
tions for different nominal charge states of the defect (left). Variation of O–O separation as a function
of the charge states of the defect (right). In case of the octahedral interstitial, the O–O distances of
the three nearest oxygen atoms of the second neighbor shell with respect to the central defect atom
were evaluated.
positive charge states the rotated dumbbell defect is characterized by a strong oxygen–
oxygen bond akin to the regular dumbbell interstitial (Oi,db) discussed in the foregoing
section. The bond is also confined to the (1210)-plane and tilted with respect to the c-axis
by an angle between 38 and 41 depending on charge state. In fact, the two dumbbell
geometries can approximately be matched by applying a sixfold mirror axis (6m). The
length of the oxygen–oxygen bond occurring for neutral and positive charge states is 20
to 24% larger than the bond length in the oxygen dimer and thus similar to the O–O
separation in the regular dumbbell structure. In contrast to the dumbbell interstitial,
however, each oxygen atom is bonded to three zinc atoms.
A very different behavior is found for negative charge states. The rotated dumbbell in-
terstitial transforms into a split-interstitial. The two oxygen atoms maintain their mutually
symmetric positions but are no longer bonded (Fig. 4.7) The split-interstitial configura-
tion can therefore be regarded as two interstitial oxygen atoms associated with one oxygen
vacancy.
Defect geometry and charge distribution underscore the similarity of the regular and
rotated dumbbell in neutral and positive charge states (Fig. 4.7). As before, inspection of
the net charges reveals an almost perfect localization of the defect charge on the two oxygen
33

4. Structure and stability of vacancies and oxygen interstitials
Zn
O
O
Zn ZnZn
Zn
Zn
Zn
Zn
Zn
ZnO
OZn
Zn
Figure 4.8.: Interpretation of the structural changes with charge state of the rotated dumbbell oxygen
interstitial (Oi,rot−db) in terms of a simple electron counting scheme. Neutral and positive charge
states (left): electrons can be withdrawn with little effort (picture also valid for dumbbell interstitial).
Negative charge states (right): O–Zn bonds are preferred because they can accommodate more
electrons than O–O bonds (not applicable to dumbbell interstitial). Large white circles: oxygen atoms;
medium sized grey circles: zinc neighbor; small (half) filled circles represent (“half”) electrons.
atoms forming the core of the defect. Going from charge state 1− to the neutral charge
state the formation of the homonuclear oxygen bond is accompanied by a discontinuous
decrease of the net charges by more than 30%.
For negative charge states, the surplus electrons are localized on the two oxygen atoms
forming the split-configuration. This behavior is very distinct from the case of the dumb-
bell interstitial (Oi,db) for which delocalization of the extra charge is observed in case of
negatively charged cells. In fact, for the doubly negative charge state the defective oxygen
atoms have achieved the same net charge state as oxygen atoms on regular lattice sites
and thus have a nominal oxidation number of −II. For these charge states, as illustrated
in Fig. 4.7 the rotated dumbbell interstitial (Oi,rot−db) strongly resembles the octahedral
interstitial if net charge and O–O separation are considered. Unlike the case of the dumb-
bell interstitial, in both the octahedral as well as the rotated dumbbell configuration O–O
bonds are absent in negative charge states.
The changes with charges state observed for the rotated dumbbell interstitial (Oi,rot−db)
can be interpreted in terms of a simple electron counting scheme as demonstrated in
Fig. 4.8. In neutral and positive charge states the system can achieve a saturated bonding
configuration (two electrons per bond) by forming a homonuclear oxygen bond. Electrons
can be withdrawn at little energetic cost from atom-like oxygen orbitals in analogy to the
MO-scheme for the dumbbell interstitial (Oi,db) shown in Fig. 4.6. In negative charge states
34

4.4. Discussion
O–Zn bonds are energetically preferred. Since each zinc atom contributes only “half” an
electron to each of its four bonds, excess electrons can be rather easily accommodated.
In conclusion, the oxygen atoms are able to adopt the formal oxidation state −II in the
negative charge state limit and they approach the oxidation state 0 in the positive charge
limit. Thereby, they realize the peroxo-like defect proposed in the introduction.
4.4. Discussion
The present calculations indicate that in neutral and positive charge states the energetically
preferred mechanism for accommodation of surplus oxygen is the formation of a homonu-
clear oxygen bond. In such a configuration all bonds are saturated and electrons can be
easily removed from non-bonding orbitals. Positive charge states of the dumbbell configu-
rations have, therefore, low formation enthalpies and can act as traps for holes in p-type
doped samples. If the system is negatively charged, it strives to form additional (initially
unsaturated) O–Zn bonds which are compensated by the surplus electrons. Therefore, the
split-interstitial and octahedral interstitial configurations are favorable for negative charge
states.
In the regular dumbbell configuration (Oi,db) for negative charge states, the two oxygen
atoms are constrained to the dumbbell structure and are not able to adopt an energetically
more favorable configuration. The opposite seems to apply for the octahedral interstitial
(Oi,oct) in positive charge states; the surplus oxygen atom strives to form homonuclear
oxygen bonds, but it is encapsulated in a cage of zinc atoms, which it cannot leave without
activation. Hence, in both cases energetic barriers exist, which are associated with large
defect formation enthalpies for the respective unfavorable charge states.
The rotated dumbbell interstitial (Oi,rot−db) incorporates the energetic advantage of
oxygen–oxygen bonding for positive charge states, while for negative charge states the
geometry allows breakage of the oxygen–oxygen bond in favor of the formation of oxygen–
zinc bonds. The resulting split-interstitial configuration for negative charge states involves
the formation of four oxygen–zinc bonds for each atom of the oxygen pair. The defect en-
ergies reveal that the gain in energy due to the formation of three additional oxygen–zinc
bonds by the two oxygen atoms in the split-interstitial configuration overcompensates the
energetic cost for leaving the original oxygen site unoccupied as the formation enthalpy
35
4. Structure and stability of vacancies and oxygen interstitials
of the rotated dumbbell interstitial (Oi,rot−db) is lower than the formation enthalpy of the
octahedral defect (Oi,oct).
4.5. Conclusions
In summary, DFT calculations have been performed on the stability and the structure of
oxygen interstitials and vacancies. The oxygen vacancy is the most stable defect for zinc-
rich conditions. Under oxygen-rich conditions the zinc vacancy is energetically preferred
for Fermi levels in the upper half of the band gap, while for Fermi levels in the lower half
of the band gap oxygen interstitials in dumbbell configurations are the dominant defect
types. These defects are characterized by a covalent oxygen–oxygen bond under neutral
and positive charging. In the introduction a peroxo-like defect has been proposed and
the possibility has been formulated that the oxygen atoms forming the defect are oxidized
as the Fermi level is pushed towards the VBM. This proposition is realized by the two
dumbbell configurations (Oi,db and Oi,rot−db). In the neutral charge state the pair of oxygen
atoms electronically resembles a single oxygen atom in an unperturbed crystal, nominally
equivalent to (O2)×O . In this state both oxygen atoms are in the formal oxidation state
−I. As the defect is charged increasingly positive the decreasing net charges of the atoms
indicate further oxidation and the two dumbbell atoms approach a formal oxidation number
of zero. The rotated dumbbell is a particular interesting case as the oxygen pair cannot only
be oxidized (like the dumbbell interstitial), but is also able to assume a configuration in
which the defect atoms carry a net charge equivalent to the ideal bulk value (oxidation state
−II). This is achieved by breakage of the oxygen–oxygen bond in favor of the formation of
several additional oxygen–zinc bonds. While the oxygen dumbbell configuration (Oi,db) is
a candidate for compensation of p-type doping under oxygen-rich conditions, the rotated
dumbbell oxygen interstitial defect (Oi,rot−db) might also act as a compensating defect for
n-type doping.
36

5. Role of band structure, volume
relaxation and finite size effects∗
Density functional theory (DFT) calculations of intrinsic point defect properties
in zinc oxide were performed in order to remedy the influence of finite size ef-
fects and the improper description of the band structure. The generalized gradient
approximation (GGA) with semi-empirical self-interaction corrections (GGA+U)
was applied to correct for the overestimation of covalency intrinsic to GGA-DFT
calculations. Elastic as well as electrostatic image interactions were accounted
for by application of extensive finite-size scaling and compensating charge correc-
tions. Size-corrected formation enthalpies and volumes as well as their charge
state dependence have been deduced. The present results partly confirm earlier
calculations from the literature and from Chapter 4 of the present work, but reveal
a larger number of transition levels: (1) For both, the zinc interstitial as well as
the oxygen vacancy, transition levels are close to the conduction band minimum.
(2) The zinc vacancy shows a transition rather close to the valence band maximum
and another one near the middle of the calculated band gap. (3) For the oxygen
interstitials, transition levels occur both near the valence band maximum and the
conduction band minimum.
5.1. Introduction
In the foregoing chapter, density functional theory (DFT) calculations on the structure
and stability of intrinsic point defects in ZnO have been presented. The major uncertainty
in these calculations as well as other theoretical studies [18, 19, 20, 21, 67, 83, 84] is the
∗Parts of the present chapter have been published in Ref. [4].
37
5. Role of band structure, volume relaxation and finite size effects
underestimation of the band gap (theory: 0.7–0.9 eV, experiment: 3.4 eV) and the improper
description of the band structure. All of these calculations were based on the local density
(LDA) or generalized gradient approximation (GGA).
The underestimation of the band gap is an intrinsic shortcoming of the DFT method
in general (see e.g., Refs. [85, 86]). The improper description of the band structure is of
particular importance in the case of zinc oxide because self–interactions intrinsic to the
LDA and GGA exchange–correlation functionals cause an energy level shift of the Zn-3d
states. As a result, the calculations not only yield a band gap error of more than 2 eV
but also overestimate the covalency of the Zn–O bond. A direct comparison between data
calculated within LDA or GGA-DFT and experiment is, therefore, severely hampered.
In the past, this problem has been addressed in various ways: Zhang et al. proposed an
empirical correction scheme based on a Taylor expansion of the formation enthalpies in the
plane wave cutoff energy [19, 80]. Since a profound physical motivation for this scheme
is lacking, the results can only be interpreted semi-quantitatively. Kohan et al. discussed
corrections based on the electronic structure of the defect configurations [18], while other
studies (including the Chapter 4) resorted to a qualitative discussion [20].
If no correction is applied the calculated formation enthalpies reported by different au-
thors are comparable (see Tab. 4.1 below), whereas the various correction schemes lead to
very different results. This can be illustrated for the case of the oxygen vacancy. According
to the data of Kohan et al. the 2+/0 transition for this defect should be located in the
vicinity of the valence band maximum (VBM) [18], while the corrected data by Zhang et
al. predict the same transition to occur just below the conduction band minimum (CBM)
[19]. Since it is difficult to assess the reliability of these predictions, quantitatively more
reliable calculations are required.
Recently, some defect calculations were carried out using the semi-empirical LDA+U
scheme [26], which allows to adjust the position of d-electron levels by implementing self-
interaction corrections into the LDA or GGA exchange-correlation potentials. Hitherto,
this scheme has been employed to study point defects in CuInSe2 where the Cu-3d elec-
trons play a similar role as the Zn-3d electrons in ZnO [87], and in calculations of optical
transition levels of the oxygen vacancy in ZnO [22, 23]. For this reason, the method is
an excellent candidate for a reassessment of the thermodynamics of point defects in zinc
oxide. Another issue, which has hardly been addressed in studies of point defects in zinc
oxide so far, is the role of volume relaxation and finite size effects. It is, however, well
38

5.2. Band structure of zinc oxide
known, that formation enthalpies can converge slowly with supercell size [88], especially if
charged defects are considered [89].
The purpose of the present chapter is twofold. Firstly, formation enthalpies for the
intrinsic point defects in zinc oxide are to be determined correctly taking into account the
role of the Zn-3d electrons. Furthermore, the effect of supercell size and volume relaxation
is studied by employing finite size scaling. Defect formation volumes are derived which
have not been calculated for ZnO up to now. In summary, by taking into account the band
structure as well as finite size effects, a consistent set of point defect properties is derived,
which will allow for a more quantitative interpretation of experimental data.
In the following section, some observations on the band structure of zinc oxide based on
experimental as well as theoretical studies are summarized. This overview allows to moti-
vate the computational approach which is described in Sec. 5.3. The results are compiled
in Sec. 5.4. An interpretation and a comparison with literature are given in Sec. 5.5.
5.2. Band structure of zinc oxide
Experimentally the electronic structure of zinc oxide has been investigated in some detail
(see Ref. [90] and references therein). Typically, the density of states reveals two primary
bands between 0 and −10 eV (measured from the VBM). The upper band is primarily
derived from O-2p and Zn-4s orbitals, while the lower band arises almost solely from Zn-
3d electrons with a maximum between −7 and −8 eV [91, 92]. From X-ray photoelectron
spectra the admixture of Zn-3d states in the O-2p band has been determined to be about
9% indicating a small covalent contribution to bonding [93]. The band dispersion has
been investigated via angle-resolved photoelectron spectroscopy along a few high-symmetry
directions [94, 95]. The measurements reveal a strong dispersion of the upper valence bands
and a small dispersion of the Zn-3d levels. Zinc oxide displays a direct band gap of about
3.4 eV at the Γ-point.
In general, DFT calculations yield too small band gaps compared to experiment. The
effect is further enhanced in ZnO due to the underestimation of the repulsion between
the Zn-3d and conduction band levels [92]. This leads to a significant hybridization of
the O-2p and Zn-3d levels [92], and eventually to an overestimation of covalency [96].
Schroer et al. [97] performed an analysis of the wavefunctions obtained from self-consistent
pseudopotential calculations and determined a contribution of 20 to 30% of the Zn-3d
39

5. Role of band structure, volume relaxation and finite size effects
orbitals to the levels in the upper valence band (to be compared with the experimental
estimate of 9% covalency cited above [93]). For zinc oxide the band gap calculated with
LDA or GGA is about 0.7–0.9 eV, which is just about 25% of the experimental value
(3.4 eV) [18, 19, 20, 92, 97] (also compare previous chapter).
The insufficient description of strongly localized electrons (such as those occupying the
Zn-3d states in ZnO) and the underestimation of their binding energies is a generic prob-
lem of DFT within the LDA or GGA, and at least partially a result of unphysical self-
interactions [98]. In fact, it has been found that calculations based on the Hartree-Fock or
the GW approximation give much more tightly bound d-electrons and significantly larger
band gaps [92, 99]. An alternative approach is the explicit correction of self-interaction
[100]. Vogel et al. have developed this idea further and devised a scheme, which allows to
incorporate self-interaction corrections (SIC) and electronic relaxation corrections (SIRC)
already during the construction of pseudopotentials (PP) [98]. Thereby, they were able
to reproduce the experimental band gap as well as the position of the 3d levels in several
II-VI compounds with remarkable precision. In fact, the thus obtained band structure for
ZnO compares better with experiment than calculations within the Hartree-Fock and GW
approximations [92, 99]. SIC-PPs have also been used by Zhang et al. in the calculation of
the formation enthalpies of a few neutral point defects in zinc oxide [19]. Unfortunately,
as they point out, the SIC scheme cannot be transferred unambiguously to charged defect
calculations and is therefore not applicable in the present situation.
5.3. Methodology
5.3.1. Calibration of GGA+U method
The problems related to tightly bound electrons within LDA and GGA-DFT have moti-
vated the development of the so-called LDA+U (or equivalently GGA+U) method [26,
54, 55, 56]. In this scheme self-interaction corrections are included heuristically by con-
sidering the (orbital dependent) on-site repulsion between electrons. The scheme has been
quite successful in describing the electronic properties of several transition metal oxides
for which conventional LDA and GGA calculations fail to reproduce the experimentally
observed ground states [26, 54, 55, 56]. The method has also been employed for studying
ferromagnetism in ZnO codoped with transition metals [101] and for calculating absorption
40

5.3. Methodology
−8
−6
−4
−2
0
2
4
AΓM
Ene
rgy
(eV
)
U − J = 0 eV
AΓM
U − J = 3 eV
AΓM
U − J = 6 eV
AΓM
U − J = 9 eV
Figure 5.1.: Band structures obtained from density functional theory calculations within the general-
ized gradient approximation using self-interaction corrections (GGA+U). The formulation of Dudarev
et al. [54] was applied with different values of U − J . Calculations performed for lattice constants
relaxed at U − J = 0 eV.
spectra of nanostructured ZnO [102]. The work by Zhao et al. [87] is of particular inter-
est in the present context as it illustrates the applicability of the LDA+U approach to the
study of point defects. These authors employed the LDA+U method to adjust the position
of the Cu-3d levels in CuInSe2 by tuning the self-interaction parameter U . More recently,
the LDA+U method has also been employed in the study of the optical transitions of the
oxygen vacancy in zinc oxide [23, 22]. In the present work a similar scheme is applied in
order to obtain a realistic representation of the Zn-3d electrons in zinc oxide.
To begin with, the GGA+U method needs to be calibrated and benchmarked. In the
present work the formulation by Dudarev et al. [54] has been adopted. In this approach,
the only free parameter is the difference U− J between the matrix elements of the screened
Coulomb electron-electron interaction. The on-site interaction correction was applied for
the Zn-3d electrons only and the position of the Zn-3d bands was tuned by adjusting
the difference U − J . The calculations were carried out within density functional theory
(DFT) as implemented in the Vienna ab-initio simulation package (Vasp) [103] using the
projector-augmented wave (PAW) method [62, 104]. The parameterization by Perdew
and Wang (PW91) [25] was used for the exchange–correlation functional. A non-shifted
Γ-point centered 4 × 4 × 4 k-point mesh was used for Brillouin zone sampling. In all
calculations, the plane wave energy cutoff was set to 500 eV giving a technical error due to
discretization of the Brillouin zone integrals and incomplete basis set of less than 1meV.
41

5. Role of band structure, volume relaxation and finite size effects
Figure 5.2: Band structures
obtained from density func-
tional theory calculations within
the generalized gradient approx-
imation (GGA) (top) and using
the GGA+U method with U −J = 7.5 eV (bottom). The con-
duction band states have been
rigidly shifted to the experimen-
tal band gap. The small black
circles represent data from self-
interaction and relaxation cor-
rected (SIRC) pseudopotential
calculations (Ref. [98]). In
the plots on the right the
solid and dashed lines show
the calculated and experimental
(Ref. [90]) density of states, re-
spectively. The grey stripe indi-
cates the calculated band gap.−10
−10
−5
−5
0
0
5
5
10
10
ΓKHAΓM
expt.
GGA
GGA+U
expt.
calc.
calc.
LA
Ene
rgy
(eV
)E
nerg
y (e
V)
Density of states
The equilibrium configuration of the unit cell was determined by calculating the energy-
volume curve of the system with full relaxation of internal positions. The structures were
optimized until the forces were converged to better than 5meV/A. As experimental data
on band dispersion is sparse (see Sec. 5.2), the calculations were benchmarked using the
band structure calculated by Vogel et al. for which they employed SIRC pseudopotentials
and which reproduces the experimental band gap as well as the position of the Zn-3d levels
[98].
Values for U − J between 0 and 10 eV were considered. As U − J is raised the Zn-3d
states are shifted downwards and the band gap increases as illustrated in Fig. 5.1. At the
same time the equilibrium volume decreases while the bulk modulus varies only slightly.
Eventually, a value of U − J = 7.5 eV was chosen, for which the valence band energy
levels as well as the position of the Zn-3d levels are in very good agreement with the SIRC
calculations as well as experiment. The band gap calculated using the GGA+U scheme is
42

5.3. Methodology
1.83 eV, which constitutes a significant improvement over GGA. With otherwise identical
parameters the latter yields a band gap of 0.75 eV.
A comparison of GGA, GGA+U , and SIRC band structure calculations is shown in
Fig. 5.2. (For better visualization, the conduction band has been rigidly shifted upwards
by the remaining band gap error). The right hand panel compares the calculated density of
states (DOS) with experimental data measured via photoelectron spectroscopy [90]. (Since
the excitation probabilities for s, p, and d electrons change with hν, the experimental
DOS varies strongly with the energy of the incoming photons [91]. In order to simplify
comparison some of the bands have been rescaled).
The GGA calculations (equivalent to U − J = 0 eV) underestimate the binding energies
of the Zn-3d states leading to a drastic overestimation of the hybridization between the
O-2p and Zn-3d levels. Compared to experiment and the SIRC calculations, the GGA+U
calculation yields a slightly smaller dispersion of the upper valence band and a yet smaller
difference in the position of the Zn-3d band†. It also reproduces the double feature in the
Zn-3d bands reported by Zwicker and Jacobi [94] as well as Girard et al. [95]. Overall, the
agreement of the GGA+U band structure and density of states with SIRC calculations as
well as experiments is very good.
5.3.2. Defect calculations
For the defect calculations hexagonal supercells with 32 to 108 atoms were used equivalent
to 2 × 2 × 2 to 3 × 3 × 3, primitive unit cells. In these calculations a non-shifted Γ-point
centered 2 × 2 × 2 k-point mesh was employed. All calculations were performed within
GGA as well as GGA+U in order to quantify the energy corrections.
Firstly, the atomic positions were relaxed with all cell parameters fixed at the ideal
bulk values (Sec. 5.4.1) until the forces were converged to better than 5meV/A. Then
the energy-volume curves for the supercells were computed with fixed atomic coordinates.
The minimum of the curve provided the relaxed volume of the defective cell, Vdef , which
allowed to calculate the formation volume according to (see e.g. Refs. [105, 106, 107])
∆VD = Vdef −Ndef
Nid
Vid. (5.1)
†With respect to numerical accuracy in particular regarding the Zn-3d levels, it must be acknowledged
that the experimental data displays some variation as values in the range between −7 and −8 eV havebeen reported [90, 94, 95].
43

5. Role of band structure, volume relaxation and finite size effects
Here, Vid and Nid denote the volume and the number of atoms in the ideal reference system,
and Ndef denotes the number of atoms in the defective cell. The data were then subjected
to finite-size scaling in a similar manner as the formation enthalpies. The formation volume
determines the pressure dependence of the formation enthalpy (∆VD = ∂∆GD/∂p).
Earlier DFT calculations within LDA and GGA consistently gave very high formation
enthalpies for antisite defects [18, 19, 20] and there is no reason to assume that their for-
mation enthalpies would be significantly lowered within GGA+U . After all, the following
point defects were considered: the oxygen vacancy (VO), the octahedral oxygen inter-
stitial (Oi,oct), the dumbbell oxygen interstitial (Oi,db), the rotated dumbbell interstitial
(Oi,rot−db), the zinc vacancy (VZn) and the octahedral zinc interstitial (Zni,oct). With the
exception of the latter the geometric structures of these defects have been described in the
preceding chapter. The variation of the formation enthalpies with chemical potential and
Fermi level was calculated using equation (4.8).
Knowledge of the formation enthalpies of the fully relaxed defects also allows to derive
the thermal (equilibrium) transition level between charge states q1 and q2 for a given defect
according to
ε = −∆HD(q1)−∆HD(q2)
q1 − q2(5.2)
where ∆HD(q1) and ∆HD(q2) denote the formation enthalpies at the valence band maxi-
mum for charge states q1 and q2, respectively.
5.4. Results
5.4.1. Ground state properties
Crystallographic parameters for w-ZnO calculated by the GGA+U method are a = 3.196 A,
c/a = 1.606, and u = 0.381 which compare very well with the experimental values‡ a =
3.24 A, c/a = 1.600, and u = 0.382. From fitting the energy-volume data to the Birch-
Murnaghan equation of state [108] a bulk modulus of 136GPa was determined in good
agreement with the experimental value of 143GPa. The calculation gave a formation
enthalpy of ∆Hf = −3.46 eV/f.u. which compares very well with the experimental value
‡The experimental data cited in this section was obtained from Refs. [71, 73, 72, 74, 75].
44

5.4. Results
−2
−1
0
1
2
3
4
5
6
0 1 2 3 4 5 6 7
∞ 108 72 48 32
Form
atio
n en
thal
py (
eV)
Concentration (%)
Number of atoms in supercell
0
+1
+2
Figure 5.3: Scaling behavior of formation
enthalpies with concentration (equivalent to
the inverse cell volume) exemplified for the
case of the zinc interstitial (Zni,oct). For the
charged defects the small circles show the
data before monopole-monopole corrections
are applied (Ref. [109]). Large filled circles
correspond to formation enthalpies after vol-
ume relaxation while large open circles show
the data obtained at fixed volume. The data
presented here have been computed using the
GGA+U method.
of ∆Hf = −3.58 eV/f.u. The GGA calculations gave a = 3.283 A, c/a = 1.611, u = 0.378,
B = 149GPa, and ∆Hf = −3.55 eV/f.u..Furthermore, the cohesive energies of pure oxygen and zinc were determined, since they
enter the calculation of the formation energy of zinc oxide as well as the defect formation
enthalpies. For hcp-zinc a cohesive energy of Ec = −1.115 eV/atom, and lattice constants
of a = 2.641 A and c/a = 1.930 (experimental values: Ec = −1.359 eV/atom, a = 2.660 A,
c/a = 1.828) were obtained; for the oxygen dimer the calculation yielded a dimer energy
of D0 = 8.80 eV and a bond length of r0 = 1.238 A (experimental values: D0 = 5.166 eV
and r0 = 1.208 A).
5.4.2. Finite size scaling
Strain interactions typically scale as O(V −1) = O(N−1) = O(c), where V is the supercell
volume, N is the number of atoms, and c is the defect concentration in the supercell. In
order to obtain the formation enthalpies at infinite dilution, results obtained from calcula-
tions with supercells comprising 32, 48, 72, and 108 atoms were extrapolated. For neutral
defects the data can well be fitted by a straight line as shown in Fig. 5.3. The formation
enthalpy at infinite dilution is given by the abscissa of the linear fit.
For charged defects, Makov and Payne have shown that additional energy contributions
have to be included in order to correct for image charge interactions [109]. They derived
45

5. Role of band structure, volume relaxation and finite size effects
the correction in the form of a multipole expansion. The first term in this expansion
corresponds to monopole-monopole interactions; it scales as O(V −1/3) and was explicitly
taken into account in the present chapter. The magnitude of this correction is visualized
in Fig. 5.3.
Since dipole-dipole and monopole-quadrupole interactions scale as O(V −1) = O(N−1) =
O(c) [109] and thus show the same scaling behavior as the interactions of the strain fields,
they are implicitly considered through the finite size scaling procedure. Fig. 5.3 shows that
indeed after correction of the monopole-monopole term the data for the zinc interstitial
are well described by a linear fit.
5.4.3. Formation enthalpies
Formation enthalpies calculated by the GGA+U method are given in Tab. 5.1. This
compilation of data also includes the results of the GGA calculations and the data of
previous DFT studies. For most defects and charge states the extrapolation errors are very
small confirming the reliability of the procedure employed. In these cases the multipole-
expansion-based correction scheme works excellent [109]. Larger errors arise for oxygen
dumbbell interstitials in charge states 2± and for the octahedral oxygen interstitial in
charge state 2+. For the dumbbell defects (Oi,db, Oi,rot−db) the defect core comprises
two atoms (compare previous chapter and Ref. [6]) which renders them distinct from the
other defects considered here. Higher order moments in the multipole expansion would
be required in order to fully capture these features. For the octahedral interstitial (Oi,oct)
in charge state 2+ analysis of the electron density shows significant charge delocalization
which cannot be described by a finite multipole expansion [109].
If the difference between the present GGA and GGA+U results are compared with the
corrections calculated by Zhang et al. [19], agreement of the general trends is found. The
differences between the present GGA and GGA+U data are smaller than the predictions
of the correction scheme of Zhang et al. [19], which is, however, consistent with the band
gap underestimation still present in the GGA+U calculations. For the neutral oxygen
vacancy and the neutral zinc interstitial (where comparison is possible) the trends agree
with SIC-PP calculations [19]. The present results yield further support for the qualitative
argumentation put forth by Zhang and coworkers regarding the trends expected upon band
46

5.4. Results
Table 5.1.: Calculated formation enthalpies for point defects in bulk zinc oxide for zinc-rich and p-type
conducting conditions (µe = 0 eV, VBM); the second column under GGA and GGA+U gives the error
of the extrapolation to infinite dilution. Ch. 4: DFT, LDA, norm-conserving PPs; Ref. [18]: DFT,
LDA, ultrasoft PPs; Ref. [19]: DFT, LDA, norm-conserving PPs; Ref. [20]: DFT, GGA, ultrasoft PPs.
Defect Charge This chapter Ch. 4 Ref. [18] Ref. [19] Ref. [20]a
GGA GGA+U uncorr. corr.
Zni,oct 0 2.50 0.03 4.25 0.03 1.7 3.4 6.2 1.2
+1 0.98 0.02 1.69 0.03 1.3 1.5 2.1 ≥ 0.4+2 0.33 0.07 0.02 0.03 0.9 −0.2 −2.3 −0.6
VO 0 1.00 0.06 1.71 0.04 0.9 0.0 1.5 2.4
+1 0.26 0.03 0.71 0.03 0.2 0.8 1.5
+2 −0.48 0.02 −0.73 0.03 −0.5 −0.3 −0.5 −3.0 −0.9
Oi,db 0 4.61 0.05 4.70 0.07 5.1
+1 4.76 0.07 4.59 0.02 5.1
+2 5.36 0.33 5.08 0.27 5.2
Oi,rot−db −2 7.70 0.40 8.79 0.17 7.2 [8.2]b
−1 6.51 0.28 7.08 0.04 6.6 [7.5]b [≥ 7.1]b
0 4.87 0.03 4.96 0.04 5.2 [6.5]b [6.0]b
+1 5.07 0.07 4.91 0.05 5.3 [6.5]b
+2 5.67 0.72 5.41 0.29 5.4
Oi,oct −2 7.84 0.13 8.97 0.07 7.4 7.8 [7.4]c [9.7]c 7.8
−1 6.65 0.05 7.33 0.03 6.7 6.8 [6.4]c [10.4]c 6.9
0 6.20 0.03 6.60 0.03 6.2 6.4 [6.2]c [12.1]c 6.4
+1 6.36 0.11 6.60 0.10 6.3 6.4
+2 6.95 0.37 7.09 0.34 6.3
VZn −2 6.32 0.11 7.06 0.05 5.9 6.6 5.8 10.1 5.1
−1 5.57 0.08 5.96 0.05 5.8 5.8 5.7 10.1 5.0
0 5.35 0.04 5.60 0.01 6.0 6.0 5.8 10.6 ≥ 5.1
aThe data given here was derived from Fig. 1 in the original reference, since no explicit values are given.bReferences [18] and [20] report formation enthalpies for a “tetrahedral interstitial” configuration but no
details on the geometry of the relaxed configuration are given.cThe geometry of the oxygen interstitial is not specified in Ref. [19].
47

5. Role of band structure, volume relaxation and finite size effects
Figure 5.4: Variation of defect forma-
tion volumes with charge state. Open and
closed circles indicate defects on the zinc
and oxygen-sublattices, respectively.
−0.5
0.0
0.5
1.0
1.5
+2+10−1−2
Form
atio
n vo
lum
e(i
n un
its o
f vo
lum
e pe
r fo
rmul
a un
it)
Charge state
Oi,db
Oi,rotdb
Oi,oct
VO
Zni,oct
VZn
gap correction [80]. The formation enthalpy correction is negative for positively charged
defects, positive for neutral and yet more positive for negatively charged defects.
5.4.4. Geometries
For almost all defects the dependence of the atomic displacements on the supercell size is
quite small giving evidence for the strain fields being rather short-ranged. For the vacancies
and the octahedral interstitials the relaxations maintain the threefold symmetry axis of the
lattice. For VZn, Oi,oct and Zni,oct the displacements change continuously with addition or
subtraction of electrons. The observations regarding the charge-state dependent relaxation
behavior of the oxygen vacancy described in the foregoing chapter are confirmed. For the
neutral and positively charged oxygen dumbbell the oxygen-oxygen bond length is found
to be between 15% (q = +2) and 23% (q = 0) longer than the calculated dimer bond
length, which is again in full agreement with the earlier calculations (Sec. 4.3.2).
5.4.5. Formation volumes
The defect formation volumes obtained via equation (5.1) and subjected to finite-size
scaling are given in Tab. 5.2 and plotted as a function of charge state in Fig. 5.4. With the
exception of the oxygen vacancy all defects display the same trend. As electrons are added
to the system the formation volume rises linearly. The slope for the oxygen interstitials as
well as the zinc vacancy is roughly −0.37Ωf.u./e while for the zinc interstitial it amounts
48

5.5. Discussion
Defect Charge state
q = −2 q = −1 q = 0 q = +1 q = +2
Zni,oct 0.81 0.28 −0.30(0.05) (0.03) (0.04)
VO −0.26 −0.18 −0.32(0.01) (0.01) (0.01)
Oi,db 0.47 0.13 −0.26(0.03) (< 0.01) (< 0.01)
Oi,rot−db 1.15 0.76 0.43 0.08 −0.32(0.10) (0.05) (0.01) (0.03) (0.01)
Oi,oct 1.05 0.68 0.33 −0.05 −0.46(0.08) (0.05) (0.01) (0.01) (0.01)
VZn 0.81 0.45 0.05
(0.03) (0.02) (0.06)
Table 5.2: Point defect for-
mation volumes calculated
within GGA+U in units of
volume per formula unit
(V fD/Ωf.u.). The errors of the
extrapolation to infinite dilu-
tion are given in brackets.
to about −0.56Ωf.u./e (Ωf.u. denotes the volume per formula unit). In the case of VZn,
Oi,db, Oi,rot−db, and Oi,oct electrons are added and removed predominantly from oxygen-
like orbitals, while for Zni,oct zinc-like orbitals compensate most of the defect charge. In a
simple picture the two different slopes are manifestations of the different spatial extents of
the O and Zn-derived orbitals.
The oxygen vacancy behaves atypical because the local relaxation is different for the
neutral and positive charge states. As explained in detail in Sec. 4.3.2 and Refs. [22, 23, 6],
Zn atoms surrounding the vacancy site in neutral charge state relax outward, while they
show an inward relaxation for positive charge states. The result is a non-linear charge
state dependence of the formation volume.
5.5. Discussion
To begin with, the results of the GGA+U calculations are discussed. From the data in
Tab. 4.1 the Fermi level dependence of the formation enthalpies (Fig. 4.3) and the stability
map (Fig. 5.6) can be derived. In agreement with the calculations presented in the foregoing
chapter three defects are found to be the most abundant: Under zinc-rich conditions the
oxygen vacancy is the most likely defect for all Fermi levels; under oxygen-rich conditions
49

5. Role of band structure, volume relaxation and finite size effects
−2
0
2
4
6
8
10
0.0 0.8 1.6
+2
00
+1
+2
0
−1
−2
2.4 3.2
Form
atio
n en
thal
py (
eV)
Fermi level (eV)
O
O
i,db
i,db
O
O
i,oct
i,octOi,rot−db
V
V
O
O V
V
Zn
Zn
Zn
Zn
i,oct
i,oct
0.0 0.8 1.6 2.4 3.2
Figure 5.5.: Variation of defect formation enthalpies with Fermi level under zinc (left) and oxygen-
rich (right) conditions as obtained from GGA+U calculations. The grey shaded area indicates the
difference between the calculated and the experimental band gap. The numbers in the plot indicate
the defect charge state; parallel lines imply equal charge states. Open and closed circles correspond
to defects on the zinc and oxygen sublattices, respectively.
the zinc vacancy and oxygen interstitials are the dominant defect types. Earlier studies
have consistently found the oxygen vacancy to be energetically slightly more favorable
than the zinc interstitial. The present data imply that upon inclusion of volume relaxation
this difference becomes yet larger (∼ 0.7 eV at the valence band maximum). For the zinc
interstitial as well as for the oxygen vacancy (equilibrium§) transition levels close to the
calculated CBM are found.
The oxygen vacancy (VO) shows a 2+/0 transition 0.61 eV below the calculated CBM.
This is in qualitative agreement with Zhang et al. [19] and Oba et al. [20] but contradicts
the result by Kohan et al. who predicted the 2+/0 transition of the oxygen vacancy in the
vicinity of the VBM [18]. The deep level character (strong localization of defect electrons)
correlates with the significant charge dependent structural changes described in Sec. 5.4.5
and Refs. [23, 22]).
§Janotti and Van de Walle [23] as well as Lany and Zunger [22] determined optical transition levels by
employing the Franck-Condon principle.
50

5.5. Discussion
0.0
0.3
0.6
0.9
1.2
1.5
1.8
−3.2−2.4−1.6−0.80.0
CBM
VBM
oxygen−richzinc−richFe
rmi l
evel
(eV
)
Chemical potential of zinc (eV)
VZn (0/−1)
VZn (−1/−2)
Zn
V
i
Zn
(+2/+1)
’’
VO· ·
VOx
Oix
Oi·
Figure 5.6: Variation of dom-
inant defect as a function of
chemical potential and Fermi
level as obtained from GGA+U
calculations. In regions where
the most stable defect is neu-
tral, the transitions for the most
stable charged defect are in-
dicated by arrows and dotted
lines.
For the zinc interstitial (Zni) the present calculations locate the 2+/1+ transition level
0.15 eV below the CBM. In this case, the data by Kohan et al. show the same charge
transition, while Zhang et al. and Oba et al. [19, 20] predict the 2+ charge state to be
stable over the entire band gap. The structure of the zinc interstitial is similar in all charge
states, indicative for a shallow defect level and in agreement with experimental observations
[110].
For oxygen-rich conditions, oxygen dumbbell defects (Oi,db, Oi,rot−db) have the lowest
formation enthalpies of all intrinsic point defects over the widest range of the (calculated)
band gap confirming the results of the previous chapter (also compare Refs. [21, 6]). The
GGA+U data clearly prove the existence of a 1 + /0 transition level close to the VBM
(Oi,db: 0.34 eV, Oi,rot−db: 0.02 eV above VBM). For the rotated dumbbell interstitial, the
0/2− transition lies at the CBM indicating very shallow acceptor behavior. The present
data provides strong indication for ambipolar behavior as anticipated in Chapter 4.
The zinc vacancy (VZn) represents a good example for the importance of finite size
sampling: supercell calculations with less than 108 atoms consistently predict the neutral
charge state to be unstable with respect to the negative charge states. If supercell effects
are, however, properly taken into account, it turns out that the formation enthalpy of the
neutral zinc vacancy at the VBM is indeed lower than for the negative charge states. This
results in two transitions. The first one (0/1−) lies very close to the VBM, the second one
(1− /2−) occurs near the middle of the calculated band gap.
51
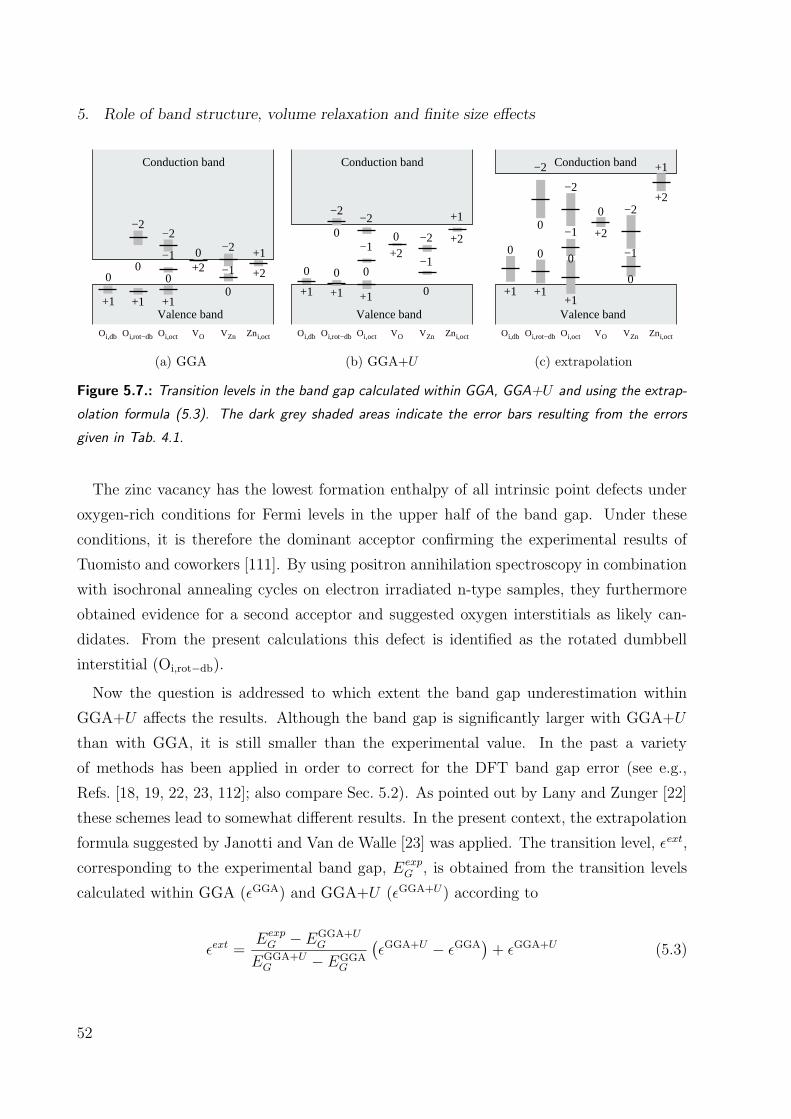
5. Role of band structure, volume relaxation and finite size effects
Zni,octVZnVOOi,octOi,rot−dbO
−2
0
i,db
Valence band
Conduction band
0
+1
0
−2
0 −2 +1
+2
0
−1
+1 +1
+2−1
(a) GGA
Zni,octVZnVOOi,octOi,rot−dbO
0−1
0+1 +1
−2−2
+1
0+2
−2
−1
+2
+1
000
i,db
Conduction band
Valence band
(b) GGA+U
Zni,octVZnVOOi,octOi,rot−dbOi,db
Valence band
Conduction band
+1
0 0
+1
−2
−2
0 −2
−1
+2
0
0
+2
+1
0
−1
+1
(c) extrapolation
Figure 5.7.: Transition levels in the band gap calculated within GGA, GGA+U and using the extrap-
olation formula (5.3). The dark grey shaded areas indicate the error bars resulting from the errors
given in Tab. 4.1.
The zinc vacancy has the lowest formation enthalpy of all intrinsic point defects under
oxygen-rich conditions for Fermi levels in the upper half of the band gap. Under these
conditions, it is therefore the dominant acceptor confirming the experimental results of
Tuomisto and coworkers [111]. By using positron annihilation spectroscopy in combination
with isochronal annealing cycles on electron irradiated n-type samples, they furthermore
obtained evidence for a second acceptor and suggested oxygen interstitials as likely can-
didates. From the present calculations this defect is identified as the rotated dumbbell
interstitial (Oi,rot−db).
Now the question is addressed to which extent the band gap underestimation within
GGA+U affects the results. Although the band gap is significantly larger with GGA+U
than with GGA, it is still smaller than the experimental value. In the past a variety
of methods has been applied in order to correct for the DFT band gap error (see e.g.,
Refs. [18, 19, 22, 23, 112]; also compare Sec. 5.2). As pointed out by Lany and Zunger [22]
these schemes lead to somewhat different results. In the present context, the extrapolation
formula suggested by Janotti and Van de Walle [23] was applied. The transition level, εext,
corresponding to the experimental band gap, EexpG , is obtained from the transition levels
calculated within GGA (εGGA) and GGA+U (εGGA+U) according to
εext =EexpG − EGGA+UG
EGGA+UG − EGGAG
(εGGA+U − εGGA
)+ εGGA+U (5.3)
52
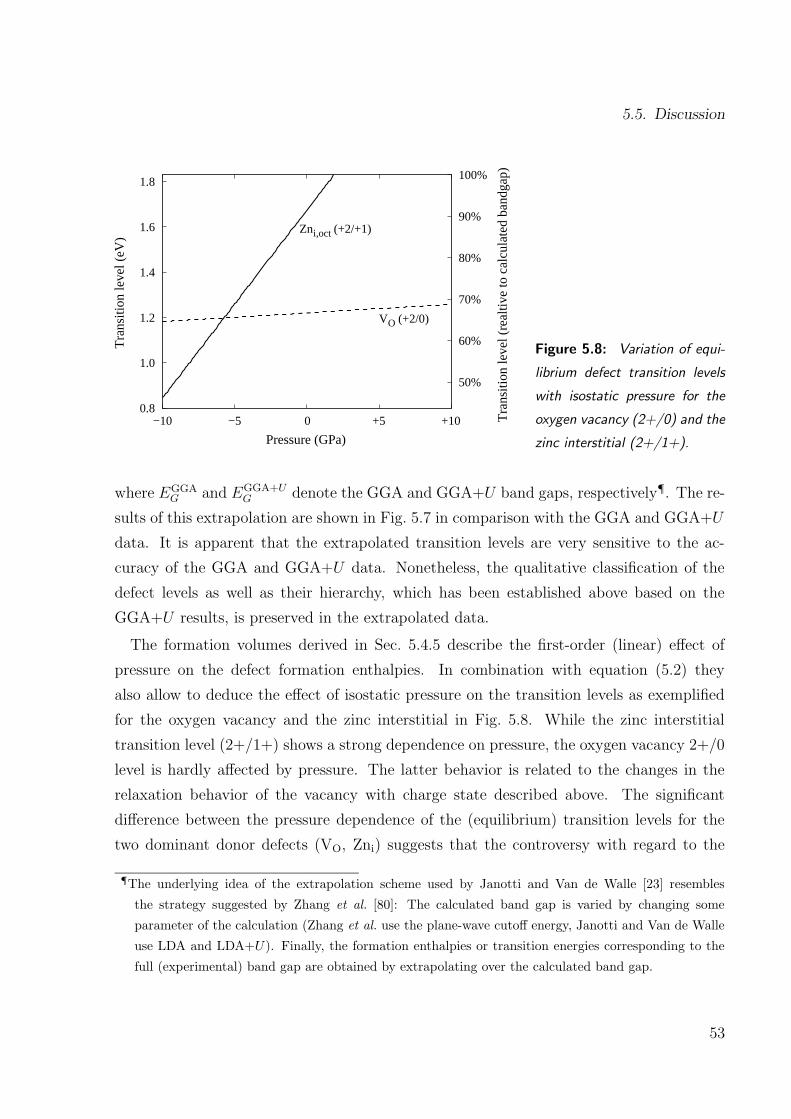
5.5. Discussion
0.8
1.0
1.2
1.4
1.6
1.8
−10 −5 0 +5 +10
50%
60%
70%
80%
90%
100%
Tra
nsiti
on le
vel (
eV)
Tra
nsiti
on le
vel (
real
tive
to c
alcu
late
d ba
ndga
p)
Pressure (GPa)
Zni,oct (+2/+1)
VO (+2/0)
Figure 5.8: Variation of equi-
librium defect transition levels
with isostatic pressure for the
oxygen vacancy (2+/0) and the
zinc interstitial (2+/1+).
where EGGAG and EGGA+UG denote the GGA and GGA+U band gaps, respectively¶. The re-
sults of this extrapolation are shown in Fig. 5.7 in comparison with the GGA and GGA+U
data. It is apparent that the extrapolated transition levels are very sensitive to the ac-
curacy of the GGA and GGA+U data. Nonetheless, the qualitative classification of the
defect levels as well as their hierarchy, which has been established above based on the
GGA+U results, is preserved in the extrapolated data.
The formation volumes derived in Sec. 5.4.5 describe the first-order (linear) effect of
pressure on the defect formation enthalpies. In combination with equation (5.2) they
also allow to deduce the effect of isostatic pressure on the transition levels as exemplified
for the oxygen vacancy and the zinc interstitial in Fig. 5.8. While the zinc interstitial
transition level (2+/1+) shows a strong dependence on pressure, the oxygen vacancy 2+/0
level is hardly affected by pressure. The latter behavior is related to the changes in the
relaxation behavior of the vacancy with charge state described above. The significant
difference between the pressure dependence of the (equilibrium) transition levels for the
two dominant donor defects (VO, Zni) suggests that the controversy with regard to the
¶The underlying idea of the extrapolation scheme used by Janotti and Van de Walle [23] resembles
the strategy suggested by Zhang et al. [80]: The calculated band gap is varied by changing some
parameter of the calculation (Zhang et al. use the plane-wave cutoff energy, Janotti and Van de Walle
use LDA and LDA+U). Finally, the formation enthalpies or transition energies corresponding to the
full (experimental) band gap are obtained by extrapolating over the calculated band gap.
53

5. Role of band structure, volume relaxation and finite size effects
green luminescence center in ZnO [113, 114] could be resolved by performing pressure-
dependent experiments.
In general, intrinsic point defects will be abundant in zinc oxide, since their forma-
tion enthalpies are very small. The resulting high defect concentrations probably do not
only actively influence the electronic and optical, but to some extent also the mechanical
properties. This could explain the large spread of experimental data for various material
properties.
5.6. Conclusions
An extensive study of intrinsic point defects in zinc oxide has been performed in order
to remedy the most significant approximations made in previous studies. To this end, a
semi-empirical self-interaction correction scheme (GGA+U) has been applied to correct the
position of the Zn-3d states and thereby the overestimation of covalency. As a consequence
the band gap opens up significantly although it is still smaller than in experimentals. In
order to remove the effects of elastic as well as electrostatic image forces, finite-size scaling
has been employed which allowed to derive more precise formation enthalpies.
The present results mostly confirm earlier calculations (see Chapter 4 and Refs. [18, 19,
20, 21]) but predict a larger number of transition levels for intrinsic defects. Transition
levels close to the conduction band minimum are identified for both the oxygen vacancy and
the zinc interstitial. The zinc vacancy possesses a transition rather close to the VBM and
another one roughly in the middle of the band gap. Oxygen interstitials show ambipolar
behavior since they display transition levels near the valence band maximum and the
conduction band minimum.
Defect formation volumes allow to deduce the pressure dependence of transition levels,
which creates the possibility to distinguish experimentally e.g., the oxygen vacancy and
zinc interstitial states.
54

6. Migration mechanisms
and diffusion of intrinsic defects∗
Density functional theory calculations in conjunction with the climbing image
nudged elastic band method were performed in order to study the self-diffusion of
oxygen and zinc in zinc oxide. To this end, the complete set of migration paths for
vacancies as well as interstitials in wurtzite crystals was derived and expressions
were deduced, which provide the link to experimentally accessible tracer diffusion
coefficients. The calculated migration barriers are consistent with annealing ex-
periments on irradiated samples. Oxygen and zinc interstitials are mobile down
to temperatures of 80 to 110K accounting for the rapid annihilation of defects
observed after electron irradiation. For oxygen self-diffusion vacancy and intersti-
tialcy mechanisms are found to dominate under zinc and oxygen-rich conditions,
respectively. This refutes the belief that vacancy mechanisms can be operational in
oxygen self-diffusion experiments in oxygen-rich atmosphere. For predominantly
oxygen-rich and n-type conducting conditions zinc self-diffusion occurs via a va-
cancy mechanism. The present results provide the basis for the (re-)interpretation
of diffusion experiments, and pave the way towards the development of continuum
models for device simulation.
6.1. Introduction
The mobilities of intrinsic point defects determine the annealing behavior of materials.
Moreover, diffusion pertains to the degradation of ZnO varistors, which is believed to
occur via the migration of interstitials to grain boundary regions [27, 28, 29, 30]. Fur-
∗Parts of the present chapter have been published in Refs. [3] and [5].
55
6. Migration mechanisms and diffusion of intrinsic defects
thermore, the annealing of defects by rapid defect migration is likely to contribute to the
remarkable radiation hardness of zinc oxide [31]. Knowledge of diffusivities and diffusion
mechanisms is obviously instrumental in order to obtain a fundamental understanding of
these processes, to devise strategies for controlling the migration of certain species, and to
develop continuum models for device simulation.
Diffusion experiments provide information on atomic migration and in addition allow
to gain insights into the defect chemistry in general [115]. The interpretation of diffusion
experiments is, however, often difficult and evidence for defect properties is indirect. In
the past several experimental studies have been concerned with the determination of self-
diffusion coefficients [116, 117, 118, 119, 120, 121], but the data scatter is large and no
consensus on activation energies, exponential pre-factors, or migration mechanisms has
been achieved. Therefore, a systematic theoretical investigation is highly desirable in order
to obtain more fundamental insights on the subject. Hitherto, theoretical investigations
based on quantum-mechanical calculations have been conducted to explore static properties
of intrinsic as well as extrinsic point defects in zinc oxide (see e.g., Refs. [18, 19, 20, 21,
22, 23, 6, 122]). Recently, migration barriers were calculated for Li in wurtzitic ZnO [122]
and for the doubly positively charged zinc interstitial in cubic ZnO (zinc blende structure)
[123] but at present there is no comprehensive study on the mobilities of intrinsic point
defects in zinc oxide.
In order to determine migration paths and barriers for vacancy and interstitial motion in
zinc oxide, density functional theory (DFT) calculations in conjunction with the climbing
image nudged elastic band method (CI-NEB) were performed [124, 125]. The complete set
of migration paths to first and second nearest neighbors on the respective sublattice has
been derived for the wurtzite lattice taking into account the non-ideal axial ratio of ZnO
as well as defect induced symmetry breaking. By using the CI-NEB method, a minimal
number of constraints was imposed when searching for saddle points. Unlike experiments
which provide only a compound value for the diffusivity, the present approach allows to
separate unequivocally the various contributions to the diffusivity. Since only isolated
intrinsic point defects are considered, association of defects, in particular with impurities
[21, 83, 122], is not included in the present study.
In the next section, the equations describing diffusion in terms of attempt frequencies and
migration barriers are summarized. Section 6.3 describes the computational framework and
56

6.2. Background
discusses potential sources of errors. The migration paths and the self-diffusion of oxygen
and zinc are treated in Sec. 6.4 and Sec. 6.5, respectively.
6.2. Background
The rate at which a single isolated point defect d moves via migration path i can usually
be described by an Arrhenius law [115]
Γdi = Γ0,i exp [−∆Gmi /kBT ] . (6.1)
In principle, the attempt frequency (Γ0,i) can be obtained within harmonic transition-state
theory via the Vineyard equation [126] but it is frequently approximated by a characteristic
frequency such as the lowest Raman mode [119], the Einstein or the Debye frequency. The
free enthalpy of migration (∆Gmi ) is given by
∆Gmi = ∆Hm
i + p∆V mi − T∆Smi (6.2)
where ∆Hmi is the enthalpy of migration (∆V m
i ) is the migration volume and ∆Smi denotes
the migration entropy. For small pressures, the pressure-volume term approaches zero, and
can be disregarded. The entropy term enters the pre-factor. Since migration entropies are
usually in the range of 1 to 2kB, this, however, constitutes merely a minor effect (compare
Sec. 4.2.2). Entropic contributions were therefore neglected in the present work. The
factor which most crucially affects the jump rate (and eventually the diffusion rate) is the
migration enthalpy (∆Hmi ). Its determination for different defects, migration paths, and
charge states is subject of the present chapter.
6.3. Methodology
6.3.1. Saddle point finding
The thermodynamic properties of a system are determined by the distribution and the en-
ergy differences between the local minima on the potential energy surface (PES). Similarly,
the kinetics are governed by the distribution of the paths connecting the local minima and
the respective barrier heights. The relevant quantities are schematically depicted for a
one-dimensional PES in Fig. 6.1.
57
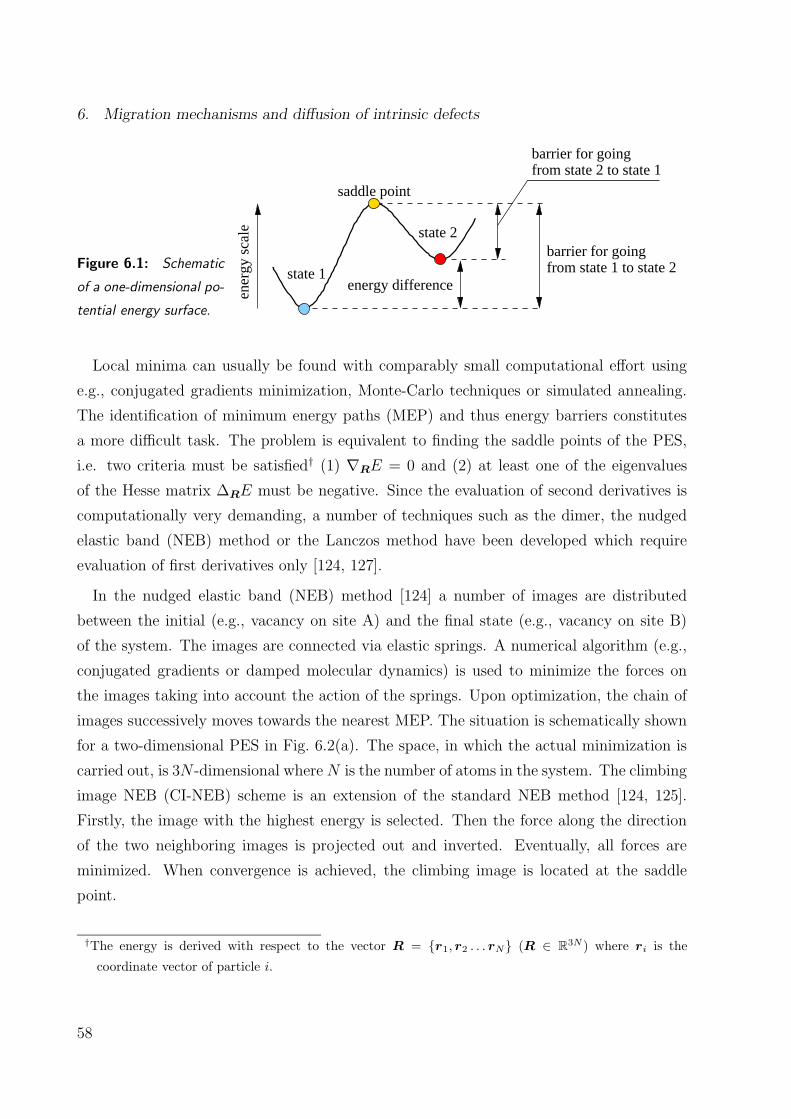
6. Migration mechanisms and diffusion of intrinsic defects
Figure 6.1: Schematic
of a one-dimensional po-
tential energy surface.
from state 1 to state 2barrier for going
from state 2 to state 1barrier for going
ener
gy s
cale
energy difference
saddle point
state 1
state 2
Local minima can usually be found with comparably small computational effort using
e.g., conjugated gradients minimization, Monte-Carlo techniques or simulated annealing.
The identification of minimum energy paths (MEP) and thus energy barriers constitutes
a more difficult task. The problem is equivalent to finding the saddle points of the PES,
i.e. two criteria must be satisfied† (1) ∇RE = 0 and (2) at least one of the eigenvalues
of the Hesse matrix ∆RE must be negative. Since the evaluation of second derivatives is
computationally very demanding, a number of techniques such as the dimer, the nudged
elastic band (NEB) method or the Lanczos method have been developed which require
evaluation of first derivatives only [124, 127].
In the nudged elastic band (NEB) method [124] a number of images are distributed
between the initial (e.g., vacancy on site A) and the final state (e.g., vacancy on site B)
of the system. The images are connected via elastic springs. A numerical algorithm (e.g.,
conjugated gradients or damped molecular dynamics) is used to minimize the forces on
the images taking into account the action of the springs. Upon optimization, the chain of
images successively moves towards the nearest MEP. The situation is schematically shown
for a two-dimensional PES in Fig. 6.2(a). The space, in which the actual minimization is
carried out, is 3N -dimensional whereN is the number of atoms in the system. The climbing
image NEB (CI-NEB) scheme is an extension of the standard NEB method [124, 125].
Firstly, the image with the highest energy is selected. Then the force along the direction
of the two neighboring images is projected out and inverted. Eventually, all forces are
minimized. When convergence is achieved, the climbing image is located at the saddle
point.
†The energy is derived with respect to the vector R = r1, r2 . . . rN (R ∈ R3N ) where ri is the
coordinate vector of particle i.
58

6.3. Methodology
Coordinate axis x (Å)
Coo
rdin
ate
axis
y (
Å)
0.5 1.0 1.5 2.0 2.5 3.0
−4.0
−3.0
−2.0
−1.0
0.0
1.0
2.0
3.0
4.0
(a) Nudged-elastic band (NEB) method
Coordinate axis x (Å)
Coo
rdin
ate
axis
y (
Å)
0.5 1.0 1.5 2.0 2.5 3.0
−4.0
−3.0
−2.0
−1.0
0.0
1.0
2.0
3.0
4.0
(b) Dimer method
Figure 6.2.: Schematic of a two-dimensional potential energy surface illustrating (a) the NEB/CI-
NEB and (b) the dimer method. The blue and red circles mark the initial and final state respectively.
(a) The dashed and solid lines show the NEB at the beginning and the end of the optimization. The
white circles mark intermediate images of the system. The yellow circles indicate the climbing image
which is the replica with the highest energy and which eventually is located at the saddle point. (b)
The line connects successive configurations along the path connecting the two minima. The final
configuration which corresponds to the saddle point is labeled yellow.
The dimer method [128] is applicable also if the final state of the system is unknown.
It employs two replicas of the system which are displaced with respect to each other by
some small distance‡. In order to find the nearest saddle point the dimer is moved uphill
on the PES. Concurrently, it is rotated in order to line up with the lowest curvature mode
at the point of the PES where it is currently located. When the drag force on the dimer
vanishes, a saddle point has been reached. The search strategy is schematically shown for
a two-dimensional PES in Fig. 6.2(b).
6.3.2. Computational method
Calculations within density functional theory (DFT) were carried out with the Vienna ab-
initio simulation package (VASP) [103] using the projector-augmented wave (PAW) method
[62, 104] and the generalized gradient approximation (GGA) in the parameterization by
Perdew and Wang (PW91) [25]. In order to properly account for the position of the Zn-
‡Typically, the distance between the two replicas is about ‖R1 −R2 ‖≈ 0.1 A.
59

6. Migration mechanisms and diffusion of intrinsic defects
3d levels the GGA+U scheme in the formulation by Dudarev et al. [54] was adopted as
described in detail in the foregoing chapter. Hexagonal 32-atom supercells were employed
equivalent to 2× 2× 2 primitive unit cells. The plane-wave energy cutoff was set to 500 eV
and a Γ-point centered 2 × 2 × 2 k-point grid was used for Brillouin zone sampling. A
discussion of the potential sources of errors is given in the appendix.
6.3.3. Determination of diffusion paths
The wurtzite lattice is composed of two interpenetrating hexagonal close packed (hcp)
lattices occupied by zinc and oxygen atoms, respectively. It follows that the diffusion
paths for oxygen (VO) and zinc vacancies (VO) can be deduced from the diffusion paths
available on the hcp lattice; similarly this applies for oxygen interstitials (Oi) which adopt
dumbbell-like ground state configurations (see chapter 4 and Refs. [21, 6]). The migration
paths for the zinc interstitial (Zni) are based on the simple hexagonal lattice formed by the
ideal octahedral interstitial sites. Since previous studies [18, 19, 20] consistently found that
antisites have extremely high formation energies, antisite mediated diffusion mechanisms
can be safely ruled out and were not considered.
In order to obtain the energy barriers for the various diffusion paths the climbing image
nudged elastic band (CI-NEB) method [124, 125] was employed as implemented for Vasp
by Henkelman, Jonsson and others [129]. The convergence of the minimum energy path
(MEP) and the saddle point was checked by using up to eight images. As the saddle point
determination worked already reliably for a small number of images, for most computations
only three or four images were used. The images of the NEB were relaxed until the max-
imum residual force was less than 15meV/A. For several configurations the saddle points
were confirmed by performing dimer calculations [128] at a higher level of convergence.
The differences between the CI-NEB and the dimer saddle point energies amounted to
about 1meV and less, which confirms the reliability of the CI-NEB approach.
Since the defect charge states vary with the electron chemical potential due to the
explicit Fermi energy dependence of the formation enthalpies (see equation (4.8)), the
migration barriers have to be determined independently for all relevant charge states (VO:
0 ≤ q ≤ +2; Oi: −2 ≤ q ≤ +2; VZn: −2 ≤ q ≤ 0; Zni: 0 ≤ q ≤ +2).
60

6.4. Oxygen
[1210]−−
− −[2110]
−[1100]
[0110]−
[0001]
[1100]−
A − 1st nbr: in−plane
C − 2nd nbr: out−of−plane
B − 1st nbr: out−of−plane
B − 1st nbr: out−of−plane
C − 2nd nbr: out−of−plane
B − 1st nbr: out−of−plane
C − 2nd nbr: out−of−planeFigure 6.3: Diffusion paths accessible to
oxygen (zinc) vacancies on the wurtzite lat-
tice via jumps to first or second nearest oxy-
gen (zinc) sites. Projections along [0001]
(top) and [1120] (bottom).
6.4. Oxygen
6.4.1. Migration paths
Vacancy diffusion
The possible diffusion paths via first as well as second nearest oxygen neighbors are
schematically shown in Fig. 6.3. Among the jumps to first nearest oxygen sites, there
are six symmetry equivalent paths in the (0001) plane (A, 1st nbr: in-plane) and six equiv-
alent paths with components parallel to the [0001] axis (B, 1st nbr: out-of-plane). On an
ideal hcp-lattice (c/a =√
8/3 = 1.633) these two paths are equivalent. In the present
case they are, however, distinct, since the axial ratio of the oxygen hcp-lattice is slightly
smaller than ideal (c/a = 1.611). Considering jumps to second nearest oxygen sites, an-
other six symmetry equivalent possibilities for upward and downward motion are obtained
(C, 2nd nbr: out-of-plane). Both out-of-plane paths also lead to in-plane displacements of
the migrating atom.
The calculated diffusion barriers are compiled in Tab. 6.1 and Fig. 6.4 shows a typical
energy pathway. The migration enthalpies for first-nearest neighbor migration display a
rather diverse behavior. In the neutral charge state the in-plane migration barrier is 0.5 eV
lower than its out-of-plane counterpart indicating anisotropic diffusion behavior. On the
other hand, since for the 2+ charge state process B possesses the lowest barrier, taking
61

6. Migration mechanisms and diffusion of intrinsic defects
0.0
0.2
0.4
0.6
0.8
1.0
1.2
1.4
1.6
1.8
2.0
0.0 0.2 0.4 0.6 0.8 1.0
Ene
rgy
diff
eren
ce (
eV)
Relative reaction coordinate
Figure 6.4.: Energy pathway for oxygen vacancy migration via in-plane path A. The large yellow circles
symbolize the moving oxygen atom, the small white squares indicate the initial and final position of
the vacancy. Projections along [0001].
into account the displacements parallel and perpendicular to the [0001] axis the diffusivity
should display isotropic behavior (also compare equations (6.7) and (6.8). The charge state
1+ represents an intermediate case.
Interstitial diffusion
There are at least three oxygen interstitial configurations which have been identified as
local minima of the energy hypersurface based on DFT calculations (see Chapter 4 and
Ref. [6]). In equilibrium oxygen interstitials adopt the dumbbell (Oi,db) or the rotated
dumbbell (Oi,rot−db) configuration. The highly symmetric octahedral interstitial (Oi,oct) is
energetically unfavorable as a ground state configuration, but it can occur as an interme-
diate state along the diffusion path as will be discussed below.
The two dumbbell configurations (Oi,db and Oi,rot−db) possess a threefold symmetry axis,
i.e. rotations about the [0001]-axis by multiples of 120 generate symmetry equivalent
copies of the original defect. Furthermore (ignoring small differences in the atomic re-
laxations), the Oi,db and Oi,rot−db can be transformed into each other by application of a
sixfold mirror axis (6m). In the following, this “on-site” transformation is referred to as
process X.
62

6.4. Oxygen
Table 6.1.: Energy barriers for vacancy and interstitial mediated migration of oxygen in units of
eV as obtained from CI-NEB calculations. The formation enthalpies of the respective ground state
configurations obtained in Chapter 5 are included for reference (zinc-rich conditions, Fermi level at
valence band maximum). See Figs. 6.3 and 6.5 for definition of migration paths.
Migration path Charge state
q = +2 q = +1 q = 0 q = −1 q = −2Oxygen vacancy, VO
1st nbr: in-plane A 1.49 1.37 1.871st nbr: out-of-plane B 1.09 1.38 2.552nd nbr: out-of-plane C 3.62 3.79 4.29
formation enthalpy −0.73 0.71 1.71
Oxygen interstitial, Oi
1st nbr: in-plane A1 Oi,db ↔ Oi,db 1.34 1.25 1.09 – –1st nbr: in-plane A2 Oi,rot−db ↔ Oi,rot−db 1.03 0.98 0.95 0.23 0.401st nbr: out-of-plane B1 Oi,db ↔ Oi,rot−db 1.23 1.09 0.81 0.43 0.881st nbr: out-of-plane B2 Oi,db ↔ Oi,rot−db 1.23 1.09 0.81 0.43 0.882nd nbr: out-of-plane C Oi,db ↔ Oi,rot−db 1.98 1.78 1.60 0.60 1.37
ground state (gs) Oi,db Oi,rot−db
formation enthalpy 5.08 4.59 4.70 7.08 8.79energy difference gs → Oi,db/Oi,rot−db +0.29 +0.25 +0.15 +0.48 +0.78energy difference gs → Oi,oct +1.44 +1.33 +1.10 +0.14 +0.30
While in neutral and positive charge states the two oxygen atoms are bonded, they adopt
a split-interstitial configuration in negative charge states (see Sec. 4.3.2 and Ref. [6]). In
spite of this difference, the migration paths can be described on a similar basis for all
charge states. Invoking the symmetry of the lattice the following mechanisms for oxygen
interstitial migration can be distinguished, which are illustrated in detail in Fig. 6.5(a-c).
(a) in-plane movement – processes A1 and A2
In process A1 one of the atoms of a dumbbell interstitial (Oi,db) moves away from
its partner and forms a new dumbbell with one of the two nearest oxygen atoms.
Because of the threefold symmetry axis of the dumbbell there are three dumbbell
orientations per oxygen site with two possible “target” atoms each, such that all of
the six nearest in-plane neighbors on the hcp oxygen lattice can be reached. Process
A2 is the equivalent migration path for a rotated dumbbell interstitial.
(b) out-of-plane movement – processes B1 and B2
63
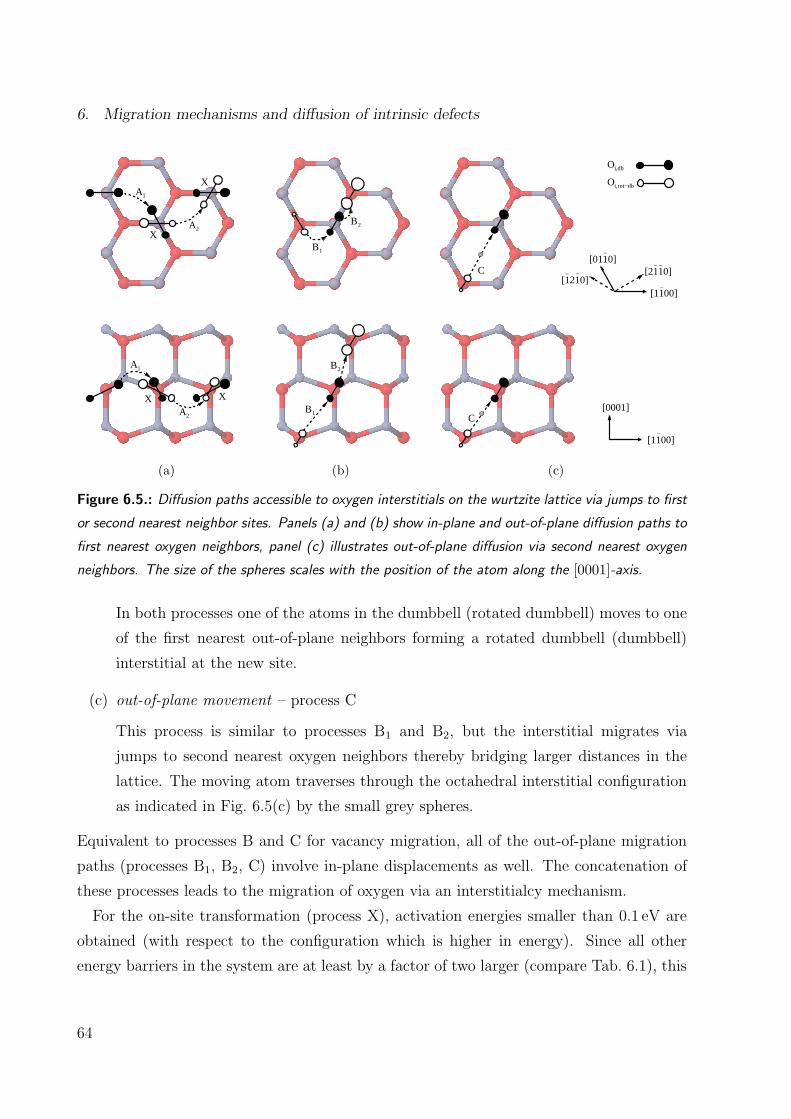
6. Migration mechanisms and diffusion of intrinsic defects
A1
A2
A1
A2
X X
X
X
(a)
B1
B2
B1
B2
(b)
[0001]
[1100]−
Oi,db
Oi,rot−db
[1210]−−
− −[2110]
−[1100]
[0110]−
C
C
(c)
Figure 6.5.: Diffusion paths accessible to oxygen interstitials on the wurtzite lattice via jumps to first
or second nearest neighbor sites. Panels (a) and (b) show in-plane and out-of-plane diffusion paths to
first nearest oxygen neighbors, panel (c) illustrates out-of-plane diffusion via second nearest oxygen
neighbors. The size of the spheres scales with the position of the atom along the [0001]-axis.
In both processes one of the atoms in the dumbbell (rotated dumbbell) moves to one
of the first nearest out-of-plane neighbors forming a rotated dumbbell (dumbbell)
interstitial at the new site.
(c) out-of-plane movement – process C
This process is similar to processes B1 and B2, but the interstitial migrates via
jumps to second nearest oxygen neighbors thereby bridging larger distances in the
lattice. The moving atom traverses through the octahedral interstitial configuration
as indicated in Fig. 6.5(c) by the small grey spheres.
Equivalent to processes B and C for vacancy migration, all of the out-of-plane migration
paths (processes B1, B2, C) involve in-plane displacements as well. The concatenation of
these processes leads to the migration of oxygen via an interstitialcy mechanism.
For the on-site transformation (process X), activation energies smaller than 0.1 eV are
obtained (with respect to the configuration which is higher in energy). Since all other
energy barriers in the system are at least by a factor of two larger (compare Tab. 6.1), this
64
6.4. Oxygen
process should never be rate-determining and is not considered any further. The energy
barriers for the remaining migration processes are compiled in Tab. 6.1. For the (out-
of-plane) processes B1, B2 and C, which implicitly transform between the two dumbbell
states, only the barrier from the respective ground state configuration is given (Oi,db for
q = 0,+1,+2 and Oi,rot−db for q = −1,−2).As shown in Fig. 6.6, all processes show comparable trends with charge state. Going
from charge state 2+ to charge state 0 the barriers decrease slightly. A sudden drop occurs
as the charge state becomes negative but the barriers rise again as yet another electron is
added to the system (q = −2). For all paths the barriers are minimal for a charge state of
1−.The significantly lower migration barriers for oxygen interstitial migration in negative
charge states can be rationalized based on the analysis of oxygen interstitial configurations
given in Chapter 4. In neutral and positive charge states, the ground state configuration
is stabilized by the formation of a strong oxygen–oxygen bond. When the system is nega-
tively charged, it is favorable to split this bond and to adopt a configuration in which the
oxygen atoms are relatively far apart (compare Sec. 4.3.2). Migration of oxygen intersti-
tials in neutral or positive charge states thus requires breaking the strong oxygen–oxygen
bond. On the other hand, for negative charge states motion of oxygen interstitials can be
accomplished by breaking and reforming a minimal set of bonds leading to significantly
lower migration barriers.
The energy surface for oxygen interstitial migration possesses many local minima (Oi,db,
Oi,rot−db, Oi,oct) and saddle points, and is also quite flat in some regions (compare e.g., the
“on-site” transformation process X). As a result, the minimum energy paths are rather
complex, which is schematically depicted in Fig. 6.7 for the charge states q = +2, 0, and
−2.The in-plane migration paths A1 and A2 possess simple saddle points. For the neutral
and positive charge states, they are almost identical if the energy difference between the
dumbbell (Oi,db) and rotated dumbbell (Oi,rot−db) is taken into account (compare Fig. 6.6).
The saddle point is close in energy to the octahedral interstitial which is plausible consider-
ing Fig. 6.5(a). For the negative charge states, the migration barrier A2 is very low and the
saddle point configuration is again very close to the octahedral interstitial configuration.
Since the energy barrier for process A2 is lower than the energy difference between Oi,rot−db
and Oi,db, the path A1 becomes redundant.
65

6. Migration mechanisms and diffusion of intrinsic defects
Figure 6.6: Charge state depen-
dence of oxygen interstitial migra-
tion enthalpies. For the in-plane path
A2, the energy difference (∆EOi) be-
tween the dumbbell (Oi,db) and ro-
tated dumbbell (Oi,rot−db) configu-
rations has been included (compare
Fig. 6.7).
0.0
0.5
1.0
1.5
2.0
+2+1 0−1−2
Mig
ratio
n ba
rrie
r (e
V)
Charge state
A1
A2+∆EOi
B1
B2
C
The out-of-plane paths B1 and B2 yield practically identical saddle points. For the
negative charge states the saddle point for the transformation of Oi,rot−db into Oi,db is
found to coincide almost exactly with the (regular) dumbbell (Oi,db) configuration. Thus,
the barrier for the migration of Oi,rot−db is essentially given by the energy difference between
Oi,rot−db and Oi,db.
The most complex minimum energy path is observed for the migration along path C.
For all charge states the octahedral interstitial occurs as an intermediate state as indicated
in Fig. 6.5. While the charge state is changing from 2+ to 2− the depth of the local
minimum associated with the octahedral interstitial changes from 0.01 eV (q = +2) to
0.90 eV (q = −2). At the same time the local minimum corresponding to the rotated
dumbbell (q ≥ 0) and dumbbell (q < 0) states, respectively, becomes more and more
shallow. Actually, in order to deal properly with these features of the energy surface,
one would need to describe the migration process C in negative charge states similar to a
reaction with pre-equilibrium. Since the barriers for the alternative processes (A1, A2, B1,
and B2), have lower barriers, they will, however, be rate-determining and the additional
complexity arising for path C can be safely neglected. Thus, only the maximum barrier
heights were compared for the latter case (see Tab. 6.1).
In summary, a migrating oxygen atom can move through a series of single jumps with
in-plane as well as out-of-plane components of the displacement vector. Since in neutral
and positive charge states the migration enthalpies for in and out-of-plane paths are very
similar, a nearly isotropic behavior would be expected. On the other hand, for the negative
66

6.4. Oxygen
0.0
0.0
0.0
0.5
0.5
0.5
1.0
1.0
1.0
1.5
1.5
1.5
C
C
C
B
B
B B
1
1
1 1
B
B
B B
2
2
2 2
A
A
A
2
2
2
Ene
rgy
(eV
)
A
A
O
1
1
i,rot−db
O
Ene
rgy
(eV
)E
nerg
y (e
V)
O
O
i,db
O
i,db
i,db
O
i,oct
O
O
i,rot−db
i,rot−db
i,db
O
O
1st nbr: in−plane
i,oct
i,oct
1st nbr: out−of−plane 2nd nbr: out−of−plane
=0q
=−2q
=+2q
b)
a)
c)
Figure 6.7.: Schematic of the energy surface for oxygen interstitial migration for charge states q = −2(a), q = 0 (b), and q = +2 (c). The zero of the energy scale corresponds to the respective ground
state (q ≥ 0: Oi,db, q < 0: Oi,rot−db). The energetically higher-lying states can transform into the
ground state via the on-site transformation process X (not shown) which has a very small barrier.
charge states the in-plane path A1 is significantly lower in energy than the two lowest out-
of-plane paths (B1, B2), which should give rise to anisotropic diffusion.
Comparison with experiment
Annealing measurements after electron [130, 31] as well as ion irradiation [131] have shown
that the onset of significant recovery occurs between 80 and 130K which has been taken
as evidence for host interstitial migration [130]. In fact, the oxygen interstitial diffusion
barriers for charge states q = −1 and −2 are small enough to allow defect diffusion at such
low temperatures. Assuming a typical annealing time of 10min, and requiring a mean
67
6. Migration mechanisms and diffusion of intrinsic defects
square displacement between (100 nm)2 and (1000 nm)2, threshold temperatures§ between
80 and 100K are obtained for charge state q = −1, and between 130 and 160K for charge
state q = −2 in good agreement with experiment. The other charge states should not
contribute to annealing at temperatures less than 350K.
Using positron annihilation spectroscopy in combination with electron irradiation of n-
type zinc oxide samples, Tuomisto et al. were able to deduce an activation energy for the
neutral oxygen vacancy of 1.8 ± 0.1 eV [132]. Again, the calculations are consistent with
this observation giving a minimum barrier of 1.87 eV (process A, Tab. 6.1).
6.4.2. Diffusivities
Derivation of diffusivities
If all migration barriers are known, the defect diffusivity is obtained by a summation over
the available paths
Dd =1
2
∑
i
ζiΓdi |λi|2 (6.3)
where |λi| is the jump length, ζi is the multiplicity (as given in Tab. 6.1), and the jump
rate, Γdi , is given by equation (6.1). By projecting the displacement vector (λi) onto
special lattice directions the components of the diffusivity tensor can be obtained. Due to
the symmetry of the wurtzite lattice, there are only two independent components, which
are conventionally denoted D⊥ and D‖ for diffusion perpendicular and parallel to the [0001]
axis, respectively.
Experimentally, diffusivities are usually obtained by measuring the mobility of tracer
atoms. Considering the vacancy and interstitialcy mechanisms, which have been introduced
in the foregoing section, a tracer atom can only migrate if a vacancy or interstitial defect is
available in its neighborhood. Therefore, the tracer diffusivity (or self-diffusion coefficient),
D∗, depends on the diffusivities of vacancies, Dv, and interstitials, Di, as well as on the
respective concentrations, cv and ci, according to
D∗ = f vZvcvDv + f iZiciDi (6.4)
§In order for a defect to anneal it must be able to migrate a certain distance√〈r2〉min during the
annealing time (τ). Using the Einstein relation,⟨r2⟩= 6Dτ , the onset temperature for annealing is
established as the temperature for which 6Dτ exceeds√〈r2〉min.
68
6.4. Oxygen
where f v and f i are lattice dependent correlation factors typically of order unity, and Zv
and Z i are the number of possible target sites. The exact determination of the correla-
tion factors is a subject in its own right [115]; in the present context the approximation
f v,i = 1− 1/Zv,i is used. Because the wurtzite lattice is composed of two interpenetrating
hexagonal close packed sublattices, the coordination numbers are Zv = Z i = 12. Since
either interstitials or vacancies prevail under oxygen and zinc-rich conditions, respectively,
one of the two terms in equation (6.4) is usually dominating. Therefore, it is admissible
and instructive to discuss the vacancy and interstitialcy mechanism as well as the charge
states separately.
In case of an intrinsic mechanism, the defect concentrations are determined by the ther-
modynamic equilibrium conditions and follow an Arrhenius law behavior,
cd = cd0 exp[
−∆Gfd/kBT
]
(6.5)
which, if entropic contributions are neglected, can be approximated by
cd ≈ cd0 exp[
−∆Hfd /kBT
]
(6.6)
where ∆Hfd is the defect formation enthalpy. Therefore, in case of an intrinsic mechanism
the activation energy measured in a diffusion experiment comprises both the formation
(∆Hf ) and the migration enthalpy (∆Hm). In contrast, in case of an extrinsic mecha-
nism, the defect concentrations (cv or ci) are externally controlled e.g., through intentional
or unintentional doping and therefore, the activation energy contains only the migration
barrier.
It is expedient to discuss the parameters which influence the tracer diffusion coefficient
in the presence of an intrinsic diffusion mechanism. Apart from the obvious temperature
dependence, D∗ is affected by (i) the chemical potential (i.e., the partial pressures of Zn
and O) and (ii) the Fermi level: (i) Since the formation enthalpies in equation (6.6) de-
pend linearly on the chemical potential [77], according to equation (6.4) the tracer diffusion
coefficient will vary as well. Neither the migration barriers (∆Hmi ) nor the attempt frequen-
cies (Γ0,i) are explicit functions of the chemical potential. (ii) The formation enthalpies of
charged defects also change linearly with the Fermi level (compare equation (4.8)), again
affecting the tracer diffusion coefficient through equations (6.4) and (6.6). In addition, the
diffusion coefficient depends implicitly on the Fermi level, since it determines which charge
state of a given defect is the most stable and thus which migration barrier is relevant.
69
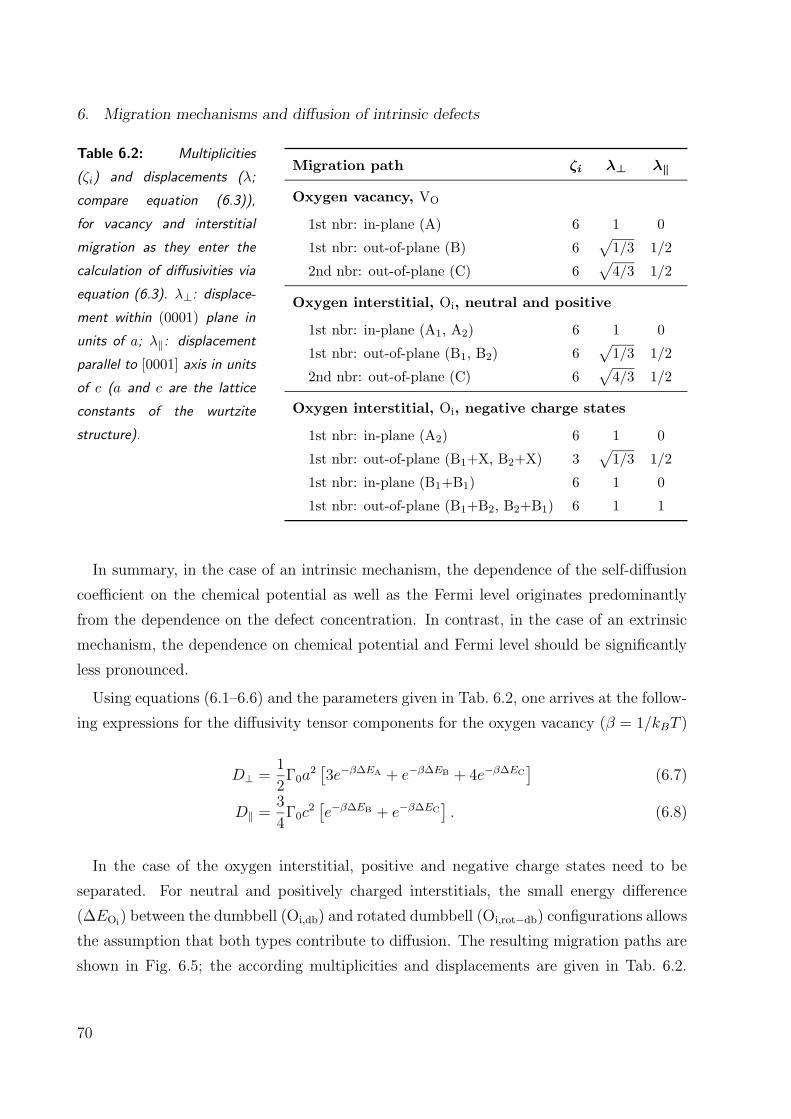
6. Migration mechanisms and diffusion of intrinsic defects
Table 6.2: Multiplicities
(ζi) and displacements (λ;
compare equation (6.3)),
for vacancy and interstitial
migration as they enter the
calculation of diffusivities via
equation (6.3). λ⊥: displace-
ment within (0001) plane in
units of a; λ‖: displacement
parallel to [0001] axis in units
of c (a and c are the lattice
constants of the wurtzite
structure).
Migration path ζi λ⊥ λ‖
Oxygen vacancy, VO
1st nbr: in-plane (A) 6 1 0
1st nbr: out-of-plane (B) 6√
1/3 1/2
2nd nbr: out-of-plane (C) 6√
4/3 1/2
Oxygen interstitial, Oi, neutral and positive
1st nbr: in-plane (A1, A2) 6 1 0
1st nbr: out-of-plane (B1, B2) 6√
1/3 1/2
2nd nbr: out-of-plane (C) 6√
4/3 1/2
Oxygen interstitial, Oi, negative charge states
1st nbr: in-plane (A2) 6 1 0
1st nbr: out-of-plane (B1+X, B2+X) 3√
1/3 1/2
1st nbr: in-plane (B1+B1) 6 1 0
1st nbr: out-of-plane (B1+B2, B2+B1) 6 1 1
In summary, in the case of an intrinsic mechanism, the dependence of the self-diffusion
coefficient on the chemical potential as well as the Fermi level originates predominantly
from the dependence on the defect concentration. In contrast, in the case of an extrinsic
mechanism, the dependence on chemical potential and Fermi level should be significantly
less pronounced.
Using equations (6.1–6.6) and the parameters given in Tab. 6.2, one arrives at the follow-
ing expressions for the diffusivity tensor components for the oxygen vacancy (β = 1/kBT )
D⊥ =1
2Γ0a
2[3e−β∆EA + e−β∆EB + 4e−β∆EC
](6.7)
D‖ =3
4Γ0c
2[e−β∆EB + e−β∆EC
]. (6.8)
In the case of the oxygen interstitial, positive and negative charge states need to be
separated. For neutral and positively charged interstitials, the small energy difference
(∆EOi) between the dumbbell (Oi,db) and rotated dumbbell (Oi,rot−db) configurations allows
the assumption that both types contribute to diffusion. The resulting migration paths are
shown in Fig. 6.5; the according multiplicities and displacements are given in Tab. 6.2.
70
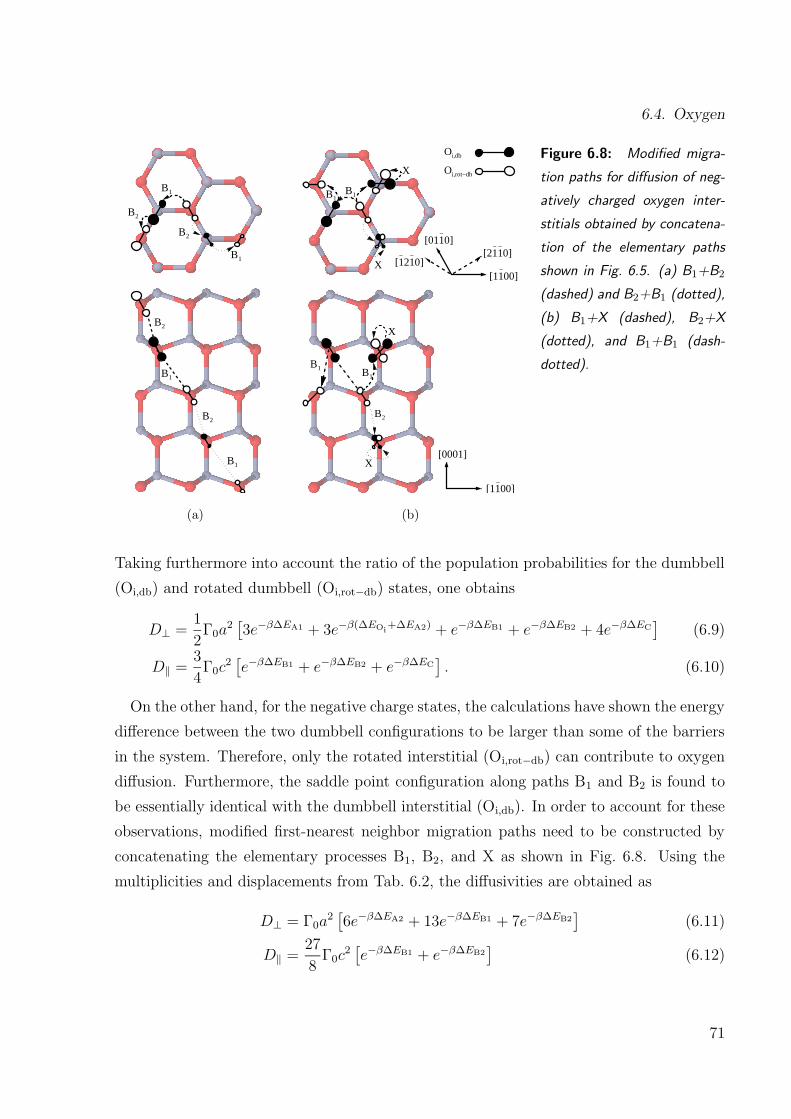
6.4. Oxygen
B2
B1
B1
B2
B1
B2
B1
B2
B1B1
B1 B1
B2
[1210]−−
− −[2110]
−[1100]
[0110]−
Oi,db
Oi,rot−db
[0001]
[1100]−
X
X
X
X
(a) (b)
Figure 6.8: Modified migra-
tion paths for diffusion of neg-
atively charged oxygen inter-
stitials obtained by concatena-
tion of the elementary paths
shown in Fig. 6.5. (a) B1+B2
(dashed) and B2+B1 (dotted),
(b) B1+X (dashed), B2+X
(dotted), and B1+B1 (dash-
dotted).
Taking furthermore into account the ratio of the population probabilities for the dumbbell
(Oi,db) and rotated dumbbell (Oi,rot−db) states, one obtains
D⊥ =1
2Γ0a
2[3e−β∆EA1 + 3e−β(∆EOi
+∆EA2) + e−β∆EB1 + e−β∆EB2 + 4e−β∆EC]
(6.9)
D‖ =3
4Γ0c
2[e−β∆EB1 + e−β∆EB2 + e−β∆EC
]. (6.10)
On the other hand, for the negative charge states, the calculations have shown the energy
difference between the two dumbbell configurations to be larger than some of the barriers
in the system. Therefore, only the rotated interstitial (Oi,rot−db) can contribute to oxygen
diffusion. Furthermore, the saddle point configuration along paths B1 and B2 is found to
be essentially identical with the dumbbell interstitial (Oi,db). In order to account for these
observations, modified first-nearest neighbor migration paths need to be constructed by
concatenating the elementary processes B1, B2, and X as shown in Fig. 6.8. Using the
multiplicities and displacements from Tab. 6.2, the diffusivities are obtained as
D⊥ = Γ0a2[6e−β∆EA2 + 13e−β∆EB1 + 7e−β∆EB2
](6.11)
D‖ =27
8Γ0c
2[e−β∆EB1 + e−β∆EB2
](6.12)
71
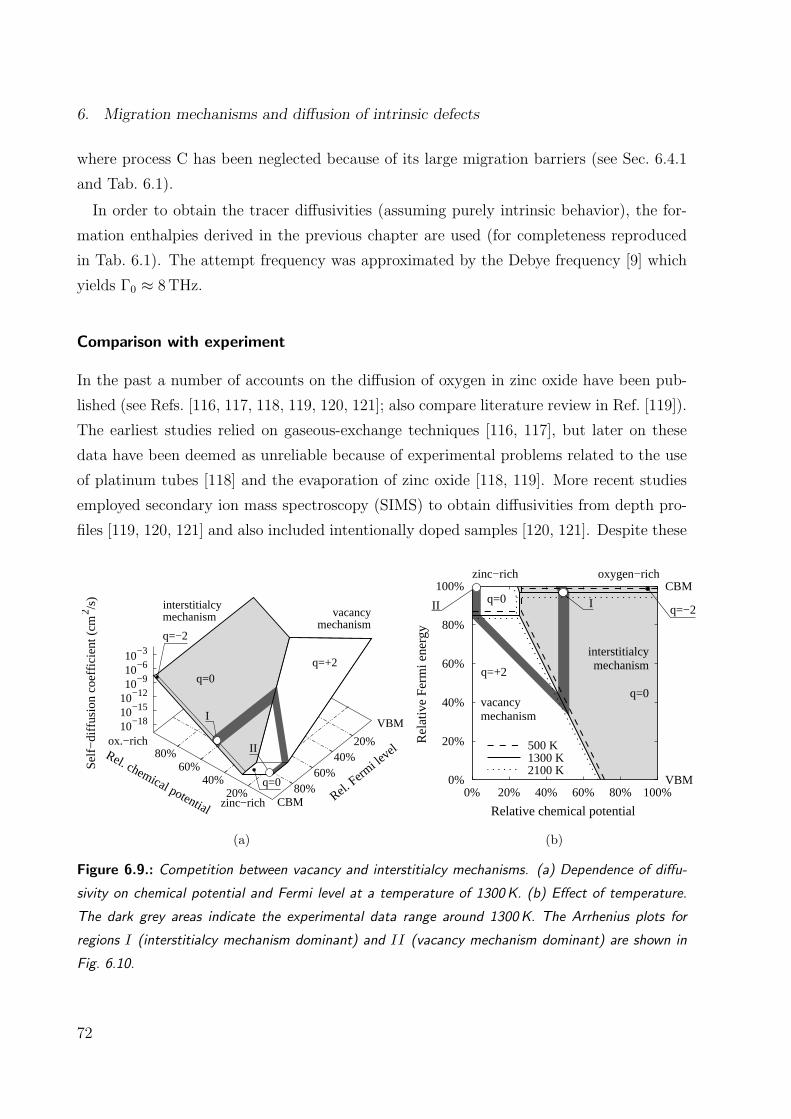
6. Migration mechanisms and diffusion of intrinsic defects
where process C has been neglected because of its large migration barriers (see Sec. 6.4.1
and Tab. 6.1).
In order to obtain the tracer diffusivities (assuming purely intrinsic behavior), the for-
mation enthalpies derived in the previous chapter are used (for completeness reproduced
in Tab. 6.1). The attempt frequency was approximated by the Debye frequency [9] which
yields Γ0 ≈ 8THz.
Comparison with experiment
In the past a number of accounts on the diffusion of oxygen in zinc oxide have been pub-
lished (see Refs. [116, 117, 118, 119, 120, 121]; also compare literature review in Ref. [119]).
The earliest studies relied on gaseous-exchange techniques [116, 117], but later on these
data have been deemed as unreliable because of experimental problems related to the use
of platinum tubes [118] and the evaporation of zinc oxide [118, 119]. More recent studies
employed secondary ion mass spectroscopy (SIMS) to obtain diffusivities from depth pro-
files [119, 120, 121] and also included intentionally doped samples [120, 121]. Despite these
20% 40%
60% 80% Rel. chemical potential
20% 40%
60% 80%
Rel. Ferm
i level
10−3
10−6
10−9
10−12
10−15
10−18
Self
−di
ffus
ion
coef
fici
ent (
cm2 /s
)
zinc−rich
ox.−rich
VBM
CBM
interstitialcyvacancymechanism
mechanismq=−2
I
II
q=0q=+2
q=0
(a)
0%
20%
40%
60%
80%
100%
0% 20% 40% 60% 80% 100%VBM
CBMzinc−rich oxygen−rich
Rel
ativ
e Fe
rmi e
nerg
y
Relative chemical potential
II q=−2
q=+2
q=0
I
500 K
q=0
1300 K2100 K
mechanismvacancy
mechanisminterstitialcy
(b)
Figure 6.9.: Competition between vacancy and interstitialcy mechanisms. (a) Dependence of diffu-
sivity on chemical potential and Fermi level at a temperature of 1300K. (b) Effect of temperature.
The dark grey areas indicate the experimental data range around 1300K. The Arrhenius plots for
regions I (interstitialcy mechanism dominant) and II (vacancy mechanism dominant) are shown in
Fig. 6.10.
72

6.4. Oxygen
10−18
10−17
10−16
10−15
10−14
10−13
10−12
10−11
10−10
10−9
60 65 70 75 80 85 90
110012001300140015001700
Self
−di
ffus
ion
coef
fici
ent (
cm2 /s
)
Inverse temperature (10 −5/K)
Temperature (K)
Hofmann and Lauder
Moore and Williams
Robin et al.
Tomlins et al.
Haneda et al.
Sabioni et al.
interstitialcy mechanism (I)
vacancy mechanism (II)
Figure 6.10.: Oxygen tracer diffusivity in zinc oxide from experiment and calculation. Experimental
data from Moore and Williams (Ref. [116]), Hofmann and Lauder (Ref. [117]), Robin et al. (Ref. [118]),
Tomlins et al. (Ref. [119], 3M sample), Haneda et al. (Ref. [120]), and Sabioni et al. (Ref. [121]).
Solid and dashed lines correspond to regions I (interstitialcy mechanism dominant) and II (vacancy
mechanism dominant) in Fig. 6.9, respectively. The reliability of the data from Refs. [116] and [117]
has been questioned in the past (see Refs. [118, 119] and text for details) but included in the plot for
completeness.
efforts a consistent picture has not emerged yet. The pre-factors and activation energies
reported in the literature are widely spread which according to the analysis by Tomlins et
al. [119] is probably related to insufficient statistics. Furthermore,direct comparison with
the experimental diffusion data is hampered, since there are unknown parameters such as
the Fermi level, the chemical potentials of the constituents, or possible impurity induced
changes in the intrinsic defect concentrations.
The dependence of the self-diffusion coefficient on chemical potential and Fermi level
as well as the resulting complicacies in the comparison with experiment are exemplified
in Fig. 6.9. Interstitialcy and vacancy mechanisms dominate under oxygen and zinc-rich
conditions, respectively. The larger formation enthalpies (∆H f ) of oxygen interstitials as
compared to vacancies are compensated by lower migration enthalpies (∆Hm), leading
73

6. Migration mechanisms and diffusion of intrinsic defects
to a balance between the two mechanisms. (The areas corresponding to vacancy and
interstitialcy mechanisms in Fig. 6.9 are nearly equally large). As illustrated in Fig. 6.9(b),
the transition between the two regimes is only weakly dependent on temperature showing
a slight increase of the interstitialcy mechanism region with rising temperature.
The range of experimental data is shown by the dark grey shaded area, which reveals that
both mechanisms can in principle explain the experimentally observed diffusivities. Since
undoped zinc oxide typically exhibits n-type behavior, Fig. 6.10 compares the temperature
dependence of the diffusivity near the bottom of the conduction band for the cases I
(interstitialcy mechanism dominates) and II (vacancy mechanism dominates) indicated
in Fig. 6.9. Both mechanisms yield similar curves and show good agreement with the
experimental data in the temperature region up to about 1450K. Above this temperature
the experimental data is very unreliable and subject to question as discussed before [119].
At this point, one can conclude that both mechanisms can explain the experimentally
measured diffusivities. Since all experimental studies were performed in oxygen atmo-
sphere, the conditions are, however, closer to the oxygen-rich side of the phase diagram for
which the interstitialcy mechanism dominates. Sabioni suggested that oxygen interstitial
diffusion occurs by motion of null or negatively charged species [133] which is supported by
the present analysis. Zinc oxide is typically intrinsically n-type conducting and the oxygen
interstitial is indeed found to diffuse in charge states q = 0 and q = −2.
Figure 6.11: Charge state dependence of mi-
gration barriers for zinc vacancy (left) and in-
terstitial (right) diffusion.
0.0
0.5
1.0
1.5
2.0
2.5
3.0
0−1−2
Mig
ratio
n ba
rrie
r (e
V)
Charge state
vacancy
A
B
C
+2+1 0
interstitialA*
A
B*
B
C
74
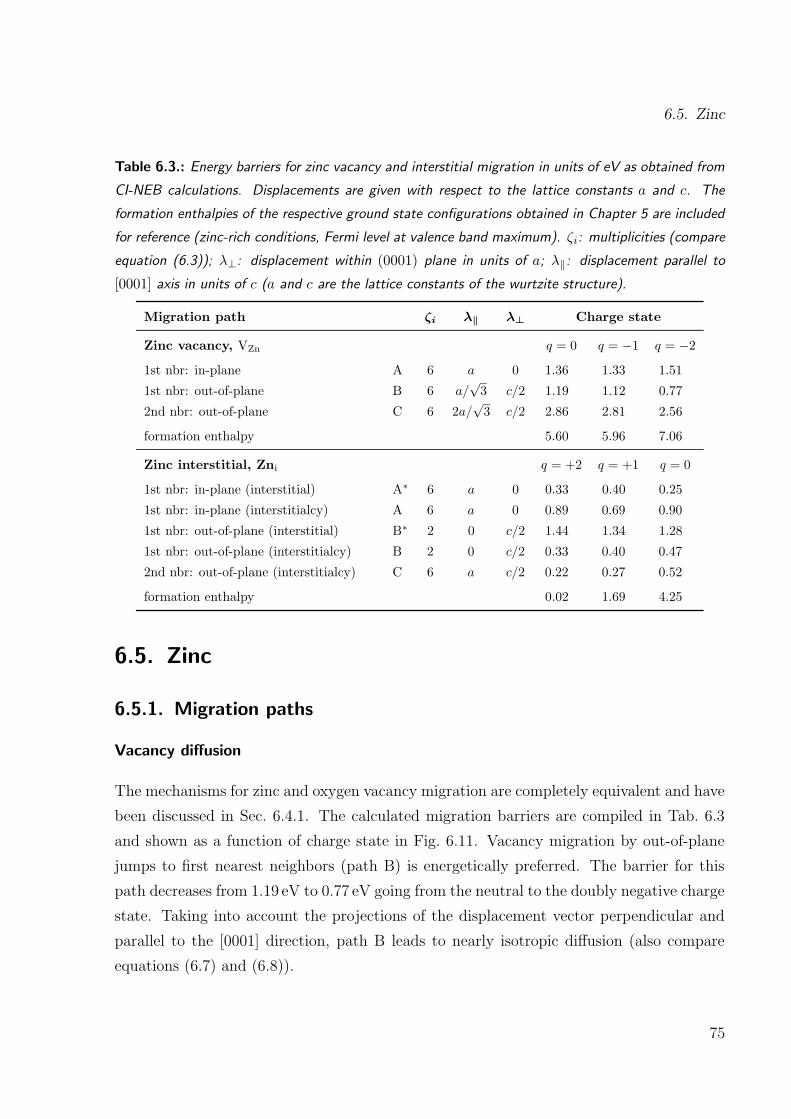
6.5. Zinc
Table 6.3.: Energy barriers for zinc vacancy and interstitial migration in units of eV as obtained from
CI-NEB calculations. Displacements are given with respect to the lattice constants a and c. The
formation enthalpies of the respective ground state configurations obtained in Chapter 5 are included
for reference (zinc-rich conditions, Fermi level at valence band maximum). ζi: multiplicities (compare
equation (6.3)); λ⊥: displacement within (0001) plane in units of a; λ‖: displacement parallel to
[0001] axis in units of c (a and c are the lattice constants of the wurtzite structure).
Migration path ζi λ‖ λ⊥ Charge state
Zinc vacancy, VZn q = 0 q = −1 q = −21st nbr: in-plane A 6 a 0 1.36 1.33 1.51
1st nbr: out-of-plane B 6 a/√3 c/2 1.19 1.12 0.77
2nd nbr: out-of-plane C 6 2a/√3 c/2 2.86 2.81 2.56
formation enthalpy 5.60 5.96 7.06
Zinc interstitial, Zni q = +2 q = +1 q = 0
1st nbr: in-plane (interstitial) A∗ 6 a 0 0.33 0.40 0.25
1st nbr: in-plane (interstitialcy) A 6 a 0 0.89 0.69 0.90
1st nbr: out-of-plane (interstitial) B∗ 2 0 c/2 1.44 1.34 1.28
1st nbr: out-of-plane (interstitialcy) B 2 0 c/2 0.33 0.40 0.47
2nd nbr: out-of-plane (interstitialcy) C 6 a c/2 0.22 0.27 0.52
formation enthalpy 0.02 1.69 4.25
6.5. Zinc
6.5.1. Migration paths
Vacancy diffusion
The mechanisms for zinc and oxygen vacancy migration are completely equivalent and have
been discussed in Sec. 6.4.1. The calculated migration barriers are compiled in Tab. 6.3
and shown as a function of charge state in Fig. 6.11. Vacancy migration by out-of-plane
jumps to first nearest neighbors (path B) is energetically preferred. The barrier for this
path decreases from 1.19 eV to 0.77 eV going from the neutral to the doubly negative charge
state. Taking into account the projections of the displacement vector perpendicular and
parallel to the [0001] direction, path B leads to nearly isotropic diffusion (also compare
equations (6.7) and (6.8)).
75

6. Migration mechanisms and diffusion of intrinsic defects
Figure 6.12: Diffusion paths accessible to
zinc interstitials on the wurtzite lattice via
jumps to first or second nearest neighbor sites.
A: in-plane migration to first nearest neighbors;
B and C: out-of-plane migration to first and
second nearest neighbors, respectively. Inter-
stitial mechanisms (in contrast to interstitialcy
mechanisms) are marked with asterisks.
[1210]−−
− −[2110]
−[1100]
[0110]−
[0001]
[1100]−
B*
B*
A*
A*
B
C
A
BC
A
Interstitial diffusion
Zinc interstitials occupy the octahedral interstitial sites of the wurtzite lattice located at the
centers of the hexagonal 〈0001〉 channels. The interstitial sites span a simple hexagonal
lattice with an axial ratio which is half as large as the one of the underlying wurtzite
lattice. The resulting migration paths are shown in Fig. 6.12. Ion migration can occur
both via pure interstitial mechanisms, i.e. via jumps on the simple hexagonal interstitial
site lattice, as well as via interstitialcy mechanisms. In-plane migration of zinc interstitials
can occur via jumps to first-nearest neighbor zinc interstitial sites along 〈2110〉 (processA∗). Equivalently, out-of-plane motion is possible by first-neighbor jumps through the
〈0001〉 channels of the wurtzite lattice (process B∗). In-plane and out-of-plane motion can
also occur via interstitialcy mechanisms involving first-nearest neighbors. The interstitialcy
mechanisms A and B shown in Fig. 6.12 and the interstitial mechanisms A∗ and B∗ lead
to equivalent final configurations. Out-of-plane motion via second-nearest neighbor sites is
finally also possible via interstitialcy mechanism C equivalent to an effective displacement
of a/√6〈2110〉+ c/2〈0001〉.
The calculated migration barriers are compiled in Tab. 6.3 and plotted as a function of
charge state in Fig. 6.11. For first neighbor in-plane migration the interstitial mechanism
(A∗) is energetically favored while for first-neighbor out-of-plane migration the interstitialcy
mechanism (B) yields the lowest barriers. For any charge state the smallest (dominant)
76
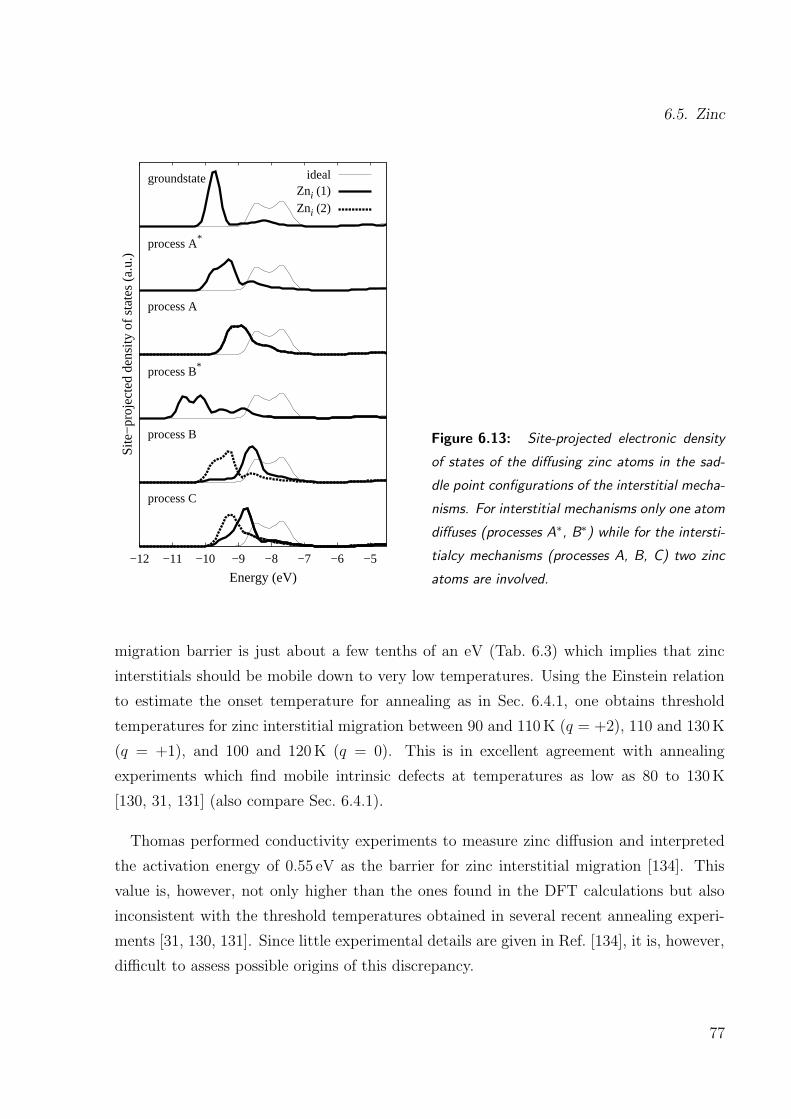
6.5. Zinc
−12 −11 −10 −9 −8 −7 −6 −5
Site
−pr
ojec
ted
dens
ity o
f sta
tes
(a.u
.)
Energy (eV)
groundstate
process A*
process A
process B*
process B
process C
idealZni (1)
Zni (2)
Figure 6.13: Site-projected electronic density
of states of the diffusing zinc atoms in the sad-
dle point configurations of the interstitial mecha-
nisms. For interstitial mechanisms only one atom
diffuses (processes A∗, B∗) while for the intersti-
tialcy mechanisms (processes A, B, C) two zinc
atoms are involved.
migration barrier is just about a few tenths of an eV (Tab. 6.3) which implies that zinc
interstitials should be mobile down to very low temperatures. Using the Einstein relation
to estimate the onset temperature for annealing as in Sec. 6.4.1, one obtains threshold
temperatures for zinc interstitial migration between 90 and 110K (q = +2), 110 and 130K
(q = +1), and 100 and 120K (q = 0). This is in excellent agreement with annealing
experiments which find mobile intrinsic defects at temperatures as low as 80 to 130K
[130, 31, 131] (also compare Sec. 6.4.1).
Thomas performed conductivity experiments to measure zinc diffusion and interpreted
the activation energy of 0.55 eV as the barrier for zinc interstitial migration [134]. This
value is, however, not only higher than the ones found in the DFT calculations but also
inconsistent with the threshold temperatures obtained in several recent annealing experi-
ments [31, 130, 131]. Since little experimental details are given in Ref. [134], it is, however,
difficult to assess possible origins of this discrepancy.
77

6. Migration mechanisms and diffusion of intrinsic defects
Notably, with the only exception being the neutral charge state, the lowest migration
barriers are obtained for the second neighbor mechanism (process C). Similar to the case
of path B for vacancy diffusion, process C involves both in-plane and out-of-plane dis-
placements and, therefore, leads to nearly isotropic diffusion characteristics. In contrast,
interstitial migration along the 〈0001〉 channels of the wurtzite lattice (process B) is en-
ergetically rather unfavorable. As demonstrated in Fig. 6.13 analysis of the site-projected
electronic density of states for the migrating zinc atoms shows the saddle point config-
uration along path C to deviate the least from the ideal configuration, providing and
explanation for the very small energy difference between the initial and the transition
state.
6.5.2. Discussion
Migration barriers for zinc vacancies and interstitials have been previously calculated by
Binks and Grimes (see Ref. [135] and Ref. 17 as cited by Tomlins et al. [136]) using
analytic pair potentials in combination with a shell-model description of the oxygen ions.
They considered jumps to first-nearest neighbors only and did not include interstitialcy
mechanisms. In the past, these results were frequently used to interpret experiments and,
in particular, to discriminate between interstitial and vacancy mechanisms (see Ref. [136]
and Ref. 12 therein). With respect to the doubly negative zinc vacancy (V′′Zn) there is at
least reasonable agreement between the shell-model potential calculations and the DFT
data obtained in the present work. According to Ref. [136] the barriers for processes A
and B are 1.81 eV and 0.91 eV, respectively, while the present calculations give values of
1.51 eV and 0.77 eV. For the zinc interstitial, there are, however, significant differences: the
DFT barriers are in general smaller and in contrast to the analytic potential calculations
indicate isotropic diffusion.
As for oxygen (Sec. 6.4.2) the detailed knowledge of all relevant migration paths and
related barriers allows to calculate the macroscopic diffusivities. The vacancy diffusivity
is given by equations (6.7) and (6.8) derived previously. Using the equations given in
Sec. 6.4.2 one obtains for the zinc interstitial
D⊥ =3
2Γ0a
2[e−β∆EA∗ + e−β∆EA + e−β∆EC
](6.13)
D‖ =1
4Γ0c
2[e−β∆EB∗ + e−β∆EB + 3e−β∆EC
]. (6.14)
78
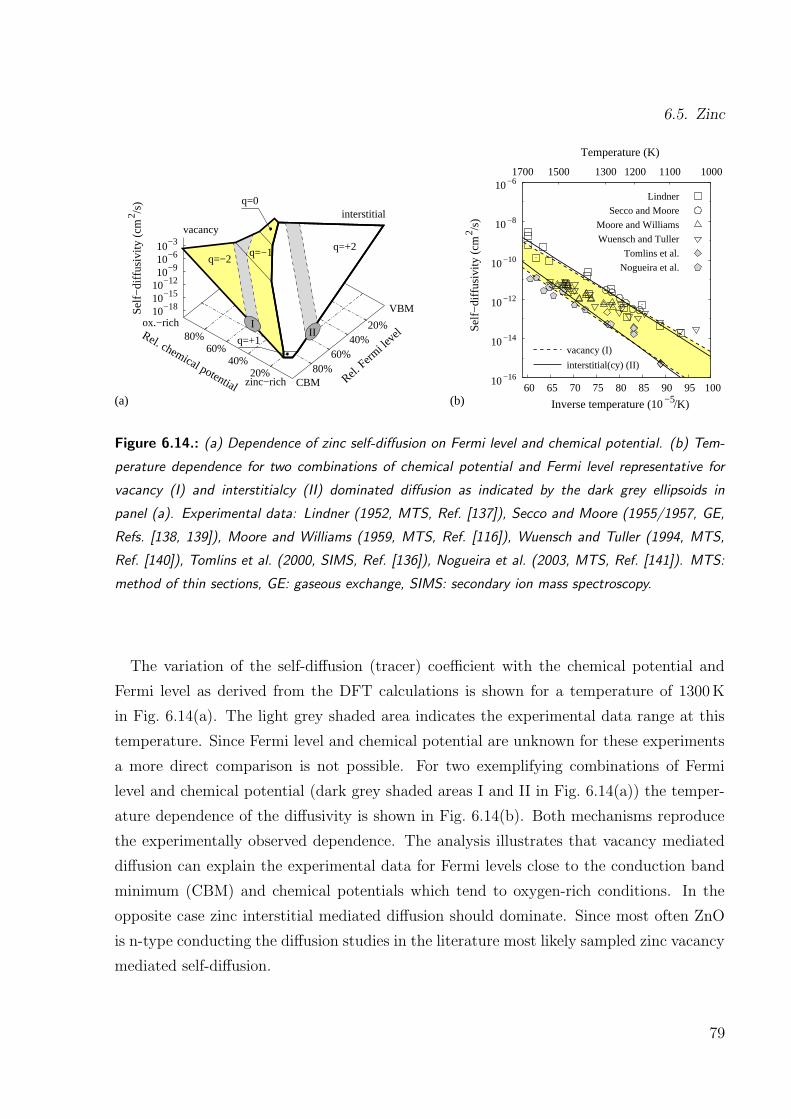
6.5. Zinc
10 −16
10
20%
−14
10
40%
−12
60%
10 −10
80%
10
Rel. chemical potential
−8
20%
10 −6
60
40%
65 70
60%
75 80 85
80%
90Rel.
Fermi le
vel
10
95
−3
100
10
1000
−6
1100
10
1200
−9
1300
10−12
1500
10
1700
−15
10−18Self
−di
ffus
ivity
(cm
Inverse temperature (10
Self
−di
ffus
ivity
(cm
Temperature (K)
2
2
−5
/s)
/s)
/K)
vacancy
Lindner
interstitial
zinc−rich
ox.−richVBM
(a) (b)
CBM
q=0
q=+1
q=+2q=−1q=−2
Secco and Moore
Moore and Williams
Wuensch and Tuller
Tomlins et al.
Nogueira et al.
interstitial(cy) (II)
vacancy (I)
III
Figure 6.14.: (a) Dependence of zinc self-diffusion on Fermi level and chemical potential. (b) Tem-
perature dependence for two combinations of chemical potential and Fermi level representative for
vacancy (I) and interstitialcy (II) dominated diffusion as indicated by the dark grey ellipsoids in
panel (a). Experimental data: Lindner (1952, MTS, Ref. [137]), Secco and Moore (1955/1957, GE,
Refs. [138, 139]), Moore and Williams (1959, MTS, Ref. [116]), Wuensch and Tuller (1994, MTS,
Ref. [140]), Tomlins et al. (2000, SIMS, Ref. [136]), Nogueira et al. (2003, MTS, Ref. [141]). MTS:
method of thin sections, GE: gaseous exchange, SIMS: secondary ion mass spectroscopy.
The variation of the self-diffusion (tracer) coefficient with the chemical potential and
Fermi level as derived from the DFT calculations is shown for a temperature of 1300K
in Fig. 6.14(a). The light grey shaded area indicates the experimental data range at this
temperature. Since Fermi level and chemical potential are unknown for these experiments
a more direct comparison is not possible. For two exemplifying combinations of Fermi
level and chemical potential (dark grey shaded areas I and II in Fig. 6.14(a)) the temper-
ature dependence of the diffusivity is shown in Fig. 6.14(b). Both mechanisms reproduce
the experimentally observed dependence. The analysis illustrates that vacancy mediated
diffusion can explain the experimental data for Fermi levels close to the conduction band
minimum (CBM) and chemical potentials which tend to oxygen-rich conditions. In the
opposite case zinc interstitial mediated diffusion should dominate. Since most often ZnO
is n-type conducting the diffusion studies in the literature most likely sampled zinc vacancy
mediated self-diffusion.
79

6. Migration mechanisms and diffusion of intrinsic defects
Together with the results for the migration of oxygen it is now possible to establish
a hierarchy for the mobilities of intrinsic defects in zinc oxide. The most mobile defects
are zinc interstitials followed by oxygen interstitials, zinc vacancies and oxygen vacancies.
These data provide further support for the most widely discussed model for degradation of
zinc oxide based varistors. This model assumes zinc interstitials to migrate in the vicinity
of grain boundaries and oxygen vacancies to be rather immobile (see e.g., Ref. [29, 30]).
6.6. Potential sources of error
In DFT calculations of point defect properties, three major sources of error have to be
taken into account (also compare previous chapter): (1) the underestimation of the band
gap, (2) elastic, and, if charge defects are considered, (3) electrostatic image interactions.
The underestimation of the band gap is an intrinsic shortcoming of the local density
(LDA) or generalized gradient (GGA) approximations. It is crucial to correct for this defi-
ciency if formation enthalpies (∆Hf ) are to be computed for configurations with different
electronic properties, for example acceptor and donor-like defects [80, 19]. On the other
hand, migration barriers (∆Hm) are obtained as energy differences between electronically
similar configurations. In addition, unlike formation enthalpies, they do not depend ex-
plicitly on the Fermi level. In the present work the GGA+U method is used to correct
for the position of the Zn-3d levels which also results in a significantly larger band gap
(1.83 eV with GGA+U vs. 0.75 eV with GGA). The migration enthalpies for the lowest
energy paths obtained with GGA and GGA+U differ by at most 0.3 eV which amounts to
a much smaller effect than in the case of formation enthalpies (compare Table 5.1). There-
fore, the remaining band gap error should have a small impact on the calculated migration
barriers.
Due to the use of periodic boundary conditions, strain and electrostatic interactions are
present between defects in neighboring supercells: Strain interactions scale approximately
asO(V −1/3) (where V is the supercell volume). If calculations are performed at fixed lattice
constants, the p∆Vf term (where p is the pressure and ∆Vf is the defect formation volume)
is non-zero and leads to an additional contribution to the calculated formation enthalpy.
For charged defects image charge interactions are present, which can be corrected based on
a multipole expansion of the excess charge distribution [109] (compare Sec. 5.4.2). Again,
these effects are crucial if formation enthalpies are computed. In contrast, in the case of
80

6.7. Conclusions
migration barriers, the initial and transition states are structurally as well as electronically
similar, and migration volumes are typically just about one tenth of the respective defect
formation volumes. Therefore, finite size effects can be expected to play a minor role in
the calculation of migration barriers.
From this argumentation it is concluded that the errors in the migration barriers can be
expected to be smaller than the errors in the formation enthalpies. Since the typical error
in the formation enthalpies is estimated to be smaller than 0.1 eV(see Refs. [18, 19, 20] and
the two foregoing chapters), the error in the migration barriers should be some fraction of
this value.
If an intrinsic diffusion mechanism is operative (compare Sec. 6.4.2), the activation en-
ergy observed in tracer experiments, comprises both the migration as well as the formation
enthalpy (see equations (6.4) and (6.6)). The relative error in the tracer diffusivity is,
therefore, not governed by the error in ∆Hm but by the error in ∆Hf .
6.7. Conclusions
Density functional theory calculations were employed in conjunction with the climbing
image nudged elastic band method to derive migration paths and saddle points for the
motion of intrinsic defects in zinc oxide. Where direct comparison is possible the present
results agree very well with experiments. The calculations yield very low barriers both
for oxygen interstitials migrating in negative charge states and zinc interstitials, which
provides an explanation for the low onset temperatures observed in annealing experiments.
The high mobilities of intrinsic interstitial defects are likely to contribute to the radiation
hardness of zinc oxide [31], since they allow for rapid annealing of Frenkel pairs or defect
agglomerates.
Which diffusion mechanism prevails, depends on the chemical potentials of the con-
stituents as well as the Fermi level, i.e. in practice the process conditions and the presence
of impurities or dopants. For oxygen, vacancy and interstitial diffusion dominate under
zinc and oxygen-rich conditions, respectively. For typical diffusion experiments carried
out in oxygen atmospheres, the interstitialcy mechanism is, therefore, the major path for
oxygen migration. Zinc self-diffusion occurs via a vacancy mechanism for predominantly
oxygen-rich and n-type conducting conditions.
81
6. Migration mechanisms and diffusion of intrinsic defects
At the time being, a direct comparison between calculation and diffusion experiments
is hampered since information on chemical potentials and Fermi level is not available for
the experimental data in the literature. The present results will, hopefully, serve as a
motivation and support for future experiments and their interpretation. Furthermore,
it can be anticipated that the detailed description of migration paths presented in this
chapter will aid the development of strategies to systematically enhance or impede the
diffusion of oxygen and zinc, will provide the data basis for continuum modeling of zinc
oxide structures and devices, and will serve as guidance for studying atomic migration in
other wurtzite crystals.
82


Part III.
Interatomic bond-order
potential for zinc oxide
85


7. Review of potential schemes
In this chapter a review is given of various potential schemes available for modeling
bonding in metals and covalent semiconductors as well as compounds. Particular
attention is paid to systems which display a mixture of ionic-covalent bonding
characteristics as typified by zinc oxide.
7.1. Introduction
Analytic potentials sacrifice the electronic degrees of freedom and are therefore computa-
tionally much more efficient than quantum mechanical calculation schemes such as density
functional theory. Thereby, they enable static as well as dynamic simulations of ensembles
of a few thousand up to a several million atoms extending to the nano or even microsecond
time scale.
From the standpoint of quantum mechanics the cohesion of a solid arises from the com-
plex many-body interactions between the valence electrons of the atoms. In general terms,
analytic potentials reduce the complexity of this system by averaging out the electronic
degrees of freedom and by considering interactions between individual atoms instead. As
the electrons are the key ingredients of chemical bonding, by coarse-graining the electronic
system necessarily some information is irreversibly lost. A judiciously chosen potential
form, however, can deliver very good approximations of the real bonding behavior.
Metal oxides (and zinc oxide in particular) represent an especially difficult case for
modeling because of their complex electronic structure and intricate mixture of ionicity and
covalency. Therefore, very few potentials for such systems are available in the literature. In
order to be useful, a potential scheme should also be capable of describing the elementary
phases. The situation is further complicated if the system of interest features such diverse
phases as a hexagonal close packed metal (zinc), a gaseous phase (dimeric oxygen), and a
87

7. Review of potential schemes
ionic-covalent semiconductor (zinc oxide). In the following, potential schemes are reviewed
which have been developed to model metallic or covalent bonding as well as schemes
which have been applied to describe compounds with ionic and ionic-covalent bonding
characteristics. Only very few potential models actually possess the capability to unify the
various bonding types within a single formalism.
7.2. Metallic and covalent bonding
Since the beginning of the 1980ies augmented efforts have been devoted to the development
of more realistic potential models for metallic and covalently bonded systems [142, 143, 33]
inspired by fundamental observations on the characteristic of the chemical bond [144, 145,
146, 32]. In contrast to pure pair potentials (e.g., Lennard-Jones or Morse potentials) these
potentials incorporate either implicitly or explicitly many-body interactions.
The embedded-atom method (EAM) [142] has emerged as the most successful model for
metallic bonding and numerous potentials employing this scheme have been developed for
elemental metals as well as metallic alloys. The modeling of covalent bonding has turned
out to be more challenging which has lead to the development of several competing schemes:
Keating type potentials are expansions of the cohesive energy about the ground state in
terms of bond lengths and angles. Following Carlsson’s classification of analytic poten-
tials this class of potentials is referred to as cluster potentials [147], the most prominent
member being the Stillinger-Weber potential scheme [143]. Analytic bond-order potentials
[32] are similarly classified as cluster functionals. They are approximations of the mo-
ment expansion within the tight-binding scheme [148] and close relatives to the embedded-
atom method [149, 150]. The best known representatives are the modified embedded-atom
method [151] (MEAM) and analytic bond-order potential [32, 33] (ABOP) schemes. The
latter approach has been extended by Brenner and coworkers by including overbinding cor-
rections [152], four-body terms and long-range interactions [153] to model hydrocarbons.
The ABOP formalism was shown to be formally equivalent to the embedded-atom
method [149]. In fact, it turns out that the bond-order ansatz is also capable of describing
many pure metals (including transition metals) on the same footing as covalent materials
[154, 155]. Pettifor and coworkers furthermore showed that bond-order potentials can be
rigorously derived within tight-binding theory based on a second moment expansion of the
88

7.3. Bonding in compounds
density of states [148, 156]. They later extended their approach to higher moments and
multi-component systems [157].
7.3. Bonding in compounds
For many elemental metals and semiconductors analytic potentials provide very good ap-
proximations of the materials behavior and have proven useful in a wide variety of appli-
cations. With regard to compounds, the situation is more complex since in most systems
cohesion arises from a mixture of covalent, metallic, ionic and van-der-Waals interactions.
Formally, the cohesive energy can be written as a sum of these contributions, and if a
realistic description of the bonding behavior is pursued, one needs to assess the relative
weight and the mathematical representations of each of these terms. In the following, po-
tential schemes from the literature are compared focusing on the treatment of covalency
vs ionicity, and, where applicable, charge equilibration.
The alkaline-halides and alkaline earth-oxides are typical example for ionic compounds in
which long-range Coulomb interactionsbetween the ions dominate. Simple pair potentials
which combine a Coulomb potential with a short ranged, spherically symmetric repulsive
potential are usually sufficient in order to obtain a satisfactory description. Shell-model
potentials (see e.g., Refs. [158, 159] and [135]) represent a somewhat more refined approach
combining short ranged repulsive, longer ranged dispersive, and ionic interactions with a
simple harmonic model for atomic polarizability [160]. The ionic charges are kept fixed at
their nominal values (and independent of the atomic environment). In the past, shell-model
potentials have been applied to a wide range of materials since they offer a very handy
formalism with few fitting parameters and yield useful models if only a small section of
configuration space is of interest. Since three-body interactions are not explicitly taken into
account covalent contributions either have to be neglected or are subsumed in the fitting
parameters. The formalism is incapable of describing pure elements which renders it inapt
for simulations in which the boundary phases of the material play a role. Furthermore,
due to the long-range interaction of the Coulomb potential the treatment of electrostatic
contributions in static as well as dynamic simulations is computationally very demanding.
In contrast to ionic interactions, covalent bonding is characterized by strong directional
dependence, and therefore angle dependent terms need to be taken into account. By
merging Stillinger-Weber type [143] two and three-body potentials with terms describing
89

7. Review of potential schemes
Coulomb, monopole-dipole, and van-der-Waals interactions, Vashishta and coworkers ar-
rived at a scheme capable of describing materials such as silicon carbide [161, 162] and
gallium arsenide [163]. The ions are assigned fixed, effective charges and the long-range
electrostatic interactions are truncated at some intermediate distance reducing the com-
putational effort substantially. The potentials are designed such that the boundary phases
can be described on the same basis as the compound. Unfortunately, parameter sets for
the SiC and GaAs potentials have not been published. A Vashishta-type potential for zinc
oxide was derived and applied to study homoepitaxial growth on (0001)-ZnO faces [164].
Since in fitting and testing only a very limited number of properties was considered, it is,
however, difficult to evaluate the transferability and reliability of this potential.
In order to simulate metal/metal-oxide interfaces Streitz and Mintmire devised a scheme
(ES+) which merges the EAM scheme with an ionic potential [165]. The model explicitly
accounts for charge transfer between anions and cations by equilibrating the ionic charge
for each configuration which renders it computationally very demanding. The scheme
has been applied with some success for modeling alumina [165] and with modifications to
titania [166].
More recently, Duin et al. constructed a reactive force field (ReaxFF) which features a
combination of many-body, van-der-Waals, and Coulomb terms [167]. Originally, designed
for hydrocarbons the scheme is sufficiently flexible to describe also oxidic compounds and
metals as demonstrated in the case of alumina [168]. Similarly, to the Vashishta poten-
tials, the Coulomb potential is truncated at some distance. The effective ionic charges are
determined via charge equilibration akin the Streitz-Mintmire approach. The full func-
tional form features more than ninety parameters. Many degrees of freedom for fitting
can improve the flexibility of the potential scheme but parameter space sampling during
fitting becomes increasingly complex and the risk for spurious minima in the potential
hypersurface grows.
As outlined in the foregoing section purely covalent bonding exemplified by elemental
semiconductors such as carbon, silicon, or germanium, can be well described within the
ABOP approach [32, 33, 152]. It turns out the formalism works similarly well for strongly
covalent compounds. In fact, the ABOP scheme in its original form as well as in slightly
modified versions has been employed with great success to the modeling of a whole variety
of materials, including covalently bonded group-III, group-IV and group-V semiconductors
90
7.3. Bonding in compounds
and compounds [150, 169, 170, 171, 172, 173, 174, 175, 176, 177], transition metals and
transition metal carbides [154, 178, 155], as well as partially ionic systems [179].
In this dissertation the applicability of the bond-order scheme as described in Refs. [150,
154] to the description of zinc oxide as a prototypical oxide was explored. To begin with,
a computer code was developed which is presented in the following chapter.
91


8. Pontifix/Pinguin: A code for
fitting analytic bond-order potentials∗
This chapter describes the Pontifix/Pinguin program package which provides
a simple interface for the generation of analytic bond-order potentials for elements
as well as compounds. Based on a set of data comprising the cohesive energies
and bond lengths for a number of structures and at least one complete set of
elastic constants for one of these structures, the potential parameter set(s) are
optimized using the Levenberg-Marquardt least-squares minimization algorithm.
The program allows to fit several parameter sets simultaneously. Furthermore,
it is possible to include an arbitrarily large number of neighbors which allows to
develop analytic bond-order potentials which extend to the second or third neighbor
shell.
8.1. Introduction
In the previous chapter, an extensive review of analytic potential schemes has been given. It
turned out that the analytic bond-order potential scheme is one of the most flexible models
for describing various bonding situations. In the present chapter, the Pontifix/Pinguin
program code is introduced which has been developed as part of this work and which allows
to fit analytic bond-order potentials for elements as well as compounds.
For pair potentials with a small number of parameters, given a set of properties, fitting
parameter sets is usually rather straight forward. For Lennard-Jones and Morse potentials
the parameters can be derived by hand while in the case of ionic potentials, codes such
as Gulp [180, 181] provide a very simple means to fit parameters. As the dimensionality
∗Parts of the present chapter have been published in Ref. [1].
93

8. Pontifix/Pinguin: A code for fitting analytic bond-order potentials
of parameter space increases and the functional form becomes more complex, the effort
expended to obtain suitable parameter sets increases enormously [182]. Therefore, fitting
such potentials is a very laborious and tedious task [183].
Ideally, a potential should be transferable, accurate and computationally efficient [183]
but in practice one needs to find a compromise between these properties. In the past
this problem has been approached from different perspectives. One option is to use a large
number of parameters and a highly flexible potential form. Thereby, it is possible to obtain
good agreement with a large number of properties included in the fitting database [184].
However, the risk for artificial minima in the potential hypersurface typically increases
with the dimensionality of parameter space which deteriorates the transferability of the
potential [182]. For EAM potentials, Mishin and coworkers have performed a detailed
investigation of the interplay between the number of parameters and the root mean square
error of the fitting and testing databases [185]. They found that there exists an optimal
value for the number of parameters, beyond which no further improvement with respect
to the properties contained in the testing database can be achieved.
Another important issue is the compilation of the fitting database itself. Usually, the data
which enters the fitting process stems from a variety of experimental as well as theoretical
sources. Thus it is of primary importance to ensure the compatibility of the data [182]
and care must be taken during the construction of the database, e.g. by means of rescaling
or shifting calculated data points [185, 154]. Furthermore, the properties which appear in
the fitting database should cover as wide a range of possible configurations as possible and
include energy as well as force-dependent quantities. In fact, inclusion of cohesive energies
and lattice parameters alone neither leads to a good description of elastic properties nor
provides satisfactory potentials [186]. On the other hand, information on forces in near-
equilibrium situations can be easily included by considering elastic constants or phonon
mode frequencies. A more involved approach is to fit directly forces obtained from first-
principles calculations [184, 187].
Finally, there are many possibilities to browse parameter space. The optimum choice
of algorithm depends on the dimensionality of the system and the functional form of the
potential. The most widely adapted methods are simulated annealing and conjugated gra-
dients minimization although alternatives such as genetic algorithms have been considered
as well [188].
94
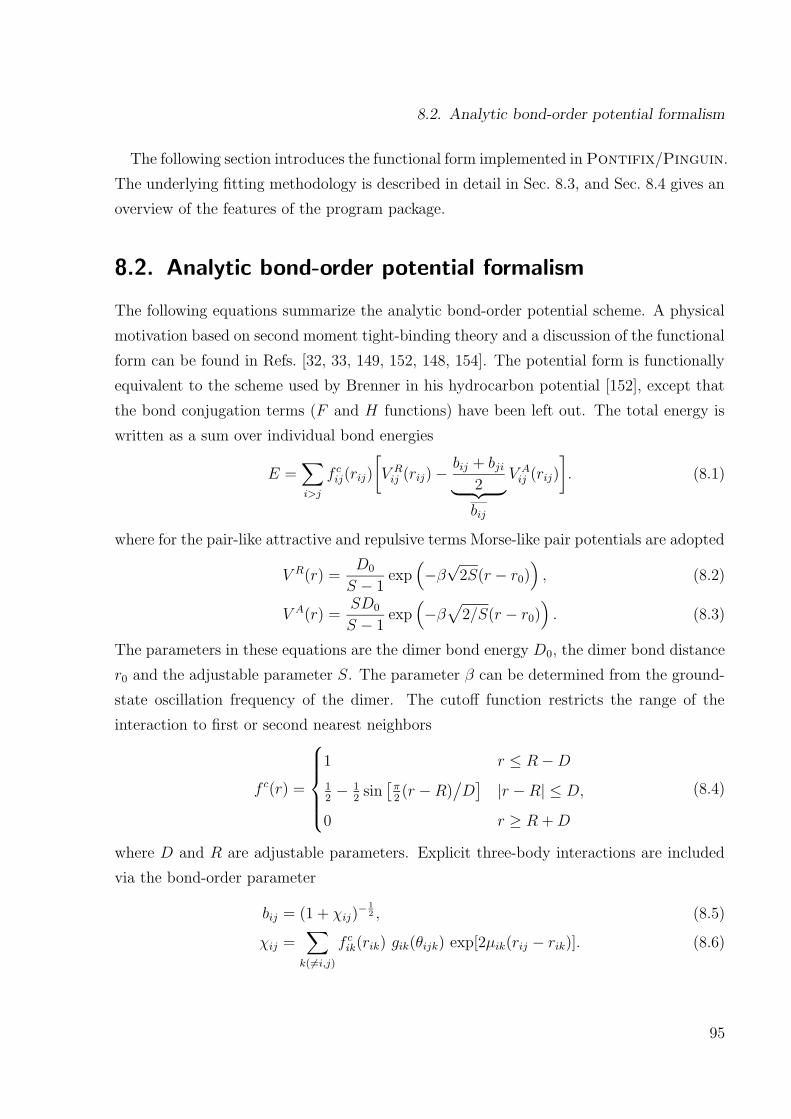
8.2. Analytic bond-order potential formalism
The following section introduces the functional form implemented in Pontifix/Pinguin.
The underlying fitting methodology is described in detail in Sec. 8.3, and Sec. 8.4 gives an
overview of the features of the program package.
8.2. Analytic bond-order potential formalism
The following equations summarize the analytic bond-order potential scheme. A physical
motivation based on second moment tight-binding theory and a discussion of the functional
form can be found in Refs. [32, 33, 149, 152, 148, 154]. The potential form is functionally
equivalent to the scheme used by Brenner in his hydrocarbon potential [152], except that
the bond conjugation terms (F and H functions) have been left out. The total energy is
written as a sum over individual bond energies
E =∑
i>j
f cij(rij)
[
V Rij (rij)−
bij + bji2
︸ ︷︷ ︸
bij
V Aij (rij)
]
. (8.1)
where for the pair-like attractive and repulsive terms Morse-like pair potentials are adopted
V R(r) =D0S − 1
exp(
−β√2S(r − r0)
)
, (8.2)
V A(r) =SD0S − 1
exp(
−β√
2/S(r − r0))
. (8.3)
The parameters in these equations are the dimer bond energy D0, the dimer bond distance
r0 and the adjustable parameter S. The parameter β can be determined from the ground-
state oscillation frequency of the dimer. The cutoff function restricts the range of the
interaction to first or second nearest neighbors
f c(r) =
1 r ≤ R−D12− 12sin
[π2(r −R)
/D]|r −R| ≤ D,
0 r ≥ R +D
(8.4)
where D and R are adjustable parameters. Explicit three-body interactions are included
via the bond-order parameter
bij = (1 + χij)− 1
2 , (8.5)
χij =∑
k(6=i,j)
f cik(rik) gik(θijk) exp[2µik(rij − rik)]. (8.6)
95

8. Pontifix/Pinguin: A code for fitting analytic bond-order potentials
The indices monitor the type-dependence of the parameters, which is of importance for
the description of compounds. The angular dependence is described by
g(θ) = γ
(
1 +c2
d2− c2
d2 + (h+ cos θ)2
)
. (8.7)
The three-body interactions are thus controlled by the parameters γ, c, d, h, and 2µ each
of which depends on the type of atoms i and k.
8.3. Fitting methodology
The approach implemented in Pontifix is based on the experience gained during the
development of several analytic bond-order potentials in the past years. The code uses
conjugate gradients minimization to optimize the input parameter sets which requires
manual intervention as fitting proceeds. It has been found that the benefits of more
involved optimization algorithms such as simulated annealing or genetic algorithms are
outweighed by the possibilities of user control and interaction available in the present
approach.
Equations (8.2) and (8.3) which describe the pairwise interactions are equivalent to the
equations originally introduced by Tersoff [33] and the respective parameters can be readily
transformed into each other. However, unlike Tersoff’s version equations (8.2) and (8.3)
have the major benefit that the parameters can be given an immediate physical meaning:
D0 and r0 are the dimer energy and bond length and β is related to the ground-state
oscillation frequency, k, of the dimer according to
β = k2πc0
√
2D0/µ, (8.8)
where µ is the reduced mass† of the dimer and c0 is the speed of light.
By construction the potential fulfills the Pauling relation which relates the energy per
bond, Eb, with the bond length, rb,
Eb = −D0 exp(
−β√2S(rb − r0)
)
. (8.9)
If D0, r0, and β are fixed, then S determines the slope of the Pauling plot and usually its
value is adjusted to obtain a good agreement with the input data. The parameter S can
†The reduced mass is defined as µ = m1m2/(m1 +m2) where m1 and m2 are the masses of the atoms of
the dimer.
96

8.4. Features of Pontifix
also be given a physical interpretation and derived from experimental data as described in
Ref. [32].
The two parameters in equation (8.4) which specify position and width of the cutoff
range, are typically set manually such that the cutoff range extends between the largest
first-nearest neighbor distance to the smallest second-nearest neighbor distance among
the structures considered. In some cases it is advisable to include second neighbors as
well [155]. In principle, Pontifix is able to include yet more neighbors but it should be
taken into account that the computational cost increases as more and more neighbors are
included. Furthermore, due to the extended range of three-body interactions unforeseen
and undesirable (artificial) energy minima might develop.
Thus, six out of eleven parameters can be given a physical interpretation and can be
set directly based on available experimental or first-principles data. From the remaining
five parameters which describe the three-body interactions the parameter 2µ appearing
in equation (8.6) stands apart. For structures for which there is only one type of first
neighbors with one unique bond length included in the cutoff sphere, the exponential term
in equation (8.6) is always one and thus the value of 2µ is immaterial. In turn this implies 2µ
affects only structures which involve asymmetric bond lengths. Typically, fitting involves
mostly high-symmetry structures the properties of which (excluding thermal vibrations)
are unaffected by the value of 2µ. Therefore, it is often possible to adjust 2µ selectively to
certain properties after all of the other parameters have been fixed. Such an approach has
been chosen e.g., by Tersoff in fitting surface properties. For the same reason the 2µ has
sometimes been found to give rise to artefacts [189], whence in the past it has often been
set intentionally to zero.
Once the seven parameters discussed above (D0, r0, β, S, R, D, and 2µ) have been
fixed or given suitable starting values, the remaining four parameters (γ, c, d, and h) are
fit to a set of properties which usually comprises the bond lengths and energies of several
structures, as well as elastic constants.
8.4. Features of Pontifix
Pontifix implements the fitting methodology described in the foregoing section. For
optimizing the initial parameter set(s) it uses conjugated gradients minimization [190].
The code is able to fit several mutually dependent parameter sets simultaneously. Pinguin
97

8. Pontifix/Pinguin: A code for fitting analytic bond-order potentials
Figure 8.1: Flow chart of the fitting algo-
rithm implemented in Pontifix. After con-
struction of the fitting database and begin
given initial parameter set(s) the code opti-
mizes the parameter set(s) with respect to the
fitting database by conjugated gradients mini-
mization.
initial parameter sets
optimization loop
cohesive energieslattice parameterselastic constants
crystal structures
general
defect structures
for each interaction type(A−A, B−B, A−B etc.)
one parameter set
Stop
Yes
Stop
Yes
calculate Jacobi matrix(properties w.r.t. parameters)
adjust parameters
calculate and print properties
No
No
calculation schemesymmetry reduced
complete structure
experience / educated guessbased on existing parameterizations
dimer dataexperimenttheory (mostly DFT)other
input data from
fitting database
achieved?convergence
interuptionuser
is a graphical user interface programmed using the GIMP Toolkit (http://www.gtk.org)
which runs under UNIX/LINUX systems. It provides a simple and intuitive tool to create
fitting databases, control parameter sets and run Pontifix interactively. As input, the
user is required to specify a database of properties which is used for fitting the potential
and one or more initial set(s) of parameters. An extensive description of the parameters
and the syntax of the input files is given in a separate document [191]. A schematic of the
fitting process is given in Fig. 8.1.
98

8.4. Features of Pontifix
8.4.1. Parameter sets
The code is able to fit several mutually dependent parameter sets simultaneously. For
each of the potential parameters described above an initial value is required. The user can
control the fitting process further by fixing individual parameters and by specifying a range
within a certain parameter is allowed to vary. The code was run with up to three parameter
sets at the same time to fit the binary system W–C [155]. There is no principle limit on the
number of parameter sets but it is strongly advised to keep the number of free parameters
(or equivalently the dimensionality of parameter space) as small as possible for the sake
of computational efficiency and in order to maintain a distinct control over the fitting
procedure. This can also be achieved when fitting several parameter sets concurrently by
fixing the values of several parameters. For instance for the reasons described above, one
can usually leave most of the pair parameters fixed.
8.4.2. Fitting database
General. There are several parameters by which the user controls the output of the
program, the break conditions of the fitting routine, and a number of other properties.
Structural properties. When a structure is included in the database of properties, Pon-
tifix automatically optimizes the structural parameters such as lattice or internal param-
eter(s) and calculates the equilibrium cohesive energy. Currently, the following structures
are included: dimer, equilateral triangular trimer, linear trimer, graphite, diamond, β-tin,
simple cubic, body-centered cubic, simple hexagonal, face-centered cubic, hexagonal closed-
packed, rock salt, cesium chloride, zinc blende, CuAu (L10), Cu3Au (L12) and tungsten
carbide.
It is possible to calculate the structural properties either by including the first-nearest
neighbors only (symmetry reduced) or by considering the complete structure including an
in principle arbitrary number of neighbors. In particular, Pontifix allows to fit analytic
bond-order potentials which include for example the second or third neighbor shell.
For cubic, hexagonal and tetragonal structures it is furthermore possible to calculate
elastic properties. The code can calculate the bulk modulus and its pressure derivative as
well as the tensor of the second order elastic constants. The code is written in a way to
simplify addition of new structures and deformation modes.
99

8. Pontifix/Pinguin: A code for fitting analytic bond-order potentials
Defect structures. Finally Pontifix allows to include extended structures in the fitting
database such as defect configurations or surfaces. it is possible to take into account volume
relaxation for these structures but the atomic positions are not optimized during fitting.
8.5. An illustrative example
In order to illustrate the typical steps during deriving a new parameter set, a silicon
potential is discussed, which has been derived as part of a Si–C potential [177]. The dimer
energy, bond length and oscillation frequency were taken from experiment to fix the initial
values of D0, r0, and β. The fitting database furthermore comprised experimental data
for the dimer, the diamond and β-tin structures and was complemented by first-principles
data for several higher coordinated structures. For the sake of consistency the bond lengths
obtained from theory were rescaled and the cohesive energies were shifted such that the
adjusted data reproduced the experimental values for the diamond structure. Finally,
experimental data on the elastic constants were included for the equilibrium diamond
structure. The cutoff parameters were fixed such that the cutoff range fell between the
first nearest neighbor distance of the fcc and the second nearest neighbor distance of the
bcc structure. An initial value for the parameter S was obtained by fitting the input data
to the Pauling relation.
Due to the functional form of g(θ) in equation (8.7) the h parameter can only assume
values between −1 and +1. In previous parameterizations for sp3 coordinated materials
values for h ranged from 0 [169] to 1 [152]. Initial values for γ, c, and d are more difficult
to find, since they are strongly dependent on each other. Typically, the ratio c/d can be
adopted to be on the order of one while γ scales roughly inversely with c2. Suitable starting
values can be taken from previous parameterizations and adjusted by trial and error.
Based on a set of initial values for γ, c, d, and h we then fitted the three-body interaction
part using Pontifix. In practice, various initial parameter sets were tested until several
reasonable combinations were obtained. These initial parameter sets were subsequently
improved by selectively varying the values of certain parameters, including or excluding
them from the fit and by changing the weights of the properties in the fitting database.
During this phase also the values of r0 and β were released in order to obtain a better fit
of the bulk modulus of the diamond structure. This is a simple example of how one can
100
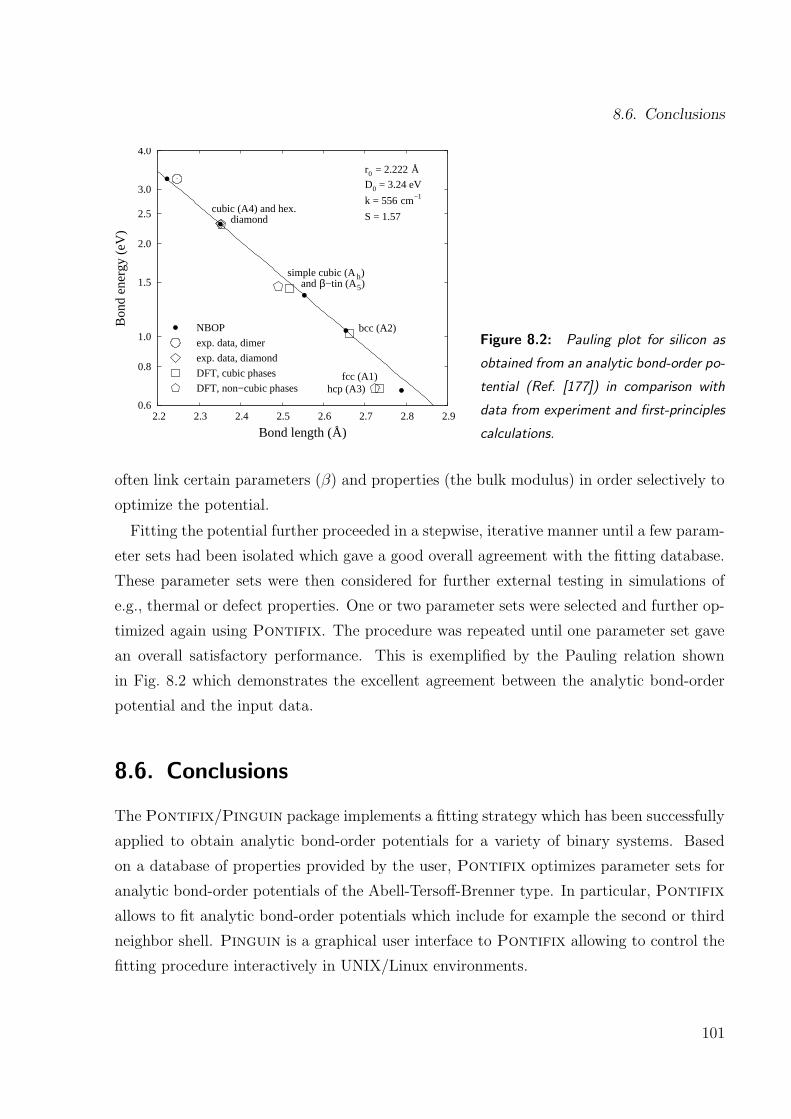
8.6. Conclusions
4.0
3.0
2.5
2.0
1.5
1.0
0.8
0.6 2.2 2.3 2.4 2.5 2.6 2.7 2.8 2.9
Bon
d en
ergy
(eV
)
Bond length (Å)
r0 = 2.222 Å
D0 = 3.24 eV
k = 556 cm−1
S = 1.57cubic (A4) and hex.
diamond
simple cubic (A h)and β−tin (A5)
bcc (A2)
fcc (A1)hcp (A3)
NBOP
exp. data, dimer
exp. data, diamond
DFT, cubic phases
DFT, non−cubic phases
Figure 8.2: Pauling plot for silicon as
obtained from an analytic bond-order po-
tential (Ref. [177]) in comparison with
data from experiment and first-principles
calculations.
often link certain parameters (β) and properties (the bulk modulus) in order selectively to
optimize the potential.
Fitting the potential further proceeded in a stepwise, iterative manner until a few param-
eter sets had been isolated which gave a good overall agreement with the fitting database.
These parameter sets were then considered for further external testing in simulations of
e.g., thermal or defect properties. One or two parameter sets were selected and further op-
timized again using Pontifix. The procedure was repeated until one parameter set gave
an overall satisfactory performance. This is exemplified by the Pauling relation shown
in Fig. 8.2 which demonstrates the excellent agreement between the analytic bond-order
potential and the input data.
8.6. Conclusions
The Pontifix/Pinguin package implements a fitting strategy which has been successfully
applied to obtain analytic bond-order potentials for a variety of binary systems. Based
on a database of properties provided by the user, Pontifix optimizes parameter sets for
analytic bond-order potentials of the Abell-Tersoff-Brenner type. In particular, Pontifix
allows to fit analytic bond-order potentials which include for example the second or third
neighbor shell. Pinguin is a graphical user interface to Pontifix allowing to control the
fitting procedure interactively in UNIX/Linux environments.
101

8. Pontifix/Pinguin: A code for fitting analytic bond-order potentials
The Pontifix/Pinguin package greatly simplifies the development of analytic bond-
order potentials for single as well as multi-component systems and it is hoped to be actively
used in the future. The program package is freely accessible for researchers in academic
environments.
102
9. Bond-order potential for zinc oxide∗
A short ranged potential for zinc oxide and its elemental constituents is developed
using the analytic bond-order formalism introduced in chapters 7 and 8. The
potential provides a good description of the bulk properties of zinc oxide over a wide
range of coordinations including cohesive energies, lattice parameters, and elastic
constants. The zinc and oxygen parts reproduce the energetics and structural
parameters of a variety of bulk and in the case of oxygen also molecular structures.
The dependence of thermal and point defect properties on the cutoff parameters
is discussed. The potential is employed to study the behavior of bulk zinc oxide
under ion irradiation.
9.1. Introduction
In this chapter the question is pursued whether a highly ionic compound such as zinc oxide
can be treated within a purely covalent model. The neglect of charges avoids the com-
putationally expensive treatment of long-range interactions and, thereby, allows to obtain
an atomistic model which is significantly more efficient† than any of the ionic potentials
described in Sec. 7.3. From a conceptual point of view, by realizing the counterpart of a
purely ionic potential it would become possible to separate ionic and covalent contributions
in a given situation by opposing the results obtained with different potentials.
As described in the two foregoing chapters, the ABOP scheme in principle offers the
possibility to describe Zn–O, O–O as well as Zn–Zn interactions within a single framework.
Although, it turns out that for many situations the neglect of charges is legitimate, it needs
∗Parts of the present chapter have been published in Ref. [2].†For GaN purely covalent as well as partially ionic potentials have been developed [179, 192]. The former
is roughly two orders of magnitude more efficient.
103
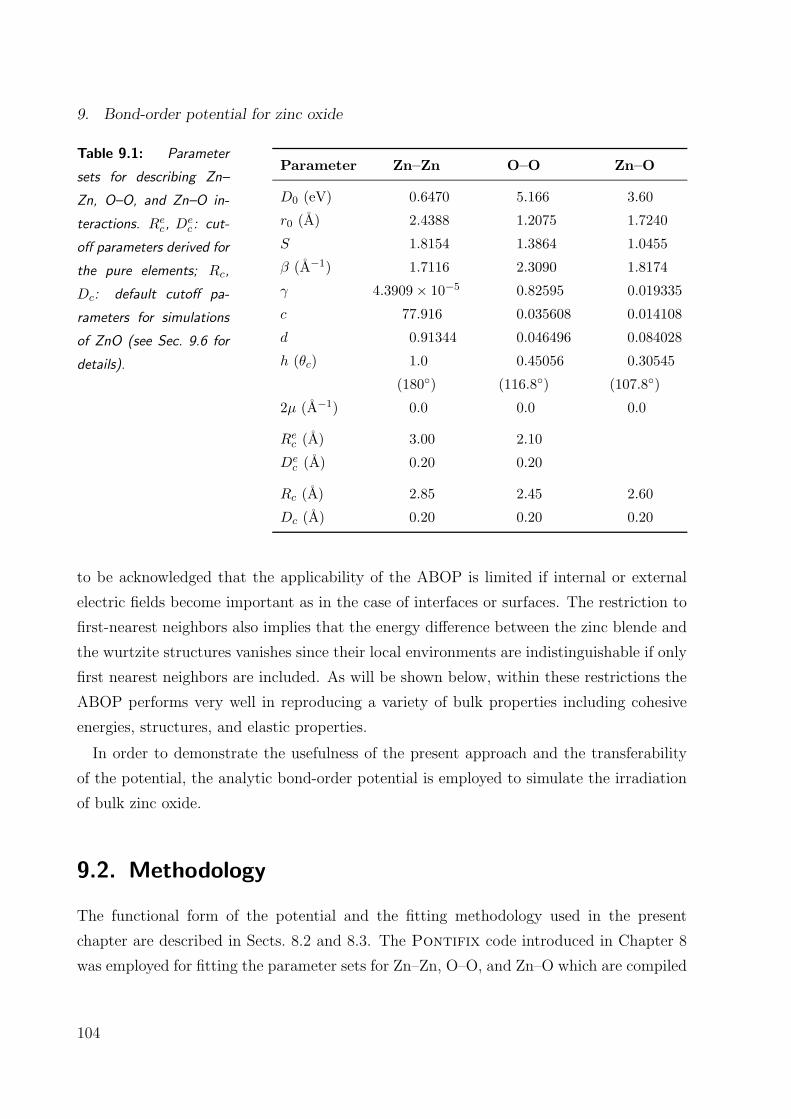
9. Bond-order potential for zinc oxide
Table 9.1: Parameter
sets for describing Zn–
Zn, O–O, and Zn–O in-
teractions. Rec, D
ec : cut-
off parameters derived for
the pure elements; Rc,
Dc: default cutoff pa-
rameters for simulations
of ZnO (see Sec. 9.6 for
details).
Parameter Zn–Zn O–O Zn–O
D0 (eV) 0.6470 5.166 3.60
r0 (A) 2.4388 1.2075 1.7240
S 1.8154 1.3864 1.0455
β (A−1) 1.7116 2.3090 1.8174
γ 4.3909× 10⁻⁵ 0.82595 0.019335
c 77.916 0.035608 0.014108
d 0.91344 0.046496 0.084028
h (θc) 1.0 0.45056 0.30545
(180) (116.8) (107.8)
2µ (A−1) 0.0 0.0 0.0
Rec (A) 3.00 2.10
Dec (A) 0.20 0.20
Rc (A) 2.85 2.45 2.60
Dc (A) 0.20 0.20 0.20
to be acknowledged that the applicability of the ABOP is limited if internal or external
electric fields become important as in the case of interfaces or surfaces. The restriction to
first-nearest neighbors also implies that the energy difference between the zinc blende and
the wurtzite structures vanishes since their local environments are indistinguishable if only
first nearest neighbors are included. As will be shown below, within these restrictions the
ABOP performs very well in reproducing a variety of bulk properties including cohesive
energies, structures, and elastic properties.
In order to demonstrate the usefulness of the present approach and the transferability
of the potential, the analytic bond-order potential is employed to simulate the irradiation
of bulk zinc oxide.
9.2. Methodology
The functional form of the potential and the fitting methodology used in the present
chapter are described in Sects. 8.2 and 8.3. The Pontifix code introduced in Chapter 8
was employed for fitting the parameter sets for Zn–Zn, O–O, and Zn–O which are compiled
104
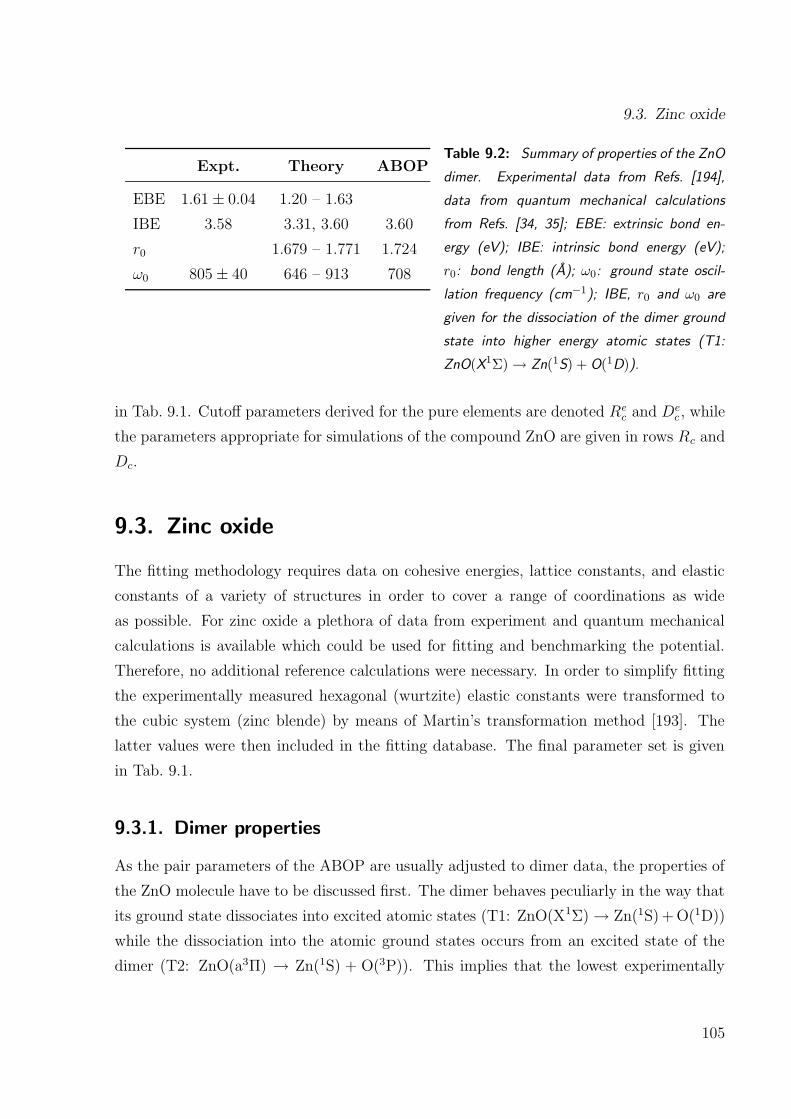
9.3. Zinc oxide
Expt. Theory ABOP
EBE 1.61± 0.04 1.20 – 1.63
IBE 3.58 3.31, 3.60 3.60
r0 1.679 – 1.771 1.724
ω0 805± 40 646 – 913 708
Table 9.2: Summary of properties of the ZnO
dimer. Experimental data from Refs. [194],
data from quantum mechanical calculations
from Refs. [34, 35]; EBE: extrinsic bond en-
ergy (eV); IBE: intrinsic bond energy (eV);
r0: bond length (A); ω0: ground state oscil-
lation frequency (cm−1); IBE, r0 and ω0 are
given for the dissociation of the dimer ground
state into higher energy atomic states (T1:
ZnO(X1Σ)→ Zn(1S) + O(1D)).
in Tab. 9.1. Cutoff parameters derived for the pure elements are denoted Rec and D
ec , while
the parameters appropriate for simulations of the compound ZnO are given in rows Rc and
Dc.
9.3. Zinc oxide
The fitting methodology requires data on cohesive energies, lattice constants, and elastic
constants of a variety of structures in order to cover a range of coordinations as wide
as possible. For zinc oxide a plethora of data from experiment and quantum mechanical
calculations is available which could be used for fitting and benchmarking the potential.
Therefore, no additional reference calculations were necessary. In order to simplify fitting
the experimentally measured hexagonal (wurtzite) elastic constants were transformed to
the cubic system (zinc blende) by means of Martin’s transformation method [193]. The
latter values were then included in the fitting database. The final parameter set is given
in Tab. 9.1.
9.3.1. Dimer properties
As the pair parameters of the ABOP are usually adjusted to dimer data, the properties of
the ZnO molecule have to be discussed first. The dimer behaves peculiarly in the way that
its ground state dissociates into excited atomic states (T1: ZnO(X1Σ)→ Zn(1S)+O(1D))
while the dissociation into the atomic ground states occurs from an excited state of the
dimer (T2: ZnO(a3Π) → Zn(1S) + O(3P)). This implies that the lowest experimentally
105

9. Bond-order potential for zinc oxide
Figure 9.1: Pauling plot for zinc oxide
comparing the analytic bond-order potential
(ABOP) with data from experiment, Hartree-
Fock (HF) and density functional theory
(DFT) calculations.
4.0
3.0
2.0
1.5
1.2
0.9
0.71.7 1.8 1.9 2.0 2.1 2.2 2.3 2.4
Bon
d en
ergy
(eV
/bon
d)
Bond length (Å)
dimer IBE
dimer EBErock salt
cesium chloride
wurtzite
zincblende
dimerexperiment
DFT−LDADFT−GGAHFABOP
determined dimer energy (associated with the extrinsic bond energy, EBE) cannot be
described by a single pair potential but corresponds to a crossing-over of the potentials
describing the transitions T1 and T2, respectively [194, 35]. For consistency only the dimer
energy, bond length and oscillation frequency are considered, which belong to transition
T1, that is the decomposition of the dimer ground state into the excited atomic states (in-
trinsic bond energy, IBE). The parameter set given in Tab. 9.1 yields very good agreement
with both the experimental as well as the quantum mechanically computed data for this
transition as show in Tab. 9.2.
9.3.2. Bulk Properties
The performance of the ABOP with respect to bulk properties is compared to experiment
and DFT calculations in Tab. 9.3. The energy difference between the wurtzite and zinc
blende structures is zero due to the neglect of long-range interactions. For the same reason
the axial ratio (c/a =√
8/3) as well as the internal relaxation parameter (u = 3/8) of
the wurtzite structure are restricted to their ideal values. Otherwise, the agreement with
respect to cohesive energies, volumes and bulk moduli is excellent. In particular, the elastic
constants of the wurtzite phase compare very well with experiment. Tab. 9.3 also compares
the elastic constants of wurtzite calculated directly with the values obtained by Martin’s
transformation method showing very good agreement throughout.
The Pauling plot in Fig. 9.1 reveals an almost perfect agreement with the Pauling re-
lation (equation (8.9)). Applying the common tangent construction to the energy-volume
106

9.3. Zinc oxide
Table 9.3.: Summary of bulk properties of zinc oxide as obtained from the analytic bond-order
potential (ABOP) in comparison with experiment and quantum mechanical calculations as well
as the shell-model potential due to Lewis and Catlow (LC) [158, 159]. Experimental data from
Refs. [71, 195, 73, 196, 197], Hartree-Fock (HF) data from Refs. [14, 198], DFT data from
Refs. [16, 14, 15, 198, 199, 200]. Elastic constants obtained by Martin’s transformation method
[193] are given in brackets. Ec: cohesive energy (eV/f.u.); ∆E: energy difference with respect to
ground-state structure (eV/f.u.); V0: equilibrium volume (A3/f.u.); a: lattice constant (A); c/a: ax-
ial ratio; u: internal parameter of wurtzite structure; B, B ′: bulk modulus (GPa) and its pressure
derivative. cij : elastic constants (GPa); c044: unrelaxed shear modulus of zinc blende structure (GPa);
ζ: Kleinman parameter [201].
Expt. ABOP Quantum-mechanical calculations LC
LDA-DFT GGA-DFT HF
zinc blende (F43m), no. 216, B3∆E 0.0a 0.015 0.013 0.052 0.097a 4.552 4.509 4.633 4.614 4.547B 145b 144 162 135 157 144B′ 4.4 4.0 3.7 3.6 3.6c11 193b 192 175c12 121b 122 129c′c 36b 36 23c44 54b 56 106c044 149ζ 0.72
wurtzite (P63mc), no. 186, B4Ec −7.52 −7.52 −9.769 −7.692 −5.658 −39.92V0 23.61d 23.59 22.874 24.834 24.570 23.46a 3.242c 3.219 3.199 3.292 3.290 3.268c/a 1.6003c 1.6330 1.6138, 1.604 1.6076 1.593 1.553u 0.3819c 0.3750 0.3790 0.3802, 0.381 0.3856 0.3920B 136 – 183 146e (144b) 162, 138, 160 134, 125 154 143B′ 3.6 – 4 4.4 4.1, 4.4 3.8 3.6 3.3c11 207, 210 212e (210b) 209 230 236c12 121 116e (117b) 85 82 112c13 106, 105 109e (108b) 95 64 105c33 210, 211 219e (220b) 270 247 188c44 43, 45 43e (41b) 46 75 74c66
c 45, 44 48e (47b) 62 74 62
adue to restriction to first neighbors.bcalculated from the hexagonal/cubic elastic constants using Martin’s transformation method (Ref-erence [193]).
ccubic: c′ = (c11 − c12)/2; hexagonal: c66 = (c11 − c12)/2.dmeasured at 20K, Reference [71].ecalculated directly.
107

9. Bond-order potential for zinc oxide
Table 9.3.: Summary of bulk properties of zinc oxide – continued from previous page.
Expt. ABOP Theory LC
LDA-DFT GGA-DFT HF
rock salt (Fm3m), no. 225, B1∆E 0.237 0.158 0.237 0.242 0.095a 4.271 – 4.283 4.275 4.229 4.345 4.225, 4.294 4.267B 170 – 228 200 206, 205 173 203, 132 192B′ 3.5 – 4 4.7 3.9, 4.9 3.7 3.6, 3.8 3.7
cesium chloride (Pm3m), no. 221, B2∆E 0.976 1.307 1.358 1.555a 2.642 2.624 2.705 2.605B 218 194 157 216B′ 5.0 4.0 3.8 3.8
Figure 9.2: Energy-volume curves for bulk
structures of zinc oxide illustrating the good
agreement between the analytic bond-order
potential (ABOP) and the reference curves
which were obtained by combining data from
experiment and first-principles calculations.
The transition pressure can be obtained from
this plot by means of the common tangent
construction which is equivalent to finding
the crossing point of the enthalpy curves.
−7.6
−7.4
−7.2
−7.0
−6.8
−6.6
−6.4
−6.2
−6.0
−5.8
16 17 18 19 20 21 22 23 24 25 26 27
Ene
rgy
(eV
/f.u
.)
Volume (Å 3/f.u.)
wurtzite/zincblende
rock salt
cesium chloride
ABOP
experiment +first−principles
curves shown in Fig. 9.2 one obtains the transition pressure for the wurtzite-rock salt trans-
formation as 10 GPa in good agreement with experimental values in the range of 8.6 to
10GPa as well as first-principles calculations predicting transition pressures between 8.6
and 14.5GPa (see Ref. [199] and references therein).
The comparison also includes the shell-model potential by Lewis and Catlow (LC) [158,
159] which due to the incorporation of electrostatic interactions is computationally much
more expensive than the ABOP. For the LC potential calculations the Gulp code [181] was
employed. The LC potential yields elastic constants in good agreement with experiment
but reveals some deficiencies in the description of the equilibrium volumes and energies of
the rock salt and zinc blende phases.
108
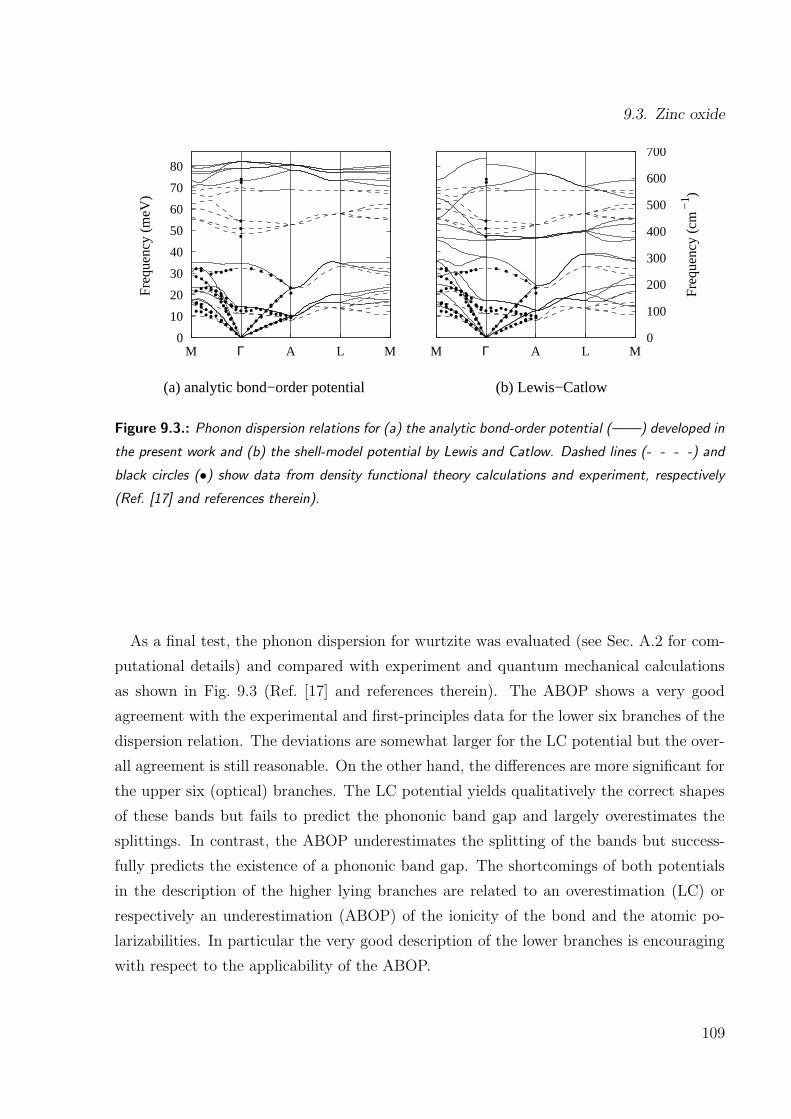
9.3. Zinc oxide
0
10
20
30
40
50
60
70
80
MM LL AA
(a) analytic bond−order potential (b) Lewis−Catlow
ΓΓ MM 0
100
200
300
400
500
600
700Fr
eque
ncy
(meV
)
Freq
uenc
y (c
m−
1 )
Figure 9.3.: Phonon dispersion relations for (a) the analytic bond-order potential (——) developed in
the present work and (b) the shell-model potential by Lewis and Catlow. Dashed lines (- - - -) and
black circles (•) show data from density functional theory calculations and experiment, respectively
(Ref. [17] and references therein).
As a final test, the phonon dispersion for wurtzite was evaluated (see Sec. A.2 for com-
putational details) and compared with experiment and quantum mechanical calculations
as shown in Fig. 9.3 (Ref. [17] and references therein). The ABOP shows a very good
agreement with the experimental and first-principles data for the lower six branches of the
dispersion relation. The deviations are somewhat larger for the LC potential but the over-
all agreement is still reasonable. On the other hand, the differences are more significant for
the upper six (optical) branches. The LC potential yields qualitatively the correct shapes
of these bands but fails to predict the phononic band gap and largely overestimates the
splittings. In contrast, the ABOP underestimates the splitting of the bands but success-
fully predicts the existence of a phononic band gap. The shortcomings of both potentials
in the description of the higher lying branches are related to an overestimation (LC) or
respectively an underestimation (ABOP) of the ionicity of the bond and the atomic po-
larizabilities. In particular the very good description of the lower branches is encouraging
with respect to the applicability of the ABOP.
109

9. Bond-order potential for zinc oxide
9.4. Zinc
Since Zn–Zn interactions are practically absent in the compound, they have to be fitted
independently of the Zn–O parameter set. Although the role of d-electrons is per-se not
taken into account in the ABOP scheme (compare Chapter 7), it has turned out that
the transition metals platinum [154] and tungsten [155] can be very well described within
the ABOP framework. While this experience is encouraging with respect to fitting a
similar potential for zinc, it must be acknowledged that the 3d-electrons in zinc have
a much more pronounced effect on the bonding behavior than in platinum or tungsten
most prominently embodied by the unusually large axial ratio of hcp-Zn. Keeping these
considerations in mind, the aim is to obtain a physically meaningful parameterization to
be used in conjunction with the Zn–O parameter set but not primarily intended to be
employed for simulations of pure zinc. It should also be recalled that in the past attempts
to model zinc using EAM and MEAM schemes have essentially failed [202, 203].
Within the ABOP scheme it turns out to be impossible to reproduce all properties equally
well with a single parameter set. In particular due to the short range of the potential it
is very difficult to reproduce the fcc-hcp energy difference (and thus the stacking fault
energy) realistically. Therefore, a reasonable fit to the energies and equilibrium volumes
of various structures was pursued accepting larger deviations in the elastic constants and
the hcp axial ratio.
The fitting database comprised data from experiment and calculations. As information
on low-coordinated structures is not available in the literature, additional density functional
theory (DFT) calculations were performed on existing and hypothetical bulk phases as
described in Sec. 9.9.1.
9.4.1. Dimer properties
The Zn2 molecule is a van-der-Waals dimer with a very low binding energy on one side and
a very large bond length on the other side. Since dispersion interactions are not taken into
account in the ABOP scheme (compare equations (8.1), (8.3), and (8.2)), no attempt was
made to fit the dimer properties; instead D0 and r0 were treated as adjustable parameters.
The final values of D0 = 0.647 eV and r0 = 2.439 A are, however, comparable in magnitude
to the Morse parameters describing the second excited state [204] (4p)1Σ+u (the first excited
state is also of the van-der-Waals type). For this state ab-initio calculations yield bond
110
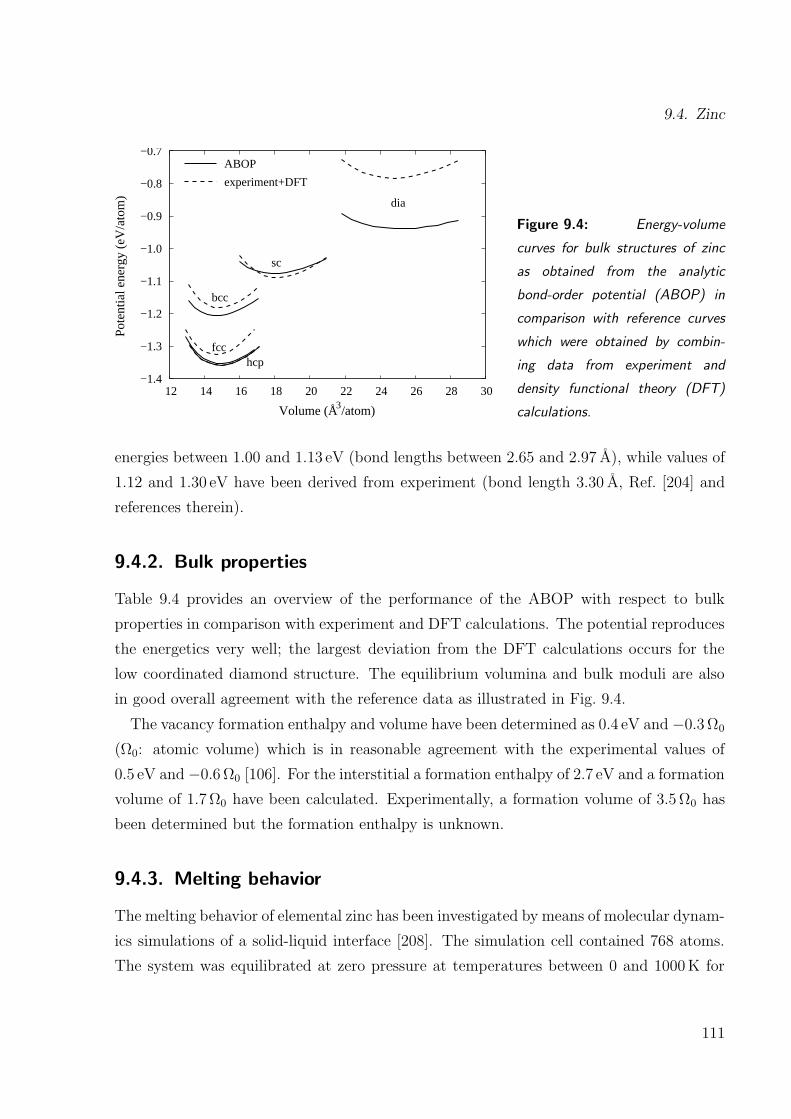
9.4. Zinc
−1.4
−1.3
−1.2
−1.1
−1.0
−0.9
−0.8
−0.7
12 14 16 18 20 22 24 26 28 30
Pote
ntia
l ene
rgy
(eV
/ato
m)
Volume (Å3/atom)
hcpfcc
bcc
dia
sc
ABOP
experiment+DFT
Figure 9.4: Energy-volume
curves for bulk structures of zinc
as obtained from the analytic
bond-order potential (ABOP) in
comparison with reference curves
which were obtained by combin-
ing data from experiment and
density functional theory (DFT)
calculations.
energies between 1.00 and 1.13 eV (bond lengths between 2.65 and 2.97 A), while values of
1.12 and 1.30 eV have been derived from experiment (bond length 3.30 A, Ref. [204] and
references therein).
9.4.2. Bulk properties
Table 9.4 provides an overview of the performance of the ABOP with respect to bulk
properties in comparison with experiment and DFT calculations. The potential reproduces
the energetics very well; the largest deviation from the DFT calculations occurs for the
low coordinated diamond structure. The equilibrium volumina and bulk moduli are also
in good overall agreement with the reference data as illustrated in Fig. 9.4.
The vacancy formation enthalpy and volume have been determined as 0.4 eV and −0.3Ω0(Ω0: atomic volume) which is in reasonable agreement with the experimental values of
0.5 eV and −0.6Ω0 [106]. For the interstitial a formation enthalpy of 2.7 eV and a formation
volume of 1.7Ω0 have been calculated. Experimentally, a formation volume of 3.5Ω0 has
been determined but the formation enthalpy is unknown.
9.4.3. Melting behavior
The melting behavior of elemental zinc has been investigated by means of molecular dynam-
ics simulations of a solid-liquid interface [208]. The simulation cell contained 768 atoms.
The system was equilibrated at zero pressure at temperatures between 0 and 1000K for
111
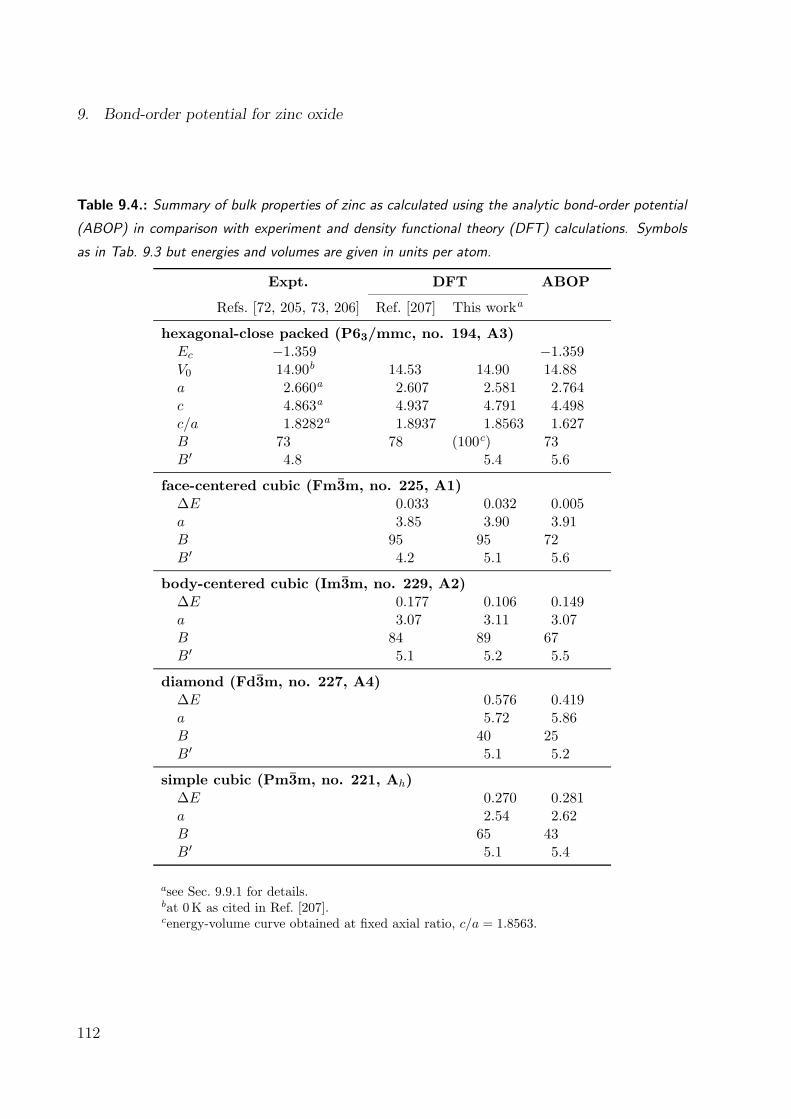
9. Bond-order potential for zinc oxide
Table 9.4.: Summary of bulk properties of zinc as calculated using the analytic bond-order potential
(ABOP) in comparison with experiment and density functional theory (DFT) calculations. Symbols
as in Tab. 9.3 but energies and volumes are given in units per atom.
Expt. DFT ABOP
Refs. [72, 205, 73, 206] Ref. [207] This worka
hexagonal-close packed (P63/mmc, no. 194, A3)Ec −1.359 −1.359V0 14.90b 14.53 14.90 14.88a 2.660a 2.607 2.581 2.764c 4.863a 4.937 4.791 4.498c/a 1.8282a 1.8937 1.8563 1.627B 73 78 (100c) 73B′ 4.8 5.4 5.6
face-centered cubic (Fm3m, no. 225, A1)∆E 0.033 0.032 0.005a 3.85 3.90 3.91B 95 95 72B′ 4.2 5.1 5.6
body-centered cubic (Im3m, no. 229, A2)∆E 0.177 0.106 0.149a 3.07 3.11 3.07B 84 89 67B′ 5.1 5.2 5.5
diamond (Fd3m, no. 227, A4)∆E 0.576 0.419a 5.72 5.86B 40 25B′ 5.1 5.2
simple cubic (Pm3m, no. 221, Ah)∆E 0.270 0.281a 2.54 2.62B 65 43B′ 5.1 5.4
asee Sec. 9.9.1 for details.bat 0K as cited in Ref. [207].cenergy-volume curve obtained at fixed axial ratio, c/a = 1.8563.
112

9.5. Oxygen
5.0
2.0
1.0
0.5
0.2
0.1
0.05
0.021.2 1.4 1.6 1.8 2.0 2.2 2.4 2.6
Bon
d en
ergy
(eV
/bon
d)
Bond length (Å)
experimentDFTABOP
C2vozone ( )
ozone(ring)
dimer
diamond
graphene
sc
fcc
bcc
Figure 9.5: Pauling plot for oxygen. The
solid line illustrates the the Pauling rela-
tion while the symbols correspond to data
from experiment, density functional theory
(DFT) and the analytic bond-order potential
(ABOP) calculations. The deviation of the
ABOP data points from the Pauling plot for
larger bond lengths is due to the penetration
of the cutoff range (Rc = 2.60 A).
at least 0.5 ns. Temperature and pressure were controlled using the Berendsen temper-
ature and pressure controls [209] with coupling constants of 100 and 200 fs, respectively.
For temperatures below 650K and above 685K either complete solidification or complete
melting was observed while for intermediate temperatures the interface was stable for at
least 2 ns. This observation agrees very well with the experimental melting point of 693K.
9.5. Oxygen‡
In order to reproduce the O2 molecule a simple pair potential would be sufficient but
then the thermodynamically most stable phase would be a close-packed structure (either
hexagonal or cubic). Here, a more general description of the bonding behavior of oxygen
is pursued.
The fitting database comprised exeperimental data on the dimer and ozone molecules
complemented by data from first-principles calculations (Sec. 9.9.2). The bond energy,
bond length and oscillation frequency of the dimer fix the parameters D0, r0 and β. The
bond angle of the ozone molecule determines h. Thus there are four parameter left to be fit-
ted. The parameter set which gave the best overall agreement with the input data is given
in Tab. 9.1. The properties calculated with the ABOP are compared in Tab. 9.5 to experi-
ment and quantum mechanical calculations. Data sets are given for two different choices of
‡This section is based on a collaboration with N. Juslin and Prof. K. Nordlund at the University of
Helsinki, Finland.
113

9. Bond-order potential for zinc oxide
Table 9.5.: Summary of properties of oxygen molecules and bulk phases calculated with the analytic
bond-order potential (ABOP) in comparison with experimental data (Refs. [72]) and quantum me-
chanical (QM) calculations (Refs. [210, 211, 212, 213, 214]). Ec: cohesive energy (eV/atom), ∆E:
energy difference with respect to oxygen dimer (eV/atom); rb: bond length (A); θ: bond angle of
ozone molecule (deg); a: lattice constant (A).
Expt. QM ABOP
Literature This worka Rc = 2.1 A Rc = 2.6 A
Dimerrb 1.21 1.22 – 1.25 1.21 1.21Ec −2.58 −2.24 – −3.07 −2.85 −2.58
Ozone, ground-state, C2v
rb 1.28 1.27 – 1.39 1.28 1.35 1.40θ 116.8 116.0 116.8 178.7∆E 0.49 0.48 – 0.67 0.47 0.50 0.83
Ozone, equilateral triangle (ring)rb 1.45 1.45 1.60∆E 0.90 – 1.13 0.98 1.43
O4 moleculerb 1.80 1.81∆E 2.26 1.81
graphene sheetrb 1.71 1.75∆E 1.60 1.60
diamond (Fd3m, no. 227, A4)a 4.40 4.46∆E 1.95 1.95
simple cubic (Pm3m, no. 221, Ah)a 2.50 2.07 2.15∆E 2.49 2.08 2.17
body-centered cubic (Im3m, no. 229, A2)a 2.91 2.43 2.76∆E 2.32 2.12 2.27
face-centered cubic (Fm3m, no. 225, A1)a 3.65 3.03 3.54∆E 2.29 2.14 2.31
asee Sec. 9.9.2 for details.
114
9.6. Point defects, thermal properties, and cutoff parameters
the cutoff parameter Rc. The first value (Rc = 2.10 A) reproduces the experimental data
for the bond angle as well as the cohesive energy of the ozone molecule but the cohesive
energies of the higher coordinated structures are systematically overestimated. The longer
cutoff (Rc = 2.60 A) yields a superior description of the higher coordinated phases but
sacrifices the ozone molecule. The good overall agreement of the oxygen-oxygen parameter
set with the reference data is further illustrated by the Pauling plot shown for Rc = 2.60 A
in Fig. 9.5.
9.6. Point defects, thermal properties, and cutoff
parameters
In chapters 4 and 5 it was shown that the geometries and the energetics of point defects
in zinc oxide result from an intricate interplay of electronic effects leading to rather com-
plicated configurations such as the oxygen dumbbell interstitials. The existence of many
different stable charge states furthermore leads to a strong dependence of the formation en-
thalpies on the Fermi level. Obviously, these complications are impossible to capture in any
analytic potential scheme, which owes its efficiency to the neglect of the electronic struc-
ture. For modeling of an ensemble of several hundred or thousand atoms, it is, however,
usually sufficient to have a reasonable description of the energetics, while defect geometries
play a minor role. Therefore, no attempt has been made to reproduce the defect structures
obtained from quantum mechanical calculations with the analytic bond-order potential.
The analytic bond-order potential scheme used in the present work employs a cutoff
function in order to scale the interaction to zero between the first and second nearest
neighbor shells. Therefore, the cutoff parameters can be varied within a certain range
without affecting the ground state properties considered during fitting (cohesive energies,
lattice parameters, elastic constants). On the other hand, the cutoff parameters do affect
other properties such as point defect formation enthalpies, melting behavior, or migration
barriers. In the past the cutoff parameters of existing potentials have been occasionally
modified in order to optimize them for certain applications, e.g., in the context of point
defect properties [215, 177] or in the study of large volumetric deformations [216].
115

9. Bond-order potential for zinc oxide
The ABOP developed in the foregoing sections was, therefore, tested with respect to
variations of the cutoff parameters. The impact on point defect formation enthalpies can
be rationalized as follows:
• The vacancy formation enthalpies are unaffected by the cutoff distances. The extent
of relaxation around the vacant site is obviously insufficient for any of the participat-
ing atoms to enter the cutoff region and/or for atoms of the same type to interact.
• The introduction of surplus zinc atoms leads to direct Zn–Zn interactions whence
the formation enthalpies of zinc interstitials and antisites are strongly dependent on
the zinc cutoff distance. The dependence is typically monotonic but discontinuous.
On the other hand their dependence on the oxygen cutoff distance is comparably
small but usually continuous. The formation enthalpies of oxygen interstitials and
antisites which involve oxygen surplus display the inverse behavior of their zinc-
surplus counterparts.
• The formation enthalpies for oxygen-surplus defects are virtually independent of the
Zn–O cutoff distance. On the other hand, the zinc-surplus defects display some
variation which can, however, not be easily rationalized as the dependence on RZn−Oc
itself is sensitive to the choice of RZn−Znc and RO−Oc .
These observations show that the formation enthalpies of zinc and oxygen-surplus point
defects (in high-symmetry positions) to some extent can be controlled independently. Va-
cancies are, however, exempt from this possibility as their formation enthalpies are in-
dependent of the cutoff distances. Note that since the ABOP is an atomistic model, it
cannot capture the Fermi level dependence of the formation enthalpies of charged defects
(see Sec. 4.2.2, Chapter 4, and Chapter 5).
Zinc oxide does not melt congruently but dissociates into liquid zinc and gaseous oxygen.
Therefore, the melting point cannot be obtained from simulations of a liquid-solid interface
(compare Sec. 9.4.3 and Ref. [208]). Simulations of single-crystalline ZnO cells, however,
show qualitatively an increase of thermal stability with increasing Zn–O cutoff distance.
In Tab. 9.1 a set of cutoff parameters is given suitable for simulations of compound
systems, which has been tested in a variety of simulations and which has also been used for
the applications presented below. Before the present potential is used in any simulation,
it is nonetheless advisable to consider the effect of the cutoff parameters explicitly with
respect to the application in mind.
116

9.7. Irradiation of bulk zinc oxide
9.7. Irradiation of bulk zinc oxide§
The behavior of materials under irradiation with energetic particles has been studied for
many decades [217, 218]. It is of major technological and fundamental importance: For
instance, in the semiconductor industry ion beams are beneficially used for dopant im-
plantation, surface structuring and to assist film deposition. In nuclear engineering, on
the other hand, it is essential to understand the detrimental effects of intense ion bom-
bardment on the performance of reactor components. In physics and materials research
energetic particles are used as analytic probes and exploited as a powerful tool to in-
vestigate the fundamental aspects of defects in solids (see discussion in Chapter 6 and
Refs. [111, 132, 219]). Since irradition with energetic particles is an efficient and control-
lable method to drive system far from equilibrium, it also allows to study for instance the
formation and the properties of metastable materials.
Since the kinetic energy of a particle impacting on a target is deposited in a small volume
(some ten nm3) during a very short period of time (some picoseconds), very large energy
densities are obtained. Such extreme conditions can induce defect concentrations, which
exceed the equilibrium concentration by orders of magnitude, and eventually can lead to
local melting or amorphization. As indicated above, particle irradiation can have both
advantageous and detrimental effects. It is, therefore, crucial to obtain a detailed under-
standing of the processes during ion bombardment. Molecular dynamics (MD) simulations
(see Sec. A.1) in conjunction with analytic potentials have proven to be a very effificient
and powerful tool in this field of research [217, 218]. Simulations of ion irradition are also
a stringent test for the applicability and transferability of a potential, since they sample
far-from-equilibrium configurations, which cannot be easily included in the fitting process,
and can furthermore reveal artificial minima of the potential function.
The threshold displacement energy measures which kinetic energy given to a lattice
atom in a certain direction is required in order to produce at least one stable lattice defect
[218, 220]. It is a fundamental quantity in irradiation physics, and the first step towards
understanding the extent and kind of damage produced by any kind of energetic particle
irradiation of a lattice [217]. The definition of this quantity is, however, not unique since the
probability to produce a defect does not always rise steeply from zero to one at a certain
energy [220]. For a more profound understanding one needs to analyze the integrated
§This section is based on a collaboration with Prof. K. Nordlund at the University of Helsinki, Finland.
117

9. Bond-order potential for zinc oxide
displacement probability function [221], i.e. the probability to form a defect at a given
energy. In order to determine this function for zinc oxide, molecular dynamics simulations
were carried out employing the analytic bond-order potential derived in this chapter (see
also Ref. [219]).
Firstly, a cell with 2280 atoms was equilibrated at 5K and zero pressure. Then a
randomly chosen atom near the center of the cell was assigned a velocity in a randomly
chosen direction equivalent to the recoil energy. The evolution of the system was followed
for 6 ps. For each recoil atom and direction the energy was successively raised starting
from 4 eV in steps of 4 eV until a defect was found. About one thousand O and Zn
(atom type and direction) combinations were simulated. Since some threshold experiments
were carried out with electron irradiation on single crystal samples in the c-axis direction,
another set of simulations was carried out with recoils directed along the positive (”Zn
face”) c-axis direction, assuming an electron beam angular spread of 15 degrees about the
[0001] direction. Due to the 4 eV step size all threshold values reported below have an
uncertainty of ±2 eV.
Voronoy polyhedron defect analysis centered on the perfect atom sites was used to de-
termine whether a defect had formed at the end of the simulation [222]. Both Voronoy
interstitials and vacancies as well as antisites were counted as defects. In addition, if the
final energy of the cell was at least 3.7 eV (the minimum energy to form a Frenkel pair)
higher than the initial one, a defect was assumed to have formed as well. Fig. 9.6 shows
the integrated displacement probability function [221], i.e. the probability to form a defect
at a given energy considering all (atom and direction) combinations which were simulated.
The figure shows that although the minimum threshold energy is about the same for both
Zn and O recoils, the defect production efficiency increases much more slowly for O recoils.
The defect production probabilities for Zn recoils along arbitrary directions and for recoils
along the c-axis are similar.
Threshold values for Zn recoils of 57 eV at 313K [223] and 56 eV at 5K [224] have
been determined from electron irradiation experiments. These studies were carried out
on ZnO single crystals in the c-axis direction. More recently using ion irradiation an
effective upper limit threshold for Zn recoils of 65 eV was determined [131]. In electron
irradiation experiments the high energy data is fit to a linear function and the threshold
energy is obtained as the intersection with the energy axis. Since at energies clearly
above the threshold, the overall damage production is determined by the average threshold
118

9.7. Irradiation of bulk zinc oxide
0 20 40 60 80 100 120 140 160 180 200
Recoil energy (eV)
0
20
40
60
80
100
Def
ect f
orm
atio
n pr
obab
ility
(%
)
O recoils, c−axisO recoilsZn recoils, c−axisZn recoils
Figure 9.6: Probability to form a
defect during a recoil event in ZnO as
a function of energy. Note that the
data illustrates specifically the prob-
ability to form at least one defect;
of course at higher energies in many
cases more than one defect is formed.
displacement energy, the electron irradiation threshold is most appropriately compared to
the average threshold energy. Note that in Ref. [224] the actual defect production data
is clearly higher than the linear fit to the lowest data points, which can be regarded as
an indication for a small defect production probability even below the average threshold,
consistent with the observations in the simulations. The present simulations give an average
threshold energy of 42 eV for all directions, and 45 eV along the c-axis direction. These
values are thus in reasonable agreement with the experimental values of <65 eV [131] and
56–57 eV [223, 224], respectively.
For oxygen recoils the experimental data is more difficult to interpret. Optical absorption
methods have not detected any defects which can be attributed to the oxygen threshold
[224] (the threshold energy interpretations reported in [225] were later disputed [223]).
Electron paramagnetic resonance and electrical measurements have detected an onset of
damage at 310 keV electron energy, corresponding to an oxygen recoil energy of 55 eV
[223]. It should be noted, however, that the maximum electron irradiation energy in this
experiment was only about 680 keV, corresponding to an O recoil energy of 155 eV. This
signal may thus be related to the low fractional defect production probabilities observed
in the simulations for oxygen recoils in the energy range 20–155 eV.
119
9. Bond-order potential for zinc oxide
9.8. Conclusions
An analytic bond-order potential for zinc oxide was derived which describes ZnO as a
predominantly covalently bonded system. It, thereby, represents the counterpart to earlier
potentials for this material which focused on the ionic character of the Zn–O bond. Since
the interatomic potential developed in this work is short-ranged it is computationally more
efficient than ionic potentials which require the evaluation of long-ranged Coulombic inter-
actions. The neglect of charges has some drawbacks in the sense that explicit electrostatic
effects which play a role for example at surfaces due to unscreened charges cannot be cap-
tured. Otherwise the ABOP provides a very good description of many properties of zinc
oxide.
The Zn–O parameterization is complemented by parameter sets for the elemental phases
of zinc and oxygen. The zinc potential yields a good description of the coordination de-
pendence of the cohesive energies. Structural and elastic properties are somewhat less well
described. The oxygen potential is capable of describing oxygen molecules as well as sev-
eral hypothetical bulk phases. Thereby, the present potential is applicable in simulations
which require a thermodynamic model for the entire Zn–O system. The transferability
of the potential has been demonstrated in one exemplary case, namely the determina-
tion of threshold displacement energies. The potential is suitable for simulating a variety
of processes and phenomena including e.g., the growth of thin films, the properties of
nanocrystalline zinc oxide, or the mechanical behavior of zinc oxide nanostructures such
as rings, wires, and belts.
9.9. Appendix: Total energy calculations
In order to apply the fitting strategy outlined previously (Chapter 8), the energy differences
and bond lengths of various bulk structures with different coordinations have to be included
in the fitting database. For zinc oxide a broad data basis is available but for zinc and
oxygen, further input was required.
9.9.1. Zinc
Singh and Papaconstantopoulos [207] calculated cohesive energies and lattice parameters of
the face-centered cubic (fcc), body-centered cubic (bcc) and hexagonal-close packed (hcp)
120
9.9. Appendix: Total energy calculations
structures based on DFT calculations using the linearized-augmented plane waves (LAPW)
method. These data were complemented with plane wave pseudopotential (PWPP) calcu-
lations on the lower coordinated simple cubic (sc) and diamond (dia) structures.
The calculations were carried out within the local-density approximation (LDA) in the
Teter-Pade parameterization [68] using the PWPP code Abinit [69, 70]. The norm-
conserving pseudopotentials due to Troullier and Martins [60] were employed including
the 3d-electrons as part of the valence. A plane wave cutoff energy of 70Hartree was used.
Brillouin zone sampling was performed employing 572 (hcp), 570 (fcc), 240 (bcc), 570 (dia)
and 220 (sc) k-points distributed on shifted Monkhorst-Pack meshes which yields a con-
vergence better than 1meV/atom. The calculated energy-volume curves shown in Fig. 9.4
were fitted to the Birch-Murnaghan equation of state [108]. The results are summarized
in Tab. 9.4. The agreement with experimental data and previous theoretical work is very
good. The systematic underestimation of the lattice constants as compared to experiment
is a well know deficiency of the LDA.
9.9.2. Oxygen¶
A wealth of experimental as well as theoretical data is available for the O2 and O3 molecules
(see e.g., Refs. [72, 210, 211, 212, 213, 214]). Additional calculations were performed on
higher coordinated molecules and bulk structures. The Castep code [226, 227] was used
to perform DFT calculations within the spin polarized generalized gradient approximation
(GGSA) based on the Perdew-Wang parameterization [25] (PW91), and the Gaussian94
code [228] for DFT calculations using the BLYP [52] and B3LYP [53] functionals as well
as for Hartree-Fock calculations. Preliminary tests proved the GGSA-PW91 DFT method
to be reliable whence it was selected for the further computations.
For the calculations ultrasoft pseudopotentials were used employing a plane wave cutoff
energy of 380 eV (norm-conserving pseudopotentials were also considered and gave basically
identical results); finite basis set corrections were included to compensate for imperfect
Brillouin zone sampling. The number of k-points was chosen to obtain convergence of the
total energy better than 15meV/atom. Using these parameters the relaxed structures and
cohesive energies of several molecules and bulk structures were computed. In the case of the
¶This section is based on a collaboration with N. Juslin and Prof. K. Nordlund at the University of
Helsinki, Finland.
121
9. Bond-order potential for zinc oxide
O3 molecule the ground state as well as the equilateral triangle geometry, which is known to
be a local minimum on the potential energy surface (see e.g., Ref. [214]), were considered.
For the O4 molecule the tetrahedron geometry was considered. The higher-coordinated
structures comprised graphene as well as diamond, sc, bcc, and fcc. The data is shown in
Tab. 9.5. Where comparison is possible the DFT data computed in the present work is in
very good agreement with experiment and previous quantum mechanical calculations.
122

Conclusions
The present dissertation combines quantum mechanical and atomistic simulation tech-
niques with thermodynamic concepts to elucidate both static and dynamic properties of
intrinsic point defects in zinc oxide.
In the first part, by using quantum mechanical calculations based on density functional
theory, it has been shown that in the ground state oxygen interstitials assume dumbbell
configurations and can occur both in negative as well as positive charge states depending
on the Fermi level. This extends considerably the established picture, which presumes
oxygen interstitials to be acceptors occupying highly symmetric octahedral interstitial sites.
The oxygen vacancy displays significant geometric relaxation as the charge state varies,
compatible with a deep-level character.
The shortcomings due to an insufficient treatment of the Zn-3d levels within the local
density (LDA) and generalized gradients (GGA) approximations as well as the limitations
of the supercell approach have been remedied by applying semi-empirical self-interaction
corrections (GGA+U scheme) and extensive finite-size scaling. In comparison to earlier
works, the reliability of the calculated formation enthalpies and transition levels is signifi-
cantly improved. In addition, point defect formation volumes are derived, which have not
been considered in zinc oxide so far.
In the past, experimental studies on the self-diffusion in zinc oxide provided very scat-
tered data and did not succeed in resolving the character of the diffusing species. In the
present work, by combining density functional theory calculations with thermodynamic
principles this long standing issue has been resolved. For oxygen, vacancy and interstitialcy
mechanisms dominate under zinc and oxygen-rich conditions, respectively. This finding re-
futes the belief that oxygen vacancy mechanisms can be operational in experiments in
oxygen-rich atmosphere under equilibrium conditions. With regard to the diffusion of zinc
123
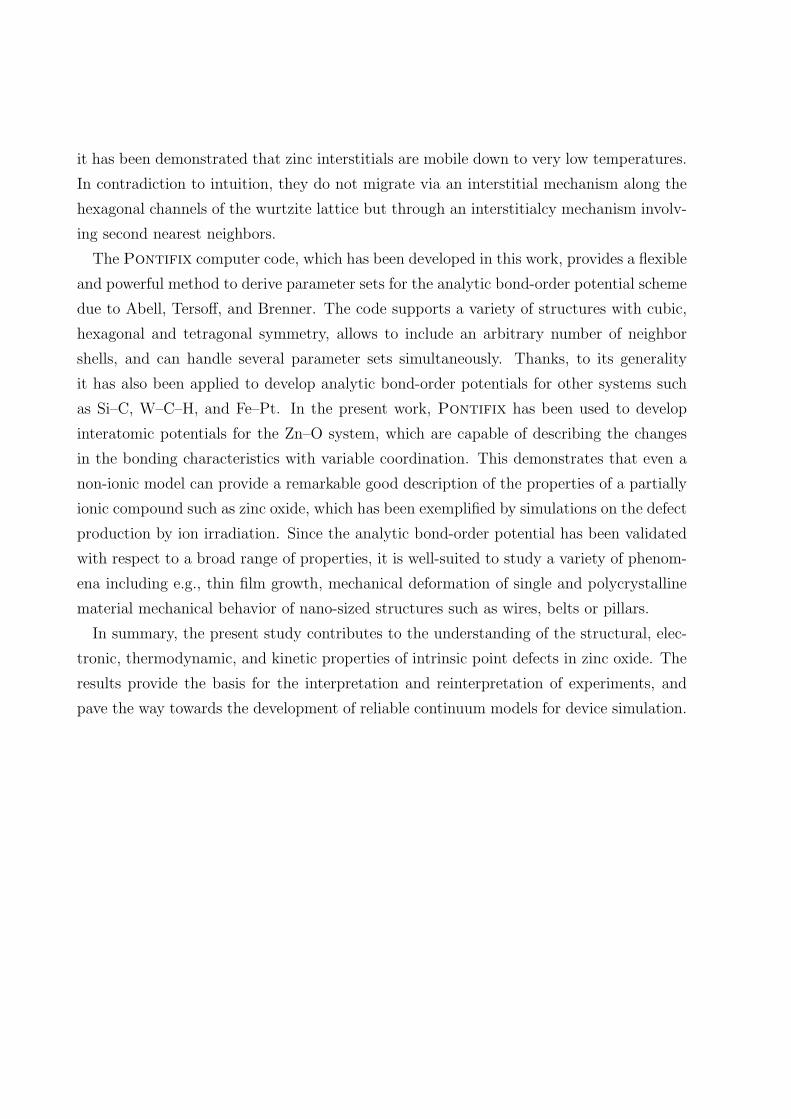
it has been demonstrated that zinc interstitials are mobile down to very low temperatures.
In contradiction to intuition, they do not migrate via an interstitial mechanism along the
hexagonal channels of the wurtzite lattice but through an interstitialcy mechanism involv-
ing second nearest neighbors.
The Pontifix computer code, which has been developed in this work, provides a flexible
and powerful method to derive parameter sets for the analytic bond-order potential scheme
due to Abell, Tersoff, and Brenner. The code supports a variety of structures with cubic,
hexagonal and tetragonal symmetry, allows to include an arbitrary number of neighbor
shells, and can handle several parameter sets simultaneously. Thanks, to its generality
it has also been applied to develop analytic bond-order potentials for other systems such
as Si–C, W–C–H, and Fe–Pt. In the present work, Pontifix has been used to develop
interatomic potentials for the Zn–O system, which are capable of describing the changes
in the bonding characteristics with variable coordination. This demonstrates that even a
non-ionic model can provide a remarkable good description of the properties of a partially
ionic compound such as zinc oxide, which has been exemplified by simulations on the defect
production by ion irradiation. Since the analytic bond-order potential has been validated
with respect to a broad range of properties, it is well-suited to study a variety of phenom-
ena including e.g., thin film growth, mechanical deformation of single and polycrystalline
material mechanical behavior of nano-sized structures such as wires, belts or pillars.
In summary, the present study contributes to the understanding of the structural, elec-
tronic, thermodynamic, and kinetic properties of intrinsic point defects in zinc oxide. The
results provide the basis for the interpretation and reinterpretation of experiments, and
pave the way towards the development of reliable continuum models for device simulation.
Outlook
It has been demonstrated that density functional theory provides a robust framework which
does not only allow to study the geometrical and electronic structure but also to derive
thermodynamic or even kinetic quantities. The approach which has been pursued in the
present study, is, therefore, currently being applied to other oxide materials such as barium
titanate and tin-doped indium oxide.
With respect to zinc oxide, there are still many aspects which deserve further investiga-
tion: In the present study of point defects entropic effects were entirely neglected based
on the argument that – compared to the energy – the entropy term represents a secondary
contribution to the free enthalpy (see Sec. 4.2.2 and Sec. 6.2). It would be interesting to
determine the entropies of formation and migration in order to validate this presumption
and to improve the quantitative reliability of the first-principles data. To this end, one
would need to compute the spectrum of vibration frequencies using e.g., the dynamical
matrix approach (see Sec. A.2 and Ref. [78]). If the eigenfrequency spectra for both the
ground and the transition state are known, it is furthermore straight-forward to calculate
the attempt frequency (Γ0 in equation (6.7)) by means of the Vineyard equation [126].
While the ideal surfaces of zinc oxide have already been explored theoretically in some
detail [12, 229, 230, 231, 232, 233], little is known about the interaction between surfaces
and defects and in particular the mechanisms by which defects are incorporated or re-
moved. In this respect, it is also of interest to investigate the interaction of various atomic
and molecular species with surfaces. Since zinc oxide possesses both polar and non-polar
surfaces with different terminations, intriguing interactions between surface dipoles and
defect induced multipoles can be expected.
Already several first-principles studies addressed the role of extrinsic defects in zinc oxide
(e.g., H [63, 234, 235], N [21, 83, 84], Li [122], Mn, Co [236]), predominantly with the in-
125

tention to provide explanations and solutions for the difficulties to grow p-type zinc oxide.
Still many open questions remain, in particular it would be instructive to study the for-
mation of defect complexes, also taking into account the oxygen interstitial configurations
discussed in Chapter 4, and to include a larger variety of dopants – most importantly Al,
Ga, and As. One would need to characterize the electronic structure of these impurities
as well as the defect induced transition levels. It has been demonstrated for the case of
Li that different sites are preferred depending on the charge state and thus on the Fermi
level. In this context the role of the d-electrons of both Zn and the dopant species deserves
special attention. The next step would be to derive the mobilities of the individual defects
and elucidate the effect of complex formation.
It is also worthwhile to consider the interfaces in zinc oxide. Starting from high-symmetry
grain boundaries it would be desirable to develop a profound understanding of the structure
and the distribution of grain boundaries, which would have implications especially with
respect to the understanding of nanocrystalline zinc oxide. In this respect, the analytic
bond-order potential developed in this work would be helpful. By opposing the results
obtained with the purely covalent analytic bond-order model with purely ionic potentials
[237, 135], one could furthermore obtain insights into the competition between covalent and
ionic bonding. Similarly, analytic interatomic potentials could be used to study various
nanostructures of zinc oxide. The first studies in this direction have been published recently
[238, 239].
For most of the problems outlined above experiments can provide only very indirect if any
insight. One possible route has been demonstrated for hydrogen in ZnO: First-principles
calculations [235] have shown that the vibrational modes of different configurations for the
hydrogen interstitial are differentiated by their pressure dependence. By monitoring the
pressure dependence of vibrational modes by means of Raman spectroscopy it was, thereby,
possible to reveal the actual position of hydrogen in ZnO. For intrinsic defects such an
approach is impractical because the vibrational modes of intrinsic defects can practically
not be isolated from the regular modes. On the other hand, it might be possible a similar
strategy for dopants with small atomic mass.
As described in Chapter 5, knowledge of the formation volumes and energies allows to
derive the pressure dependence of the transition levels and the defect concentrations. Based
on the calculations, different trends for the pressure dependence of the transition levels of
the oxygen vacancy and the zinc interstitial were obtained. It would be very interesting

to test this prediction experimentally. Furthermore, it could be fruitful to explore the
possibilities for controlling defect concentrations via application of stress.


A. Appendix: Methods
This chapter gives a concise description of the molecular dynamics simulation
technique and the determination of phonon dispersion relations using dynamical
matrices and the harmonic approximation. Finally, the external codes utilized in
this work are summarized.
A.1. Molecular dynamics simulations
Studying the dynamics of an ensemble of atoms (or more general point-like particles) is
equivalent to finding solutions of Newton’s equation F = ma. The mutual dependence of
the atomic trajectories is described by a set of coupled differential equations
mi∂2ri∂t2
= F i (rj) , i = 1 . . . N, (A.1)
where mi and ri are the mass and position of particle i and F i is the force acting on it.
For more than three atoms (N > 3) analytical solutions do not exist and one must resort
to a numerical method. The scheme, which, for historical reasons, is known as molecular
dynamics [240] (MD), discretize the set of equations (A.1) and solves them iteratively using
a small finite increment ∆t (the timestep). The principle steps in a MD simulation are
shown in the flow chart of Fig. A.1.
The most important input to any MD simulation is the force field which is obtained as
the gradient of the scalar potential
F i (rj) = −∇riV (rj) . (A.2)
Density functional theory (DFT, Chapter 3) or tight-binding (TB) schemes provide the
most accurate and reliable energies but they are computationally very expensive. There-
fore, analytic potentials, which are computationally much more efficient, are employed the
most often. A detailed review of analytic potential schemes is given in Chapter 7.
129

A. Appendix: Methods
Figure A.1: Flow chart showing the most
important steps during a molecular dynam-
ics simulation.
Integrate the equationsof motion over a short timestep
Calculate Forces
positions and velocitiesProvide initial
δ tt t +
Finalize simulation
Calculate physical quantities(temperature, stress tensor etc.)
maxIs t > t ?No
Yes
A.2. Phonon dispersion relations
The phonon dispersion describes the distribution of phonon frequencies over the phonon
wave vectors in the irreducible wedge of the Brillouin zone. Experimentally, phonon dis-
persion relations are typically measured by Raman and infrared (IR) spectroscopy as well
as neutron scattering. Theoretically, the most common methods are the frozen phonon
and the dynamical matrix [241] approach. In the present work, the latter method was
employed.
Essentially, the calculation of phonon dispersion relations from dynamical matrices can
be split into three parts: (1) At first, the force constant matrix is evaluated. It is defined
as the mixed derivative of the energy with respect to atomic displacements, uiα
ΦΠiα,Φjβ =∂2E
∂uiα∂ujβ(A.3)
where Π and Φ denote the cell index, i and j denote atoms in the primitive unit cell, and
α and β label the Cartesian directions. (2) Then, the dynamical matrix Diα,jβ at the wave
130

A.3. Overview of external codes
vector q is obtained by summation over all unit cells and Fourier transformation of the
force constant matrix according to [241]
Diα,jβ =∑
Π
∑
Φ
ΦΠiα,Φjβ exp[iq(rΠiα − rΦjβ)]. (A.4)
(3) Finally, the dynamical matrix is diagonalized. The eigenvalues are the desired phonon
frequencies at the respective wave vector.
As part of the present work a code was developed which implements this scheme for sev-
eral analytic potential schemes including analytic bond-order and embedded atom method
potentials.
A.3. Overview of external codes
A.3.1. Abinit
Abinit implements the plane wave-pseudopotential (PWPP) approach to density func-
tional theory (DFT). It relies on an efficient Fast Fourier Transform algorithm [242] for
the conversion of wavefunctions between real and reciprocal space, on the adaptation to
a fixed potential of the band-by-band conjugate gradient method [57] and on a potential-
based conjugate-gradient algorithm for the determination of the self-consistent potential
[243]. The Abinit code was used in generating the results presented in Sec. 9.9 and Chap-
ter 4. The Abinit code is a common project of the Universite Catholique de Louvain,
Corning Incorporated, and other contributors (http://www.abinit.org).
A.3.2. Vasp
The Vienna ab-initio simulation package (Vasp) [103] is another implementation of the
PWPP approach to DFT. It features ultrasoft pseudopotentials [61] and the projector
augmented plane wave (PAW) method [62, 104]. G. Henkelman, H. Jonsson, and coworkers
[129] implemented a number of additional algorithms into Vasp which permit to employ
e.g., the nudged elastic band [124, 125] (NEB) or the dimer [128] method. Results obtained
using the Vasp code are shown in Chapter 5 and Chapter 6. Vasp was coded by G. Kresse
and J. Furthmuller at the University of Vienna and is commercially distributed.
131

A. Appendix: Methods
A.3.3. Gulp
The general utility lattice program (Gulp) implements various analytic force fields and
potentials. It provides capabilities for performing structure optimization as well as molec-
ular dynamics simulations. Gulp was used to perform benchmark calculations with the
shell-model potential by Lewis and Catlow [159] as reported in Sec. 9.3.2. Gulp was de-
veloped by J. Gale at the Imperial College, London. The code is available free of charge
for researchers in academic environments.
132

Danksagung – Acknowledgments
Ohne die Hilfe einer ganzen Reihe von Menschen ware mir die Erstellung der vorliegenden
Arbeit nicht moglich gewesen.
Insbesondere mochte ich mich bei Professor Karsten Albe fur das Thema und den Titel
dieser Arbeit, sein Vertrauen und seine kontinuierliche Unterstutzung wahrend der letzten
Jahre bedanken.
Bei Professor von Seggern bedanke ich mich fur die Ubernahme des Koreferats.
Meinen Eltern gilt ebenso mein Dank wie meiner Schwester Lisa. Min flickvan Petra
Traskelin tackar jag for hennes fortrosta, stod och motivation.
Dr. Andreas Klein schulde ich Dank ich fur wichtige Anregungen und zahlreiche hilf-
reichen Diskussionen.
Kai Nordlund and Niklas Juslin contributed to sections 6.4 and 9.7 of this work and
have warmthly hosted me at the University of Helsinki.
I am very grateful to Eduardo Bringa, Babak Sadigh and Vasily Bulatov at Lawrence
Livermore National Laboratory for their continuous interest and support throughout the
last four years.
Bei Michael Muller sowie die Mitgliedern des Gemeinschaftslabors Nanomaterialien und
der ehemaligen Arbeitsgruppe ,,Dunne Schichten” Thorsten Enz, Jens Ellrich, Hermann
Sieger, Holger Schmitt, Sebastian Gottschalk, Johannes Seydel und Renate Hernichel be-
danke ich mich fur viele Mittagessen, Kaffeepausen, Diskussionen und gemeinsame Abende.
Ebenso gilt Nina Balke, Johannes Luschitz, Verena Liebau-Kunzmann, Ralf Theissmann
und Jean-Christophe Jaud mein Dank fur verschiedene Gelegenheiten, die Arbeit in den
richtigen Zusammenhang zu stellen.
I also would like to thank G. Henkelman, H. Jonsson, and coworkers for kindly providing
their VASP extensions (http://theory.cm.utexas.edu/henkelman).
133

This work was funded by the Sonderforschungsbereich 595 “Fatigue in functional materi-
als” of the Deutsche Forschungsgemeinschaft. The project was partially supported through
a bilateral travel program funded by the German foreign exchange server (DAAD). Gener-
ous grants of computer time by the Center for Scientific Computing at the JohannWolfgang
Goethe-University, Frankfurt/Main are gratefully acknowledged.
Erklarung – Disclaimer
Die vorliegende Arbeit wurde im Zeitraum von August 2003 bis Mai 2006 im Fachgebiet
Materialmodellierung am Institut fur Materialwissenschaft der Technischen Universitat
Darmstadt bei Herrn Prof. Dr. rer. nat. Karsten Albe angefertigt.
Hiermit versichere ich an Eides statt, daß ich die vorliegende Arbeit selbststandig und nur
unter Verwendung der angegebenen Hilfsmittel angefertigt habe. Von mir wurde weder
an der Technischen Universitat Darmstadt noch an einer anderen Hochschule ein Promo-
tionsversuch unternommen.
Darmstadt, den 18. Mai 2006
Paul Erhart
135


Curriculum Vitae
Education
High School Graduation (Abitur),
Heinrich-Mann-Schule, Dietzenbach, Germany, May 1997
Academic year,
University of Illinois, Urbana-Champaign, USA, August 2001–June 2002
Diploma in Materials Science and Engineering (Dipl.-Ing.),
Technische Universitat Darmstadt, Germany, June 2003
Research experience
Research assistant (20 months),
Technische Universitat Darmstadt, Germany, 2000–2003
Research assistant (10 months),
University of Illinois, Urbana-Champaign, 2001–2002
Scholar of Computational Materials Science and Chemistry Summer Institute,
Lawrence Livermore National Laboratory, USA, June 2002–August 2002
Visiting scientist (3 months),
Lawrence Livermore National Laboratory, July 2003–August 2003, April 2004
Visiting scientist (4 months),
University of Helsinki, several visits since October 2002
Research scientist, PhD student,
Technische Universitat Darmstadt, Germany, since August 2003
137

Publications based on the present dissertation
1. P. Erhart and K. Albe, Pontifix/Pinguin: A program package for fitting inter-
atomic potentials of the bond-order type, submitted to Comp. Mater. Sci.
2. P. Erhart, N. Juslin, O. Goy, K. Nordlund, R. Muller and K. Albe, Analytic
bond-order potential for atomistic simulations of zinc oxide, J. Phys. Condens.
Matter. 18, 6585 (2006).
3. P. Erhart and K. Albe, Diffusion of zinc vacancies and interstitials in zinc oxide,
Appl. Phys. Lett. 88, 201918 (2006).
4. P. Erhart, K. Albe and A. Klein, First-principles study of intrinsic point defects
in ZnO: Role of band structure, volume relaxation and finite size effects, Phys.
Rev. B 73, 205203 (2006).
5. P. Erhart and K. Albe, First-principles study of migration mechanisms and dif-
fusion of oxygen in zinc oxide, Phys. Rev. B, 73, 115207 (2006).
6. P. Erhart, A. Klein, and K. Albe, First-principles study of the structure and
stability of oxygen defects in zinc oxide, Phys. Rev. B 72, 085213 (2005).
Other publications
1. P. Traskelin, N. Juslin, P. Erhart, and K. Nordlund, Hydrogen bombardment
simulations of tungsten-carbide surfaces, submitted to Phys. Rev. B.
2. N. Juslin, P. Erhart, P. Traskelin, J. Nord, K. Henriksson, E. Salonen, K. Nord-
lund, and K. Albe, Analytical interatomic potential for modeling nonequilibrium
processes in the W–C–H system, J. Appl. Phys. 98, 123520 (2005).
3. P. Erhart and K. Albe, Molecular dynamics simulations of gas phase condensa-
tion of silicon carbide nanoparticles, Adv. Eng. Mater. 10, 937 (2005).
4. L. P. Davila, P. Erhart, E. M. Bringa, M. A. Meyers, V. A. Lubarda, M. S.
Schneider, R. Becker, and M. Kumar, Atomistic modeling of shock-induced void
collapse in copper, Appl. Phys. Lett. 86, 161902 (2005).
5. P. Erhart, E. Bringa, M. Kumar, and K. Albe, Atomistic mechanism of shock-
induced void collapse in nanoporous metals, Phys. Rev. B 72, 052104 (2005).
6. P. Erhart and K. Albe, Analytical potential for atomistic simulations of silicon,
carbon and silicon carbide, Phys. Rev. B 71, 035211 (2005).
7. E. Bringa, J. U. Cazamias, P. Erhart, J. Stolken, N. Tanushev, B. D. Wirth, R. E.
Rudd, and M. J. Caturla, Atomistic shock Hugoniot simulation of single-crystal
copper, J. Appl. Phys., 96, 3793 (2004).
8. P. Erhart and K. Albe, The role of thermostats in modeling vapor phase conden-
sation of silicon nanoparticles, Appl. Surf. Sci. 226, 12 (2004).
9. J. Nord, K. Albe, P. Erhart and K. Nordlund, Modelling of compound semi-
conductors: Analytical bond-order potential for gallium, nitrogen and gallium
nitride, J. Phys.: Condens. Matter 15, 5649 (2003).


Bibliography
[1] P. Erhart and K. Albe, Pontifix/Pinguin: A program package for fitting in-
teratomic potentials of the bond-order type, submitted to Comp. Mater. Sci.,
http://www.mm.mw.tu-darmstadt.de/.
[2] P. Erhart, N. Juslin, O. Goy, K. Nordlund, R. Muller and K. Albe, Analytic bond-
order potential for atomistic simulations of zinc oxide, J. Phys.: Condens. Matter
18, 6585 (2006).
[3] P. Erhart and K. Albe, Diffusion of zinc vacancies and interstitials in zinc oxide,
Appl. Phys. Lett. 88, 201918 (2006).
[4] P. Erhart, K. Albe and A. Klein, First-principles study of intrinsic point defects in
ZnO: role of band structure, volume relaxation and finite size effects, Phys. Rev. B
73, 205203 (2006).
[5] P. Erhart and K. Albe, First-principles study of migration mechanisms and diffusion
of oxygen in zinc oxide, Phys. Rev. B 73, 115207 (2006).
[6] P. Erhart, A. Klein and K. Albe, First-principles study of the structure and stability
of oxygen defects in zinc oxide, Phys. Rev. B 72, 085213 (2005).
[7] K. Ellmer, Magnetron sputtering of transparent conductive zinc oxide: relation be-
tween the sputtering parameters and the electronic properties, J. Phys. D 33, R17
(2000).
[8] D. C. Look, B. Claflin, Y. I. Alivov and S. J. Park, The future of ZnO light emitters,
Phys. Status Solidi A 201, 2203 (2004).
141

Bibliography
[9] U. Ozgur, Y. I. Alivov, C. Liu, A. Teke, M. Reshchikov, S. Dogan, V. Avrutin, S. J.
Cho and H. Morkoc, A comprehensive review of ZnO and related devices, J. Appl.
Phys. 98, 041301 (2005).
[10] Z. W. Pan, Z. R. Dai and Z. L. Wang, Nanobelts of Semiconducting Oxides, Science
291, 1947 (2001).
[11] M. H. Huang, S. Mao, H. Feick, H. Yan, Y. Wu, H. Kind, E. Weber, R. Russo and
P. Yang, Room-Temperature Ultraviolet Nanowire Nanolasers, Science 292, 1897
(2001).
[12] J. E. Jaffe, N. M. Harrison and A. C. Hess, Ab-initio study of ZnO (10 1 0 ) surface
relaxation, Phys. Rev. B 49, 11153 (1994).
[13] G. Kresse, O. Dulub and U. Diebold, Competing stabilization mechanism for the
polar ZnO(0001)-Zn surface, Phys. Rev. B 68, 245409 (2003).
[14] J. E. Jaffe and A. C. Hess, Hartree-Fock study of phase changes in ZnO at high
pressure, Phys. Rev. B 48, 7903 (1993).
[15] J. E. Jaffe, J. A. Snyder, Z. Lin and A. C. Hess, LDA and GGA calculations for
high-pressure phase transitions in ZnO and MgO, Phys. Rev. B 62, 1660 (2000).
[16] R. Ahuja, L. Fast, O. Eriksson, J. M. Wills and B. Johansson, Elastic and high
pressure properties of ZnO, J. Appl. Phys. 83, 8065 (1998).
[17] J. Serrano, A. H. Romero, F. J. Manjon, R. Lauck, M. Cardona and A. Rubio,
Pressure dependence of the lattice dynamics of ZnO: An ab initio approach, Phys.
Rev. B 69, 094306 (2004).
[18] A. F. Kohan, G. Ceder, D. Morgan and C. G. Van de Walle, First-principles study
of native point defects in ZnO, Phys. Rev. B 61, 15019 (2000).
[19] S. B. Zhang, S. H. Wei and A. Zunger, Intrinsic n-type versus p-type doping asym-
metry and the defect physics of ZnO, Phys. Rev. B 63, 075205 (2001).
[20] F. Oba, S. R. Nishitani, S. Isotani, H. Adachi and I. Tanaka, Energetics of native
defects in ZnO, J. Appl. Phys. 90, 824 (2001).
142

Bibliography
[21] E.-C. Lee, Y.-S. Kim, Y.-G. Jin and K. J. Chang, Compensation mechanism for N
acceptors in ZnO, Phys. Rev. B 64, 085120 (2001).
[22] S. Lany and A. Zunger, Anion vacancies as a source of persistent photoconductivity
in II-VI and chalcopyrite semiconductors, Phys. Rev. B 72, 035215 (2005).
[23] A. Janotti and C. G. Van de Walle, Oxygen vacancies in ZnO, Appl. Phys. Lett. 87,
122102 (2005).
[24] R. O. Jones and O. Gunnarsson, The density functional formalism, its applications
and prospects, Rev. Mod. Phys. 61, 689 (1989).
[25] J. P. Perdew, in Electronic structure of solids, edited by P. Ziesche and H. Eschrig
(Akademie Verlag, Berlin, 1991), Vol. 11.
[26] V. I. Anisimov, J. Zaanen and O. K. Andersen, Band theory and Mott insulators:
Hubbard U instead of Stoner I, Phys. Rev. B 44, 943 (1991).
[27] K. Eda, A. Iga and M. Matsuoka, Degradation mechanism of non-Ohmic zinc oxide
ceramics, J. Appl. Phys. 51, 2678 (1980).
[28] T. K. Gupta, W. G. Carlson and P. L. Hower, Current instability phenomena in ZnO
varistors under a continuous ac stress, J. Appl. Phys. 52, 4104 (1981).
[29] T. K. Gupta and W. Carlson, A grain-boundary defect model for instability of a ZnO
varistor, J. Mater. Sci. 20, 3487 (1985).
[30] M. Ramanachalam, A. Rohatgi, J. Schaffer and T. K. Gupta, Characterization of
ZnO varistor degradation using lifetime positron-annihilation spectroscopy, J. Appl.
Phys. 69, 8380 (1991).
[31] C. Coskun, D. C. Look, G. C. Farlow and J. R. Sizelove, Radiation hardness of ZnO
at low temperatures, Semicond. Sci. Technol. 19, 752 (2004).
[32] G. C. Abell, Empirical chemical pseudopotential theory of molecular and metallic
bonding, Phys. Rev. B 31, 6184 (1985).
[33] J. Tersoff, New empirical approach for the structure and energy of covalent systems,
Phys. Rev. B 37, 6991 (1988).
143

Bibliography
[34] A. I. Boldyrev and J. Simons, Ab initio study of the bonding of zinc atoms to first-
and second-row main group atoms, Mol. Phys. 92, 365 (1997).
[35] C. W. Bauschlicher, Jr. and H. Partridge, A comparison of ZnO and ZnO−, J. Chem.
Phys. 109, 8430 (1998).
[36] D. M. Ceperley and B. J. Alder, Ground State of the Electron Gas by a Stochastic
Method, Phys. Rev. Lett. 45, 566 (1980).
[37] J. C. Grossman and L. Mitas, Family of low-energy elongated Sin (n ≤ 50) clusters,
Phys. Rev. B 52, 16735 (1995).
[38] L. Mitas, J. C. Grossman, I. Stich and J. Tobik, Silicon clusters of intermediate size:
energetics, dynamics, and thermal effects, Phys. Rev. Lett. 84, 1479 (2000).
[39] W.-K. Leung, R. J. Needs, G. Rajagopal, S. Itoh and S. Ihara, Calculations of Silicon
Self-Interstitial Defects, Phys. Rev. Lett. 83, 2351 (1999).
[40] R. Q. Hood, P. R. C. Kent, R. J. Needs and P. R. Briddon, Quantum Monte Carlo
Study of the Optical and Diffusive Properties of the Vacancy Defect in Diamond,
Phys. Rev. Lett. 91, 076403 (2003).
[41] R. G. Parr andW. Yang, Density-Functional Theory of Atoms and Molecules (Oxford
University Press, New York, 1989).
[42] C. M. Goringe, D. R. Bowler and E. Hernandez, Tight-binding modelling of materials,
Rep. Prog. Phys. 60, 1447 (1997).
[43] J. Jacobsen, B. H. Cooper and J. P. Sethna, Simulations of energetic beam deposition:
from picoseconds to seconds, Phys. Rev. B 58, 15847 (1998).
[44] M. R. Sørensen and A. F. Voter, Temperature-accelerated dynamics for simulation of
infrequent events, J. Chem. Phys. 112, 9599 (2000).
[45] A. F. Voter, F. Montalenti and T. C. Germann, Extending the Time Scale in Atom-
istic Simulation of Materials, Annu. Rev. Mat. Sci. 32, 321 (2002).
[46] E. B. Tadmor, M. Ortiz and R. Phillips, Quasicontinuum analysis of defects in solids,
Phil. Mag. A 73, 1529 (1996).
144

Bibliography
[47] E. B. Tadmor, R. Phillips and M. Ortiz, Mixed Atomistic and Continuum Models of
Deformation in Solids, Langmuir 12, 4529 (1996).
[48] J. Knap and M. Ortiz, An analysis of the quasicontinuum method, J. Mech. Phys.
Solids 49, 1899 (2001).
[49] G. Csanyi, T. Albaret, M. C. Payne and A. De Vita, “Learn on the fly”: A Hybrid
Classical and Quantum Mechanical Molecular Dynamics Simulation, Phys. Rev. Lett.
93, 175503 (2004).
[50] P. Hohenberg and W. Kohn, Inhomogeneous Electron Gas, Phys. Rev. 136, B864
(1964).
[51] W. Kohn and L. J. Sham, Self-Consistent Equations Including Exchange and Corre-
lation Effects, Phys. Rev. 140, A1133 (1965).
[52] C. Lee, W. Yang and R. G. Parr, Development of the Colle-Salvetti correlation-energy
formula into a functional of the electron density, Phys. Rev. B 37, 785 (1988).
[53] A. D. Becke, Density-functional thermochemistry. III. The role of exact exchange, J.
Chem. Phys. 98, 5648 (1993).
[54] S. L. Dudarev, G. A. Botton, S. Y. Savrasov, C. J. Humphreys and A. P. Sutton,
Electron-energy-loss spectra and the structural stability of nickel oxide: An LSDA+U
study, Phys. Rev. B 57, 1505 (1998).
[55] I. V. Solovyev, P. H. Dederichs and V. I. Anisimov, Corrected atomic limit in the
local-density approximation and the electronic structure of d impurities in Rb, Phys.
Rev. B 50, 16861 (1994).
[56] A. I. Liechtenstein, V. I. Anisimov and J. Zaanen, Density-functional theory and
strong interactions: Orbital ordering in Mott-Hubbard insulators, Phys. Rev. B 52,
R5467 (1995).
[57] M. C. Payne, M. P. Teter, D. C. Allan, T. A. Arias and J. D. Joannopoulos, Iterative
minimization techniques for ab initio total-energy calculations: molecular dynamics
and conjugate gradients, Rev. Mod. Phys. 64, 1045 (1992).
145

Bibliography
[58] N. W. Ashcroft and N. D. Mermin, Solid State Physics (Saunders College, Fort
Worth, 1976).
[59] H. J. Monkhorst and J. D. Pack, Special points for Brillouin-zone integrations, Phys.
Rev. B 13, 5188 (1976).
[60] N. Troullier and J. L. Martins, Efficient pseudopotentials for plane-wave calculations,
Phys. Rev. B 43, 1993 (1991).
[61] D. Vanderbilt, Soft self-consistent pseudopotentials in a generalized eigenvalue for-
malism, Phys. Rev. B 41, 7892 (1990).
[62] P. E. Blochl, Projector augmented-wave method, Phys. Rev. B 50, 17953 (1994).
[63] C. G. Van de Walle, Defect analysis and engineering in ZnO, Physica B 308–310,
899 (2001).
[64] S. B. Zhang, S.-H. Wei and A. Zunger, A phenomenological model for systemization
and prediction of doping limits in II-VI and I-III-VI2 compounds, J. Appl. Phys. 83,
3192 (1998).
[65] H. Moormann, D. Kohl and G. Heiland, Work function and band bending on clean
cleaved zinc oxide surfaces, Surf. Sci. 80, 261 (1979).
[66] S. Trasatti, The ”absolute” electrode potential: The end of the story, Electrochimica
Acta 35, 269 (1990).
[67] S. Limpijumnong, S. B. Zhang, S.-H. Wei and C. H. Park, Doping by Large-Size-
Mismatched Impurities: The Microscopic Origin of Arsenic- or Antimony-Doped
p-Type Zinc Oxide, Phys. Rev. Lett. 92, 155504 (2004).
[68] S. Goedecker, M. Teter and J. Hutter, Separable dual-space Gaussian pseudopoten-
tials, Phys. Rev. B 54, 1703 (1996).
[69] X. Gonze et al., First-principles computation of material properties: the ABINIT
software project, Comp. Mater. Sci. 25, 478 (2002).
[70] The ABINIT code is a common project of the Universite Catholique de Louvain,
Corning Incorporated, and other contributors (URL http://www.abinit.org).
146

Bibliography
[71] J. Albertsson, S. C. Abrahams and A. Kvick, Atomic displacement, anharmonic ther-
mal vibration, expansivity and pyroelectric coefficient thermal dependences in ZnO,
Acta Cryst. B 45, 34 (1989).
[72] Handbook of Chemistry and Physics, 85th Ed., edited by D. R. Lide (CRC Press,
Boca Raton, 2004).
[73] A. Every and A. McCurdy, in Landolt-Bornstein: numerical data and functional
relationships in science and technology, New Series, edited by H. Ullmaier (Springer,
Heidelberg, 1992), Vol. III/29A.
[74] C. Kittel, Introduction to Solid State Physics, 8th Ed. (Wiley, New York, 2004).
[75] Huber K. P. and G. Herzberg, Constants of Diatomic Molecules (Van Nostrand, New
York, 1979).
[76] G.-X. Qian, R. M. Martin and D. J. Chadi, First-principles study of the atomic
reconstructions and energies of Ga- and As-stabilized GaAs(100) surfaces, Phys. Rev.
B 38, 7649 (1988).
[77] S. B. Zhang and J. E. Northrup, Chemical potential dependence of defect formation
energies in GaAs: Application to Ga self-diffusion, Phys. Rev. Lett. 67, 2339 (1991).
[78] E. Rauls and T. Frauenheim, Entropy of point defects calculated within periodic
boundary conditions, Phys. Rev. B 69, 155213 (2004).
[79] R. F. W. Bader, Atoms in Molecules – A Quantum Theory (Oxford University Press,
Oxford, 1990).
[80] S. B. Zhang, S.-H. Wei and A. Zunger, Microscopic Origin of the Phenomenological
Equilibrium ”Doping Limit Rule” in n-Type III-V Semiconductors, Phys. Rev. Lett.
84, 1232 (2000).
[81] L. Colombo, Tight-binding theory of native point defects in silicon, Annu. Rev. Mat.
Sci. 32, 271 (2002).
[82] S. Limpijumnong and C. G. Van de Walle, Diffusivity of native defects in GaN, Phys.
Rev. B 69, 035207 (2004).
147

Bibliography
[83] Y. Yan, S. B. Zhang, S. J. Pennycook and S. T. Pantelides, A Theoretical Study of
p-Type Doping of ZnO: Problems and Solutions, Mat. Res. Soc. Symp. Proc. 666,
F2.6 (2001).
[84] Y. Yan, S. B. Zhang and S. T. Pantelides, Control of Doping by Impurity Chemical
Potentials: Predictions for p-Type ZnO, Phys. Rev. Lett. 86, 5723 (2001).
[85] B. Arnaud and M. Alouani, All-electron projector-augmented-wave GW approxima-
tion: Application to the electronic properties of semiconductors, Phys. Rev. B 62,
4464 (2000).
[86] M. S. Hybertsen and S. G. Louie, First-Principles Theory of Quasiparticles: Calcu-
lation of Band Gaps in Semiconductors and Insulators, Phys. Rev. Lett. 55, 1418
(1985).
[87] Y.-J. Zhao, C. Persson, S. Lany and A. Zunger, Why can CuInSe2 be readily
equilibrium-doped n-type but the wider-gap CuGaSe2 cannot?, Appl. Phys. Lett. 85,
5860 (2004).
[88] M. J. Puska, S. Poykko, M. Pesola and R. M. Nieminen, Convergence of supercell
calculations for point defects in semiconductors: Vacancy in silicon, Phys. Rev. B
58, 1318 (1998).
[89] J. Lento, J.-L. Mozos and R. M. Nieminen, Charged point defects in semiconductors
and the supercell approximation, J. Phys.: Condens. Matter 14, 2637 (2002).
[90] R. Blachnik, J. Chu, R. R. Galazka, J. Geurts, J. Gutowski, B. Honerlage, D.
Hofmann, J. Kossut, R. Levy, P. Michler, U. Neukirch, T. Story, D. Strauch and
A. Waag, in Landolt-Bornstein: numerical data and functional relationships in sci-
ence and technology, New Series, edited by U. Rossler (Springer, Heidelberg, 1999),
Vol. III/41B.
[91] W. Ranke, Separation of partial s-densities and p-densities of valence states of ZnO
from UPS-measurements, Sol. State. Comm. 19, 685 (1976).
[92] M. Usuda, N. Hamada, T. Kotani and M. van Schilfgaarde, All-electron GW calcu-
lation based on the LAPW method: Application to wurtzite ZnO, Phys. Rev. B 66,
125101 (2002).
148
Bibliography
[93] S. A. Leontiev, S. V. Koshtcheev, V. G. Devyatov, A. E. Cherkashin and E. P.
Mikheeva, Detailed XPS and UPS studies of the band structure of zinc oxide, J.
Struct. Chem. 38, 725 (1997).
[94] G. Zwicker and K. Jacobi, Experimental band structure of ZnO, Solid State Comm.
54, 701 (1985).
[95] R. T. Girard, O. Tjernberg, G. Chiaia, S. Soderholm, U. O. Karlsson, C. Wigren,
H. Nylen and I. Lindau, Electronic structure of ZnO(0001) studied by angle-resolved
photoelectron spectroscopy, Surf. Sci. 373, 409 (1997).
[96] General Discussion, Faraday Discuss. 124, 275 (2003).
[97] P. Schroer, P. Kruger and J. Pollmann, First-principles calculation of the electronic
structure of the wurtzite semiconductors ZnO and ZnS, Phys. Rev. B 47, 6971 (1993).
[98] D. Vogel, P. Kruger and J. Pollmann, Self-interaction and relaxation-corrected pseu-
dopotentials for II-VI semiconductors, Phys. Rev. B 54, 5495 (1996).
[99] S. Massidda, R. Resta, M. Posternak and A. Baldereschi, Polarization and dynamical
charge of ZnO within different one-particle schemes, Phys. Rev. B 52, R16977 (1995).
[100] J. P. Perdew and A. Zunger, Self-interaction correction to density-functional approx-
imations for many-electron systems, Phys. Rev. B 23, 5048 (1981).
[101] M. S. Park and B. I. Min, Ferromagnetism in ZnO codoped with transition metals:
Zn1−x(FeCo)xO and Zn1−x(FeCu)xO, Phys. Rev. B 68, 224436 (2003).
[102] C. L. Dong, C. Persson, L. Vayssieres, A. Augustsson, T. Schmitt, M. Mattesini,
R. Ahuja, C. L. Chang and J.-H. Guo, Electronic structure of nanostructured ZnO
from X-ray absorption and emission spectroscopy and the local density approximation,
Phys. Rev. B 70, 195325 (2004).
[103] G. Kresse and J. Furthmuller, Efficient iterative schemes for ab initio total-energy
calculations using a plane-wave basis set, Phys. Rev. B 54, 11169 (1996).
[104] G. Kresse and D. Joubert, From ultrasoft pseudopotentials to the projector
augmented-wave method, Phys. Rev. B 59, 1758 (1999).
149

Bibliography
[105] C. P. Flynn, Point Defects and Diffusion (Oxford University Press, Oxford, 1972).
[106] P. Ehrhart, P. Jung, H. Schultz and H. Ullmaier, in Landolt-Bornstein: Numerical
Data and Functional Relationships in Science and Technology, New Series, edited by
H. Ullmaier (Springer, Heidelberg, 1991), Vol. III/25.
[107] S. A. Centoni, B. Sadigh, G. H. Gilmer, T. J. Lenosky, T. Diaz de la Rubia and
C. B. Musgrave, First-principles calculation of intrinsic defect formation volumes in
silicon, Phys. Rev. B 72, 195206 (2005).
[108] F. Birch, Finite strain isotherm and velocities for single-crystal and polycrystalline
NaCl at high pressures and 300 degrees K, J. Geophys. Res. 83, 1257 (1978).
[109] G. Makov and M. C. Payne, Periodic boundary conditions in ab initio calculations,
Phys. Rev. B 51, 4014 (1995).
[110] D. C. Look, J. W. Hemsky and J. R. Sizelove, Residual Native Shallow Donor in
ZnO, Phys. Rev. Lett. 82, 2552 (1999).
[111] F. Tuomisto, V. Ranki, K. Saarinen and D. C. Look, Evidence of the Zn Vacancy
Acting as the Dominant Acceptor in n-Type ZnO, Phys. Rev. Lett. 91, 205502 (2003).
[112] C. Persson, Y.-J. Zhao, S. Lany and A. Zunger, n-type doping of CuInSe2 and Cu-
GaSe2, Phys. Rev. B 72, 035211 (2005).
[113] M. Liu, A. H. Kitai and P. Mascher, Point-defects and luminescence-centers in zinc-
oxide and zinc-oxide doped with manganese, J. Lumin. 54, 35 (1992).
[114] L. Bixia, F. Zhuxi and J. Yunbo, Green luminescent center in undoped zinc oxide
films deposited on silicon substrates., Appl. Phys. Lett. 79, 943 (2001).
[115] A. R. Allnatt and A. B. Lidiard, Atomic Transport in Solids (Cambridge University
Press, Cambridge, 2003).
[116] W. J. Moore and E. L. Williams, Diffusion of zinc and oxygen in zinc oxide, Discuss.
Faraday Soc. 28, 86 (1959).
[117] J. W. Hoffman and I. Lauder, Diffusion of oxygen in single crystal zinc oxide, Trans.
Faraday Soc. 66, 2346 (1970).
150

Bibliography
[118] R. Robin, A. R. Cooper and A. H. Heuer, Application of a nondestructive single-
spectrum proton activation technique to study oxygen diffusion in zinc oxide, J. Appl.
Phys. 44, 3770 (1973).
[119] G. W. Tomlins, J. L. Routbort and T. O. Mason, Oxygen diffusion in single-crystal
zinc oxide, J. Amer. Ceram. Soc. 81, 869 (1998).
[120] H. Haneda, I. Sakaguchi, A. Watanabe, T. Ishigaki and J. Tanaka, Oxygen Diffusion
in Single- and Poly-Crystalline Zinc Oxides, J. Electroceramics 4, 41 (1999).
[121] A. C. S. Sabioni, M. J. F. Ramos and W. B. Ferraz, Oxygen diffusion in pure and
doped ZnO, Mat. Res. 6, 173 (2003).
[122] M. G. Wardle, J. P. Goss and P. R. Briddon, Theory of Li in ZnO: A limitation for
Li-based p-type doping, Phys. Rev. B 71, 155205 (2005).
[123] G. M. Dalpian and S.-H. Wei, Photoinduced cation interstitial diffusion in II-VI
semiconductors, Phys. Rev. B 72, 075208 (2005).
[124] G. Henkelman, G. Johannesson and H. Jonsson, in Methods for finding saddlepoints
and minimum energy paths in Progress on theoretical chemistry and physics, p. 269,
edited by S. D. Schwartz (Kluwer Academic, Dordrecht, 2000).
[125] G. Henkelman, B. P. Uberuaga and H. Jonsson, A climbing image nudged elastic
band method for finding saddle points and minimum energy paths, J. Chem. Phys.
113, 9901 (2000).
[126] G. H. Vineyard, Frequency factors and isotope effects in solid state rate processes, J.
Phys. Chem. Solids 3, 121 (1957).
[127] R. Olsen, G. J. Kroes, G. Henkelman, A. Arnaldsson and H. Jonsson, Comparison
of methods for finding saddle points without knowledge of the final states., J. Chem.
Phys. 121, 9776 (2004).
[128] G. Henkelman and H. Jonsson, A method for finding saddle points on high dimen-
sional potential surfaces using only first derivatives, J. Chem. Phys. 111, 7010 (1999).
[129] The implementations of the climbing image nudged elastic band and the dimer
method for VASP were obtained from http://theory.cm.utexas.edu/henkelman .
151

Bibliography
[130] Y. V. Gorelkinskii and G. D. Watkins, Defects produced in ZnO by 2.5-MeV electron
irradiation at 4.2 K: study by optical detection of electron paramagnetic resonance,
Phys. Rev. B 69, 115212 (2004).
[131] K. Lorenz, E. Alves, E. Wendler, O. Bilani, W. Wesch and M. Hayes, Damage for-
mation and annealing at low temperatures in ion implanted ZnO, Appl. Phys. Lett.
87, 191904 (2005).
[132] F. Tuomisto, K. Saarinen, D. C. Look and G. C. Farlow, Introduction and recovery
of point defects in electron-irradiated ZnO, Phys. Rev. B 72, 085206 (2005).
[133] A. C. S. Sabioni, About the oxygen diffusion mechanism in ZnO, Solid State Ionics
170, 145 (2004).
[134] D. G. Thomas, Interstitial zinc in zinc oxide, J. Phys. Chem. Solids 3, 229 (1957).
[135] D. J. Binks and R. W. Grimes, Incorporation of Monovalent ions in ZnO and their
influence on varistor degradation, J. Am. Ceram. Soc. 76, 2370 (1993).
[136] G. W. Tomlins, J. L. Routbort and T. O. Mason, Zinc self-diffusion, electrical prop-
erties, and defect structure of undoped, single crystal zinc oxide, J. Appl. Phys. 87,
117 (2000).
[137] R. Lindner, Die Diffusion von radioaktivem Zink in Zink-Eisen-Spinell und Zinkoxyd,
Acta Chem. Scand. 6, 457 (1952).
[138] E. A. Secco and W. J. Moore, Diffusion of zinc in crystalline zinc oxide, J. Chem.
Phys. 23, 1170 (1955).
[139] E. A. Secco and W. J. Moore, Diffusion and exchange of zinc in crystalline zinc
oxide, J. Chem. Phys. 26, 942 (1957).
[140] B. J. Wuensch and H. L. Tuller, Lattice diffusion, grain-boundary diffusion and defect
structure of ZnO, J. Phys. Chem. Solids 55, 975 (1994).
[141] M. A. d. N. Nogueira, W. B. Ferraz and A. C. S. Sabioni, Diffusion of the 65Zn
radiotracer in ZnO polycrystalline ceramics, Mater. Res. 6, 167 (2003).
152

Bibliography
[142] M. S. Daw and M. I. Baskes, Embedded-atom method: Derivation and application to
impurities, surfaces and other defects in metals, Phys. Rev. B 29, 6443 (1984).
[143] F. H. Stillinger and T. A. Weber, Computer simulation of local order in condensed
phases of silicon, Phys. Rev. B 31, 5262 (1985).
[144] M. J. Stott and E. Zaremba, Quasiatoms: An approach to atoms in nonuniform
electronic systems, Phys. Rev. B 22, 1564 (1980).
[145] M. J. Puska, R. M. Nieminen and M. Manninen, Atoms embedded in an electron gas:
Immersion energies, Phys. Rev. B 24, 3037 (1981).
[146] J. K. Norskov, Covalent effects in the effective-medium theory of chemical binding:
Hydrogen heats of solution in the 3d metals, Phys. Rev. B 26, 2875 (1982).
[147] A. E. Carlsson, Solid State Physics: Advances in Research and Applications, edited
by H. Ehrenreich and D. Turnbull (Academic, New York, 1990), Vol. 43.
[148] A. P. Horsfield, A. M. Bratkovsky, M. Fearn, D. G. Pettifor and M. Aoki, Bond-order
potentials: Theory and implementation, Phys. Rev. B 53, 12694 (1996).
[149] D. W. Brenner, Relationship between the Embedded-Atom Method and Tersoff Po-
tentials, Phys. Rev. Lett. 63, 1022 (1989).
[150] K. Albe, K. Nordlund, J. Nord and A. Kuronen, Modeling of compound semiconduc-
tors: Analytical bond-order potential for Ga, As, and GaAs, Phys. Rev. B 66, 035205
(2002).
[151] M. I. Baskes, Modified embedded-atom potentials for cubic materials and impurities,
Phys. Rev. B 46, 2727 (1992).
[152] D. W. Brenner, Empirical potential for hydrocarbons for use in simulating the chem-
ical vapor deposition of diamond films, Phys. Rev. B 42, 9458 (1990).
[153] D. W. Brenner, O. A. Shenderova, J. A. Harrison, S. J. Stuart, B. Ni and S. B.
Sinnott, A second-generation reactive empirical bond order (REBO) potential energy
expression for hydrocarbons, J. Phys.: Condens. Matter 14, 783 (2002).
153

Bibliography
[154] K. A. Albe, K. Nordlund and R. S. Averback, Modeling the metal-semiconductor
interaction: Analytical bond-order potential for platinum-carbon, Phys. Rev. B 65,
195124 (2002).
[155] N. Juslin, P. Erhart, P. Traskelin, J. Nord, K. Henriksson, E. Salonen, K. Nordlund
and K. Albe, Analytical interatomic potential for modeling nonequilibrium processes
in the W–C–H system, J. Appl. Phys. 98, 123520 (2005).
[156] D. Pettifor and I. Oleinik, Analytic bond-order potentials beyond Tersoff-Brenner. I.
Theory, Phys. Rev. B 59, 8487 (1999).
[157] D. G. Pettifor, M. W. Finnis, D. Nguyen-Manh, D. A. Murdick, X. W. Zhou and
H. N. G. Wadley, Analytic bond-order potentials for multicomponent systems, Mater.
Sci. Eng. A 365, 2 (2004).
[158] C. R. A. Catlow, Point Defect and Electronic Properties of Uranium Dioxide, Proc.
Roy. Soc. A 353, 533 (1977).
[159] G. V. Lewis and C. R. A. Catlow, Potential models for ionic oxides, J. Phys. C: Solid
State Phys. 18, 1149 (1985).
[160] B. G. Dick, Jr. and A. W. Overhauser, Theory of the Dielectric Constants of Alkali
Halide Crystals, Phys. Rev. 112, 90 (1958).
[161] F. Shimojo, I. Ebbsjo, R. K. Kalia, A. Nakano, J. P. Rino and P. Vashishta, Molec-
ular Dynamics Simulation of Structural Transformation in Silicon Carbide under
Pressure, Phys. Rev. Lett. 84, 3338 (2000).
[162] A. Chatterjee, R. Kalia, A. Nakano, A. Omeltchenko, K. Tsuruta, P. Vashishta, C.-
K. Loong, M. Winterer and S. Klein, Sintering, structure, and mechanical properties
of nanophase SiC: A molecular-dynamics and neutron scattering study, Appl. Phys.
Lett. 77, 1132 (2000).
[163] J. P. Rino, A. Chatterjee, I. Ebbsjo, R. K. Kalia, A. Nakano, F. Ebbsjo and
P. Vashishta, Pressure-induced structural transformation in GaAs: A molecular-
dynamics study, Phys. Rev. B 65, 195206 (2002).
154

Bibliography
[164] M. Kubo, Y. Oumi, H. Takaba, A. Chatterjee, A. Miyamoto, M. Kawasaki, M. Yoshi-
moto and H. Koinuma, Homoepitaxial growth mechanism of ZnO(0001): Molecular-
dynamics simulations, Phys. Rev. B 61, 16187 (2000).
[165] F. H. Streitz and J. W. Mintmire, Electrostatic potentials for metal-oxide surfaces
and interfaces, Phys. Rev. B 50, 11996 (1994).
[166] S. Ogata, H. Iyetomi, K. Tsuruta, F. Shimojo, R. K. Kalia, A. Nakano and P.
Vashishta, Variable-charge interatomic potentials for molecular-dynamics simulations
of TiO2, J. Appl. Phys. 86, 3036 (1999).
[167] A. C. T. van Duin, S. Dasgupta, F. Lorant and W. A. Goddard, III, ReaxFF: a
reactive force field for hydrocarbons, J. Phys. Chem. A 105, 9396 (2001).
[168] Q. Zhang, T. Cagin, A. van Duin, W. A. Goddard, III, Y. Qi and L. G. Hector, Jr.,
Adhesion and nonwetting-wetting transition in the Al/alpha-Al2O3 interface, Phys.
Rev. B 69, 045423 (2004).
[169] J. Tersoff, Empirical interatomic potential for silicon with improved elastic properties,
Phys. Rev. B 38, 9902 (1988).
[170] J. Tersoff, Empirical Interatomic Potential for Carbon, with Applications to Amor-
phous Carbon, Phys. Rev. Lett. 61, 2879 (1988).
[171] J. Tersoff, Modeling solid-state chemistry: Interatomic potentials for multicomponent
systems, Phys. Rev. B 39, 5566 (1989).
[172] M. V. R. Murty and H. A. Atwater, Empirical interatomic potential for Si–H inter-
actions, Phys. Rev. B 51, 4889 (1995).
[173] K. Beardmore and R. Smith, Empirical potentials for C–Si–H systems with applica-
tion to C60 interactions with Si surfaces, Phil. Mag. A 74, 1439 (1996).
[174] A. J. Dyson and P. V. Smith, Extension of the Brenner empirical interatomic poten-
tial to C–Si–H systems, Surf. Sci. 355, 140 (1996).
[175] A. J. Dyson and P. V. Smith, Improved empirical interatomic potential for C–Si–H
systems, Mol. Phys. 96, 1491 (1999).
155

Bibliography
[176] F. Gao and W. J. Weber, Empirical potential approach for defect properties in 3C-
SiC, Nucl. Instr. Meth. Phys. Res. B 191, 504 (2002).
[177] P. Erhart and K. Albe, Analytical Potential for Atomistic Simulations of Silicon and
Silicon Carbide, Phys. Rev. B 71, 035211 (2005).
[178] K. Albe and R. S. Averback, Modeling of metal-carbides: Analytical bond-order po-
tential for nickel and nickel-carbide, to be published.
[179] J. Nord, K. Albe, P. Erhart and K. Nordlund,Modelling of compound semiconductors:
Analytical bond-order potential for gallium, nitrogen and gallium nitride, J. Phys.:
Condens. Matter 15, 5649 (2003).
[180] J. Gale, GULP: A computer program for the symmetry-adapted simulation of solids,
JCS Faraday Trans. 93, 629 (1997).
[181] J. D. Gale and A. L. Rohl, The General Utility Lattice Program (GULP), Mol. Simul.
29, 291 (2003).
[182] H. Balamane, T. Halicioglu and W. A. Tiller, Comparative study of silicon empirical
interatomic potentials, Phys. Rev. B 46, 2250 (1992).
[183] D. W. Brenner, The Art and Science of an Analytical Potential, Phys. Stat. Sol. B
217, 23 (2000).
[184] T. J. Lenosky, B. Sadigh, E. Alonso, V. V. Bulatov, T. Diaz de la Rubia, J. Kim,
A. F. Voter and J. D. Kress, Highly optimized empirical potential model of silicon,
Modelling Simul. Mater. Sci. Eng. 8, 825 (2000).
[185] Y. Mishin, D. Farkas, M. J. Mehl and D. A. Papaconstantopoulos, Interatomic po-
tentials for monoatomic metals from experimental data and ab initio calculations,
Phys. Rev. B 59, 3393 (1999).
[186] B. J. Thijsse, Silicon potentials under (ion) attack: towards a new MEAM model,
Nucl. Instr. Meth. Phys. Res. B 228, 198 (2005).
[187] F. Ercolessi and J. B. Adams, Interatomic potentials from first-principles calculations:
the force-matching method., Europhys. Lett. 26, 583 (1994).
156

Bibliography
[188] Y. Saito, N. Sasaki, H. Moriya, A. Kagatsume and S. Noro, Parameter optimization
of Tersoff interatomic potentials using a genetic algorithm, JSME Int. J. Ser. A 44,
207 (2001).
[189] K. Nordlund and A. Kuronen, Non-equilibrium properties of GaAs interatomic po-
tentials, Nucl. Instr. Meth. Phys. Res. B 159, 183 (1999).
[190] W. H. Press, S. A. Teukolsky, W. T. Vetterling and B. P. Flannery, in Numeri-
cal Recipes in Fortran 77: The Art of Scientific Computing, 2nd Ed. (Cambridge
University Press, New York, 1995), Chap. 11.
[191] P. Erhart, pontifix/pinguin: User Manual.
[192] K. Albe, J. Nord and K. Nordlund, Analytical bond-order potential for gallium nitride
with environment dependent valence charges, to be published.
[193] R. M. Martin, Relation between Elastic Tensors of Wurtzite and Zinc-Blende Struc-
ture Materials, Phys. Rev. B 6, 4546 (1972), ibid. 20, 818 (1979), erratum.
[194] C. A. Fancher, H. L. de Clercq, O. C. Thomas, D. W. Robinson and K. H. Bowen,
Zinc oxide and its anion: A negative ion photoelectron spectroscopic study, J. Chem.
Phys. 109, 8426 (1998).
[195] E. H. Kisi and M. M. Elcombe, u parameters for the wurtzite structure of ZnS and
ZnO using powder neutron diffraction, Acta Cryst. C 45, 1867 (1989).
[196] T. B. Bateman, Elastic moduli of single-crystal zinc oxide, J. Appl. Phys. 33, 3309
(1962).
[197] I. B. Kobiakov, Elastic, piezoelectric and dielectric-properties of ZnO and CdS single-
crystals in ad wide-range of temperatures, Solid State Comm. 35, 305 (1980).
[198] J. M. Recio, R. Pandey and V. Luana, Quantum-mechanical modeling of the high-
pressure state equations of ZnO and ZnS, Phys. Rev. B 47, 3401 (1993).
[199] S. Desgreniers, High-density phases of ZnO: Structural and compressive parameters,
Phys. Rev. B 58, 14102 (1998).
157

Bibliography
[200] H. Karzel, W. Potzel, M. Kofferlein, W. Schiessl, M. Steiner, U. Hiller, G. M. Kalvius,
D. W. Mitchell, T. P. Das, P. Blaha, K. Schwarz and M. P. Pasternak, Lattice
dynamics and hyperfine interactions in ZnO and ZnSe at high external pressures,
Phys. Rev. B 53, 11425 (1996).
[201] L. Kleinman, Deformation Potentials in Silicon. I. Uniaxial Strain, Phys. Rev. 128,
2614 (1962).
[202] F. Cleri and V. Rosato, Tight-binding potentials for transition metals and alloys,
Phys. Rev. B 48, 22 (1993).
[203] M. I. Baskes and R. A. Johnson, Modified embedded atom potentials for HCP metals,
Modelling Simul. Mater. Sci. Eng. 2, 147 (1994).
[204] M. A. Czajkowski, R. Bobkowski and L. Krause, O+u (3Πu)← XO+g (
1Σ+g ) transitions
in Zn2 excited in crossed molecular and laser beams, Phys. Rev. A 41, 277 (1990).
[205] B. Eisenmann and H. Schafer, in Landolt-Bornstein: numerical data and functional
relationships in science and technology, New Series, edited by H. Ullmaier (Springer,
Heidelberg, 1988), Vol. III/14 A.
[206] H. M. Ledbetter, The elastic constants of zinc – compilation and a review, J. Phys.
Chem. Ref. Data 6, 1181 (1977).
[207] D. Singh and D. A. Papaconstantopoulos, Equilibrium properties of zinc, Phys. Rev.
B 41, 8885 (1990).
[208] F. Ercolessi, O. Tomagnini, S. Iarlori and E. Tosatti, in Nanosources and Manipula-
tion of Atoms Under High Fields and Temperatures: Applications, edited by V. T.
Binh (Kluwer, Dordrecht, 1993), S. 185–205.
[209] H. J. C. Berendsen, J. P. M. Postma, W. F. Gunsteren, A. D. Nola and J. R. Haak,
Molecular dynamics with coupling to an external bath, J. Chem. Phys. 81, 3684
(1984).
[210] P. J. Hay and T. H. Dunning, Jr., Geometries and energies of the excited states of
O3 from ab initio potential energy surfaces, J. Chem. Phys. 67, 2290 (1977).
158

Bibliography
[211] L. A. Curtiss, K. Raghavachari, G. W. Trucks and J. A. Pople, Gaussian-2 theory
for molecular energies of first- and second-row compounds, J. Chem. Phys. 94, 7221
(1991).
[212] J. M. Seminario, A study of small systems containing H-atoms and O-atoms us-
ing nonlocal functionals - comparisons with ab-initio and experiment, Int. J. Quant.
Chem. 52, 655 (1994), suppl. 28.
[213] P. Politzer and P. Lane, Kohn-Sham studies of oxygen systems, Int. J. Quant. Chem.
77, 336 (2000).
[214] A. F. Jalbout, DFT/B3-LYP and ab initio analysis of the ozone potential energy
surface, J. Mol. Struct.: THEOCHEM 617, 5 (2002).
[215] H. U. Jager and K. Albe, Molecular-dynamics simulations of steady-state growth of
ion-deposited tetrahedral amorphous carbon films., J. Appl. Phys. 88, 1129 (2000).
[216] M. Tang and S. Yip, Atomistic simulation of thermomechanical properties of β-SiC,
Phys. Rev. B 52, 15150 (1995).
[217] R. Smith (ed.), Atomic & ion collisions in solids and at surfaces: theory, simulation
and applications (Cambridge University Prss, Cambridge, UK, 1997).
[218] R. S. Averback and T. Diaz de la Rubia, Displacement Damage in Irradiated Metals
and Semiconductors, Solid State Physics 51, 281 (1998).
[219] D. C. Look, G. C. Farlow, P. Reunchan, S. Limpijumnong, S. B. Zhang and K.
Nordlund, Evidence for native-defect donors in n-type ZnO, Phys. Rev. Lett. 95,
225502 (2005).
[220] K. Nordlund, J. Wallenius and L. Malerba, accepted for publication in Nucl. Instr.
Meth. B .
[221] C. Erginsoy, G. H. Vineyard and A. Englert, Dynamics of Radiation Damage in a
Body-Centered Cubic Lattice, Phys. Rev. 133, 595 (1964).
[222] K. Nordlund, M. Ghaly, R. S. Averback, M. Caturla, T. Diaz de la Rubia and J.
Tarus, Defect production in collision cascades in elemental semiconductors and FCC
metals, Phys. Rev. B 57, 7556 (1998).
159

Bibliography
[223] J. M. Meese and D. R. Locker, Oxygen displacement energy in ZnO, Solid State
Comm. 11, 1547 (1972).
[224] G. Pazionis and H.-J. Schulz, Radiation damage experiments with ZnO at low tem-
peratures, Mater. Sci. Forum 10-12, 839 (1986).
[225] W. E. Vehse, W. A. Sibley, F. J. Keller and Y. Chen, Radiation damage in ZnO
single crystals, Phys. Rev. 167, 828 (1968).
[226] Accelrys Inc., CASTEP Users Guide (Accelrys Inc., San Diego, 2001).
[227] V. Milman, J. A. White, C. J. Pickard, M. C. Payne, E. V. Akhmatskaya and R. H.
Nobes, Electronic structure, properties, and phase stability of inorganic crystals: A
pseudopotential plane-wave study, Int. J. Quant. Chem. 77, 895 (2000).
[228] M. J. Frisch and G. W. Trucks, Gaussian 94, rev. E.2 (Gaussian Inc., Pittsburgh,
1995).
[229] A. Beltran, J. Andres, M. Calatayud and J. B. L. Martins, Theoretical study of ZnO
(10 1 0 ) and Cu/ZnO (10 1 0 ) surfaces, Chem. Phys. Lett. 338, 224 (2001).
[230] U. Diebold, L. Koplitz and O. Dulub, Atomic-scale properties of low-index ZnO
surfaces, Appl. Surf. Sci. 237, 336 (2004).
[231] B. Meyer and D. Marx, Density-functional study of the structure and stability of ZnO
surfaces, Phys. Rev. B 67, 035403 (2003).
[232] B. Meyer, First-principles study of the polar O-terminated ZnO surface in thermo-
dynamic equilibrium with oxygen and hydrogen, Phys. Rev. B 69, 045416 (2004).
[233] F. Claeyssens, C. L. Freeman, N. L. Allan, Y. Sun, M. N. R. Ashfold and J. H.
Harding, Growth of ZnO thin films - experiment and theory, J. Mater. Chem. 15,
139 (2005).
[234] C. G. Van de Walle, Hydrogen as a Cause of Doping in Zinc Oxide, Phys. Rev. Lett.
85, 1012 (2000).
[235] S. Limpijumnong and S. B. Zhang, Resolving hydrogen binding sites by pressure - A
first-principles prediction for ZnO, Appl. Phys. Lett. 86, 151910 (2005).
160

Bibliography
[236] L. Petit, T. C. Schulthess, A. Svane, Z. Szotek, W. M. Temmerman and A. Janotti,
Electronic structure of transition-metal impurities in p-type ZnO, Phys. Rev. B 73,
045107 (2006).
[237] G. V. Lewis and C. R. A. Catlow, Defect studies of doped and undoped barium titanate
using computer simulation techniques, J. Phys. Chem. Solids 47, 89 (1986).
[238] A. J. Kulkarni, M. Zhou and F. J. Ke, Orientation and size dependence of the elastic
properties of zinc oxide nanobelts, Nanotechnology 16, 2749 (2005).
[239] A. J. Kulkarni and M. Zhou, Size-dependent thermal conductivity of zinc oxide
nanobelts, Appl. Phys. Lett. 88, 141921 (2006).
[240] M. P. Allen and D. J. Tildesley, Computer Simulation of Liquids (Oxford University
Press, Oxford, 1987).
[241] D. C. Wallace, Thermodynamics of Crystals (Dover, Mineola, New York, 1998).
[242] S. Goedecker, Fast radix 2, 3, 4 and 5 kernels for Fast Fourier Transformations on
computers with overlapping multiply-add instructions, SIAM J. on Scientific Com-
puting 18, 1605 (1997).
[243] X. Gonze, Towards a potential-based conjugate gradient algorithm for order-N self-
consistent total energy calculations, Phys. Rev. B 54, 4383 (1996).
161
Related Documents