Intrinsic Gene Expression Subsets of Diffuse Cutaneous Systemic Sclerosis Are Stable in Serial Skin Biopsies Sarah A. Pendergrass 1 , Raphael Lemaire 2 , Ian P. Francis 2 , J. Matthew Mahoney 1 , Robert Lafyatis 2 and Michael L. Whitfield 1 Skin biopsy gene expression was analyzed by DNA microarray from 13 diffuse cutaneous systemic sclerosis (dSSc) patients enrolled in an open-label study of rituximab, 9 dSSc patients not treated with rituximab, and 9 healthy controls. These data recapitulate the patient ‘‘intrinsic’’ gene expression subsets described previously, including fibroproliferative, inflammatory, and normal-like groups. Serial skin biopsies showed consistent and non-progressing gene expression over time, and importantly, the patients in the inflammatory subset do not move to the fibroproliferative subset, and vice versa. We were unable to detect significant differences in gene expression before and after rituximab treatment, consistent with an apparent lack of clinical response. Serial biopsies from each patient stayed within the same gene expression subset, regardless of treatment regimen or the time point at which they were taken. Collectively, these data emphasize the heterogeneous nature of SSc and demonstrate that the intrinsic subsets are an inherent, reproducible, and stable feature of the disease that is independent of disease duration. Moreover, these data have fundamental importance for the future development of personalized therapy for SSc; drugs targeting inflammation are likely to benefit those patients with an inflammatory signature, whereas drugs targeting fibrosis are likely to benefit those with a fibro- proliferative signature. Journal of Investigative Dermatology (2012) 132, 1363–1373; doi:10.1038/jid.2011.472; published online 9 February 2012 INTRODUCTION Systemic sclerosis (SSc) is a multisystem autoimmune disorder with a hallmark of skin fibrosis and thickening along with significant internal organ involvement (Mayes et al., 2003). SSc has historically been divided into limited and diffuse disease based on the extent of skin involvement, with limited cutaneous SSc (lSSc) involving skin restricted to the regions below the elbows, knees, and face, and diffuse cutaneous SSc (dSSc), including more proximal skin. The degree of skin involvement has a direct correlation with SSc prognosis and internal organ complications (Barnett et al., 1988; Scussel-Lonzetti et al., 2002). However, within dSSc and lSSc, there is a heterogeneous range of skin and internal organ involvement. Approaches that objectively quantify disease heterogeneity and predict internal organ involvement are critically needed. Previous genome-wide gene expression studies in SSc skin identified disease-specific gene expression signatures in both lesional and non-lesional skin biopsies that are distinct from those found in healthy controls (Whitfield et al ., 2003; Gardner et al., 2006; Milano et al., 2008). In addition, we have shown that distinct gene expression signatures divide SSc patients into ‘‘intrinsic subsets’’, capturing the clinical heterogeneity of limited versus diffuse SSc, but extending this heterogeneity by revealing that patients with dSSc fall into several different subsets based on gene expression in the skin (Milano et al., 2008). These results suggested that distinct pathogenic mechanisms may drive disease in different patients or at different stages of the disease. We previously identified four intrinsic gene expression subsets: a ‘‘diffuse- proliferation’’ group comprised completely of patients with dSSc (here referred to as fibroproliferative), showing increased expression of genes associated with cell proliferation that could be further subdivided into two groups: ‘‘diffuse 1’’ and ‘‘diffuse 2’’; an ‘‘inflammatory’’ group comprised of dSSc, lSSc, and morphea samples, showing increased expression of genes associated with inflammation; a ‘‘limited’’ group See related commentary on pg 1329 & 2012 The Society for Investigative Dermatology www.jidonline.org 1363 ORIGINAL ARTICLE Received 10 February 2011; revised 22 November 2011; accepted 27 November 2011; published online 9 February 2012 1 Department of Genetics, Dartmouth Medical School, Hanover, New Hampshire, USA and 2 Boston University School of Medicine, Arthritis Center, Boston, Massachusetts, USA Correspondence: Michael L. Whitfield, Department of Genetics, Dartmouth Medical School, 7400 Remsen, Hanover, New Hampshire 03755, USA. E-mail: [email protected]; or Robert Lafyatis, Boston University School of Medicine, Medical Campus, Evans 501, 72 East Concord Street, Boston, Massachusetts 02118-2526, USA. E-mail: [email protected] Abbreviations: dSSc, diffuse cutaneous SSc; GO, gene ontology; lSSc, limited cutaneous SSc; MRSS, modified Rodnan skin score; PPAR-g, peroxisome proliferation–activated receptor-g; SSc, systemic sclerosis

Welcome message from author
This document is posted to help you gain knowledge. Please leave a comment to let me know what you think about it! Share it to your friends and learn new things together.
Transcript
Intrinsic Gene Expression Subsets of DiffuseCutaneous Systemic Sclerosis Are Stable in SerialSkin BiopsiesSarah A. Pendergrass1, Raphael Lemaire2, Ian P. Francis2, J. Matthew Mahoney1, Robert Lafyatis2 andMichael L. Whitfield1
Skin biopsy gene expression was analyzed by DNA microarray from 13 diffuse cutaneous systemic sclerosis(dSSc) patients enrolled in an open-label study of rituximab, 9 dSSc patients not treated with rituximab, and 9healthy controls. These data recapitulate the patient ‘‘intrinsic’’ gene expression subsets described previously,including fibroproliferative, inflammatory, and normal-like groups. Serial skin biopsies showed consistent andnon-progressing gene expression over time, and importantly, the patients in the inflammatory subset do notmove to the fibroproliferative subset, and vice versa. We were unable to detect significant differences in geneexpression before and after rituximab treatment, consistent with an apparent lack of clinical response. Serialbiopsies from each patient stayed within the same gene expression subset, regardless of treatment regimen orthe time point at which they were taken. Collectively, these data emphasize the heterogeneous nature of SScand demonstrate that the intrinsic subsets are an inherent, reproducible, and stable feature of the disease that isindependent of disease duration. Moreover, these data have fundamental importance for the futuredevelopment of personalized therapy for SSc; drugs targeting inflammation are likely to benefit those patientswith an inflammatory signature, whereas drugs targeting fibrosis are likely to benefit those with a fibro-proliferative signature.
Journal of Investigative Dermatology (2012) 132, 1363–1373; doi:10.1038/jid.2011.472; published online 9 February 2012
INTRODUCTIONSystemic sclerosis (SSc) is a multisystem autoimmunedisorder with a hallmark of skin fibrosis and thickening alongwith significant internal organ involvement (Mayes et al.,2003). SSc has historically been divided into limited anddiffuse disease based on the extent of skin involvement, withlimited cutaneous SSc (lSSc) involving skin restricted to theregions below the elbows, knees, and face, and diffusecutaneous SSc (dSSc), including more proximal skin. Thedegree of skin involvement has a direct correlation with SScprognosis and internal organ complications (Barnett et al.,1988; Scussel-Lonzetti et al., 2002). However, within dSSc
and lSSc, there is a heterogeneous range of skin and internalorgan involvement. Approaches that objectively quantifydisease heterogeneity and predict internal organ involvementare critically needed.
Previous genome-wide gene expression studies in SSc skinidentified disease-specific gene expression signatures in bothlesional and non-lesional skin biopsies that are distinct fromthose found in healthy controls (Whitfield et al., 2003;Gardner et al., 2006; Milano et al., 2008). In addition, wehave shown that distinct gene expression signatures divideSSc patients into ‘‘intrinsic subsets’’, capturing the clinicalheterogeneity of limited versus diffuse SSc, but extending thisheterogeneity by revealing that patients with dSSc fall intoseveral different subsets based on gene expression in the skin(Milano et al., 2008). These results suggested that distinctpathogenic mechanisms may drive disease in differentpatients or at different stages of the disease. We previouslyidentified four intrinsic gene expression subsets: a ‘‘diffuse-proliferation’’ group comprised completely of patients withdSSc (here referred to as fibroproliferative), showing increasedexpression of genes associated with cell proliferation thatcould be further subdivided into two groups: ‘‘diffuse 1’’ and‘‘diffuse 2’’; an ‘‘inflammatory’’ group comprised of dSSc,lSSc, and morphea samples, showing increased expressionof genes associated with inflammation; a ‘‘limited’’ group
See related commentary on pg 1329
& 2012 The Society for Investigative Dermatology www.jidonline.org 1363
ORIGINAL ARTICLE
Received 10 February 2011; revised 22 November 2011; accepted 27November 2011; published online 9 February 2012
1Department of Genetics, Dartmouth Medical School, Hanover,New Hampshire, USA and 2Boston University School of Medicine, ArthritisCenter, Boston, Massachusetts, USA
Correspondence: Michael L. Whitfield, Department of Genetics, DartmouthMedical School, 7400 Remsen, Hanover, New Hampshire 03755, USA.E-mail: [email protected]; or Robert Lafyatis, BostonUniversity School of Medicine, Medical Campus, Evans 501, 72 East ConcordStreet, Boston, Massachusetts 02118-2526, USA. E-mail: [email protected]
Abbreviations: dSSc, diffuse cutaneous SSc; GO, gene ontology; lSSc, limitedcutaneous SSc; MRSS, modified Rodnan skin score; PPAR-g, peroxisomeproliferation–activated receptor-g; SSc, systemic sclerosis

comprised primarily of patients with lSSc; and the ‘‘normal-like’’ group of dSSc and lSSc patients, showing geneexpression similar to healthy controls. A weak relationshipwas found between disease duration and these intrinsicsubsets, suggesting that they might reflect evolution of thedisease process rather than biologically distinct pathogenicprocesses.
Here we recapitulate the intrinsic subsets, show thesesubsets are stable over time, and that treatment with ritu-ximab fails to alter skin gene expression. These data illustratethat patients with an inflammatory signature do not go on todevelop a fibroproliferative signature, suggesting a possibleexplanation as to why, in the past, broad-spectrum anti-inflammatory agents may not have worked in SSc. It alsoindicates that different pathogenic mechanisms drive diseasepathogenesis within phenotypically similar patients withdSSc and that this heterogeneity can be consistently andreproducibly detected by analyzing skin gene expression,having broad implications for the future development oftherapies for SSc.
RESULTSdSSc skin biopsies can reproducibly be divided into ‘‘intrinsic’’gene expression subsets
We analyzed skin biopsies from dSSc patients for geneexpression changes indicative of patient-specific heterogene-ity. Gene expression was measured in 60 skin biopsies from22 patients with dSSc and 9 healthy controls (SupplementaryTable 1 online). A total of 89 microarrays were hybridized,which included 29 technical replicates. All patients werebiopsied at a lesional forearm site; a subset was also biopsiedat a non-lesional back site. Clinical data can be found inSupplementary Table 2 online.
Skin biopsies from dSSc patients were analyzed before andafter treatment with rituximab for gene expression changes.Consistent with the lack of clinical response (Lafyatis et al.,2009), we did not find a significant change in gene expressionassociated with rituximab treatment. Instead, gene expressionwas nearly identical between serial biopsies of patients beforeand after treatment (see Supplementary Material online;Supplementary Data File S1 online; and SupplementaryFigure S2 online).
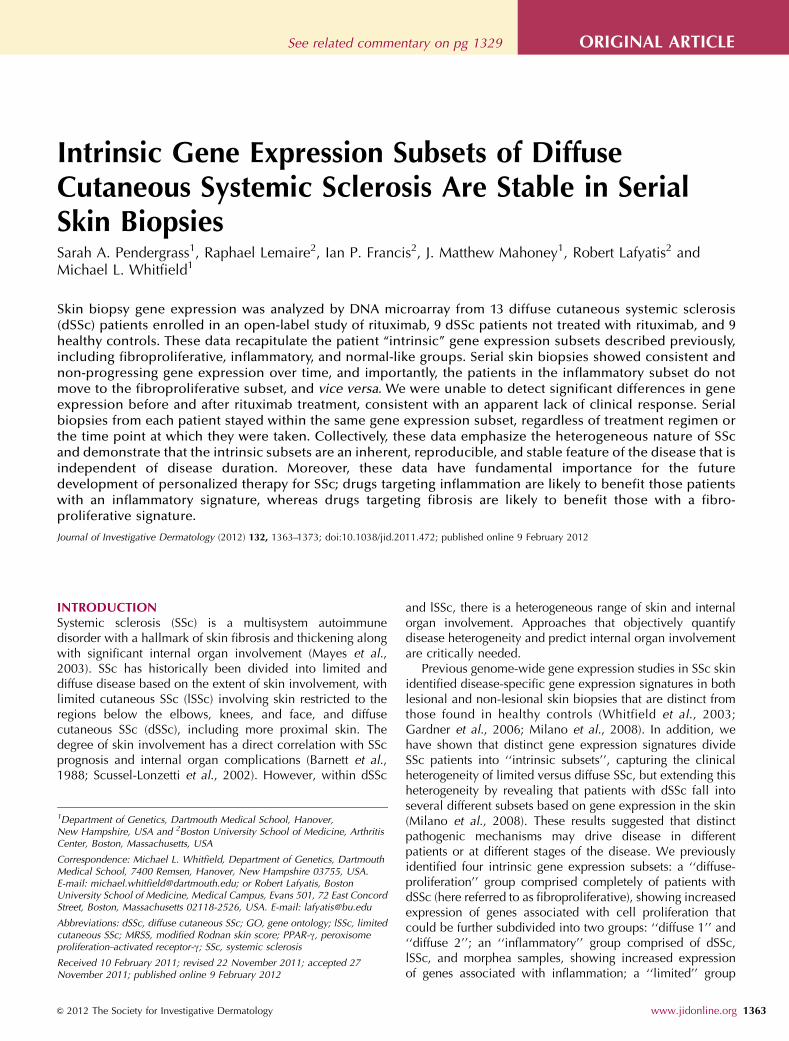
We previously selected a set of ‘‘intrinsic’’ genes that showedconsistent non-changing gene expression between the lesionalforearm and non-lesional back biopsies, but showed the largestchanges between different patients (Milano et al., 2008),allowing us to compare differences between patients ratherthan between lesional/non-lesional biopsies. This resulted inthe identification of patient subsets based on gene expression.These groups were labeled fibroproliferative, inflammatory,limited, and normal-like based on the biological gene expres-sion programs that predominated in each subset. We usedthe same strategy to classify patients in this independentcohort of patients. Hierarchical clustering using 2,377intrinsic genes (false discovery rate of 0.4%) recapitulatedthe major intrinsic subsets, including the fibroproliferative(diffuse 1 and diffuse 2), inflammatory, and normal-likegroups (Figures 1a and 2).
Patient biopsies taken at different time points show similarpatterns of gene expression
We carried out a second analysis to specifically explore whetherpatients showed significant alterations in gene expression subsetover time (intrinsic-by-time point analysis). Genes wereselected that showed the most consistent expression at asingle time point for each patient, but had the most diverseexpression between time points (1,888 genes, false discoveryrate of 1.58%). Organizing the samples by hierarchicalclustering shows that serial biopsies from 13 of 14 patientsgroup together, even though this analysis emphasizesdifferences between time points (Figure 1b and Supplemen-tary Figure S1 online), indicating that serial biopsies aremore similar to each other than to any other samples overthe 6 months to 2 years analyzed. The dendrograms for theintrinsic-by-time point and intrinsic-by-patient analyses areremarkably similar, confirming that gene expression varieslittle across time (Figure 1). (Additional analyses are availablein the Supplementary Material online.)
Distinct pathways are associated with each intrinsic geneexpression group
Distinct sets of genes were associated with each subset thatcorresponded to specific biological processes in the skin,represented by gene ontology (GO) biological processes(Milano et al., 2008; Figure 2; and Supplementary Data fileS3 online). Genes associated with the inflammatory group areenriched for the GO biological processes of immune systemresponse and inflammatory response (Pp0.001, The Data-base for Annotation, Visualization, and Integrated Discoveryanalysis (DAVID); Figure 2d and e) and include IFN-inducedgenes, such IFIT1, IFIT2, and OAS3. This group of genes isalso enriched for the GO biological processes of vasculaturedevelopment (Pp0.01), including the genes vascular en-dothelial growth factor C (VEGFC) and endoglin (ENG), aswell as genes associated with fibrosis (COL6A3, COL6A1,COL5A2, COL5A1, COL1A1, and COL1A2), collagen oligo-meric matrix protein (COMP), and matrix metalloproteinase9 (MMP9) (Varga and Jimenez, 1995; Jimenez et al., 1996;Ramirez et al., 2006; Liu and Zhang, 2008).
Two groups of dSSc patients showed increased expressionof the proliferation signature indicative of dividing cells(Figure 2g) and low expression of the inflammatory signature(Figure 2d), labeled diffuse 1 (blue) and diffuse 2 (red,showing a more prominent proliferation signature) (Whitfieldet al., 2002). Genes associated with this subset are enrichedfor the GO biological processes of mitosis, m-phase of themitotic cell cycle, chromosome segregation (Pp0.001), andDNA metabolic process (Pp0.05). These include the cellcycle regulators CDCA8, CDC2, the kinesins KIF2C, KIF11,and cyclins CCNB2 and CCNB1.
Pathways more prominent in this study than seen pre-viously include fatty acid metabolism (Milano et al., 2008),with increased expression in the normal-like and diffuse 1subsets (Figure 2c). Enriched GO biological processes includedlipid metabolism and fatty acid metabolism (Pp0.001),which contained the peroxisome proliferation–activatedreceptor-g (PPAR-g) coactivator a 1 gene. A group of genes
1364 Journal of Investigative Dermatology (2012), Volume 132
SA Pendergrass et al.Stable Subsets in Systemic Sclerosis
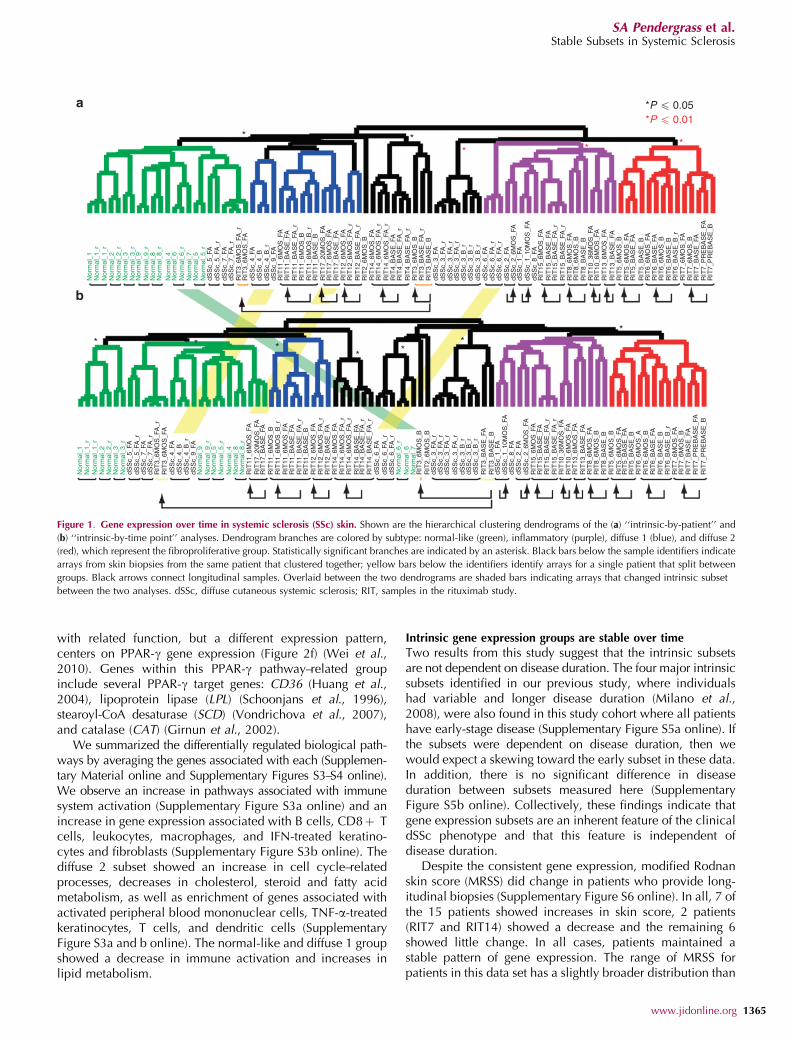
with related function, but a different expression pattern,centers on PPAR-g gene expression (Figure 2f) (Wei et al.,2010). Genes within this PPAR-g pathway–related groupinclude several PPAR-g target genes: CD36 (Huang et al.,2004), lipoprotein lipase (LPL) (Schoonjans et al., 1996),stearoyl-CoA desaturase (SCD) (Vondrichova et al., 2007),and catalase (CAT) (Girnun et al., 2002).
We summarized the differentially regulated biological path-ways by averaging the genes associated with each (Supplemen-tary Material online and Supplementary Figures S3–S4 online).We observe an increase in pathways associated with immunesystem activation (Supplementary Figure S3a online) and anincrease in gene expression associated with B cells, CD8þ Tcells, leukocytes, macrophages, and IFN-treated keratino-cytes and fibroblasts (Supplementary Figure S3b online). Thediffuse 2 subset showed an increase in cell cycle–relatedprocesses, decreases in cholesterol, steroid and fatty acidmetabolism, as well as enrichment of genes associated withactivated peripheral blood mononuclear cells, TNF-a-treatedkeratinocytes, T cells, and dendritic cells (SupplementaryFigure S3a and b online). The normal-like and diffuse 1 groupshowed a decrease in immune activation and increases inlipid metabolism.
Intrinsic gene expression groups are stable over time
Two results from this study suggest that the intrinsic subsetsare not dependent on disease duration. The four major intrinsicsubsets identified in our previous study, where individualshad variable and longer disease duration (Milano et al.,2008), were also found in this study cohort where all patientshave early-stage disease (Supplementary Figure S5a online). Ifthe subsets were dependent on disease duration, then wewould expect a skewing toward the early subset in these data.In addition, there is no significant difference in diseaseduration between subsets measured here (SupplementaryFigure S5b online). Collectively, these findings indicate thatgene expression subsets are an inherent feature of the clinicaldSSc phenotype and that this feature is independent ofdisease duration.
Despite the consistent gene expression, modified Rodnanskin score (MRSS) did change in patients who provide long-itudinal biopsies (Supplementary Figure S6 online). In all, 7 ofthe 15 patients showed increases in skin score, 2 patients(RIT7 and RIT14) showed a decrease and the remaining 6showed little change. In all cases, patients maintained astable pattern of gene expression. The range of MRSS forpatients in this data set has a slightly broader distribution than
Nor
mal
_1
Nor
mal
_2N
orm
al_2
_rN
orm
al_3
Nor
mal
_3_r
Nor
mal
_9N
orm
al_9
_r
Nor
mal
_8_r
Nor
mal
_8
Nor
mal
_6N
orm
al_6
_r
Nor
mal
_4
Nor
mal
_5N
orm
al_5
_r
Nor
mal
_7
Nor
mal
_1_r
Nor
mal
_1_r
Nor
mal
_1
Nor
mal
_2N
orm
al_2
_rN
orm
al_3
Nor
mal
_3_r
Nor
mal
_9
dSS
c_5_
FA
dSS
c_4_
FAdS
Sc_
4_B
dSS
c_4_
B_r
dSS
c_9_
FA
dSS
c_5_
FA_r
dSS
c_7_
FAdS
Sc_
7_FA
_rR
IT3_
6MO
S_F
A_r
RIT
3_6M
OS
_FA
dSS
c_5_
FA
dSS
c_4_
FAdS
Sc_
4_B
dSS
c_4_
B_r
dSS
c_9_
FAR
IT11
_6M
OS
_FA
RIT
11_6
MO
S_F
A
RIT
11_B
AS
E_F
AR
IT11
_BA
SE
_FA
_rR
IT11
_6M
OS
_BR
IT11
_6M
OS
_B_r
RIT
11_B
AS
E_B
RIT
17_B
AS
E_F
AR
IT12
_6M
OS
_FA
RIT
12_6
MO
S_F
A_r
RIT
12_B
AS
E_F
A_r
RIT
2_6M
OS
_BR
IT14
_6M
OS
_FA
RIT
14_6
MO
S_F
A_r
RIT
14_6
MO
S_F
A_r
RIT
4_B
AS
E_F
AR
IT4_
BA
SE
_FA
_rR
IT4_
BA
SE
_FA
_rR
IT3_
6MO
S_B
RIT
3_B
AS
E_F
A_r
RIT
3_B
AS
E_B
RIT
17_2
0MO
S_F
AR
IT17
_6M
OS
_FA
dSS
c_5_
FA_r
** *
**
** * *
*P � 0.01*P � 0.05
*
**
dSS
c_6_
FA_r
dSS
c_6_
FA_r
dSS
c_6_
FA
dSS
c_3_
FA_r
dSS
c_3_
FA_r
dSS
c_3_
FA_r
dSS
c_3_
FA_r
dSS
c_3_
B_r
dSS
c_3_
B_r
dSS
c_3_
B_r
dSS
c_1_
FA
dSS
c_2_
FAdS
Sc_
8_FA
dSS
c_2_
6MO
S_F
A
dSS
c_1_
10M
OS
_FA
dSS
c_3_
FAdS
Sc_
3_FA
_rdS
Sc_
3_FA
_rdS
Sc_
3_FA
_rdS
Sc_
3_B
_rdS
Sc_
3_B
_rdS
Sc_
3_B
_rdS
Sc_
6_FA
dSS
c_6_
FA_r
dSS
c_6_
FA_r
dSS
c_2_
FA
dSS
c_1_
FA
dSS
c_8_
FA
RIT
7_P
RE
BA
SE
_BR
IT7_
PR
EB
AS
E_F
AR
IT7_
PR
EB
AS
E_B
RIT
7_P
RE
BA
SE
_FA
RIT
7_B
AS
E_F
AR
IT7_
BA
SE
_FA
RIT
7_6M
OS
_BR
IT7_
6MO
S_F
AR
IT6_
BA
SE
_B_r
RIT
6_B
AS
E_F
AR
IT6_
6MO
S_F
A
RIT
5_6M
OS
_FA
RIT
5_6M
OS
_FA
RIT
5_6M
OS
_BR
IT5_
6MO
S_B
RIT
13_B
AS
E_F
AR
IT13
_6M
OS
_FA
RIT
10_6
MO
S_F
AR
IT10
_36M
OS
_FA
RIT
15_6
MO
S_F
AR
IT15
_BA
SE
_FA
RIT
15_B
AS
E_F
A_r
RIT
15_B
AS
E_F
A_r
RIT
8_6M
OS
_FA
RIT
8_6M
OS
_B
RIT
8_6M
OS
_BR
IT8_
6MO
S_F
AR
IT13
_BA
SE
_FA
RIT
13_6
MO
S_F
AR
IT10
_6M
OS
_FA
RIT
10_3
6MO
S_F
A
RIT
15_6
MO
S_F
A
RIT
3_6M
OS
_B
RIT
17_2
0MO
S_F
AR
IT17
_BA
SE
_FA
RIT
11_6
MO
S_B
RIT
11_6
MO
S_B
_rR
IT11
_6M
OS
_FA
RIT
11_B
AS
E_F
AR
IT11
_BA
SE
_FA
_rR
IT11
_BA
SE
_BR
IT12
_6M
OS
_FA
RIT
12_6
MO
S_F
A_r
RIT
14_6
MO
S_F
A_r
RIT
14_6
MO
S_F
A_r
RIT
14_B
AS
E_F
A_r
RIT
14_B
AS
E_F
A_r
RIT
14_B
AS
E_F
A
RIT
14_6
MO
S_F
AR
IT12
_BA
SE
_FA
RIT
2_6M
OS
_B
RIT
3_B
AS
E_B
RIT
3_B
AS
E_F
A
RIT
15_B
AS
E_F
AR
IT15
_BA
SE
_FA
_rR
IT15
_BA
SE
_FA
_r
RIT
8_B
AS
E_B
RIT
8_B
AS
E_B
RIT
5_B
AS
E_B
RIT
5_B
AS
E_F
A
RIT
6_6M
OS
_BR
IT6_
BA
SE
_B
RIT
7_6M
OS
_BR
IT7_
6MO
S_F
AR
IT6_
BA
SE
_B_r
RIT
6_B
AS
E_F
A
RIT
5_B
AS
E_B
RIT
5_B
AS
E_F
A
RIT
6_6M
OS
_BR
IT6_
6MO
S_A
RIT
6_B
AS
E_B
dSS
c_2_
6MO
S_F
A
dSS
c_1_
10M
OS
_FA
dSS
c_7_
FAdS
Sc_
7_FA
_rR
IT3_
6MO
S_F
A_r
RIT
3_6M
OS
_FA
Nor
mal
_9_r
Nor
mal
_8_r
Nor
mal
_8
Nor
mal
_6N
orm
al_6
_r
Nor
mal
_4
Nor
mal
_5N
orm
al_5
_r
Nor
mal
_7
Nor
mal
_1_r
Nor
mal
_1_r
Figure 1. Gene expression over time in systemic sclerosis (SSc) skin. Shown are the hierarchical clustering dendrograms of the (a) ‘‘intrinsic-by-patient’’ and
(b) ‘‘intrinsic-by-time point’’ analyses. Dendrogram branches are colored by subtype: normal-like (green), inflammatory (purple), diffuse 1 (blue), and diffuse 2
(red), which represent the fibroproliferative group. Statistically significant branches are indicated by an asterisk. Black bars below the sample identifiers indicate
arrays from skin biopsies from the same patient that clustered together; yellow bars below the identifiers identify arrays for a single patient that split between
groups. Black arrows connect longitudinal samples. Overlaid between the two dendrograms are shaded bars indicating arrays that changed intrinsic subset
between the two analyses. dSSc, diffuse cutaneous systemic sclerosis; RIT, samples in the rituximab study.
www.jidonline.org 1365
SA Pendergrass et al.Stable Subsets in Systemic Sclerosis

Nor
mal
_1N
orm
al_1
_rN
orm
al_1
_r
Nor
mal
_2_r
Nor
mal
_3_r
Nor
mal
_9_r
Nor
mal
_8_r
Nor
mal
_6_r
Nor
mal
_5_r
dSS
c_5_
FAdS
Sc_
5_FA
_rdS
Sc_
7_FA
dSS
c_7_
FAA
_r
dSS
c_4_
FAdS
Sc_
4_B
dSS
c_4_
B_r
dSS
c_9_
FA
RIT
3_6M
OS
_FA
_r
RIT
11_6
MO
S_F
A
RIT
11_6
MO
S_B
RIT
11_6
MO
S_B
_r
RIT
11_B
AS
E_F
AR
IT11
_BA
SE
_FA
_r
RIT
11_B
AS
E_B
RIT
17_2
0MO
S_F
AR
IT17
_6M
OS
_FA
RIT
17_B
AS
E_F
A
RIT
12_B
AS
E_F
A
RIT
12_6
MO
S_F
A
RIT
2_6M
OS
_BR
IT14
_6M
OS
_FA
RIT
14_6
MO
S_F
A_r
RIT
14_6
MO
S_F
A_r
RIT
14_B
AS
E_F
A_r
RIT
14_B
AS
E_F
A_r
RIT
3_6M
OS
_BR
IT3_
BA
SE
_FA
_rR
IT3_
BA
SE
_BdS
Sc_
3_FA
dSS
c_3_
FA_r
dSS
c_3_
FA_r
dSS
c_3_
FA_r
dSS
c_3_
B_r
dSS
c_3_
B_r
dSS
c_3_
B_r
dSS
c_6_
BA
dSS
c_6_
FA_r
dSS
c_6_
FA_r
dSS
c_2_
FA
dSS
c_1_
FAdS
Sc_
2_6M
OS
_FA
dSS
c_1_
10M
OS
_FA
dSS
c_8_
FAR
IT15
_6M
OS
_FA
RIT
15_B
AS
E_F
AR
IT15
_BA
SE
_FA
_rR
IT15
_BA
SE
_FA
_r
RIT
6_6M
OS
_FA
RIT
8_6M
OS
_FA
RIT
8_6M
OS
_BR
IT8_
BA
SE
_BR
IT10
_36M
OS
_FA
RIT
10_6
MO
S_F
AR
IT13
_6M
OS
_FA
PPARGC1A Peroxisome proliferative activated receptor, gamma, coact1, alpha
* P � 0.05
Diffuse 2InflammatoryDiffuse 1Normal-like
* P � 0.01
ALDH5A1 Aldehyde dehydrogenase 5 family, member A1HSD11B2 Hydroxysteroid (11-beta) dehydrogenase 2
NM_170740NM_000196NM_000288NM_015715NM_001001930
NM_003645
NM_001360NM_004462NM_013402NM_006918
NM_006111NM_001005291
NM_005532NM_005101NM_002462NM_001547NM_003641NM_021034NM_006435
NM_009587NM_004031NM_139266NM_000593NM_001511NM_004619NM_002737NM_002121NM_004843NM_002341NM_002852NM_005429NM_016639NM_000095NM_004994NM_001845NM_000064NM_003873NM_000093NM_004369NM_004460NM_001901NM_138455NM_005531NM_005475NM_000418NM_003246
NM_002982NM_000118NM_001560L12350Z74615NM_001848NM_002609NM_003810NM_001065
NM_001752NM_002889NM_007069NM_000237NM_138711NM_001001547NM_005063NM_002612
NM_003503NM_001238NM_003504NM_018101NM_031966NM_006845NM_004701NM_080668NM_001786NM_016343NM_001255NM_001813NM_202002NM_001237NM_007174NM_020240NM_003390
PEX7 Peroxisomal biogenesis factor 7PLA2G3 Phospholipase A2, group IIIPPARA Peroxisome proliferative activated receptor, alphaITGB8 Integrin, beta 8SLC27A2 Solute carrier family 27 (fatty acid transport), member 2MVK Mevalonate kinaseDHCR7 7-Dehydrocholesterol reductaseFDFT1 Farnesyl-diphosphate farnesyltransferase 1FADS1 Fatty acid desaturase 1SC5DL Sterol-C5-desaturase-likeELOVL5 ELOVL family member 5, elongation of long chain fatty acidsACAA2 Acetyl-coenzyme A acyltransferase 2SREBF1 Sterol regulatory element binding transcription factor 1
IFI27 Interferon, alpha-inducible protein 27G1P2 Interferon, alpha-inducible proteinMX1 Myxovirus resistance 1, interferon-inducible protein p78IFIT2 Interferon-induced protein with tetratricopeptide repeats 2IFITM1 Interferon induced transmembrane protein 1IFITM3 Interferon induced transmembrane protein 3IFITM2 Interferon induced transmembrane protein 2TIMP1 Tissue inhibitor of metalloproteinase 1LGALS9 Lectin, galactoside-binding, soluble, 9IRF7 Interferon-regulatory factor 7STAT1 Signal transducer and acivator of transcription 1TAP1 Transporter 1CXCL1 Chemokine ligand 1TRAF5 TNF receptor-associated factor 5PRKCA Protein kinase C, alphaHLA-DPB1 Major histocompatibility complex, class II, DP beta 1IL27RA Interleukin-27 receptor, alphaLTB Lymphotoxin beta (TNF superfamily, member 3)PTX3 Pentaxin-related gene, rapidly induced by IL-1 betaVEGFC Vascular endothelial growth factor CTNFRSF12A Tumor necrosis factor receptor family, member 12ACOMP Cartilage oligomeric matrix proteinMMP9 Matrix metalloproteinase 9COL4A1 Collagen, type IV, alpha 1C3 Complement component 3NRP1 Neuropilin 1COL5A1 Collagen, type V, alpha 1COL6A3 Collagen, type VI, alpha 3FAP Fibroblast activation protein, alphaCTGF Connective tissue growth factorCTHRC1 Collagen triple helix repeat containing 1IFI16 Interferon, gamma-inducible protein 16LNK Lymphocyte adaptor proteinIL4R Interleukin-4 receptorTHBS1 Thrombaspondin 1COL8A1 Collagen, type VIII, alpha 1CCL2 Chemokine (C-C motif) ligand 2ENG EndoglinIL13RA1 Interleukin-13 receptor, alpha 1THBS2 Thrombospondin 2COL1A1 Collagen, type I, alpha 1COL6A1 Collagen, type VI, alpha 1PDGFRB Platelet-derived growth factor receptor, betaTNFSF10 Tumor necrosis factor (ligand) superfamily, member 10TNFRSF1A Tumor necrosis factor receptor superfamily, 1A
CAT CatalaseRARRES2 Retinoic acid receptor responder 2HRASLS3 RAS-like suppressor 3LPL Lipoprotein lipasePPARG Peroxisome proliferative activated receptor, gammaCD36 CD36 antigen (collagen type I, thrombospondin receptor)SCD Stearoyl-CoA desaturasePDK4 Pyruvate dehydrogenase kinase, isoenzyme 4
CDC7 CDC7 cell division cycle 7CCNE1 Cyclin E1CDC45L CDC45 cell division cycle 45-likeCDCA8 Cell division cycle associated 8CCNB1 Cyclin B1KIF2C Kinesin family member 2CCCNB2 Cyclin B2CDCA5 Cell division cycle associated 5CDC2 Cell division cycle 2, G1 to S and G2 to MCENPF Centromere protein FCDC20 CDC20 cell division cycle 20 homologCENPE Centromere protein E, 312kDaFOXM1 Forkhead box M1CCNA2 Cyclin A2CIT Citron (rho-interacting, serine/threonine kinase 21)CDC42SE2 CDC42 small effector 2WEE1 WEE1 homolog
RIT
13_B
AS
E_F
AR
IT5_
6MO
S_B
RIT
5_6M
OS
_FA
RIT
5_B
AS
E_F
AR
IT5_
BA
SE
_B
RIT
6_B
AS
E_F
AR
IT6_
6MO
S_B
RIT
7_6M
OS
_FA
RIT
7_6M
OS
_BR
IT7_
BA
SE
_FA
RIT
7_P
RE
BA
SE
_FA
RIT
7_P
RE
BA
SE
_B
RIT
6_B
AS
E_B
RIT
6_B
AS
E_B
_r
RIT
14_B
AS
E_F
A
RIT
12_6
MO
S_F
A_r
RIT
3_6M
OS
_FA
* ** *
*
Nor
mal
_7N
orm
al_5
Nor
mal
_4N
orm
al_6
Nor
mal
_8
Nor
mal
_9
Nor
mal
_3
Nor
mal
_2
Above Median Below
1.00
0.6
0 –0.6
–1.0
0
NM_013261
1366 Journal of Investigative Dermatology (2012), Volume 132
SA Pendergrass et al.Stable Subsets in Systemic Sclerosis

the skin scores in Milano et al. (2008) (Supplementary FigureS5c online). When lSSc patients are excluded, the MRSS ofproliferative and inflammatory groups though broader indistributions are otherwise similar to our past study (Milanoet al., 2008) (Supplementary Figure S5c and d online). Theinflammatory group has the widest range of MRSS scores,whereas the normal-like group consistently shows lower MRSSscores in both data sets. Autoantibodies did not show asignificant association with intrinsic subset (SupplementaryTables S2 online). One diffuse 1 patient was anti-scl-70positive (1/4; P¼0.52, Fisher’s exact test), two inflammatorypatients were anti-RNA polymerase III positive (2/7;P¼0.12), and three unclassified patients were anti-scl-70positive (2/3; P¼0.051) and anti-centromere positive (1/3;P¼0.16). Diffuse 2 patients were negative for all threemeasured autoantibodies (P¼ 0.52).
Independent validation by immunohistochemistry
To validate the mRNA expression, we analyzed proteins forCOMP and IFN-induced transmembrane protein 3 (IFITM3)in representative biopsies spanning the intrinsic subsets.Both showed highest expression in the inflammatory subsetconsistent with gene expression data (Figure 2d andSupplementary Figure S7 online). Immunohistochemicalstaining results paralleled and confirmed the gene expressionfindings. COMP showed highest expression in the inflamma-tory subset and lowest in the diffuse 2 subset (Po0.05), withslightly higher expression in the diffuse 1 subset (Supple-mentary Figure S7a online); protein staining was mostprevalent in dermal fibroblasts of SSc patients of theinflammatory subset (Supplementary Figure S7c and gonline), while absent in controls (Supplementary Figure S7eonline). IFITM3 showed highest expression in both theinflammatory and diffuse 2 subsets (Supplementary FigureS7b online) and lowest expression in the diffuse 1 subset(Po0.05), with staining around the microvasculature in theskin (Supplementary Figure S7d and h online). These dataconfirm and extend the gene expression findings at theprotein level.
Validation of the 995-gene intrinsic subset gene set
We next determined whether the 995 genes selected in ourprevious study could stratify the cohort of patients describedhere into the intrinsic subsets (Milano et al., 2008), and thuscould be developed into a classifier for subset stratification. Intotal, 808 genes that passed basic quality filters were used toorganize the samples by hierarchical clustering (Figure 3b),showing that 26 out of 31 dSSc skin biopsies from differentanatomical sites or time points were grouped together bypatient (Figure 3a). The subsets identified previously are
similar to those found here using the same set of genes(Milano et al., 2008; Figure 3c). The fibroproliferative andinflammatory groups in the two data sets are indicated withthe fibroproliferative groups in red and the inflammatorygroup in purple. Subsets of overlapping genes between thegroups are indicated. The inflammatory signature is moreprominent in the data set presented here, whereas theproliferation signature is more prominent in our previousreport (Milano et al., 2008). Therefore, the original 995 genescan stratify an independent cohort into the intrinsic patientsubsets.
Surrogate gene biomarkers of MRSS
We previously reported a 177-gene expression signature thatcould serve as surrogate biomarker of MRSS (Milano et al.,2008). We refined this by identifying 44 genes that werepresent in the 177-gene signature, and also found in theintrinsic-by-patient analysis of this study (Figure 2). Organiz-ing the samples using these 44 genes revealed two majorsubdivisions of samples. One included both dSSc patientsand healthy controls (Figure 4a, group 1), whereas the otherincluded only dSSc patients (Figure 4a, group 2). Subjectsin these groups showed a significant difference in meanMRSS (group 1: mean 17.92, standard deviation 11.61;group 2: mean 25.90, standard deviation 8.52; t-test,P¼ 0.005; Figure 4b).
Gene expression gradients are evident within a geneexpression subset
To further power the analysis of SSc skin gene expressionacross time scales that cannot be easily captured withlongitudinal biopsies, we combined the gene expressionanalyses from both this and our previous study (Milano et al.,2008). The combined data set includes skin biopsies from 39patients with dSSc, 7 with lSSc, 3 with morphea, 1 patientwith eosinophilic fasciitis, and skin biopsies from 15 healthycontrol subjects, totaling 121 biopsies. After distance-weighteddiscrimination adjustment to remove systematic differences(Benito et al., 2004), intrinsic analysis was performed, 3,551probes selected (false discovery rate of 0.07%; Figure 5a),and the combined data sets clustered hierarchically. The twodata sets recapitulated the major intrinsic subsets (Figure 5a).Gene expression in the ‘‘fibroproliferative’’ and ‘‘inflamma-tory’’ groups both showed gradients of gene expressionwithin their respective groups (Figure 5a). In the proliferationgroup, the dendrogram split samples with high expression ofthe signature (‘‘Prolif 1’’) and low expression (‘‘Prolif 2’’).Similarly, the inflammatory group contained samples withhigh (‘‘Inflam 1’’) and low (‘‘Inflam 2’’) expression of thesignature. To determine if the intensity of these signatures
Figure 2. Recapitulation of the intrinsic subsets. In all, 2,377 genes were selected from 89 arrays (31 individuals) by ‘‘intrinsic-by-patient’’ analysis.
(a) Hierarchical clustering dendrogram shows the normal-like (green branches), inflammatory (purple), and fibroproliferative groups (diffuse 1 (blue), and
diffuse 2 (red)). Significance of clustering was determined by Statistical Significance of Clustering (SigClust). Healthy control identifiers are green and diffuse
cutaneous systemic sclerosis (dSSc) are black. RIT indicates samples in the rituximab study. Black bars indicate patient samples that clustered together;
the yellow bar indicates arrays from patient RIT3 that did not cluster together. (b) Heat map of genes and samples clustered hierarchically. (c) Fatty acid synthesis
genes. (d and e) Inflammatory and collagen genes. (f) Peroxisome proliferation–activated receptor-g (PPAR-g) genes. (g) Proliferation cluster genes.
www.jidonline.org 1367
SA Pendergrass et al.Stable Subsets in Systemic Sclerosis
dSS
c_3_
B_r
dSS
c_5_
FA
dSS
c_2_
FA
RIT
3_6M
OS
_FA
_rR
IT3_
6MO
S_F
A
RIT
14_6
MO
S_F
AR
IT14
_6M
OS
_FA
_rR
IT14
_6M
OS
_FA
_rR
IT14
_BA
SE
_FA
RIT
14_B
AS
E_F
A_r
RIT
14_B
AS
E_F
A_r
RIT
3_6M
OS
_BR
IT3_
BA
SE
_B
dSS
c_2_
FA
dSS
c_3_
FA
_rdS
Sc_
3_F
A_r
dSS
c_3_
FA
_rdS
Sc_
3_F
A_r
dSS
c_4_
FA
dSS
c_4_
BdS
Sc_
4_B
_rdS
Sc_
9_F
A
dSS
c_1_
FA
dSS
c_1_
10M
OS
_FA
dSS
c_8_
FA
RIT
5_6M
OS
_FA
RIT
5_6M
OS
_FA
RIT
5_B
AS
E_F
A
RIT
5_B
AS
E_F
AR
IT5_
BA
SE
_FA
_rR
IT5_
BA
SE
_FA
_rR
IT8_
6MO
S_F
AR
IT8_
6MO
S_B
RIT
10_3
6MO
S_F
AR
IT10
_36M
OS
_FA
RIT
13_3
6MO
S_F
A
RIT
11_6
MO
S_B
RIT
11_6
MO
S_B
_rR
IT11
_6M
OS
_FA
RIT
11_B
AS
E_F
AR
IT11
_BA
SE
_BR
IT11
_BA
SE
_FA
_rR
IT17
_20M
OS
_FA
RIT
17_6
MO
S_F
AR
IT17
_BA
SE
_FA
RIT
2_6M
OS
_BR
IT12
_6M
OS
_FA
RIT
12_B
AS
E_F
AR
IT5_
6MO
S_B
RIT
5_B
AS
E_B
RIT
6_6M
OS
_FA
RIT
8_B
AS
E_B
RIT
7_pr
eBA
SE
_BR
IT7_
preB
AS
E_F
AR
IT7_
BA
SE
_FA
RIT
7_6M
OS
_BR
IT7_
6MO
S_F
AR
IT6_
BA
SE
_B_r
RIT
6_B
AS
E_B
RIT
6_6M
OS
_BR
IT6_
BA
SE
_FA
RIT
12_6
MO
S_F
A_r
RIT
13_B
AS
E_F
A
dSS
c_6_
FA
dSS
c_6_
FA
_rdS
Sc_
6_F
A_r
dSS
c_5_
FA
_rdS
Sc_
7_F
AdS
Sc_
7_F
A_r
CDT1 DNA replication factor
**
* *P �0.05
OGDHL Oxoglutarate dehydrogenase-like
FXYD2 FXYD domain containing ion transport regulator 2
CD33 CD33 antigen (gp67)ICAM2 Intercellular adhesion molecule 2APOL3 Apoliporotein L, 3PTPRC Protein tyrosine phosphatase, receptor type, CCDW52 CDW52 antigen (CAMPATH-1 antigen)MARCKS Myristoylated alanine-rich protein kinase C substrateCOL6A3 Collagen, type VI, alpha 3
MSN Moesin
SCGB2A1 Secretoglobin, family 2A, member 1
Above Median Below
–1.0
0
–0.6
00.6
1.00
MPEG1 Macrophage expressed gene 1CPA3 Carboxypeptidase A3 (mast cell)VSIG4 V-set and immunoglobulin domain containing 4GIMAP6 GTpase, IMAP family member 6
MX1 Myxovirus (influenza virus) resistance 1, interfron-inducible proteinIFITI Interferon-induced protein with tetratricopeptide repeats 1TAP1 Transporter 1, ATP-binding cassetteCD8A CD8 antigen, alpha polypeptide (p32)DDX58 DEAD (Asp–Glu–Ala–Asp) box polypeptide 58PPIC Peptidylprolyl isomerase C (cyclophilin C)LILRB2 Leukocyte immunoglobulin-like receptor
MRCL3 Myosin regulatory light chain MRCL3
GBP3 Guanylate binding protein 3
GSG2 HaspinCENPE Centromere protein E, 312 kDaLOC123876 Xenobiotic/medium-chain fatty acid:CoA ligase
APOH Apoliporotein H (beta-2-glycoprotein I)
FXN Frataxin
SYT6 Synaptotagmin VIHPS3 Hermansky-Pudlak syndrome 3ZSCAN2 Zinc finger and SCAN domain containing 2
CBLL1 Cas_Br_M (murine) ecotropic retroviral transforming sequence-like 1
RAD51AP1 RAD51 associated protein 1
CACNG6 Calcium channel, voltage-dependent, gamma subunit 6
ATAD2 ATPase family, AAA domain containing 2
dSS
c_3_
B_r
dSS
c_3_
B_r
RIT
3_B
AS
E_F
A_r
Nor
mal
_1_r
Nor
mal
_1_r
Nor
mal
_9
Nor
mal
_4N
orm
al_5
Nor
mal
_8N
orm
al_8
_r
Nor
mal
_5_r
Nor
mal
_9_r
Nor
mal
_3_r
Nor
mal
_3N
orm
al_7
Nor
mal
_6N
orm
al_6
_r
Nor
mal
_2_r
Nor
mal
_2
Nor
mal
_1
LUM Lumican
TTR Transthyretin (prealbumin, amyloidosis type I)IL23A Interleukin-23, alpha subunit p19
PPFIA4 Protein tyrosine phosphatase interacting protein
1368 Journal of Investigative Dermatology (2012), Volume 132
SA Pendergrass et al.Stable Subsets in Systemic Sclerosis

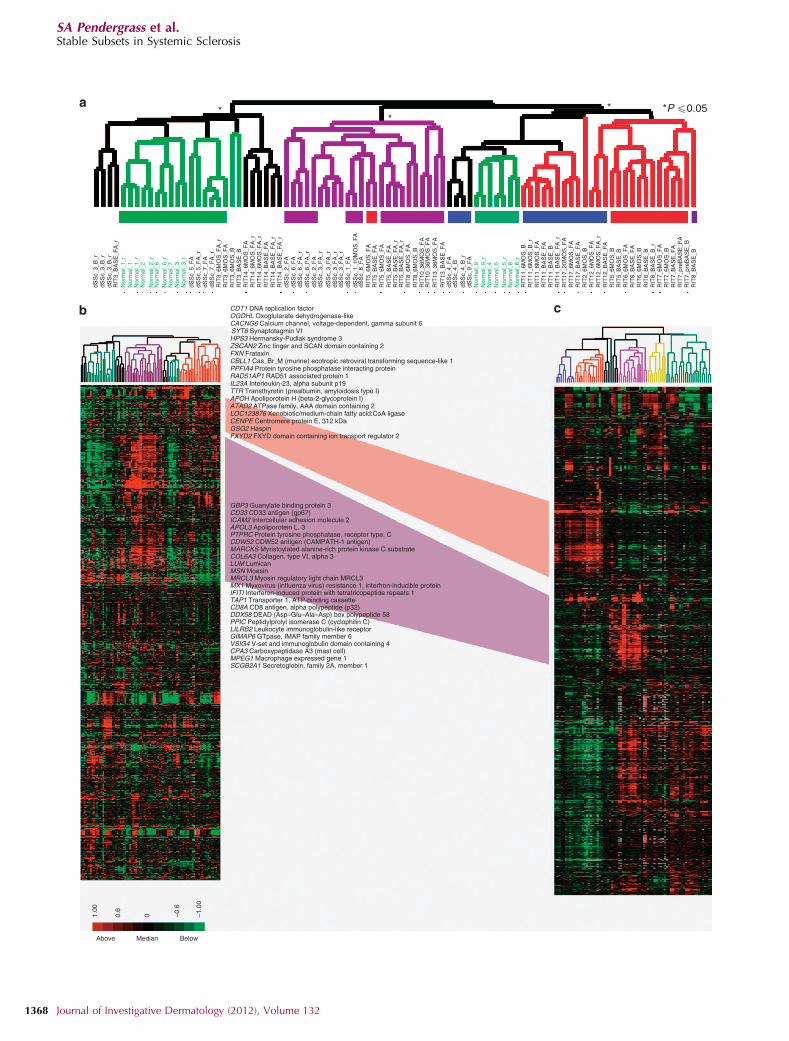
were associated with disease duration or MRSS, wecompared the distributions between these two parameterswithin each group (Figure 6). The ‘‘Prolif 1’’ group had asignificantly longer disease duration (t-test, P¼0.0027)
compared with ‘‘Prolif 2’’ and a trend towards a higherMRSS (Po0.05). In contrast, the ‘‘Inflam 2’’ group, which hada higher inflammatory gene expression signature, showed asignificantly higher average MRSS (t-test, P¼0.016), with
40
MR
SS
Above Median Below
–1.0
0
RECK Reversion-inducing-cysteine-rich protein with kazal motifsFBLN1 Fibulin 1PDGFRL Platelet-derived growth factor receptor-likeKAZALD1 Kazal-type serine protease inhibitor domain 1OSR2 Odd-skipped related 2
CDC7 CDC7 cell division cycle 7CENPE Centromere protein E, 312 kDaLGALS8 Lectin, galactoside-binding, soluble, 8 (galectin 8)TNFRSF12A Tumor necrosis factor receptor superfamily, member 12ATMOD3 Tropomodulin 3 (ubiquitous)CRTAP Cartilage associated proteinCFHL1 Complement factor H-related 1NR3C1 Nuclear receptor subfamily 3, group C, member 1
PCOLCE2 Procollagen C-endopeptidase enhancer 2
IGFBP5 Insulin-like growth factor binding protein 5PTGIS Prostaglandin l2 (prostacyclin) synthaseGHR Growth hormone receptorECM2 Extracellular matrix protein 2, female organ and adipocyte specific
ROBO3 Roundabout, axon guidance receptor, homolog 3
–0.6
00.6
1.00
30
20
10
Group 2Group 1
Group 2Group 1
Figure 4. Surrogate gene expression biomarkers of modified Rodnan skin score (MRSS). (a) Probes that matched the 177 genes with correlations above |0.5|
from Milano et al. (2008) were extracted from the ‘‘by-patient’’ intrinsic analysis, resulting in 44 genes. Hierarchical clustering results in two groups. Group 1
(red branches) includes dSSc and healthy control skin biopsies, whereas group 2 (black branches) includes primarily dSSc skin biopsies. The first row of bars
below the dendrogram indicates the intrinsic subset assignment in the ‘‘by-patient’’ analysis (normal-like, green; diffuse 1, blue; diffuse 2, red; inflammatory,
purple; unclassified, black). The second row of bars indicates sample diagnosis, dSSc (red) or healthy control (black). (b) Box plot comparison of MRSS between
the two groups shows a statistically significant difference in MRSS (two-sample t-test, P¼ 0.005). The MRSS at time of biopsy is plotted with open circles.
Figure 3. Concordance between data sets. Hierarchical clustering of 808 genes that matched the 995 intrinsic genes from Milano et al. (2008) (187 did not
pass the basic filtering criteria). (a) Hierarchical clustering dendrogram shows normal-like (green), inflammatory (purple), diffuse-proliferation (diffuse 1
(blue) and diffuse 2 (red)), and limited groups (yellow). Significant branches are indicated by asterisk. Black bars indicate subject samples that clustered together.
(b) Heat map for the 808 genes. (c) Heat map of the original 995 ‘‘intrinsic’’ genes in Milano et al. (2008). The fibroproliferative groups that are between
the two data sets are connected in red and the inflammatory groups connected in purple; genes found in the respective clusters of both data sets are
indicated. dSSc, diffuse cutaneous systemic sclerosis; RIT, samples in the rituximab study.
www.jidonline.org 1369
SA Pendergrass et al.Stable Subsets in Systemic Sclerosis

little difference in disease duration across the subgrouping.Thus, this analysis suggests that the gene expression withina group changes intensity with increased disease severityand/or duration.
DISCUSSIONSSc is a progressive disease, with skin going through variousphases that can begin with edema, then progressive fibrosis,and in some cases a skin softening late in the disease. Paststudies have suggested that SSc skin pathology evolves frominflammatory to fibrotic changes over time (Fleischmajeret al., 1977, 1978; Roumm et al., 1984; Kraling et al., 1995).Our molecular analyses suggest that inflammatory changes inthe skin are not part of an evolving process, leading tofibrosis, but rather represent a subset of patients, with other
patients having significantly less skin inflammation as part ofthe pathological process. The data presented here indicatethat the gene expression subsets are stable over time. Weshow that measuring gene expression of skin biopsies frompatients at different time points consistently classifies thepatients into the same intrinsic subsets. In addition, these datataken from a cohort of patients with shorter disease durationcompared with our previous studies of patients with longerdisease duration show the same disease subsets.
Strikingly, although patients do not appear to move betweensubsets over time, patients within inflammatory and particularlyfibroproliferative subsets show changes in the intensity of thesignature associated with disease duration. Similar changes inintensity of gene expression was found in a study of limitedSSc patients with and without PAH, suggesting that as disease
1.00
0.6
0
Above Median Below
–0.6
–1.0
0
Proliferative Inflammatory Lim Normal - like
Inflam 1 Inflam 2Prolif 1 Prolif 2
e
Figure 5. Consistent classification and expression gradients within subsets. Data from this study and from Milano et al. (2008) were merged to create a single
data set of 164 arrays. In all, 3,551 intrinsic genes were selected (false discovery rate of 0.07%). (a) Heat map of 2D hierarchical clustering. (b) Clustering
dendrogram with branches indicating the intrinsic subset each sample was assigned in the independent data set analyses (proliferative (red), inflammatory
(purple), limited (yellow), and normal-like (green)). The first row of bars below the dendrogram indicates patient diagnosis (dSSc, red; limited cutaneous SSc
(lSSc), yellow; morphea and eosinophilic fasciitis, blue; healthy controls, green). The second row of bars indicates the data set the samples were obtained:
Milano et al., red; this study, black. (c) Inflammatory gene cluster. (d) Proliferation gene cluster. (e) Fatty acid synthesis gene cluster.
1370 Journal of Investigative Dermatology (2012), Volume 132
SA Pendergrass et al.Stable Subsets in Systemic Sclerosis
becomes more severe, the intensity of the changes increases(Pendergrass et al., 2010). Our data are consistent withprevious observations that the expression of pro-fibroticgenes in non-lesional SSc fibroblasts tends to be intermediatebetween that observed in healthy and lesional SSc fibroblasts(Chen et al., 2005). Thus, our data suggest that differentbiological processes may underpin dSSc pathogenesis in dif-ferent patient subsets, and that the intensity of these processeschange over time. Although we cannot exclude the possibilitythat analysis of serial biopsies over a longer period of timewould show patients changing subsets, the data here supportthe notion that a patient could be assigned to a specificintrinsic subset early in their disease course. These observa-tions then have the potential of suggesting treatments thatblock the immune response if a patient displays an inflam-matory signature, or treatments that block fibrosis, if theyposses a fibroproliferative signature. Thus, as the pathogenicmechanisms underlying intrinsic subsets are identified, patientsubset identification might permit specific targeting of patho-genic processes. A TGFb-responsive signature appears todrive at least in part pathogenesis in the fibroproliferativesubset of patients (Sargent et al., 2009), emphasizing thecontribution of this cytokine to the phenotype of SSc (Leask,2009; Varga and Pasche, 2009), while IL-13 appears to playan important role in the inflammatory subset (Greenblattet al., 2012).
This data set recapitulates and validates our originallydefined inflammatory, diffuse-proliferation, and normal-like
subsets of SSc patients. The disease duration of the cohortanalyzed here (o2 years) is more homogeneous and moretypical of when the disease is most actively progressingcompared with our previous report. Despite these differences,the results show reproducibility of patient subsets in a com-pletely new patient population from a different clinical center.The reproducibility and stability of these gene expression-basedsubsets confirms that they reflect fundamental underlyingpathogenic processes that differ between patients in thedifferent subsets, rather than stages in the progressive disease.The addition of more serial biopsies covering a larger span oftime, coupled with longitudinal clinical data, should provideprognostic information for patients in each group.
A subset of patients in this analysis was treated withrituximab, a mAb that depletes mature B cells. In that open-label trial of rituximab, patients did not show a significantchange in skin score, pulmonary function, or other measuresof organ involvement, although immunohistochemistry showeddepletion of both peripheral and skin-resident B cells (Lafyatiset al., 2009). Several other unblinded clinical trials havesuggested some potential beneficial effect of rituximab onskin and/or lung disease in patients with SSc (Wesson et al.,2008; Bosello et al., 2010; Daoussis et al., 2010; Smith et al.,2010). Rituximab may prove to have value in SSc, and it isparticularly intriguing to consider its potential efficacy in SSc-associated interstitial lung disease where B cell infiltration isoften quite prominent (Lafyatis et al., 2007). However, ourstudies here are consistent with our clinical trial results,suggesting no or modest effect on skin disease. We thereforebelieve that rituximab is more likely to show efficacy for SSc-associated interstitial lung disease and that lung diseasewould be a better target for a large-scale trial of B celldepletion.
Comparing the results of Chung et al. (2009), who reportedtwo patients with dSSc that showed a response to treatmentwith imatinib mesylate (Chung et al., 2009), with the resultsreported here in rituximab-treated patients suggests that whena clinical response is evident, one is also likely to find a geneexpression response. Thus, gene expression may be useful asa surrogate outcome measure and for stratifying likely patientresponders in clinical trials. As the patients with an inflam-matory signature do not go on to display a fibroproliferativesignature, and vice versa, it is essential to target patients witha therapy that is appropriate to their gene expressionsignature. Therefore, it will be imperative to identify patientsubsets in clinical trials as drugs may target only those in asingle subset.
MATERIALS AND METHODSPatient selection, biopsy processing, and microarrayhybridization
All study participants gave written, informed consent under Boston
University Medical Center Institutional Review Board, an approved
protocol. The study conformed to Declaration of Helsinki principles.
Forearm lesional skin and, for a subset of patients, non-lesional back
skin were collected by punch biopsies (3–6 mm) from 13 patients
enrolled in the rituximab study (Lafyatis et al., 2009), as well as from
200
150
100
50
0
70
40
30
20
10
MR
SS
Inflam 1 Inflam 2 Inflam 1 Inflam 2
60
50
40
30
20
10
Prolif 1 Prolif 2 Prolif 1 Prolif 2M
RS
S
40
35
30
25
20
15Dis
ease
dur
atio
n (m
onth
s)D
isea
se d
urat
ion
(mon
ths)
Figure 6. Association between disease duration and modified Rodnan skin
score (MRSS) within the proliferation and inflammatory subsets. Above the
dendrogram in Figure 5, the ‘‘Prolif 1’’, ‘‘Prolif 2’’, ‘‘Inflam 1’’, and ‘‘Inflam 2’’
groups are indicated. These are groups showing differences in the intensity
of gene expression within the proliferative and inflammatory subsets.
Box plots show differences in disease duration and MRSS between (a and b)
‘‘Prolif 1’’ and ‘‘Prolif 2’’, as well as between (c and d) ‘‘Inflam 1’’ and
‘‘Inflam 2’’ are apparent. Disease duration (months) is plotted for each
blopsy at time collection (a and c). MRSS is plotted for each blopsy in
panels b and d.
www.jidonline.org 1371
SA Pendergrass et al.Stable Subsets in Systemic Sclerosis
9 additional patients with early dSSc (o1.5 years from diagnosis).
A total of 60 skin biopsies were collected from 22 patients with dSSc
and 9 healthy controls (Supplementary Tables S1 and S2 online).
RNA purification and microarray hybridization was carried out
essentially as described (Milano et al., 2008). Detailed methodology
is provided in Supplementary Text online.
Bioinformatic and statistical analyses
Intrinsic gene analysis was carried out as described previously
(Supplementary Material online; Milano et al., 2008). Gene expression
data were organized by average linkage hierarchically clustering
using Cluster 3.0 (http://bonsai.hgc.jp/~mdehoon/software/cluster/
software.htm) and visualized using Java TreeView (http://jtreeview.
sourceforge.net/). Significance of clustering was determined by
Statistical Significance of Clustering (Liu et al., 2008). Enriched GO
biological processes were determined using The Database for
Annotation, Visualization, and Integrated Discovery (Huang da
et al., 2007) (Supplementary Data File S5 online). Module maps
were created with Genomica. Correlation between gene expression
and clinical parameters were calculated using MATLAB (Mathworks,
Natick, MA). Statistics were carried out using R (http://www.
r-project.org/). Distance-weighted discrimination, utilizied the java
implementation (Benito et al., 2004). Gene expression data from this
study is available from NCBI GEO (http://www.ncbi.nlm.nih.gov/geo/;
accession number GSE32413).
CONFLICT OF INTERESTMLW, RL, and SAP have filed patent applications for gene expressionbiomarkers in scleroderma. MLW is a scientific founder and holds an interestin Celdara Medical, LLC, which is aiming to translate these discoveries intoclinical use.
ACKNOWLEDGMENTSThis work was supported by NIH grant U01-AR055063 to RL and MLW, andby a grant from the Scleroderma Research Foundation to MLW. MLW is aHulda Irene Duggan Arthritis Investigator. SAP was supported by the NIAMSAutoimmunity and Connective Tissue Training grant T32 AR007575-11 andby funds from the Arthritis Foundation.
SUPPLEMENTARY MATERIAL
Supplementary material is linked to the online version of the paper at http://www.nature.com/jid
REFERENCES
Barnett AJ, Miller MH, Littlejohn GO (1988) A survival study of patients withscleroderma diagnosed over 30 years (1953–1983): the value of a simplecutaneous classification in the early stages of the disease. J Rheumatol15:276–83
Benito M, Parker J, Du Q et al. (2004) Adjustment of systematic microarraydata biases. Bioinformatics 20:105–14
Bosello S, De Santis M, Lama G et al. (2010) B cell depletion in diffuseprogressive systemic sclerosis: safety, skin score modification and IL-6modulation in an up to thirty-six months follow-up open-label trial.Arthritis Res Ther 12:R54
Chen Y, Shi-Wen X, van Beek J et al. (2005) Matrix contraction by dermalfibroblasts requires transforming growth factor-beta/activin-linked kinase5, heparan sulfate-containing proteoglycans, and MEK/ERK: insightsinto pathological scarring in chronic fibrotic disease. Am J Pathol 167:1699–1711
Chung L, Fiorentino DF, Benbarak MJ et al. (2009) Molecular framework forresponse to imatinib mesylate in systemic sclerosis. Arthritis Rheum60:584–91
Daoussis D, Liossis SN, Tsamandas AC et al. (2010) Experience withrituximab in scleroderma: results from a 1-year, proof-of-principle study.Rheumatology (Oxford) 49:271–80
Fleischmajer R, Gay S, Meigel WN et al. (1978) Collagen in the cellular andfibrotic stages of scleroderma. Arthritis Rheum 21:418–28
Fleischmajer R, Perlish JS, West WP (1977) Ultrastructure of cutaneouscellular infiltrates in scleroderma. Arch Dermatol 113:1661–6
Gardner H, Shearstone JR, Bandaru R et al. (2006) Gene profiling ofscleroderma skin reveals robust signatures of disease that are imperfectlyreflected in the transcript profiles of explanted fibroblasts. ArthritisRheum 54:1961–73
Girnun GD, Domann FE, Moore SA et al. (2002) Identification of a functionalperoxisome proliferator-activated receptor response element in the ratcatalase promoter. Mol Endocrinol 16:2793–801
Greenblatt MB, Sargent JL, Farina G et al. (2012) Interspecies comparison ofhuman and murine scleroderma reveals IL-13 and CCL2 as diseasesubset-specific targets. Am J Pathol; e-pub ahead of print 11 January 2012
Huang H, Campbell SC, Bedford DF et al. (2004) Peroxisome proliferator-activated receptor gamma ligands improve the antitumor efficacy ofthrombospondin peptide ABT510. Mol Cancer Res 2:541–50
Huang da W, Sherman BT, Tan Q et al. (2007) The DAVID Gene FunctionalClassification Tool: a novel biological module-centric algorithm tofunctionally analyze large gene lists. Genome Biol 8:R183
Jimenez SA, Hitraya E, Varga J (1996) Pathogenesis of scleroderma. Collagen.Rheum Dis Clin North Am 22:647–74
Kraling BM, Maul GG, Jimenez SA (1995) Mononuclear cellular infiltrates inclinically involved skin from patients with systemic sclerosis of recentonset predominantly consist of monocytes/macrophages. Pathobiology63:48–56
Lafyatis R, Kissin E, York M et al. (2009) B cell depletion with rituximab inpatients with diffuse cutaneous systemic sclerosis. Arthritis Rheum60:578–83
Lafyatis R, O’Hara C, Feghali-Bostwick CA et al. (2007) B cell infiltration insystemic sclerosis-associated interstitial lung disease. Arthritis Rheum56:3167–8
Leask A (2009) Signaling in fibrosis: targeting the TGF beta, endothelin-1 andCCN2 axis in scleroderma. Front Biosci (Elite Ed) 1:115–22
Liu T, Zhang J (2008) Detection of V, III and I type collagens of dermal tissuesin skin lesions of patients with systemic sclerosis and its implication.J Huazhong Univ Sci Technol Med Sci 28:599–603
Liu Y, Hayes DN, Nobel A et al. (2008) Statistical significance of clustering forhigh-dimension, low-sample size data. J Am Statist Assoc 103:1281–93
Mayes MD, Lacey Jr JV, Beebe-Dimmer J et al. (2003) Prevalence, incidence,survival, and disease characteristics of systemic sclerosis in a largeUS population. Arthritis Rheum 48:2246–55
Milano A, Pendergrass SA, Sargent JL et al. (2008) Molecular subsets in thegene expression signatures of scleroderma skin. PLoS ONE 3:e2696
Pendergrass SA, Hayes E, Farina G et al. (2010) Limited systemic sclerosispatients with pulmonary arterial hypertension show biomarkers ofinflammation and vascular injury. PLoS ONE 5:e12106
Ramirez F, Tanaka S, Bou-Gharios G (2006) Transcriptional regulation of thehuman alpha2(I) collagen gene (COL1A2), an informative model systemto study fibrotic diseases. Matrix Biol 25:365–72
Roumm AD, Whiteside TL, Medsger Jr TA et al. (1984) Lymphocytes in theskin of patients with progressive systemic sclerosis. Quantification,subtyping, and clinical correlations. Arthritis Rheum 27:645–53
Sargent JL, Milano A, Bhattacharyya S et al. (2009) A TGFbeta-responsivegene signature is associated with a subset of diffuse scleroderma withincreased disease severity. J Invest Dermatol 130:694–705
Schoonjans K, Peinado-Onsurbe J, Lefebvre AM et al. (1996) PPARalpha andPPARgamma activators direct a distinct tissue-specific transcriptionalresponse via a PPRE in the lipoprotein lipase gene. EMBO J 15:5336–48
Scussel-Lonzetti L, Joyal F, Raynauld JP et al. (2002) Predicting mortality insystemic sclerosis: analysis of a cohort of 309 French Canadian patientswith emphasis on features at diagnosis as predictive factors for survival.Medicine (Baltimore) 81:154–67
1372 Journal of Investigative Dermatology (2012), Volume 132
SA Pendergrass et al.Stable Subsets in Systemic Sclerosis

Smith V, Van Praet JT, Vandooren B et al. (2010) Rituximab in diffusecutaneous systemic sclerosis: an open-label clinical and histopatho-logical study. Ann Rheum Dis 69:193–7
Varga J, Jimenez SA (1995) Modulation of collagen gene expression: itsrelation to fibrosis in systemic sclerosis and other disorders. Ann InternMed 122:60–2
Varga J, Pasche B (2009) Transforming growth factor beta as a therapeutictarget in systemic sclerosis. Nat Rev Rheumatol 5:200–6
Vondrichova T, de Capretz A, Parikh H et al. (2007) COX-2 and SCD, markersof inflammation and adipogenesis, are related to disease activity inGraves’ ophthalmopathy. Thyroid 17:511–7
Wei J, Ghosh AK, Sargent JL et al. (2010) PPARgamma downregulation by TGFssin fibroblast and impaired expression and function in systemic sclerosis:a novel mechanism for progressive fibrogenesis. PLoS ONE 5:e13778
Wesson RN, Sparaco A, Smith MD (2008) Chronic pancreatitis in a patientwith malnutrition due to anorexia nervosa. JOP 9:327–31
Whitfield ML, Finlay DR, Murray JI et al. (2003) Systemic and cell type-specific gene expression patterns in scleroderma skin. Proc Natl Acad SciUSA 100:12319–24
Whitfield ML, Sherlock G, Saldanha AJ et al. (2002) Identification of genesperiodically expressed in the human cell cycle and their expression intumors. Mol Biol Cell 13:1977–2000
www.jidonline.org 1373
SA Pendergrass et al.Stable Subsets in Systemic Sclerosis
Related Documents