1998;31;1547-1554 J. Am. Coll. Cardiol. A Schmermund, BJ Rensing, PF Sheedy, MR Bell, and JA Rumberger segmental analysis of coronary artery stenoses Intravenous electron-beam computed tomographic coronary angiography for This information is current as of December 29, 2011 http://content.onlinejacc.org on the World Wide Web at: The online version of this article, along with updated information and services, is located by on December 29, 2011 content.onlinejacc.org Downloaded from

Welcome message from author
This document is posted to help you gain knowledge. Please leave a comment to let me know what you think about it! Share it to your friends and learn new things together.
Transcript
1998;31;1547-1554 J. Am. Coll. Cardiol.A Schmermund, BJ Rensing, PF Sheedy, MR Bell, and JA Rumberger
segmental analysis of coronary artery stenosesIntravenous electron-beam computed tomographic coronary angiography for
This information is current as of December 29, 2011
http://content.onlinejacc.orgon the World Wide Web at:
The online version of this article, along with updated information and services, is located
by on December 29, 2011 content.onlinejacc.orgDownloaded from
Intravenous Electron-Beam Computed Tomographic CoronaryAngiography for Segmental Analysis of Coronary Artery Stenoses
AXEL SCHMERMUND, MD,* BENNO J. RENSING, MD, PHD,† PATRICK F. SHEEDY, MD,MALCOLM R. BELL, MBBS, FRACP, JOHN A. RUMBERGER, MD, PHD, FACC
Rochester, Minnesota and Rotterdam, The Netherlands
Objectives. We sought to identify and localize significant coro-nary stenoses on a segmental basis by electron-beam computedtomography (EBCT) and intravenous administration of a contrastagent.
Background. The clinical applicability and limitations of intra-venous EBCT coronary angiography have not been defined.
Methods. EBCT was performed within 24 h of selective coro-nary angiography (SCA) in 28 patients (19 men and 9 women,mean [6SD] age 60 6 10 years). After examination for coronarycalcium, EBCT coronary angiography was performed using over-lapping slices (in-plane resolution 0.34 to 0.41 mm) with anominal slice thickness of 1 mm. Based on quantitative analysis ofSCA, lumen diameter narrowing >250% (i.e., significant stenoses)was evaluated in 8 (major) or 12 (including side branches)coronary artery segments, using both two-dimensional (tomo-graphic) and three-dimensional (volume) data sets.
Results. Of the 330 segments assessable by SCA, 237 (72%)were visualized by EBCT. The sensitivity (6SE) for detection ofsignificant stenoses was 82 6 6%; specificity was 88 6 2%; positiveand negative predictive values were 57 6 7% and 96 6 2%,
respectively; and overall accuracy was 87 6 2%. If only eight(major) coronary artery segments were considered, 194 (88%) of221 segments were visualized, and the overall accuracy was 90 62%. Seven (18%) of 38 significantly stenotic segments wereclassified as having <50% stenoses by EBCT. Six of these seg-ments (86%), but only 9 (29%) of the 31 correctly classifiedstenotic segments, were severely calcified (area >20 mm2, p 50.02). In 23 (12%) of 199 nonstenotic segments falsely classified ashaving >250% stenosis by EBCT, the lumen diameter was signifi-cantly smaller than that of the segments correctly classified asnegative (mean [6SD] 1.5 6 0.8 vs. 2.9 6 1.1 mm, p < 0.001).
Conclusions. Intravenous EBCT coronary angiography allowsfor accurate segmental evaluation of significant disease in themajor coronary arteries and may be of value for ruling outsignificant disease. The main determinant of false negative resultsis substantial segmental calcification, whereas the main determi-nant of false positive results is small vessel size.
(J Am Coll Cardiol 1998;31:1547–54)©1998 by the American College of Cardiology
Direct visualization of the epicardial coronary arteries isnecessary to establish the presence and focal severity ofcoronary lumen disease. At the moment, selective coronaryangiography (SCA) is the only clinical method to accuratelyvisualize and quantify coronary artery anatomy in vivo. Al-though this method provides for exceptional spatial resolutionand a general “road map” of the coronary system, it isexpensive, has a small but definite risk of complications and
requires at least a brief hospital stay and a period of observa-tion for several hours after the procedure (1). A convenient,noninvasive and safe means to perform coronary angiographyclearly would be of clinical benefit.
Intravenous coronary angiography based on contrast-enhanced electron-beam computed tomography (EBCT) wasintroduced by Moshage et al. (2). Compared with othernoninvasive approaches (3–6), EBCT offers a unique combi-nation of superior temporal and spatial resolution with gener-ation of a three-dimensional data set. Several published re-ports following the original report have confirmed thefeasibility of using EBCT for the detection of stenoses in thecoronary arteries (7–9) or venous and arterial bypass grafts(10). However, its potential for broad clinical applicabilitydepends on 1) correct identification and localization of steno-ses on a coronary segmental basis; and 2) exact definition ofmethodologic limitations related to variables such as vesselsize, segmental anatomy and presence of coronary calcifica-tion. The purpose of this study was to evaluate these issues inpatients undergoing SCA for the traditional assessment ofcoronary artery disease.
From the Division of Cardiovascular Diseases, Department of InternalMedicine and Department of Diagnostic Radiology, Mayo Clinic and Founda-tion, Rochester, Minnesota; and †Thorax Center, Rotterdam, The Netherlands.This study was funded by the Mayo Foundation (Grant 342-X-96), which alsopartly supported Dr. Rumberger. Dr. Schmermund was supported by a grantfrom the German Research Association (Deutsche Forschungsgemeinschaft,Schm 1233/1-1, Bonn) and a Heart Center Essen Cardiovascular Research Grant(Schm 97-1). Dr. Rensing was supported by a grant from the Dutch Interuni-versity Cardiology Institute (ICIN), Utrecht, The Netherlands.
Manuscript received August 29, 1997; revised manuscript received Novem-ber 25, 1997, accepted February 25, 1998.
*Present address and address for correspondence: Dr. Axel Schmermund,Department of Cardiology, University Clinic Essen, Hufelandstrasse 55, D-45122Essen, Germany. E-mail: [email protected].
JACC Vol. 31, No. 7June 1998:1547–54
1547
©1998 by the American College of Cardiology 0735-1097/98/$19.00Published by Elsevier Science Inc. PII S0735-1097(98)00132-6
by on December 29, 2011 content.onlinejacc.orgDownloaded from
MethodsPatients. The study was approved by the Mayo Clinic
Institutional Review Board, and all patients provided writteninformed consent before participation. Thirty patients under-going diagnostic SCA agreed to participate and to have EBCTperformed within 24 h of SCA. Owing to technical problemswith the image storage medium (an optical disk), data on twopatients were irretrievable, and therefore we report the resultsfrom 28 consecutive patients. The patients’ mean (6SD) agewas 60 6 11 years (range 39 to 75); there were 19 men and 9women. Their mean body mass index was 26.5 6 3.6 kg/m2
(range 17.9 to 38.0). Eleven patients had a previous myocardialinfarction, and 18 were taking beta-blockers.
Selective coronary angiography. SCA (Judkins technique)was performed with a minimum of five views of the left systemand two views of the right system. All patients received 0.4 mgof nitroglycerin sublingually before imaging. The angiogramswere visually assessed by two experienced angiographers whohad no knowledge of the results of EBCT. Segmental stenosesestimated to represent $50% lumen diameter reduction werejudged to be “significant.” Quantitative coronary angiography(QCA), using a system validated in our laboratory (11), wasperformed to confirm these visual estimations and to deter-mine a more precise degree of stenosis in the projection judgedto show the worst narrowing. To assess the potential contribu-tion of lumen size to the accuracy of the EBCT evaluation, thelength of the lesion with an absolute lumen diameter #1.5 mmwas computed for all significant stenoses determined by QCA,except in cases of total vessel occlusion. This diameter waschosen because the effective slice thickness using our protocolwas 1 mm. Vessels with dimensions on this order thus had apotential for limited resolution, especially if not lying perpen-dicular to the tomographic imaging plane.
Twelve distinct coronary segments, as defined by the Amer-ican Heart Association (12) (Fig. 1), were used for the SCAanalysis and for comparison with intravenous EBCT coronaryangiography. All segments were scored depending on thepresence and severity of stenoses: 1 5 angiographically normalsegment (0% stenosis); 2 5 nonobstructive disease (.0% to49% lumen diameter stenosis); 3 5 50% to 74% lumendiameter stenosis; 4 5 75% to 99% lumen diameter stenosis;and 5 5 total occlusion (100% lumen diameter stenosis). Insegments visually estimated to contain significant stenoses (on
the order of $50% diameter narrowing), the final classificationof segments in categories 2 through 4 was based on QCAmeasurements. Finally, the minimal and reference lumendiameters of all coronary segments, irrespective of the pres-ence of stenoses, were determined by QCA.
In three patients, three coronary segments were distal to anoccluded segment not supplied by collateral vessels and wereexcluded from the analysis. In three more patients, one lesionper patient was treated by balloon angioplasty before theEBCT examination. These segments were also excluded fromthe analysis because of the potential for factors such as earlypostprocedural restenosis or arterial spasm, which might con-found comparison with EBCT.
Electron-beam computed tomography. A Siemens Evolu-tion EBCT scanner (Imatron C-150LXP) was used. A routineexamination of coronary calcium without contrast enhance-ment was obtained in all patients using a standardized protocol(13,14). Quantifiable segmental calcium was evaluated asreported by Baumgart et al. (15) and, slightly modified, byKajinami et al. (16). A total calcium score was computed as thesum of all segmental scores (13,14).
For the intravenous EBCT coronary angiogram, imageswere obtained in 100 ms after an electrocardiographic (ECG)trigger signal at 80% of the RR interval. A tomographic slicethickness of 3 mm and a patient table increment of 2 mm, assuggested by Moshage et al. (2), resulted in overlapping sliceswith a nominal thickness of 1 mm. Imaging was done using an18- or 21-cm field of view depending on individual heart size.A matrix size of 512 3 512 pixels yielded in-plane pixeldimensions of 0.35 3 0.35 mm (18-cm field of view) or 0.41 30.41 mm (21-cm field of view). Tomographic imaging com-menced at the level of the aortic root above the coronary ostia.Patients were instructed to briefly hyperventilate just beforescanning and then to hold their breath for the duration of theexamination. A nonionic, reduced osmolar contrast medium(iopamidol 370) was injected through an 18-gauge angiocathinto an antecubital vein with the use of a powered injector. Thecirculation time was determined by a 10-ml bolus of contrastmedium and measurements of computed tomographic (CT)density values over 10 preset time frames over roughly 20 s in
Abbreviations and Acronyms
CI 5 confidence intervalEBCT 5 electron-beam computed tomography
(tomographic)ECG 5 electrocardiogram, electrocardiographicLAD 5 left anterior descending coronary arteryLCx 5 left circumflex coronary arteryQCA 5 quantitative coronary angiographyRCA 5 right coronary arterySCA 5 selective coronary angiography
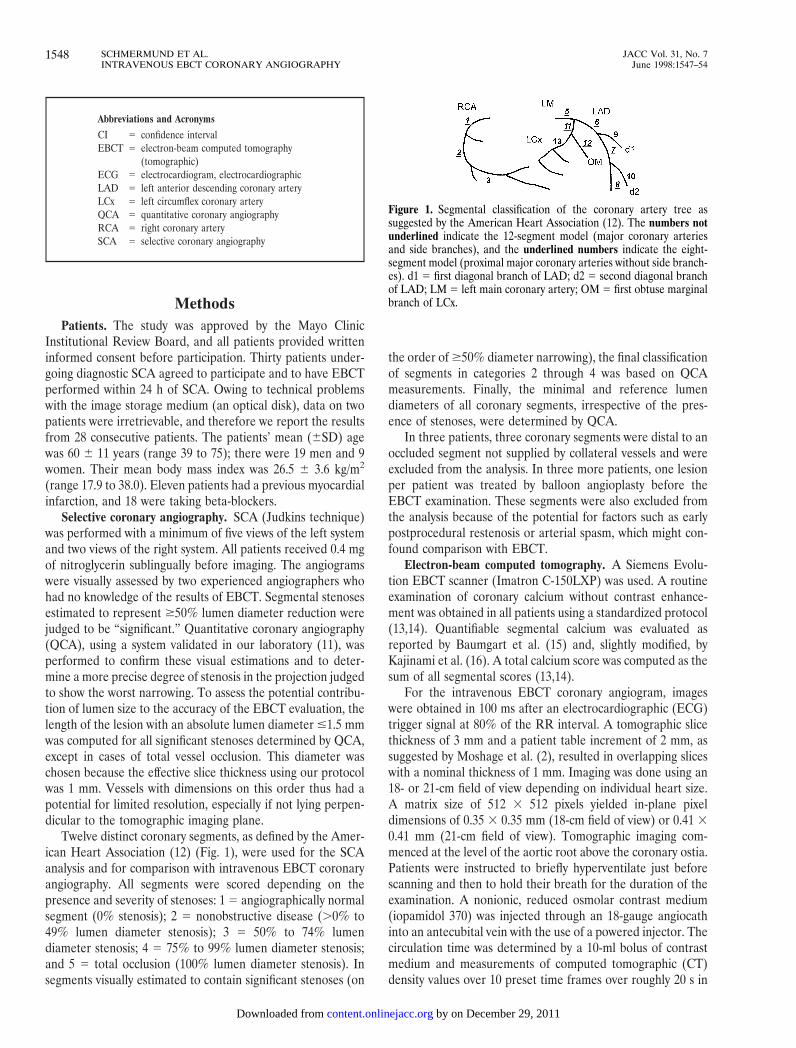
Figure 1. Segmental classification of the coronary artery tree assuggested by the American Heart Association (12). The numbers notunderlined indicate the 12-segment model (major coronary arteriesand side branches), and the underlined numbers indicate the eight-segment model (proximal major coronary arteries without side branch-es). d1 5 first diagonal branch of LAD; d2 5 second diagonal branchof LAD; LM 5 left main coronary artery; OM 5 first obtuse marginalbranch of LCx.
1548 SCHMERMUND ET AL. JACC Vol. 31, No. 7INTRAVENOUS EBCT CORONARY ANGIOGRAPHY June 1998:1547–54
by on December 29, 2011 content.onlinejacc.orgDownloaded from
the ascending aorta. For the intravenous coronary angiogram,the contrast agent was injected at a rate of 4 ml/s, and imagingcommenced at the “circulation time” plus 3 s. The total volumeof contrast agent injected ranged from 120 to 160 ml. Itdepended on the patient’s heart rate and the time needed forcontinuous opacification of the coronary artery lumen. Forty“slices” scanned one at a time with each cardiac cycle required40 s at a heart rate of 60 beats/min and 20 s at a heart rate of120 beats/min. To cover a time of 40 s, 160 ml had to be given(4 ml/s), and to cover 20 s, 80 ml had to be given. To ensureadequate opacification, we gave a minimum of 110 ml perpatient for the EBCT coronary angiogram in this initial series,but we did not give .150 ml. This added up to 120 to 160 ml,including the 10 ml of contrast agent used for determiningcirculation time.
The first five patients entered into the study were scannedin the neutral (transaxial) position. Interim analysis of imagesshowed that artifacts obscuring the tomographic trajectory ofthe mid right coronary artery (RCA) could be decreased bytilting the patient table up by 10° and slewing it to the patient’sright by 10°; this position was used for all subsequent exami-nations. The initial software configuration of the scannerlimited the examination of most patients to 40 tomographicslices (covering ;8 cm); however, a software update availablefor examination of the last five patients enabled up to 120slices, so that 50 to 60 slices through the entire cardiac volumecould be obtained (covering ;10 to 12 cm).
The mean heart rate at baseline was 69 6 10 beats/min(range 55 to 100). Because the EBCT allowed ECG-triggeredscanning at each cardiac cycle up to heart rates of 120 beats/min,and because with higher heart rates the breathholding time isshorter due to the increased scanning frequence, it was our aimto examine patients with heart rates $80 beats/min. We thusadministered 0.4 to 1.0 mg of intravenous atropine to 23 pa-tients with rest heart rates ,75/min. Sublingual nitroglycerin(0.4 mg) was administered to 21 patients for dilation of thecoronary epicardial arteries. Seven patients refused to takenitroglycerin or had a headache at the time of the EBCT study.During EBCT coronary angiography, the mean heart rateincreased to 81 6 13 beats/min (range 60 to 110, p , 0.001 vs.baseline heart rate using the paired t test). No side effects werenoted with the use of atropine and nitroglycerin, except fororal dryness in several patients. Total breathholding time was34 6 5 s (range 25 to 42) and was well tolerated by all patients.
All two-dimensional tomograms were evaluated for imagequality, patient motion, correct ECG triggering, arterial con-trast opacification and presence of extensive focal calciumdeposits. The EBCT-derived three-dimensional angiographicdata were processed on a Siemens Magic View workstationaccording to the suggestions by Moshage et al. (2) andAchenbach et al. (7,10). This workstation allows rendering ofthree-dimensional volumetric images from the overlappingtwo-dimensional tomograms and was used to analyze theimages in several different ways. For three-dimensional ren-dering analysis, the tomographic frames were manually editedso as to include all contrast-enhanced cardiac structures and to
provide for an overview of the heart as a whole. Portions of theleft and right atria were excluded on an individual basis toallow for better assessment of the proximal left circumflexcoronary artery (LCx) and RCA, respectively. As a first step,these data were rendered as a “shaded surface display” (i.e.,display of gray scale [density] values of the leading edge ofeach structure within a preset range of density values) (Fig.2a). According to the method of Achenbach et al. (7), anEBCT density of 80 Hounsfield units was chosen as the lowerthreshold so as to exclude nonenhanced cardiac structures;however, no upper threshold density limit was set. In a secondstep, only the aortic root and coronary epicardial arteries wereedited to be included in the three-dimensional representation.This data set was rendered as “shaded surface display” asdescribed earlier (Fig. 2b), and also as “maximal intensityprojection”. In this latter projection, only the maximal densityvalues at each point in the three-dimensional volume aredisplayed, and the final picture is similar to a conventional(arterial) angiogram in that structures are projected over oneanother. In addition, “curved surface reformation” (alsotermed “multiplanar reformation”) was obtained of the majorcoronary arteries in all patients. In this technique, the plane ofa specific artery is chosen to be displayed as a two-dimensionalimage. This then represents a “curved surface” from within thethree-dimensional volume, following the curved trajectory ofthe respective artery (Fig. 2d). The final interpretation of anyindividual EBCT coronary angiogram was based on an inte-grated opinion based on all image rendering techniques.
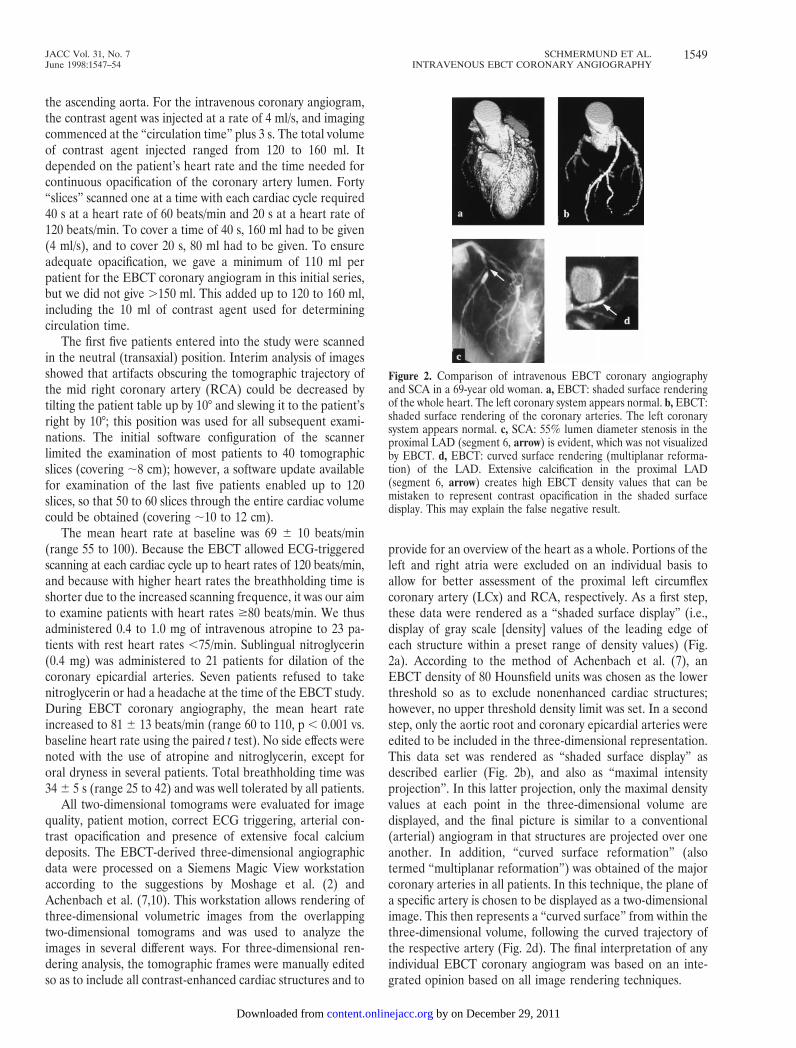
Figure 2. Comparison of intravenous EBCT coronary angiographyand SCA in a 69-year old woman. a, EBCT: shaded surface renderingof the whole heart. The left coronary system appears normal. b, EBCT:shaded surface rendering of the coronary arteries. The left coronarysystem appears normal. c, SCA: 55% lumen diameter stenosis in theproximal LAD (segment 6, arrow) is evident, which was not visualizedby EBCT. d, EBCT: curved surface rendering (multiplanar reforma-tion) of the LAD. Extensive calcification in the proximal LAD(segment 6, arrow) creates high EBCT density values that can bemistaken to represent contrast opacification in the shaded surfacedisplay. This may explain the false negative result.
1549JACC Vol. 31, No. 7 SCHMERMUND ET AL.June 1998:1547–54 INTRAVENOUS EBCT CORONARY ANGIOGRAPHY
by on December 29, 2011 content.onlinejacc.orgDownloaded from
The EBCT coronary angiographic three-dimensional im-ages were analyzed on the same segmental basis as the SCAs(12), defined with reference to angiographic anatomic land-marks such as vessel bifurcations and side branches, whichcould readily be identified from the EBCT coronary angio-grams. Analysis was performed in the 12 angiographicallydefined segments representing the major coronary arteries andside branches (Fig. 1) to duplicate the analysis of the SCA. Ina separate analysis that excluded side branches, only eightsegments in the proximal major coronary arteries were consid-ered. The EBCT coronary angiograms were evaluated by twoinvestigators who had no knowledge of the results of SCA andwho reached agreement on their classification replicating thegrading system (1 through 5) used for the selective angiograms.Interobserver variability for EBCT was tested in nine randomlyselected patients in whom a second team of two investigatorsanalyzed the coronary segments, without knowledge of eitherthe SCA or the initial EBCT readings.
Statistics. Statistical analyses were performed using SPSS(version 6.1.4), MedCalc (4.16) and a desktop computer. Dataare reported as the mean value 6 SD, unless otherwiseindicated. The segmental classification of the SCA and thepresence of significant stenoses determined by QCA wereconsidered the “true” observations against which segmentalEBCT variables were compared. The standard errors forsensitivity, specificity, positive and negative predictive valuesand accuracy were determined as described by Diamond andForrester (17). Characteristics of groups of patients or coro-nary segments were compared using an unpaired or paired ttest where appropriate. Proportions were compared by thechi-square test. Kappa statistics were used to evaluate interob-server agreement. To test for independence of the results fordifferent segments in the same patients, chi-square analysis ofindependence was performed. Also, the correlation betweenintraperson mean segmental gradings from SCA and thosefrom EBCT was tested for homogeneity across patients. A pvalue ,0.05 was considered significant for all statistical evalu-ations.
ResultsSelective coronary angiography. Of the 28 patients, 18
(64%) had at least one significant stenosis (50% to 100%lumen diameter stenosis, grades 3 to 5), 8 (29%) had nonob-structive disease (no segments graded .2) and 2 (7%) hadangiographically normal coronary arteries (only segmentsgraded 1). In the 18 patients with significant angiographicdisease, a total of 47 significant segmental stenoses (graded$3) were noted: 22 in the left anterior descending coronaryartery (LAD), 11 in the LCx and 14 in the RCA. Ten patientshad one-vessel disease, two had two-vessel disease and six hadthree-vessel disease. There were no significant stenoses of anyleft main coronary artery segment.
Of the 47 segments graded $3, 44 (94%) were located inthe major coronary arteries or major side branches for the12-segment model. Thirty-seven segments graded $3 (79%)were seen in the proximal major coronary arteries without sidebranches for the eight-segment model. Of note, no patient hada segmental stenosis $50% outside the eight-segment model(either in the 12-segment model or further distal) who did notalso have a proximal stenosis $50%.
Electron-beam computed tomography. Quantifiable coro-nary calcium was found in 25 patients (89%). No calcium wasseen in three patients: two with angiographically normalcoronary arteries and one with nonobstructive disease who hadsix segments graded 2. The mean total calcium score washigher in patients with obstructive angiographic disease (seg-ments graded $3, n 5 18) than in patients with nonobstructiveangiographic disease (segments graded 2, n 5 8) (996.7 6775.1 [range 18.5 to 2366.9] vs. 179.4 6 230.5 [range 0 to 583.3],p 5 0.001).
Of the 330 coronary segments assessable from SCA (12segments per patient with six segments excluded from theanalysis), 237 (72%) were visualized by EBCT. Table 1 gives anoverview of the comparison between EBCT and SCA withrespect to the coronary segmental disease grade. Table 2provides the same data using the eight-segment model. In this
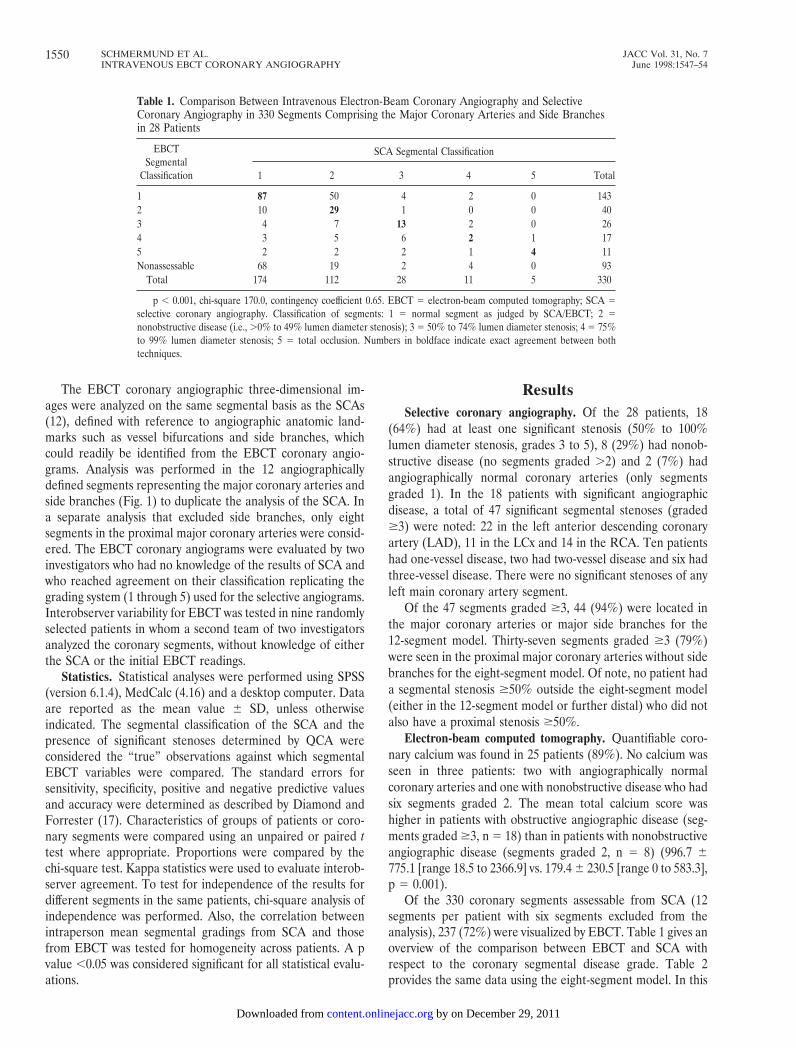
Table 1. Comparison Between Intravenous Electron-Beam Coronary Angiography and SelectiveCoronary Angiography in 330 Segments Comprising the Major Coronary Arteries and Side Branchesin 28 Patients
EBCTSegmental
Classification
SCA Segmental Classification
1 2 3 4 5 Total
1 87 50 4 2 0 1432 10 29 1 0 0 403 4 7 13 2 0 264 3 5 6 2 1 175 2 2 2 1 4 11Nonassessable 68 19 2 4 0 93
Total 174 112 28 11 5 330
p , 0.001, chi-square 170.0, contingency coefficient 0.65. EBCT 5 electron-beam computed tomography; SCA 5selective coronary angiography. Classification of segments: 1 5 normal segment as judged by SCA/EBCT; 2 5nonobstructive disease (i.e., .0% to 49% lumen diameter stenosis); 3 5 50% to 74% lumen diameter stenosis; 4 5 75%to 99% lumen diameter stenosis; 5 5 total occlusion. Numbers in boldface indicate exact agreement between bothtechniques.
1550 SCHMERMUND ET AL. JACC Vol. 31, No. 7INTRAVENOUS EBCT CORONARY ANGIOGRAPHY June 1998:1547–54
by on December 29, 2011 content.onlinejacc.orgDownloaded from
case, three segments were excluded owing to balloon angio-plasty at the time of SCA. Of the 221 remaining segments, 194(88%) were visualized by EBCT. Nonobstructive angiographicdisease (segments graded 2) were frequently underestimatedfrom EBCT, whereas obstructive disease (segments graded 3)were most often correctly classified or even overestimatedfrom EBCT. The contingency coefficient as a measure of thedegree of the relation between SCA and EBCT was 0.65 forthe 12-segment model and 0.71 for the 18-segment model(chi-square statistics; 1 being the optimal value). There was asignificant correlation between intraperson mean segmentalgrading from SCA and that from EBCT (R2 5 0.5, p 50.0065), indicating that the segmental comparisons describedearlier were homogeneous across patients and not due to“clusters” in some of the patients.
Table 3 gives sensitivity and specificity data with regard tothe diagnosis of significant stenoses by EBCT (grades 3 to 5 vs.1 or 2) for analysis of either 12 or 8 segments per patient andcompares the overall results with those obtained for each ofthe major coronary arteries. Consistently, the negative predic-tive values were high (93% to 100%) and better than thepositive predictive values (25% to 84%), and a better overallaccuracy was achieved in the LAD than in the RCA or LCx.There was no significant heterogeneity across patients, as thechi-square analysis of independence yielded p values of 0.7 forsensitivity and 0.16 for specificity across patients. In other
words, the distribution of sensitivities and specificities was notdifferent from a random distribution in our patients.
Table 4 gives the results yielded by two independent groupsof observers in nine randomly selected patients. Althoughsome variability was noted with regard to classification ofsegments graded 1 or 2, only one lesion was scored “signifi-cant” by one group of observers and “nonsignificant” by theother group. This was in an ostial lesion with a 59% diameterstenosis of the first obtuse marginal branch in a patient inwhom two LAD lesions were correctly identified by bothgroups of observers. However, a total of four stenoses weredescribed by one group of observers and judged “nonassess-able” by the other group. The mean (6SE) kappa statistic was0.88 6 0.04 (95% confidence interval [CI] 0.80 to 0.97) ifcalculated with respect to the segmental differentiation ofsignificant angiographic stenoses from minor or no disease,including judgment of segment assessability, and it was 0.59 60.06 (95% CI 0.46 to 0.71) for the overall grading.
A total of seven significant stenoses (18% of 38 segmentsgraded $3 by coronary angiography) were not detected byEBCT (Table 1, Fig. 2): three in the LAD, three in the LCxand one in the RCA. These lesions tended to have a less severediameter stenosis, a larger minimal lumen diameter and ashorter segment measuring #1.5 mm in absolute diameterthan lesions that were detected by EBCT, but these differenceswere not statistically significant (Table 5). However, the area of
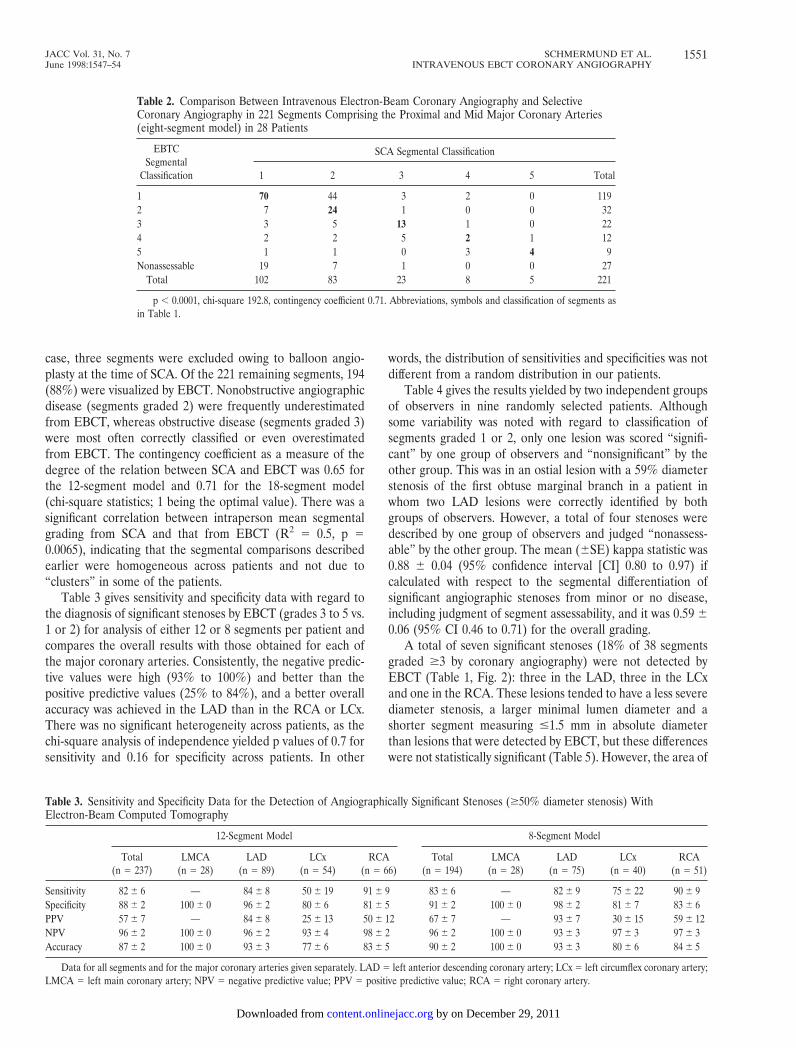
Table 2. Comparison Between Intravenous Electron-Beam Coronary Angiography and SelectiveCoronary Angiography in 221 Segments Comprising the Proximal and Mid Major Coronary Arteries(eight-segment model) in 28 Patients
EBTCSegmental
Classification
SCA Segmental Classification
1 2 3 4 5 Total
1 70 44 3 2 0 1192 7 24 1 0 0 323 3 5 13 1 0 224 2 2 5 2 1 125 1 1 0 3 4 9Nonassessable 19 7 1 0 0 27
Total 102 83 23 8 5 221
p , 0.0001, chi-square 192.8, contingency coefficient 0.71. Abbreviations, symbols and classification of segments asin Table 1.
Table 3. Sensitivity and Specificity Data for the Detection of Angiographically Significant Stenoses ($50% diameter stenosis) WithElectron-Beam Computed Tomography
12-Segment Model 8-Segment Model
Total(n 5 237)
LMCA(n 5 28)
LAD(n 5 89)
LCx(n 5 54)
RCA(n 5 66)
Total(n 5 194)
LMCA(n 5 28)
LAD(n 5 75)
LCx(n 5 40)
RCA(n 5 51)
Sensitivity 82 6 6 — 84 6 8 50 6 19 91 6 9 83 6 6 — 82 6 9 75 6 22 90 6 9Specificity 88 6 2 100 6 0 96 6 2 80 6 6 81 6 5 91 6 2 100 6 0 98 6 2 81 6 7 83 6 6PPV 57 6 7 — 84 6 8 25 6 13 50 6 12 67 6 7 — 93 6 7 30 6 15 59 6 12NPV 96 6 2 100 6 0 96 6 2 93 6 4 98 6 2 96 6 2 100 6 0 93 6 3 97 6 3 97 6 3Accuracy 87 6 2 100 6 0 93 6 3 77 6 6 83 6 5 90 6 2 100 6 0 93 6 3 80 6 6 84 6 5
Data for all segments and for the major coronary arteries given separately. LAD 5 left anterior descending coronary artery; LCx 5 left circumflex coronary artery;LMCA 5 left main coronary artery; NPV 5 negative predictive value; PPV 5 positive predictive value; RCA 5 right coronary artery.
1551JACC Vol. 31, No. 7 SCHMERMUND ET AL.June 1998:1547–54 INTRAVENOUS EBCT CORONARY ANGIOGRAPHY
by on December 29, 2011 content.onlinejacc.orgDownloaded from
calcium attributed to the stenotic segments was significantlygreater in stenoses not detected by EBCT than that in stenosesthat were detected, and the segmental calcium scores were alsosignificantly higher (Table 5, Fig. 2 and 3). In 6 (86%) of the 7stenoses not detected by EBCT, calcific lesions of an area.20 mm2 were found, although this degree of segmentalcalcification was seen in only 9 (29%) of the 31 stenosescorrectly identified by EBCT (p 5 0.02, chi-square and Fisherexact tests).
A total of 23 (12%) of 199 segments graded 1 or 2 by SCAwere misdiagnosed as showing $50% diameter stenosis byEBCT (Table 1, Fig. 4). These falsely positive segments had asignificantly smaller lumen caliber than the truly negativesegments (Table 5).
A total of 93 segments were not visualized adequately to bejudged assessable by EBCT (Table 1). These comprised seg-ments including the first two diagonal branches of the LAD(n 5 41) or the distal LCx (n 5 15) (i.e., segments significantlysmaller than the remaining major epicardial segments). Ref-erence vessel size and minimal lumen diameter were 1.9 60.7 mm and 1.4 6 0.5 mm, respectively, for nonassessablesegments, compared with 2.6 6 1.2 mm and 2.1 6 1.2 mm,respectively, for assessable segments (p , 0.001 for bothcomparisons between nonassessable and assessable segments).Other factors accounting for nonaccessibility by EBCT in-
cluded localization of segments distal to severe stenoses (n 515), presence of severe diffuse disease and subtotal occlusion(n 5 4) or hypoplastic vessels with reference diameters ,1 mm(n 5 15). Only one segment could not be assessed owing to apremature supraventricular contraction and improper ECGtriggering.
On a patient-by-patient basis, 21 (75%) of the 28 patientswere correctly classified with respect to significant coronaryartery disease by EBCT (true positive or true negative results;16 men and 5 women), 2 (7%) had false negative results (1 manand 1 woman) and 5 (18%) had false positive results (2 menand 3 women). Both patients with false negative results hadLAD stenoses of borderline angiographic significance (50%and 55% diameter stenosis by QCA) and were not thought torequire catheter or surgical interventions by the attendingclinicians. Their individual EBCT total calcium scores were429.11 and 1,244.72, and thus, on the basis of total atheroscle-rotic plaque burden alone, the presence of significant coronaryartery disease was suspected (18). In contrast, calcium scoreswere significantly higher in patients with true positive than inthose with false positive results (Fig. 5). The number ofsegments not assessable by EBCT per patient did not differbetween those correctly or incorrectly classified (3.7 6 1.1 vs.3.3 6 2.2, p 5 0.7).
Table 4. Analysis of Coronary Segments (12 per patient) by Intravenous Electron-Beam ComputedTomographic Coronary Angiography
Investigator Group 2Segmental Classification
Investigator Group 1 Segmental Classification
1 2 3 4 5 Nonassessable Total
1 40 8 0 0 0 0 482 8 6 1 0 0 1 163 0 0 4 5 0 1 104 0 0 2 1 1 0 45 0 0 0 0 1 0 1Nonassessable 0 1 0 1 2 23 27
Total 48 15 7 7 4 25 106
Evaluation was done by two teams of independent investigators in nine randomly selected patients. Symbols andclassification of segments as in Table 1.
Table 5. Angiographic Characteristics and Segmental Calcification of Segments With False NegativeResults (n 5 7) Versus True Positive Results (n 5 31) and Angiographic Characteristics of SegmentsWith True Negative Results (n 5 199) Versus False Positive Results (n 5 23) by Electron-BeamComputed Tomography
False Negative Results False Positive Results
EBCT FN EBCT TP EBCT FP EBCT TN
Diameter stenosis (%) 64.0 6 9.9 72.4 6 18.2 14.9 6 13.8 17.3 6 12.0Length of segment #1.5 mm (mm) 3.8 6 2.9 4.9 6 3.3 — —Minimal lumen diameter (mm) 0.91 6 0.34 0.84 6 0.29 1.2 6 0.6 2.3 6 1.1†Reference diameter (mm) 2.55 6 0.43 2.44 6 0.52 1.5 6 0.8 2.9 6 1.1†Area of calcification (mm2) 39.5 6 15.9 21.2 6 24.1* — —Segmental calcium score 157.4 6 64.3 83.0 6 97.3* — —
*p , 0.05 versus false negative (FN). †p , 0.001 versus false positive (FP). EBCT 5 electron-beam computedtomographic; TN 5 true negative; TP 5 true positive.
1552 SCHMERMUND ET AL. JACC Vol. 31, No. 7INTRAVENOUS EBCT CORONARY ANGIOGRAPHY June 1998:1547–54
by on December 29, 2011 content.onlinejacc.orgDownloaded from
DiscussionThis investigation evaluated the application of intravenous
EBCT for a minimally invasive definition of major coronaryartery anatomy on a segmental basis and, to our knowledge,represents the first attempt to characterize limitations of thetechnique. No patients with available images were excludedfrom the analysis. Concordant with previous reports (2,9,19),good sensitivity and a very high negative predictive value forruling out obstructive coronary lumen disease were found.However, positive predictive accuracy was only moderate.Marked segmental coronary calcium was determined to be themost important factor related to false negative interpretationof lumen disease severity. Of 7 “false negative” lesions, 6(86%) showed a segmental calcium area .20 mm2. Kaufmannet al. (20), using receiver operating characteristic curve analysisin 160 patients, found that a calcium area of 18 mm2 best
separated individuals with from those without obstructivelumen disease, and accordingly the presence of severe segmen-tal calcification would alert the clinician to the high likelihoodof obstructive coronary artery disease. A larger referencelumen diameter and a shorter stenosis segment (#1.5 mm)may also have played a role in cases where stenosis severity wasunderestimated, but to a much lesser degree than segmentalcoronary calcium (Table 5). Small vessel diameter was themain determinant of falsely positive results. Small vesseldiameter was also associated with segments judged to benonassessable, along with factors such as upstream high gradestenoses or severe diffuse disease of the segment in question.Artifacts caused by improper ECG triggering or patient move-ment and breathing were rare and did not have a major impacton the results.
Factors contributing to technical limitations of EBCT. Weclassified 93% of all LAD segments correctly, but accuracydeclined to 83% to 84% for RCA segments and to 77% to 80%for LCx segments. This difference in accuracy for the majorcoronary arteries is very comparable to previously reportedresults (2,9,19). Although other investigators (2) have sus-pected motion artifacts as the explanation, more apparent inthe LCx and RCA than in the LAD, a smaller vessel diameterwas the most important factor confounding the grading of LCxsegments in our study. For RCA segments, several factors mayhave been contributing. Despite modification of patient posi-tioning in the last 23 of 28 EBCT studies, persistent artifacts inthe mid-RCA were seen due to the dense contrast opacifica-tion of the adjacent right atrium. Also, as opposed to angio-graphically normal coronary arteries in a larger group ofpatients undergoing SCA (21), major RCA segments (n 5 51)in our patients had a significantly smaller reference lumen
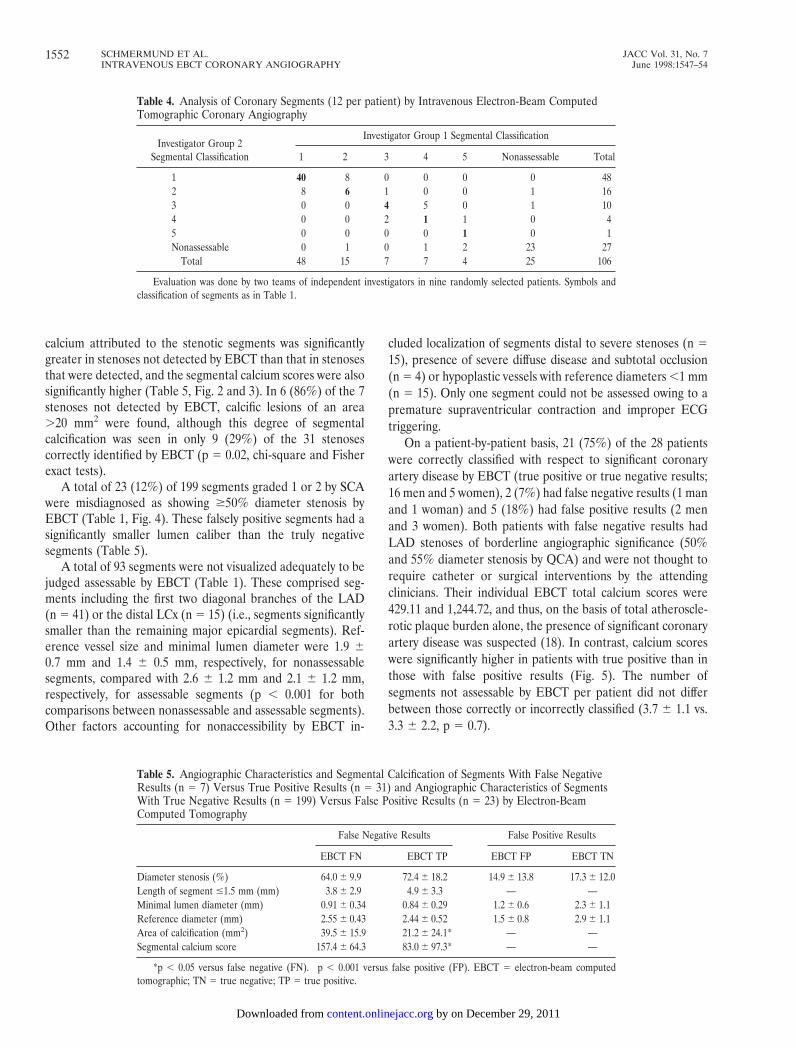
Figure 3. Comparison of intravenous EBCT coronary angiographyand SCA in a 49-year old man. The left upper panel shows an EBCTshaded surface display with correct detection of a proximal 68% lumendiameter stenosis of the LAD (selective angiogram, right). Thestenosis was overestimated and graded as 4 from EBCT as opposed to3 from SCA. The lower panel shows a curved surface rendering(multiplanar reformation) of the LAD with comparably little calcifi-cation. The arrows indicate the site of the lesion.
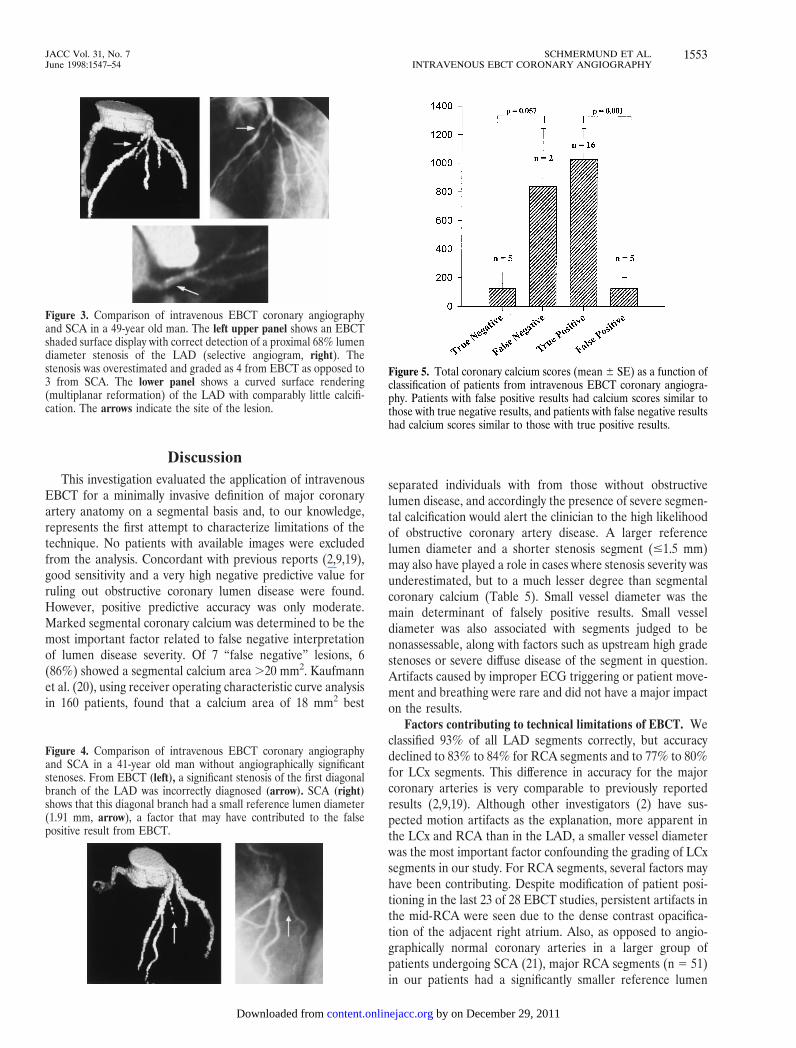
Figure 4. Comparison of intravenous EBCT coronary angiographyand SCA in a 41-year old man without angiographically significantstenoses. From EBCT (left), a significant stenosis of the first diagonalbranch of the LAD was incorrectly diagnosed (arrow). SCA (right)shows that this diagonal branch had a small reference lumen diameter(1.91 mm, arrow), a factor that may have contributed to the falsepositive result from EBCT.
Figure 5. Total coronary calcium scores (mean 6 SE) as a function ofclassification of patients from intravenous EBCT coronary angiogra-phy. Patients with false positive results had calcium scores similar tothose with true negative results, and patients with false negative resultshad calcium scores similar to those with true positive results.
1553JACC Vol. 31, No. 7 SCHMERMUND ET AL.June 1998:1547–54 INTRAVENOUS EBCT CORONARY ANGIOGRAPHY
by on December 29, 2011 content.onlinejacc.orgDownloaded from
diameter than major LAD segments (n 5 75) (2.5 6 1.1 vs.3.1 6 0.9 mm, p 5 0.004).
EBCT image analysis. Because the interpretation ofshaded surface three-dimensional rendering relies on grayscale (density) values above the preset threshold, it has beenpreviously speculated that calcium may be difficult to differen-tiate from contrast opacification owing to the overlap indensity values (2). Multiplanar reformation instead of a shadedsurface display has been suggested as a means to circumventthis shortcoming (8). With this approach, however, uncertain-ties as to the true center of the vessel may be of concern.Maximal intensity projections have been used to detect calcium(2), but they may not always permit reliable detection ofstenoses because of the overlap of different structures in theplanar projection format. Realizing from the outset that nosingle method of analysis is without limitations, we incorpo-rated review of the two-dimensional images, including thecalcium scans, and the different three-dimensional renderingsinto our final consensus opinions.
Conclusions. Intravenous EBCT coronary angiography isan attractive method for the noninvasive definition of coronaryanatomy because it can be performed in a straightforwardfashion, requires an examination time of only minutes, isassociated with a very steep learning curve and provides highlyreproducible results (2,8,9,19). Our study confirms high nega-tive predictive values with respect to the detection and local-ization of obstructive stenoses on a segmental basis. Thissuggests that EBCT coronary angiography may be of value forruling out significant disease in patients undergoing clinicalevaluation for obstructive versus nonobstructive coronary ar-tery disease. Therefore, it should be analyzed in the context ofthe patient’s history and symptoms. Calcium quantities, as asurrogate measure for intramural atherosclerotic plaque bur-den, may be especially valuable in cases with equivocal findingsrelated to diffuse coronary disease and a small vessel lumendiameter (14,18).
We thank Dr. John F. Bresnahan for his valuable help in grading the selectivecoronary angiograms; Dr. Suvipaporn Siripornpitak for her valuable help ingrading the EBCT angiograms; and Joseph F. Colter for his expert assistance inperforming quantitative angiographic analyses.
References1. Pepine CJ, Allen HD, Bashore TM, et al., American College of Cardiology/
American Heart Association Ad Hoc Task Force on Cardiac Catheteriza-tion. ACC/AHA guidelines for cardiac catheterization and cardiac catheter-ization laboratories. Circulation 1991;84:2213–47.
2. Moshage WE, Achenbach S, Seese B, Bachmann K, Kirchgeorg M. Coro-
nary artery stenoses: three-dimensional imaging with electrocardiographi-cally triggered, contrast agent-enhanced, electron-beam CT. Radiology1995;196:707–14.
3. Hamm CW, Meinertz T, Dix WR, et al. Intravenous coronary angiographywith dichromography using synchrotron radiation. Herz 1996;21:127–31.
4. Manning WJ, Li W, Edelman RR. A preliminary report comparing magneticresonance coronary angiography with conventional angiography [erratum inN Engl J Med 1994;330:152]. New Engl J Med 1993;328:828–32.
5. Pennell DJ, Bogren HG, Keegan J, Firmin DN, Underwood SR. Assessmentof coronary artery stenosis by magnetic resonance imaging. Heart 1996;75:127–33.
6. Caiati C, Aragona P, Iliceto S, Rizzon P. Improved Doppler detection ofproximal left anterior descending coronary artery stenosis after intravenousinjection of a lung-crossing contrast agent: a transesophageal Dopplerechocardiographic study. J Am Coll Cardiol 1996;27:1413–21.
7. Achenbach S, Moshage W, Ropers D, Nossen J, Bachmann K. NichtinvasiveKoronarangiographie mittels Elektronenstrahltomogaphie: Methodik undklinische Evaluierung im Follow-up nach PTCA. Z Kardiol 1997;86:121–30.
8. Nakanishi T, Ito K, Imazu M, Yamakido M. Evaluation of coronary arterystenoses using electron-beam CT and multiplanar reformation. J ComputAssist Tomogr 1997;21:121–7.
9. Budoff MJ, Oudiz RJ, Zalace CP, et al. Intravenous three dimensionalcoronary angiography using contrast enhanced electron beam computedtomography [abstract]. J Am Coll Cardiol 1997;29 Suppl A:393A.
10. Achenbach S, Moshage W, Ropers D, Nossen J, Bachmann K. Noninvasive,three-dimensional visualization of coronary artery bypass grafts by electronbeam tomography. Am J Cardiol 1997;79:856–61.
11. Bell MR, Britson PJ, Chu A, Holmes DR Jr, Bresnahan JF, Schwartz RS.Validation of a new UNIX-based quantitative coronary angiographic systemfor the measurement of coronary artery lesions. Cathet Cardiovasc Diagn1997;40:66–74.
12. American Heart Association Committee Report. A reporting system onpatients evaluated for coronary artery disease. Circulation 1975;51:7–34.
13. Agatston AS, Janowitz WR, Hildner FJ, Zusmer NR, Viamonte M, DetranoR. Quantification of coronary artery calcification using ultrafast CT. J AmColl Cardiol 1990;15:827–32.
14. Rumberger JA, Sheedy PF, Breen JR, Schwartz RS. Coronary calcium asdetermined by electron beam CT, and coronary disease on arteriogram:effect of patient’s sex on diagnosis. Circulation 1995;91:1363–7.
15. Baumgart D, Schmermund A, Gorge G, et al. Comparison of electron beamcomputed tomography with intracoronary ultrasound and coronary angiog-raphy for the detection of coronary atherosclerosis. J Am Coll Cardiol1997;30:57–64.
16. Kajinami K, Seki H, Takekoshi N, Mabuchi H. Coronary calcification andcoronary atherosclerosis: site by site comparative morphologic study ofelectron beam computed tomography and coronary angiography. J Am CollCardiol 1997;29:1549–56.
17. Diamond GA, Forrester JS. Analysis of probability as an aid in the clinicaldiagnosis of coronary-artery disease. N Engl J Med 1979;300:1350–8.
18. Rumberger JA, Sheedy PF, Breen JF, Schwartz RS. Electron beam com-puted tomographic calcium score cutpoints and severity of associatedangiographic lumen stenosis. J Am Coll Cardiol 1997;29:1542–8.
19. Achenbach S, Moshage W, Nossen J, et al. Nichtinvasive Koronararterien-darstellung mittels Elektronenstrahltomographie—Vergleich zur Koronar-angiographie bei 100 Patienten [abstract]. Z Kardiol 1997;86 Suppl 2:205.
20. Kaufmann RB, Moll PP, Sheedy PF, Rumberger JA, Schwartz RS. Quanti-fication of coronary artery calcium by electron beam computed tomographyfor determination of angiographic coronary artery disease in youngerindividuals. J Am Coll Cardiol 1995;25:626–32.
21. Dodge JT Jr, Brown BG, Bolson EL, Dodge HT. Lumen diameter of normalhuman coronary arteries—influence of age, sex, anatomic variation, and leftventricular hypertrophy or dilation. Circulation 1992;86:232–46.
1554 SCHMERMUND ET AL. JACC Vol. 31, No. 7INTRAVENOUS EBCT CORONARY ANGIOGRAPHY June 1998:1547–54
by on December 29, 2011 content.onlinejacc.orgDownloaded from
1998;31;1547-1554 J. Am. Coll. Cardiol.A Schmermund, BJ Rensing, PF Sheedy, MR Bell, and JA Rumberger
segmental analysis of coronary artery stenosesIntravenous electron-beam computed tomographic coronary angiography for
This information is current as of December 29, 2011
Citations http://content.onlinejacc.org#otherarticles
This article has been cited by 32 HighWire-hosted articles:
Rights & Permissions
http://content.onlinejacc.org/misc/permissions.dtlor in its entirety can be found online at: Information about reproducing this article in parts (figures, tables)
Reprints http://content.onlinejacc.org/misc/reprints.dtl
Information about ordering reprints can be found online:
by on December 29, 2011 content.onlinejacc.orgDownloaded from
Related Documents


![Coronary Computed Tomographic Angiography at 80 kVp and ... · modality for detecting and ruling out coronary artery disease (CAD) [1], but there are still ... a11111 OPEN ACCESS](https://static.cupdf.com/doc/110x72/5fb6c266c32f8306cb3e1ff2/coronary-computed-tomographic-angiography-at-80-kvp-and-modality-for-detecting.jpg)


