Aquatic Toxicology 97 (2010) 15–22 Contents lists available at ScienceDirect Aquatic Toxicology journal homepage: www.elsevier.com/locate/aquatox Intraspecific competition delays recovery of population structure Matthias Liess ∗ , Kaarina Foit UFZ-Helmholtz Centre for Environmental Research, Department of System Ecotoxicology, Permoserstrasse 15, D-04318 Leipzig, Germany article info Article history: Received 15 September 2009 Received in revised form 20 November 2009 Accepted 25 November 2009 Keywords: Size structure Recovery Latent toxicant effect Long-term effects Pesticide risk assessment Insecticide Daphnia magna abstract Ecotoxicological field studies have shown that total abundance and biomass often recover shortly after pulsed toxicant stress. In contrast, population structure showed comparatively long-term alterations before reaching pre-treatment conditions. We investigated two mechanisms that may explain the pro- longed recovery of population structure: latent toxicant effects on life-history traits on the individual level and competition on the population level. To test these hypotheses we exposed populations of Daphnia magna to a pulse of the pyrethroid Fenvalerate. For several generations the populations were kept at two different degrees of competition: strong competition at carrying capacity and reduced competition main- tained by simulated predation. After disturbance due to Fenvalerate exposure, biomass recovered after 14–17 days. In contrast, size structure characterised by a lack of large and dominance of small organisms recovered after 43 days in populations with strong competition. Size structure recovered twice faster in populations with reduced competition. We explain this as follows: due to toxicant induced mortality, food availability and consequently birth rate increased and populations were dominated by small indi- viduals. In populations without predation, these cohorts grew and eventually exerted high intraspecific competition that (i) stopped further growth of juveniles and (ii) increased mortality of adults. These demographic processes were mainly responsible for the prolonged recovery of size structure. In con- trast, for populations with predation, the regular harvest of individuals reduced competition. Juveniles developed continuously, allowing a fast recovery of size structure in these dynamic populations. In risk assessment the duration for populations to recover from (toxicant) stress, is crucial for the determina- tion of ecological acceptable effects. We conclude that competition needs to be considered in order to understand and predict recovery of size structure. © 2009 Elsevier B.V. All rights reserved. 1. Introduction Assessment of toxicant effects on ecosystems requires consid- ering the relevant processes beyond those investigated in standard test systems. These include on the individual level (1) relative sensitivity of the test organism compared to the species sensitiv- ity distribution (SSD, RSD) of autochthonous species (Posthuma et al., 2002; Wogram and Liess, 2001), (2) latent effects after exposure that may only become apparent long after the initial dosing and that are not identified by short-term laboratory tests (Liess, 2002; Beketov and Liess, 2008), (3) increased sensitivity of autochthonous species to toxicants that is due to additional environmental stressors within their biotope (Duquesne and Liess, 2003). On the population level relevant processes are (4) toxicant- induced responses in mating behaviour (Reynaldi et al., 2006) and compensatory potential of intraspecific competition (Liess, 2002). On the community level relevant processes are (5) increased sensi- tivity due to presence of chemical signals of predation risk (Pestana ∗ Corresponding author. Tel.: +49 341 235 1578; fax: +49 341 235 451578. E-mail addresses: [email protected] (M. Liess), [email protected] (K. Foit). et al., 2009), predation (Beketov and Liess, 2006) and parasitism (Marcogliese et al., 2009) as well as (6) alteration of competitive balance with controphics that are frequently observed in meso- cosms (Friberg-Jensen et al., 2003) and in the wild (Liess and von der Ohe, 2005). Understanding these processes will improve risk assessment and consequently management and conservation of non-target species (Relyea and Hoverman, 2006). Here we want to focus on the process of recovery. The ecotoxicological impact of a toxicant depends on the magnitude of the effect and on the potential of affected populations to recover. The duration of the recovery pro- cess of a population also determines the extent to which a toxicant indirectly affects the community. Hence, the ability to predict the duration of recovery determines our ability to predict the extent of toxicant effects on an ecosystem. The recovery of populations can be assessed by “integrating end- points” that describe a system in its entirety (i.e. total abundance or biomass) or “differentiating endpoints” that describe a system by grouping its elements according to relevant traits (i.e. size or age distribution). The use of “integrating endpoints” like the popula- tion growth rate (PGR) for predicting recovery of total abundance is well established. PGR considers effects on relevant life-history 0166-445X/$ – see front matter © 2009 Elsevier B.V. All rights reserved. doi:10.1016/j.aquatox.2009.11.018

Welcome message from author
This document is posted to help you gain knowledge. Please leave a comment to let me know what you think about it! Share it to your friends and learn new things together.
Transcript

I
MU
a
ARR2A
KSRLLPID
1
etsieed(oe2icOt
0d
Aquatic Toxicology 97 (2010) 15–22
Contents lists available at ScienceDirect
Aquatic Toxicology
journa l homepage: www.e lsev ier .com/ locate /aquatox
ntraspecific competition delays recovery of population structure
atthias Liess ∗, Kaarina FoitFZ-Helmholtz Centre for Environmental Research, Department of System Ecotoxicology, Permoserstrasse 15, D-04318 Leipzig, Germany
r t i c l e i n f o
rticle history:eceived 15 September 2009eceived in revised form0 November 2009ccepted 25 November 2009
eywords:ize structureecoveryatent toxicant effectong-term effectsesticide risk assessmentnsecticideaphnia magna
a b s t r a c t
Ecotoxicological field studies have shown that total abundance and biomass often recover shortly afterpulsed toxicant stress. In contrast, population structure showed comparatively long-term alterationsbefore reaching pre-treatment conditions. We investigated two mechanisms that may explain the pro-longed recovery of population structure: latent toxicant effects on life-history traits on the individual leveland competition on the population level. To test these hypotheses we exposed populations of Daphniamagna to a pulse of the pyrethroid Fenvalerate. For several generations the populations were kept at twodifferent degrees of competition: strong competition at carrying capacity and reduced competition main-tained by simulated predation. After disturbance due to Fenvalerate exposure, biomass recovered after14–17 days. In contrast, size structure characterised by a lack of large and dominance of small organismsrecovered after 43 days in populations with strong competition. Size structure recovered twice faster inpopulations with reduced competition. We explain this as follows: due to toxicant induced mortality,food availability and consequently birth rate increased and populations were dominated by small indi-viduals. In populations without predation, these cohorts grew and eventually exerted high intraspecific
competition that (i) stopped further growth of juveniles and (ii) increased mortality of adults. Thesedemographic processes were mainly responsible for the prolonged recovery of size structure. In con-trast, for populations with predation, the regular harvest of individuals reduced competition. Juvenilesdeveloped continuously, allowing a fast recovery of size structure in these dynamic populations. In riskassessment the duration for populations to recover from (toxicant) stress, is crucial for the determina-tion of ecological acceptable effects. We conclude that competition needs to be considered in order toecove
understand and predict r. Introduction
Assessment of toxicant effects on ecosystems requires consid-ring the relevant processes beyond those investigated in standardest systems. These include on the individual level (1) relativeensitivity of the test organism compared to the species sensitiv-ty distribution (SSD, RSD) of autochthonous species (Posthumat al., 2002; Wogram and Liess, 2001), (2) latent effects afterxposure that may only become apparent long after the initialosing and that are not identified by short-term laboratory testsLiess, 2002; Beketov and Liess, 2008), (3) increased sensitivityf autochthonous species to toxicants that is due to additionalnvironmental stressors within their biotope (Duquesne and Liess,003). On the population level relevant processes are (4) toxicant-
nduced responses in mating behaviour (Reynaldi et al., 2006) andompensatory potential of intraspecific competition (Liess, 2002).n the community level relevant processes are (5) increased sensi-
ivity due to presence of chemical signals of predation risk (Pestana
∗ Corresponding author. Tel.: +49 341 235 1578; fax: +49 341 235 451578.E-mail addresses: [email protected] (M. Liess), [email protected] (K. Foit).
166-445X/$ – see front matter © 2009 Elsevier B.V. All rights reserved.oi:10.1016/j.aquatox.2009.11.018
ry of size structure.© 2009 Elsevier B.V. All rights reserved.
et al., 2009), predation (Beketov and Liess, 2006) and parasitism(Marcogliese et al., 2009) as well as (6) alteration of competitivebalance with controphics that are frequently observed in meso-cosms (Friberg-Jensen et al., 2003) and in the wild (Liess and vonder Ohe, 2005).
Understanding these processes will improve risk assessmentand consequently management and conservation of non-targetspecies (Relyea and Hoverman, 2006). Here we want to focus onthe process of recovery. The ecotoxicological impact of a toxicantdepends on the magnitude of the effect and on the potential ofaffected populations to recover. The duration of the recovery pro-cess of a population also determines the extent to which a toxicantindirectly affects the community. Hence, the ability to predict theduration of recovery determines our ability to predict the extent oftoxicant effects on an ecosystem.
The recovery of populations can be assessed by “integrating end-points” that describe a system in its entirety (i.e. total abundance or
biomass) or “differentiating endpoints” that describe a system bygrouping its elements according to relevant traits (i.e. size or agedistribution). The use of “integrating endpoints” like the popula-tion growth rate (PGR) for predicting recovery of total abundanceis well established. PGR considers effects on relevant life-history
1 c Toxicology 97 (2010) 15–22
t(efseBbwlliidllslsioctebbeeptaB(cSn
tece
2
2
oiwptpetpl(ctacdtt
Table 1Overview of the experimental set-up.
Short-term disturbance Test series Test INo predationReplicates
Test IIPredationReplicates
Fenvalerate (�g/L)
Control 6 60.8 5 51 4 43 3 3
Mechanical50% 5
6 M. Liess, K. Foit / Aquati
raits providing an integrating measure of the effects of toxicantsMeyer et al., 1986; Sibly and Hone, 2002). Modelling based on PGRnables the prediction of the time needed for populations to recoverollowing pulses of toxicants. The results of PGR modelling corre-pond well to observed recovery times in mesocosms and enclosurexperiments of about one generation time (Sherratt et al., 1999;arnthouse, 2004), where a generation time is defined as the num-er of days from birth until first reproduction. In contrast to thisell-studied and predictable recovery of “integrating endpoints”
ike total abundance or biomass, field studies show unexpectedlyong recovery times of several generation times in “differentiat-ng endpoints” like size structure. For example, after the oil spilln Alaska from the Exxon Valdez (USA), a fast recovery in abun-ance was found for the brown alga Fucus gardneri. However, a
ong-term disturbance of size structure, characterised by a lack ofarge organisms was observed exceeding the 7-year duration of thetudy (Driskell et al., 2001). Johnston and Keough (2005) observedong-term effects of copper pulses as changes in the populationize structure rather than the overall density of an organism. Alson laboratory experiments allowing an undisturbed developmentf populations under a high degree of self-regulation and strongompetition similar results were obtained: populations of D. magnahat were exposed to a pulse of the pyrethroid Fenvalerate recov-red fast during around one generation in term of total abundanceut underwent a long-term shift in size structure, characterisedy a lack of large organisms. The altered size structure lasting thequivalent of around 10 generation times (Liess et al., 2006). Liesst al. (2006) proposed two mechanisms that might explain thishenomenon: Firstly, delayed (latent) effects after exposure of theoxicant on the individual. Such post-exposure effects of toxicantsre reported to be apparent for several days (Jones et al., 2009;eketov and Liess, 2008) weeks (Beketov and Liess, 2005) or monthsLiess, 2002) after the short-term exposure of toxicants. Secondly, aompetition driven delay of development on the population level.uch a mechanism has not been investigated to our knowledge untilow.
The aim of the study was to determine if either or both of thewo proposed mechanisms may account for the observed long-termffects on size structure after a toxicant pulse. Finally we aimed atontributing to improve the risk assessment of chemicals by anxtended consideration of ecological processes.
. Materials and methods
.1. Test design
The experiment comprised a total of 41 vessels with populationsf D. magna. In test I individuals were left to develop to carry-ng capacity (23 replicates). In test II a proportion of individuals
ere regularly extracted to simulate predation and to reduce com-etition within the populations (18 replicates). Hereafter, thesewo test designs are referred to as “not predated” and “predated”opulations, respectively. All vessels were allowed 37 days forstablishment until abundance stabilised. After this initial phaseest I (not predated) and test II (predated) were exposed to aulse of the insecticide Fenvalerate (details see below) at the fol-
owing nominal concentrations: control (six replicates), 0.8 �g/Lfive replicates), 1 �g/L (four replicates), and 3 �g/L (three repli-ates). Test I (not predated) comprised an additional test serieshat were not exposed to Fenvalerate but the population was once
ffected by mechanically removing 50% of individuals (five repli-ates). The acute effect on abundance of the mechanical short-termisturbance was comparable with the effect of the disturbancehrough Fenvalerate at 1 �g/L. Exposure to Fenvalerate and alsohe single mechanical removal are referred to as “short-termNumber of text system 23 18
Total 41
disturbance”. Number and size of individuals were monitored byimage analysis (details see below). The experiment was terminated51 days after pulse exposure to Fenvalerate or the single distur-bance event, respectively. The experimental set-up is summarisedin Table 1.
2.2. Test system
The populations of D. magna were cultured in cylindrical glassvessels (Harzkristall, Derenburg, Germany) containing 4.5 L ofElendt M7 medium (OECD, 1997). The populations of D. magna,clone B (Bayer, Monheim, Germany) were initiated with 30neonates per test system. The neonates were less than 48 h oldoriginating from a third brood of cultured individuals. The popula-tions were fed daily with a suspension of batch-cultured green algae(Desmodesmus subspicatus), cultured in algal medium (Grimme andBoardmann, 1972) and aerated continuously (1% CO2 added to air).The algae were harvested in exponential growth phase and thencentrifuged at 3000 rpm for 10 min. The pellet that resulted wassuspended in Elendt M7 medium. The quantity of food given asdaily ration was 1.1 × 10⁵ cells/mL (0.45 mg C/L), measured usinga total organic carbon analyser (TOC-5000 Analyzer; Shimadzu,Duisburg, Germany) and a Coulter counter (Casy1 counter; ScharfeSystems, Reutlingen, Germany). The water quality was measured 7days before and 4 days after dosing, and subsequently every secondweek. It did not differ between test series (I and II), and also betweenexposure concentrations. The concentrations of ions were suchthat no negative effects on populations would be expected (NH4
+,0.0015 ± 0.001 mg/L [mean ± SD]; NO2
−, 0.0016 ± 0.001 mg/L; pH7.8 ± 0.1; O2, 8.4 ± 0.8 mg/L; temperature, 20.5 ± 0.1 ◦C). The baseof each glass vessel contained 500 g of washed aquarium gravel(diameter, 1–2 mm) as support for bacteria to promote the self-purification of the test system. A clear glass plate was placed ontop of each vessel to prevent excessive evaporation. The studieswere performed at 20 ◦C. The photo period was controlled (16:8 hlight:dark), and lighting was provided by a 70 W, cool-white flu-orescent tube situated 10 cm above the test vessels. The culturemedium was aerated three times a day for 15 min via silicone tubing(14 cm below the water’s surface; diameter, 4 mm; tapered end-ing, 0.5 mm). Every week, 75% of the medium in test vessels wasrenewed via silicone tubing capped with a 200 �m nylon mesh toprevent the loss of animals.
2.3. Simulated predation
In test II, the populations of D. magna were regularly exposedto simulated predation to reduce intraspecific competition within
the populations. We started the predation 20 days before short-term disturbance with Fenvalerate. By this the population densitywas manually reduced by 29.3% of total abundance (SD ± 4%, n = 20,quantified by image analysis) every 2–3 days. Prior to the man-ual reduction, the water was agitated slightly to distribute the
c Toxic
iothnpca
2
wI2mvdm
2
p5hp2(Gactvdtmrr
2
mdraF2Ni(ssct(tavtt92
M. Liess, K. Foit / Aquati
ndividuals homogeneously. A nylon sieve (mesh-size, 200-�m;pening area, 63.75 cm2) was placed 1 cm above the bottom ofhe vessel and lifted through the water column three times. Thearvested individuals were discarded. We decided to perform aon-selective predation so that all size classes are affected in pro-ortion to their abundance. This was done to reduce intraspecificompetition within the populations without altering size structures a direct effect of predation.
.4. Toxicant-free disturbance “mechanical50%”
Test I comprised an additional test series of five replicates thatas disturbed once by removing mechanically 50% of abundance.
ndividuals of D. magna were harvested by sieving (see Section.3), killed in boiling water, and returned to the test systems toimic conditions of test systems with high lethality due to Fen-
alerate exposure. The percentage of the population removed wasetermined by image analysis. The test series is referred to asechanical50%.
.5. Exposure to fenvalerate
Fenvalerate, (RS)-cyano-3-phenoxybenzyl (RS)-2-(4-chloro-henyl)-3-methylbutyrate (Chemical Abstract Service no. 51630-8-1), was obtained from Riedel-de Haën (Seelze, Germany;igh-performance liquid chromatography [HPLC] technical grade;urity, 99.9%). Fenvalerate has a water solubility of <3 �g/L at5 ◦C, with a log Kow of 5.01 (Tomlin, 2003). Dimethyl sulfoxideDMSO) was therefore used as a carrier solvent (Merck, Darmstadt,ermany; HPLC technical grade; purity, 99.8%). Fenvalerate, likell pyrethroides, is highly toxic especially for aquatic insects andrustaceans. Aliquots of a stock solution were added directly tohe test systems. The maximum amount of DMSO was 0.0025% byolume. The populations of D. magna were not fed on the day ofosing to reduce sorption of the toxicant to algae. Medium in allhe vessels was replaced to 80% with fresh, uncontaminated M7
edium on day 7 after exposure. Exposure to 3 �g L−1 Fenvalerateesulted in the complete extinction of the populations; hence, theesults are not shown here.
.6. Validation of exposure concentration
To quantify the actual Fenvalerate concentrations in theedium 5 min after exposure, we selected 13 test systems ran-
omly with the following replicates per test series: control (twoeplicates), 0.8 �g/L (four replicates), 1 �g/L (four replicates),nd 3 �g/L Fenvalerate (three replicates). The concentrations ofenvalerate were measured through solid-phase extraction of00 mL culture medium with C18 columns (Baker, Phillipsburg,J, USA), followed by chromatography/mass spectrometry apply-
ng electron-impact ionisation and selected ion-monitoring mode6890 Series GC System with 7683 Series Injector and 5973 masselective detector; Hewlett-Packard, Avondale, PA, USA). The mea-ured concentrations were, on average, 22% less than the nominaloncentrations and reached 67% at 0.8 �g/L (coefficient of varia-ion CV of 4.8%), 70% at 1 �g/L (CV of 3.3%), and 97% at 3 �g/LCV of 2.2%). Due to the fact that the measured exposure concen-
rations did not differ strongly from the nominal concentrations,ll exposure concentrations are given as nominal values. A pre-ious investigation with an identical test design demonstratedhe temporal reduction of the nominal concentration of 3.2 �g/Lo percentages of 77, 26, 18, 11, and 4% at time = 1, 24, 48,6, and 144 h, respectively, after exposure (Pieters and Liess,006).ology 97 (2010) 15–22 17
2.7. Monitoring of D. magna populations
The populations of D. magna were monitored every 2–3 daysby image analysis. The technique estimates abundance as integrat-ing endpoint and size distribution as differentiating endpoint in D.magna populations (Liess et al., 2006). Details of the method aredescribed in Liess et al. (2006). In short, photographs of D. magnapopulations were obtained using a digital camera (Olympus Came-dia C-5050, image size 2560 × 1920 pixels, speed 1/30 s; F 3.2; ISO400; over exposure +1). In order to obtain a good image, free fromreflections, the camera was fixed to one end of a rectangular lightroof box (length 0.8 m), whilst the opposite end of the box was fittedagainst the front surface of the test vessel. Images were analysedusing Zeiss KS 300 Imaging software 3.0 (Carl Zeiss Vision GmbH,Germany). Non-Daphnid objects (e.g. image noise, impurities onthe glass) were deleted and any holes in the selected objects werefilled before automatic enumeration of individuals and the surfacearea (in pixels) of the population.
In contrast to traditional methods for monitoring abundanceand size distribution, image analysis is non-invasive, time-efficient,and enables the frequent recording of the whole population. Mea-surements were divided into three groups of body size: size class 1,0.8–2.3 mm (neonate and juvenile); size class 2, 2.3–2.8 mm (smalladults); and size class 3, >2.8 mm (large adults). A comparison withmanual measurements of abundance and individual size showeda high degree of agreement between methods. Correlations forabundance were log image analyses counts = 0.14 + 0.91 log manualcounts (r2 = 0.999, p < 0.001). Correlations for size were log imagesurface area = 1.65 + 1.77 log manual length (r2 = 0.991, p < 0.001)(Liess et al., 2006). The population biomass was calculated fromindividual dry weights W = 1.5 × 10⁻⁸ L2.84, where L is the bodylength of Daphnia individuals (Dumont et al., 1975).
2.8. Algal density
The cell density of the chlorophyte D. subspicatus was measured2 days after short-term disturbance (toxic exposure and mechani-cal removal) in all 38 test systems. Three hours after feeding withalgae, three samples of 2 mL of test medium were taken per testsystem. The fluorescence of the medium was measured in a Spec-tramax GEMINI EM fluorescence plate reader (Molecular Devices,Sunnyvale, USA) at an excitation wavelength of 430 nm and emis-sion at 690 nm. The measurement of fluorescence was calibratedwith a five-point standard curve of algal suspension (for detailsof algal feeding and the quantification of algal cell densities, seeSection 2.2 above).
2.9. Statistical analysis
Abundance of D. magna is given as a moving average with themean value of three successive observations (one value directlybefore and one after dosing). To account for differences in the devel-opment of populations before dosing, the individual abundances ofsome test series were normalised. This was done by comparing themean abundances of individuals of the test series with those of thecontrols vessels during the three time points before dosing. In caseof significant deviations during that time period, we normalised allvalues of the test series to match the mean value of the control1 day before dosing. Differences between the means of the con-trol and disturbed test series (toxic or mechanical) were calculatedusing a one-way analysis of variance followed by Dunnett’s post hoc
multiple-comparison test. In the few cases when the condition ofdata normality (Shapiro-Wilk test) and homoscedasticity (Levene’stest) were violated, differences between means were calculatedusing the non-parametric Kruskal–Wallis test, followed by a non-parametric multiple-comparison test. An observation was regarded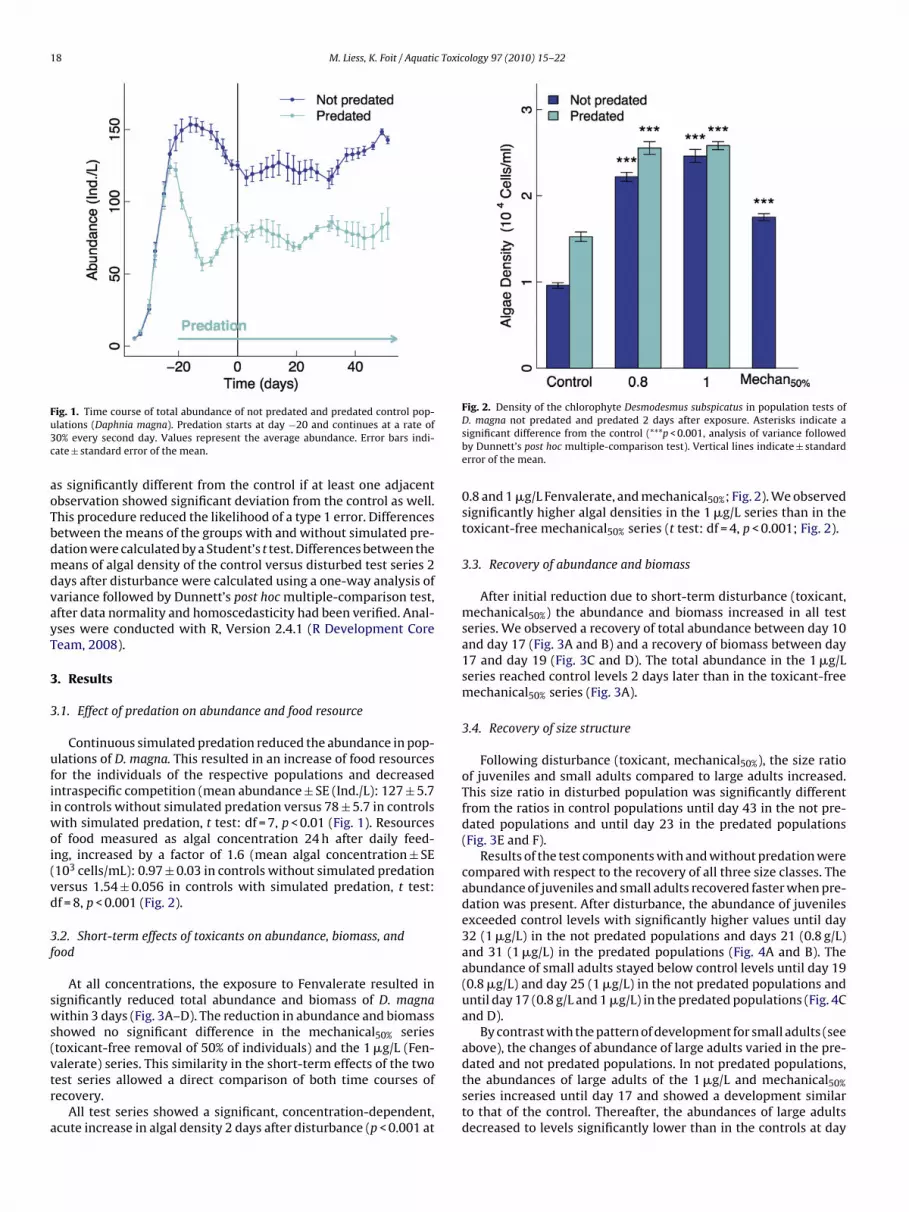
18 M. Liess, K. Foit / Aquatic Toxicology 97 (2010) 15–22
Fu3c
aoTbdmdvayT
3
3
ufiiwoi(vd
3f
sws(vtr
a
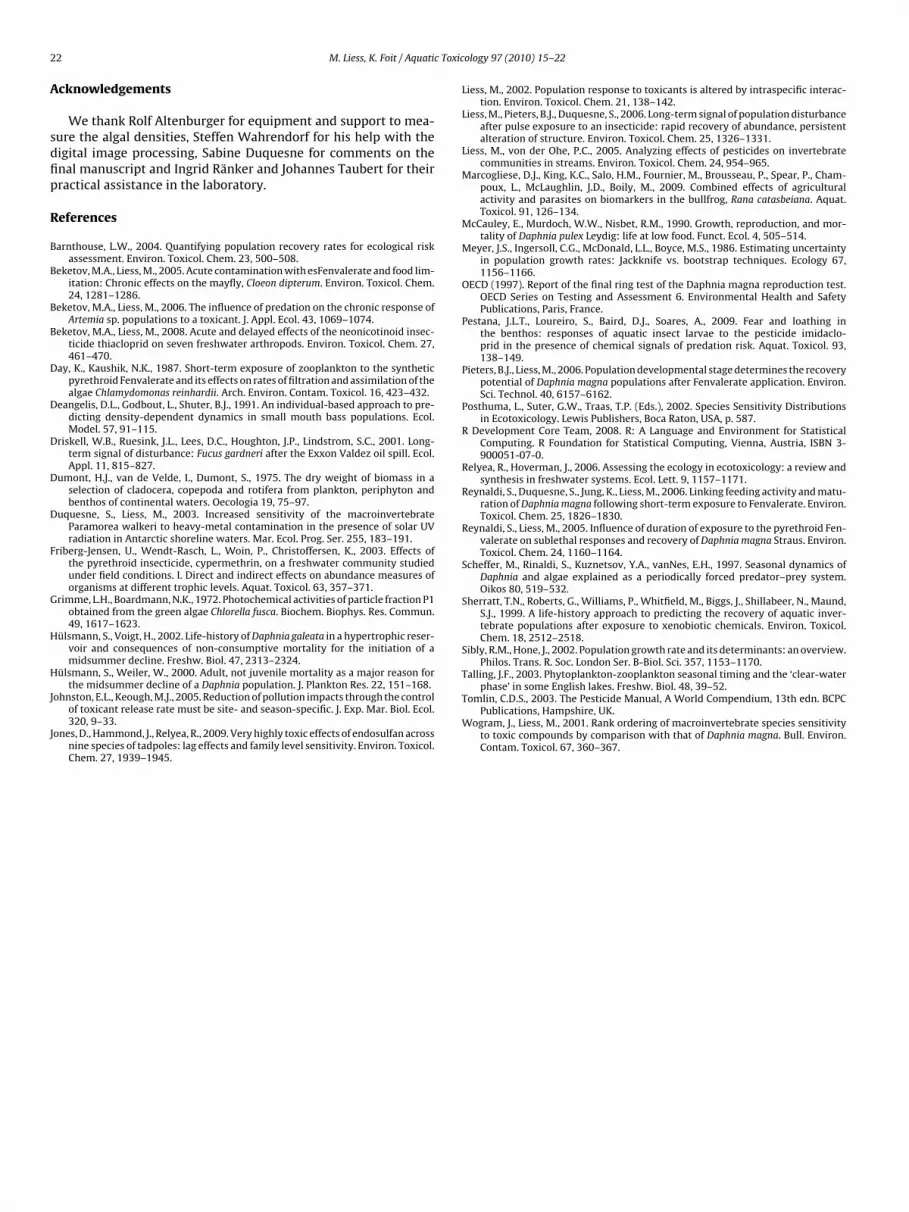
Fig. 2. Density of the chlorophyte Desmodesmus subspicatus in population tests of
ig. 1. Time course of total abundance of not predated and predated control pop-lations (Daphnia magna). Predation starts at day −20 and continues at a rate of0% every second day. Values represent the average abundance. Error bars indi-ate ± standard error of the mean.s significantly different from the control if at least one adjacentbservation showed significant deviation from the control as well.his procedure reduced the likelihood of a type 1 error. Differencesetween the means of the groups with and without simulated pre-ation were calculated by a Student’s t test. Differences between theeans of algal density of the control versus disturbed test series 2
ays after disturbance were calculated using a one-way analysis ofariance followed by Dunnett’s post hoc multiple-comparison test,fter data normality and homoscedasticity had been verified. Anal-ses were conducted with R, Version 2.4.1 (R Development Coreeam, 2008).
. Results
.1. Effect of predation on abundance and food resource
Continuous simulated predation reduced the abundance in pop-lations of D. magna. This resulted in an increase of food resourcesor the individuals of the respective populations and decreasedntraspecific competition (mean abundance ± SE (Ind./L): 127 ± 5.7n controls without simulated predation versus 78 ± 5.7 in controls
ith simulated predation, t test: df = 7, p < 0.01 (Fig. 1). Resourcesf food measured as algal concentration 24 h after daily feed-ng, increased by a factor of 1.6 (mean algal concentration ± SE103 cells/mL): 0.97 ± 0.03 in controls without simulated predationersus 1.54 ± 0.056 in controls with simulated predation, t test:f = 8, p < 0.001 (Fig. 2).
.2. Short-term effects of toxicants on abundance, biomass, andood
At all concentrations, the exposure to Fenvalerate resulted inignificantly reduced total abundance and biomass of D. magnaithin 3 days (Fig. 3A–D). The reduction in abundance and biomass
howed no significant difference in the mechanical50% seriestoxicant-free removal of 50% of individuals) and the 1 �g/L (Fen-
alerate) series. This similarity in the short-term effects of the twoest series allowed a direct comparison of both time courses ofecovery.All test series showed a significant, concentration-dependent,cute increase in algal density 2 days after disturbance (p < 0.001 at
D. magna not predated and predated 2 days after exposure. Asterisks indicate asignificant difference from the control (***p < 0.001, analysis of variance followedby Dunnett’s post hoc multiple-comparison test). Vertical lines indicate ± standarderror of the mean.
0.8 and 1 �g/L Fenvalerate, and mechanical50%; Fig. 2). We observedsignificantly higher algal densities in the 1 �g/L series than in thetoxicant-free mechanical50% series (t test: df = 4, p < 0.001; Fig. 2).
3.3. Recovery of abundance and biomass
After initial reduction due to short-term disturbance (toxicant,mechanical50%) the abundance and biomass increased in all testseries. We observed a recovery of total abundance between day 10and day 17 (Fig. 3A and B) and a recovery of biomass between day17 and day 19 (Fig. 3C and D). The total abundance in the 1 �g/Lseries reached control levels 2 days later than in the toxicant-freemechanical50% series (Fig. 3A).
3.4. Recovery of size structure
Following disturbance (toxicant, mechanical50%), the size ratioof juveniles and small adults compared to large adults increased.This size ratio in disturbed population was significantly differentfrom the ratios in control populations until day 43 in the not pre-dated populations and until day 23 in the predated populations(Fig. 3E and F).
Results of the test components with and without predation werecompared with respect to the recovery of all three size classes. Theabundance of juveniles and small adults recovered faster when pre-dation was present. After disturbance, the abundance of juvenilesexceeded control levels with significantly higher values until day32 (1 �g/L) in the not predated populations and days 21 (0.8 g/L)and 31 (1 �g/L) in the predated populations (Fig. 4A and B). Theabundance of small adults stayed below control levels until day 19(0.8 �g/L) and day 25 (1 �g/L) in the not predated populations anduntil day 17 (0.8 g/L and 1 �g/L) in the predated populations (Fig. 4Cand D).
By contrast with the pattern of development for small adults (seeabove), the changes of abundance of large adults varied in the pre-
dated and not predated populations. In not predated populations,the abundances of large adults of the 1 �g/L and mechanical50%series increased until day 17 and showed a development similarto that of the control. Thereafter, the abundances of large adultsdecreased to levels significantly lower than in the controls at day
M. Liess, K. Foit / Aquatic Toxicology 97 (2010) 15–22 19
Fig. 3. Time course of total abundance, total biomass, as well as size ratio of size class 1–2 (neonates, juveniles and small adults)/size class 3 (large adults) of D. magna in notpredated populations (left) and predated populations (right). Short-term disturbance with Fenvalerate or mechanical removal (mechanical50%) at day 0. Predation starts atday −20 and continues at a rate of 30% every second day. Values represent averages of abundance of replicates. Asterisks indicate a significant difference from the control(p < 0.05, analysis of variance followed by Dunnett’s post hoc multiple-comparison test). Confidence limits have been omitted for clarity.

20 M. Liess, K. Foit / Aquatic Toxicology 97 (2010) 15–22
Fig. 4. Time courses of D. magna in not predated populations (left) and predated populations (right) displayed as three size classes of body length: size class 1, 0.8–2.3 mm(neonate and juvenile), size class 2, 2.3–2.8 mm (small adults) and size class 3, >2.8 mm (large adults). Short-term disturbance with Fenvalerate or mechanical removal(mechanical50%) at day 0. Predation starts at day −20 and continues at a rate of 30% every second day. Values represent averages of abundance of replicates. Asterisks indicatea significant difference from the control (p < 0.05, analysis of variance followed by Dunnett’s post hoc multiple-comparison test). Confidence limits have been omitted forclarity.

c Toxic
3Hrta
pwmteFrFeas
4
4
darrafi2tra
4
pFtlaHmae
4
riosret5et
4
t
or latent toxicant effects on life-history traits on the individual
M. Liess, K. Foit / Aquati
9 to day 41 in mechanical50% and 1 �g/L, respectively (Fig. 4E).owever, in predated populations, the abundance of large adults
eached control levels after 23 days and then remained similar tohe controls without any delayed decrease of abundance (Fig. 4Dnd F).
To reveal whether the delayed effects in the not predatedopulations can be attributed to the exposure to Fenvalerate,e compared the 1 �g/L Fenvalerate series with a toxicant-freeechanical50% series. Both test components showed a similar pat-
ern of recovery, however, development processes occurred slightlyarlier in toxicant-free mechanical50% series compared to the 1 �g/Lenvalerate series. In the toxicant-free mechanical50% series, theecovery occurred (i) for juveniles after day 32 (i.e. as the 1 �g/Lenvalerate series), (ii) for small adults after day 27 (i.e. 2 daysarlier than in the 1 �g/L Fenvalerate series), (iii) for large adultsfter day 39 (i.e. also 2 days earlier compared to 1 �g/L Fenvalerateeries) (Fig. 4A, C and E).
. Discussion
.1. Field relevance of study design
The results of the two test components with and without pre-ation differed significantly in terms of abundance of D. magnand in algal density used as an indicator of availability of foodesource. In the field, these two parameters, abundance and foodesources, are influenced predominantly by seasonal changes inlgal growth, intra- and interspecific competition, and predation bysh or invertebrates (Scheffer et al., 1997; Hülsmann and Weiler,000; Hülsmann and Voigt, 2002; Talling, 2003). We thus assumehat the selected test design represents a realistic scenario of natu-al populations of zooplankton that differ in the availability of foodnd the pressure from competition.
.2. Short-term effects of toxicants on abundance and biomass
Abundance and biomass in both the not predated and predatedopulations were reduced significantly as a result of exposure toenvalerate. The lowest-observed-effect concentration (LOEC) andhe concentration that caused total mortality corresponded to pub-ished values that were obtained in tests on individuals 10 daysfter a 24-h exposure to Fenvalerate (Reynaldi and Liess, 2005).owever, the predated populations showed a slightly higher acuteortality than the not predated populations. This is because the
cute effect of Fenvalerate was monitored after the first predationvent. Hence, toxicant effect and predation effect are cumulated.
.3. Recovery of abundance and biomass
Toxicant-induced mortality resulted in high levels of foodesources for survivors. Following this, reproduction was stronglynduced in all test series and the total abundance and biomassf the controls was reached within 10, respectively, 19 days. Thishort-term recovery of “integrating endpoints” has been observedepeatedly in experiments with populations of D. magna (Liesst al., 2006; Pieters and Liess, 2006). Based on life-cycle traits,he recovery time related to abundance of D. magna reduced by0% is modelled to be 7 days (Barnthouse, 2004). Hence, mod-lled recovery time for abundance is close to the observed recoveryime.
.4. Recovery of size structure
Recovery time for size structure surprisingly exceeded recoveryime for abundance many times over. We explain the mechanism
ology 97 (2010) 15–22 21
behind this observation as follows. In the not predated popula-tions, the large number of small individuals that were producedafter disturbance exerted a strong competitive pressure as soonas the carrying capacity of the system was reached. This acted asa bottleneck for further growth in all size classes. A similar effectwas modelled by Deangelis et al. (1991) were for a fish popula-tion high numbers of juveniles decreased recruitment of larvae.In our investigation mortality in all size classes was increased athigh individual density as well. In particular, the abundance of largeadults declined. We suggest an accelerated senescence when foodis scarce to explain the observed pattern (McCauley et al., 1990).Hence both, the inhibited growth of juveniles and the increasedmortality of large adults at carrying capacity when competition ishigh prolonged the recovery of size structure in the not predatedpopulations.
Consequently, we hypothesised that a release from competitivepressure will reduce the time required for the population structureto recover. This expectation was confirmed in predated populationswere a removal of individuals reduced pressure from competi-tion. Here, the juveniles that were produced after exposure to thetoxicant were able to grow into larger size classes – filling thegaps resulting from predation – and consequently size structurerecovered faster. Additionally, adult mortality at carrying capac-ity was not increasing in this test component that is characterisedby a higher availability of food. These processes mechanisticallyexplain how simulated predation may have shortened the recov-ery time of size structure. However, this conclusion is only validfor rates of predation that can be well compensated by repro-duction. Higher rates of predation, combined with the negativeeffects of the toxicant on population growth rate, may exhaustthe potential for recovery and cause extinction (Beketov and Liess,2006).
4.5. Chemical vs. mechanical disturbance
We compared the effect of chemical (1 �g/L series) vs. mechani-cal short-term disturbance (mechanical50%) on the recovery processto identify in which extend sublethal or latent effects of Fenvaler-ate may have contributed to the slow recovery of size structure. Thetotal abundance recovered 2 days later when mortality was causedby exposure to Fenvalerate (1 �g/L series) compared to mechani-cal removal of individuals (mechanical50%). This can be explainedby sublethal effects of Fenvalerate that is known to inhibit fooduptake of individuals, and consequently, to delay the maturationand reproduction (Day and Kaushik, 1987; Reynaldi et al., 2006).In this experiment, the inhibited food uptake due to Fenvaler-ate exposure resulted in an increased algae concentration (Fig. 2).Size structure recovered 5 days later when mortality was causedby exposure to Fenvalerate (1 �g/L series) instead of mechanicalremoval of individuals (mechanical50%) (Fig. 3E). Hence, the delayin recovery caused directly by the effect of the toxicant on individu-als (delayed development) adds only minor to the delay in recoverycaused by the indirect effect of the toxicant (restricted developmentdue to competition).
5. Conclusion
Strength of intraspecific competition greatly determines dura-tion for recovery of population structure. In contrast, sublethal
level are of minor importance. As competition is present in allnatural populations, this parameter needs to be considered inthe design of test systems and in the interpretation of resultswhen deriving realistic ecological acceptable threshold levels forstressors.
2 c Toxic
A
sdfip
R
B
B
B
B
D
D
D
D
D
F
G
H
H
J
J
phase’ in some English lakes. Freshw. Biol. 48, 39–52.
2 M. Liess, K. Foit / Aquati
cknowledgements
We thank Rolf Altenburger for equipment and support to mea-ure the algal densities, Steffen Wahrendorf for his help with theigital image processing, Sabine Duquesne for comments on thenal manuscript and Ingrid Ränker and Johannes Taubert for theirractical assistance in the laboratory.
eferences
arnthouse, L.W., 2004. Quantifying population recovery rates for ecological riskassessment. Environ. Toxicol. Chem. 23, 500–508.
eketov, M.A., Liess, M., 2005. Acute contamination with esFenvalerate and food lim-itation: Chronic effects on the mayfly, Cloeon dipterum. Environ. Toxicol. Chem.24, 1281–1286.
eketov, M.A., Liess, M., 2006. The influence of predation on the chronic response ofArtemia sp. populations to a toxicant. J. Appl. Ecol. 43, 1069–1074.
eketov, M.A., Liess, M., 2008. Acute and delayed effects of the neonicotinoid insec-ticide thiacloprid on seven freshwater arthropods. Environ. Toxicol. Chem. 27,461–470.
ay, K., Kaushik, N.K., 1987. Short-term exposure of zooplankton to the syntheticpyrethroid Fenvalerate and its effects on rates of filtration and assimilation of thealgae Chlamydomonas reinhardii. Arch. Environ. Contam. Toxicol. 16, 423–432.
eangelis, D.L., Godbout, L., Shuter, B.J., 1991. An individual-based approach to pre-dicting density-dependent dynamics in small mouth bass populations. Ecol.Model. 57, 91–115.
riskell, W.B., Ruesink, J.L., Lees, D.C., Houghton, J.P., Lindstrom, S.C., 2001. Long-term signal of disturbance: Fucus gardneri after the Exxon Valdez oil spill. Ecol.Appl. 11, 815–827.
umont, H.J., van de Velde, I., Dumont, S., 1975. The dry weight of biomass in aselection of cladocera, copepoda and rotifera from plankton, periphyton andbenthos of continental waters. Oecologia 19, 75–97.
uquesne, S., Liess, M., 2003. Increased sensitivity of the macroinvertebrateParamorea walkeri to heavy-metal contamination in the presence of solar UVradiation in Antarctic shoreline waters. Mar. Ecol. Prog. Ser. 255, 183–191.
riberg-Jensen, U., Wendt-Rasch, L., Woin, P., Christoffersen, K., 2003. Effects ofthe pyrethroid insecticide, cypermethrin, on a freshwater community studiedunder field conditions. I. Direct and indirect effects on abundance measures oforganisms at different trophic levels. Aquat. Toxicol. 63, 357–371.
rimme, L.H., Boardmann, N.K., 1972. Photochemical activities of particle fraction P1obtained from the green algae Chlorella fusca. Biochem. Biophys. Res. Commun.49, 1617–1623.
ülsmann, S., Voigt, H., 2002. Life-history of Daphnia galeata in a hypertrophic reser-voir and consequences of non-consumptive mortality for the initiation of amidsummer decline. Freshw. Biol. 47, 2313–2324.
ülsmann, S., Weiler, W., 2000. Adult, not juvenile mortality as a major reason forthe midsummer decline of a Daphnia population. J. Plankton Res. 22, 151–168.
ohnston, E.L., Keough, M.J., 2005. Reduction of pollution impacts through the controlof toxicant release rate must be site- and season-specific. J. Exp. Mar. Biol. Ecol.320, 9–33.
ones, D., Hammond, J., Relyea, R., 2009. Very highly toxic effects of endosulfan acrossnine species of tadpoles: lag effects and family level sensitivity. Environ. Toxicol.Chem. 27, 1939–1945.
ology 97 (2010) 15–22
Liess, M., 2002. Population response to toxicants is altered by intraspecific interac-tion. Environ. Toxicol. Chem. 21, 138–142.
Liess, M., Pieters, B.J., Duquesne, S., 2006. Long-term signal of population disturbanceafter pulse exposure to an insecticide: rapid recovery of abundance, persistentalteration of structure. Environ. Toxicol. Chem. 25, 1326–1331.
Liess, M., von der Ohe, P.C., 2005. Analyzing effects of pesticides on invertebratecommunities in streams. Environ. Toxicol. Chem. 24, 954–965.
Marcogliese, D.J., King, K.C., Salo, H.M., Fournier, M., Brousseau, P., Spear, P., Cham-poux, L., McLaughlin, J.D., Boily, M., 2009. Combined effects of agriculturalactivity and parasites on biomarkers in the bullfrog, Rana catasbeiana. Aquat.Toxicol. 91, 126–134.
McCauley, E., Murdoch, W.W., Nisbet, R.M., 1990. Growth, reproduction, and mor-tality of Daphnia pulex Leydig: life at low food. Funct. Ecol. 4, 505–514.
Meyer, J.S., Ingersoll, C.G., McDonald, L.L., Boyce, M.S., 1986. Estimating uncertaintyin population growth rates: Jackknife vs. bootstrap techniques. Ecology 67,1156–1166.
OECD (1997). Report of the final ring test of the Daphnia magna reproduction test.OECD Series on Testing and Assessment 6. Environmental Health and SafetyPublications, Paris, France.
Pestana, J.L.T., Loureiro, S., Baird, D.J., Soares, A., 2009. Fear and loathing inthe benthos: responses of aquatic insect larvae to the pesticide imidaclo-prid in the presence of chemical signals of predation risk. Aquat. Toxicol. 93,138–149.
Pieters, B.J., Liess, M., 2006. Population developmental stage determines the recoverypotential of Daphnia magna populations after Fenvalerate application. Environ.Sci. Technol. 40, 6157–6162.
Posthuma, L., Suter, G.W., Traas, T.P. (Eds.), 2002. Species Sensitivity Distributionsin Ecotoxicology. Lewis Publishers, Boca Raton, USA, p. 587.
R Development Core Team, 2008. R: A Language and Environment for StatisticalComputing. R Foundation for Statistical Computing, Vienna, Austria, ISBN 3-900051-07-0.
Relyea, R., Hoverman, J., 2006. Assessing the ecology in ecotoxicology: a review andsynthesis in freshwater systems. Ecol. Lett. 9, 1157–1171.
Reynaldi, S., Duquesne, S., Jung, K., Liess, M., 2006. Linking feeding activity and matu-ration of Daphnia magna following short-term exposure to Fenvalerate. Environ.Toxicol. Chem. 25, 1826–1830.
Reynaldi, S., Liess, M., 2005. Influence of duration of exposure to the pyrethroid Fen-valerate on sublethal responses and recovery of Daphnia magna Straus. Environ.Toxicol. Chem. 24, 1160–1164.
Scheffer, M., Rinaldi, S., Kuznetsov, Y.A., vanNes, E.H., 1997. Seasonal dynamics ofDaphnia and algae explained as a periodically forced predator–prey system.Oikos 80, 519–532.
Sherratt, T.N., Roberts, G., Williams, P., Whitfield, M., Biggs, J., Shillabeer, N., Maund,S.J., 1999. A life-history approach to predicting the recovery of aquatic inver-tebrate populations after exposure to xenobiotic chemicals. Environ. Toxicol.Chem. 18, 2512–2518.
Sibly, R.M., Hone, J., 2002. Population growth rate and its determinants: an overview.Philos. Trans. R. Soc. London Ser. B-Biol. Sci. 357, 1153–1170.
Talling, J.F., 2003. Phytoplankton-zooplankton seasonal timing and the ‘clear-water
Tomlin, C.D.S., 2003. The Pesticide Manual, A World Compendium, 13th edn. BCPCPublications, Hampshire, UK.
Wogram, J., Liess, M., 2001. Rank ordering of macroinvertebrate species sensitivityto toxic compounds by comparison with that of Daphnia magna. Bull. Environ.Contam. Toxicol. 67, 360–367.
Related Documents