Geophys. J. Int. (2004) 159, 390–399 doi: 10.1111/j.1365-246X.2004.02357.x GJI Tectonics and geodynamics Intraplate seismicity in SE Brazil: stress concentration in lithospheric thin spots Marcelo Assump¸ c˜ ao, 1 Martin Schimmel, 1, ∗ Christian Escalante, 1, † Jos´ e Roberto Barbosa, 1 Marcelo Rocha 1 and Lucas V. Barros 2 1 University of S˜ ao Paulo, IAG, Rua do Mat˜ ao 1226, Cidade Universit´ aria, S ˜ ao Paulo SP 05508-090, Brazil. E-mail: [email protected] 2 Seismological Observatory, University of Bras´ ılia, Bras´ ılia 70910, Brazil Accepted 2004 April 29. Received 2004 April 15; in original form 2003 April 16 SUMMARY Intraplate seismicity has generally poor correlation with surface geological patterns. Except for major extensional features, such as aborted continental rifts, which may act as weak zones, it is usually difficult to find simple geology based models to explain differences in seismic activity in stable continental regions. Seismicity in Brazil is clearly not uniform and a few areas of higher activity have been identified. However, the seismic areas show almost no correlation with the main geological provinces, which is typical of other intraplate settings. A recent upper- mantle tomography study in SE and central Brazil, using approximately 8500 P-wave and 2000 PKP-wave arrivals recorded in 59 sites since 1992, has mapped P-wave velocity anomalies from lithospheric depths down to 1300 km. In this region, higher seismic activity occurs preferentially in areas with low P-wave velocities at 150–250 km depth. The low P-wave velocities are interpreted as shallower asthenosphere. In such areas, a hotter geotherm will reduce the strength of the lithospheric upper mantle causing most of the intraplate forces to be concentrated in the brittle upper crust. The low-velocity anomalies coincide with Late Cretaceous provinces of alkaline intrusions. The proposed ponding of the Trindade plume head beneath lithospheric thin spots is consistent with our tomography results, suggesting that plume effects may have helped to preserve lithosphere/asthenosphere topography. Although other factors are also important, the present data show that stress concentrations resulting from lithosphere/asthenosphere topography should play an important role in explaining the intraplate seismicity in the Brazilian platform. Key words: intraplate seismicity, lithospheric strength, Trindade plume, upper-mantle tomog- raphy. 1 INTRODUCTION Understanding the causes of seismicity in stable continental interi- ors, in most cases, is still a challenge in seismology. Although obser- vations show that seismic activity is not uniform in intraplate areas, it is not always clear why seismicity concentrates in certain regions while others are completely aseismic. One of the major difficulties in studies of intraplate seismicity is that seismic ruptures very rarely reach the surface and in general no correlation is observed between epicentres and old geological faults mapped at the surface (e.g. Seeber & Armbruster 1988; Talwani 1989; Ferreira et al. 1998). Several models have been proposed to explain the distribution of seismicity in intraplate areas. In general, the proposed models in- ∗ Now at: Institute of Earth Sciences, CSIC, Barcelona 08028, Spain. †Now at: Instituto Geofisico de Arequipa, Peru. volve weak zones, stress concentrations from lateral density varia- tion, flexural stresses, or a combination of the above factors. In a classical review paper, Sykes (1978) attempted to explain intraplate seismicity as resulting from pre-existing zones of weak- ness. Relatively recent tectonism (such as evidenced by Mesozoic or Cenozoic alkaline intrusions) would indicate deep crustal weakness zones including suture zones, aborted rifts and faults in cratonic lim- its. For large earthquakes (larger than 6.5 Ms) in stable continental regions, Johnston (1989) and Johnston & Kanter (1990) confirmed a good correlation between epicentres and areas affected by exten- sional Mesozoic tectonism such as passive margins or intraconti- nental grabens, with the weak zones being the areas of extended continental crust. However, in areas with smaller earthquakes, weak zones are not so easily identified. Another class of models uses stress concentrations in the crust, which can be caused by lateral density variations, rock rigidity con- trast between crustal blocks or flexure from lithospheric loads (see 390 C 2004 RAS

Welcome message from author
This document is posted to help you gain knowledge. Please leave a comment to let me know what you think about it! Share it to your friends and learn new things together.
Transcript
Geophys. J. Int. (2004) 159, 390–399 doi: 10.1111/j.1365-246X.2004.02357.xG
JITec
toni
csan
dge
ody
nam
ics
Intraplate seismicity in SE Brazil: stress concentrationin lithospheric thin spots
Marcelo Assumpcao,1 Martin Schimmel,1,∗ Christian Escalante,1,†Jose Roberto Barbosa,1 Marcelo Rocha1 and Lucas V. Barros2
1University of Sao Paulo, IAG, Rua do Matao 1226, Cidade Universitaria, Sao Paulo SP 05508-090, Brazil. E-mail: [email protected] Observatory, University of Brasılia, Brasılia 70910, Brazil
Accepted 2004 April 29. Received 2004 April 15; in original form 2003 April 16
S U M M A R YIntraplate seismicity has generally poor correlation with surface geological patterns. Except formajor extensional features, such as aborted continental rifts, which may act as weak zones, it isusually difficult to find simple geology based models to explain differences in seismic activityin stable continental regions. Seismicity in Brazil is clearly not uniform and a few areas ofhigher activity have been identified. However, the seismic areas show almost no correlationwith the main geological provinces, which is typical of other intraplate settings. A recent upper-mantle tomography study in SE and central Brazil, using approximately 8500 P-wave and 2000PKP-wave arrivals recorded in 59 sites since 1992, has mapped P-wave velocity anomaliesfrom lithospheric depths down to 1300 km. In this region, higher seismic activity occurspreferentially in areas with low P-wave velocities at 150–250 km depth. The low P-wavevelocities are interpreted as shallower asthenosphere. In such areas, a hotter geotherm willreduce the strength of the lithospheric upper mantle causing most of the intraplate forcesto be concentrated in the brittle upper crust. The low-velocity anomalies coincide with LateCretaceous provinces of alkaline intrusions. The proposed ponding of the Trindade plumehead beneath lithospheric thin spots is consistent with our tomography results, suggesting thatplume effects may have helped to preserve lithosphere/asthenosphere topography. Althoughother factors are also important, the present data show that stress concentrations resultingfrom lithosphere/asthenosphere topography should play an important role in explaining theintraplate seismicity in the Brazilian platform.
Key words: intraplate seismicity, lithospheric strength, Trindade plume, upper-mantle tomog-raphy.
1 I N T RO D U C T I O N
Understanding the causes of seismicity in stable continental interi-ors, in most cases, is still a challenge in seismology. Although obser-vations show that seismic activity is not uniform in intraplate areas,it is not always clear why seismicity concentrates in certain regionswhile others are completely aseismic. One of the major difficultiesin studies of intraplate seismicity is that seismic ruptures very rarelyreach the surface and in general no correlation is observed betweenepicentres and old geological faults mapped at the surface (e.g.Seeber & Armbruster 1988; Talwani 1989; Ferreira et al. 1998).Several models have been proposed to explain the distribution ofseismicity in intraplate areas. In general, the proposed models in-
∗Now at: Institute of Earth Sciences, CSIC, Barcelona 08028, Spain.†Now at: Instituto Geofisico de Arequipa, Peru.
volve weak zones, stress concentrations from lateral density varia-tion, flexural stresses, or a combination of the above factors.
In a classical review paper, Sykes (1978) attempted to explainintraplate seismicity as resulting from pre-existing zones of weak-ness. Relatively recent tectonism (such as evidenced by Mesozoic orCenozoic alkaline intrusions) would indicate deep crustal weaknesszones including suture zones, aborted rifts and faults in cratonic lim-its. For large earthquakes (larger than 6.5 Ms) in stable continentalregions, Johnston (1989) and Johnston & Kanter (1990) confirmeda good correlation between epicentres and areas affected by exten-sional Mesozoic tectonism such as passive margins or intraconti-nental grabens, with the weak zones being the areas of extendedcontinental crust. However, in areas with smaller earthquakes, weakzones are not so easily identified.
Another class of models uses stress concentrations in the crust,which can be caused by lateral density variations, rock rigidity con-trast between crustal blocks or flexure from lithospheric loads (see
390 C© 2004 RAS

Seismicity concentration in lithospheric thin spots 391
Dewey (1998) for a review). Lateral density variations near moun-tain chains (e.g. the contrast between the low-density crustal rootbeneath the chain and the high-density upper mantle in the neighbor-ing shield) causes extensional stresses in the high-topography areasand compressional stresses in the low-lying nearby areas, such asin the Transverse Ranges (Sonder 1990) and in the sub-Andean re-gion (Assumpcao & Araujo 1993). The same gravity effect operatesin the continental/oceanic transition zone (e.g. Bott & Dean 1972;Stein et al. 1989) and was included by Meijer (1995) and Coblentz& Richardson (1996) in their models of mid-plate stresses in SouthAmerica. High local stresses can also be generated by flexural effectsfrom intracrustal loads, such as proposed by Zoback & Richardson(1996) and Lima et al. (1997) for the Middle Amazon basin, orby sedimentary loads in the continental shelf (e.g. Cloetingh et al.1984; Stein et al. 1989).
Regional stresses from plate boundary forces can be combinedwith local effects, resulting from density contrasts or flexure, in-creasing the resultant stresses (so called superposition model) suchas proposed by Lima et al. (1997), Assumpcao (1998a) and Ferreiraet al. (1998) to explain the seismicity along parts of the northeasternand southeastern margins of Brazil. However, seismicity along theBrazilian passive margin is not uniform: for example, the superpo-sition model used for the NE margin fails to explain the aseismicityalong the northern margin. This means that other factors must besearched for.
It is clear that no simple model can explain all aspects of intraplateseismicity. Detailed understanding of each seismic province mayrequire a combination of many different factors (e.g. Talwani &
-60˚ -55˚ -50˚ -45˚ -40˚ -35˚ -30˚-30˚
-25˚
-20˚
-15˚
-10˚
-5˚
0˚
Sao
Francisco
craton
Amazon craton
Parana’
basin
Amazon basin
Parnaiba
basin
TrindadeIsl.
Figure 1. Map of eastern South America showing the study area. The rectangle marks the area shown in Fig. 2. The dashed circle indicates the 600-km radiusof the impact zone of the Trindade plume head, at 85–80 Ma, as proposed by Gibson et al. (1995, 1997). Contour lines in the ocean are the 200 and 2000-mbathimetry.
Rajendram 1991) including different types of crustal weaknessesand various mechanisms of stress concentrations. Also, the conceptof weak zones may not be related only to geological features mappedat the surface, but may include all of the rheological profile of thelithosphere. For example, Liu & Zoback (1997) showed an interest-ing mechanism of stress concentration in the upper crust as a resultof a weaker subcrustal lithosphere in the New Madrid seismic zone.
We show that the seismicity in the central and SE Brazilian plat-form is not uniformly distributed, but no clear correlation with sur-face geological features can be observed. Upper-mantle tomographystudies show P-wave, low-velocity anomalies in the 150–250 kmdepth range, probably related to variations of lithospheric thick-ness, with a good correlation with concentrations of seismicity. Wepropose that a thinner lithosphere, with a weaker upper-mantle lid,may concentrate stresses in the brittle upper crust, which may helpexplain the observed epicentral distribution.
2 S E I S M I C I T Y I N S E B R A Z I L I A NP L AT F O R M
In this paper, we focus on the continental seismicity of central and SEBrazil. The study area is indicated by the box in Fig. 1 where upper-mantle tomography studies have been carried out recently. Despitethe low seismicity level in the SE Brazilian platform (the largestevent occurred in 1922 with 5.1 mb), Fig. 2 shows that the epicentraldistribution is not uniform and large aseismic areas can be recog-nized. The present earthquake catalogue (from the compilation ofBerrocal et al. 1984, and the Brazilian Seismic Bulletins published
C© 2004 RAS, GJI, 159, 390–399
392 M. Assumpcao et al.
-24˚
-22˚
-20˚
-18˚
-16˚
-14˚
-12˚ (a) whole catalog
AC
Pt
GM
BB
AB
SFC
Parana basin
RBRJ
SP
-24˚
-22˚
-20˚
-18˚
-16˚
-14˚
-12˚ (b) uniform catalog
magnitudes 3 4 5
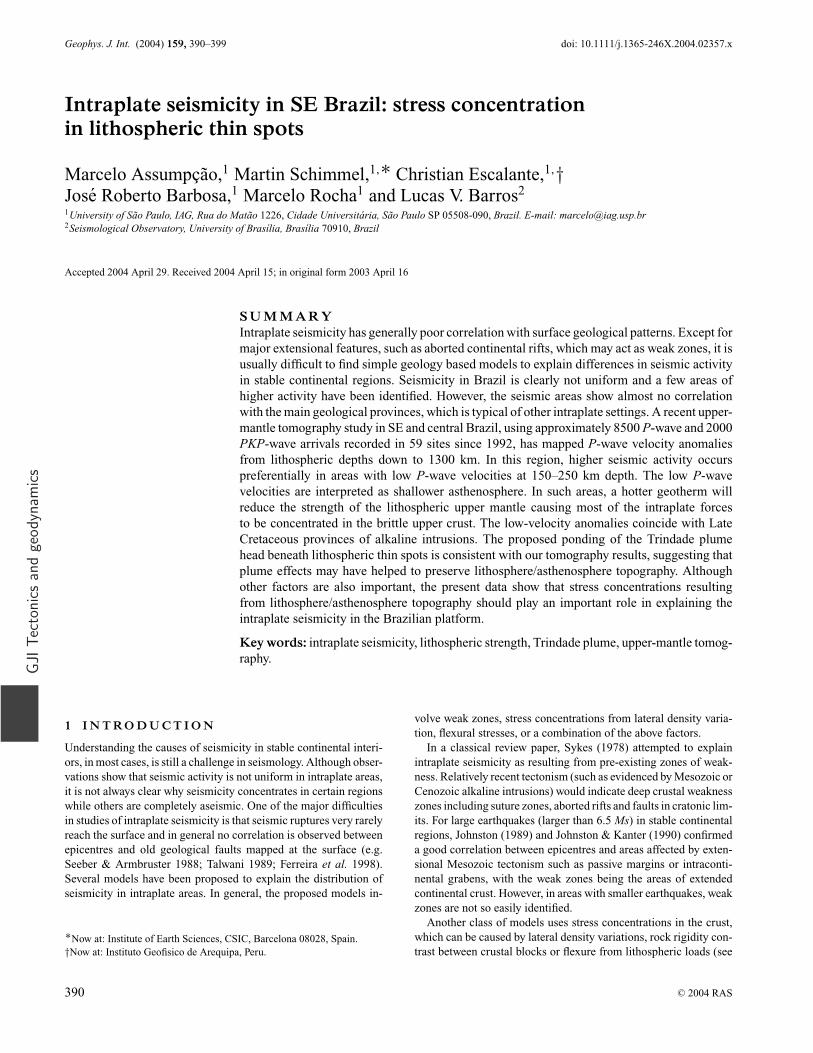
Figure 2. Seismicity maps of SE Brazilian shield. (a) Whole catalogue with all historical and instrumental epicentres. Thin lines denote limits of majorgeological provinces. Amazon craton (AC), Sao Francisco craton (SFC), Aracuaı fold belt (AB), Brasılia fold belt (BB), Ribeira belt (RB), Pantanal basin (Pt).Thick dashed line is suture zone proposed by Lesquer et al. (1981). Thin dashed line is the limit of the Goias Massif (GM). The Goias Massif and the Brasıliafoldbelt are part of the Tocantins province. Squares indicate the cities of Sao Paulo (SP) and Rio de Janeiro (RJ). (b) Uniform catalogue with events filteredwith the time variable thresholds of Table 1. Additional lines denote geological faults from CPRM (2000).
in the Rev. Bras. Geofısica) includes both historical and instrumen-tal data from 1861 to 2003, shown in Fig. 2(a). Its completeness isvariable both in time and space. For example, events before 1900only appear in the region approximately between the cities of SaoPaulo and Rio de Janeiro (in the Ribeira fold belt), where the pop-ulation density was higher and accounts of earthquakes felt by thepopulation were recorded in newspapers and books. In the late 1970sand early 1980s many seismographic stations were installed in reser-
voir areas in the Parana basin and parts of the surrounding fold belt,allowing events as small as magnitude 2.0 to be located in SE Brazil.
To have a better representation of the geographical distributionof seismicity, this whole catalogue must be filtered to eliminateconcentrations of events resulting from a higher population densityor a large number of seismographic stations in some particular ar-eas. The threshold magnitude (i.e., the minimum magnitude with alarge probability of being detected in the whole southeastern region)
C© 2004 RAS, GJI, 159, 390–399
Seismicity concentration in lithospheric thin spots 393
Table 1. Time variation of threshold magnitudes.
Magnitude Date Comments
5.0 1900 Macroseismic coverage, 250 km felt radius4.5 1940 Macroseismic coverage, 100 km felt radius4.0 1965 Brasilia array and RDJ station3.2 1980 Regional stations in SE Brazil2.8 1990 Increase in regional cover
varies with time. Table 1 (adapted from Assumpcao 1998a) showsthe threshold magnitudes used to produce the uniform catalogue ofFig. 2(b). For example, events larger than magnitude 3.2 are onlyincluded in the uniform catalogue if they occurred in 1980 or later,when there were enough seismic stations in SE Brazil to record anyevent of this size in the area of Fig. 2. A similar threshold (mag-nitude 3.1) was used for this region by Berrocal et al. (1996) forearthquakes after 1979. Since approximately 1990, with the instal-lation of additional digital three-component stations, events down tomagnitude 2.8 are believed to be completely detected in the south-eastern region (Table 1). Seismicity maps using time-variable thresh-old magnitudes (e.g. Adams & Basham 1991; Engdahl & Rinehart1991; Assumpcao et al. 2002) are useful for recognizing areas withdifferent seismicity rates and better defining seismogenic zones.
The study region (Fig. 2a) has two main Archean/Mesoproterozoic cratonic areas (Amazon and Sao Francisco cra-tons) surrounded by Neoproterozoic/Early Palaeozoic fold belts:Brasilia belt between the two cratons, the Ribeira belt along the coastand the Aracuaı belt to the east. The Parana basin, with Palaeozoicorigin, covers parts of the fold belts and may conceal a small cra-tonic nucleus (Brito Neves & Cordani 1991). The region betweenthe Amazon craton, the Sao Francisco craton and the Parana basinis known as the Tocantins province. The Goias Massif, a narrowblock trending roughly SSW–NNE with Archean terranes and theBrasılia fold belt are part of the Tocantins province.
The uniform catalogue (Fig. 2b) shows that earthquakes in SE andcentral Brazil tend to occur more frequently in two main seismiczones: (i) a SW–NE trending zone in the Tocantins province and(ii) the southern part of the Brasılia fold belt including a small partof the Sao Francisco craton and the NE border of the Parana basin.Fig. 2(b) clearly demonstrates the relative aseismicity of the Ribeirafold belt (Serra da Mantiqueira and Serra do Mar coastal ranges),as compared with the other continental areas. The Parana basin alsoseems to be relatively less seismic: the largest events in the basin(magnitudes ∼3.5) have been triggered by hydroeletric reservoirsor artesian wells (Berrocal et al. 1984; Mioto et al. 1991; Yamabe& Berrocal 1991; Assumpcao et al. 1995; Yamabe & Hamza 1996).
The epicentral distribution (Fig. 2b) shows no obvious correlationwith the main geological units described above. Earthquakes occurboth in fold belts and in cratonic areas. In fact, the Amazon and SaoFrancisco cratons correspond to 1/3 of the area shown in Fig. 2 andcontain also 1/3 of the epicentres of the uniform catalogue. Largesections of the fold belts (such as the central part of Fig. 2, or inthe Aracuaı belt, east of the Sao Francisco craton) are aseismic. Asuture zone marking the final collision between the Sao Franciscocraton and a possible cratonic block beneath the Parana basin (thickdashed line in Fig. 2) has been recognized both by geological stud-ies and by a strong gravimetric gradient (Lesquer et al. 1981). Thissuture zone could be a candidate for a weak zone but Fig. 2 showsthat seismicity only occurs near its SE segment, with the northernsegment being completely aseismic. A correlation has been sug-gested between the SW–NE trending seismic belt in the Tocantinsprovince and the regional structural trend (Fig. 2). However, a closer
examination shows that the seismic belt crosses several different ge-ological blocks, such as the Goias Massif and the foreland domainof the Brasılia belt (Fig. 2a).
3 U P P E R - M A N T L E T O M O G R A P H Y
Upper-mantle, P- and S-wave traveltime tomography has been car-ried out in SE Brazil since 1992 (VanDecar et al. 1995; Schimmelet al. 2003) using mainly temporary broad-band stations. A fewpermanent stations of the global network as well as short-periodregional stations have also been used. Until 2003, 59 sites in SEand central Brazil (Fig. 3a ) produced a total of 8500 P-wave and2000 PKP-wave readings (Escalante 2002; Rocha 2003). Relativetraveltime residuals were obtained by cross-correlation techniquesusing P-wave phases from teleseismic distances and also PKP-dfphases. In addition to P-wave anomalies, the inversion included sta-tion corrections and small (heavily damped) epicentral mislocation.Smoothness constraints (minimizing both 1st and 2nd model deriva-tives) were used to regularize the inversion. Residuals larger than1.5 standard deviations were downweighted to reduce effects ofpossible outliers. The model area is approximately that shown inFig. 3(a), with velocity anomalies defined in a grid with node spac-ing approximately 33 km in the NS and EW directions and 33 km indepth, in the better resolved area of the model. The inverted model,extends down to 1300-km depth. More details of the inversion tech-nique are described in VanDecar et al. (1995) and Schimmel et al.(2003). The input data consisted of relative residuals ranging roughlyfrom −1 to +1 s (rms of 0.41 s). After the inversion, the tomographicmodel explained approximately 88 per cent of the data, with finalresiduals having rms deviations of approximately 0.05 s.
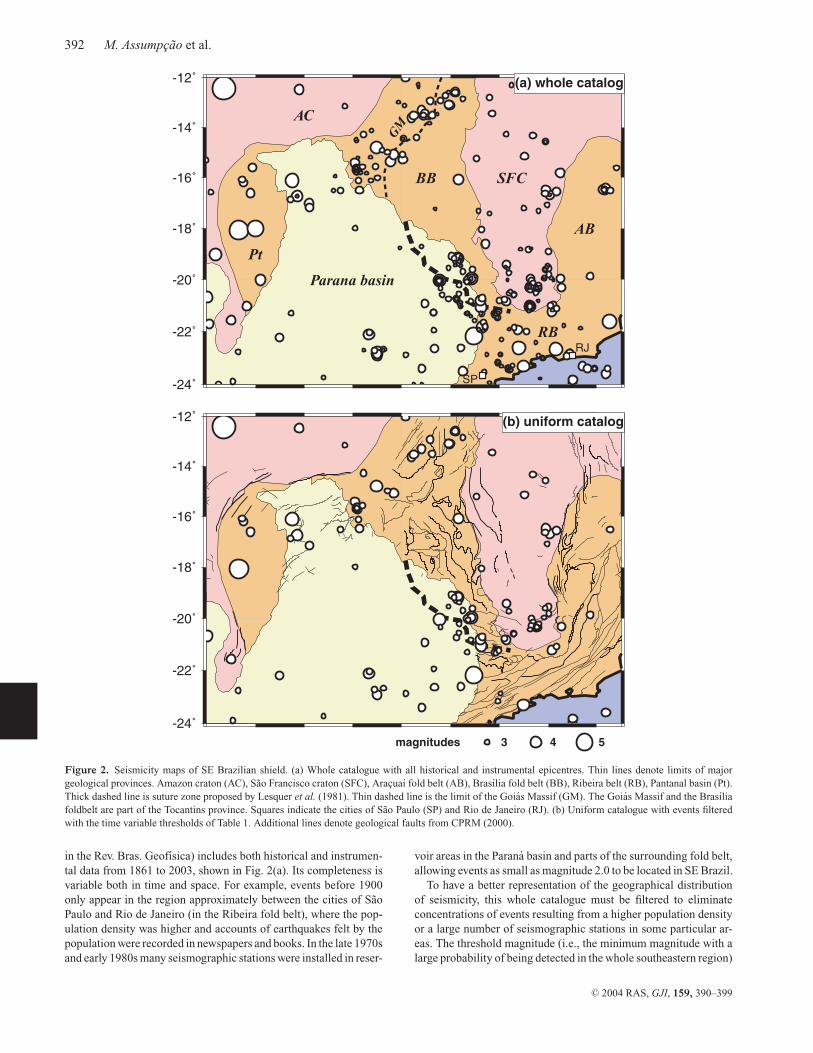
Fig. 3 shows the P-wave velocity variations at depths of 150 and200 km. Dark areas denote poorly resolved parts of the model withinsufficient ray samplings. Because only relative arrival times werepicked (and not absolute traveltimes), only lateral velocity anomaliesare obtained in the tomography inversion, i.e. variations of P-wavevelocity relative to a 1-D model. This means that the high- and low-velocity anomalies shown in Fig. 3 refer to the average velocity ateach depth.
The Sao Francisco craton, as expected, is characterized by largerthan average P-wave velocities. The middle part of the Parana basinhas mainly high velocities, consistent with the hypothesis of a cra-tonic block beneath the basin. However, the largest positive anomalycan be seen in the Brasılia belt, near the NE border of the Paranabasin, a feature not yet completely understood. A strong negativeanomaly is seen in the Tocantins province (approximately 16◦S,51◦W) coincident with the Ipora igneous province (a set of 85–60 Ma alkaline intrusions, shown in Fig. 3a). As pointed out bySchimmel et al. (2003), low velocities are also observed near theAlto Paranaıba Igneous province (APIP) of the same age, as well asfurther to the east, near the coast, where the alkaline intrusions areslightly younger (85–50 Ma). Another igneous province (Poxoreu,near the northwestern edge of the Parana basin) also seems to becharacterized by low velocities. These igneous provinces may berelated to a proposed Trindade plume (Gibson et al. 1995, 1997)whose latest track would be the E–W trending Vitoria–Trindade is-land chain in the Atlantic as seen in Fig. 1. The initial impact of theplume would have occurred beneath the Ipora province; the spreadof the plume head, as indicated by the dashed circle in Fig. 1, causedthe other igneous provinces by ponding plume material beneath ar-eas of thinner lithosphere, according to Gibson et al. (1997).
It is interesting to note that the older, 140–120 Ma intrusions(red circles in Fig. 3a) do not correlate with low velocities in the
C© 2004 RAS, GJI, 159, 390–399

394 M. Assumpcao et al.
1214
1618
2022
2426
58 56 54 52 50 48 46 44 42
(a) stations and intrusions150 km depth
Longitude West
Latit
ude
Sou
th
-1 -0.5 0 0.5 1
P-wave velocity anomaly (%)
PX IP
APIP
SM
Figure 3. P-wave anomalies in SE Brazil. (a) Anomalies at 150-km depth. Squares denote seismic stations used in the tomography. Circles indicate alkalineintrusions: red circles denote Upper Jurassic/Lower Cretaceous intrusions (140–120 Ma) roughly contemporaneous with the South Atlantic rifting and theextrusion of flood basalts in the Parana basin; yellow circles are Upper Cretaceous/Early Terciary (85–50 Ma) intrusions; note that the more recent intrusions tendto occur at or near the borders of P-wave, low-velocity anomalies. Poxoreu igneous province (PX), Ipora alkaline province (IP); Alto Paranaıba Igneous province(APIP); Serra do Mar province (SM). (b) Anomalies at 200-km depth with epicentres (circles) from the uniform catalogue of Fig. 2(b); note concentration ofevents near areas of lower P-wave velocities.
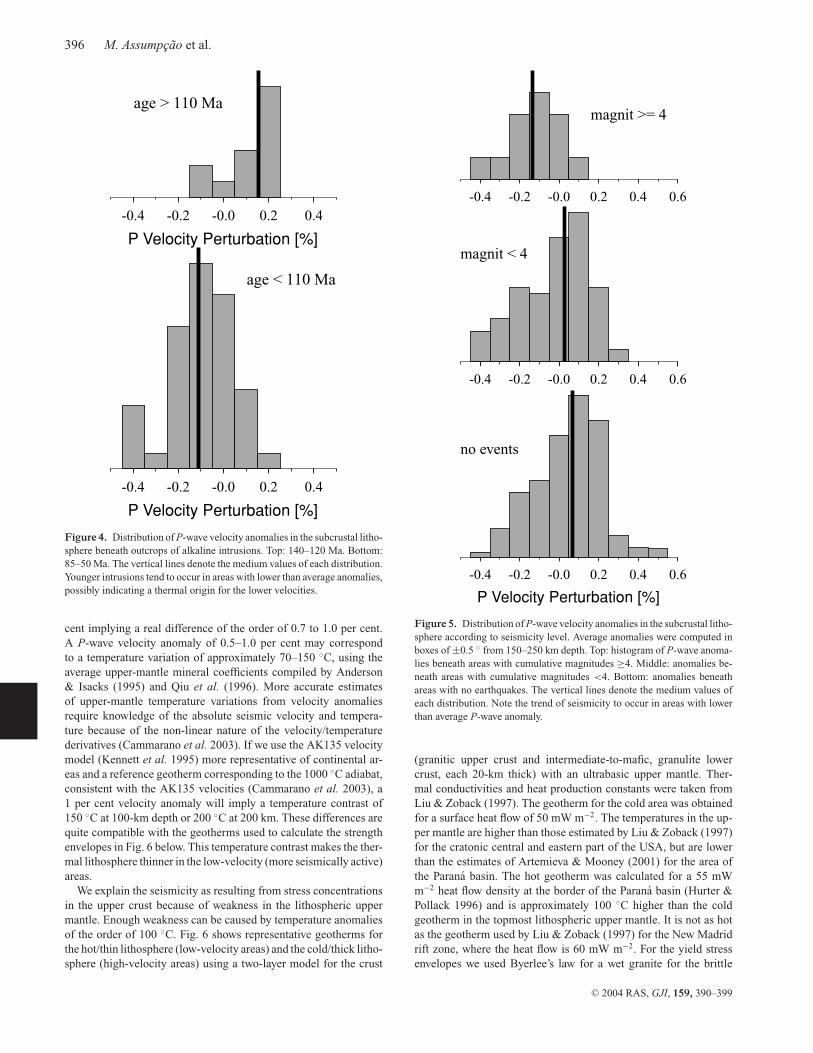
bottom of the lithosphere. These older intrusions were probablyrelated to the impact of the Tristan da Cunha superplume dur-ing the South Atlantic rifting. Fig. 4 shows the distribution of theP-wave anomalies beneath the older and beneath the more recentLate Cretaceous/Palaeogene magmatism. The velocity anomaly be-neath each alkaline outcrop was taken as the average in a window of±1◦ between 100- and 300-km depth. The mean velocity anomalybeneath the whole study area of Fig. 3 is +0.03 per cent. The meanvelocity anomaly beneath the 85–50 Ma intrusions is significantlylower than this regional average; the anomalies beneath the olderintrusions are higher than the regional average. This supports thehypothesis that the low velocities beneath the alkaline provinces arethe residual thermal effects of mantle upwellings impacting areasof thinner lithosphere, which would be consistent with a possibleTrindade plume head.
4 S E I S M I C I T Y A N D L O W- V E L O C I T YA N O M A L I E S
Fig. 3(b) shows a clear trend of the seismicity to be located in areaswith low velocities in the uppermost mantle. The epicentres shownin Fig. 3(b) are those of the uniform catalogue of Fig. 2(b). The SW–
NE trending seismic belt in the NW part of the Tocantins provinceis located in a region with negative velocity anomalies in the up-permost mantle. This seismic belt seems to continue beneath thePoxoreu igneous province (PX) and the Pantanal basin followingthe low-velocity anomalies. The concentration of epicentres next tothe southern part of the Sao Francisco craton, along the southernsegment of the suture zone (Fig. 2b), also occurs in a region withlower than average velocities in the upper mantle. The area of high-est velocites near the NE border of the Parana basin, on the otherhand, is completely aseismic. Some exceptions are observed in theSao Francico craton and the middle of the Parana basin, but theseevents are generally small with magnitude less than 3.7 mb.
To quantify the visual correlation seen in Fig. 3(b), we comparedthe distribution of the P-wave velocity anomalies in the subcrustallithosphere in the seismic and aseismic areas. A grid with 0.5◦ spac-ing was used to sample the study region (central and SE Brazil asshown in Fig. 3b). For every point in this grid, we calculated theenergy of all earthquakes within a 40-km radius. The magnitudecorresponding to this total energy was called cumulative magni-tude. For every point in the grid, we also calculated the averagevelocity anomaly within a window of ±0.5◦ and depth interval 150–250 km. Fig. 5 shows the distribution of the velocity anomalies in the
C© 2004 RAS, GJI, 159, 390–399

Seismicity concentration in lithospheric thin spots 395
1213
1415
1617
1819
2021
2223
24
58 56 54 52 50 48 46 44 42
200 km depth(b) epicentres
Longitude West
Latit
ude
Sou
th
-1 -0.5 0 0.5 1
P-wave anomaly (%)
magnitude
543
Figure 3. (Continued.)
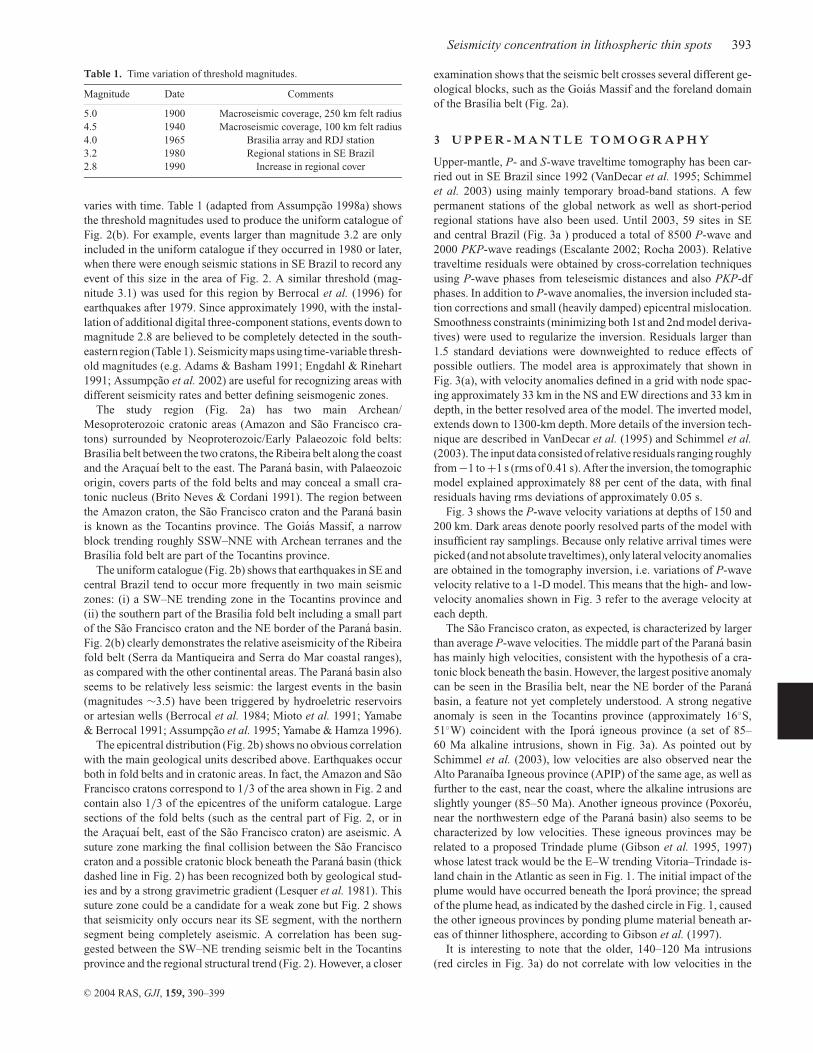
gridpoints with high seismicity (cumulative magnitude ≥4), lowseismicity (mb < 4), and aseismic points (no events). Only grid-points with enough ray density in the tomography inversion wereused: i.e., darkened areas in Fig. 3 were not included in Fig. 5. Themean P-velocity anomaly in all the study area, at 200-km depth, is0.03 per cent. The mean velocity in areas with high activity (mag-nitude ≥4) is lower than this regional average (Fig. 5, top), whereasaseismic areas have a mean P velocity slightly higher than the re-gional average (Fig. 5, bottom). Areas with intermediate activity (mb
< 4) show a slight trend towards lower velocities, but are not signif-icantly different from the aseismic areas (Fig. 5, middle). The stan-dard deviations of these means are approximately 0.03, indicatingthat the difference between the mean velocities beneath the seismicand aseismic areas is highly significant. We also tested taking theaverage anomaly and cumulative magnitude every 1◦, within a largerradius, and the histograms showed similar patterns. When seismic-ity is compared with the S-wave anomalies mapped by Schimmelet al. (2003), the same trend is suggested. This is not surprising asP-wave and S-wave anomalies are usually well correlated.
5 D I S C U S S I O N
Seismic velocity anomalies in the upper mantle can be caused bothby temperature and composition variations, especially if the anoma-lies are small such as shown in Fig. 3. However, we believe that lateraltemperature variation is a major factor contributing to the observed
velocity anomalies. Several lines of evidence support this hypothe-sis. First, Schimmel et al. (2003) showed that upper-mantle P- andS-wave anomalies in SE Brazil have a similar pattern, such as highvelocities beneath the Sao Francisco craton and beneath the middleof the Parana basin, and low velocities near the APIP (S-wave datafor the Tocantins province have not been fully analysed yet). Thisis consistent with temperature anomalies, which affect both P andS velocities in the same direction. Secondly, the fact that only themore recent (85–50 Ma) alkaline intrusions occur near low-velocityareas may indicate a thermal effect associated with the generationof the Late Cretaceous igneous activity. Thirdly, heat flow data inSE Brazil (Hamza & Munoz 1996; Hurter & Pollack 1996) show atrend of lower heat flow density in the middle of the Parana basin(approximately 40 to 50 mW m−2) compared with the border of thebasin and surrounding fold belts (approximately 50 to 60 mW m−2).This is consistent with the generally higher P-wave velocities in themiddle of the basin and the fact that the low-velocity anomalies areobserved near the borders of the basin.
The velocity anomalies obtained from the tomographic inversionare lower bounds because of smoothness constraints necessary toregularize the tomographic inversion. In addition, station correc-tions are also inverted for and can absorb part of the signal pro-duced by velocity anomalies at lithospheric depths. Synthetic tests(Schimmel et al. 2003) show that we usually recover approximately50 to 70 per cent of the actual anomalies. The mean anomalies in theseismic and aseismic areas (Fig. 3b) differ by approximately 0.5 per
C© 2004 RAS, GJI, 159, 390–399
396 M. Assumpcao et al.
-0.4 -0.2 -0.0 0.2 0.4
P Velocity Perturbation [%]
age < 110 Ma
-0.4 -0.2 -0.0 0.2 0.4
P Velocity Perturbation [%]
age > 110 Ma
Figure 4. Distribution of P-wave velocity anomalies in the subcrustal litho-sphere beneath outcrops of alkaline intrusions. Top: 140–120 Ma. Bottom:85–50 Ma. The vertical lines denote the medium values of each distribution.Younger intrusions tend to occur in areas with lower than average anomalies,possibly indicating a thermal origin for the lower velocities.
cent implying a real difference of the order of 0.7 to 1.0 per cent.A P-wave velocity anomaly of 0.5–1.0 per cent may correspondto a temperature variation of approximately 70–150 ◦C, using theaverage upper-mantle mineral coefficients compiled by Anderson& Isacks (1995) and Qiu et al. (1996). More accurate estimatesof upper-mantle temperature variations from velocity anomaliesrequire knowledge of the absolute seismic velocity and tempera-ture because of the non-linear nature of the velocity/temperaturederivatives (Cammarano et al. 2003). If we use the AK135 velocitymodel (Kennett et al. 1995) more representative of continental ar-eas and a reference geotherm corresponding to the 1000 ◦C adiabat,consistent with the AK135 velocities (Cammarano et al. 2003), a1 per cent velocity anomaly will imply a temperature contrast of150 ◦C at 100-km depth or 200 ◦C at 200 km. These differences arequite compatible with the geotherms used to calculate the strengthenvelopes in Fig. 6 below. This temperature contrast makes the ther-mal lithosphere thinner in the low-velocity (more seismically active)areas.
We explain the seismicity as resulting from stress concentrationsin the upper crust because of weakness in the lithospheric uppermantle. Enough weakness can be caused by temperature anomaliesof the order of 100 ◦C. Fig. 6 shows representative geotherms forthe hot/thin lithosphere (low-velocity areas) and the cold/thick litho-sphere (high-velocity areas) using a two-layer model for the crust
-0.4 -0.2 -0.0 0.2 0.4 0.6
P Velocity Perturbation [%]
no events
-0.4 -0.2 -0.0 0.2 0.4 0.6
magnit < 4
-0.4 -0.2 -0.0 0.2 0.4 0.6
magnit >= 4
Figure 5. Distribution of P-wave velocity anomalies in the subcrustal litho-sphere according to seismicity level. Average anomalies were computed inboxes of ±0.5 ◦ from 150–250 km depth. Top: histogram of P-wave anoma-lies beneath areas with cumulative magnitudes ≥4. Middle: anomalies be-neath areas with cumulative magnitudes <4. Bottom: anomalies beneathareas with no earthquakes. The vertical lines denote the medium values ofeach distribution. Note the trend of seismicity to occur in areas with lowerthan average P-wave anomaly.
(granitic upper crust and intermediate-to-mafic, granulite lowercrust, each 20-km thick) with an ultrabasic upper mantle. Ther-mal conductivities and heat production constants were taken fromLiu & Zoback (1997). The geotherm for the cold area was obtainedfor a surface heat flow of 50 mW m−2. The temperatures in the up-per mantle are higher than those estimated by Liu & Zoback (1997)for the cratonic central and eastern part of the USA, but are lowerthan the estimates of Artemieva & Mooney (2001) for the area ofthe Parana basin. The hot geotherm was calculated for a 55 mWm−2 heat flow density at the border of the Parana basin (Hurter &Pollack 1996) and is approximately 100 ◦C higher than the coldgeotherm in the topmost lithospheric upper mantle. It is not as hotas the geotherm used by Liu & Zoback (1997) for the New Madridrift zone, where the heat flow is 60 mW m−2. For the yield stressenvelopes we used Byerlee’s law for a wet granite for the brittle
C© 2004 RAS, GJI, 159, 390–399
Seismicity concentration in lithospheric thin spots 397
0
20
40
60
80
Dep
th(k
m)
0 200 400 600 800Temperature (C)
crust
mantle
thickthinspot
0
20
40
60
80
Dep
th(k
m)
0 200S1-S3 (MPa)
thickthinspot
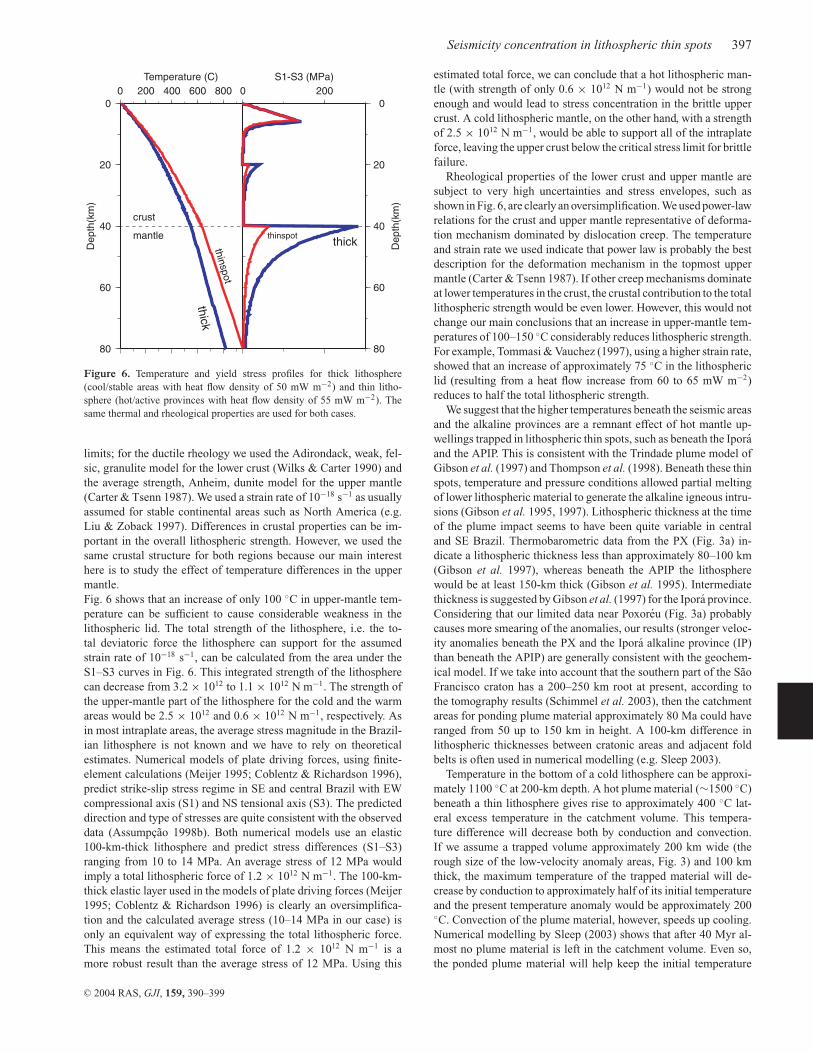
Figure 6. Temperature and yield stress profiles for thick lithosphere(cool/stable areas with heat flow density of 50 mW m−2) and thin litho-sphere (hot/active provinces with heat flow density of 55 mW m−2). Thesame thermal and rheological properties are used for both cases.
limits; for the ductile rheology we used the Adirondack, weak, fel-sic, granulite model for the lower crust (Wilks & Carter 1990) andthe average strength, Anheim, dunite model for the upper mantle(Carter & Tsenn 1987). We used a strain rate of 10−18 s−1 as usuallyassumed for stable continental areas such as North America (e.g.Liu & Zoback 1997). Differences in crustal properties can be im-portant in the overall lithospheric strength. However, we used thesame crustal structure for both regions because our main interesthere is to study the effect of temperature differences in the uppermantle.Fig. 6 shows that an increase of only 100 ◦C in upper-mantle tem-perature can be sufficient to cause considerable weakness in thelithospheric lid. The total strength of the lithosphere, i.e. the to-tal deviatoric force the lithosphere can support for the assumedstrain rate of 10−18 s−1, can be calculated from the area under theS1–S3 curves in Fig. 6. This integrated strength of the lithospherecan decrease from 3.2 × 10¹² to 1.1 × 10¹² N m−1. The strength ofthe upper-mantle part of the lithosphere for the cold and the warmareas would be 2.5 × 10¹² and 0.6 × 10¹² N m−1, respectively. Asin most intraplate areas, the average stress magnitude in the Brazil-ian lithosphere is not known and we have to rely on theoreticalestimates. Numerical models of plate driving forces, using finite-element calculations (Meijer 1995; Coblentz & Richardson 1996),predict strike-slip stress regime in SE and central Brazil with EWcompressional axis (S1) and NS tensional axis (S3). The predicteddirection and type of stresses are quite consistent with the observeddata (Assumpcao 1998b). Both numerical models use an elastic100-km-thick lithosphere and predict stress differences (S1–S3)ranging from 10 to 14 MPa. An average stress of 12 MPa wouldimply a total lithospheric force of 1.2 × 10¹² N m−1. The 100-km-thick elastic layer used in the models of plate driving forces (Meijer1995; Coblentz & Richardson 1996) is clearly an oversimplifica-tion and the calculated average stress (10–14 MPa in our case) isonly an equivalent way of expressing the total lithospheric force.This means the estimated total force of 1.2 × 10¹² N m−1 is amore robust result than the average stress of 12 MPa. Using this
estimated total force, we can conclude that a hot lithospheric man-tle (with strength of only 0.6 × 10¹² N m−1) would not be strongenough and would lead to stress concentration in the brittle uppercrust. A cold lithospheric mantle, on the other hand, with a strengthof 2.5 × 10¹² N m−1, would be able to support all of the intraplateforce, leaving the upper crust below the critical stress limit for brittlefailure.
Rheological properties of the lower crust and upper mantle aresubject to very high uncertainties and stress envelopes, such asshown in Fig. 6, are clearly an oversimplification. We used power-lawrelations for the crust and upper mantle representative of deforma-tion mechanism dominated by dislocation creep. The temperatureand strain rate we used indicate that power law is probably the bestdescription for the deformation mechanism in the topmost uppermantle (Carter & Tsenn 1987). If other creep mechanisms dominateat lower temperatures in the crust, the crustal contribution to the totallithospheric strength would be even lower. However, this would notchange our main conclusions that an increase in upper-mantle tem-peratures of 100–150 ◦C considerably reduces lithospheric strength.For example, Tommasi & Vauchez (1997), using a higher strain rate,showed that an increase of approximately 75 ◦C in the lithosphericlid (resulting from a heat flow increase from 60 to 65 mW m−2)reduces to half the total lithospheric strength.
We suggest that the higher temperatures beneath the seismic areasand the alkaline provinces are a remnant effect of hot mantle up-wellings trapped in lithospheric thin spots, such as beneath the Iporaand the APIP. This is consistent with the Trindade plume model ofGibson et al. (1997) and Thompson et al. (1998). Beneath these thinspots, temperature and pressure conditions allowed partial meltingof lower lithospheric material to generate the alkaline igneous intru-sions (Gibson et al. 1995, 1997). Lithospheric thickness at the timeof the plume impact seems to have been quite variable in centraland SE Brazil. Thermobarometric data from the PX (Fig. 3a) in-dicate a lithospheric thickness less than approximately 80–100 km(Gibson et al. 1997), whereas beneath the APIP the lithospherewould be at least 150-km thick (Gibson et al. 1995). Intermediatethickness is suggested by Gibson et al. (1997) for the Ipora province.Considering that our limited data near Poxoreu (Fig. 3a) probablycauses more smearing of the anomalies, our results (stronger veloc-ity anomalies beneath the PX and the Ipora alkaline province (IP)than beneath the APIP) are generally consistent with the geochem-ical model. If we take into account that the southern part of the SaoFrancisco craton has a 200–250 km root at present, according tothe tomography results (Schimmel et al. 2003), then the catchmentareas for ponding plume material approximately 80 Ma could haveranged from 50 up to 150 km in height. A 100-km difference inlithospheric thicknesses between cratonic areas and adjacent foldbelts is often used in numerical modelling (e.g. Sleep 2003).
Temperature in the bottom of a cold lithosphere can be approxi-mately 1100 ◦C at 200-km depth. A hot plume material (∼1500 ◦C)beneath a thin lithosphere gives rise to approximately 400 ◦C lat-eral excess temperature in the catchment volume. This tempera-ture difference will decrease both by conduction and convection.If we assume a trapped volume approximately 200 km wide (therough size of the low-velocity anomaly areas, Fig. 3) and 100 kmthick, the maximum temperature of the trapped material will de-crease by conduction to approximately half of its initial temperatureand the present temperature anomaly would be approximately 200◦C. Convection of the plume material, however, speeds up cooling.Numerical modelling by Sleep (2003) shows that after 40 Myr al-most no plume material is left in the catchment volume. Even so,the ponded plume material will help keep the initial temperature
C© 2004 RAS, GJI, 159, 390–399
398 M. Assumpcao et al.
difference between a thick craton (say, 1100 ◦C at 200-km depth)and the normal asthenospheric adiabat (1300 ◦C).
Temperature profiles in the deep continental lithosphere cannot bedetermined accurately, specially in SE Brazil where little is knownof upper-mantle properties. Estimates of rheological parameters andconvection patterns are even more uncertain. However, it is not thescope of this paper to determine all upper-mantle properties, butonly to show that the observed P-wave, low-velocity anomalies andthe preferential location of Late Cretaceous intrusions are consis-tent with the hypothesis of a weaker lithosphere caused by highertemperature beneath the seismically active areas.
The correlation of the continental Late Cretaceous/Palaeogenemagmatism and the Vitoria–Trindade island chain to a commonhotspot/plume mechanism is highly controversial. Geochemicalsimilarities between the various igneous provinces, from the Poxoreuprovince to the Trindade island (Fodor & Hanan 2000; Greenwood2001), are consistent with a common hotspot origin (Gibson et al.1995, 1997; Thompson et al. 1998). Combination of intraplate stressfield changes and the Trindade hotspot source has been used byCobbold et al. (2001) to explain the late Cretaceous/Palaeogenereactivation of the pre-existing structures in the continental mar-gin of SE Brazil. However, Riccomini et al. (2004) note thatthe magmatism was not restricted to a single hotspot trace, butwas widespread from southern Brazil (Late Cretaceous, Piratiniprovince) to Paraguay (Palaeogene, Asuncion province), approxi-mately 1200 and 1500 km, respectively, from the assumed Trindadehotspot trace. In addition, recent determinations of Ar–Ar ages atseveral igneous intrusions in the Serra do Mar province seem in-consistent with a pattern of eastward decreasing ages expected froma hotspot source. For these reasons, instead of the plume/hotspotmodel, Riccomini et al. (2004) favour several different pulses ofmantle upwellings and stress field changes for the generation andemplacement of alkaline magmas along reactivated regional struc-tures. The correlation we presented between seismicity, low seismicvelocities and young igneous intrusions confirm a thermal mecha-nisms for the Late Cretaceous/Palaeogene activity and we hope willcontribute to the Trindade hotspot debate.
6 C O N C L U S I O N S
Three indirect evidences suggest that the P-wave, low-velocityanomalies are mainly caused by higher temperatures: (i) similar-ity of the P- and S-wave anomaly patterns, (ii) generally higher heatflow at the border of the Parana basin where most of the low-velocityanomalies are found and (iii) correlation with the younger post-rift igneous provinces. The lithosphere/asthenosphere topographyfound by our P-wave tomography is in excellent agreement with thethin spot hypothesis proposed by Gibson et al. (1995, 1997) for theorigin of the igneous provinces. The temperature induced thinningof the lithosphere also correlates with the areas of higher seismicity,indicating an important mechanism to help explain earthquake ac-tivity in SE and central Brazil. Thinning of the lithosphere decreasesthe overall lithospheric strength and causes the regional stress fieldto concentrate at the brittle upper crust.
Many other different mechanisms have been proposed to explainintraplate seismicity patterns involving weak crustal zones (iden-tified from geological/geophysical studies) and concentration ofstresses as a result of lateral structure variation. Usually severalmechanisms must be combined to explain all seismicity features ina given region. Here, we showed that deep lithospheric structure canalso make an important contribution to help explain the seismicitydistribution in the Brazilian platform.
Similar examples have been found in other areas. In the seismi-cally active New Madrid rift, where the surface heat flow averages 60mW m−2, Liu & Zoback (1997) showed that the higher geothermcauses considerable weakness in the subcrustal lithosphere, com-pared with the more stable shield region, irrespective of which rhe-ological model is used for the crustal and upper-mantle rocks. An-other example has been given by Yang & Liu (2002) in modellingintraplate stresses in China. The higher seismicity of the north Chinablock, compared with the more stable south China block, is betterexplained with a thin and weak lithosphere as evidenced by P-wave,low-velocity anomalies in the upper mantle. New Madrid and Chinaare two of the most seismically active intraplate regions in the world.Our results for Brazil indicate that temperature induced lithosphericweakness can also be an important factor even in areas with verylow seismicity levels.
A C K N O W L E D G M E N T S
Work supported by Brazilian grants FAPESP 96/01556-0, 97/03640-6, 01/06066-6, 01/01867-0, 02/09989-0 and CNPq 30.0227/79-5,52.0078/00-4. The authors thank Yara Marangoni for calculatingthe geotherms and for critically reading the manuscript, and LuısGalhardo for equipment service and maintenance during the tomog-raphy experiment. The authors also thank Alain Vauchez, ClaudioRiccomini and Garry Karner for helpful discussions. Suzan Vander Lee and an anonymous reviewer made valuable comments toimprove the manuscript.
R E F E R E N C E S
Adams, J. & Basham, P.W., 1991. The seismicity and seismotectonics ofeastern Canada, in Neotectonics of North America, Decade Map Vol. 1,261–276, eds Slemmons, D.B. et al, Geol. Soc. Am., Boulder, CO, USA.
Anderson, O.L. & Isacks, D.G., 1995. Elastic constants of mantle minerals athigh temperature, in, Mineral Physics and Crystalography: a handbook ofphysical constants, Vol. 2, pp. 64–97, ed. Ahrens, T.J., AGU, Washington,DC.
Artemieva, I.M. & Mooney, W.D., 2001. Thermal thickness and evolutionof Precambrian lithosphere: a global study, J. geophys. Res., 106(B8),16 387–16 414.
Assumpcao, M., 1998a. Seismicity and stresses in the Brazilian passivemargin, Bull. seism. Soc. Am., 88(1), 160–169.
Assumpcao, M., 1998b. Focal mechanisms of small earthquakes in SEBrazilian shield: a test of stress models of the South American plate,Geophys. J. Int., 133, 490–498.
Assumpcao, M. & Araujo, M., 1993. Effect of the Altiplano-Puna plateau,South America, on the regional intraplate stress, Tectonophysics, 221,475–496.
Assumpcao, M., Freire, M. & Ribotta, L.C., 1995. Sismicidade induzidano reservatorio de Capivara: resultados preliminares sobre localizacao defraturas ativas. In: IV Int. Congr. Brazilian Geophys. Soc., Rio de Janeiro,1995, Proceedings, 2, 961–964.
Assumpcao, M. et al., 2002. Reservoir induced seismicity in Brazil, Pureappl. Geophys., 159, 597–617.
Berrocal, J., Assumpcao, M., Antezana, R., Dias Neto, C.M., Ortega, R.,Franca, H. & Veloso, J., 1984. Sismicidade do Brasil, Instituto As-tronomico e Geofısico, Universidade de Sao Paulo, Sao Paulo, Brazil,p. 320.
Berrocal, J., Fernandes, C., Bassini, A. & Barbosa, J.R., 1996. Earthquakehazard assessment in southeastern Brazil, Geofısica Internacional, 35,257–272.
Bott, M.H.P. & Dean, D.S., 1972. Stress systems at young continental mar-gins, Nature Phys. Sci., 235, 23–25.
C© 2004 RAS, GJI, 159, 390–399
Seismicity concentration in lithospheric thin spots 399
Brito Neves, B. & Cordani, U., 1991. Tectonic evolution of South Americaduring the Late Proterozoic, Precambrian Res., 53, 23–40.
Cammarano, F., Goes, S., Vacher, P. & Giardini, D., 2003. Inferring upper-mantle temperatures from seismic velocities, Phys. Earth planet. Int., 138,197–222.
Carter, N.L. & Tsenn, M.C., 1987. Flow properties of continental litho-sphere, Tectonophysics, 136, 27–63.
Cloetingh, S.A.P.L., Wortel, M.J.R. & Vlaar, N.J., 1984. Passive marginevolution, initiation of subduction and the Wilson cycle, Tectonophysics,109, 147–163.
Coblentz, D.D. & Richardson, R.M., 1996. Analysis of the South Americanintraplate stress field, J. geophys. Res., 100, 20 245–20 255.
Greenwood, J.C., 2001. The secular geochemical evolution of the Trindademantle plume, PhD thesis, Cambridge Univ., Cambridge, UK.
Cobbold, P.R., Meisling, K.E. & Mount, V.S., 2001. Reactivation of anobliquely rifted margin, Campos and Santos basins, southeastern Brazil,Am. Assoc. Petrol. Geol. Bull., 85(11), 1925–1944.
CPRM, 2000. Geologic Map of South America, 1:5000 000, BrazilianGeological Survey, Brasilia, Brazil.
Dewey, J.W., 1988. Midplate seismicity exterior to former rift-basins. Seis-mol. Res. Lett., 59, 213–218.
Engdahl, E.R. & Rinehart, W.A., 1991. Seismicity map of North AmericaProject, in Neotectonics of North America, Decade Map Vol. 1, pp. 21–27,eds Slemmons, D.B. et al., Geological Soc. Am., Boulder, CO, USA.
Escalante, C., 2002. Upper mantle P-wave tomography beneath SE Brazil,MPhil thesis, IAG, University of Sao Paulo, Sao Paulo, Brazil (inPortuguese).
Ferreira, J., Oliveira, R.T., Takeya, M.K. & Assumpcao, M., 1998. Super-position of local and regional stresses in NE Brazil: evidence from focalmechanisms around the Potiguar marginal basin, Geophys. J. Int., 134,341–355.
Fodor, R.V. & Hanan, B.B., 2000. Geochemical evidence for the Trindadehotspot trace: Columbia seamount ankaramite, Lithos, 51, 293–304.
Gibson, S.A., Thompson, R.N., Leonardos, O.H., Dickin, A.P. & Mitchell,J.G., 1995. The late Cretaceous impact of the Trindade mantle plume:evidence from large-volume, mafic potassic magmatism in SE Brazil, J.Petrol., 36(1), 189–228.
Gibson, S.A., Thompson, R.N., Weska, R.K., Dickin, A.P. & Leonardos,O.H., 1997. Late Cretaceous rift-related upwelling and melting of theTrindade starting mantle plume head beneath western Brazil, Contrib.Mineral Petrol., 126, 303–314.
Hamza, V.M. & Munoz, M., 1996. Heat flow map of South America,Geotherm, 25(6), 599–646.
Hurter, S.J. & Pollack, H.N., 1996. Terrestrial heat flow in the Parana Basin,southern Brazil, J. geophys. Res., 101(B4), 8659–8671.
Johnston, A.C., 1989. The seismicity of stable continental interiors, in,Earthquakes at North-Atlantic Passive Margins: Neotectonics and Post-glacial Rebound, pp. 299–327, eds Gregersen, S. & Basham, P.W., KluwerAcademic, Boston, USA.
Johnston, A.C. & Kanter, L.R., 1990. Earthquakes in stable continental crust,Scientific American, 262, 68–75.
Kennett, B.L.N., Engdahl, E.R. & Bulland, R.P., 1995. Constraints on seismicvelocities in the Earth from travel times, Geophys. J. Int., 122, 108–124.
Lesquer, A., Almeida, F.F.M., Davino, A., Lachaud, J.C. & Maillard, V.,1981. Signification structurales des anomalies gravimetriques de la partiesud du craton de S. Francisco (Bresil), Tectonophysics, 76, 273–293.
Lima, C., Nascimento, E. & Assumpcao, M., 1997. Stress orientations inBrazilian sedimentary basins from breakout analysis—implications forforce models in the South American plate, Geophys. J. Int., 130(1), 112–124.
Liu, L. & Zoback, M.D., 1997. Lithospheric strength and intraplate seismic-ity in the New Madrid seismic zone, Tectonics, 16(4), 585–595.
Meijer, P.T., 1995. Dynamics of active continental margins: the Andesand the Aegean region, PhD thesis, Utrecht University, the Netherlands,p. 218.
Mioto, J.A., Ribotta, L.C. & Verdiani, A.C., 1991. Aspectos geologico-estruturais da sismicidade relacionada ao reservatorio de Capivara(SP/PR). In: II Congr. Int. Soc. Bras. Geofısica, Salvador, Proceedings,1, 513–520.
Qiu, X., Priestley, K. & McKenzie, D., 1996. Average lithospheric structureof southern Africa, Geophys. J. Int., 127, 563–587.
Riccomini, C., Velazquez, V.F. & Gomes, C.B., 2004. Tectonic controls ofthe Mesozoic and Cenozoic alkaline magmatism in central-southeasternBrazilian Platform, in Mesozoic to Cenozoic Alkaline Magmatism in theBrazilian Platform, pp. 1–26, eds Comin-Chiaramonti, P. & Gomes, C.B.,EDUSP-FAPESP, Sao Paulo, Brazil.
Rocha, M.P., 2003. Extension of upper mantle seismic tomography in SEand central Brazil using P waves, MPhil thesis, IAG, University of SaoPaulo, Sao Paulo (in Portuguese).
Schimmel, M., Assumpcao, M. & VanDecar, J., 2003. Upper mantle seismicvelocity structure beneath SE Brazil from P- and, S,-wave travel timeinversions, J. geophys. Res., 108(B4), 2191, doi:10.1029/2001JB000187.
Seeber, L. & Armbruster, J.G., 1988. Seismicity along the Atlantic seaboardof the U.S.: intraplate neotectonics and earthquake hazard, in The Geol-ogy of North America,The Atlantic Continental Margin: U.S., Vols 1–2,pp. 565–582, eds Sheridan, R.E. & Grow, J.A., Geol. Soc. Am.
Sleep, N.H., 2003. Fate of mantle plume material trapped within lithosphericcatchment with reference to Brazil, Geochem. Geophys. Geosyst., 4, Art.No. 8509.
Sonder, L.J., 1990. Effects of density contrasts on the orientation of stressesin the lithosphere: relation to principal stress directions in the TansverseRanges, California, Tectonics, 9, 761–771.
Stein, S., Cloetingh, S., Sleep, N.H. & Wortel, R., 1989. Passive marginearthquakes, stresses and rheology, in Earthquakes at North-Atlantic Pas-sive Margins: Neotectonics and Postglacial Rebound, pp. 231–259, edsGregersen, S. & Basham, P.W., Kluwer, Dordrecht.
Sykes, L., 1978. Intraplate seismicity, reactivation of pre-existing zones ofweakness, alkaline magmatism, and other tectonism postdating continen-tal fragmentation, Rev. Geophys. Space Phys., 16, 621–688.
Talwani, P., 1989. Characteristic features of intraplate earthquakes and themodels proposed to explain them, in Earthquakes at North-Atlantic Pas-sive Margins: Neotectonics and Postglacial Rebound, pp. 231–259, edsGregersen, S. & Basham, P.W., Kluwer, Dordrecht.
Talwani, P. & Rajendram, K., 1991. Some seismological and geometric fea-tures of intraplate earthquakes, Tectonophysics, 186, 19–41.
Thompson, R.N., Gibson, S.A., Mitchell, J.G., Dickin, A.P., Leonardos,O.H., Brod, J.A. & Greenwood, J.C., 1998. Migrating Cretaceous-Eocenemagmatism in the Serra do Mar alkaline province, SE Brazil: melts fromthe deflected Trindade mantle plume, J. Petrol., 39, 1493–1526.
Tommasi, A. & Vauchez, A., 1997. Continental-scale rheological hetero-geneities and complex intraplate tectono-metamorphic patterns: insightsfrom a case-study and numerical models, Tectonophysics, 279, 327–350.
VanDecar, J.C., James, D.E. & Assumpcao, M., 1995. Seismic evidence fora fossil mantle plume beneath South America and implications for platedriving forces, Nature, 378, 25–31.
Wilks, K.R. & Carter, N.L., 1990. Rheology of some continental lowercrustal rocks, Tectonophysics, 182, 57–77.
Yamabe, T.H. & Berrocal, J., 1991. A origem da atividade sısmica de Pres-idente Prudente (SP): induzida ou natural? In: II Congr. Int. Soc. Bras.Geofısica, Salvador, Proceedings, 1, 521–528.
Yamabe, T.H. & Hamza, V.M., 1996. Geothermal investigations in an areaof induced seismicity, northern Sao Paulo state, Brazil, Tectonophysics,253, 209–225.
Yang, Y. & Liu, M., 2002. Why North China is seismically active while SouthChina remains largely aseismic? In: AGU Fall Meeting, San Francisco,Abstracts, 2002.
Zoback, M.L. & Richardson, R.M., 1996. Stress perturbation associated withthe Amazonas and other ancient continental rifts, J. geophys. Res., 101,5459–5475.
C© 2004 RAS, GJI, 159, 390–399
Related Documents


