. ,.. 4: Best Available Copy sofe Raised Intrapulmonary Pressure ManUA IntrafuD ary Prouo .m m J. ERNSTING 4 4 oOqo 7o,,cM, I

Welcome message from author
This document is posted to help you gain knowledge. Please leave a comment to let me know what you think about it! Share it to your friends and learn new things together.
Transcript
. ,.. 4:
Best Available Copy
sofe
RaisedIntrapulmonary
Pressure
ManUA IntrafuD ary Prouo.m m
J. ERNSTING
4 4
oOqo 7o,,cM, I

Ja
+ok~.Ai 106ý000
0"
Some Effects of Raised
Intrapulmonary Pressure
in Man
THE ADVISORY GROUP
FOR AEROSPACE RESEARCH AND DEVELOPMENT OF
THE NORTH ATLANTIC TREATY ORGANIZATION
b CjI

PAGES
AREMISSING
INORIGINAL
DOCUMENT

Authoi
Sqn. Ldr. JOHN ERNSTING, O.B.E., Ph.I)., B.Sc., M.B., B.S., R.A.F.
ROYAL AIR FORCE INSTITUTE OF AVIATIONMEDICINE
FARNBOROUGH
ENGLANI)
Iii~o
Published by
TECHNIVISION LIMITEDMAIDENHEAD ENGLAND
Set in Baskerville io on i i ptPrinted and Bound
by'
W. and J. MACKAY and CO LTDLONDON and CHATHAM, ENGLAND
!v
COPYRIGHtT
©OCTOBER 1966
LIBRARY OF CONGRESS
CARD NO 66-28576TIlE ADVISORY GROUP FOR AEROSPACE
RESEARCH AND DEVEIOPMENT
vi
CONTENTS
Chapter Page
SUMMARY AND ACKNOWLEDGEMENTS ix
I INTRODUCTION I
2 EXPERIMENTAL METHODS 21
3 LIMITATIONS OF VARIOUS TECIINIQ•UES OF DELIVERING
GAS UNDER PRESSURE TO THE RESPIRATORY TRACT 63
4 THE MECHANICS OF Rr.SPIRATION DURING PRESSURE
BREATHING AND TIlE EFFECTS OF CHEST AND TRUNK
COUNTER PRESSUR E 105
5 PULMONARY GAS EXCHANGE IN PRESSURE BREATHING 161
6 TIlE CARDIOVASCULAR EFFECTS OF HIGH PRESSURE
BREATHING 229
7 GENERAL SUMMARY AND CONCLUSIONS 313
REFERENCES 323
INDEX 341
vii

I
The AEROSPACE MEDICAL PANEL of the NATO Advisory Group forAerospace Research and Development (AGA RD) takes pleasure in spon-soring the publication of the monograph "Some Effects of Raised Intra-pulmonary Pressure in Man". This work is considered to be an importantcontribution to the medical literature and is expected to serve as a valuablereference work.
The Panel wishes to thank the author, Squadron Leader John Ernsting,O.B.E., Ph.D., B.Sc., M.B., B.S., Royal Air Force, for making his manu-script available for publication as an AGAR Dograph. Permission to publishwas graciously given by the author's military organisation, the Royal AirForce Institute of Aviation Medicine, Farnborough, Hants., England; theMedical Directorate of the Ministry of Defence (Air) of the United Kingdom;and the Faculty of Medicine of the University of London, where this workwas submitted as a thesis for the degree of Doctor of Philosophy.
EDITORS NOTE: Since the publication of this volume, Squadron LeaderJohn Ernsting has been promoted to Wing Commander.
viii
-- .-, ,.-.... -II J - • .- DI - 11 I I __II____-

SUMMARY
Positive pressure breathing with oxygen is a means whereby an acceptablearterial oxygen tension may be maintained at altitudes in excess L, foooo ft.The nature of the disturbances induced by raising the intrapulmonarypressure by between 3o and 140 mmHg has been investigated. It has beenshown that these disturbances may be reduced to within acceptable limits byapplying counterpressure to certain specific regions of the body. Pressurebreathing at these pressures distends the lungs and induces a marked alveolarhyperventilation. The application of counterpressure to the trunk reducesthese effects and is essential at positive pressures greater than 40 mmHg. Theuse of an oronasal mask for pressure breathing allows distension of the mouthand pharynx, increased activity of the carotid baroreceptors and haemor-rhages in the conjunctivae and tympanic membrane. Coiinterpressure to thehead and neck is required at positive pressures above 65 mmHg. Raising theintrapulmonary pressure reduces the effective blood volume and collapseoccurs when the reduction exceeds 700 to 8oo ml. These collapses, which haveall the features ofvasovagal syncope, may also be precipitated during pressurebreathing by hypoxia, hypocapnia, discomfort or pain. The magnitude of thereduction of effective blood volume may be decreased by applying counter-pressure (o the limbs but the cardiovascular disturbances induced by pressurebreathing limit the time for which this manoeuvre may be used at high alti-tude. It has been shown, however, that provided the duration of an exposr1reis less than four minutes, pressure breathing with limited counterpressure willprovide protection against hypoxia at altitudes of up to 70000 ft.
ACKNOWLEDGEMENTS
It gives me great pleasure to acknowledge my indemtedness to Air Com-modore W. K. Stewart, C.B.E., A.F.C., Group Captain H. L. Roxburgh,C.B.E., and Professor IV. R. Spurrell for the guidance and encouragementwhich they have given me in the course of the work described in this thesis.
I wish to express my appreciation of the willing manner ia which mycolleagues have acted as experimental subjects and of the excellence of thetechnical assistance afforded by Mr. A. W. Cresswell and Sergeant A. B.Pignatelli.
I also wish to express my thanks to Air Marshal Sir Richard Nelson,K.C.B., O.B.E., Director General of Medical Services, Air Ministry, forproviding me with the opportunity to carry out this work.
EnDITORS NOTE: Since the publication of i'iis volume Air CommodoreW. K. Stewart has been promoted to Air Vice Marshal and Group CaptainH. L. Roxburgh to Air Commodore.
ixc

CHAPTER I
INTRODUCTION
Although altitude sickness was familiar to the mountaineers and balloonistsof the early nineteenth century the cause of the condition was not settled untilBert 1878 (34) carried out his experimental studies of the effects of low andhigh pressures upon living organisms. He demonstrated in beautifullydesigned experiments that the principal symptoms of altitude sickness werethe result of the lowering of the partial pressure of oxygen and not due to thereduction of total pressure per se. He showed in experiments on himself thatthe symptoms induced by reduction of environmental pressure could be pre-vented by the administration of oxygen. In spite, however, of his cleardemonstration that serious impairment of consciousness developed rapidly ata pressure of 250 mml-Ig absolute and of the need for an adequate oxygensupply at this pressure, two balloonists, Croce-Spinelli and Sivel, perished inthe tragic flight of the Zenith in 1875. These balloonists were the first of manyaviators to die as a result of oxygen lack occurring in flight. Bert also demon-strated that if the environmental pressure was reduced to a sufficiently lowlevel, even too"0 oxygen would not maintain consciousness in a variety ofanimals. Further, he found that when the total pressure was reduced to about8o mmHg, death became imminent.
The introduction of a simple and direct method for obtaining in mansamples of alveolar air by Haldane and Priestly 1905 (137) opened the wayto a quantitative study of the effects of reduced environmental pressure uponrespiratory gas exchange. Using the normal values for the tensions of carbondioxide and water vapour in the alveolar gas, Haldane 192o (135) calcu-lated that at an altitude of 350oo ft (barometric pressure --- 179 mliHg, therelationship between altitude and barometric pressure is that defined by theInternational Civil Aviation Organisation and the United States StandardAtmosphere) (Fig. 1-6) the alveolar oxygen tension would still be at least53 mmHg. He concluded that marked symptoms of oxygen lack whenoxygen was breathed would only begin to appear at pressures be!ow 140 mmHgabsolute and that these symptoms would become urgent in an unacclimmtize'lperson at barometric pressures of less than too mmHg. Having made thesecalculations Haldane 1920 (135) continued:
If it wet c required to go much above 40000 ft and to a barometric pressured below 130 mm (mercury) it would be necessary to enclose the airman in an
air tight dress, somewhat similar to a diving dress but capable cf resistingan int ýrnal pressure of, say, 130 mmHg. This dress would be so arrangedthat even in a complete vacuum the contained oxygen would still have apressure of 130 mm. There would then be no limit to the physiologicalheight obtainable.
It would appear that with this statement Haldane was the first investigator to
,mom _
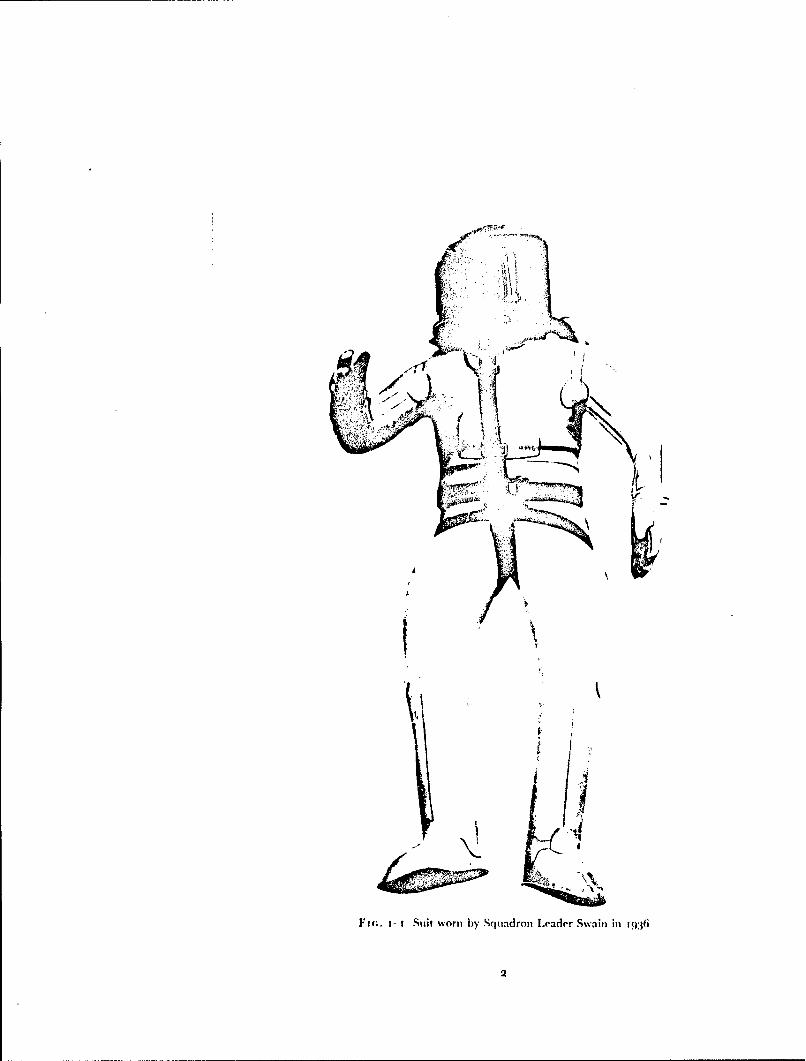
Fic.. i- Suit worn by Squiadron Leader Swain in1:6
2
INTRODU)CTION
suggest the use of a pressure suit to protect man against hypoxia at altitudesabove 40000 ft.
No attempt was made to follow up the concept of a high-altitude suit until1933 when Ridge, an American balloonist, approached Haldane to seekassistance in the development and testing of such a suit. With the help ofDavis of Messrs. Siebe Gorman and Co. a self-contained diving dress wasmodified so that it could be inflated with oxygen to a pressure of 150 mmHg.Whilst wearing this suit Ridge was exposed in a decompression chamber to anabsolute pressure of i 7 mmHg (equivalent to an altitude of 84ooo ft) withoutany untoward effects (138) (72). I n his account of these experiments Haldanealso considered the possibility of the occurrence of decompression sickness andthe protective value of breathing too",, oxygen before an exposure to the lowenvironmental pressure. A modified version of this suit (Fig. 1-i) was used in1936 by Squadron Leader Swain, R.A.F., who flew to an altitude of49!67 ft,and by Flight Lieutenant Adams, R.A.F., who reached an altitude of53936 ft in 1937 (202).
An alternative method of protecting an individual against the effects ofexposure to high altitude, the sealed gondola, was successfully put intopractice in 1931 by Piccard 1933 (236). The gondola, which contained thecrew, was sealed and the pressure within it was maintained during flight atone atmosphere by the vaporization of liquid oxygen. The concept of protect-ing the occupants of the cabin of an aircraft from the effects of high altitudeby increasing the pressute of the air within the cabin was formulated at theend of the First World War. The first aircraft successfully fitted with such apressurized cabin did not fly, however, until 1937 (7) and the majority ofaircraft were not fitted with pressurized cabins ur.til after 1945.
By 1939 it was generally accepted that in practice the maximum altitudeto which an individual breathing too",, oxygen could be exposed withoutserious impairment of consciousness was 40000 ft (Armstrong, 3939). Duringthe Second World War, however, it became necessary for certain military air-craft to operate at altitudes above 40000 ft. The cabins of these aircraft werenot pressurized and the lull pressure suits available at the time were toocumbersome to bc of any operational use. In December 1941 Gagge, Allenand Marbarger 1945 (1 19) showed that it was possible to raise the altitudeat which useful consciousness was maintained above 40000 ft by positivepressure breathing using a mouthpiece. In his initial experiments, whichwere performed at a minimum environmental pressure of i16 mmHg, themask pressure was raised above that of the environment by 8 mmHg and hefound that this procedure at a pressure-altitude of 43000 ft increased thearterial oxygen saturation as measured by an ear oximeter from 73 to 820,.In later experimeiits performed in 1942, Gagge showed that it was possible tobreathe oxygen at a positive pressure of 2o mmHg and that pressure breathingat this level would maintain an arterial oxygen saturation of 820' at a simu-lated altitude of 3oooo ft. In the same year, Bazett independently suggestedthe use of pressure breathing with oxygen as a means of increasing the altitudeat which consciousness was unimpaired.
Although Gagge and Bazett's experiments were the first in which positivepressure breathing (the difference between the pressure in the respiratorytract and the pressure of the individual's immcdiate environment) was
3

RAISED INTRAPULMONARY PRESSURE
employed at a low environmental pressure, the manoeuvre had been studiedin clinical medicine for many years previously. According to Barach, Martinand Eckman 1938 (19) the first report of the use of pressure breathing wasthat by Oertel who, in 1878, applied intermittent positive pre sure breathingat a maximum positive breathing pressure of 8-r5 mmHg in the treatment ofsevere asthma. Later, in ,897, Norton used the manoeuvre successfully in thetreatment of a case of pu!monary oedema due to carbolic acid poisoning.Breathing at a posit~ve breathing pressure of 5-1o mmHg was shown by bothPoulton I936 (233) dnd Barach, Martin and Eckman 1938 (19) to providesome relief in cases of acute pulmonary oedemna due to left sided heart failure.Barach, Martin and Eckman 1938 (t9) also studied the effects of continuousbreathing at a positive breathing pressure of 2-6 mmHg upon normalsubjects. In clinical medicine positive pressure breathing at these pressureswas used in the treatment of acute pulmonary oedema, asthma and upperrespiratory obstruction ( 15).
With the recognition of the value ofpositive pressure breathing as a meansof decreasing hypoxia at altitudes above 40000 ft the physiological distur-bances induced by this manoeuvre were subjected to intensive study (iP). Itwas shown that the altitude gained by the use of pressure breathing was thatto be expected from the increase of the partial pressure of oxygen produced bvthe manoeuvre. It was found that the maximum positive breathing pressurewhich healthy young men could tolerate for periods of several hour:s, usingan oronasal mask alone, was t5 mmHg. The limit to the use of a mask was apositive breathing pressure of 30 mmHg when circulatory collapse occurredin twenty to thirty minutes at ground level and in a shorter period whenpressure breathing was combined with hypoxia at reduced environmentalpressure.
In addition to continuous pressure breathing other methods of increasingintrapulmonary pressure were investigated at this time. Intermittent positivepressure breathing in which the mask pressure was raised considerably duringinspiration and allowed to fall to a low value during expiration was demon-strated to reduce the subjective difficulty ofexpiration which was experiencedwith continuous pressure breathing. The gain in oxygenation using inter-mittent pressure breathing at altitude was shown to be closely related to themean mask pressure measured over the whole respiratory cycle and not tothe maximum mask pressure (59). A more serious disadvantage of thismanoeuvre, however, was the marked hyperventilation and h)pocapniawhich it induced (88). The value of voluntarily raising the interthoracicpressure during expiration was studied by Lilienthal and Riley 1943 (188).They showed that this manoeuvre, when correctly performed, would increasethe maximum altitude at which useful consciousness was maintained whenoxygen was breathed to about 4450o ft. They found, however, that theimproved oxygenation was related to the mean intrathoracic pressurethroughout the respiratory cycle and that in a large proportion of subjects themanoeuvre produced gross hypocapnia. As a result of these studies onlycontinuous positive pressure breathing was used in high altitude flight.
During the Second World War continuous pressure breathing with a maskalone at a maximum positive breathing pressure of 1.5 mmHg %%as used forperiods of several hours by the American Air Forces to maintain adequate
4

a N'rRODUs:'rIoN
oxygenation at altitudes or up to 45000 ft ( t!9). An important use of pressurebreathing at a positive breathing pressure of 2 to 4 mmHg was the preventionof leakage of air into the mask at altitudes above 33000 ft where admixtureof air with the oxygen delivered by the breathing equipment would result inserious hypoxia.
In his original study of pressure breathing Bazett proposed that counter-pressure should be applied to the trunk by means of a bag inflated to thesame pressure as that delivered to the respiratory tract (30). He showed thatthe use of counterpressure removed the labour of breathing produced bypressure breathing with a mask a!one. This proposal was rapidly exploitedby the various groups working in this field and it became the basis of thepressure br -vtUng equipment subsequently introduced to the Royal AirForce and the Royal Canadian Air Force (115). It was shown that the use ofcounterpressure to the trunk raised the positive breathing pressure whichcould be used for long periods without collapse to about 30 mmHg. Variousinvestigators increased the area of the trunk covered by the counterpressurevest by extending the bladder to the lower abdomen and preventing it movingup by a pair of straps passed through the crutch (274). Drury, Henry andGoodman 1947 (82) showed that with adequate counterpressure to thewhole trunk positive breathing pressures of up to 45 mmHg could he toleratedfor ten to twenty minutes.
An important limitation to the time for which individuals could be exposedto altitudes above 30000 ft in addition to that imposed by hypoxia was knownto be decompression sickness. Thus, although pressure breathing with orwithout counterprcssure applied to the chest had been shown to be a practicalmethod of preventing hypoxia at altitudes of up to 45000 ft, an individualusing the equipment might well be forced to descend owing to the develop-ment of serious decompression sickness. Aircrcw flying to these altitudes inunpressurized aircraft had to be, in fact, a specially selected group of indivi-duals who had a kw susceptibility to decompression sickness. In certaincircumstances denitrogenation by breathing oxygen before flight was alsoemployed to reduce the incidence of decompression sickness at high altitude.
As, after the Second World War, aircraft were developed with pressurizedcabins the circumstances in which pressure breathing might be used duringflight underwent a marked change. Instead of being a method which allowedan aircraft without a pressure cabin to be flown routinely above 4oooo ft,pressure breathing became an emergency procedure which was used to main-tain consciousness following failure of the pressure cabin at high altitude. ksthe heights to which aircraft could fly increased so the need for emergencyprotection against the effects of exposure to very high altitudes also increased,but the time for which protection was required diminished.
4,* Bazett suggested in his early proposals that the application of counter-pressure to the lower limbs would be advantageous during pressure breathing(30). Counterpressure to this region would reduce the amount of blooddisplaced by the raising of intrapulmonary pressure and so decrease thecardiovascular disturbance produced by the manoeuvre. A further disadvan-tage to raising the positive breathirg pressure to higher than about 30 mmHgwas the severe discomfort which occurred in the face and neck when anoronasal mask was used to deliver the pressure to the respiratory tract.
5

RAISED INTRAPULMONARY PRESSURE
Pressure headpieces, by which the increase of pressure was applied to moreor less of the head, were developed and used in later experimental procedures.Using a facepiece in place of a mask together with counterpressure to thetrunk and lower limbs, Bazett (unpublished report, 1943) showed that apositive breathing pressure of 40 mmHg could be tolerated for long periodsand that it would provide protection against severe hypoxia for an hour at asimulated altitude of 52 000 ft.
Later, in 1944, Henry and his colleagues, working at the University ofSouthern California, demonstrated that when adequate counterpressure wasapplied to the trunk and lower limbs subjects could tolerate positive breathingpressures of up to 6o mmHg for as long as thirty minutes. They exposedsubjects using this equipment to simulated altitudes of up to 55000 ft in adecompression chamber. By attaching inflatable sleeves to the trunk garmentso that counterpressure was applied to both the upper and lower limbs aswell as to the trunk, Henry, Greeley, Meehan and Drury 1944 (148)successfully exposed subjects to an absolute pressure of 6o mmHg (equivalentto an altitude of 58000 ft) in a decompression chamber. The technique ofapplying counterpressure to the surface of the body by means of inflatablebladders was found by Henry to result in a bulky garment which greatlyrestricted mobility. An external system of bladders was adopted to applycounterpressure to the limbs. This employed the capstan principle which hadbeen developed by Lamport, Hoff and Herington 1944 (i8o) as a methodof applying counterpressure to the lower limbs in order to provide protectionagainst accelerative forces. Thr: limbs were covered by a close fitting layer ofnylon fabric which was tensioned by the inflation of an external bladderwhich ran along the length of each limb and was connected by "figure ofeight" tapes to the fabric.
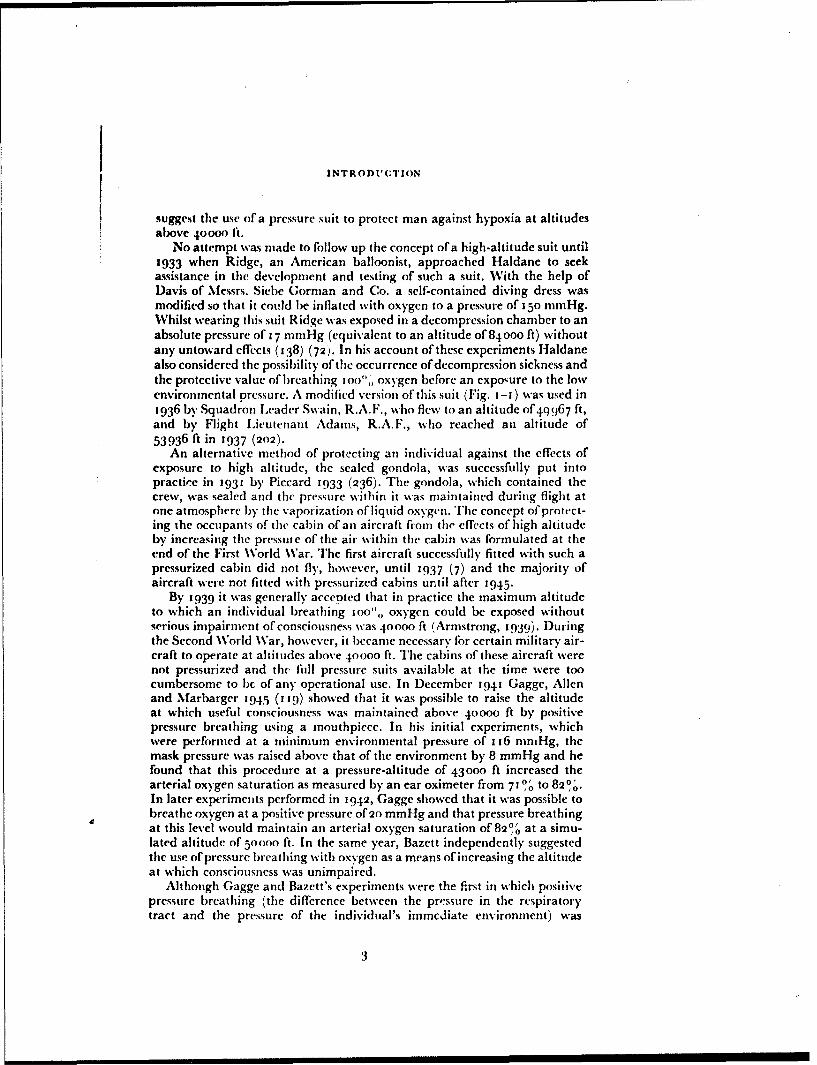
The prototype suit employing the capstan principle was delivered to theUnited States Air Force Aero-Medical Laboratory in 1946 when Henry alsojoined the staff of this organization. The helmet and suit were progressivelyimproved and it was shown that it would provide protection against hypoxiaat simulated altitudes of up to iooooo ft. The breathing system was designedso that at altitudes above 42000 ft oxygen was delivered to the respiratorytract at an absolute prestsure of 141 mmHg. The absence of pneunmaticbladders encircling the limbs allowed sweat to pass through the nylon fab'icand thus the heat load imposed by this garment was considerably less thanthat associated with the earlier forms of full pressure suit. In the first opera-tional version of this suit (the capstan partial pressure suit) the trunk bladderwas omitted and counterpressure was applied to the trunk as well as to thelimbs by means of external capstans (162). The counterpressure provided bythe capstan system was not uniform, however, and the suit in this form didnot give full protection against the respiratory and circulatory stresses asso-ciated with positive breathing pressures above 50 mmHg (157) (53).
Further improvements were made to the suit in the United Kingdom,particularly in the pressure headpiece (Fig. 1-2) and it was adopted as anemergency garment for use in the test flying of aircraft at high altitudes (194).Thr experience gained thereby and from a series of sizing trials showed thatthe suit imposed serious limitations upon movement even in the uninflatedstate. Aircrew also complained of severe discomfort at positive breathing
6
FIG. 1-2 The capstan partial pressure suit
RAISED INTRAPUI.MONARY PRESSURE
pressures of the order of 8o mmHg (Ernsting and Holmes, unpublishedobservations, 1954). The difficulty of breathing experienced in the inflatedsuit was markedly reduced by the use of an inflated waistcoat beneath thetrunk portion of the garment. In the later versions of the suit used opera-tionally by the United States Air Force the original trunk bladder wasrefitted (288).
Although a full pressure suit (a garment which completely encloses thewhole body and by means of which a pressure is applied evenly over thewhole surface) had been used in unpressurized aircraft before j939 this formof protective device was not used operationally during the Second WorldWar. Further development of this concept continued, however, and with theimprovements in fabric technology directly after the war, more satisfactorysuits became available. The comfort of the uninflated suit was greatlyimproved by the use of lightweight fabrics and the minimum of metal partsand by the provision of an efficient system of ventilation beneath the imper-meable layer of the suit. Ventilation was provided by passing dry, cool airover the surface of the limbs and trunk whilst oxygen was delivered to therespiratory tract by means of a face mask. A reasonable degree of mobilitywas attained in suits of this type when inflated at pressures ofup to 150 mmHggauge. The absolute pressure within these suits was maintained at between226 and 18o mmHg when the pressure of the immediate environment fellbelow this level.
The improvements in comfort and mobility attained in modern fullpressure suits (Fig. 1-3) led to the adoption of this type of suit by the UnitedStates Navy as an emergency protective device to be worn by the airerew ofaircraft flying to altitudes above 45000 ft (122). A decade ago there was,therefore, a wide variety of devices either already available or under develop-ment for the protection ofaircrew in the event of failure of the pressure cabinat high altitude. Many of these devices, were however, unsatisfactory inseveral respects and at that time an attempt was made to develop a rationalphilosophy with regard to the use of pressure suits in the Royal Air Force(255).
It is possible to divide the conditions in which personal pressure equipmentmay be employed in the event of the failure of the pressure cabin ofan aircraftflying at high altitude into two broad categories: It may be used to provideshort term protection to the wearer enabling him to descend to an altitudewhere protection is no longer required or to protect him for a long period andthereby allow the aircraft to remain at high altitude. The time for whichprotection is required may vary therefore from less than four minutes, thetime taken to descend in a high performance interceptor aircraft from analtitude of iooooo ft to below 40000 ft, to about six hours, the time taken fora bomber or photographic reconnaissance aircraft to complete its mission.The nature and intensity of the physiological effects induced by an exposureto high altitude varies in an important manner with the duration of the ex-posure. The variability of these effects must be considered, therefore, in somedetail before a satisfactory philosophy concerning the use of pressure clothingcan be developed.
The physiological effects of failure of a pressure cabin may be divided intothose related to the sudden change of cabin pressure and thosc produced by
8

Fin. 1- A U.S. NavY fu'll premsure suit
9
NAM

fo Sop tw (TaNSNS w rwa. w I*4 aO . 'S,
00
Fio. t-4 The time of useful consciousness following rapid decompression to variousaltitudes whilst breathing ito% oxygen (Benzinger, 2943)
Cgi4•5~ MCJ'1t 0
10
*0*O wt~ue •,
10 0

INTRODUCTION
the low environmental pressure and temperature to which the crew are* exposed following the failure. The effects of the reduction of pressure itself
are due to the expansion of gas contained within the gastro-intestinal tract,* the middle ear, the nasal sinuses and the lungs. Symptoms arise when the
gas contained in these regions cannot escape freely to the environment. Thecommonest site for symptoms is the gastro-intestinal tract and although thethe incidence of symptoms is extremely variable, they almost always ariseimmediately the pressure is reduced and are seldom seen at altitudes below25000 ft. Above 25000 ft the incidence of abdominal symptoms increases asthe altitude to which the subject is exposed increases. The symptoms varyfrom mild abdominal discomfort to severe colic which may be associated withvasovagal syncope (250) (Ernsting, personal observation).
The overall incidence of incapacitating symptoms due to the expansion ofabdominal gas following decompression from 25000 ft to above 40000 ft in agroup of 30o aircrew was 3% (Ernsting, unpublished observation). Theexpansion of the gases contained within the cavities of the skull does not giverise to any disturbance in normal subjects since the volumes of gas concernedare small in relation to the size of the passages connecting the cavities to theexternal environment. The respiratory tract differs from the other gas con-taining cavities of the body in that it normally contain, i large volume of gasin relation to the size of the airways. Further, the lungs are relatively moresusceptible to damage by over-distension than are other organs (144). Overa very wide range of rates of decompression, provided that the glottis is open,the alveolar gas can escape as it expands and no lung damage will occur. If,however, the rate and range of the decompression exceed certain limits thealveolar pressure will exceed the pressure of the environment to such anextent that the lungs are damaged by over-distension (279, 8, 195). Severalcases of lung damage produced by rapid decompression have occurred indecompression chambers. In practical aviation however such decompressionshave not occurred, although certain forms of breathing equipment do imposea high resistance to the outflow of gas from the respiratory tract during adecompression and could, in certain circumstances, produce dangerousoverdistension of the lungs (99).
Exposures to the low pressure which characterizes the environment athigh altitude can give rise to three distinct physiological effects, viz. hypoxia,decompression sickness and vaporization of tissue fluid. When the inspiredgas is 0oo% oxygen the alveolar oxygen tension falls below the normal sealevel value on exposure to altitudes above 33700 ft, although very littleimpairment of performance due to hypoxia ensues until the altitude of theexposure exceeds 40000 ft. The intensity of the hypoxia increases markedlyas the altitude exceeds 40000 ft and above 50000 ft unconsciousness ensuesfifteen to sixteen seconds after the beginning of the exposure (Fig. 1-4).When the altitude exceeds 5oooo ft consciousness is impaired if the durationof the exposure exceeds five seconds (197) (Ernsting, unpublished observa-tion). Thus in practical aviation even when the duration of an exposure toan altitude above 40ooo ft is short, severe hypoxia will occur unless the absolutepressure within the respiratory tract is maintained in excess of 130 mmHg.
A prolonged exposure to an altitude in excess of 25ooo ft will, in the majo-rity ofsubjects, give rise to one or more of the manifestations of decompression
II
RAISED INTRAPULMONARY PRESSURE
sickness. Although the existence of this condition following decompressionfrom pressures above one atmosphere was clearly recognized by the middle ofthe nineteenth century and although Bert 1878 (34), Hill (1912) (156) andHaldane 1920 (135) described clearly the mechanism of caisson disease theexistence of a similar condition at high altitude was not generally recognizeduntil 1939 (7). Both Henderson 1917 (143) and Haldane (138), however,recognized that decompression sickness can occur at low pressure and in factJongbloed 1931 (166) and Barcroft, Douglas, Kendal and Margaria 1931(35) gave clear descriptions of the "bends" occurring at low environmentalpressures. It was not until 1938 that a case of paraplegia occurring at reducedbarometric pressure and cured by recompression to ground level was de-scribed (41).
With the beginning of the Second World War and the ascent of aircraftroutinely to altitudes above 30000 ft decompression sickness was studiedintensely by many groups of investigators (t 18) . The incidence of incapacitat-ing decompression sickness rises with increase of the altitude and of the dura-tion of the exposure (Fig. 1-5). Thus in a series of two-hour exposures tovarious simulated altitudes, the incidence of serious decompression sicknessincreased from 2'",, at 30000 ft to 24',, at 38000 ft (104). Even moderateexercise greatly increases the incidence of decompression sickness (io6). It isvery rare, however, for decompression sickness to arise immediately on reduc-tion of the environmental pressure. In practice the incidence of incapacitatingdecompressioai sickness in the initial five minutes of an exposure to reducedpressure is negligible ((256), (io0), (127), Ernsting, personal observation).When the duration of the exposure to an altitude greater than 30000 ftexceeds ten minutes, incapacitating decompression sickness may occur andwhen the duration of an exposure is measured in hours, the incidence ofserious symptoms due to this condition is very high.
Apart from maintaining the immediate environmental pressure at a valuegreater than 280 mmHg absolute, the incidence of decompression sicknessmay be reduced by the selection of relatively unsusceptible subjects or byremoving nitrogen from the tissues by breathing Ioo',, oxygen before expo-sure to reduced environmental pressure. Although both these procedureswere used in the Second World War and more recently in test flying, neitherof them is acceptable under modern operational conditions. Thus, if decom-pression sickness is to be avoided following failure of the pressure cabin athigh altitude either the duration of the exposure to altitudes greater than30000 ft must be short, less than five minutes, or the pressure of the aircrew'simmediate environment must be at least 225 mmHg absolute.
When the total pressure in a tissue is less than the vapour pressure of thetissue fluid at the local temperature, the fluid will vaporize. Thus animalsexposed to a pressure of 30 mmHg absolute develop vapour-thorax and gasbubbles within the circulation (5o). Such extreme effects do not occur inpractical aviation since protection against hypoxia demands that the absolutepressure within the respiratory tract and hence the abdomen and circulationshall be maintained at a value greater than 130 mmHg. Exposure of peri-pheral parts of the body, for example the hands, to an environmental pressureof the order of 4o mmHg absolute or less results in vaporization of tissue fluidin regions such as the dorsal tendon sheaths Ernsting (97). In these experi-
12

oS•oaTaMI ,S, MOl bJ~l,,o F',",•)
"1W
to.
|I,
00
I so 40 3 0 SO 46 10 so ISALTYII4I (nouWMAMOS or V (Ct7
FIG. 1-6 The relationship between barometric pressure and altitude as defin, d bythe International Civil Aviation Organisation an( the U.S. Standard Atmosphere
.340 s
..-4WWs W Vg?
FIG. 1-7 The variation of the temperature of the atmosphere with altitude. Thestandard curve is that defined by the International Civil Aviation Organisation
13
._ _ \-•,•_/
RAISED INTRAI'ULMONARY PRFSSURE
mental exposures there was no impairment of function during and subsequentto pressures of the order of 35 mmHg absolute lasting two to three minutes.Thus although it is undesirable that any portion of the body should be ex-posed to environmental pressures lower than 47 mmHg absolute, no seriousimpairment of performance or damage to a peripheral region such as a handor foot has been observed during an exposure limited to a few minutes.
Failure of the pressure cabin of an aircraft is frequently associated with areduction of the environmental temperature as well as a fall of pressure.Further, following escape at high altitude a pilot is directly exposed to thelow temperature of the atmosphere. The temperature of the earth's atmos-phere falls progressively with increase of altitude until at a height of about40000 ft it is of the order of -55sC (Fig. 1-7). From 40000 ft to 8oooo ft thetemperature is fairly uniform and, depending upon the season of the year andthe latitude, it varies between -453 and - 9 o'C. The degree of cooling of abody which results on exposure to low temperature depends not only on thetemperature difference between the body and the surrounding air but alsoon the degree of air movement. There may be considerable air movementaround the pilot following the failure ofa hatch or window in the wall of thepressure cabin of his aircraft. Exposure to such low temperatures has bothlocal and general physiological effects. The local effects which arise primarilyin exposed regions such as the face and hands consist of cooling with impair-ment of function followed by tissue damage, frostbite. Frostbite of exposedskin occurs within a few minutes at temperatures of the order of -4o0C andbelow. The general effects of exposure to low temperature consist of progres-sive reduction of mental and physical efficiency followed by unconsciousnessand death: These general effects only arise when the exposure exceeds severalminutes.
The time course of the physiological effects is influenced markedly by theclothing which the individual is wearing. Thus an aircrew member wearingnormal flying clothing including an oxygen mask and gloves will not sufferany serious damage or show any gross loss of efficiency during an exposure tothe lowest temperature conditions which may Le encountered at high altitudeprovided that the duration of the exposure is limited to about ten minutes.Exposure to such conditions beyond this time will, however, result in grossperipheral cold injuries and a progressive impairment of the ability to per-form any useful task. Protection against the effects of exposure to a lowtemperature environment involves the provision of insulating materialbetween the skin and the surrounding atmosphere and the supply of heat tothe body from an external source. The heat can be supplied either by meansof electrically heated clothing or by distributing hot air over the surface ofthe skin beneath the insulation layer of the clothing. It must be distributedin such a manner that thermal comfort N, maintained and that the face,hands and feet are adequately protected.
It is apparent from these considerations that the nature of the effects of anexposure to low barometric pressure and temperature depend not only uponthe absolute ',nessure and temperature but also upon the duration o" theexposure. However extreme the ahitude and temperature conditions, pro-vided that the duration of the exposure is relatively short the only scriousphysiological disturbance will be hypoxia. If, however, the exposure is
14

INTRODUCTION
prolonged, then both decompression sickness and cold injuries will occur inaddition to hypoxia. The exposure may be considered to be of short durationif the time spent abovr 40000 ft does not exceed five minutcs and if descent tolower altitudes is carried out as rapidly as possible. Even if the exposure toaltitudes above 30000 ft is as long as ten minutes the incidence of decom-pression sickness and serious tissue damage due to cold will be relatively low.Thus the physiological requirements for protection following loss of cabinpressurization vary markedly with the duration of the exposure. Whenimmediate descent can be carried out following depressurization and theexposure to altitudes above 30000 ft does not exceed ten minutes, it is onlynecessary to prevent hypoxia. If, however, the duration of the exposure tohigh altitude is longer than ten minutes, protection must be provided againstdecompression sickness and the effects of extreme cold as well as hypoxia.
Protection against all the physiological hazards which arise following lossof cabin pressurization at high altitude requires the use of a full pressure su;t.It is only with such a garment that the absolute pressure of the immediateenvironment may be kept at such a level that decompression sickness will notoccur. Further, it is simpler to provide and distribute the heat which isrequired to maintain thermal equilibrium in these conditions when the wholebody is enclosed within a gas tight bag. It is very desirable, however, that therestriction imposed upon an aircrew member by the equipment which hewears in order to obtain protection against certain emergency conditionswhich are unlikely to occur should be minimal. A full pressure suit whichmeets all the physiological requirements for protection against the effects ofexposure to high altitude even if well designed does, however, impose a con-siderable reduction in mobility and comfort upon the wearer. In practice,therefore, there is a certain degree of conflict between the need for comfortand full mobility during routine flight and the restrictions imposed by theequipment used to provide protection against the effects of failure of thepressure cabin at high altitude. When the duration of the exposure to highaltitude is long then adequate prozection can only be provided with a fullpressure suit. Although a full pres.:ure suit will obviously also provideadequate protection against a short exposure to high altitude, the protectionwhich it gives is actually greater than the situation demands.
Hypoxia, which is the only serious hazard when the duration of the ex-posure to altitudes above 40000 ft does not exceed five to ten minutes maybe prevented by positive pressure breathing with oxygen. When protection isrequired at an altitude at which the positive breathing pressure will exceed30 mmHg, some form of body counterpressure is also required. These consi-derations suggest a rational philosophy for the use of pressur - clothing. Thuswhen the duration of an exposure to high altitude is prolonged adequateprotection can only be provided by a full pressure suit. If, however, immedi-ate descent to low altitude can be undertaken following loss of cabin pressure,then pressure breathing with a limited degree of counterpressure applied tothe body will prevent hypoxia. Further, the restrictions associated withwearing partial pressure clothing in normal flight are considerably less thanthose imposed by a full pressure suit.
Roxburgh, Howard, Dainty and Holmes 1953 (255) advanced theargument that since the time for which pressure breathing could be used at
15
RAISED INTRAPULIMONARY PRESSUIRE
high altitude was severely limited by tile hazards ,f dtt )iitk.ii:k,,..iand cold injury, the degree of counterpressure which isas given by, fbrexample, the capstan partial pressure suit was considerably greater than wasessential during the short period for which the suit could be used. Thcy sug-gested that since this time was severely restricted the degree ofcounterpressureafforded by the pressure clothing could be reduced to the minimum whichwould give adequate protection agaiit the rep;i'rtn,. and circulatory effectsof the breathing pressures required to prevent hypoxia. Roxburgh. .,oward,D)ainty and Holmes (255) (1953) suggested that the counterpressure appliedby the standard R.A.F. pressuie breathing waistcoat and an anti-g suit whichcovered the lower abdomen and most of the lower limbs, used in conjunctionwith a pressure helmet, would suffice at positive breathing pressures of tip to8o mmHg for several minutes (Fig. j-8).. Later experimental studies byBadger, Ernsting and Roxburgh, (1i56) (i3) showed, however, that the
counterpressure given to the abdomen by this combination was inadequateand that seven out of ten subjects were unable to complete a seven and a halfminute exposure to a positive breathing pressure of 78 mmHg. Each of theseven subjects who failed to complete the exposure exhibited a circulatorycollapse which had the clinical features of vasovagal syncope (187). It wasfound that, when the effectiveness of the counterpressure applied to the trunkby this combination was improved by encircling the whole trunk by allinflatable bladdrir, none of the experimental subjects collapsed when exposedto a positive breathing pressure of 78 mmHg for seven and a half minutes.This bladder garment which encircled the whole trunk became the basicgarment of a series of partial pressure assem)blies.
In 1954 positive pressure breathing with oxygen was adopted by tile RoyalAir Force as the method of providing short duration protection againsthypoxia following either loss of cabin pressurization or escape at altitudesbetween 4000" ft and iooooo ft. In order to sali.giiard against hypoxia themaintenance of a certain mininztiun absolute intrapitilunonary pressure isessential and previous studies suggested that th;, minimnum lay between 120and 141 mmHg absolute. To maintain this intrapulnonary pressure abovean altitude of 4oooo ft demands a degree of positive pressure breathing, theextent of which is a function of the altitude concerned (Fig. I--o). Tilus tilemaximum positive breathing pressure required in order to afford protectionto an altitude of iooooo ft lay between 1 12 and i:j:3 mmHg.
"The work described in this thesis was undertaken in order to determinethe physiological disturbances induced by the high positive breathing pres-sures required at altitudes greater than 500(0 ft and to find the degree ofcounterpressure necessary to reduce the effect of each of these disturbancesto a level which was thought to be acceptable during a short durationexposure. For this purpose the problems associated with high pressure breath-ing were divided into four groups:Disturbances in the head and neck- The actual application of gas utnderpressure to the imoutat and no~e induced various changes in the head and neck.The physiological limitations to the use of all oronasal mask for this purposewere studied in (ietail and the parts of the head and neck to which counter-pressure should be applied were determined.Disturbances of respiration -- Pressure breathing, particularly at positive
16

Fmn. 18 A standard R.A.F. pre~ssurr breathing waistcoat atid anti-g suit
17

BRCATMING PR.ESSuRL
140
Ito
Io
60
40
40 o 0lo so 100ALTiTUO((TNOUUANOS OF FET)
Fi(;. 1-9 The relationship between positive breathing pressure and altitude requiredto maintain intrapulmonary pressures of i1o and 141 mmHg ahsolutt
t8
INTRODUCTION
breathing pressures above 30 mmHg, produced gross disturbances of themechanics of respiration and of respiratory gas exchange. The efficiency ofvarious degrees of counterpressure applied to the trunk in overcoming thesedisturbances was determined and an efficient trunk counterpressure garment,the pressure jerkin, was evolved.Disturbances of circulation - The rise of intrathoracic pressure associatedwith pressure breathing produced cardiovascular changes of which the mostimportant was the displacement of blood from the central part of the circula-tion into the limbs. The time for which pressure breathing could be performedat a given positive breathing pressure was limited primarily by these cardio-vascular disturbances. It was shown that these effects could be reduced bythe application of counterpressure to the lower limbs by means of an anti-gsuit and virtually eliminated by the application of counterpressure to bothitec upper and lower limbs.Hypoxia and pressure breathing - The influence of hypoxia upon thecirculatory responses to pressure breathing was investigated since this deter-mined in part the minimum absolute intrapulmonary pressure which couldbe used during pressure breathing at high altitude. The inmeraction betweenhypoxia and the circulatory load imposed by pressure breathing was studiedin order to determine the most satisfactory compromise between the positivebreathing pressure and absolute intrapulmonary pressure for adequate pro-tection at a given altitude above 40000 ft.
These physiological studies which were performed in conjunction with aparallel programme of development of personal equipment resulted in theformulation of three assemblies, the purpose of which was to provide shortduration protection against hypoxia at reduced environmental pressure. Theprotection afforded by each of these assemblies was assessed by exposing aseries of subjects wearing the equipment to reduced cavironmental pressurein a decompression chamber. The assemblies, which were based upon thepressure jerkin, were:
The pressure breathing mask, pressure jerkin and anti-g suit assembly-Pressure breathing with -. is assembly was limited to a maximum positivebreathing pressure of 6o mmHg and provided protection against hypoxia ataltitudes of up to 56000 ft.
The partial pressure helmet, pressure jerkin and anti-g suit assembly-This combination was used at positive breathing pressures of up to Ioo mmHgand provided protection at altitudes of up to 70000 ft.
The partial pressure helmet, pressure jerkin with sleeves (the ':armjerkin") and anti-g suit assembly-This assembly afforded protection againstthe effects of pressure breathing at positive breathing pressures of up to140 mmHg and was used at altitudes of up to iooooo ft.
Each of these partial pressure assemblies has been introduced into theRoyal Air Force as a means of providing short duration protection against theeffects of loss of cabin pressurization at altitudes above 40000 ft.
19
Sj I I
I*14¾!
1�4A �4< I½
4$
) *-� 44
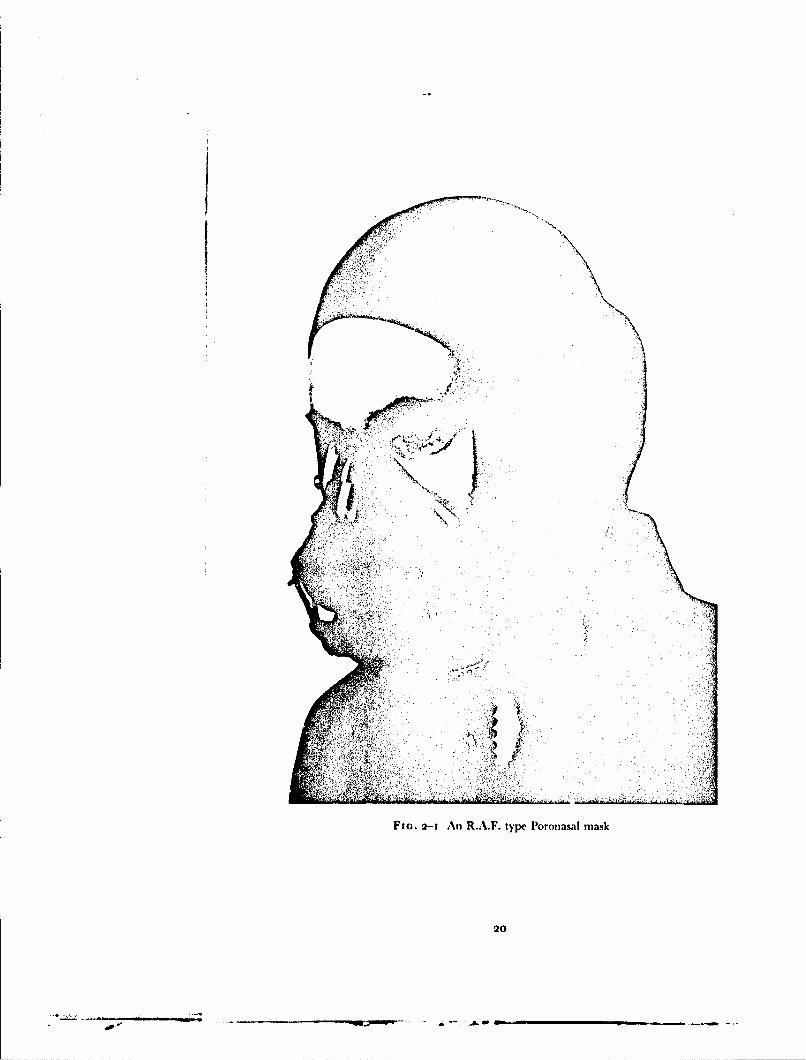
FIG. 2-I An R.A.F. type Poronasal mask
20
.. a- -. �-4���

CHAPTER 2
EXPERIMENTAL METHOI)S
PRESSURE BREATHING EQUIPMENT
In the course of many of the cxperiments carried out in this investigationspecial equipment was used to deliver gas to the respiratory tract at a pressuregreater than that of the environment and to apply counterpressure to variousparts of the trunk and lower limbs. Some of these items were standard R.A.F.equipment; other items were, however, developed during the investigationand have subsequently become standard service equipment.Pressure Breathing Mask - The R.A.F. type P oronasal mask (Fig. 2-I)has a reflected edge seal of thin rubber. The line of reflection lies over thebridge of the nose, in the nasolabial sulci and the mentolabial sulcus. Thebody of the mask, which carries the inlet and outlet valves and a microphoneis supported by a rigid exoskeleton to which the harness is attached. Themask is held against the face by a pair of chains, each of which passes from atoggle bar attached to the exoskeleton to the side of a flying helmet which isworn on the head. The length of either chain of the harness may be adjustedby means of a turn-buckle inco+rporated in the attachment point to the helmet.A special feature of the harness is that the toggle bar has two positions.Rotating the toggle downwards through approximately 135C decreases thehorizontal distance between the mask exoskeleton and the attachment pointson the helmet by 2 cm. Thus by downward rotation of the toggle a maskadjusted for comfort may be forced on to the face so that no gross leak willoccur when the gas pressure within the mask cavity is increased. The maskharness was normally adjusted with the toggle in the "low" pressure positionso that no leakage occurred when the pressure in the mask was 5 cm of watergreater than that of the environment. After rotation of the toggle harness tothe "high" pressure position, the leakage of gas between the face and themask at a positive breathing pressure of 6o mmHg did not usually exceedio litre/min.Pressure Headpiece - The pressure headpieces used in the present studydid not apply pressure to the whole head since, when gas pressure is appliedevenly over the head, some form of downward restraint is required in order toprevent the helmet rising when it is inflated. In order to avoid this lift thehelmets used in this study are designed so that no pressure is applied to anarea of the crown of the head which is approximately equal to the crosssectional area of the neck.
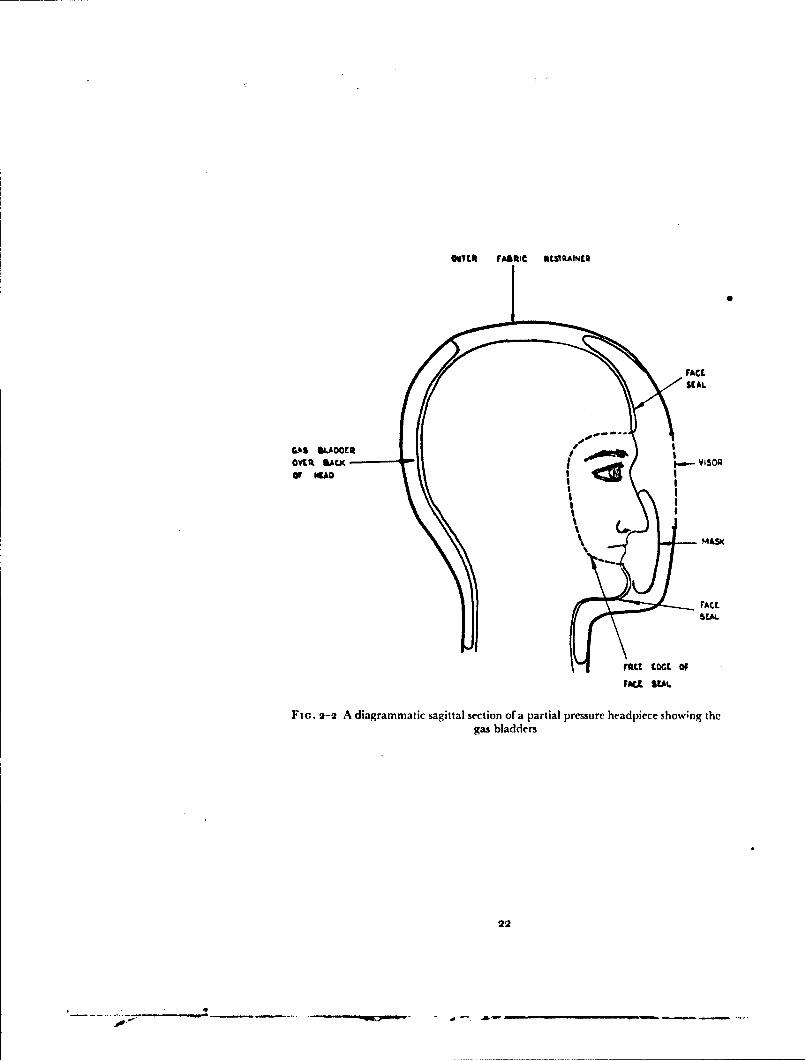
Several forms of partial pressure helmet were used in this investigation.The basic construction of these helmets is very similar (Fig. 2-2). Eachconsists essentially of a double layer rubber bladder which envelops the headand upper part of the neck. The inner layer of the bladder lies closely againstthe skin of the head and neck. This layer has a free edge which is positionedaround the periphery of the face, passing across the forehead about i cm
21
L Ar.' -",,•-gm.a ,~m -,.-.J-+ . ... _
OvTITC FABRIC NEVRAINEQ
M S0FACE
MASK
rAct
FD~,L SEAL
Flo. 2-2 A diagrammatic sagittal section of a partial pressure headpiece showng thegas bladders
22
S1 4•
IR-Lý.I Z4'ý' w
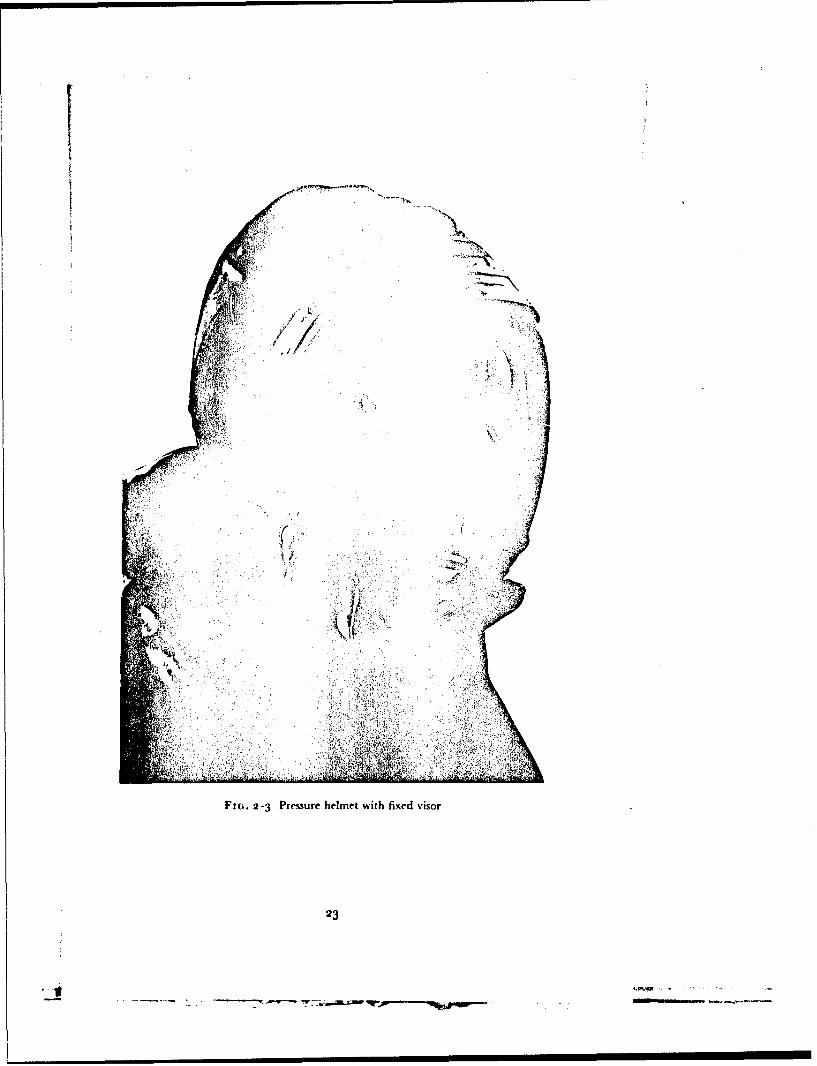
FIG.2-3Presur hemetwit fied iso
23
WA
I AA
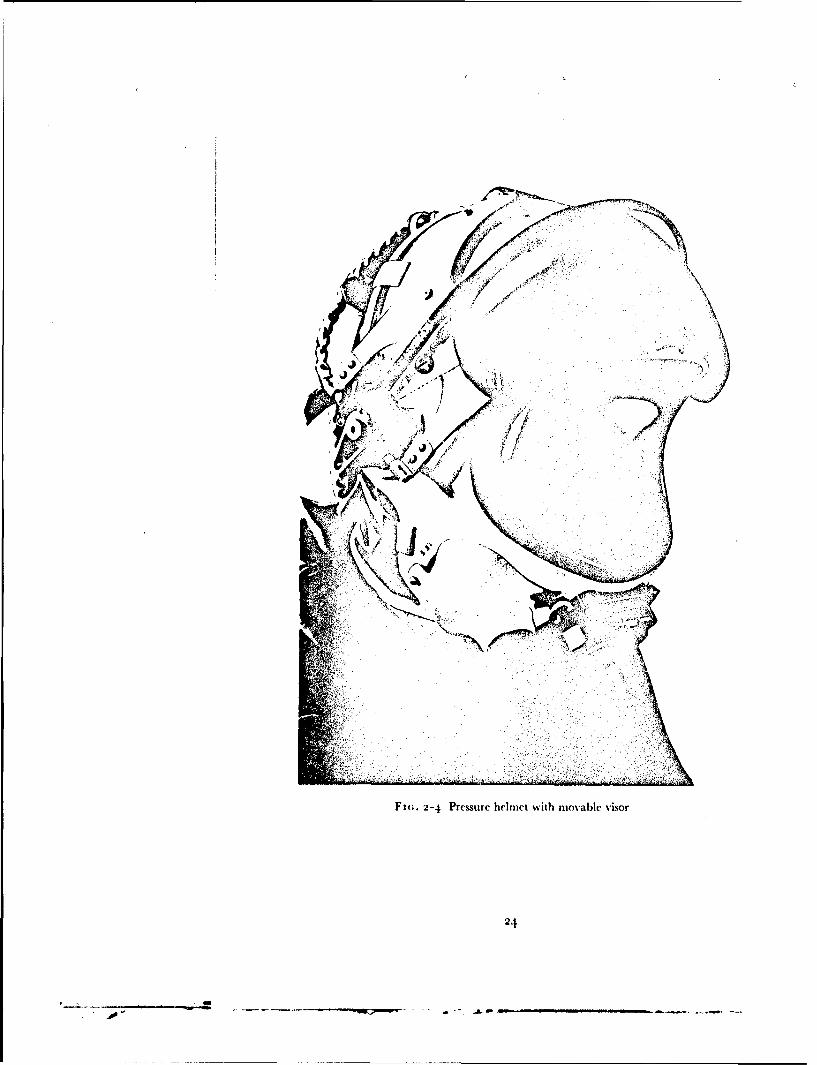
Fm.. 2-4 Pressure helmet with movable visor
24

EXPERIMENTAL METIIODS
above thie supraorhital ridges and then down either side of the face justposterior to the lateral margin of the orbit and across the chin below tilelower lip. An important feature of this face seal is that when the ht'hnet isfitted to the head a certain degree of tension must exist in the free edge of tileseal forcing it against the skin. From the free edge of the face seal tile innerlayer of the bladder passes back over the sides of the head to tile entry slitwhere it is reflected off the head to become the outer layer. Upwards theinner layer is reflected off the crown of the head to become the outer layer sothat an area of the crown remains uncovered. Similarly the inner layercovering the upper part of the neck is reflected off the neck and becomes theouter layer. The outer layer of the bladder is continuous over the headand neck except for an area in firont of the face. Here it is attached to themargins of the visor apertilre in the outer shell. In one type of helmet whichwas used in this investigation (the Type 1), Fig. 2-3) the visor is per-manently attached to the margins of this aperture. In the other form ofhelmet used the visor aperture is normally open and the visor drops auto-matically into place when decompression occurs (Fig. 2-4). In thie partialtype of headpiece prssure is applied to the mouth and nose and to that areaof the face delineated by the free edge of the face seal directly by the gas illthe helmet. Pressure is applied to the remainder of the head and neck throughthe inner layer of the rubber bladder. There is no direct communicationbetween the gas within the bladder of tile helmet and that in the auditorymeati.
The standard forms of partial pressure henmct used in this investigationwere fitted with oronasal masks. In the fixed visor helmet (Type D) ihis maskdoes not fit the face closely and its purpose is to deflet the moist expired gasaway from the inner surface of the visor. A well fitted oronasal mask is,however, an essential component of a helmet with all opening visor in orderthat the wearer may breathe oxygen enriched gas mixtures whilst the visor isopen. When an open visor helmet is used any leakage of air into the niaskfrom the visor compartment will give rise to a reduction of the inspired oxygentension. Thus it is essential that the mask of the heliiet should seal against theface. The presence of a significant inboard leak was detected in this studyprior to an exposure to reduced barometric pressure by continuously mrni-toring the nitrogen concentration in the gas within the mask compartmentwhilst oxygen was breathed. The fit of the mask was considered adequatewhen the nitrogen concentration in the mask cavity remained at less than ',
after breathing oxygen for several minutes.With correct fitting the leakage of gas from a partial pressure helmet when
it was pressurized was generally low. Experience showed that it was relativelyeasy to achieve a leak of less than to litre;mmin. when the pressure within thehelmet was between 5o and ioo mmHg (gauge). Whilst such a leak wasperfectly acceptable for the normal use of a helmet the leakage amounted to50--100 of resting respiratory minute volume. Thus a modified helmet wasdeveloped specifically for measurement of respiratory function. The oronasalmask was removed Irom a Type D helmet and replaced by a mouthpiecewhich was connected by a short length of flexible hose to a 2.5 cm diameterbrass pipe scaled into thle outer layer of the helmet bladder below the helmetvisor. The appropriate valve system was mounted on this tube outside the
25
• • l J l l- I I i i I I I

RAISED INTRAPULMONARY PRESSURE
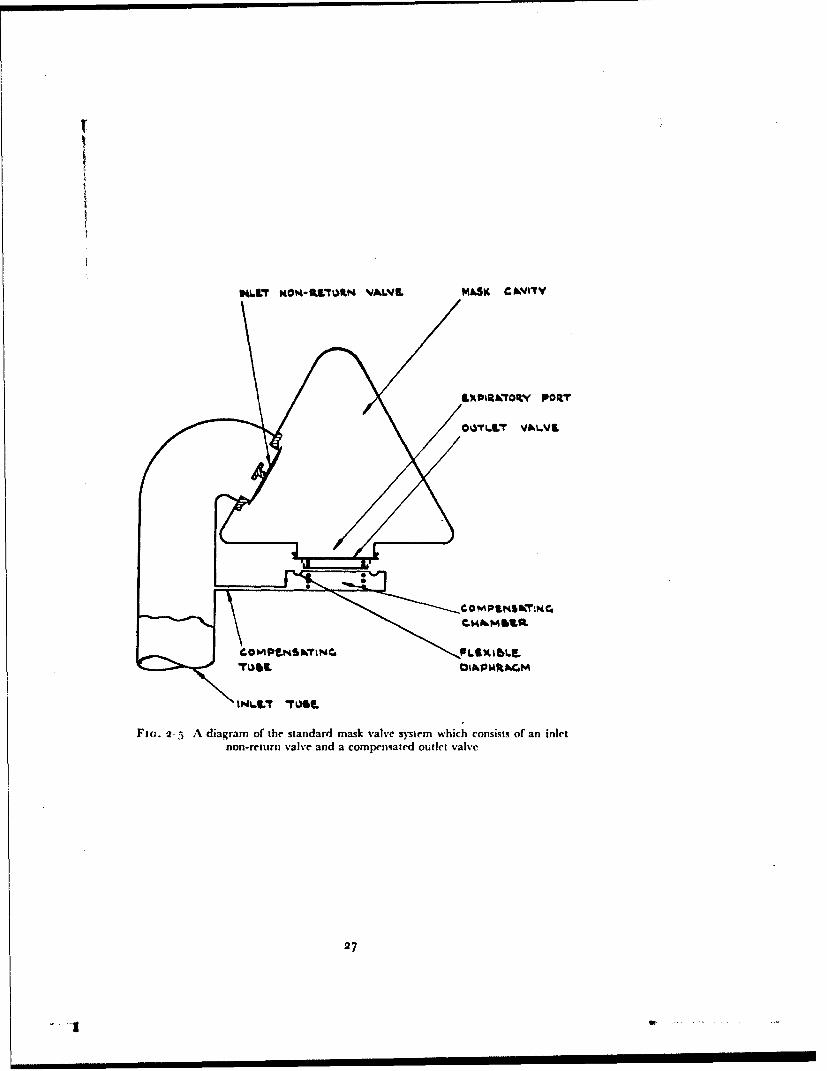
helmet. The bladder of tile helhet was inflated by a system separate fromthat which supplied the mouthpiece. In this manner, with the subject'snostrils occluded by a spring clip, it was possible to obtain a leak-free con-nection with the respiratory tract, whilst the appropriate counterpressure wasapplied to the face, head and neck.The Mask and Helmet Valve System - Essentially the same valve systemwas fitted to all the standard masks and pressure headpieces used in this study.This consisted of a simple inlet norn-return valve (Fig. 2-5) through which gasentered the mask cavity during irspiration, and a compensated outlet valve.The latter maintained in the mask cavity a pressure equal to that existing inthe breathing system upstream of the inlet non-return valve when the latterpressure was greater than that of the environment. A compensated outletvalve consists of a valve plate which is held in the closed position by a lightspring. A thin rubber diaphragm lies beneath the valve plate and forms oneboundary of the compensating chamber. This chamber is in conimunicationwith tile inlet tube of the mask by way of the compensating tube. In thismanner the pressure existing in the inlet tube of the mask is applied to theexternal surface of the outlet valve, acting upon an area equal to that of theport of the valve. Thus the outlet valve cannot open until the pressure withinthe mask cavity exceeds that in the inlet tube. The presence oflan inlet non-return valve is essential to the operation of a compensated outlet valve since,when tile mask is connected to an oxygen regulator, an expiratory effort canonly raise the mask cavity pressure above the inlet tube pressure when such avalve is present. Thus when gas at a pressure greater than that of the environ-ment is delivered to the inlet tube of the mask or headpiece this pressure isapplied to the gas in the respiratory tract. During inspiration the pressure inthe mask cavity is reduced and gas flows through the inlet valve. The pressureupstream of the inlet valve is, however, greater than that in the mask cavityso that the outlet valve remains closed. l)uring expiration the mask cavitypressure is increased above that in the inlet tube to the mask so that the inletvalve closes and the outlet valve is opened.The Pressure Breathing Waistcoat and the Pressure Jerkin - In thecourse oft lie development of'a system which would allow the use of breathingpressures of up to i:3o mmHg several Ibrms of respiratory counterpressure wereused. A standard R.A.F. garment, the pressure breathing waistcoat, was usedin certain preliminary experimnemtts. The waistcoat (Fig. 1-8) consists of arubberized fabric bag which covers tile thorax. The lower border of thisgarment extends to about the lower edge of the rib cage, and when inflatedit applies presstre to most of the thorax. It rapidly became obvious, however,that more complete respiratory counterpressure than that given by the waist-coat was necessarv. A bladder garment, the prcssure jerkin, which providedcounterpresure to the "whole trunk, was thereibre developed.
It was decided that a gas-containing bladder encircling the trunk was themost effective method of applying counterpressure to this region. The gar-ment cotilstcd of a loose rubberized fabric bag enclosed within a non-extensible tersvicne outer laver. This fbrm of construction ensured that thepressure applied to the surfhce covered by the inner layer of the garmentwas equal to the pressure of the gas within the bladder. A simple garnmentincorporating such a bladder was made and the cticiency and comfort of it
26
IN4XT MO T*PI4L VALIL MASK CAWJITY
LIX KTR ~O• PORT
Fir.. 2-5 A diagram of the standard mask valve system which consists of an inlet
non-return valve and a compensated outlet valve
27
I I

RAISED INTRAPULMONARY PRESSURE
was assessed by exposing several experienced subjects to pressure breathing atground level whilst wearing the garment and a pressure helmet. As a resultof this assessment several modifications to the basic garment were suggestedand a new sample was manufactured. In this manner a series of garmentswere designed and made, each incorporating features which tests on previousgarments had suggested would improve the comfort and efficiency of theclothing. Whilst some of those features were dictated primarily by the en-vironment in which the garment was to be used, an important group of themwas related directly to the function of the garment as a means of applyingcounterpressure to the trunk. The problems associated with the pres1urizatq;,nprovided by a garmciit can be considered on a regional basis:"The Neck - In early prototype garments the bladder was brought close tothe root of the neck in order to ensure that counterpressure was applied to asmuch of the surface of the trunk as was possible. I)uring pressute breathing,however, compression of the neck occurred and gave rise to discomfort or evenfrank pain. In later versions of the pressure jerkin the neck line was loweredand the ballooning of the outer restraining layer of the garment reduced byusing less extensible material in its construction.The Armhole - The design of the armhole of the pressure jerkin was dictatedby a desire to maintain upper limb mobility when the garment was pres-surized. The front margin of the armhole was cut away until there was nosignificant restriction Qf abduction at the shoulder joint. In order to ensurethat the hands could be elevated above the head the outer border of thegarment over the top of the shoulder was taken medially to cross the clavicleat the junction between the outer and middle thirds. Only when the outerpart of the shoulder was uncovered could the upper limbs be elevated freelywhilst the garment was inflated.The Scrotum - Early versions of the trunk bladder garment were fitted witha tail piece which, when the garment had been donned was: brought forwardbetween the thighs and attached to the lower end of the front of the trunkbladder. This tail piece was not inflated and severe testicular pain was com-mon during pressure breathing with this arrangement. Even inflation of thecrutch piece did little to decrease the incidence of testicular pain. W'hen thisversion of the garment was inflated it tended to move backwards in relationto the pelvis and thighs so that the scrotum was forced against the front partof the crutch piece. This situation arose because, whilst the pressure in thebladder was distributed evenly over the sacral region and the buttocks, theholes for the passage of the lower limbs greatly reduced the front area of thepelvis to which pressur, was applied. This unequal distribution of pressureover the pelvic region was eliminated by reducing the area of the posteriorsurface of the pelvis to which pressure was applied. The bladder of the gar-ment was obliterated over a saddle shaped region which lay over the sacrumcentrally and the medial third of each buttock laterally (Fig. 2-6). With thismodification there was no movement of the garment on the pelvic regionwhen it was inflated and testicular discomfbrt did not occur during pressurebreathing.Inguinal and Femoral Canals - In early forms of the trunk garment thebladder ended at the level of the groin so that when it was inflated theinguinal and femoral canals were unsupported. On several occasions subjects
28

AA
4 Fin r-6 Pressure jerkin sho%% lug uniiflatrd saddle shaped region
29
RAISED INTRAPULMONARY PRESSURE
complained of discomfort in the inguinal region during pressure breathing at8o mmHg with this type of garment. The high intra-abdominal pressureproduced by pressure breathing might induce a herniation of the abdominalcontents through either the inguinal or the femoral canal. Although in thenormal subject the risk of herniation was considered negligible, this proceduremight well induce a hernia in a subject who had a congenital defect such as apatent processus vaginalis. In order to ensure adequate pressurization of theinguinal and femoral canals it was found that the lower edge of the bladderof the garment had to be carried completely around the upper thighs.
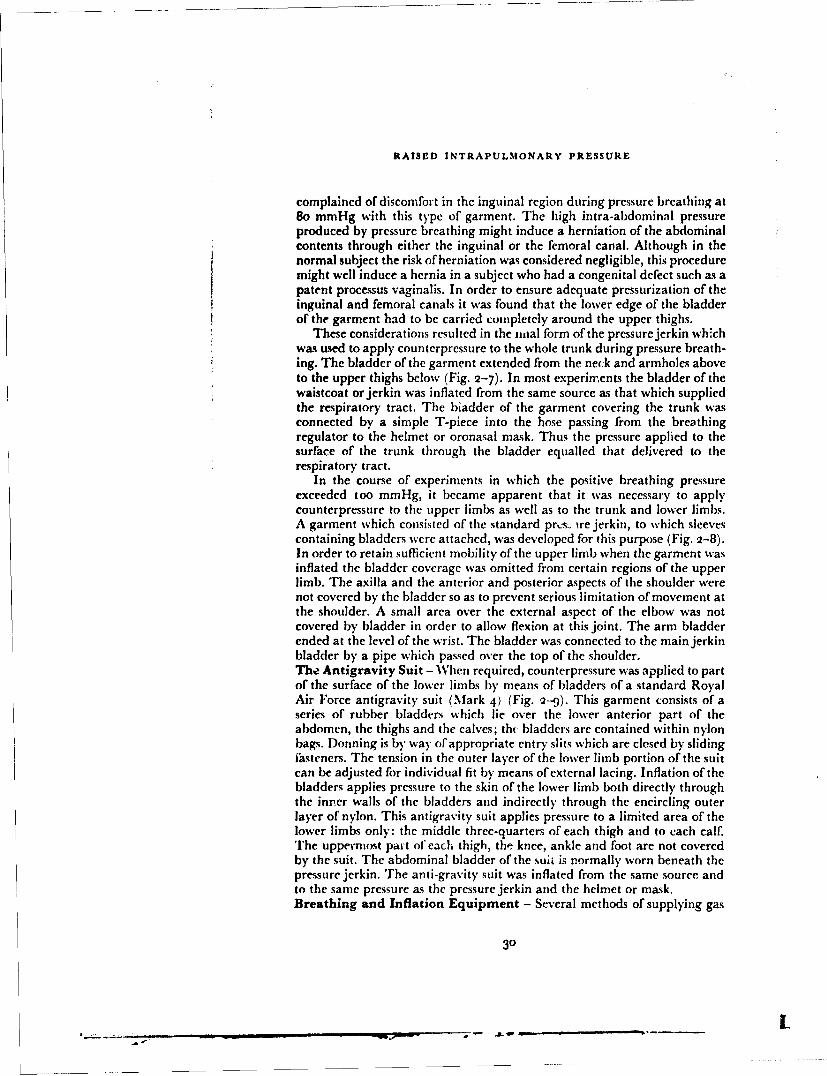
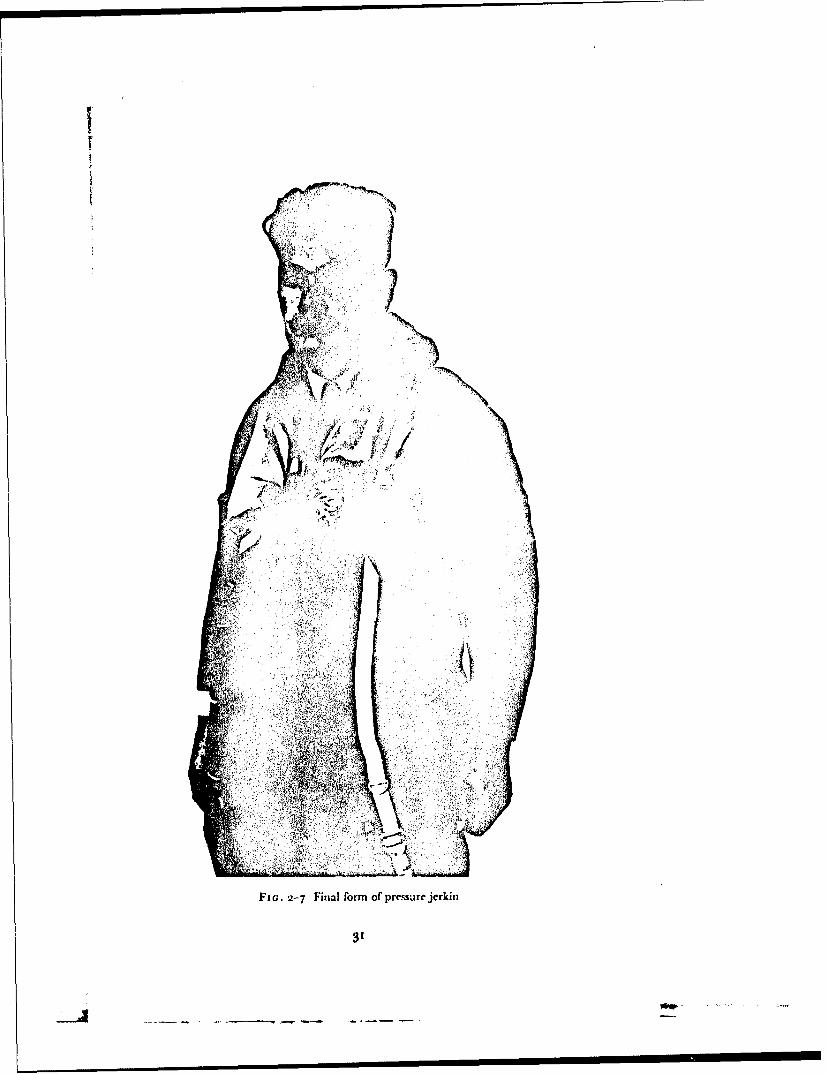
These considerations resulted in the nnal form of the pressure jerkin whichwas used to apply counterpressure to the whole trunk during pressure breath-ing. The bladder of the garment extended from the nec:k and armholes aboveto the upper thighs below (Fig. 2-7). In most experiments the bladder of thewaistcoat orjerkin was inflated from the same source as that which suppliedthe respiratory tract. The biadder of the garment covering the trunk wasconnected by a simple T-piece into the hose passing from the breathingregulator to the helmet or oronasal mask. Thus the pressure applied to thesurface of the trunk through the bladder equalled that delivered to therespiratory tract.
In the course of experiments in which the positive breathing pressureexceeded too mmHg, it became apparent that it was necessary to applycounterpressure to the upper limbs as well as to the trunk and lower limbs.A garment which consisted of the standard pr,:&s ire jerkin, to which sleevescontaining bladders were attached, was developed for this purpose (Fig. 2-8).In order to retain sufficient mobility of the upper limb when the garment wasinflated the bladder coverage was omitted from certain regions of the upperlimb. The axilla and the anterior and posterior aspects of the shoulder werenot covered by the bladder so as to prevent serious limitation of movement atthe shoulder. A small area over the external aspect of the elbow was notcovered by bladder in order to allow flexion at this joint. The arm bladderended at the level of the wrist. The bladder was connected to the main jerkinbladder by a pipe which passed over the top of the shoulder.The Antigravity Suit - When required, counterpressure was applied to partof the surface of the lower limbs by means of bladders of a standard RoyalAir Force antigravity suit (Mark 4) (Fig. 2-9). This garment consists of aseries of rubber bladders which lie over the lower anterior part of theabdomen, the thighs and the calves; th( bladders are contained within nylonbags. Donning is by way of appropriate entry slits which are closed by slidingfasteners. The tension in the outer layer of the lower limb portion of the suitcan be adjusted for individual fit by means of external lacing. Inflation of thebladders applies pressure to the skin of the lower limb both directly throughthe inner walls of the bladders and indirectly through the encircling outerlayer of nylon. This antigravity suit applies pressure to a limited area of thelower limbs only: the middle three-quarters of each thigh and to each calf.The uppermost part of each thigh, the knee, ankle and foot are not coveredby the suit. The abdominal bladder of the suit is normally worn beneath thepressure jerkin. The anti-gravity suit was inflated from the same source andto the same pressure as the pressure jerkin and the helmet or mask.Breathing and Inflation Equipment - Several methods of supplying gas
30
____ ____ ___ ___
Fj.27Fnlfr o rIuejri
I1ow

'2.
FmIC. 2 8 Pressure jerkin showing bladder coverage of upper limibs
32

FIG. 2 9 liitzgravilv stit
33
............ ___ __

RAISED INTRAPULMONARY PRESSURE
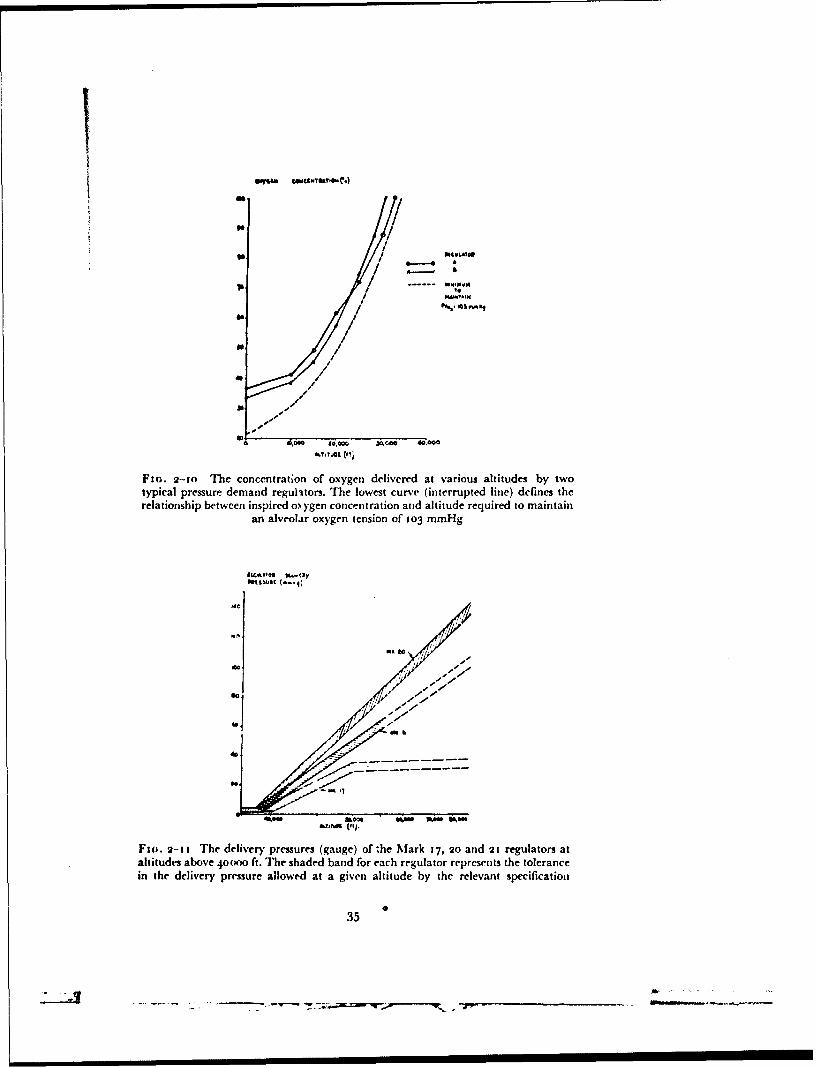
at a pressure greater than that of the environment to the respiratory tract andto the bladders of the pressure clothing were used in the course of this investi-gation. The method employed in any given experiment depended uponwhether the experiments were carried out at ground level or at reducedenvironmental pressure and upon the nature of the measurements to be madein the course of the experiment.Pressure demand oxygen regulators - In the majority of the experimentscarried out at reduced environmental pressure the standard equipment whichhad been developed for use in conjunction with pressure clothing in aircraftwas used. This standard equipment consisted of a high-pressure gaseoussupply of oxygen and a variety of types of pressure demand regulator with theappropriate hose and connector assemblies. When used with these regulatorsa mask or helmet was fitted with the standard compensated outlet valvesystem. The delivery of gas by a demand regulator depends primarily uponthe pressure at its outlet which is connected by wide bore hose to the cavityof the mask. Gas flows from the regulator when the pressure at the outlet isreduced at the beginning of inspiration and ceases when the regulator outletpressure rises at the end of inspiration. The greater the inspiratory demandthe greater is the reduction of the pressure at the outlet of the regulator andhence the greater the flow given by the regulator. Since with a simple demandregulator a reduction of the pressure in the mask below that of the environ-ment is necessary before gas flows from the regulator, an ill-fitting mask, byallowing air to be drawn in, may well give rise to hypoxia at reduced baro-metric pressure. At pressure altitudes in excess of 12 000 ft the regulators usedin this investigation deliver gas until the pressure at the outlet of the regulatorexceeds that of the environment by 2 to 3 cm of water. By this manoeuvre thepressure within the cavity of the mask during inspiration is maintained at avalue slightly greater than that of the environment ("safety pressure") atleast during quiet breathing. These regulators also mix air with oxygen, theproportion of the two gases depending upon altitude, so that the alveolaroxygen tension does not fall below that existing at ground level when air isbreathed (Fig. 2-10). At altitudes above 33000 ft the regulators deliver too",,oxygen. Such a regulator can be set to deliver too",, oxygen unde1r all altitudeconditions.
At altitudes above 40000 ft the regulators employed in this investigationdelivered oxygen at a pressure greater than that of the environment. Threetypes of oxygen regulator (Mark 17, 20 and 21), each providing a differentrelationship between delivery pressure and environmental pressure, wereused. The nominal relationship between these two variables given by each ofthese regulators together with the specification tolerances are depicted inFig. 2-11. The Mark 2o and 2t regulators are constructed so that when theenvironmental pressure suddenly falls to a value of less than 141 mmHgabsolute oxygen is delivered at a very high flow (greater than 150 litresN.T.P. per minute). This high flow ensures that the required absolu!e pressureis attained in the pressure clothing and respiratory tract within three secondsof a sudden decompression.
The low-pressure oxygen system from thc regulator to the oxygen mask orpressure helmet was designed so that it had the minimum resistance com-patible with an acceptable installation. The regulator outlet was connected
34
7 -..... . .- • ....
So
10 /
/,o /
/
k.T,IAo (fl;
Fio. 2-to The concentration of oxygen delivered at various altitudes by twotypical pressure demand regulators. The lowest curve (interrupted line) defines therelationship between inspired o) ygen concentration and altitude required to maintain
an alveolar oxygen tension of 103 mmHg
N&W-004
"o
F (jo. 2- 11 The delivery- pressures (gauge) of the Mark 17, 2o and 21 regulators ataltitude% above 4o(x)O ft. The shaded band for each regulator represents the tolerancein the delivery pressure allowed at a given altitude by the relevant specificatioln
35
S... ..... :2 _ '-- '-' -'_.-.- • q '-• - . " "• NK• ""
• n n n / n

RAISED INTRAPVLMONARY PRESSURE
by I to 2 m. of smooth bore hose (internal diameter 2.2 cnm), a locking con-nector and about I m. of 1.9 cm internal diameter smooth bore hose to theoronasal mask or helmet, the pressure jerkin and the antigravity suit (Fig.2-12). The resistance to flow of gas from the regulator outlet to the maskcavity of a typical expe, imental installation is shown in Fig. 2-13. The totalresistance to breathing imposed by such an assembly depends not only on thatof the low-pressure system but also upon the pressure delivery characteristicsof the regulator and the resistance of the outlet valve of the mask or helmet.Performance data for a typical breathing system used in this study are givenin Fig. 2-14.Production of pressure breathing by means of a decompressionchamber - When a breathing system which imposed very little resistance torespiration was required or gaseo is exchange studies were being made, analternative technique was used to obtain pressure breathing. Althoughgenerally used at ground level this method was also employed on occasions atreduced barometric pressure. The technique made use of a decompressionchamber in which the subject, weating the pressure breathing equipment,was seated. The breathing compartment of the helmet or mask was connectedby way of two pieces of smooth-bore hose (internal diameter 3.1 cm) to theexternal surface of the chamber. A pair of low-resistance non-return valveswere fitted into the breathing system to ensure the uni-directional flow ofrespired gases through the hoses. The pressure clothing and the compartmentoft he helmet outside the breathing portion were connected by another hoseto the external surface of the decompression chaniber. Pressure breathing wasproduced byreducingthe pressure in the decompression chamber by the desiredamount. An advantage of this technique was that during pressure breathingthe absolute pressure within the respiratory tract was equal to that at rest.
TECHNIQUE OF EXPERIMENTS AT REDUCED PRESSURE
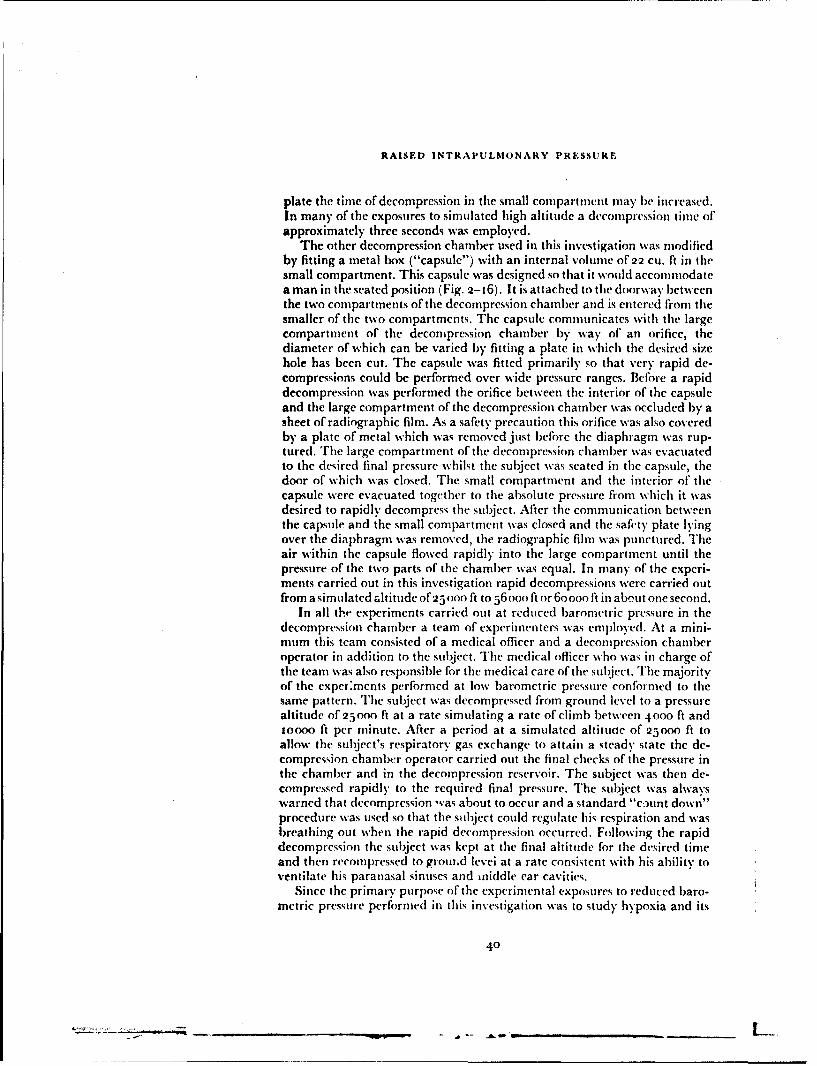
The experimental exposures of subjects to reduced barometric pressurewere made in one of two decompression chambers (a standard and a modifiedR.A.F. mobile decompression chamber Mark 11). The standard de-compression chamber consists of a cylinder 8 ft in diameter divided by a pairof doors into two compartments 7 ft and 13 ft long. The pressure within eachcompartment can be reduced independently by two rotary vacuum pumps.The performance of the decompression chamber in terms of the maximumrate at which air can be removed from and added to each compartment isshown in Fig. 2-15. In addition the smaller compartment is connected by a12 in. diameter pipe to a large reservoir cylinder which can also be evacuated.The pipe between the smaller compartment and the cylinder contains a largebutterfly valve. The pressure within the small conmpartmat of the de-compression chamber can be reduced suddenly by opening the butterflyvalve after the air in the reservoir cylinder haý bcln removed. The volumes ofthe smaller compartment and of the reservoir cylinder are such that when thelatter is evacuated to a pressure of less than 8 nmmHg absolute the small com-partment can be decompressed from a pressure altitude of 27000 ft (258mm[Ig) to 56ooo ft (66 mmhlg) in approximately o.8 sec. The pipe be-tween the small compartment of the reservoir also contains a valve plate,the position of which can be adjusted by an external handle. By means of this
36
- -.00, ---. - . . - - .- .

MASK ~O~
M&SYE. PLQQC
.P.II'SUL MOM,
U.MhMO tuG~LbToaAftKIN CONNECTOA
C ONNEC.TOR. ,/
P~~hH1IQ SSrI,I I!
[email protected] COW4K9MCt@
Fi(;. 2- 12 A typical low |pressure oxygeti system used with partial pressure clothing.The hose assembly from the locking connector below to the socket for the mask plug
above is attached permanently to the jerkin by the jerkin connector
37
- t ,-.q -_ . P
so .00
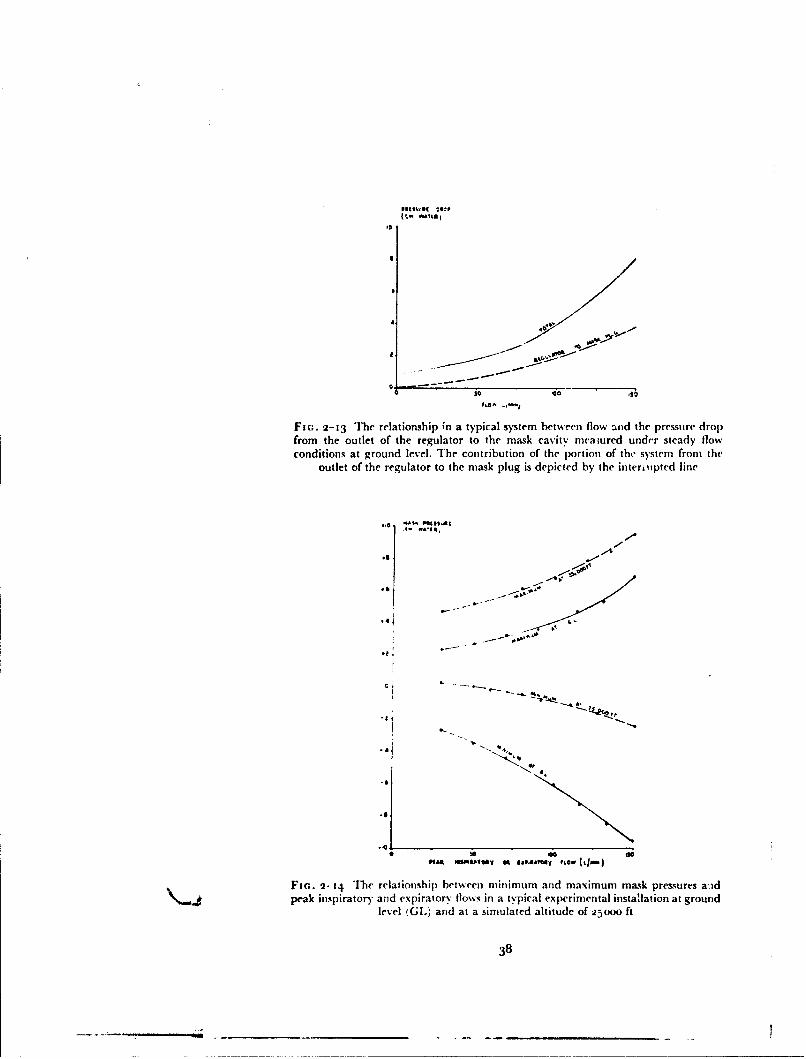
Fi(;. 2-13 The relationship ;n a typical system between flow and the pressure dropfrom the outlet of the regulator to the mask cavity niaiured under steady flowconditions at ground level. The contribution of the portion of the" system from the
outlet of the regulator to the mask plug is depicted by the interipted line
-S. tSS•At
.4.4
-.L
°l4,
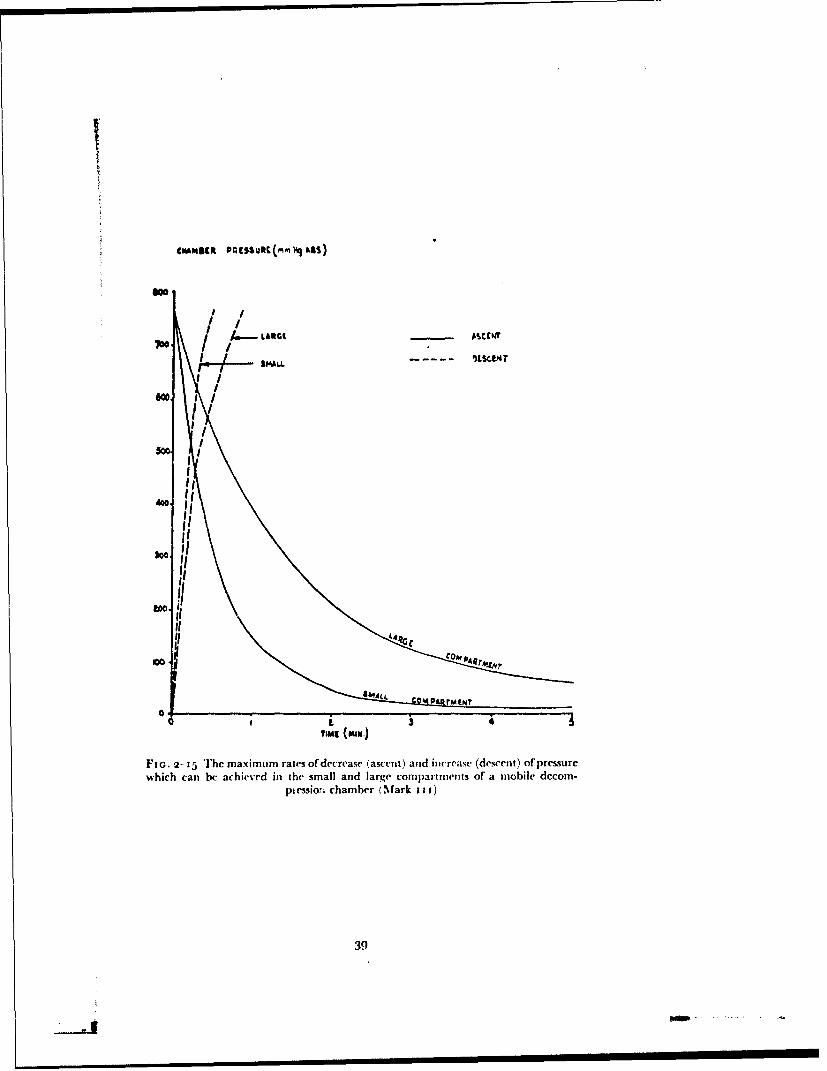
0 do dPC" OWfMyTI- 0 (a..aATMI ILaO WI-)
FIn. 2-14 The relationship between milimum and maximum mask pressures a.idpeak inspiratory and expiratory flo%%s in a typical experimental installation at ground
level (GI.) and at a simulated altitude of 2•000 ft
38
II
too"I,
Co COAN PAcr,JV~ i i
Fio. 2- i5 The max imum rtaes of decrease (ascent) and increase (descent) of pressurewhich can be achieved in the small and large compartmnents of a mobile decom-
pkessio:ri chamber (Mark i i j)
39
, 'II I I
RAISED INTRAPULMONARY PRESSURE
plate the time of decompression in tile small compartment may be increased.In many of the exposures to simulated high altitude a decompression time ofapproximately three seconds was employed.
The other decompression chamber used in this investigation was modifiedby fitting a metal box ("capsule") with an internal volume of 22 Cu. ft in thesmall compartment. This capsule was designed so that it would accommodatea man in the seated position (Fig. 2-16). It is attached to the doorway betweenthe two compartments of the decompression chamber and is entered from thesmaller of the two compartments. The capsule communicates with the largecompartment of the decompression chamber by way of an orifice, thediameter of which can be varied by fitting a plate in which the desired sizehole has been cut. The capsule was fitted primarily so that very rapid de-compressions could be performed over wide pressure ranges. Before a rapiddecompression was performed the orifice between the interior of the capsuleand the large compartment of the decompression chamber was occluded by asheet of radiographic film. As a safety precaution this orifice was also coveredby a plate of metal which was removed just before the diaphragm was rup-tured. The large compartment of the decompression chamber was evacuatedto the desired final pressure whilst the subject was seated in tihe capsule, thedoor of which was closed. The small compartment and the interior of thecapsule were evacuated together to the absolute pressure from which it wasdesired to rapidly decompress the subject. After the communication betweenthe capsule and the small compartment was closed and the safrty plate lyingover the diaphragm was removed, the radiographic film was punctured. Theair within the capsule flowed rapidly into the large compartment until thepressure of the two parts of the chamber was equal. In many of the experi-ments carried out in this investigation rapid decompressions were carried outfrom a simulated altitude of2 5 ooo ft to 36ooo ft or 6oooo ft in about one second.
In all the experiments carried out at reduced barometric pressure in thedecompression chamber a team of experimenters was employed. At a mini-mum this team consisted of a medical officer and a decompression chamberoperator in addition to the subject. The medical officer who was in charge ofthe team was also responsible for the medical care of the subject. The majorityof the experiments performed at low barometric pressure conformed to thesame pattern. The subject was decompressed from ground level to a pressurealtitude of 25000 ft at a rate simulating a rate of climb between 4000 ft andioooo ft per minute. After a period at a simulated altitude of 25000 ft toallow the subject's respiratory gas exchange to attain a steady state the de-compression chamber operator carried out the final checks of the pressure inthe chamber and in the decompression reservoir. The subject was then de-compressed rapidly to the required final pressure. The subject was alwayswarned that decompression was about to occur and a standard "c3unt down"procedure was used so that the subject could regulate his respiration and wasbreathing out when the rapid decompression occurred. Following the rapiddecompression the subject was kept at the final altitude for the desired timeand then recompressed to grom,d levei at a rate consistent with his ability toventilate his paranasal sinuses and middle ear cavities.
Since the primary purpose of the experimental exposures to reduced baro-metric pressure performed in this investigation was to stud)y hypoxia and its
40
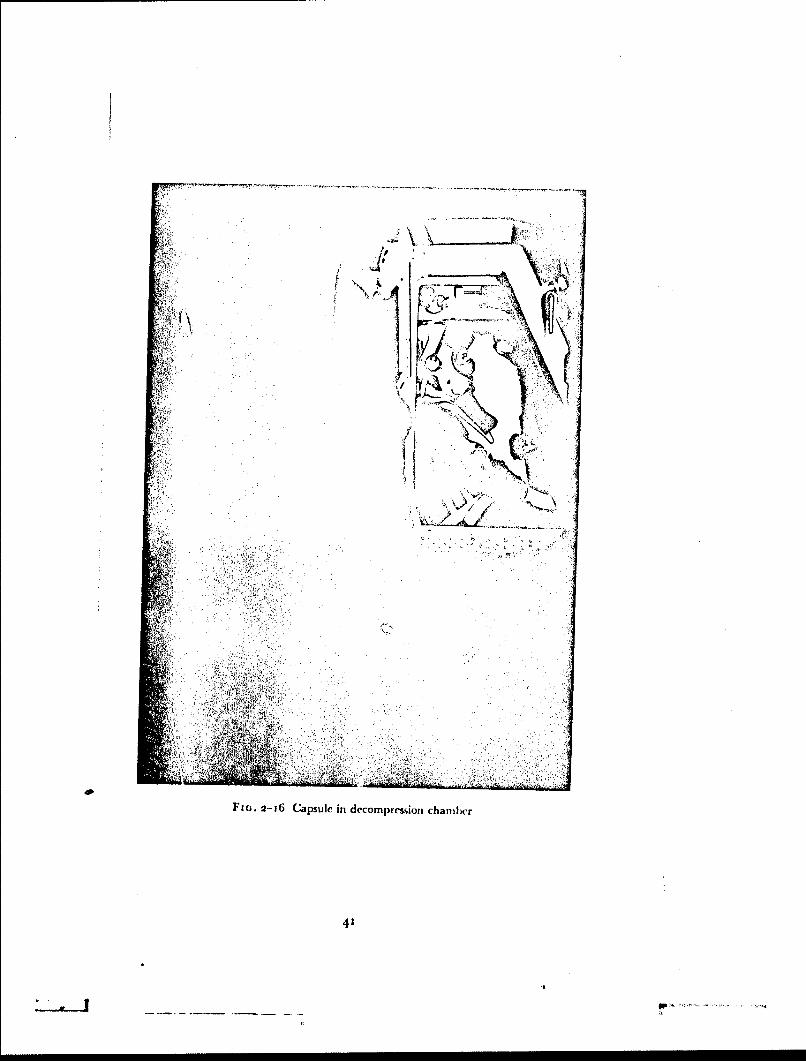
N
Ft(;. 2-16 Capsule in decompression chanmber
41
RAISED INTRAPULMONARY PRESSURE
prevention the subject was usually afforded protection against decompressionsickness. A further reason for affording protection against this condition wasthat it can lead to serious circulatory and neurological disturbances which areoccasionally fatal. This protection was given by removing a large proportionof the nitrogen normally held in the blood and tissue fluids before an exposureto low environmental pressure. Breathing too%'. oxygen in an open circuitremoves nitrogen from the alveolar gas and thus from the blood and tissuefluids. Experience with subjects with varying susceptibilities to decompressionsickness has shown that breathing ioo".. oxygen for one hour providesadequate protection against the effects of exposure to a simulated altitude inexcess of 30000 ft provided that the time of exposure does not exceed tenminutes. As a general rule all subjects exposed to pressure altitudes in excessof 3oooo ft breathed ioo"%, oxygen for at least one hour at ground level beforedecompression was performed. Special precautions were taken to ensure thatno air was drawn into the breathing system during this period. The subject'soxygen mask was firmly secured and the pressure demand oxygen regulatorset to deliver oxygen at a pressure between 2 and 4 mmHg greater than thatof the environment. Since, however, the strict adherence to this procedurewas very time consuming, denitrogenation before decompression was omittedin certain circumstances. These circumstances were that the susceptibility ofthe subject to decompression sickness was known from previous exposures toreduced barometric pressure without prior denitrogenation and that theexposure to pressures less than that equivalent to an altitude of 3000o ft didnot exceed five minutes. In practice only the members of the High AltitudeResearch Unit of the Institute were exposed without denitrogenation.
Certain safety precautions were routinely practised in these experiments.The medical officer in charge of the decompression always ensured that thesubject was medically fit to undergo the proposed experiment. One medicalofficer checked the subject's oxygen equipment before the decompressioncommenced. As an additional safety precaution the medical officer normallyoccupied the lock of the decompression chamber (the large compartment ofthe standard Mark I I I decompression chamber and the smaller compartmentof the modified chamber outside the capsule), and was decompressed to apressure equivalent to an altitude of 2500o ft. This medical officer kept thesubject under continuous observation. If, following a rapid decompression,the subject indicated that he was in difficulties or if the medical officer decidedthat the subject's reactions were abnormal the subject was very rapidly re-compressed to a pressure altitude of 25000 ft (this normally took between oneand two seconds.%. The medical officer could then pass into the compartmentcontaining the subject and render him such aid as might be necessary. Thepressure-altitude at which the medical officer remained when the subject wasexposed to a lower pressure was chosen as 2rO00 ft since the subject could berecompressed at a very high rate to this pressure-altitude with very little riskofotitic or sinus barotrauima. Further, ifth" medical officer was decompressedto a pressure-altitude greater than 235oK ft he was likely to develop de-compression sickness.
Facilities were always available for the trea!ment of any of the emergencyconditions which might occur during the experimental programme. Theserious conditions which it was considered might arise were:
EXPERIMENTAL METHODS
(a) Unconsciousness(b) Airway obstruction by inhalation of vomit(c) Circulatory failure due to decompression sickness(d) Pneumothorax and arterial air einbolism(e) Respiratory arrest(f) Cardiac arrest.Every instance of circulatory collapse was treated as decompression sick-
ness until the latter diagnosis was excluded by an observation period of aminimum of four hours following the incident.
In all those experiments in which it was considered that syncope mightarise and in many of the more routine exposure- to reduced barometricpressure in the decompression chamber, the electrocardiogram and arterialblood pressure were recorded throughout the experiment. A second medicalofficer observed these recordings and in the event ofany suggestion of impend-ing collapse warned tht mnedical officer in charge of the experiment whogenerally ordered the immediate cessation of the exposure to reduced environ-mental pressure.
RESPIRATORY TECHNIQUES
Measurement of pulmonary ventilation and collection of expiredgas - Both open and closed circuit techniques were employed in the course ofthis investigation. Measurements of respiratory minute volume were made bymeans of a recording Tissot spirometer (capacity 150 litres). The circuit wasusually arranged so that the subject inspired from the spirometer, particularlywhen collections of expired gas were made. These were generally taken bypassing the expired gas into a series of Douglas bags of suitable capacity overtimed intervals. Subsequently the contents of each Douglas bag werethoroughly mixed and the volume of gas collected measured by passing thecontents at a steady rate (of less than 15 litre/min.) through a water sealedgas meter. As the contents of the bag were emptied a sample of the gas wastaken through the side arm of the Douglas bag into a too ml capacity gassampling tube by allowing the mercury with which it had been previouslyfilled to flow out. Before the sample was taken the side arm of the Douglas bagwas flushed by drawing through it and the side arm of the sampling tube5o ml of the bag contents by means of a suitable syringe. By this techniquethe volume of gas drawn from the Douglas bag in the process of taking thesample was known accurately so that the total volume of the bag contentscould be calculated. In most of the closed circuit experiments a standard6 litre recording bell type spirometer was used. The circuit contained a carbondioxide absorber (soda lime) and a respiratory pump which circulated thecontents at approximately 5o litre/min.Flow measurement - Various techniques were used to measure thevelocity of flow of gases. When the flow was steady it was measured by meansof a suitable rotameter. Care was taken to maintain 'he pressure and tempel a-ture conditions within the rotameter tube equivalent to those under which theinstrument had been calibrated. The majority of flow measurements, how-ever, were made during respiration. Two types of pneumotachygraph wereused When only dry gas was to pass through the flowmeter a gauze screen(4o0 per in.) instrument based upon that developed by Lilly (m95o) (Iqo) was
43
- - w -. .. a r -- -

RAISED INTRAPULMONARY PRESSURE
used. Steady flow calibrations showed that there was a linear relationshipbetween the flow of gas and the pressure drop across the screen at flows of upto 250 litre/min. When moist expired gas was to pass through the flowmetera Fleisch capillary tube meter (196o) fitted with a heater was employed. Cali-bration of this instrument demonstrated that there was a linear relationshipbetween the flow of gas and the pressure difference between the two tappingsof the transducer. The pressure difference created between the pressure tap-pings of each of the flowmeters by gas flow was recorded by means of adifferential capacitance manometer of suitable sensitivity and an appropriateamplifier. The output of the amplifier was fed on to the galvanometer of aphotographic recorder. The tubes from the pressure tappings on the flow-meter to the differential manometer were made as short as possible (generallyabout io cm) and the lengths of the two tubes were kept equal. Before andafter each series of measurements the experimental record was calibrated bypassing known steady flows through the flowmeter using a rotameter andrecording the corresponding galvanometer deflections.
The adequacy of the overall dynamic response of the flow measuringequipment was tested using an electrically driven pump which producedsinusoidal variations in flow. The stroke volume of the pump cou!d be variedbetween o.5 litre and 3.0 litre and its frequency from 8 to 40 strokes/min. Theflowmeter was connecteC directly to the outlet of the pump and the flowpatterns produced by various settings of the pump were recorded. Thefrequency and stroke volume of the pump were measured independently ofthe flowmeter with a stopwatch and a recording spirometer for each of thesettings used. The peak flow was then calculated for each setting by means ofthe equation:
V= r
,fwhere
V = stroke volumeP = peak flow
f = frequency
The relationship between the calibrated peak flow and that recorded bythe Lilly pneumotachygraph is shown in Fig. 2-17, for stroke volumes betweeno.5 and 3.0 litre and frequencies between io and 40 per minute. It may beseen that there was excellent agreement between the calibrated and peakflows. Similar results were obtained with the Fleisch flowmeter. These resultsconfirmed that the pneumotachygraphs and associated amplifiers and record-ing equipment used in this investigation faithfully reproduced the actualchanges in the flow which were occurring through the flowmeter.
On some occasions the volume of each breath was obtained by planimetricintegration of the area between the flow curve and the line -epresenting zeroflow. The overall accuracy of this technique was asse..sed by simultaneouslyrecording the subject's tidal volume b) means of a bell spirometer and theflow of gas by means of a pneumotachygra.h. The areas contained by theflow curve for the two phases of each breath were measured three times bymeans of a suitable planimeter. The volume represented by a unit area of
44
_--- - -- Li.

MLwAN LOW fiiuM
4 0
s o ftis 0 wotCALUAY90 PEASK FLOW
Fic.. 2-17 The results of the dynamic calibration of the Lilly pneumotachygraph bymeans of a sine wave pun~p. The peak flow indicated by the Lilly flowmeter isplotted against the corresp,''iding peak flow calculated from the stroke volume and
frequency of the pump
Iv mwat (Ij
'S IL•l.vtm~'~4
al
Fio. 2-18 The relationship between the value of the tidal volume cbtained byplanimetric integration of the output of the Lilly pneumotachygraph and the actual
tidal volume measured directly with a recording spirometer
45
- -.--- ---. ... . . .... --
RAISED INTRAPULMONARY PRESSURE
record was determined by measuring the area contained between the calibra-tion line produced by a known flow and the zero flow line for a Icngth ofrecord representing a known time. The tidal volumes calculated in thismanner for twenty-five breaths are compared with the actual spirometricallydetermined volumes in Fig. 2-18. The tidal volumes calculated from theplanimetric integration of the flow curve agreed with the corresponding spiro-metric tidal volumes within +3%,o of the tidal volume.Measurement of pressure in breathing equipment - In many circum-stances it was necessari to measure the difference between the pressure withina part of the breathing equipment and that of the environment. When thevelocity of gas flow at the point at which the pressure measurement was to bemade was considerable, care was taken to ensure that only the lateral com-ponent of the total gas pressure was measured. This requirement was metwhen pressire measurements were made in a tube by inserting a piezometerring with the same internal diameter as the pipe. Where the actual velocityof gas flow was relatively low, such as within the cavity of an oronasal mask,the pressure was measured by means of a simple tapping through the wa!l andan alcohol or mercury manometer depending upon the magnitude of thepressure. A rapidly changing pressure was measured by means of an un-bonded strain gauge pressure transducer of the appropriate sensitivity. Thechange in the resistance of the strain gauge of the transducer was measured bymeans of a Wheatstone bridge circuit and a carrier amplifier, the output ofwhich was fed on to the galvanometer of a bromide paper photographicrecorder. Before and after each experimental period the output of the trans-ducer was calibrated using an appropriate manometer. All the pressuretransducers used in this study gave a linear relationship between pressurechange and galvanometer deflection.Intraocsophageal pressure measurement - The changes in pleuralpressure during respiration were measured by means of an oesophagealballoon. As pointed out by Mead, NlclIroy, Selverstone and Kriete (1955)(209) the length of the balloon used to record intraoesophageal pressure isimportant, the value of the pulmonary compliance given by a short balloondepending upon its position in the oesophagus. The thin latex balloons usedin this investigation had the dimensions suggested by Mead, Nicllroy,Selverstone and Kriete (I955) (209), i.e. they were 16 cm long and o.8 cmin diameter. The pressure within the balloon was measured by way of a 75 cmlength of polyethylene catheter (1.4 mm internal diameter) the distal end ofwhich was sealed within the balloon. The wall of the part of the catheterwithin the balloon contained small holes approximately tcm apart. Thepressure distension characteristics of each balloon used in this study weredetermined by introducing known volumes of air into the balloon and record-ing the corresponding pressure within the balloon by means of an alcoholmanometer. A typical pressure-distension curve is presented in Fig. 2-19. Thepressure within the balloon equalled that of the environment when the volumeof gas within it was between i ml and 5 ml. The pressure within the balloonwas recorded by means of a capacitance manometer of the Hansen (1949)(141) type with a chamber volume of less than 0.2 ml. Changes in thecapacity of the transducer were amplified and fed on to the galvanometer ofa photographic recorder.
46
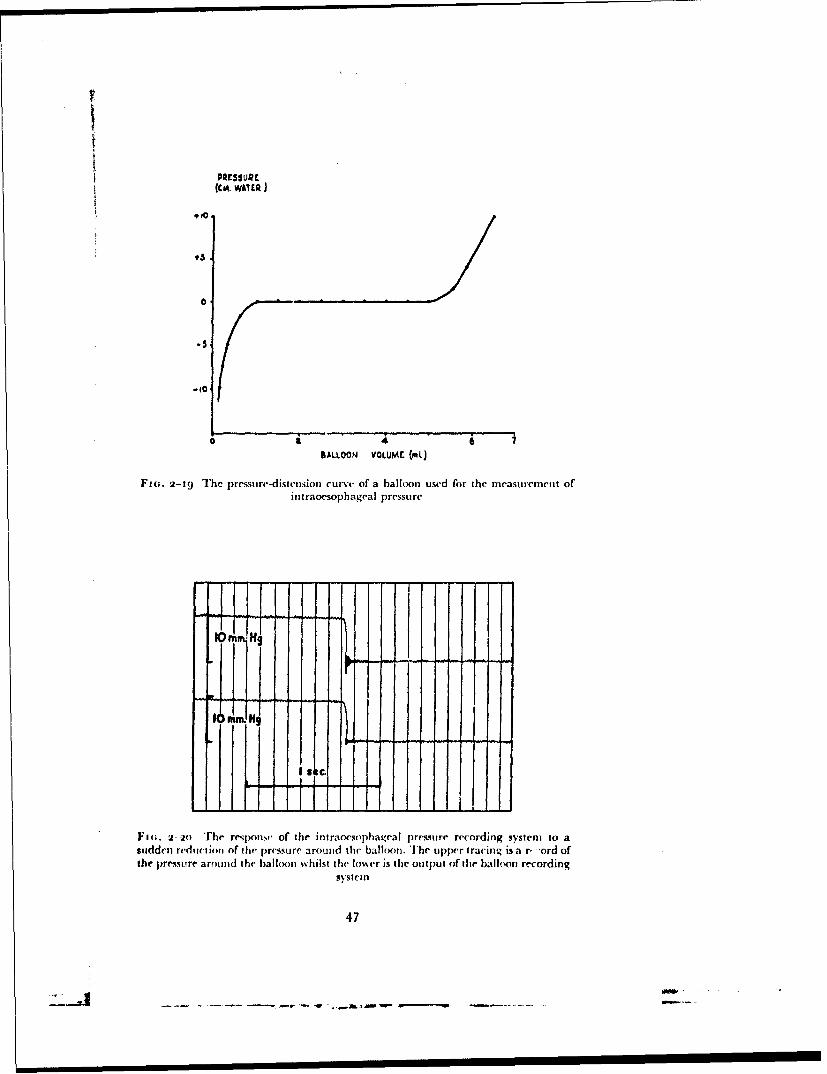
PRtESSuR(CI. wATER
910,
0.5
- IC
0 4 • '
BALLOON VOLUME (mL)
Fie. 2-19 The pressure-distension curve of a balloon used for the measuremtent ofint raoesophageal pressure
lOnm NJg
I S elI
Fio;. 2 2o The response of the intraoesophageal presmure recording system to asudden reduction of the pressure around the balloon. The upper tracing is a r, "ord ofthe pressure around the balloon vhilst the lo%,er is the output of tihe ball(,on recording
systelll
47
. , u I I I I I I I SAIW

RAISED INTRAPULMONARY PRESSURE
The accuracy -with which the balloon-catheter-transducer-amplifier-recorder system followed the changes in pressure immediately around theballoon was examined by placing the balloon within a flask. The pressure inthe flask was varied by means of a syringe attached to a side arm of tile flask.Sudden changes in pressure were produced by covering the opening or theflask with a rubber membrane, increasing the pressure in the flask and thensuddenly rupturing the membrane. The changes in pressure within the flaskwere measured directly by means of a second capacitance transducer whichwas connected by a short length of rigid pipe to the cavity of the flask. Atypical recording of the response of the balloon recording system to a suddenchange in flask pressure is shown in Fig. 2-2o. Further tests demonstratedthat the balloon system recorded the actual pressure changes, both static anddynamic, up to pressures of ±50 cm of wvter.
In order to measure intraocsophageal pressure the balloon was firstswallowed through the mouth into the stomach. The minimum volume of airnecessary to ensure that the recording system faithfully reproduced thepressure outside the balloon was introduced by means of a syringe. Theballoon was then withdrawn until the pressure recorded by it fell duringinspiration. In experiments in which the pressure within the stomach wasmeasured a similar balloon was swallowed until it lay within the stomach.Frequently the oesophageal and gastric pressures were recorded simulta-neously. In this case a double balloon was used. The polyethylene catheterof the distal balloon was carried through the lumen of the proximal one with-out communicating with it. The distal ends of the two balloons were separatedby 20 cw
GAS ANALYSIS
D0c3rete samples - The concentrations of carbon dioxide and oxygen indiscrete gas samples were determined by analysis by the standard Haldanetechnique (136) using an apparatus with a 21 mil burette. On every occasionduplicate analyses were performed and if the pair ofanalyses differed by morethan 0.02 solumes per cent a third analysis was carried out. On manyoccasions the total concentration of' absorbable gas exceeded 30',, of the
sample and in these circumstances a nitrogen dilution technique was used.The carbon dioxide and oxygen content of a 2o ml sample of room air wasabsorbed and a portion of the residual nitrogen in the apparatus expelleduntil a volume of between 13 and 15.5 ml remained. The volume of thisnitrogen was accurately measured and then the gas was transferred into theoxygen absorbent. Approximately 5 nil of the sample to be analyzed was thendrawn into the measuring burette taking the usual precautions to pre\entcontamination with laboratory air. The exact volume of nitrogen which hadbeen stored in the oxygen absorbent was drawn back into the measuring
burette and the total volume of nitrogen together with the sample wasaccurately measured. The volumes of ca bon dioxide and oxygen content inthe mixture were then determined in the iuual manner. All the ai ilvsesperformed by this method were carried out in duplicate. The ace uracy of thenitrogen dilution technique was less than that of the standard Haldane tech-nique. The variation between duplicate analyses was -ound to be less than
±o.o6 volumes per cent.
48
#1#.• •27lulmlq - -l - -a~ •-' -. .. - - -- .. ..

EXPERIMENTAL METHODS
Continuous nitrogen analysis - The concentration of nitrogen in the
respired gases was measured continuously by emission spectroscopy using thetechnique developed by Iundin and Akesson (1954) (198) from tile originalform of nitrogen meter designed by Lilly and Anderson (1944) (190). A smallsample (0oo mlimin.) of the gas to be analyzed was drawn continuouslythrough the electrical discharge tube of the instrument by means of a rotaryvacuum pump. The specially designed needle valve (198) was inserted in thehose through which the gas to be sampled flowed. The size of the samplingorifice could be varied so as to maintain the pressure within the emission tubeat the desired level. Tihe output of the nitrogen meter was displayed on amilliamm :ter and also fed on to the galvanometer of a photographic recorder.
Preliminary studies were made in order to determine the effects of varia-tions in operating conditions upon the sensitivity of the instrument. Tlheeffects of variation of the pressure sithin the emission tube and of the currentflowing through the emission tube (ionizing current) were investigated. Thepressure within the vacuum system was measured with a McLeod gaugewhich was connected by mean,. -fa "T" piece between the emission tube andthe vacuum pump to cm firoin the outlet of the emission tube. The relation-ship between the vacuum pressure and the output current when the instru-ment was sampling laboratory air is depicted in Fig. 2-21. Increasing tileionizaticn current was found to increase the output of the instrument at agiven nitrogen concentration and operating pressture. Water vapour wasfound not to have a specific effect upon the outl)Ut of the instrument. With agiven nitrogen concentration a sample saturated with water vapour gave aslightly smaller output than a dry sample. The decrease in output was foundto be proportiona. to the dilution of'the dry sample by water vapour. Carbondioxide, however, did have a specific effect, although quantitatively this wasr'elatively small (Table 2-1).
TABLE '2-i
THE EFFEC;T OF 100", CARBON DIOXIDE
UPON TIlE ou'TriUT OF TIlE NITROGEN ME IER
Ionization current - a '.: .nA
Operating Meter reading Equivalentpressure with ioo",, carbon dioxide nitrogen concentration
(mm Hg abI. (arbitrary units. I.")
o.8 13.0 2.4
1.2 mo.d 2.61.8 6.o 3.12.5 5.o 1.52.8 3,5 t.I
4.3 2.5 o.86.o 1.5 0.57.0 Lo. 0.4
49
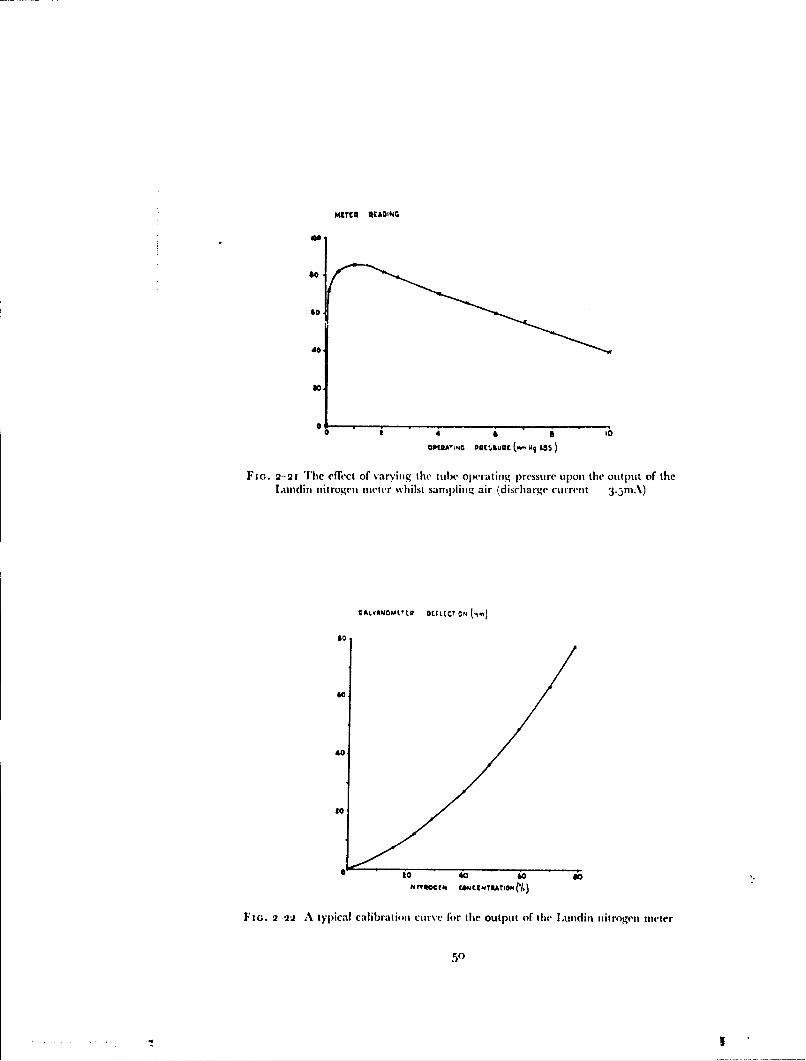
METER 4CAOiNG
*0.
40,to
OPt0A'•,, DQC•tSUQC ( ASS )
Fio. 2-21 The effect of varying the tubc operating pressure upon the output of thelJundin nitrogen meter wvhilst saml)linig air (discharge current 3.5mA)
CALvANOMtEtE DtvitvC ON ,
60
40
l0
to4o t
0 ZO 40 60 7Z?#t¶ftCCh rAM~INTRAIGNN.)
FIG. 2-22 A typical calibration curve for the output of the Lundin nitrogen meter
50
S.. .... : , . _ .
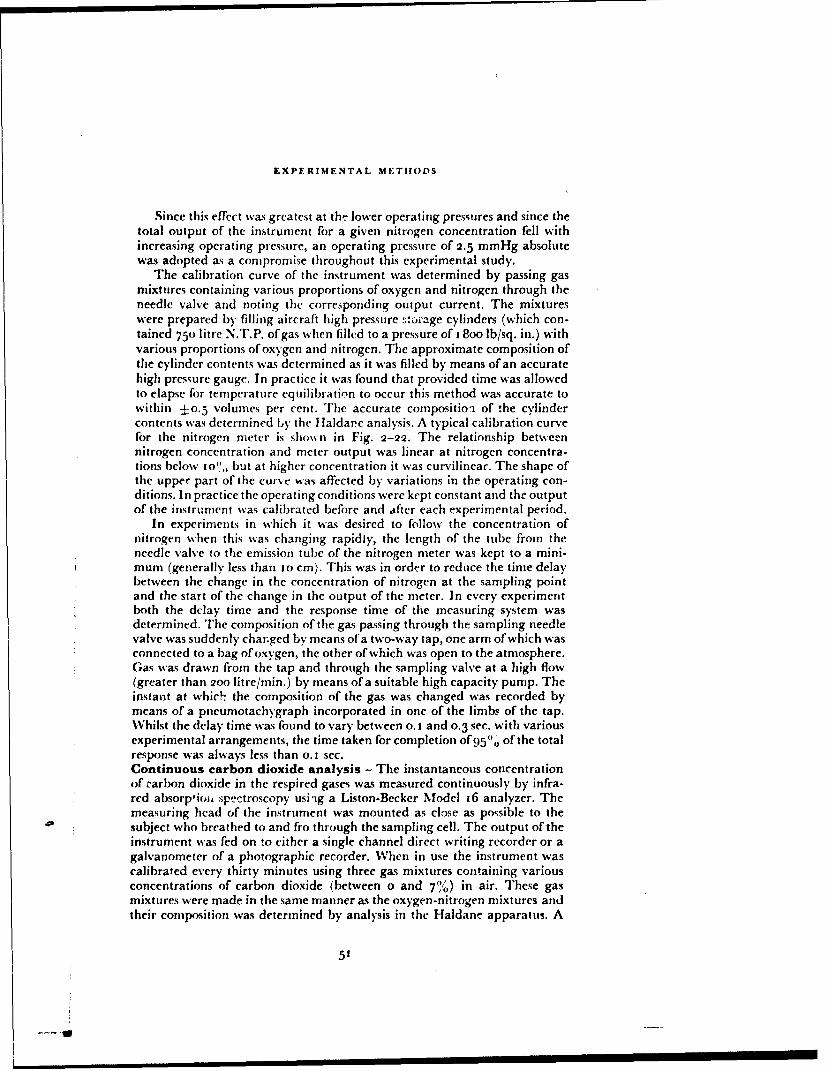
EXPERIMENTAL METHODS
Since this effect was greatest at the lower operating pressures and since thetotal output of the instrument for a given nitrogen concentration fell withincreasing operating pressure, an operating pressure of 2.5 mmHg absolutewas adopted as a compromise throughout this experimental study.
The calibration curve of the instrument was determined by passing gasmixtures containing various proportions of oxygen and nitrogen through theneedle valve and noting the correiponding output current. The mixtureswere prepared by filling aircraft high pressure stoiage cylinders (which con-tained 750 litre N.T.P. of gas when filled to a pressure of I Boo lb/sq. in.) withvarious proportions of oxygen and nitrogen. The approximate composition ofthe cylinder contents was determined as it was filled by means of an accuratehigh pressure gauge. In practice it was found that provided time was allowedto elapse for temperature equilibration to occur this method was accurate towithin ±o.5 volumes per cent. The accurate composition of the cylindercontents was determined by the Haldare analysis. A typical calibration curvefor the nitrogen meter is shown in Fig. 2-22. The relationship betweennitrogen concentration and meter output was linear at nitrogen concentra-tions below to'",, but at higher concentration it was curvilinear. The shape ofthe upper part of the curve was affected by variations in the operating con-ditions. In practice the operating conditions were kept constant and the outputof the instrument was calibrated before and after each experimental period.
In experiments in which it was desired to follow the concentration ofnitrogen when this was changing rapidly, the length of the tube from theneedle valve to the emission tube of the nitrogen meter was kept to a mini-mum (generally less than to cm). This was in order to reduce the time delaybetween the change in the concentration of nitrogen at the sampling pointand the start of the change in the output of the meter. In every experimentboth the delay time and the response time of the measuring system wasdetermined. The composition of the gas passing through the sampling needlevalve was suddenly changed by means of a two-way tap, one arm of which wasconnected to a bag of oxygen, the other of which was open to the atmosphere.Gas was drawn from the tap and through the sampling valve at a high flow(greater than 2oo litre/min.) by means of a suitable high capacity pump. Theinstant at which the composition of the gas was changed was recorded bymeans of a pneumotachygraph incorporated in one of the limbs of the tap.Whilst the delay time was found to vary between o. I and 0.3 sec. with variousexperimental arrangements, the time taken for completion of 95"0' of the totalresponse was always less than o.1 sec.Continuous carbon dioxide analysis - The instantaneous concentrationof carbon dioxide in the respired gases was measured continuously by infra-red absorptioji spectroscopy usi-ig a Liston-Becker Model 16 analyzer. Themeasuring head of the instrument was mounted as close as possible to the
4% subject who breathed to and fro through the sampling cell. The output of theinstrument was fed on to either a single channel direct writing recorder or agalvanometer of a photographic recorder. When in use the instrument wascalibrated every thirty minutes using three gas mixtures containing variousconcentrations of carbon dioxide (between o and 7%) in air. These gasmixtures were made in the same manner as the oxygen-nitrogen mixtures andtheir composition was determined by analysis in the Haldane apparatus. A
51
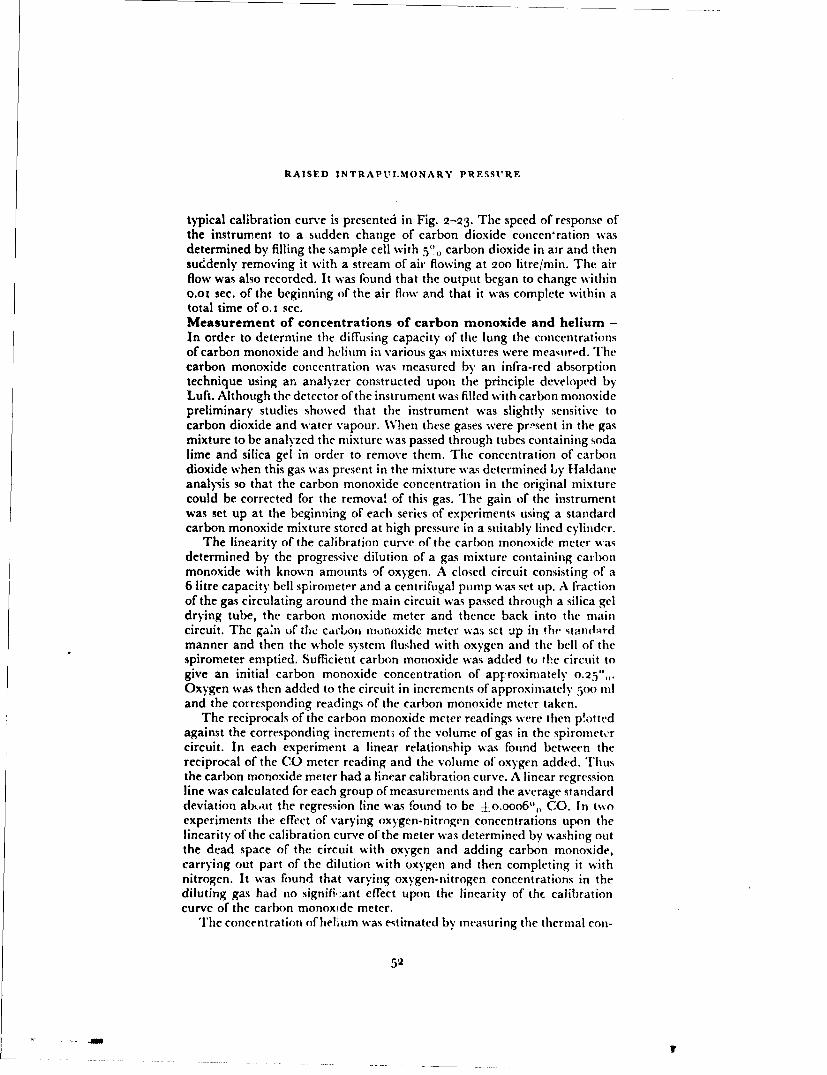
RAISED INTRAPUIMONARY PRESSURF
typical calibration curve is presented in Fig. 2-23. The speed of response ofthe instrument to a sudden change of carbon dioxide concenration wasdetermined by filling the sample cell with 5V0 carbon dioxide in air and thensuddenly removing it with a stream of air flowing at 2oo litre/min. The airflow was also recorded. It was found that the output began to change withino.oi sec. of the beginning of the air flow and that it was complete within atotal time of 0. 1 sec.Measurement of concentrations of carbon monoxide and helium -In order to determine the diffusing capacity of the lung the concentrationsof carbon monoxide and helium in various gas mixtures were meamird. Thecarbon monoxide concentration was measured by an infra-red absorptiontechnique using an analyzer constructed upon the principle developed byLuft. Although the detector of the instrument was filled with carbon monoxidepreliminary studies showed that the instrument was slightly sensitive tocarbon dioxide and water vapour. When these gases were pr!"sent in the gasmixture to be analyzed the mixture was passed through tubes containing sodalime and silica gel in order to remove them. The concentration of carbondioxide when this gas was present in the mixture was determined by Haldaneanalysis so that the carbon monoxide concentration in the original mixturecould be corrected for the removal of this gas. The gain of the instrumentwas set up at the beginning of each series of experiments using a standardcarbon monoxide mixture stored at high pressure in a suitably lined cylinder.
The linearity of the calibration curve of the carbon monoxide meter wasdetermined by the progressive dilution of a gas mixture containing carbonmonoxide with known amounts of oxygen. A closed circuit consisting of a6 litre capacity bell spirometer and a centrifugal pump was set up. A fractionof the gas circulating around the main circuit was passed through a silica geldrying tube, the carbon monoxide meter and thence back into the maincircuit. The gain of the cadbou monoxide meter was set up in the standardmanner and then the whole system flushed with oxygen and the bell of thespirometer emptied. Sufficient carbon monoxide was added to the circuit togive an initial carbon monoxide concentration of apFroximately 0.25',,.Oxygen was then added to the circuit in increments of approximately Poo nland the corresponding readings of the carbon monoxide meter taken.
The reciprocals of the carbon monoxide meter readings were then p!ottedagainst the corresponding incrementu of the volume of gas in the spirometercircuit. In each experiment a linear relationship was found between thereciprocal of the CO meter reading and the volume of oxygen added. Thusthe carbon monoxide meter had a linear calibration curve. A linear regressionline was calculated for each group of measurements and the average standarddeviation abtut the regression line was found to be ±o.ooo6",, CO. In twoexperiments the effect of varying oxygen-nitrogen concentrations upon thelinearity of the calibration curve of the meter was determined by washing outthe dead space of the circuit with oxygen and adding carbon monoxide,carrying out part of the dilution with oxygen and then completing it withnitrogen. It was found that varying oxygen-nitrogen concentrations in thediluting gas had no signifi,:ant effect upon the linearity of the calibrationcurve of the carbon monoxide meter.
The concentration of helium was estimated by measuring the thermal con-
52
It
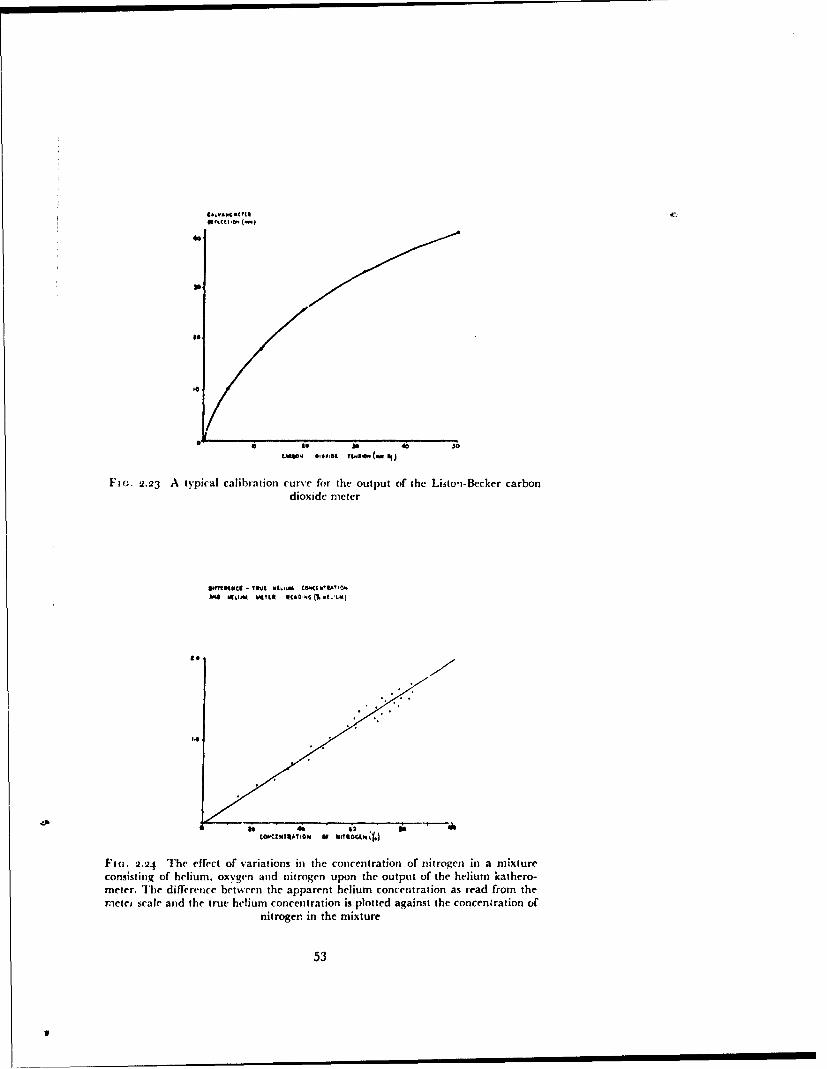
~ .0 4 ,60,4C Tt.$**(, wo
F]aG. 2.23 A typical calibration curve for the output of the Listo'i-Bccker carbondioxide meter
A%* * hu .. Lu CKOCCM IAYto
14
ltUkt"AICN Of WISc 4
1Fi(;. 2.24 The effect of variations in the concentration of nitrogen in a mixtureconsisting of helium. oxygen and nitrogen upon the output of the helium kathero-meter. The difference between the apparent helium concentration as read from thermeter scale and the true helium concentration is plotted against the concentration of
nitrogen. in the mixture
53
IU
RAISED INTRAPtULMONARY PRESSURE
ductivity of the gas mixture using a Cambridge katharometer. Since thistechnique is not specific and since the thermal conductivities of water vapourand carbon dioxide differ from that of oxygen, these gases were removed fromthe samples before pasing them through the katharometer by means of silicagel and soda lime. Since there is also a small difference in the thermal con-ductivities of oxygen and nitroge'i a standard procedure was developed anda calibration curve was constructed for the instrument to allow for changes innitrogen concentration. The instrument was adjusted to read zero whenoxygen was passed through it. The accuracy of the calibration of the instru-ment for helium in oxygen was determined by the dilution of tile helium andoxygen mixture with oxygen. The actual experimental technique used todetermine the linearity of the calibration curve of the helium katharometerwas similar to .hat employed to check the linearity of the carbon monoxideinfia-red analyzer. A closed spirometer circuit was used with a fraction of thegas pasr'ng around the main circuit passing through a katharometer. Thecircuit was washed ott with oxygen and approximately litre of this gaswas left in the spirometer. The helium katharometer was then set up to readzero. Sufficient cylinder helium was then added to give a final concentration ofthe order of 14'"o, oxygen was added in approximately 500 ml aliquots and thecorresponding helium meter readings noted. A linear relationship was foundbetween the reciprocal of the helium meter reading and the correspondingincrement in the volume of the gas in the circuit. The standard deviationabout the linear regression line calculated for the data was found to bejO.o34'.'. The dead space of the closed circuit was given by the value of the
intercept of the regression line on the volume axis.The effect of nitrogen upon the response of the helium katharometer to a
given concentration of helium was determined by using nitrogen to dilute theinitial helium in oxygen mixture in t'ie closed circtuit. The actual heliumconcentration after a given volume of nitrogen had been added was calculatedfrom the dilution of the initial helium in oxygen mixture (using the volume ofthe dead space of the circuit and the amount of gas added to it). Thus it waspossible to obtain by subtraction the difference betwen the true helium con-centration in the circuit and the reading of the helium meter. It was alsopossible to calculate the nitrogen concentration in the circuit at any givenpoint from the total volume of nitrogen added to the circuit and the initialamount of helium and oxygen added. Thus it was possible to relate thedifference between the actual helium concentration and the reading given bythe meter to the concentration of nitrogen in the circuit. The relationshipbetween these two variables was found to be a straight line (Fig. 2-24) witha slope of o.oi98";, per i",, nitrogen.Arterial Blood - When required, samples of arterial blood were withdrawnfrom the brachial artery through a Riley needle. The needle was insertedafter local analgesia had been produced by the infiltration of 2",, lignocainehydrochloride around the artery. The needle was connected by way of athree-way tap to a bottle of saline to which heparin had been added (ioooounits of heparin to 500 ml of saline). Throughout the experimental period,except when samples of arterial blood were being withdrawn, a slow streamof the heparinized saline was infused tc, maintain the patency of the intra-arterial needle. Prior to sampling the infusion was stopped and the needle and
54
EXPERIMENTAL METHODS
tap flushed with arterial blood. Each blood sample was taken into a 2o mlsyringe, the dead space of which had been previously filled with a soluticn ofheparin (500 units per ml) to which sodium fluoride had been added (7.6 ingper ml) together with a small amount of mercury. Between 16 and j8 ml ofblood was taken on each occasion and the syringe capped with a scaled hypo-dermic needle hub. The syringe was then rotated for two minutes to ensureadequate mixing of its contents and placed in a beaker containing iced water.Analyses were carried out as soon as possible, the longest time elapsingbetween sampling and analysis being two hours.
The oxygen content of each sample of blood was determined in duplicateby the manometric technique of Van Slyke and Neill using 2 ml samples. Thedifference between duplicate analyses did not exceed o.o4 volumes per cent.About 8 ml of blood was saturated with air by rotating it in a tonome:er forfifteen minutes at room temperature, air being flushed through the tonometerevery) five minutes. Where several arterial blood samples were taken in thecourse of a single experiment blood for the determination of the oxygencapacity was usually obtained by pooling the blood remaining after theanalysis of oxygen content had been performed on the separate samples.1A+7n this procedure was followcal L,,,:iiatocrit dottazniiJatioits were made oneach sample and on the pooled sample used for the estimation of oxygencapacity in order that the effect of any change in red cell concentration couldbe corrected. Duplicate analyses of the oxygen content of the saturated bloodwere performed using the manometric technique. The oxygen capacity wascalculated from the oxygen content of the saturated blood by subtracting theconcentration of oxygen in physical solution using the partial pressure ofoxygen in the air with which it was equilibrated and the data obtained bySendroy, Dillon and Van Slyke (1934) (261).
The concentration of physically dissolved oxygen in each arterial samplewas obtained by calculating the approximate percentage saturation from theoxygen content of the sample and the oxygen capacity of thc blood. The corre-sponding oxygen tension was determined from a standard oxygen dissociationcurve (74) and the concentration of the physically dissolved oxygen calcu-lated. The true oxygen saturation of the sample was then calculated from itsoxygen content, corrected for the physically dissolved oxygen and the oxygencapacity of the blood. The concentration of hydrogen ions in a blood samplewas measured by means of a glass electrode-calomel half-cell system at atemperature of 3 8'C. The measurements were made anaerobically in theapparatus designed by Astrup (1957) (1 i), the temperature ofwhich was heldconstant at 38 ± 0.1°1C. Preliminary experiments showed that when 2 ml ofblood at room temperature .;,-as placed in the measuring chamber the tem-perature ofthe blood and the water in thejacket were equal after four min ites.In all the subsequent measurements four minut,:s -',as allowed to elapsebetween the introduction of a sample into the measuring chamber and thereading of its pH.
The pH meter (Radiometer Type 4) was used to measure the potentialdifference between the glass electrode and the calomel cell, all readings beingmade in millivolts. The relationship between pH and the output of the cellwas determined daily using three standard buffers, viz. o.o5 M potassiumhydrogen phthallate, the pH ofwhich was taken to be 4.025 at 38'C; 0.025 N1
55
S SiI!I
RAISED INTRAPULMO'VARY PRESSURE
disodium hydrogen phosphate and 0.025 M potassium dihydrogen phosphate,the pH of which was taken to be 6.83f at 38C and 0.05 M tetraboratedecahydrate, the pH ofwhich was taken to be 9.085 at 38C. A linear relation-ship was obtained between the output of the cell (millivolts) and the pH of
these buffers. A fourth buffer of the Sorensen type was prepared (200 ml M15
potassium dihydrogen phosphate and 8oo ml - disodium hydrogen phos-15
phate) and the pH of this was determined daily using the three standardbuffers. This buffer, which had a mean pH of 7.360 at 38 C, was used tostandardize the pH meter during measurements of the pH of the bloodsamples.
After the output of the pH meter had been standardized using the pH7.360 buff r the measuring chamber was washed thomnoghly with distilledwater. The syringe containing the blood sample was removed from the icedwater and -.llowcd to remain at room temperature for five minutes, duringwhich time it was roated (fifteen times per minute) by an electric motor soas to ensure that its contents were thoro',ghly mixed. The sealing cap was thenremoved from the syringe and replaced by a short piece of rubber tubingwhich covered the tip of the syringe. About 2 ml of blood was then introducedanaerobically into the measuring chamber and after four minutes its pH wasmeasured. After washing out the blood a further volume of the pH 7.360buffer was placed in the measuring chamber and the output of the cell wasmeasured. Thus the measurement of the pH of each sample of blood wasbracketed by a pair of measurements of the pH of the buffer. It was possible,therefore, to deduce w.-hether any change had occurred in the output/pHratio of the glass electrode-calomel cell. The reproducibility of the pHmeasurements was determined by carrying out a series of six consecutivemeasurements of the pH of a single blood sample. A variation of ±o.oo2 unitwas found.
When required the carbon dioxide tension of an arterial blood sample wasmeasured by the interpolation technique developed by Astrup (1957) (1 1.This consists of measuring the pH of the blood sample and determining therelationship between carbon dioxide tension and pH for the pl-ma separate"from the blood sample. The arterial sample was divided into two portions andthe pH of one portion determined anaerobically as described above. Theremainder of the sample was introduced anaerobically into a small centrifugetube (capacity 8 ml) beneath a layer of liquid paraffin. Sufficient of the bloodsample was delivered into this tube to displace all but a thin layer (0.3 cm) ofthe liquid paraffin. A rubber bung was then fitted to the centrifuge tube. Inorder to allow any trapped air and excess liqtuid paraffin to escape a hypo-dermic needle was placed through the hung before it was inserted into thetube. The needle was removed after the bung was in position. The tube andits contents were then centrifuged at 2ooo r.p.m. for fifteen minutes at roomtemperature, when complete -ieparation of the plasma occurred.
The plasma was removed and placed in the measuring chamber of the pHmeter together with one drop of octanol to avoid foaming. The plasma wasthen equilibrated with a known tenm;nn of carhbn dioxide by bubbling aIemadifi,.' gas inix,aic containing .,pp'Oxiudatcly 5.5',0 carbon dioxide in
56
EXPERIMENTAl. METHODS
oxygen through the plasma in the measuring chamber for six minutes. Thecarbon dioxide-oxygen mixture was stored at high pressure in a cylinder andits composition was determined once a week by analysis in the Haldaneapparatus. The pH of the plasma was then measured. The plasma was furtherequilibrated with a gas mixture containing approximately '2.5",, carbondioxide in oxygen and the corresponding pH value determined. The twopairs of values relating carbon dioxide tension and pH for each sample ofplasma were plotted on semi-logarithmic paper (logn, PCO,2 against plH) andthe two points joined by a straight line (44). The tension of carbons dioxidein the original blood sample was then obtained by reading the carbon dioxidetension corresponding to the pH value of the blood sample from this stiaightline.
The accuracy of this method of measuring the tension of carbon dioxide inblood was determined by equilibrating samples of venous blood with variousgas mixtures containing known tensions ofcarbon dioxide and then measuringthe tension of the carbon dioxide of the blood in the manner described in theprevious paragraphs. Venous blood to which heparin had been added wasplaced in a tonometer containing a mixture of carbon dioxide and oxygenand the gas and blood equilibrated by rotation of the tonometer in a waterbath at 38 -- o.1 C. After thirty minutes the blood was transferred into asyringe, the dead space of which had been filled with mercury and hcparinsolution. The carbon dioxide tension of -he blood was then measured by thcmodified Astrup technique. The concentration of carbon dioxide in the gasphase in the tonometer was determined by analysis by the Haldane tech-nique. Care was taken during the equilibration period to ensure that the totalgas pressure within the tononieter equalled atmospheric pressure. The rela-tionship betwseen the carbon dioxide tension of the gas phase and the measuredtension of carbon dioxide in the corresponding blood sample is shown inFig. 2 -25. The values lie closely along the line of perfect correlation. Themean error of to determinations was a blood carbon dioxide tension 0.17mmHg greater than that of the gas. The standard error around this meanerror was ±0o.95 mmHg. Thus there was no significant bias in the differencebetween the measured carbon dioxide tension and the carbon dioxide tensionin the gas in equilibrium with the blood.
CARDIOVASCIUI.AR TECHNIQUES
Intravascular presure - Arterial and venous pressures were obtained bydirect measurement using a strain gauge pressure transducer (Statham TypeP.23Gb), an appropriate amplifier and a galvanometer photographicrecorder. Arterial puncture was performed with a Riley needle as describedpreviously for the collection of samples of bloo,4. Venipuncture was performedafter the local infiltration of 2"i, lignocaine using a 20 S.W.G. hypodermicneedle. The lumnen of the needle was then connected by means of a poly-ethylene cannula (internal diameter 0.5 mm) to one arm of a two-way tapwhich was also connected to the pressure transducer. The other arm of thefluid-containing head of the pressure transducer was connected through asecond two-way tap to a fine adjustable needle valve. A bottle of sterile:.,)rmal saline containing 2000 units of heparin per ioo ml was attached tothe inlet of the needle valve. The pressure in the saline reservoir was raised to
57
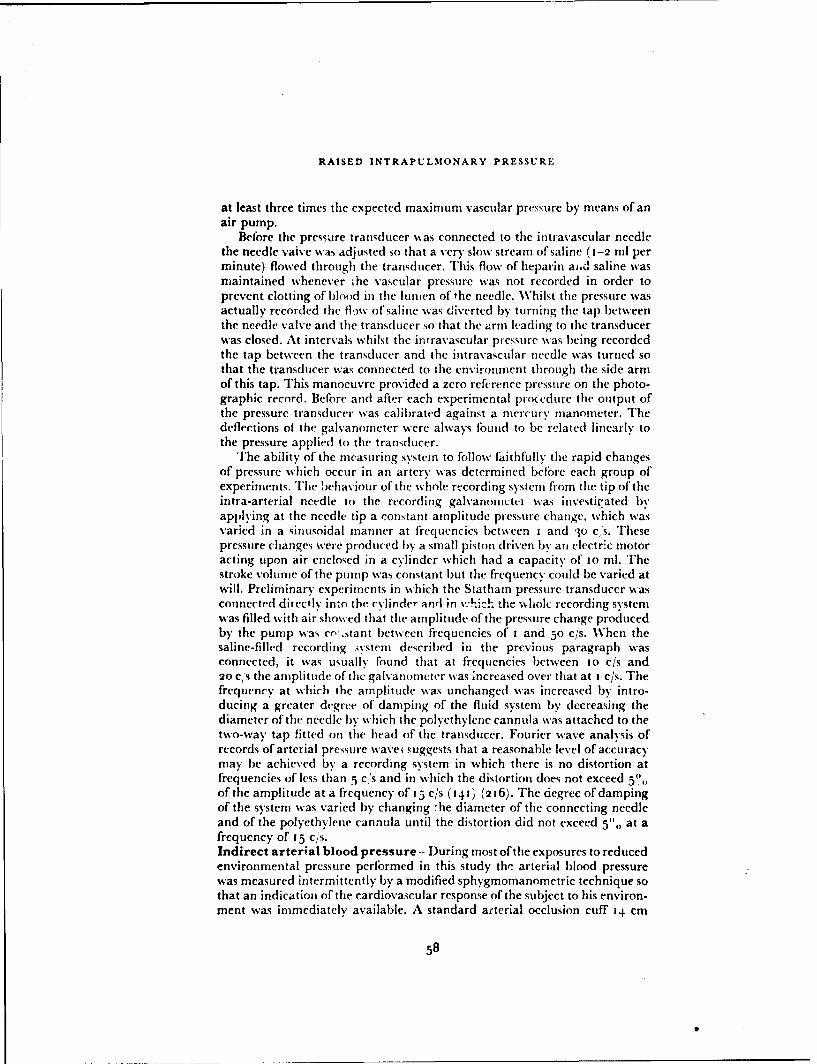
RAISED INTRAPULMONARY PRESSURE
at least three times the expected maximum vascular pressure by means of anair pump.
Before the pressure transducer was connected to the intravascular needlethe needle valve was adjusted so that a very slow stream of saline (1-2 ml perminute) flowed through the transducer. This flow of heparin aid saline wasmaintained whenever ihe vascular pressure was not recorded in order toprevent clotting of blood in the lumen of the needle. Whilst the pressure wasactually recorded the fl)%% of saline was diverted by turning the tap betweenthe needle valve and the transducer so that the arm lkading to the transducerwas closed. At intervals whilst the intravascular pressure was being recordedthe tap between the transducer and the intravascular needle was turned sothat the transducer was connected to the environment through the side armof this tap. This manoeuvre provided a zero reference pressure on the photo-graphic record. Before and after each experimental prodedure the output ofthe pressure transducer was calibrated against a mercury manometer. Thedeflections ot the galvanometer were always found to be related linearly tothe pressure applied to the transducer.
The ability of the measuring system to follow faithfully the rapid changesof pressure which occur in an artery was determined before each group ofexperiments. The behaviour of the whole recording system froom the tip of theintra-arterial needle to the recording galvanonictci was investigated byapplying at the needle tip a constant amplitude pressure change, which wasvaried in a sinusoidal manner at frequencies between i and 3o cs. Thesepressure changes were produced by a small piston driven by an electric motoracting upon air enclosed in a cylinder which had a capacity of to ml. Thestroke volume of the pump was constant but the frequency could be varied atwill. Preliminary experiments in which tile Statham pressure transducer wasconnected directly into the cylinder atdrl in v•.'ich the %hiolc recording systemwas filled with air showed that tile amplitude of the pressure change producedby the pump was cn'.stant between frequencies of I and 50 c/s. When thesaline-filled recording .ystem described in the previous paragraph wasconnected, it was usually found that at frequencies between 1o c/s and20 Ci's the amplitude of the galvanometer was increased over that at I c/s. Thefrequency at which the amplitude was unchanged was increased by intro-ducing a greater degree of damping of the fluid system by decreasing thediameter of the needle by which the polyethylene cannula was attached to thetwo-way tap fitted on the head of the transducer. Fourier wave analysis ofrecords of arterial pressure wavei suggests that a reasonable level of accuracymay be achieved by a recording system in which there is no distortion atfrequencies of less titan 5 c's and in which the distortion does not exceed 5of the amplitude at a frequency of 13 c/s (141) (216). The degree ofdampingof the system was varied by changing -he diameter of the connecting needleand of the polyethylene cannula until the distortion did not exceed 5",, at afrequency of 15 c/s.Indirect arterial blood pressure -- During most of the exposures to reducedenvironmental pressure performed in this study the arterial blood pressurewas measured intermittently by a modified sphygmomanometric technique sothat an indication of the cardiovascular response of the subject to his environ-ment was immediately available. A standard arterial occlusion cuff 14 cm
58
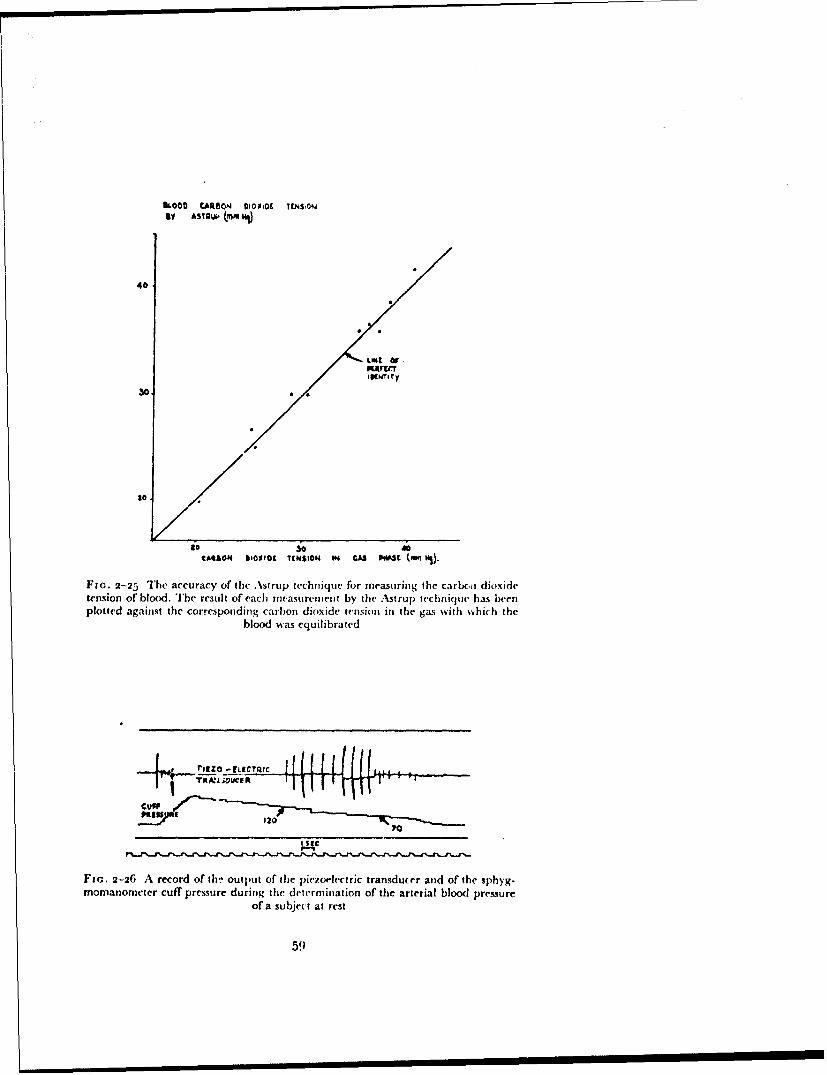
KOCO tARtSON 010010t TWýON61 AS1AWU (MM10l)
40
IKNIK~Ty
300
to il00
tARSOM 61o0o0C TENSIOM iM GAS iWSC (,• WS).
FIG. 2-25 The accuracy of the L'strup technique for measuring the carbc, ) dioxidetension of blood. The result of each mcasurement by the Astrup technique has beenplotted against the corresponding carbon dioxide tension in the gas with which the
blood was equilibrated
+rrINZO____ICQI920 V.. 02
Ftc. 2-26 A record of th- output of the piezoelectric transducer and of the sphyg-momanometer cuff pressure during the determination of the arterial blood pressure
of a subject at rest
51)
RAISED INTRAPULMONARY PRESSURE
wide was placed around the upper arm. The movements of the wall of thebrachiial artery beneath the cuff were detected by means of a piezoelectrictransducer attached to the inner surface of the cuff3 cm from its lower border.The transducer consisted of a flexible diaphragm, the movement of whichdeformed a piezoelectric crystal (I cm " I cm X 0.2 cm) mounted within asmall housing, one side of which was the flexible diaphragm. The position ofthe brachial artery was detected by palpation and the cuff was positionedso that the piezoelectric transducer lay directly over the artery. The outputof the piezoelectric crystal was amplified and fed on to one pen of a four-channel d~rect writing paper recorder.
The pressure in the cuff was recorded by means of a metrury manometerinto which a series of platinum wire contacts had been introduced at to mmintervals. Each contact was connected by a resistor to its neighbour and apotential of 90 volts was placed across the whole lenigth of the column. Asthe cuff pressure increased the mercury in the ma'iometer rose and reducedthe total resistance of the series of resistances. The current which passedthrough the circuit was recorded on a second pen of the direct ink writer. Therecord produced by this system consisted of a series of steps each of whichrepresented a change of pressure of io mmHg. The pressure in the cuff wasraised every thirty seconds to a level about 50 mmHg greater than theexpected systolic pressure. The air in the cuff was then allowed to escape sothat the p.-essure in it fell at a constant rate of about 5 mmHg'sec. until thepressure was less thian the diastolic value. As the pressure in the cuff fell thepiezoelectric transducer generated a signal with each cardiac cycle, theam:iplitude of which increased progressively until suddenly the signal virtuallydis.xppeared (Fig. 2-26).
"imultaneous records of intra-arterial pressure and of the output of thepiezt'electric transducer showed that the cuff pressure was equal to thesystolic pressure at the point at which the first signal was generated bythe transducer. The pressure in the cuff equalled the diastolic pressure at thepoint at which the amplitude of the signal suddenly decreased. Direct com-parisons of the values of the arterial blood pressure given by this indirecttechnique with those obtained by intravascular recording at rest and duringpressure breathing showed that the indirect method gave values for bothsystolic and diastolic pressur,'s which were within ±3 mmHg of the directlydetermined values.Limb Volume - The volumes of various segments of the limbs weremeasured during pressure breathing with water-filled plethysmographs. Theseexperiments were performed in a draught free room, the temperature ofwhichlay between 2o and 22 C. The subject, wearing the appropriate pressureclothing, was seated in a standard ejection seat. The straps of the seat harnesswere tightened firmly so as to reduce to a minimum the movement of thesubject's limbs when his pressure clothing was inflated and deflated. Handand thicarm volumes were measured with simple metal plethysmographs.The hand was enclosed in a loose-fitting surgical glove, the wrist portion ofwhich had been cemented to a thick rubber diaphragm, which fitted snuglyaround the wrist (168). This rubber diaphragm was secured to the end of theplethysmograph together with a metal supporting plate by means of wingnuts. When the forearm volume was to be measured two rubber diaphragms
6o
-........ . . .. .... . . . . ,- -
EXPERIMENTAL METHODS
were cut so that they fitted snugly around the upper and lower forearmrespectively. The edges of these diaphragms were joined by a sleeve of verythin rubber (125). This sleeve loosely covered the forearm withi-n the plethys-mograph. The diaphragms were supported in position by means of metalplates which also conformed to the shape of the forearm.
Care was taken to ensure that there was no actual constriction of the limbby the diaphragms or supporting plates. Each upper limb p!ethysmographwas placed so that the mid-plane of the segment lay t5 cm vertically belowthe sternal angle. Changes of thigh and calf volume were recorded by meansof similar plethysmographs in which thin rubber sleevcs separated the limbsegment from the water in the plethysmograph. The lower limb in whichmeasurements were made was supported in the horizontal position by meansof wide webbing straps which passed behind the knee and ankle. The plethys-mograph was suspended by adjustable cords from the ceiling of the laboratoryso that it was free to move with the limb when the pressure clothing wasinflated and deflated (2o).
When the plethysmograph had been fitted to the limb it was filled withwater until the air-water interface lay in the lower part of the cylinder (3 cmin diameter) which was attached to the top of the plethysmograph. The upperend of the cylinder was open to the atmosphere. The temperature of the waterwithin the hand plethysmograph was held at 32 + o.5CC whilst that of thewater in the forearm and lower limb plethysinographs was held at 34 ± o.5 "Cby intermittent heating (21). 1 he change in the water level produced by achange of limb volume was recorded by means of a pair of vertical concentricelectrodes inserted in the cylinder at the top of the plethysmograph (67).Changes in the impedance between the electrodes produced by alterations ofthe water level were recorded by means of a carrier-wave bridge amplifier,the output of which was fed on to a galvanometer ofa ph -tographic recorder.The volume recorded was calibrated by adding known volumes of water tothe plethysmograph. The volume of the segment enclosed within the plethys-mograph was measured after each experiment either by water displacementinto the case of the upper limb or from the physical dimeiisions of the part inthe case of the lower limb segments.
61

CHAPTER 3
LIMITATIONS OF VARIOUS TECHNIQUESOF DELIVERING GAS UNDER PRESSURE
TO THE RESPIRATORY TRACT
INTRODUCTION
Gas may be delivered to the respiratory tract at a pressure greater thanthat of the immediate environment by means of a mouthpiece alone providedthat the nose is closed with a suitable clip. W,'hilst this is the simplest method,it is generally impractical since severe discomfort :apidly occurs in the cheekseven at pressures as low as 20 mmHg. Further, at higher pressures the lipscannot be held against the mouthpiece and gas is lost through gaps betweenthe mouthpiece and the lips. In pract&:e the minimum acceptable standardfor delivering gas under pressure is provided by a mask which covers theanterior part of the cheeks in addition to the mouth and nose (I i9). With asuitably designed oronasal mask (for example, the R.A.F. Type P mask) it ispossible to deliver gas at positive breathing pressures of up to too mmHgwithout leakage of gas. With this equi- ment, however, no external support isapplied to the eyes, to the external ear, to the floor of the mouth or to the neckduring pressure breathing and disturbances of function arise in these regions.
The majority of these disturbances may be overcome by the use of apressure headpiece designed to a,. ply external support to the head and neck.All the pressure headpieces so far developed, however, have certain dis-advantages when considered broadly as pieces of flying clothing. As comparedwith the simplicity of a pressure-sealing oron;sal mask the weight, bulk andvisual restrictiouz of a pressure headpiece cannot but reduce the efficiency ofthe wearer during dight. The local functional disturbances induced bypressure breathing with an oronasal mask were studied, therefore, in order toassess the limitations in terms of breathing pressure and duration of expcsureof this method of supplying gas under pressure to the respiratory tract.
GENERAL INVESTIGATION OF DISTURBANCES INDUCED IN THE HEAD
AND NECK BY PRESSURE BREATHING WITH AN ORONASAL MASK
The type and incidence of the disturbances induced in the head and neckby pressure breathing with an oronasal mask were determined by exposing agroup comprising four medical officers and sixteen aircrew to various breath-ing pressures. All the subjects had previous experience of pressire breathingat pressures of up to 8o mmHg using a pressure headpiece and a pressurejerkin. The experiments were performed at ground level. Each subject wasclothed in a pressure jerkin and anti-g suit and fitted with a Type P oronasalmask. He was then exposed to pressure breathing for two minutes on fouroccasions, separated one from anotler by rest periods of five minutes dura-tion. The positive breathing pressures emsployed were 40, 5o, 6o and 70 mmHgand the order of the exposures was randomized. The amount of leakage of air
63

RAISED INTRAPULMONARY PRESSURE
past the seal of the mask was detcrmined during each exposure and if thisexceeded 5 litre/min. or if gas flowed between the edge of the mask and thenose into the eyes, the exposure was discontinued and repeated after adjust-ment of the fit of the mask. Before and after each period of pressure breathingthe conjunctivae and the tympanic membranes were inspected. Any changesin the head and neck induced by the procedure were recorded and after eachexposure the subject was asked to describe his symptoms. In addition, theaircrew subjects were asked for their opinion as to the acceptability of theequipment as an emergency pressure breathing system under the conditionslikely to be experienced following failure of the pressure cabin of an aeroplaneflying at high altitude.Results - All the twenty subjects accepted pressure breathing for twominutes at positive breathing pressures of up to 6o mmHg. The majority ofthe subjects, however, reported some discomfort during pressure breathing,especially at a pressure of 6o mmHg. At a positive breathing pressure of70 mmHg severe discomfort and pain occurred in some of the subjects. Theincidence of the various disturbances reported by the subjects is shown inTable 3-1.
TABLE 3-1
INCIDENCE OF SUBJECTIVE DISTURBANCES
INDUCED BY PRESSURE BREATHING
WITH AN ORONASAL MASK FOR 2 MINUTES
Number of subjects affectedfrom a group of 2o
40 mmHg 50 mmHg 6o mmHg 70 mmHg
Eyes(i) Open nasolacrimal ducts 0 2 4 7
(ii) Blepharospasm 0 2 3 5(iii) Impaired vision o 1 1 2
(iv) Suffusion of the o 2 7conjunctivae
Neck(i) Swelling 5 18 19 19(ii) Discomfort 1 1 6 155
Ears(i) Discomfort o o 1
The commonest disturbances were related to the eyes, to the neckand to the floor of the mouth. At the higher positive breathing pressures thenasolacrimal ducts opened in some subjects and gas passed up the ductsthrough the lacrimal canaliculi into the conjunctival sacs. In these subjectsthe lacrimal secretions rapidly overflowed the lower lids and rolled down thecheeks. The stream of gas passing up the lacrimal ducts was associated withspasm of the eyelids which in one subject interferred with vision.
64
.0II -, -__ _.....____ __ ___ __
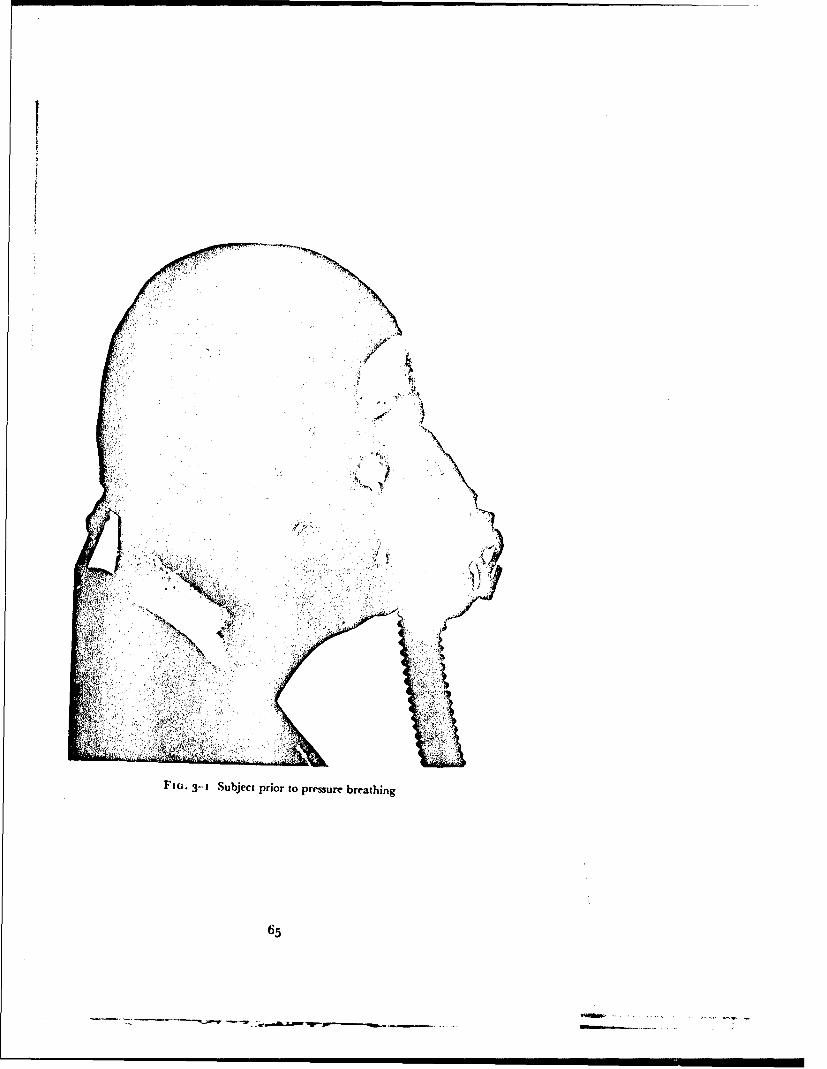
I
ii
;'*N
4,, I
N
r -� AIA
1.ij I
Fio. � Subject prior to pressure breathing
65

FIn- 3-2 Neck distension during pressure breathing at 70 mimHg pressure
66
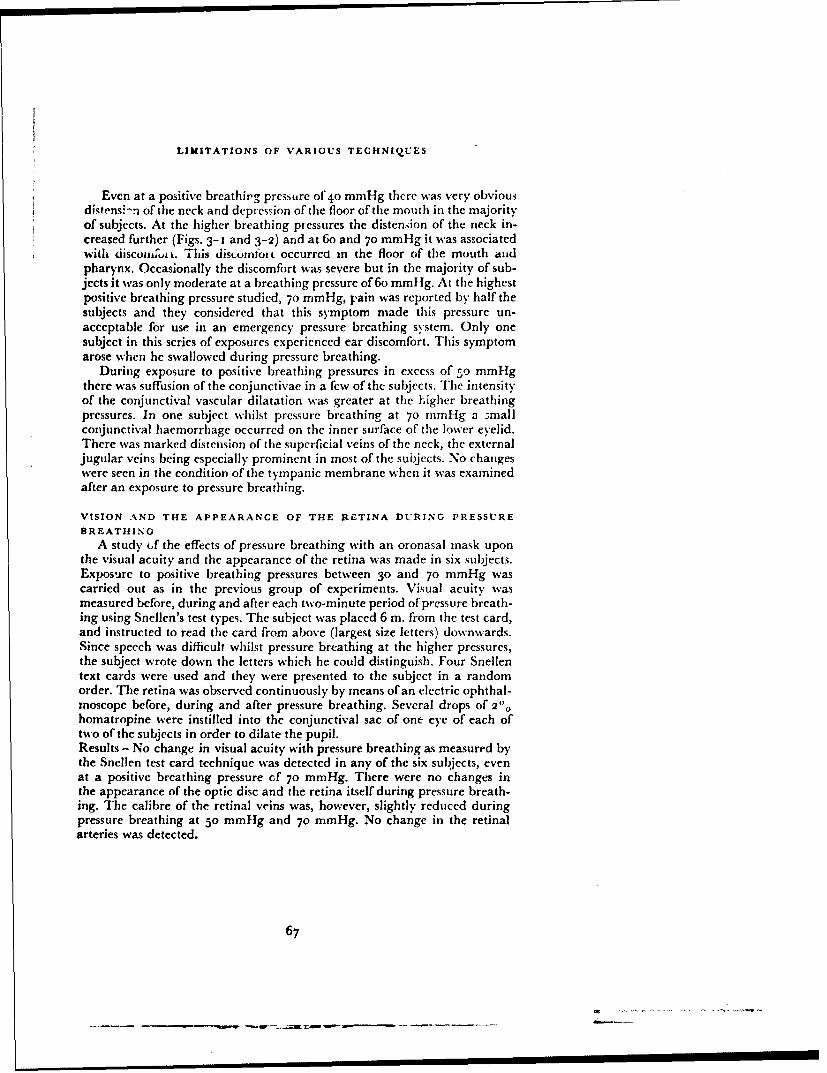
LIMITATIONS OF VARIOUS TECHNIQUES
Even at a positive breathirg pressure of'4o mmHg there was very obviousdiotrnsi-n of the neck and depression of the floor of the mouth in the majorityof subjects. At the higher breathing pressures the distension of the neck in-creased further (Figs. 3-I and 3-2) and at 6o and 70 mmHg it was associatedwith disconX,,it. This distL onfoi occurrect in the floor of the mouth andpharynx. Occasionally the discomfort was severe but in the majority of sub-jects it was only moderate at a breathing pressure of 6o mmHg. At tile highestpositive breathing pressure studied, 70 mmHg, pain was reported by half thesubjects and they considered that this symptom made this pressure un-acceptable for use in an emergency pressure breathing system. Only onesubject in this series of exposures experienced ear discomfort. This symptomarose when he swallowed during pressure breathing.
During exposure to positive breathing pressures in excess of 5o mmHgthere was suffusion of the conjunctivae in a few of the subjects. The intensityof the conjunctival vascular dilatation was greater at the higher breathingpressures. In one subject whilst pressure breathing at 70 mmHg a smallconjunctival haemorrhage occurred on the inner surface of the lower eyelid.There was marked distension of the superficial veins of the neck, the externaljugular veins being especially prominent in most of the subjects. No changeswere seen in the condition of the tympanic membrane when it was examinedafter an exposure to pressure breathing.
VISION AND THE APPEARANCE OF THE RETINA DURING PRESSURE
BREATHING
A study ,f the effects of pressure breathing with an oronasal mask uponthe visual acuity and the appearance of the retina was made in six subjects.Exposure to positive breathing pressures between 30 and 70 mmHg wascarried out as in the previous group of experiments. Visual acuity wasmeasured before, during and after each two-minute period of pressure breath-ing using Snellen's test types. The subject was placed 6 m. from the test card,and instructed to read the card from above (largest size letters) downwards.Since speech was difficult whilst pressure breathing at the higher pressures,the subject wrote down the letters which he could distinguish. Four Snellentext cards were used and they were presented to the subject in a randomorder. The retina was observed continuously by means of an electric ophthal-moscope berore, during and after pressure breathing. Several drops of 2",homatropine were instilled into the conjunctival sac of one eye of each oftwo of the subjects in order to dilate the pupil.Results - No change in visual acuity with pressure breathing as measured bythe Snellen test card technique was detected in any of the six subjects, evenat a positive breathing pressure Gf 70 mmHg. There were no changes inthe appearance of the optic disc and the retina itself during pressure breath-ing. The calibre of the retinal veins was, however, slightly reduced duringpressure breathing at 50 mmtlg and 70 mmHg. No change in the retinalarteries was detected.
67
,W ý - MAW J tI I I

RAISED INTRAPULMONARY PRES3URE
DISTENSION OF THE UPPER RESPIRATORY TRACT DURING PRESSURE
BREATHING
The changes underlying the distension of the neck produced by pressurebreathing with an oronasal mask were investigated b-' radiography and bymeasurement of the respiratory dead space.Radiographic Studies - Lateral and antero-posterior radiographs weretaken of the head and neck of two subjects. The radiographs were taken withthe subjects sitting at rest and wl,i'st presture hreathing at positive breathingpressures between 30 mmHg and 1oo mmHg using an oronasal mask and apressure jerkin. The distance between the X-ray tube and the film cassettewas held constant throughout this study. In order to calibrate the radiographsso that various dimensions could be measured, a radiograph was taken of alead bar notched at 2 cm intervals held in the same plane as that in which thesubject's head was placed for the radiographic studies.Results - The most striking feature of the radiographs taken during pressurebreathing was the gross distension of the upper resphatory passages (Fig.3-3). The mouth cavity and the lower pharynx shared in this distension.The cervical portion of the oseophagus which contained no air in the controlradiographs was markedly distended with air in the radiographs taken duringpressute breathing. The antero-pmsterior radiographs show that there wasalso gross lateral distension of the pharyiiý. There was virtually no dilatationof the trachea. The anteroposterior dimensions of the nasopharynx, thehypopharynx, the cervical oesophagus and the trachca have been measuredat the levels depicted in Fig. 3-4, from the radiographs taken with the subjectat rest and during pressure breathing. The relationships between thesedimensions and the positive breathing pressure for one subject are shownin Fig. 3-5. The shape of the curves in this figure show that the disten-sibility of the pharynx and oesophagus is greatest at the lower breathingpressures and that there is little further increase in the antero-posteriordimensions of these cavities at positive breathing pressures in excess of50 mmHg.Respiratory Dead Space - The volume of the dead space was measuredby the technique developed by Fowler (1948) (It I) in which the instantane-ous concentratiot, of nitrogen in the expired gas is measured following abreath of oxygen. The sampling needle valve of the Lundin-Akesson nitrogenmeter was fitted directly into the mouthpiece through which the subjectbreathed, whilst the nose was closed with a clip. A Fleisch flowmeter wasattached directly beyond the sampling tube and a two-way tap was attachedto the distal end of the flowmeter. One arm of this tap was open to theatmosphere and the other was connected to a bell spirometer. Before theapparatus was attached to the subject the spirometer and connecting tubingwere filled with oxygen. The subject breathed atmospheric air to and frothrough the mouthpiece, the attached sampling valve and the flowmeter.At the end of a normal txsp:ration he turned the tap and inspired one litre ofoxygen from the spirometer. At the end of inspiration he held his breath forone second, during which the tap was turnedI so that the mouthpiece waw.opened to the atmosphere. The subject then breathed out in the normalmanner. The two subjects used in this experiment had had previous experi-ence of respiratory manoeuvres and were instructed to maintain the same
68
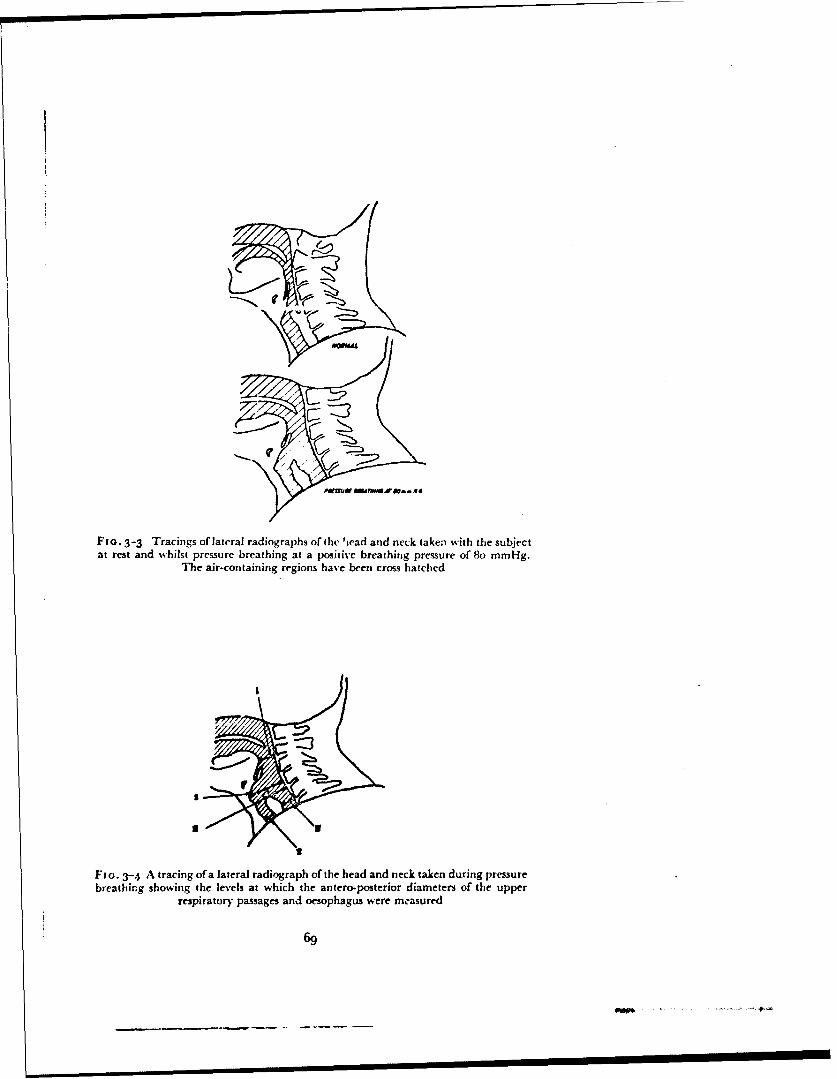
Fio. 3-3 Tracings of lateral radiographs of the 'icad and neck taken with the subjectat rest and whilst pressure breathing at a positive breathing pressure of 8o mmHg.
The air-containing regions have been cross hatched
33
Fio. 3-4 A tracing of a lateral radiograph of the head and neck taken during pressurebreathing showing the levels at which the antero-posterior diameters of the upper
respiratory passages and oesophagus were mcasured
69
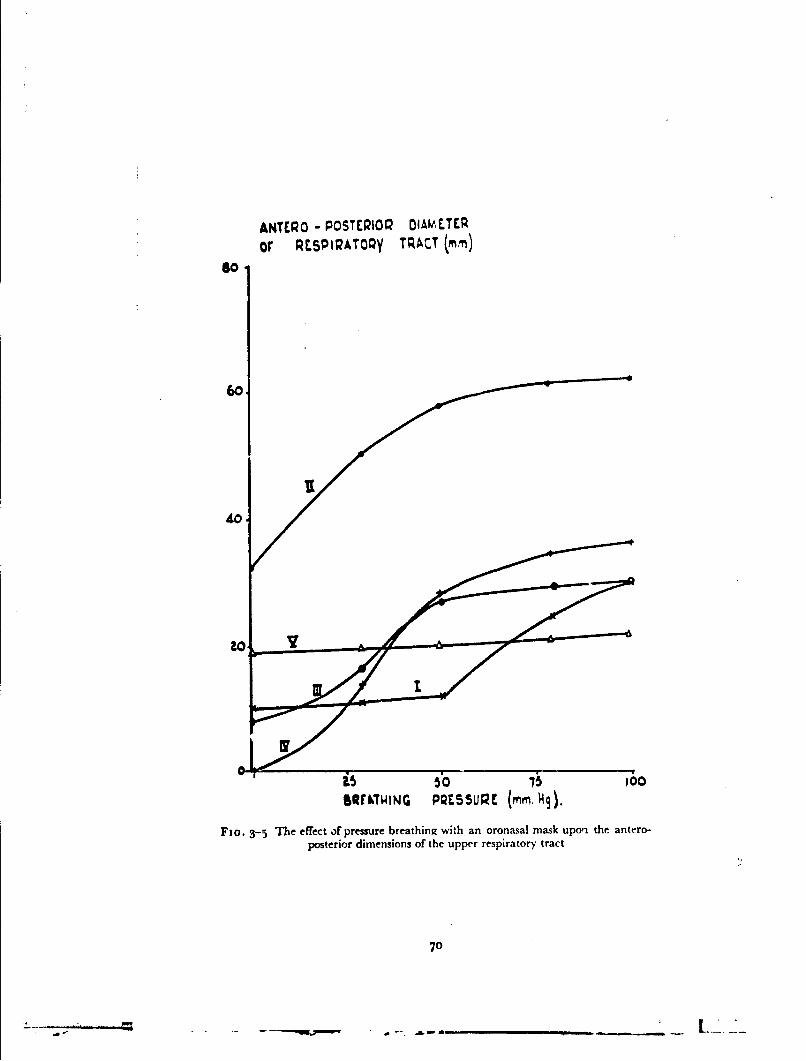
ANTER0 - POSTERI0Q DIAMELTER
or RESPIRAT00y TRACT (m
60,
40 -/ 0
0. 5,0 ico1WOW~TING PRESSURE (mmr. kq).
Fta. 3-5 The effect of pressure breathing with an oronasal mask upori the~ antero-posterior dimensions of the upper respiratory tract
70

LIMITATIONS OF VARIOUS TECHNIQUES
breathing pattern during each expiration. At least two minutes were allowedto elapse between each measurement of the respiratory dead space.
In order to assess the accuracy with which an increase in the respiratorydead space could be measured with this technique, a preliminary investiga-tion was performed. Various lengths of 2.0 cm bore hose with a smoothinternal wall were interposed between the subject's mouth and the needlevalve of the nitrogen meter. Measurements of the overall dead space weremade in exactly the manner described in the previous paragraph. The volumeof each length of hose interposed between the subject's mouth and the needlevalve was measured by water displacement.
The volume of the dead space was measured during pressure breathingwith an oronasal mask and a pressure jerkin at positive breathing pressures ofup to 6o mmHg. The oronasal mask was modified by incorporating theneedle valve of the nitrogen meter in a short tube fitted to the entrance 0othe expiratory valve within the mask cavity. A Fleisch flowmeter w,'s fittedin the outlet of the mask beyond the expiratory compensated valve. In orderthat a spirometer could be used to supply a known volume of oxygen, theseexperiments were performed with the subject seated in the decompressionchamber. The spirometer filled with oxygen was mounted outside tie chamberand the hose from it was passed through the chamber wall to one arm of a two-way tap fixed in the inspiratory port of the u• cnasal mask. The third arm of thetap was connected through the wall of the chamber to the external atmos-phere. Pressure breathing was induced by reducing the pressure within thedecompression chamber by the desired value. The respiratory dead spacewas measured in the same general manner as in the previous experiments.After pressure in the mask had stabilized the tap was turned and the subjectinspired t litre of oxygen from the spirometer. The concentration of nitrogenand expired gas flow were recorded during the subsequent expiration.
The effect of a distending pressure within the upper respiratory tract uponthe respiratory dead space was also studied by reducing the pressure in aperspex Lox enclosing the neck. This box (Fig. 3-6) encircled the neck andwas sealed at its upper end against the skin along the mento-suboccipital dia-meter. The lower edge of the box was sealed against the skin lying ovr.: theupper part of the chest anteriorly and pesteriorly and just medial to theshoulder joints laterally. The box was connected via a two-way tap to a largecapacity reservoir, in which the pressure was maintained at known sub-atmospheric levels. The pressure within the perspex box was measured bymeans of a "U" mercury manometer. The capacity of the exhaust pumpacting on the reservoir and the volume of the reservoir were such that thepressure within the perspex box was maintained at the required level belowatmospheric despite small leakages of air inwards past the rubber seals.Subatmospheric pressures of up to 8o mmHg were applied to the neck. Aftera given subatmospheric pressure had been applied for thirty seconds therespiratory dead spacce was measured and then the pressure within the boxwas returned to atmospheric.Results - A typical experimental record is reproduced in Fig. 3-7, showingthe instantaneous concentration of nitrogen and the respiratory flow patternduring and following a single inspiration of oxygen. The volume of the deadspace was estimated from such experimental records by the technique
7'
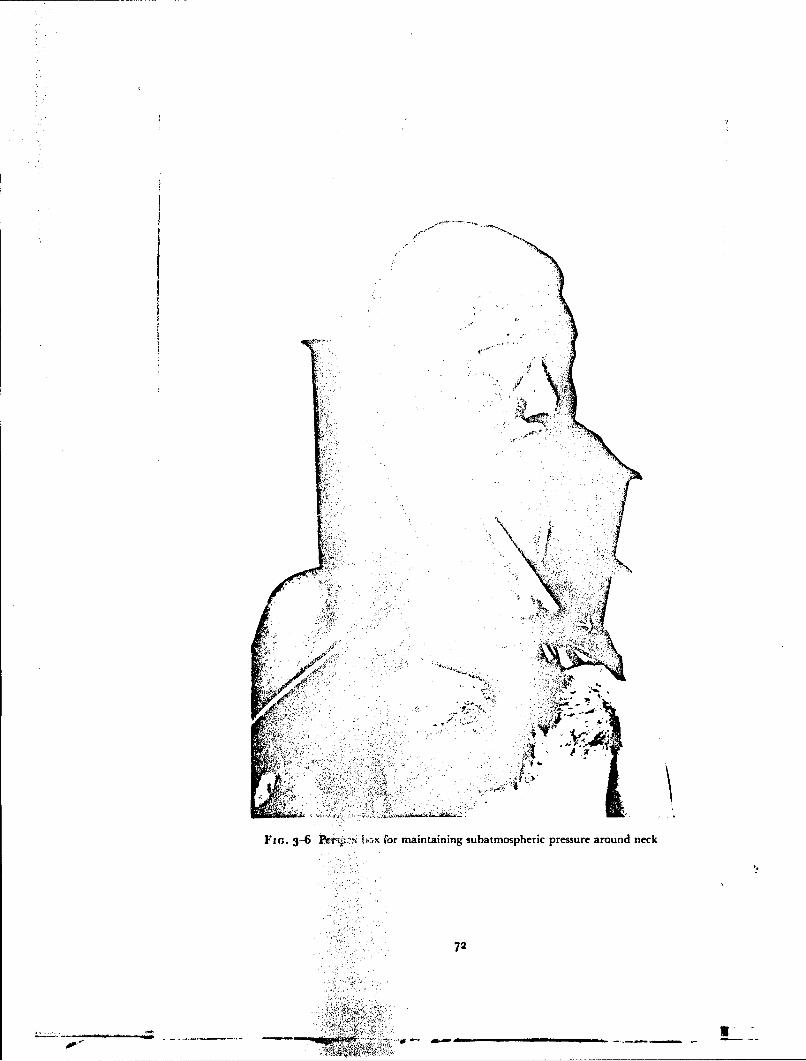
I
, . . 2
S ff2.5 , % .,-,. •

I LA 46
EX PIRATOVRV
- .- -.. ... -
I SE
Fi (;. 3-7 The determination of the respiratory dead space. Records of the respiratoryflow. and of the concentration of nitrogen in the expired gas following a single inspira-
tion of oxygen
too TOTAL DEAD SPACE(Li)
400
0 100 600ADDED DEAD SOWC jmQ
FIG- 3-8 The effect or introducing various lengths of smooth bore hose of knownvolume between the lips and the sampling valve of the nitrogen meter upon the
measured total respiratory dead space
73

Kt•,AAo~y DtAO 5•ACC (-tl
300
to * 0 60* 0
* S
POSITIt BlrEATWIlNG P;ESSUDr- (rAM M9 )
Fio. 3--9 The effect of pressure breathing with an orona~sal mask and pressure jerkinupon the respiratory dead space in two subjects
40C DESf1QA!OQY CIA-' SPACEI-,)
300
400
0 A
SvCTAON TO NtEC(" 14).
FIG. 3-No The effect of the application of various sub-atmospheric pressures to thesurface of the neck upot, the volume of the respiratory dead space in two subjects
74
_____ _____ ____. ..._
LIMITATIONS OF VARIOUS TECHNIQUES
described by Fowler (I I I). A vertical line was drawn on the recorded nitrogenconcentration curve at the point at which it was risirg rapidly so that the areasA and B (Fig. 3-7) were equal. A squared transparent ruler was used for thisestimation. The lag of the nitrogen meter response behind that of the flow-meter which was determined at the end of each series of measurements (meano.o8 see.) was subtracted from the instant described by the vertical linethrough the nitrogen meter record and the resulting line extended across theflow record. The volume: of gas expired up to this instant was determined bymeasuring the area enclosed by the expiratory flow curve to the vertical linealready described by means of a planimeter. The true dead space was thenobtained by subtracting from this value the volume of the instrumentaldead space (35 ml). Ten measurements of the dead space in one subject atrest gave a mean value of 154 ml B.T.P.S. with a standard deviation of± 1o ml. The relationship between the volume of the various lengths ofsmooth-bore tubing added as external dead space (ranging from 52 ml to315 ml) to the corresponding total dead space volumes is shown in Fig. 3-8.Each point represents the mean of at least five measurements and the lengthof the bar through each point depicts the magnitude of twice the standarddeviation of a single determination. The correlation coefficient betweenadded dead space volume and the total dead space volume was o.98 (N =28). The slope of the linear regression line fitted to this data with the addedexternal dead space volume as the independent variable was 1.04.
When the respiratory dead space was measured during pressure breathingwith an oronasal mask several difficulties were encountered. It was extremelydifficult to ensure a complete seal between the edge of the mask and thesubject's face at positive breathing pressures greater than 30 mmHg. Duringthese measurements even a leak which was usually quite acceptable (e.g.I litre/min.) resulted in the loss of a significant volume of gas from the maskduring the period in which the dead space gas was expelled from the respira-tory tract. The pattern of the expiratory flow of gas following the breath ofoxygen varied considerably from one determination to another during pres-sure breathing. The dead space of the mask (85 ml) was subtracted from eachmeasured value to give the true respiratory dead space. The results of thetechnically satisfactory measurements of the dead space volume duringpressure breathing of the two subjects who were studied are presented in Fig.3-;9. There was a considerable variation between individual measurements inthe-e experiments. The general trend, however, was that there was littlechange in dead space volume at breathing pressures of up to to mmHg andthat at higher breathing pressures the volume of the dead space increasedmarkedly. No technically satisfactory measurements were obtained at positivebreathing pressures in excess of 45 mmHg owing to the presence of mask leaksat the higher pressures.
The results of the measurements of the respiratory dead space when varioussubatmospheric pressures were applied to the surface of the neck by means ofthe perspex box for the two subjects studied are presented in Figs. 3-10. Theshapes of the pressure distension curves obtained in the two subjects were verysimilar. When the pressure difference applied across the walls of the upperrespiratory passages was small (less than 1o mmHg), there was little changein the volume of these passages. A further increase in this pressure difference,
75
I I I I I I I I I II I I

!IRAISED INTRAPULMONARY PRESSURE
however, caused a large increase in respiratory) dead space. A pressure dif-ference of about 50 mmHg produced nearly maximal distension over therange of pressures studied. The increase in the volume of the dead spaceproduced by a reduction of the pressure in the box of 5o mmHg was approxi-mately 2oo ml B.T.P.S. in both the subjects.
AUDITORY ACUITY AND THE APPEARANCE OF THE TYMPANIC
MEMBRANE DURING PRESSURE BREATHING
Auditory Acuity - The auditory acuity of six subjects was measured at restand whilst pressure breathing with an oronasal mask and a pressure jerkin ata positive breathing pressure of 6o rrmHg at ground level. The subject, whowore a standard flying helmet (R.A.F. Type G), fitted with standard induc-tive type telephones, was seated in a decompression chamber. Pure tones atfrequencies of 250, 500, Goo0, 20oo and 4000 c/s were produced in the sub-ject's telephones by means of an oscillator, the power output of which couldbe varied in known steps. The subject was provided with a signal key whichhe operated when he perceived a sound. The output of the oscillator was fedto the telephones by way of a second key. After the frequency and power out-put of the oscillator had been adjusted to the desired values this key wasclosed for a period of two seconds. At each of the chosen frequencies thethreshold of auditory acuity was determined approximately by progressivelydecreasing the power of the signal until the subject failed to perceive it. Thesubject's threshold was then determined accurately by applying the signal ata known suprathreshold level for two seconds and then decreasing the powerin 3 db steps until he did not hear it.
There were two sources of noise within the decompression chamber whichinterfered with the determination of the auditory threshold. One source wasthe vacuum pumps by means of which the pressure in the chamber wasreduced. The noise from this source was eliminated by pumping the air froma large cylindrical reservoir before the measurements commenced andmaintaining a constant pressure within the decompression chamber byallowing air to pass from it into the evacuated reservoir. The valves within theoronasal mask worn by the subject also generated considerable noise. Thissource of interference was eliminated by removing the valves from the maskand connecting the mask cavity to a canister containing soda lime by a shortlength of hose and a two-way tap. The distal end of the canister was connectedby a short length of wide-bore hose to a Douglas bag filled with oxygenwhich was placed outside the decompression chamber. The subject breathedto and fro through the canister to the Douglas bag.
In these experiments the pressure within the decompression chamber wasreduced to 6o mmHg less than the prevailing barometric pressure, whilst thesubject breathed air from within the decompression chamber. The subjectwas instructed to maintain the patency of his plaryngo-tympanic tubes andhe remained at the slightly reduced pressure for five minutes before thecontrol measurements of auditory acuity were made. Pressure breathing wasthen instituted by connecting the pressure jerkin and oronasal mask to theexterior of the chamber by turning the appropriate taps. The auditory acuityof the subject was determined during the second and subsequent half minutesof the exposure to a breathing pressure of 6o mmHg. The acuity measure-
76
LIMIT ,TIONS OF VARIOUS TECHNIQUES
ments were repeated after the subject had swallowed several times. Measure-ments of auditory acuity were also made at simulated altitudes of 38000 ftand 5oooo ft in the decompression chamber. The subject wore the standardtype P mask, pressure jerkin and anti-g suit assembly which was connectedto an automatic pressure demand regulator Mark 20,
The subject was decompressed to 38000 ft at 50oo ft per minute and thenthe auditory threshold was measured by the technique used in the groundlevel experiments whilst the subject breathed oxygen at a pressure of I to 2
mmHg greater than that within the decompression chamber. This was fol-lowed by recompression to a pressure altitude of 25000 ft during which thesubject maintained the patency of his pharyngo-tympanic tub,:s. After threeminutes had elapsed the subject was rapidly decompressed to 500oo ft inone second. Auditory acuity was measured as rapidly as was practicable whilstthe subject breathed oxygen at a positive breathing pressure of 6o mmHg at5oooo ft and then the subject was rapidly recompressed to 38000 ft. After afurther three minutes at this pressure altitude, a final determination ofauditory acuity was made and the subject was then recompressed to groundlevel. The pressure within the decompression chamber was maintained at thedesired value whilst acuity measurements were made by the technique usedin the initial experiments at ground level. The intensity of the noise generatedby the valves of the oronasal mask at 38000 ft and 50000 ft was negligible.Appearance of the tympanic membrane - The tympanic membrane ofone ear was continuously observed in twenty subjects whilst they were exposedto positive breathing pressures of up to 70 mmHg with an oconasal mask anda pressure jerkin. Each exposure lasted for two minutes. The tympanicmembrane was observed by means of an electric auroscope through a holemade in the ear bun of a standard flying helmet.
The effect of pressure breathing at positive breathing pressures greaterthan 70 mmHg upon auditor)y acuity and the appearance of the tympanicmembrane was determined by using a partial pressure headpiece to apply airunder pressure to the respiratory tract. In the R.A.F. types of partial pressureheadpiece there is no direct pressurization of the external auditory meatus.Measurement of the pressure within the external auditory meatus was madeat positive breathing pressures of up to 14o mmHg by means of a fine poly-thene catheter (O.D. 0.7 mm) placed in the meatus and brought out throughthe bladder of the headpiece overlying the ear. The meatal pressure measure-ments which were made with a capacitance manometer showed that the risein meatal pressure was less than io",, of the pressure applied by means of theheadpiece to the respiratory tract.
Fifty subjects wearing a pressure headpiece, jerkin and anti-g suit wereexposed to pressure breathing at 8o mmHg for four minutes on two occasionsand at 1oo mmHg for two minutes on two occasions. Further a group of tensubjects were ex posed to a rositive breathing pressure of 8o mmHg for twentyminutes and one of Ii r j.lmHg for fifteen minutes whilst wearing a partialpressure headpiece, armi jerkin and anti-g suit.
77
Ra

RAISED INTRAPULMONARY PRESSURE
RESULTS
Auditory Acuity - The changes of auditory acuity produced by pressurebreathing under the various conditions studied were consistent from one sub-ject to another. The mean values of the reduction of acuity relative to thelevel obtained at rest at ground level from the group of six subjects arepresented in Fig. 3-I1 . Increasing the pressure in the respiratory tract by 6ommHg at ground level did not produce any overall change of acuity until thesubject swallowed. This manoeuvre when performed during pressure breathingresulted in a considerable loss of acuity, particularly at the lower frequencies.Breathing oxygen at the pressure of the environment at a simulated altitudcof 38ooo ft resulted in some loss of auditory acuity which was most marked atthe lower frequencies. There was a further loss of acuity when the subject wasexposed to a positive breathing pressure of 6o mmHg at a simulated altitudeof 5oooo ft. The absolute pressure within the respiratory tract was virtuallythe same during breathing oxygen at 38000 ft and during pressure breathingat 5oooo ft.Appearance of the tympanic membrane - Direct observation of thetympanic membrane during pressure breathing with an oronasal maskshowed that no changes occurred in this organ in nineteen of the twenty sub-jects examined. In one subject there was a general bulging of the drumheadoutwards at the commencement of pressure breathing. A similar change aroseduring pressure breathing in the other subjects when the subject swallowed.This movement affected the whole membrane but was greatest in the parsflaccida. The bulging of the membrane following a swallow was associatedwith discomfort in the ear and a subjective reduction of auditory acuity. Nochanges were seen in the appearance n!" the tympanic membrane in the fiftysubjects who were examined before and after exposure to pressure breathingfor short periods at positive breathing pressures of 8o to ioo mmHg whilstwearing partial pressure headpieces.
In the group of experiments in which the duration of pressure breathingwas prolonged, marked changes were seen in the appearance of the tympanic
TABLE 3-2
INCIDENCE OF EAR CHANGES AFTER PRESSURE BREATHING FOR
LONG PERIODS
No. of subjects showingPetechial
Total No. Injection of External Haemorrhages in the1 Fluid inCondition of Subjects Auditory Meatus Tympanic Me.abrane Middle Ear
t tt ttt8o mmHg for 10 7 2 3 2 5
20 minsii5mmHgfor 1o 8 2 3 3 6
t5 mins
I .+ depict increasing intensity of change
78
- - - -----

MEAIING LOSS (db0)
00
40
o l 10o 2000 oo00 4000
FICQUENCtf (cls)
PRESSURE B.CATNiNG AT CG L. APRESSURE BQEATWING AT G.L.(AFTER SWALU.OwiN) .BREATHING OYGEN AT 38,000 FT.PRESSuRE BR[ATHMNG AT 50,000 MT. 0
FiG. 3-1 1 The effect of pressure breathing and reduction of environmental pressureupon the auditory threshold measured relative to the threshold at rest at ground
level. Each point represents the mean of the values obtained from six subjects
79

RAISED INTRAPULMONARY PRESSURE
membranes after pressure breathing. Typically the inner part of the externalauditory meatus and the tympanic membrane were injected; the membranewas covered with petechial haemorrhages and there was a fluid level in themiddle ear. Not all the subjects showed all the changes. The incidence of thevarious signs is presented in Table 3-2. It may be seen that the incidence andintensity of the changes were slightly greater in the exposure to a positivebreathing pressure of 115 mmHg for fifteen minutes than in the twenty-
minute period of pressure breathing at 8o mmHg. One subject, two minutesafter the start of an exposure to a positive breathing pressure of 115 mmHgexperienctd di.comfort in his right ear and the exposure was ended. Examina-
tion of the car revealed blood in the external auditory meatus and this wasfound to be coming from a ruptured haemorrhagic bulla in the antero-inferior sector of the membrane. The membrane itself was not perforated.
THE CARDIO-VASCULAR EFFECTS OF NECK COUNTERPRESSURE
DURING PRESSURE BRLATHING
The response of the cardiovascular system to the appiication and removal ofcounterpressure to the neck was studied during pressure breathing with anoronasal mask and a pressure jerkin. Pressure was applied to the neck bymeans of an inflatable rubber bladder made in the form of a collar. Thebladder was shaped so that its upper border fitted up beneath the ears andit was secured in this position by means of adhesive tape. The lower borderof the bladder reached the root of the neck. The bladder was covered by aninextensible layer of fabric which adjusted to fit the wearer's neck by meansof lacing. The size of the bladder and the closeness of the restraining layerwere selected to ensure that when the bladder was inflated the walls of thebladder were not overdistended. The bladder was inflated with compressedair by means of a 2 cm I.D. hose and a two-way tap. The pressure within thebladder was recorded by means of a capacitance manometer. The neckbladder was usually inflated at the commencement of a period of pressurebreathing to the same pressure as that which waw applied to the respiratorytract. The pressure within the neck bladder was suddenly reduced oneminute after the beginning of pressure breathing. The effects of suddenlyincreasing the neck bladder pressure to its original value were also studied.All the experiments were performed with the subject in the seatedposition.
In the majority of experiments lead II of the electrocardiogram wasrecorded continuously. The arterial pressure responses to deflation andinflation of the neck bladder were measured by electromanometry by way ofa Riley needle inserted in the brachial artery. The blood flow through theforearm was measured by means of a Whitney strain gauge (286) with anocclusion cuff placed around the wrist and a collection cuff around the upperarm just above the elbow (Fig. 3-12). The gauge was placed )n the forearm6 cm from the tip of the olecranon and held in position against the skin bytwo pieces of adhesive plaster. The upper limb was placed within a perspexbox with a reflected rubber seal around the upper arm just proximal to thecongestion cuff. The seal consisted of a thin cuff of rubber which was attachedto the edge of a holejust large enough to contain the arm without constriction.The seal was reflected along the upper limb towards the elbow and its free
8o

RCFLECTEO COGE SEAL
COLLECTINGt
CUIFF
WNITN[y GAUGE
,.-. " Curt"
- .PIPE CONNECTEOTO BREATWING
It. VARIABLE PQESSURU RnGULATORM- M(ICURy MANOMETER.
FIG. 3-12 The apparatus used for the measurement of forearm blood llow duringpressure breathing
8,
RAISED INTRAPULMONARY PRESSURE
edge was fixed to the skin by means of adhesive plaster. The congestion cuffwas applied over the seal.
The outer surface of the rubber sheet was supported by means of a perspexplate, the inner edge of which was shaped to fit closely against the skini of theupper arm without producing actual constriction. The limb was supportedcomfortably within the box with the elbow flexed by means of a paddedblock beneath the elbow and with the hand resting on a second block. Thebox was positioned so that the lower border of the forearm was at the hori-zontal level of the suprasternal notch. The wrist occlusion cuff was connectedto a mercury manometer and an inflation pump outside the box. The collec-tion cuff was connected by way of a wide bore two-way tap and hose to alarge reservoir (too litre), the pressure in which was maintained at the desiredvalue by means of a demand regulator with a variable output pressure.During pressure breathing the box enclosing the upper limb was pressurizedto the same pressure as that which was applied to the respiratory tract. Inorder to reduce to a minimum the displacement of the upper limb from thebox when the latter was pressurized the sul- ect was firmly secured in the seatand the box fixed relative to the seat.
When the apparatus was correctly positioned the subject rested in thequiet for ten minutes. Following the rest period measurements were made ofthe forearm blood flow. The wrist occlusion cuff was inflated to 300 mmHgone minute before the measurement of blood flow. The collecting cuff wasthen inflated for five seconds every twenty seconds and the consequent in-crease in forearm volume recorded. As a preliminary investigation at thebeginning of each experiment the pressure within the collecting cuff wasvaried between 3o and 6o mmHg until the collecting pressure which yieldeda constant rate of increase of forearm volume was found. When the subjectwas pressure breathing and the pressure within the box enclosing the upperlimb had been raised, the pressure to which the collecting cuff was inflatedwas increased by an amount equal to the pressure applied within the box. Inthis manner the relationship between the pressure within the collecting cuffand the venous pressure in the forearm was unchanged throughout theexperiment. During pressure breathing the neck bladder was deflated andinflated and the corresponding forearm blood flows were recorded.Results - A reduction of the pressure within the neck bladder whilst thesubject was pressure breathing generally caused a transient slowing of theheart rate (Fig. 3-13). There was a marked variation betwetn the response ofthe heart rate to the same reduction of neck bladder pressure between oneindividual and another. In four out of the six subjects studied there wasbradycardia following deflation of the neck cuff (Fig. 3-14) whilst the re-maining two subjects exhibited no change of heart rate in this situation. Theminimum pulse rate occurred within one or two beats of the reduction of cuffpressure. The pulse rate then increased to regain the prestimulus value fiveto fifteen seconds later. At a given positivc breathing pressure the magnitudeand duration of the slowing were related to the amount by which the pressurewithin the neck bladder was r'duced (Fig. 3-15). A fall of biadder pressureof between 15 and 25 mmHg was found to be the smallest stimulus whichproduced an effect on the heart rate. The greater the fall in neck bladderpressure the greater was the degree and duration of the subsequent brady-
82

Fro. 3-13 The effect of sudden deflation of the neck bladder in a subject pressurebreathing at 6o mmHg upon the electrocardiogram (Lead ii)
PAS$ *CCVAC (M)
° 7
M!.
0 3 ' " so; 'k r," ii
FIG. 3-14 The effect of sudden deflation of the neck bladder during pressure breath-ing at 8h mmHg upon the heart rate (expressed as the pulse interval) in four subjects
83

MemoU TO
?fa ("ee
Fio. 3-13 The effect upon thc heart rate (expres~xd as pulse interval) in one subjectof suddenly reducing thc pressure in the neck bladder from 8o mnmHg to 5o, 2o oro mnmHg whilst thc subject was pressure breathing at a positive breathing pressure
of 8o mmHg
04)84
-M P+

FALL OF MEAN ARTCEIALPRESSuRE (,,,m Hj)
40
BREATINur,
0 to 4..
CHANC OF NECK S"DOER PRESSuPE ( N)
Fjo. 3-J7 The effects of various reductions of neck bladder pressure upon the meanarterial blood pressure, whilst pressure breathing at positive breathing pressures of5o, 6o and 8o mmHg
85
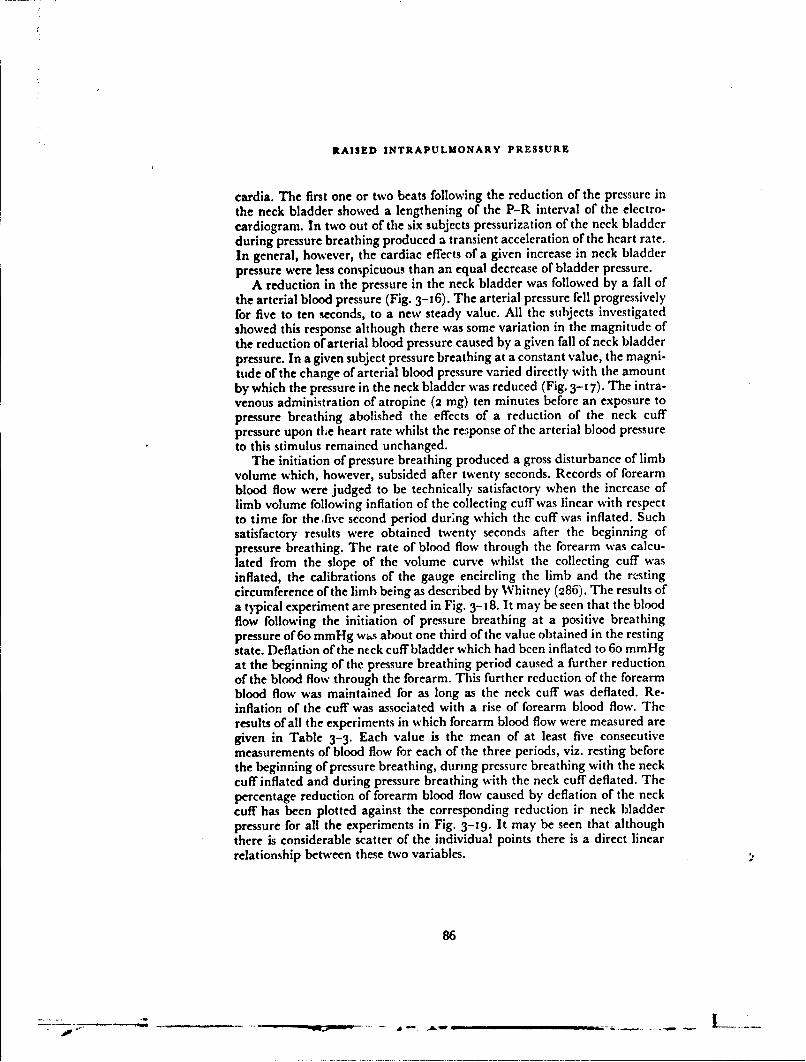
RAISED INTRAPULMONARY PRESSURE
cardia. The first one or two beats following the reduction of the pressure inthe neck bladder showed a lengthening of the P-R interval of the electro-cardiogram. In two out of the six subjects pressurization of the neck bladderduring pressure breathing produced a transient acceleration of the heart rate.In general, however, the cardiac effects of a given increase in neck bladderpressure were less conspicuous than an equal decrease of bladder pressure.
A reduction in the pressure in the neck bladder was followed by a fall ofthe arterial blood pressure (Fig. 3-16). The arterial pressure fell progressivelyfor five to ten seconds, to a new steady value. All the subjects investigatedshowed this response although there was some variation in the magnitude ofthe reduction of arterial blood pressure caused by a given fall of neck bladderpressure. In a given subject pressure breathing at a constant value, the magni-tude of the change of arterial blood pressure varied directly with the amountby which the pressure in the neck bladder was reduced (Fig. 3-17). The intra-venous administration of atropine (2 mg) ten minutes before an exposure topressure breathing abolished the effects of a reduction of the neck cuffpressure upon tLe heart rate whilst the response of the arterial blood pressureto this stimulus remained unchanged.
The initiation of pressure breathing produced a gross disturbance of limbvolume which, however, subsided after twenty seconds. Records of forearmblood flow were judged to be technically satisfactory when the increase oflimb volume following inflation of the collecting cuff was linear with respectto time for thefive second period dur;ng which the cuff was inflated. Suchsatisfactory results were obtained twenty seconds after the beginning ofpressure breathing. The rate of blood flow through the forearm was calcu-lated from the slope of the volume curve whilst the collecting cuff wasinflated, the calibrations of the gauge encircling the limb and the restingcircumference of the limb being as described by Whitney (286). The results ofa typical experiment are presented in Fig. 3-18. It may be seen that the bloodflow following the initiation of pressure breathing at a positive breathingpressure of 6o mmHg wý,s about one third of the value obtained in the restingstate. Deflation of the neck cuff bladder which had been inflated to 6o mmHgat the beginning of the pressure breathing period caused a further reductionof the blood flow through the forearm. This further reduction of the forearmblood flow was maintained for as long as the neck cuff was deflated. Re-inflation of the cuff was associated with a rise of forearm blood flow. Theresults of all the experiments in which forearm blood flow were measured aregiven in Table 3-3. Each value is the mean of at least five consecutivemeasurements of blood flow for each of the three periods, viz. resting beforethe beginning of pressure breathing, during pressure breathing with the neckcuff inflated and during pressure breathing with the neck cuff deflated. Thepercentage reduction of forearm blood flow caused by deflation of the neckcuff has been plotted against the corresponding reduction ir neck bladderpressure for all the experiments in Fig. 3-19. It may be seen that althoughthere is considerable scatter of the individual points there is a direct linearrelationship between these two variables.
86
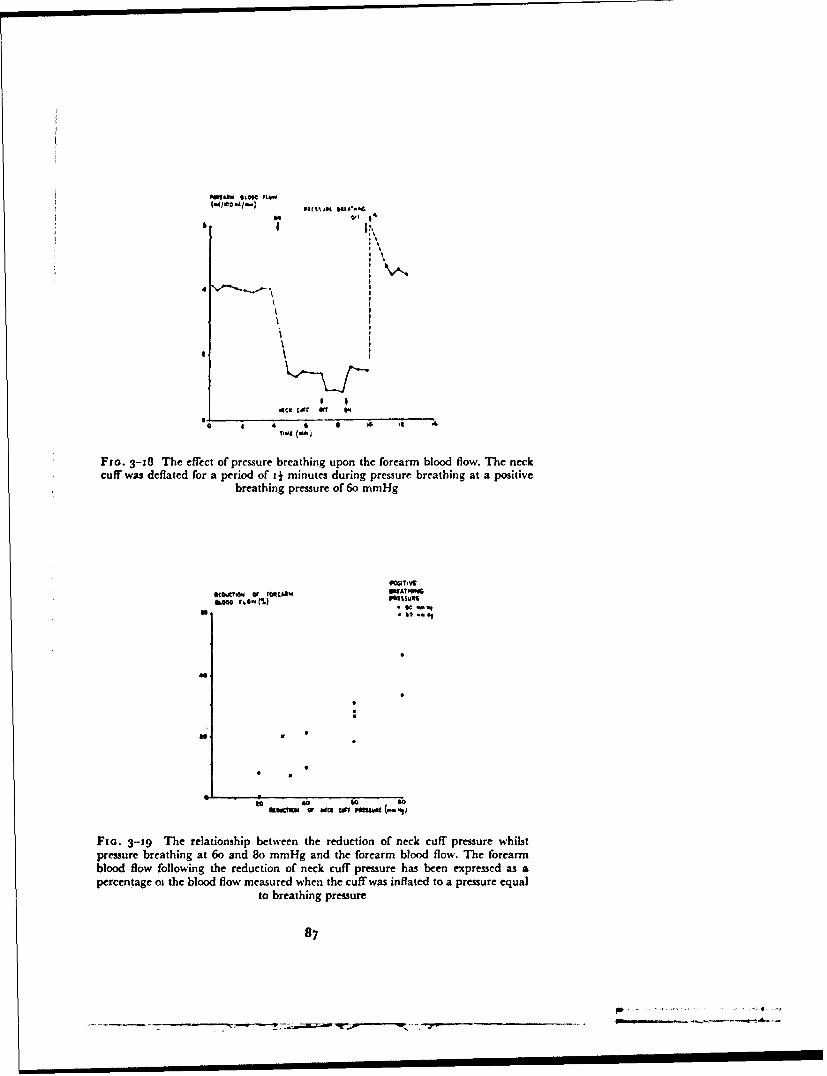
& lO'l ) I lll l I ?J.*€
I'x,,
G o
Fzo. 3-18 The effect of pressure breathing upon the forearm blood flow. The neckcuff was deflated for a period of 4 minutes during pressure breathing at a positive
breathing pressure of 6o mmHg
it• rcua, WATI4I87
ill ~* it' .
a. V
Fia. 3-59 The relationship between the reduction of neck cuff pressure whilstpressure breathing at 6o and 8o mmHg and the forearm blood flow. The forearmblood flow following the reduction of neck cuff pressure has been expressed as apercentage ot the blood flow measured when the cuff was inflated to a pressure equal
to breathing pressure
87
- -, - -' n n I I I_ _ I- d I -

RAISED INTRAPULMONARY PRESSURE
TABLE 3-3
THE EFFECT OF PRESSURE BREATHING AND THE APPLICATION
OF VARIOUS DEGREES OF COUNTERPRESSURE
TO THE NECK UPON FOREARM BLOOD FLOW
Forearm blood flow(ml/too mlimin.)
Positive Reduction of Pressure Breathing Pressure BreathingSubject Breathing Neck Cuff Rest with neck cuff with neck cuff
Pressure Pressure inflated pressure reduced(mmHg) (mmHg)
A 6o 30 4.5 3.5 1.26o 4.C 1.4 1.0
A 8o 20 4.3 3.2 1.140 4.1 3.4 1.3
6o 3.9 1.3 0.98o 4.5 1.3 0.7
B 6o 30 4.6 1.6 1.56o 4.4 1.4 1.1
B 8o 20 4.2 3.3 1.140 4.1 1.2 1.3
6o 4.3 1.3 3.1
8 4.' 1.2 0.9
DISCUSSIONThese investigations have shown the regions of the head and neck in which
disturbances are induced by pressure breathing when an oronasal mask isused to deliver the increase in gas pressure to the respiratory tract. In mostregions two mechanisms are responsible for these disturbances: the rise ofpressure within the upper respiratory tract is responsible for some of thechanges in that it produces a significant pressure gradient between the air-containing cavities and the surface of the skin; the second mechanism con-cerned is vascular. When trunk counterpressure is employed the arterialpressure is increased by 8o-1 2o0", of the pressure applied to the respiratorytract whilst the venous pressure is increased by an amount which virtuallyequals the applied pressure. Thus the transmural pressure of all the vesselsof the unsupported regions of the head and neck is increased during pressurebreathing by an amount which is virtually equal to the breathing pressure.Eye - The direct effect of the rise of the pressure within the respiratory tractupon the eye is the opening of the nasolacrimal duct. Each duct normallycarries the lacrimal secretion from one conjunctival sac. The secretion flowsto the inner canthus of the eye and then passes through the lacrimal cannali-culi which are situated at the inner end of the upper and lower lids, into thenasolacrimal sac and thence into the middle nasal; passage. The edges of thelids containing the lacrimal cannaliculi are normally opposed to the surfaceof the scleral conjunctiva, and the walls of the nasolacrimal duct lie in contact
88
LIMITATIONS OF VARIOUS TECHNIQUES
with one another. In the majority of subjects studied (651,,) the nasolacrimalducts remained closed even when gas at a positive pressure of 70 mmHg wasapplied to the respiratory tract. In a few subjects, however, gas flowed fromthe lacrimal cannaliculi at a pressure of 50 mmHg and the proportion ofsubjects affected was increased by a rise of breathing pressure. In theseinstances the increase of the pressure of the gas within the nose must haveopened the nasolacrimal duct. Gas then passed up through the lacrimalcannaliculi lifting their conjunctival openings off the surface of the scleralconjunctiva.
Since the stream of gas passed up the nasolacrimal duct the tear secretionsdid not drain down the duct in the normal manner and the secretion rapidlyflowed over the edge of the lower lid. The flow of gas through the lacrimalcannaliculi on to the surface of the sclcral conjunctiva was associated in mostcases with spasm of the eyelids. This blepharospasm was probably a reflexinitiated by the irritation of the coojunctiva produced by the incident streamof gas from the cannaliculi. In only two of the subjects studied was this spasmsevere enough to interlere with vision and at a positive breathing pressure of6o mmHg impairment of vision arose in only one subject. This disturbancemay obviously limit the pressure that can be applied by means of an oronasalmask. The results of the exposure of twenty subjects suggest, however, thatthe incidence of serious blepharospasm and consequent interference withvision is very low with positive breathing pressures of up to 6o mmHg.Subsequent experience in the training of one hundred aircrew in pressurebreathing with an oronasal mask at pressures of up to 65 mmHg has con-firmed these conclusions. No incident of impairment of vision was encoun-tered in this extended training programme, although in several subjects therewas a considerable degree of blepharospasm at the highest breathing pressure.
Since the conjunctival vessels lie directly beneath a thin epithelial layer,an increase of the pressure within them will probably not affect the pressurein the tissues surrounding them. Thus in pressure breathing the transmuralpressures of these vessels are probably increased by an amount which corre-sponds to the rise of intravascular pressure. The conjunctival suffusion seenin some of the subjects at breathing pressures of greater than 5o mmHg wasdue to the vascular dilatation produced by this increase of vascular trans-mural pressure. The present series of experiments suggests that in the vastmajority of individuals the conjunctival vessels can withstand an increase oftransmural pressure of up to 70 mmHg without rupture since only oneinstance of subconjunctival haemorrhage occurred. Another circumstance inwhich the vascular pressure in the vessels of the eyes is raised is the applicationof longitudinal accelerations to the body acting from foot to head ("negative"G). Both in the goat and man, exposure to longitudinal acceleration actingfrom foot to head of 2.5 X 981 cm sec.- 2 for 15 sec. invariab'y producedconjunctival haemorrhages (120). During such an exposure the effectiveweight of the column of blood between the eye veins and the thorax is mar-kedly increased so that at an acceleration of 2.5 x 981 cm sec.- 2 the venouspressure at eye level was 70 to 8o mmHg in the human experiment conductedby Gamble, Shaw, Henry and Gauer 1950 (120). It is apparent, therefore,that if the increase in vascular pressure at eye level produced by pressurebreathing exceeds 70 mmHg conjunctival capillaries will be ruptured.
89
. ................
RAISED INTRAPULMONARY PRESSURE
Rupture of an intraocular vessel may have much more serious conse-quences than the small subconjunctival haemorrhages which follow ruptureof one of the vessels lying on the external surface of the eye. An intraocularvascular rupture may result in bleeding into either the anterior or posteriorchamber or in direct damage to the retina, and any of these events can causepermanent loss of vision. Intraocular haemorrhage due to increased venouspressure in the head occurs in several circumstances, thus Henry (1950) (145)found that exposure to high longitudinal accelerative forces applied from footto head of the order of Io x 981 cm sec. - 2 produced occasional haemorrhagesin the anterior chamber of the eye in goats. At this level of acceleration thevenous pressure at eye level must have been of the order of 3oo mmHg.Accidental exposure of aircrew during flight to negative accelerations of theorder of3 x 981 cm sec.- 2 has resulted in intraocular haemorrhages (Howard,personal communication). Similar haemorrhages have also been producedby high decelerative forces being applied to a man-seat system in which theman was secured by a seat harness passing across the abdomen (271). Themechanism of this injury was probably that the man was suddenly flung intothe restraining harness and this caused a rapid and marked rise of intra-abdominal pressure, which was transmitted through the venous system to theintraocular vessels (158). In all these instances, however, intraocular hae-morrhage was associated with venous pressures in excess of ioo mmHg at eyelevel and in most instances with a very rapid rise of venous pressure.
The mechanics underlying the behaviour of the intraocular vessels whena rise of venous pressure occurs differ considerably from those involved in thecase of the conjunctival vessels. The intraocular vessels lie in a fluid-filledthick-walled sphere and are supported to a certain extent by the intraocularfluids. The magnitude of the increase of the transmural pressure of the intra-ocular vessels when the pressure within them is raised will be determined bythe relative distensibilities of the ocular globe and the intraocular vascularbed. Thus at one extreme, if the sclera and cornea were indistensible a riseof intravascular pressure would be transmitted throughout the extravascularfluids of the eye without an increase of the transmural pressure and hencewith no significant distension of the intraocular vessels. If the distensibilityof the ocular globe were significant but considerably less than that of thevascular bed within the eye a small fraction of the total increase of intra-vascular pressure would appea, as an increase of vascular transmural pressureand a slight distension of the capacity vessels of the intraocular bed wouldoccur. In both these situations the likelihood of vascular damage occurringas a result of an increase of venous pressure would be very remote. If, how-ever, the distensibility of the cornea and sclera exceeds that of the vascularbed within the eye a large proportion of any increase of intravascular pressurewould be borne by the vessels themselves and the situation would approachthat which exists in the conjunctiva. The intraocular haemorrhages producedby high levels of foot-to-head acceleration and by sudden blows to theabdomen could have arisen because either a very large increase of vascularpressure occurred and the support afforded by the ocular globe becameinadequate or there was a temporal lag in the rise of extravascular pressurewithin the eye.
The rise of vascular pressure produced by pressure breathing at positive
90
_________ .. F~- ~ - - - - - - .--
LIMITATIONS OF VARIOUS TECIINIQUES
breathing pressures of up to 7o mmHg is such that rupture of intraocularvessels due to inadequate support by the sclera and cornea would not beexpected. No instance of intraocular haemorrhage has been reported as aresult of pressure breathing with an oi onasal mask and no evidence of retinalvascular damage was seen in the present experiments. Further, the directobservations of the large retinal vessels gave no evidence of vascular distensionduring pressure breathing. There was indeed a slight reduction of the dia-meter of the retinal veins during this manoeuvre. These ophthalmoscopicfindings have been confirmed by Green (1961) (129) who took serial photo-graphs of the retina before and approximately five and forty seconds after theonset of pressure breathing at 6o mmHg. He found that whilst there was nosignificant change of the retinal venous diameter in the first ten seconds ofpressure breathing, after thirty seconds there was a significant reduction inthe diameter of these vessels.
These results suggest that the ocular globe is considerably less distensiblethan the vasculature of the eye and that no significant temporal lag occursbetween the ocular vascular pressure and the pressure within the extravascu-lar fluids of the eye at the onset of pressure breathing, at least at positivebreathing pressures of up to 70 mmHg. The mechanism of the reduction ofthe diameter of the retinal veins observed during pressure breathing isuncertain. Pressure breathing generally induces hyperventilation and hypo-capnia causes constriction of the retinal veins. The onset of the constrictionduring pressure breathing is relatively rapid and the degree of hypocapniaproduced by thirty seconds of pressure breathing is small. It is possible on theother hand that the retinal veins participate in the general peripheral veno-constriction which is induced by pressure breathing (Chapter 6). Themeasurements of visual acuity confirm that pressure breathing at pressures ofup to 70 mmHg causes no disturbance of the peripheral processes whichunderlie vision.Neck Distension - The distension of the neck is one of the most strikingeffects of the delivery of gas at positive pressures above 30 mmHg by meansof an oronasal mask. The radiographic studies demonstrate that an increasein the volume of the upper respiratory tract is the principal cause of thisdistension although direct observations suggest that vascular congestion alsoplays a part. The two methods used to study the distension of the air-containing cavities of the head and neck, radiography and measurement ofthe respiratory dead space, are complementary. The former gives a qualita-tive indication of the parts involved in this distension whilst the latter gives ameasure of the volume increase. Care was taken in the radiographic study toavoid as far as possible the distortion of the apparent dimensions of the air-containing cavities by employing a long tube-to-subject distance and cali-brating the experimental radiographs under exactly the same condition- aswere used with the human subjects.
The value of the dead space volume of a given individual as measured bymonitoring the egress of nitrogen from the lungs during a prolonged expira-tion following an inspiration of oxygen is affected by a number of variables.The most important of these factors are the volume of oxygen inspired imme-diately before the measurement, the duration of the pause between the end ofinspiration and the beginning of expiration and the pattern of this expiration
91
9t9

RAISED INTRAPULMONARY PRESSURE
(111) (36). Thus in any experiment designed to measure a change of deadspace volume produced by a given situation, the value of these variables mustbe. held constant. In the present study the subjects had had previous experi-ence of respiratory experiments and were capable of controlling their respira-tory patterns. The volume of oxygen inspired and the duration of thisinspiration were controlled by the subject watching the pen of the spirometerfrom which th's gas was inspired as it moved over the recording drum.
After a little practice each subject was able to inspire I litre of oxygen overa period of three seconds. The subject was also able to control the duration ofthe inspiratory/expiratory pause by watching the movement of the recordingdrum of the spirometer and commencing expiration at a fixed interval (twoseconds) after the end of inspiration. Although the subject was given no visualindication of his expiratory flow pattern the instruction to breathe out at asteady rate resulted in a reproducible expiratory flow pattern, particularlywhen the subject was at rest. The relatively small standard deviation obtainedin the series of ten consecutive determinations of the dead space volume in aresting subject demonstrates the adequacy of control of these variables atleast in the resting state. The reliability of this method of measuring addedexternal dead space as demonstrated by the experiments in which smoothbore hose of known volume were added to the breathing circuit was satisfac-tory in view of the magnitude of the change found during pressure breathing.
The subjects found it very difficult to maintain a fixed expiratory flowpattern during pressure breathing and the influence of this factor is shownin the increased variability found in the measurement of dead space volumeduring pressure breathing. This difficulty together with the impossibility ofobtaining a perfect mask seal at positive breathing pressures above 45 mrnHgled to the adoption of the neck box as providing a second method of studyingthe effects of an increased pressure difference across the walls of the upperrespiratory tract. The reduction of pressure around the neck did not interferewith normal respiratory mechanics so that the subjects were able to controltheir breathing satisfactorily. The proportion of the upper respiratory tractexposed to the distending pressure was slightly greater during pressure breath-ing than when suction was applied by means of the neck box. In the neck boxexperiments the cheeks were not exposed to the increased pressure differentialand the intrathoracic airways were not distended by the increase of functionalresidual capacity normally induced by pressure breathing.
The increase in volume of the oral cavity produced by distension of thechecks in pressure breathing has not been measured. The actual outwardmovement of the cheeks induced by pressure breathing is limited by the edgeof the oronasal mask. The increase of the coronal diameter of the oral cavitycannot exceed 2 cm at a positive pressure of 6o mmHg. It may be estimatedthat the maximum increase of the volume of the oral cavity at this pressurewill not exceed i5 ml. The increase of the anatomical dead space associatedwith a o.5 1 increase of the functional residual capacity, which is the order ofthe increase produced by pressure breathing, is about 15 ml (36). Thus themaximum difference at a distending pressure of 6o mmHg between theincrement of the dead space volume given by the neck box method and bypressure breathing will not exceed 30 ml which amounts to only 120,, of thetotal volume increase. The results of the neck box experiments may be applied
92
LIMITATIONS OF VARIOUS TECHNIQUES
therefore to the situation where distension is produced by pressure breathingwithout introducing a serious error.
The pressure dlLtension curve of the air spaces of the head and neck issigmoid in shape and thus it is possible to distinguish three phases in thedistension process. When the positive breathing pressure is less than io mmHgno significant distension occurs. Between a pressure of to mmHg and one of5o mmHg the distensibility of the airways is very high, whilst above 5o mmHgthe passages are virtually indistensible (within the range of pressures studied).It is possible to account for this curve by the following mechanism: at restmost of the passages are slit-like in cross section with the superio-inferior (oralcavity) or antero-posterior (oropharynx, hypopharynx and cervical oesopha-gus) walls virtually touching. When the pressure difference between the gas inthe lumen of this tube and the surface of the skin exceeds about 1o mmHg thecross-sectional shape changes from a slit to an oval and finally to a virtual circle.
During this phase a very large increase of cross-sectional area and henceof the volume of these passages occurs with very little increase of circum-ference and therefore little increase of wall area. The increase of pressureassociated with this phase of rapid increase of volume overcomes the resistanceto deformation of the tissues lying between the lumen of this tube and thesurface of the head and neck. Thus in this phase the floor of the mouth isdepressed, the oropharynx and hypopharynx becoming widely dilated so thattheir lateral recesses, which are normally closed, open out to give a very widetube. The cervical oesophagus is opened out into a tube which becomesvirtually circular in cross section. A similar change occurs in the shape of thelower pharynx and oesophagus during deglutition when a large bolus isswallowed, except that only one part of the tube is opened widely at anyinstant during swallowing.
The principal causes of tissue resistance at this phase of distension are thetone of the striated muscles which form the floor of the mouth and whichsurround the pharynx and upper oesophagus, and the elastic fibrous tissuewhich envelops these regions. When the distending pressure is of the order of50 mmHg the inelastic fibrous tissue which surrounds the muscle of th. floorof the mouth and neck becomes tense and tends to prevent any further in-crease of the volume of the pharynx and oesophagus. Thus during pressurebreathing at pressures greater than 50 mmHg the tissues of the walls of themouth, the pharynx and the upper oesophagus are widely stretched.
The cervical oesophagus is distended throughout its length during pressurebreathing at positive pressures greater than 1o mmHg. The portion of theoesophagus which lies within the thorax, however, iq not involved in thisdistension. The pressure within the thorax is raised during pressure breathingby an amount which very nearly equals the positive breathing pressure, sothat the pressure difference across the wall of the thoracic oesophagus is notincreased significantly by pressure breathing. Thus in contrast to the pressureconditions existing in the cervical oesophagus pressure breathing does notproduce any tendency to distension of the intrathoracic oesophagus.
Since the cervical oesophagus is not ventilated directly by the tidal volume,a considerable fraction of the air contained within the distended tube willnot be included in the increase in dead space volume as measured by theFowler technique. A certain degree of mixing will occur between the inspired
93
RAISED INTRAPULMONARY PRESSURE
air and the air held in the upper part of the oseophagusjust below the openirgof the larynx, especially if any turbulence occurs in the flo" of gas into aTdout of the larynx. The volume of air contained within the distended oesopl'z.-gus may be calculated approximately from the dimension of the shadow orthis region in the lateral and antero-posterior rad;ographs taken duringpressure breathing. This volume amounted to 6o ml at a positive breathingpressure of 6o mmHg.
The diameter of that part of the trachea which lies within the neck isslightly increased during pressure breathing. The increase of the antero-posterior diameter is due to bulging outwards of the posterior wall of thetrachea where the cartilaginous rings are incomplete. The intrathoracictrachea does not undergo any significant increase in size since there is noincrease in the pressure difference between the tracheal lumen and the pleuralpressure. The larynx and trachea are moved forward relative to the cervicalspine by distension of the pharynx and oesophagus. The opening into thelarynx is widened by pressure breathing, particularly at positive breathingpressures in excess of 30 mmHg.
The measurements carried out with the neck box suggest that pressurebreathing at 6o mmHg increases the dead space of the upper respiratorypassages to more than double the resting value. Nunn, Campbell and Peckett1959 (227) have also carried out experiments which illustrate the largevariability of the dead space volume. They found that the respiratory deadspace increased from a value of 70 ml when the neck was acutely flexed by asmuch as a further 70 ml when the head was fully extended. The increase ofdead space in pressure breathing will lead to a diminution of the alveolarventilation at a given level of pulmonary ventilation. Thus if no change ofpulmonary ventilation occurred during the pressure breathing a breathingpressure of 6o mmHg would reduce the alveolar ventilation by 2 litres perminute at a respiratory frequency of io per minute. This reduction is a veryconsiderable fraction of the alveolar ventilation of the resting subject. Thus ifno hypernea occurred during pressure breathing with an oronasal mask asignificant degree of hypercapnia would arise. In fact pressure breathingnormally induces such a degree of hypernea that the arterial carbon dioxidetension actually falls. In these circumstances the increase of respiratory deadspace due to the distension of the upper respiratory passages reduces thedegree of hypocapnia induced by the increase of pulmonary ventilation.
At a certain level, which varies from one subject to another, and from timeto time in the same subject, pressure breathing with an oronasal mask inducesdiscomfort in the neck and the floor of the mouth. At the highest breathingpressures studied -;ome of the subjects experienced frank pain in these regions.The existence of discomfort also depends upon the duration of the exposure.Thus when the duration of exposure is relatively short (less than four minutes)the incidence of discomfort is insignificant at positive breathing pressures ofless than 50 mmHg. Above this pressure, however, discomfort and pain arecommon even if the exposure is short. The discomfort is of the dull, illocalized,nauseating type usually associated with the stimulation of simple sensoryendings (282). The lowest breathing pressure at which this subjective dis-turbance arises is very close to the pressure at which the upper respiratoryairways are fully distended and presumably the fascial layers become stretched.
94

LIMITATIONS OF VARIOUS TECHNIQUES
It is probable, therefore, that the discomfort and pain produced by pres-sure breathing with an oronasal mask at positive pressures greater than 50mmHg arise from the stimulation of receptors lying in the fibrous tisste of thefascial layers of the neck. This discomfort and pain is the most importantsingle factor limiting the pressure at which gas may be delivered to therespiratory tract by means of an oronasal mask. Apart from the consciousappreciation of this form of sensory stimulation afferent impulses of this typecan have important cardiovascular effects. As will be discussed later, afferentimpulses associated with the sensation of pain of the deep illocalized type mayprecipitate vasovagal syncope during pressure breathing. When the durationof pressure breathing with an oronasal mask is extended beyond five minutesdiscomfort may occur in the neck and floor of the mouth at breathing pres-sures of less than 50 mmHg. Pressure breathing at a positive pressure of 2oinrnHg has been performed for at least one hour without any discomfort(161). Pressure breathing at a positive pressure of 30 mmHg gaverise to discomfort when the duration was extended beyond thirty minutes(r6i).
The distension of the mouth and pharynx induced by pressure breathingwith an oronasal mask at positive pressures of greater than 30 mmHg inter-fercs with the processes underlying speech. Pressure breathing of itself doesnot interfere with speech since normal intelligible speech can be producedwhen a pressure headpiece is used in conjunction with trunk counterpressure.Distension of the mouth and pharynx interferes with the process by which tilevibrating air column produced by the lungs and larynx are transformed intospeech. There is distortion of the sounds which depend upon the fine move-ments of the walls of the pharynx, the soft palate and the tongue. The move-ments of the lips are also restricted somewhat during high pressure breathingwith a mask as the cheeks are forced out against the edge of the mask.Disturbances in the Ear - The absence of any movement of the tympanicmembrane in most individuals at the beginning of pressure breathing suggeststhat there is no significant increase of the pressure within the middle carcavity during this manoeuvre. This conclusion is supported by the results ofthe measurements ofauditory acuity made before and during pressure breath-ing at ground level. Van Dishoek 1941 (978) investigated the effects of in-creasing or decreasing the pressure within the exernal auditory canal uponhearing. He showed that the creation of a pressure difference across thetympanic membrane produced a loss of hearing and that the magnitude ofthis loss grew as the pressure difference was increased. The hearing loss wasgreatest at the lower frequencies. More recently Jones 1958 (164) demon-strated that a meatal pressure of io cm of water either greater than or lessthan atmos" :ieric pressure produced a hearing loss of 4 db at a frequency of5o c/s. Thus the measurement of auditory acuity is a sensitive method ofdeducing the presence of a pressure difference across the tympanic membrane.In the vast majority of subjects, since there was no change of acuity duringpressure breathing, the pharyngo-tympanic tube did not transmit the increaseof naso-pharyngeal pressure to the gas within the middle ear cavity. Swallow-ing, however, was followed by a rise of this pressure. The absence of anysignificant rise of middle ear pressure during pressure breathing at groundlevel was due to the rapid rise of naso-pharyngeal pressure to a level at which
95
-.- - -

RAISED INTRAPULMONARY PRESSURE
the pharyngeal ostium of the pharyngo-tympanic tube was firmly dLosed bythe pressure within the pharynx itself.
Although no direct observations of the behaviour of the tympanic mem-brane were made following the induction of pressure breathing by rapiddecompresdion to a simulated altitude in excess of 4oooo ft, the measurementsof auditory acuity performed at 5oooo ft suggest that this situation differsfrom that which exists when pressure breathing is induced at ground level.Thus on every occasion there was a hearing loss of betweeni 15 and 3o dbduring pressure breathing at 6o mmHg at 50000 ft. This is tle magnitude ofhearing loss which would be expected if the pressure differential across thetympanic membrane equalled the positive breathing pressure. In thesemeasurements at simulated high altitude the subject underwent a rapiddecompression from 25000 ft. Before such a rapid decompression the pressureof the gas in the middle ear cavity is approximately equal to the pressurewithin the decompression chamber (282 mmHg absolute.
As the pressure in the chamber falls on decompression the absolute pres-sure within the naso-pharynx falls from that of the environment at 25000
ft to the value delivered by the oxygen regulator (140-1so mmHg absolute).Thus the gas expanding within the middle ear cavity flows along the pharyn-go-tympanic tube into the naso-pharynx until the absolute pressure within themiddle ear approximately equals that within the naso-pharynx, i.e. 140-150mmHg. A fraction of the increase of the volume of the gas in the middle earcavity is taken up by the increase in the dimensions of this part produced bythe bulging of the tympanic membrane into the external auditory meatus.Thus since the pressure within the external meatus follows that of the environ-ment the tympanic membrane is subjected to the full pressure differentialdelivered by the oxygen regulator. The tympanic membrane appears to besufficiently strong to withstand a pressure in the middle ear exceeding that inthe meatus by un to at least 1oo mmHg for short periods without any per-manent aamage. Some 400 subjects have been exposed to breathing pressuresof between 6o mmHg and ioo mmHg at simulated altitudes above 40000 ftwith only one incidence of ear damage which was probably vascular inorigin.
A very considerable proportion of the blood vessels of the tympanicmembrane are distributed in the thin layer of skin which forms its externalsurface. Since the pressures of the gas within tLe middle ear and that in theexternal auditory meatus are not normally raised by pressure breathing atground level, the difference of pressure between the blood within the vesselsof the membrane and the surface of the membrane is increased by an amountequal to the positive breathing pressure. It is not known how the extra-vascu-lar pressure within the tympanic membrane behaves with a rise of intravascu-lar pressure. In the superficial tissues of the limbs, however, there is nosignificant rise of tissue pressure during pressure breathing (91). It is probable,therefore, that the greater fraction of the increase of the pressure differencebetween the blood in the vessels of the membrane and the gas within themiddle ear and external meatus occurs across the walls of the vessels. A riseof pressure in the middle ear cavity during pressure breathing will have aneffect upon the extravascular pressure within the tympanic membrane. Agradient of pressure will be created between the inner and outer surfaces of
96

LIMITATIONS OF VARIOUS TECHNIQUES
the membrane. It would appear likely that most of this fall of tissue pressurewill occur within the collagen and elastic fibre layers of the membrane. Thus't is probable that the tissue pressure in the epithelial lining of the outersurface will not be increased significantly by a rise of pressure within themiddle car ca% ity.
The absence )f any signs of vascular damage in the ear after a shortexposure to positive breathing pressures of up to 0oo mmHg suggests that thevessels of the tympanic membrane and of the epithelium lining the auditorycanal are capable of withstanding an increase of transmural pressure of upto ioo mmHg. The appearance, however, ofinjection and petechial haemorr-hages in the lining of the canal and on the surface of the membrane afterprolonged exposure to pressure breathing at positive pressures of 8o and ioommHg, demonstrates that the capillary vessels of this region cannot withstandsuch a rise of transmural pressure over a long period. The similarity of thevascular changes seen in the wall of the deeper part of the auditory canal tothose seen in the tympanic membrane itself demonstrate that these changesare vascular in origin and that they cannot be due to a rise of pressure in themiddle ear. On one occasion in the experimental series a frank haemorrhageoccurred from the rupture of a blood filled bulla. Similar vascular damage isseen when a frogman suit is used in diving (163). The design of the hood ofthis type of suit is such that the pressure within the external auditory meatusdoes not increase to as great an extent as does the hydrostatic and hencevascular pressures during descent in water. Frank bullae are frequently seenon the surface of the tympanic membrane in these circumstances.
The appearance of fluid within the middle ear cleft in many of the subj.?ctsexposed to prolonged pressure breathing adds further weight to the conceptthat the pressure within this cavity is not usually raised. The fluid presumablyappears because the increase of the pressure in the vessels of the lining of thecleft disturbs the normal equilibrium between capillary pressure, tissuepressure and the osmotic pressures of tle blood and the tissue fluids (272).This disturbance leads to the passag.- of fluid at an excessive rate from theblood. A high rate of fluid formation cannot arise if the pressure in the middleear cavity increases pari passu with the pressure in the respiratory tract andhence the circulation. Thus failure to increase the pressure within the externalauditory canal when the pressure within the respiratory tract is raised bypressure breathing can lead to damage of the vessels of the tympanic mem-brane and the skin lining the canal.
When the duration of any exposure is limited to less than four minutes,and the positive breathing pressure does not exceed ioo mmHg the incidenceof overt vascular lesions in the ear is very low. In a series of 400 subjectsexposed to pressure breathing under these conditions the total number ofovert lesions was four (personal observation). Although the application ofadequate pressurization to the external auditory meatus is the obviousmethod of overcoming the vasLular distension induced by pressure breathing,this procedure has a certain disadvantage. Since in the majority of subjectsthe increase of naso-pharyngeal pressure is not communicated to the middleear cleft, pressurization of the auditory canal will subject the tympanicmembrane to the same stresses as arise when the barometric pressure isincreased and thus introduce the risk of otitic barotrauma (73). With
97

RAISED INTRAPULMONARY PRESSURE
adequate instruction and training, however, the incidence of ear damage dueto this mechanism can be reduced to an insignificant level.Carotid Baroreceptora - The rise of the transmural pressure of tile vesselsof the neck normally induced by pressure breathing is prevented by inflationof a bladder around the neck to the same pressure as that applied to therespiratory tract. Thus deflation of the neck cuff increases the vascular trans-mural pressures in this region. The present study showed that a suddenreduction of neck bladder pressure during pressure breathing produces atransient bradycardia and a maintained reduction of the arterial pressure.These cardiovascular effects constitute the characteristic response to stimula-tion of the carotid artery stretch receptors which was first described by Hering1924 (151). It is probable, therefore, that the effects of removal of counter-pressure to the neck during pressure breathing arise reflexly from stimulationof the stretch receptors in the walls of the carotid arteries.
The exact relationship between the decrease of pressure in the cuff aroundthe neck and -he change of the transmural pressure of the carotid arteries isuncerta'n. When a bladder restrained by an outer non-distensible layer isused to exert pressure on the skin, the pressure applied will only equal thatof the gas within the bladder if there is no tension in the inner layer of thebladder. Whilst this situation existed over much of the neck covered by thebladder there was tension in the wall of the bladder where it was reflected offthe skin at its upper and lower borders. Thus the regions of the neck coveredby the borders of the bladder were not subjected to the total pressure of thegas in the bladder. The upper border of the bladder was fixed as high aspossible in an attempt to ensure that full counterpressure was applied to theskin overlying the carotid sinus region. It has been shown (Ernsting, 1955)(91) that a rise of the pressure within the fore-arm vessels induced by pressurebreathing caused no significant increase of the local tissue pressure so that theentire increase of the pressure difference between the tissues and the bloodwithin the lumen of the vessel occurred at the vessel wall. The presence in theneck of the strong superficial and deep layers of cervical fascia together withthe dense carotid fascial sheath may modify this relationship between thetissue pressure and the intravascular pressure. No direct measurements of thetissue pressure within the carotid sheath have been made during pressurebreathing.
The magnitude of the cardiovascular changes produced by removal ofcounterpressure from the neck during pressure breathing suggests, however,that a considerable fraction, if not all, of the pressure difference between thelumen of the vessels and the skin of the neck occurs across the vessel walls.The electrocardiographic changes seen following a large reduction of neckcuff pressure showed that the afferent discharge evoked by stimulation of thecarotid artery stretch receptors affected both the heart rate and the rate ofconduction by the atrio-ventricular bundle. The lengthening of the conduc-tion time of the atrio-ventricular bundle was, however, of much shorterduration than the effect upon the sinuatrial node. This pattern of chrnges istypical of those mediated by the vagal efferent fibres to the heart. In oneexperiment in which the cuff pressure was reduced by 8o mmHg atrio-ventricular dissociation occurred for several beats immediately following theapplication of the stimulus owing to severe depression of atrio-ventricular
98

LIMITATIONS OF VARIOUS TECHNIQUES
conduction. The abolition of these effects by atropine demonstrates con-clusively that they were mediated by vagal efferent fibres. The transientnature of the cardiac slowing produced by deflation of the neck bladder is thetypical reflex response to maintained stimulation of the carotid artery baro-receptors.
Thus, Hering 1927 (15a) demonstrated that in animals the bradycardiainduced by carotid sinus stimulation was ofsudden onset, that its maximumeffect was attained within a few seconds and that it was poorly maintained.Winder 1937 (287) concluded that the rapid recovery of the heart ratefollowing stimulation of the carotid baroreceptors was due to afferent impulsesarising from the aortic baroreceptors which were stimulated by the fall ofarterial pressure induced by the carotid baroreceptor discharge. There was aclose relationship between the intensity of the stimulation, reduction of neckbladder pressure and the cardiac response, bradycardia, in each experiment.A similar quantitative relationship was found by Ernsting and Parry 1957(98) who stimulated the carotid artery stretch receptors by applying varioussubatmospheric pressures to the surface of the neck. Bronk and Stella 1932(49) demonstrated that the intensity of the afferent discharge in the carotidsinus nerve bears a direct relation to the height of the arterial blood pressure.Thus in the present experiment, deflation of the neck bladder would beassociated with an increase in the intensity of the afferent activity fiom thecarotid sinus receptors and this increase in activity would be related directlyto the magnitude of the reduction of neck bladder pressure.
The reduction of systemic arterial pressure produced by removal ofcounterpressure to the neck was maintained after the initial phase of cardiacslowing when the heart rate had returned to the prestimulation level. It alsoremained following abolition of the cardiac slowing by the administration ofatropine. Thus the continuing arterial pressure response was independent ofthe change of heart rate normally induced by this stimulation. As with theheart rate response, the linear relationship between the change in neck bladderpressure and the response of the mean artzciial pressure was demonstrated ineach of the subjects used in the investigation. A similar relationship wasdemonstrated by Ernsting and Parry 1957 (98) when the carotid stretchreceptors were stimulated in resting subjects. After atropinization the systemicarterial pressure fell relatively slowly when counterpressure was removedfrom the neck. Hering 1927 (152) demonstrated that the vasomotor re-sponse to carotid sinus stimulation was slower to develop than the cardiacslowing.
In order to elucidate the cardiovascular mechanism by which neck bladderreduced the arterial pressure, an attempt was made to determine the effectsof this manoeuvre upon the blood flow through the forearm. Pressure breath-ing of the magnitude used in the present investigation causes a considerablerise of venous pressure and this is associated with distension of the capacityvessels of the limbs. Thus, conventional venous occlusion plethysmography(21) could not be used to measure the blood flow through a limb segmentsince this technique requires that the capacity vessels should be capable ofreceiving blood during the period that the venous cuff is inflated without thepressure within them rising significantly. The distension of the capacityvessels in pressure breathing can be prevented or reduced, however, by
99

RAISED INTRAPULMONARY PRESSURE
applying external counterpressure. In the present study counterpressure wasapplied to the upper limb by air by means of a box enclosing the limb, so thatthe circumferential gauge would function satisfactorily. A pressure equal tothat which was applied to the respiratory tract was used within the boxencircling the limb.
Since frequently the rise of peripheral venous pressure induced by pressurebreathing is not quite as great as the pressure applied to the respiratory tract,the transmural pressures o" the capacity vessels o:" the limb exposed to gascounterpressure during pressure breathing may have differed from thosewhich existed at rest. However, this difference could not be great and prob-ably amounted to only 2 to 5 mmHg at a positive breathing pressure of 6ommHg. Further, once the initial vascular disturbances produced by thebeginning of pressure breathing subsided the transmural pressures of thevessels of the limb within the box remained constant. Thus whilst consider-able difficulties arise if this technique is used to measure the change of bloodflow induced by pressure breathing as compared with the resting state, it willgive a satisfactory measure of changes of blood flows arising during pressurebreathing once the initial disturbances produced by this manoeuvre havesubsided. Further evidence in support of this contention may be obtainedfrom the shape of the record of forearm volume following inflation of thevenous collection cuff.
During the five seconds that the collecting cuff was inflated the limbvolume increased at a constant rate. There was no evidence, therefore, of anyreduction of the arterial inflow during the collection period. Although it isprobable that the measurements of forearm blood flow obtained duringpressure breathing did not reflect the arterial flow into the forearm whichwould have occurred in the absence of counterpressure to the surface of thelimb, they suggest that pressure breathing reduces the blood flow into thisregion. There is considerable evidence that such a reduction of blood flow isproduced by pressure breathing at much lower pressures. Thus Fenn andChadwick 1947 (102) found a reduction of finger blood flow during pressurebreathing at 30 mmHg, whilst Blair, Glover and Kidd 1959 (37) demon-strated a reduction of forearm blood flow which varied from 13 to 6o(,) of theresting value in subjects exposed to pressure breathing at 15 mmHg. Personalmeasurements of peripheral vascular resistances in the forearm using thetechnique developed by Hayter and Sharpey-Schafer 1958 (142) have shownthat pressure breathing at 6o mmHg with trunk counterpressure producesa 200 to 300% increase of vascular resistance.
The removal of the counterpressure to the neck during pressure breathingcaused a reduction of khe blood flow through the forearm (Fig. 3-18). Sucha reduction of flow could have been the result of either a fall of the effectivedriving pressure, i.e. the difference between mean arterial and venouspressures, or an activc constriction of the resistance vessels in the forearm.When the neck buff was deflated there was a fall of arterial pressure (Fig.3-17) and since the venous pressure was unchanged there was a reduction ofdriving pressure. It is possible to calculate the approximate value of thedriving pressure associated with a given pressure in the neck bladder and agiven breathing pressure from the aterial pressure measurements (Fig. 3-17).Thus at a positive breathing pressure of 8o mmHg reduction of the neck cuff
1oo
-... .. .... .. ,L_* - - .

LIMITATIONS OF VARIOUS TECHNIQUES
pressure by 40, 6o and 8o mmHg reduced the driving pressure by approxi-mately 20, 3o and 4o0',, respectively. Thus the reduction of blood flowthrough the forearm produced by deflation of the neck bladder was directlyproportional to the corresponding decrease of driving pressure.
It follows, therefore, that the fall of the blood flow was produced by thereduction of the arterial pressure and that there was no significant change ofarteriolar resistance in the forearm when the carotid artery stretch receptorswere stimulated by removal of counterpressure to the neck. A similar re-lationship between blood flow through the forearm, hand and calf and thesystemic arterial pressure was found by Ernsting and Parry 1957 (98) whenthe carotid baroreceptors were stimulated in resting subjects by reducing thepressure around the neck. Roddie and Shepherd 1957 (248) studied thecardiovascular responses to a fall of pressure in the carotid sinus produced bycompression of the common carotid arteries. They found that this procedureproduced no significant chaiige of the resistance offered by the vessels ofthe forearm, calf and hand. These results are in conflict with measurementsof limb blood flow made in animals. Thus Heymans, Bouckaert and Dautre-bande 1931 (155), Grimson and Shen 1939 (132) and Lindgren and Uvnas1954 (192) found that stimulation of the carotid sinus baroreceptors pro-duced by a rise of the transmural pressure caused an active vasodilatation inthe limbs. The conditions of these animal experiments differed considerably,however, from those of the human studies, both in the form of the preparationand the size and nature of the stimulus applied to the carotid barore-ceptors.
The maintained reduction of systemic arterial pressure produced bystimulation of the carotid baroreceptors during pressure breathing is not dueto an arteriolar dilatation in the limbs. No further analysis of the cardiovascu-lar changes induced by the removal of counterpressure to the neck was madeduring pressure breathing. Ernsting and Parry 1957 (98), however, studiedthe effects of increasing the transmural pressure of the carotid arteries inresting subjects upon the cardiac output. They measured the cardiac outputby the direct Fick method tbllowing right heart catheterization in two sub-jects at rest and whilst various subatmospheric pressures were applied to theneck. In their experiments a reduction of the pressure around the neck of 4ommHg caused no significant change of the cardiac output. In view of thisfinding it was suggested that the fall in arterial blood pressure produced bystimulation of the carotid baroreceptors was caused by a reduction of vascularresistance and that the site of this arteriolar dilatation was not in the limbs.The probable site of the arteriolar dilatation is the splanchnic circulation.This conc~usion is supported by the results of many investigations of theeffects of a rise of carotid sinus pressure in animals. Heymans, Bouckaertand Dautrebande 1931 (155) demonstrated mesenteric vasoconstrictionfol'owing a drop of carotid sinus perfusion pressure and emphasized theimportant role played by the mesenteric vessels in the reflex response to,carotid baroreceptor stimulation. Simrilar active vasoconstriction in responseto a fall of carotid sinus pressure has been demonstrated by Heymans 1929
(154) in the kidney. Although no 6;:'oiled analysis of the cardiovascularchanges underlying the reduction o, stemic arterial pressure produced bycarotid artery baroreceptor stimulation has been undertaken during pressure
Ifo
• , m n n I I I
RAISED INTRAPULMONARY PRESSURE
breathing there would appear to be no reason why the same mechanismshould not be operative under these conditions.
Thus the absence of counterpressure to the neck during pressure breathingmodifies considerably the cardiovascular changes induced by thi:. procedure.The use of an oronasal mask reflexly reduces the normal increase of systemicarterial pressure. The order of this reduction is 1o to 25 mmHg at a positivebreathing pressure of 6o mmHg. This relative hypotension is probably theresult of dilatation of the resistance vessels in the splanchnic circulation andit will lead to an altered distribution of the cardiac output. Thus the differencebetween the carotid artery and jugular venous pressures will be reduced by"some 15 to 300o by the use of an oronasal mask in place of a pressure head-piece. Such a reduction of the cerebral arterio-venous pressure gradientmight be expected to produce a significant fall of blood flow through thebrain. It is likely, however, that this effect is of less importance than thecerebral vaso-constriction produced by hypocapnia (169) which arises fre-quently during pressure breathing. There is no evidence that these changes ofregional blood flow produce any significant effect upon overall performanceduring short duration exposures to high pressure breathing.
A further possibility to be considered, however, is that the specific cardio-vascular changes induced by stimulation of carotid artery stretch receptorsmay lead to syncope during pressure breathing. In certain susceptible sub-jects mechanical stimulation of the carotid sinus region produces syncopewith a marked bradycardia and hypotension (283). The primary mechanismunderlying these effects of carotid sinus stimulation is reflex cardiac slowing.Frequently the heart ceases to beat for five to ten seconds and unconsciousnesssupervenes. This form of syncope always follows immediately upon theapplication of the stimulus and is not accompanied by the facial pallor, nauseaand sweating which typify vasovagal syncope (187). All the incidents ofsyncope which have been observed during pressure breathing have been ofthe vasovagal type. It has been seen that the absence of counterpressure to theneck during high pressure breathing gives rise to severe discomfort in certainsubjects in addition to stimulation of the carotid artery stretch receptors.Discomfort and pain alone are potent causes of vasovagal syncope duringpressure breathing. It is probable, therefore, that the discomfort produced inthe neck by the use of an oronasal mask is the cause of syncope during pressurebreathing rather than the concomitant stimulation of the carotid baroreceptors.
CONCLUSIONS
The experiments described in this chapter have shown that whilst thereare limitations to the use of an oronasal mask to deliver gas under pressure tothe respiratory tract, this technique is highly effective in certain circum-stances. Whilst various types of oronasal mask have been employed in aviationfor continuous positive pressure breathing at positive pressures of up to 30mmHg since 1943 (119) (Roxburgh, personal communication) the value ofthis method at greater breathing pressures had not been studied. The scopeof the present investigation was limited in that the exposures to pressurebreathing were of relatively short duration, a single exposure to a positivepressure in excess of 5o mmHg lasting only two minutes. When the durationof the exposure to a positive breathing pressure of 6o mmHg is extended
102
- .______________"____
LIMITATIONS OF VARIOUS TECHNIQUES
to six minutes (94) the disturbances which are produced are similar tothose which were found in the present study. The intensity and incidenceof discomfort around the neck rises, however, with the increase of theduration of the exposure. The present study has demonstrated that highpressure breathing with a mask induces disturbances iii the eye, the ear andthe neck. Two of these disturbances set the limit to the maximum pressurewhich normal subjects will tolerate with this method of pressure breathing.These are discomfort owing to stretch of the soft tissues of the neck and spasmof the eyelids. The influence of the pressure at which the gas is delivered uponthe incidence of these effects is such that the practical limit to the use of thistechnique is a positive breathing pressure of 65 mmHg. It may be concludedfrom the experiments described above that, provided the duration of thepressure breathing period is limited to two minutes, this pressure will beaccepted by normal subjects and that no significant damage will be producedin the head and neck.
This stud'y has shown, however, that the use of an oronasal mask to delivergas under pressure to the respiratory tract has disadvantages even when thepressure and the length of the exposure are within the limits given in theprevious paragraph. Distension of the neck causes some discomfort at positivebreathing pressures of greater than about 30 mmHg. The pressure of the edgeof the mask against the face is also a source of discomfort. All the specificdisturbances caused in the head and neck by pressure breathing with anoronasal mask may be prevented by the use of a suitably designed headpiecewhich ensures a pressure equal to that applied to the respiratory tract isapplied to the surface of the head and neck. In many situations in aviation,however, where the maximum positive breathing pressure required in anemergency will not exceed 65 mmHg and the total duration of the exposureto pressure breathing will not exceed two minutes, the advantages of wearingan oronasal mask instead of a pressure headpiece during routine flight out-weigh the disadvantages of using this method for emergency protectionagainst exposure to high altitude.
When either the positive breathing pressure or the length of the exposureto pressure breathing exceed the limits which are imposed by the use of anoronasal mask, some form of pressure headpiece must be used. In its simplestform a pressure headpiece consists of a spherical globe which encircles thehead and which has a circular seal through which the head is inserted andwhich abuts against the skin at the root of the neck. There are, however,several practical difficulties in the construction of such a headpiece. rurther,a headpiece of this type may prove bulky and may significantly reduce theefficiency of the user. Thus there is room for a further compromise. Theresults of the experiments described in this chapter suggest that, at a mini-mum, a pressure headpiece should apply counterpressure to the face, thefloor of the mouth, the external auditory meati and the neck. Practicalpressure headpieces by means of whizh counterpressure may be applied tothese regions, with the exception ,i the external ear, have been developed andused in flight (R.A.F. partial pressure headpiece, Chapter 2). The absence ofcounterpressure to the auditory meati limits the use of this type of pressurehelmet to a maximum positive breathing pressure of approximately toommHg, with an exposure time not exceeding four minutes. When the
103
RAISED INTRAPULMONARY PRESSURE
magnitude of the breathing pressure is reduced the duration of an exposuremay be extended. Thus a partial pressure headpiece may be used to deliver apositive breathing pressure of 5o mmHg for at least thirty minutes withoutany significant disturbance arising in the head and neck.
There are, therefore, three practical methods by which gas may bedelivered to the respiratory tract at a pressure above that of the immediateenvironment. When this positive breathing pressure does not exceed 65 mmHgand the duration of an exposure is limited to less than four minutes a pressuresealing oronasal mask will suffice. A partial pressure helmet by whichcounterpressure is applied to the face and neck is suitable for short durationexposures to positive breathing pressures of up to about too mmHg. Whenthese time limits are exceeded a pressure headpiece which encloses the entirehead qnd neck must be used.
104

CHAPTER 4
THE MECHANICS OF RESPIRATION DURINGPRESSURE BREATHING AND THE EFFECTS
OF CHEST AND TRUNK COUNTERPRESSURE
INTRODUCTION
One of the most striking effects produced by the delivery of gas to therespiratory tract at a pressure greater than that of the environment is theincrease in the volume of gas in the lungs. In a subject who is instructed torelax his respiratory muscles the lungs are fully distended when the pressuredelivered to the mouth is of the order of 20 to 25 mmHg and if this pressureexceeds 8o to too mmHg, tearing of the lung parenchyma may occur (144).In a normal subject, however, the expiratory muscles are contracted through-out the respiratory cycle during positive pressure breathing at pressures ofgreater than about to mmHg. Experience has shown that pressure breathingcan be performed continuously for ten to twenty minutes at a breathingpressure of3o mmHg (t6t). If the pressure is raised above this level expirationbecomes very difficult and extreme fatigue sets in very rapidly. In practicethe maximum positive pressure at which this form of continuous pressurebreathing can be used is 30 mmHg. The distension 4f the lungs and thedifficulty of expiration associated with pressure breathing may be reduced orprevented by applying pressure to the outer surface of the trunk (30). In thisstudy of the respiratory disturbances induced by breathing at pressures of upto 130 mmHg two forms of respiratory counterpressure were used. A standardR.A.F. garment, the pressure breathing waistcoat, which applies counter-pressure only to the chest, was used in certain preliminary experiments. Itrapidly became obvious, however, that more complete respiratory counter-pressure was necessary at the higher breathing pressures. The pressure jerkinwhich provides counterpressure to the whole trunk was developed. It wasfound that this garment would allow pressure breathing at pressures of up to130 mmHg without any gross subjective disturbance of breathing.
The disturbance of the mechanics of respiration induced by pressurebreathing and the influence of various degrees of respiratory counterpressureupon these disturbances have been investigated in detail at ground level. Themaximum positive breathing pressures used in these experiments were limitedby the cardiovascular effects of raised intrapulmonary pressure. Thus whencounterpressure was applied to the chest alone the maximum positive pressurewhich could be used was 8o mmHg. When a pressure jerkin was worn theeffects of posit've breathing pressures of up to too mmHg were studied. Theeffects of positive breathing pressures above ioo mmHg were not smudied indetail because of the absence of a pressure headpiece which applied adequatecounterpressure to the external auditory meati. The experiments performedin this part of the investigation were carried out using four subjects, each ofwhom had had considerable experience of pressure breathing, both with and
o05

RAISED INTRAPULMONARY PRESSURE
without respirator)y counterpressure. The physical characteristics of thesubjects are shown in Table 4-1. The mechanical behaviour of each subject'srespiratory apparatus was determined in a preliminary investigation bymeasuring the relaxation pressure-volume curve of the lungs and thoraciccage. The effects of pressure breathing and of varying degrees of respiratorycounterpressure were investigated by measuring the total lung volume and itssub-divisions, the respiratory flow, the intraoesophageal and intragastricpressures and by radiographic studies.
EXPERIMENTAL INVESTIGATIONS
Relaxation Pressure Volume Curve - The relaxation pressure volumecurve of the lungs and thoracic cage was determined for each of the foursubjects used in this investigation. The seated subject was connected by way ofa mouthpiece and a wide bore tube to a closed circuit consisting of a recordingspirometer, carbon dioxide absorber and a circulating pump filled withoxygen. A water manometer was attached to the mouthpiece. At approxi-mately one minute intervals the subject either inhaled or exhaled to changehis lung volume and the tap between the mouthpiece and the spirometer wasthen closed. The subject was instructed to relax his respiratory muscles. Thereading of the water manometer was taken and the mouth tap was open sothat the subject was reconnected to the spirometer circuit. Each subjectrepeated this manoeuvre at various volumes above and below his normalresting functional residual capacity. An average of 20 points were obtainedin this manner for each subject. Whilst connected to the spirometer circuitthe subject also performed several maximum inspirations and expirations.The volume of gas within the respiratory tract in excess of the subject'sresidual volume corresponding to the relaxation pressures recorded at themouthpiece was obtained from the spirometer record.Results - The values of the mouthpiece pressures obtained during relaxationwere plotted against the corresponding lung volumes expressed as the volumein excess of the residual volume for each subject. A typical curve is presentedin Fig. 4-1. The shape of the curve obtained from each subject was verysimilar, being slightly sigmoid. A composite relaxation pressure volume curvewas calculated from the experimental results obtained with the four subjects.In ordeer to facilitate this calculation, lung volumes for each subject wereexpressed as a proportion of the subject's resting vital capacity. The meancomposite relaxation pressure volume curve is presented in Fig. 4-2.Sub-Divisions of the Total Lung Volume - Measurements of the vitalcapacity, its sub-divisions and of the residual volume were made with the foursubjects seated at rest and whilst pressure breathing. Pressure breathing wasperformed with no respiratory counterpressure or whilst using either a pressurewaistcoat or a pressure jerkin. In all the experiments the subject wore themodified pressure helmet fitted with a mouthpiece. For the determination ofthe vital capacity and of the expiratory and inspiratory reserve volumes thismouthpiece was connected to a wide bore "T" piece. The subject, wearingthe appropriate pressure garment, sat within the decompression chamber. Apair of hoses (3.1 cm I.D1.) connected the "T" piece attached to the mouth-piece to a 7.5 litre recording spirometer placed outside the decompressionchamber The closed circuit so formed also contained a gi.s circulating pump
io6

MECHANICS OF RESPIRATION
TABLE 4-I
The physical characteristics of the subjects used in the studyof the mechanics of respiration
Subject Age Height Weight(yr) (cm) (kg)
A 30 179 76.3B 29 177 67.5C 22 173 71.5D 23 168 66. i
TABLE 4--2
The mean values of vital capacity and expiratory reserve volumeobtained in duplicate experiments with four subjects
Positive breathingpressure Vital capacity Expiratory reserve volume(rimHg) (,, resting value), (' resting vital capacity)!
mean S.E. mean S.E.
Rest 100.0 ±1.1 30.7 ±3.5Pressure breathing(a) No counterpresure
10 102.12 ±0.9 50.52 ±3520 104.33 11.2 7o.93 _---14.130 1o6.43 ±1.6 8o.8 3 `3.635 I°6.7 ± 1.7 85.53 ±2.5
(b) Chest couaterpressure20 101.8 ±I.7 56.53 ±4-140 1o6.2 3 1.6 67.5 3 ±3.56o 109.23 -1.5 79.3' ±4.980 108.93 -1.6 81.5' ±4.1
(c) Trunk cunterpressure20 99.1 ±I.5 37.62 ±2.540 102.0 ±1.6 35.12 ±3.56o 104.53 ±1.4 39.53 ±3.080 105.23 ±1.5 41.63 -:2.5
1 All values expressed as a percentage of the mean resting vital capacity (5.26 litreB.T.P.S.).
Significance of difference from resting value.3 o.oo ,1 p <:, o.o 13 PP< 0.01
107
..............................................................- 4

!,G SJAIt $•
:S
pat 9,10DC (C.e atv),
Fic.. 4-t The relaxation pressure volume curve of the lungs and thoracic cage ofsubject B. The mouth pressure generated with the respiratory, muscles relaxed has
been plotted against the corresponding lung volume
* 0
40
FIG. 4-2 The mean relaxation pressure-volume curve of the lungs and thoracic cagefor the four subjects. The lung volumes have been expressed as a proportion of the
correspdanding resting vital calacity
soo
MECHANICS OF RESPIRATION
and a carbon dioxide absorbe:. Care was taken to ensure that no leakageoccurred from the portion of the closed circuit situated within the de-compression chamber when the pressure within the chamber was reduced to15o mraHg less than atmospheric pressure. The face compartment of thehelmet and the bladder of the pressure garment, when one was worn, wereconnected through wide bore tubing to the exterior of the decompressionchamber. The closed circuit was filled with ioo",, oxygen and the helmetplaced on the subject's head, after his nostrils had been occluded with a clip.Following an initial rest period of three to five minutes the subject was askedto perform three slow maximal inspirations and expirations, each separatedby a period of quiet breathing. The pressure in the decompression chamberwas then reduced by the desired amount in order to induce pressure breath-ing. Pressure breathing was continued for one to two minutes and then thesubject was instructed to repeat the vital capacity manoeuvres. Two to threeminutes after the cessation of pressure breathing the subject performed amaximal inspiration and expiration a further three times.
The residual volume of the lungs was measured by the nitrogen dilutiontechnique developed by Rahn, Fenn and Otis 1949 (241). In this group ofexperiments a two-way wide bore tap was connected to the mouthpiece of themodified pressure helmet. A rubber bag with a capacity of 3 litres wasattached to one limb of the tap. The other limb was connected by means of a"T" piece to a pair of wide bore pipes which passed to the exterior of thedecompression chamber. A non-return valve was placed in each of these pipesto ensure the unidirectional flow of gas within them. The rubber bag wasenclosed within a io litre aspirator bottle which was also connected to theexterior of the decompression chamber by a wide bore pipe. A side tappingwas placed in the limb of the tap to which the rubber bag was attached.Before a measurement was made the rubber bag and the connecting limb ofthe two-way tap were flushed with oxygen and the bag was sucked empty.Then with tl.e tap turned so that the bag was isolated 2 litres of oxygen werecarefully measured into it. After the remainder of the circuit had been flushedwith air the subject donned the appropriate pressure clothing and the helmet.At the desired time the subject was instructed to expire fully and hold hisbreath. The tap was then turned so that the mouthpiece was in direct com-munication with the bag. The subject breathed rapidly into and out of thebag taking three seconds to complete each respiratory cycle. He was instructedto completely empty the bag during inspiration and to breathe out as far ashe could during expiration. At the end of the third expiration the subjectagain held his breath and a sample of the gas in the mouth of the bag wastaken through the side tapping into a previously evacuated sampling tube.The tap was then returned to its original position and the subject allowed tobreathe in. The concentrations of carbon dioxide and oxygen in each of thesamples of gas were determined using the Haldane gas analysis apparatus. Inpreliminary experiments in which air was breathed throughout end-expiratory Haldane-Priestley samples of alveolar gas were obtained.
The values of the positive breathing pressures used were varied with thedegree of respiratory counterpressure. When no counterpressure was employedthe subject was exposed on two separate occasions to positive pressure breath-ing at 1o, 20, 3o and 35 mmHg arranged in a random order. With respiratory
lo9
RAISED INTRAPULMONARY PRESSURE
counterpressure, however, positive breathing pressures of 20, 40, 6o and 8omnmHg were used. Again each subject experienced each pressure twice andthe order of the exposure was randomized.
RESULTSThe vital capacity and its subdivisions - A typical spirometer recordobtained in an experiment in which the subject was exposed to pressurebreathing at a positive pressure of 30 mmHg without respiratory counter-pressure is presented in Fig. 4-3. When pressure breathing was induced therewas a sudden reduction of the volume of gas within the spirometer. Afterseveral breaths, however, a new end-expiratory level was attained. This levelwas maintained for the remainder of the pressure breathing period. Cessationof pressure breathing was accompanied by an equally rapid increase of thespirometer volume. The magnitude of the change of spirometer volumevaried with the breathing pressure, the degree of respiratory counterpressureand the subject. The vital capacity and expiratory reserve volume weredetermined from each experimental record for the control, pressure breathingand recovery periods. Each volume was corrected to the conditions presentin the respiratory tract, i.e. saturated with water vapour at body temperature.The values of vital capacity and expiratory reserve volume obtained for eachsubject during each recovery period did not differ significantly from thecorresponding control values. The control and recovery values were com-bined together, therefore, to give the resting values of these volumes.
In order to facilitate comparisons between one experimental condition andanother the values of vital capacity and expiratory reserve volume obtainedduring the exposures to pressure breathing have been expressed as a propor-tion (percentage) of the resting vital capacity. The means of the percentagevalues of vital capacity and expiratory reserve volume obtained in the dupli-cate experiments on the four subjects are presented in Table 4-2 and Fig. 4-4with their respective standard errors. There was a small increase of the vitalcapacity during pressure breathing, although the increase produced by agiven pressure was reduced when counterpressure was applied to either thechest or the trunk. Pressure breathing without respiratory counterpressurecaused a marked increase of the expiratory reserve volume, the value at apositive breathing pressure of 35 mmHg being two and a half times thecontrol value. The counterpressure given to the chest by the pressure waist-coat reduced the increase of the expiratory reserve volume caused by pressurebreathing. At a positive breathing pressure of 8o mmHg, however, theexpiratory reserve volume was some two and a half times the control value.When counterpressure was applied to the whole trunk by the pressure jerkinthere was only a small increase of the expiratory reserve volume.
The analysis of spirometer records obtained in these experiments wasextended to the measurements of the tidal volume. The mean tidal volumeshave been measured from each spirometer record over the last minute of thecontrol period and the !ast minute of the pressure breathing period. The meantidal volumes for the resting state and for each of the experimental conditionshave been calculated from the eight results obtained from the four subjects(Table 4-3). Pressure breathing caused an increase of the tidal volume,although there was a considerable variation of response between the four
1to

I M inutes I
FIG. 4- A typical spirornetric record obtained during the detertnination of the vitalCapacity and its sub-divisions during rest and pressure breathing at 30 mmHg
without respiratory counterpre-ssure

LUNG VOLUMt('1. RCSTtNC WtTsI. cU•€try 1
40.
ip
//
lS. /• --o
// /
/ tS /€//
/, 4iI/ ........----&--- -
0 C1ESTA TRUNK,
46 rauw
POSST1Vt S•ITlINO PitsSMt (-MA.
FIm. 4-4 The mean values for four subjects of the vital capacity (solid line) andexpiratory reserve volume (interrupted line) during pressure breathing with norespiratory counterpressure (X), with chest counterpressure (0) and trunk counter-pressure (L). The lung volumes have been expressed as a percentage of the resting
vital capacity
112
djiM• i i~----- a - .-. 1 - . , •

MECHANICS OF RESPIRATION
TABLE 4-3
THE MEAN VALUES OF THE TIDAL VOLUME
OBTAINED IN DUPLICATE EXPERIMENTS ON FOUR SUBJECTS
Positive breathing pressure Tidal volume (litre B.T.P.S.)(mmHg) Mean S.E.
Rest 0.69 ±-0.04Pressure breathing(a) No counterpressure
10 o.68 ±0.0520 0.71 10.0730 0.902 ±o.o635 0.942 ±o.09
(b) Chest counterpressure20 0.71 ±o.o640 0.781 ±0.056o 0.842 ±0.0780 o.95 -o-0.09
(c) Trunk counterpressure20 0.67 ±0.0540 0.71 ±0.046o 0.75 ±o.o680 o.81 ±0.05
Significance of difference from resting valueI o.ool .-- P -Z o.ol
P < 0.fx12 P~ 0.00o3u
TABLE 4-4
THE MEAN VALUES OF THE RESIDUAL VOLUME
OBTAINED IN DUPLICATE EXPERIMENTS ON FOUR SUBJECTS
Positive breathing pressure Residual Volume (litre B.T.P.S.)(mmHg) Mean S.E.
Rest 1.61 ±0-.04Pressure breathing(a) No counterpressure
10 1.731 4-0.0520 1.822 0.O0430 1.882 -4o.535 0.902 ±0.06
(b) Chest counterpressure20 1.721 4-0.0340 1.862 ±0.056o 1.912 ±o.o680 1.892 ±0.09q
(c) Trunk counterpressure20 1.751 ±+.o,"40 1.892 ±0.066o 1.862 ±0.0580 1.922 ±0.04
Significance of difference from resting value!o.,oo, < P- 0.0!I P< 0.o 0
113
1 ~* 1 I I II I

RAISED INTRAPULMONARY PRESSURE
subjects. In the absence of respiratory counterpressure all the subjects showeda considerzblc increase of tidal volume. In contrast there was only a smallincrease of tidal volume when trunk counterpressure was applied by thepressure jerkin.The residual volume - The residual volume was calculated from the dilu-tion of the alveolar nitrogen produced by re-breathing oxygen in the follow-ing manner:If
FAN2' = concentration of nitrogen in the alveolar gas before re-breathing
FANX2' = concentration of nitrogen in gas from neck of re-breathingbag at the end of the third expiration
F,2 v = concentration of nitrogen in oxygen placed in the re-breath-ing bag
Va = volume of oxygen in bag and the attached limb of the tap;corrected to the pressure and temperature conditionsexisting in the respiratory tract
VD = volume of apparatus from mouthpiece to tapthen the residual volume, Viz is given by:
VR = VB(FA.2-- F%'2) -(FA.N-z -- FA.xo-)
The initial studies of the alveolar gas composition when air was breathedduring the contro: and pressure breathing periods were performed in orderto determine the alveolar nitrogen concentration immediately prior to re-breathing of oxygen. These studies showed that pressure breathing caused nosignificant change of the concentration of nitrogen in end-expiratory Haldane-Priest!ey samples of alveolar gas. The mean concentration was 8o.oo0 ((S.E. ±o.o5) and this value was employed in the calculation of the residualvolume. The oxygen used in these experiments contained 0.30(, nitrogen.Finally the dead space of the apparatus, which was measured by water dis-placement, was 70 ml.
The residual volume of each subject was measured in duplicate at eachbreathing pressure with varying degrees of respiratory counterpressure. Themeans of the residual volumes obtained with the four subjects under variousexperimental conditions are presented together with their respective standarderrors in Table 4-4. Pressure breathing produced a small but significantincrease of the residual volume. The degree of increase varied with the typeof counterpressure applied to the trunk.Chest radiographic studies - Limited radiographic studies were made ofthe chest during pressure breathing with either chest or trunk counterpressure.Antero-posterior and lateral radiographs were taken of the chest with thesubject seated 6 ft from the X-ray tube. One pair of radiographs were takenat rest and a second pair Were taker, during pressure breathing with thepressure waistcoat or pressure jerkin at a positive pressure of 8o mmHg. Carewas taken to reduce to a minimum movement of the subject when pressurebreathing was induced. All the radiographs were taken at the end of a quietexpiration. These studies were conducted on the four subjects who wereexperienced in pressure breathing.
114
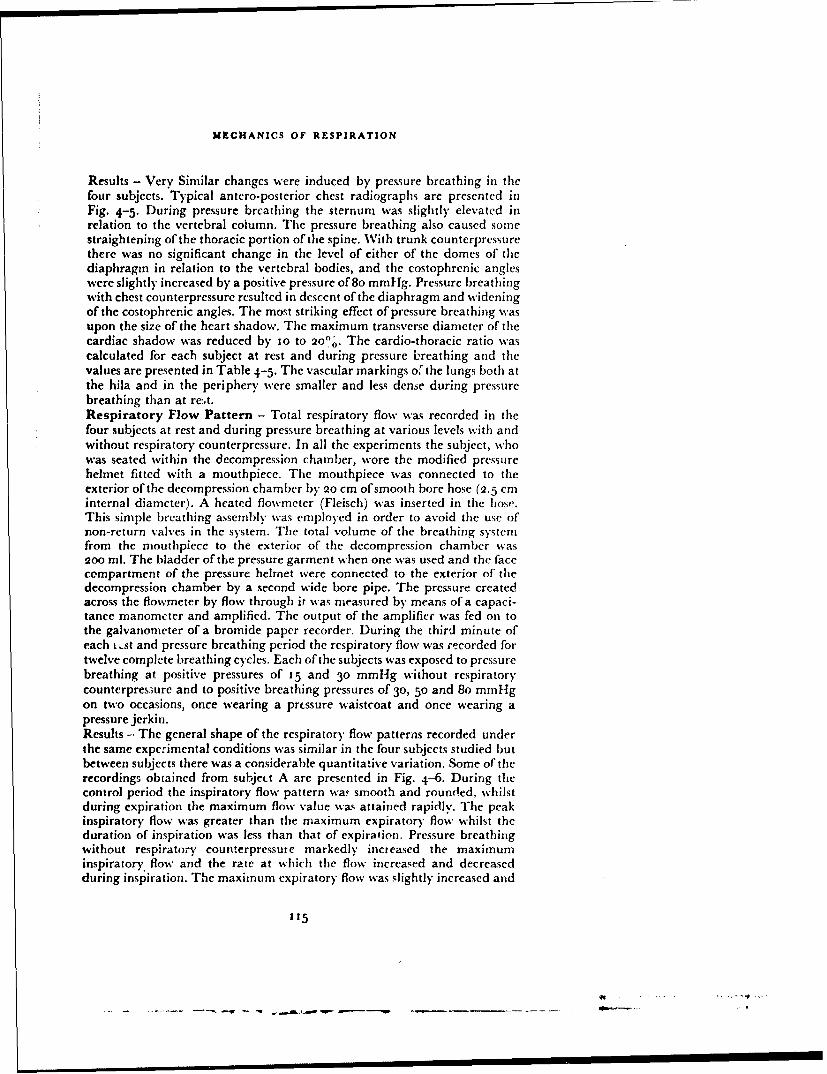
MECHANICS OF RESPIRATION
Results - Very Similar changes were induced by pressure breathing in thefour subjects. Typical antero-posterior chest radiographs are presented inFig. 4-5. During pressure breathing the sternum was slightly elevated inrelation to the vertebral coiumn. Tihe pressure breathing also caused somestraightening of the thoracic portion of the spine. With trunk counterpressurethere was no significant change in the level of either of the domes of thediaphragm in relation to the vertebral bodies, and the costophrenic angleswere slightly increased by a positive pressure of 8o mmHg. Pressure breathingwith chest counterpressure resulted in descent of the diaphragm and wideningof the costophrenic angles. The most striking effect of pressure breathing wasupon the size of the heart shadow. The maximum transverse diameter of thecardiac shadow was reduced by 1o to 200o. The cardio-thoracic ratio wascalculated for each subject at rest and during pressure breathing and thevalues are presented in Table 4-5. The vascular markings o&the lungs both atthe hila and in the periphery were smaller and less dense during pressurebreathing than at rest.Respiratory Flow Pattern - Total respiratory flow was recorded in thefour subjects at rest and during pressure breathing at various levels with andwithout respiratory counterpressure. In all the experiments the subject, whowas seated within the decompression chamber, wore the modified pressurehelmet fitted with a mouthpiece. The mouthpiece was connected to theexterior of the decompression chamber by 2o cm of smooth bore hose (2.5 cminternal diameter). A heated flowmeter (Fleisch) was inserted in the hose.This simple breathing assembly was employed in order to avoid the use ofnon-return valves in the system. The total volume of the breathing systemfrom the mouthpiece to the exterior of the decompression chamber was200 ml. The bladder of the pressure garment when one was used and the facecompartment of the pressure helmet were connected to the exterior of thedecompression chamber by a second wide bore pipe. The pressure createdacross the flowmeter by flow through it was measured by means of a capaci-tance manometer and amplified. The output of the amplifier was fed on tothe galvanometer of a bromide paper recorder. During the third minute ofeach i.st and pressure breathing period the respiratory flow was recorded fortwelve complete breathing cycles. Each of the subjects was exposed to pressurebreathing at positive pressures of 15 and 30 mmHg without respirator)ycounterpres3ure and to positive breathing pressures of 30, 50 and 8o mmHgon two occasions, once wearing a prcssure waistcoat and once wearing apressure jerkin.Results -. The general shape of the respirator), flow patterns recorded underthe same experimental conditions was similar in the four subjects studied butbetween subjects there was a considerable quantitative variation. Some of therecordings obtained from subject A are presented in Fig. 4-6. During thecontrol period the inspiratory flow pattern waF smooth and rounded, whilstduring expiration the maximum flow value was attained rapidly. The peakinspiratory flow was greater than the maximum expiratory flow whilst theduration of inspiration was less than that of expiralion. Pressure breathingwithout respiratory counterpressure markedly increased the maximuminspiratory, flow and the rate at which the flow increased and decreasedduring inspiration. The maximum expiratory flow was slightly increased and
115
- . I r I - - - -. ' -
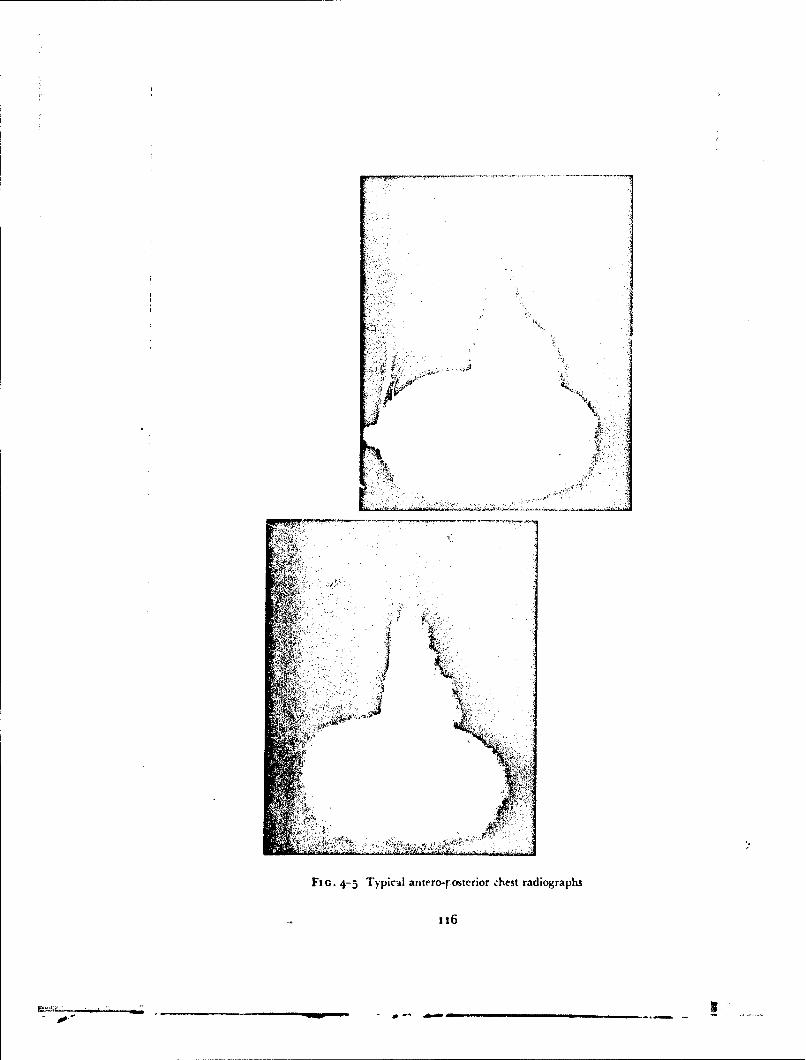
~t1
AV',
''A-
Fiu. 4- Typical antrro-r-ostcrior chest radiographs
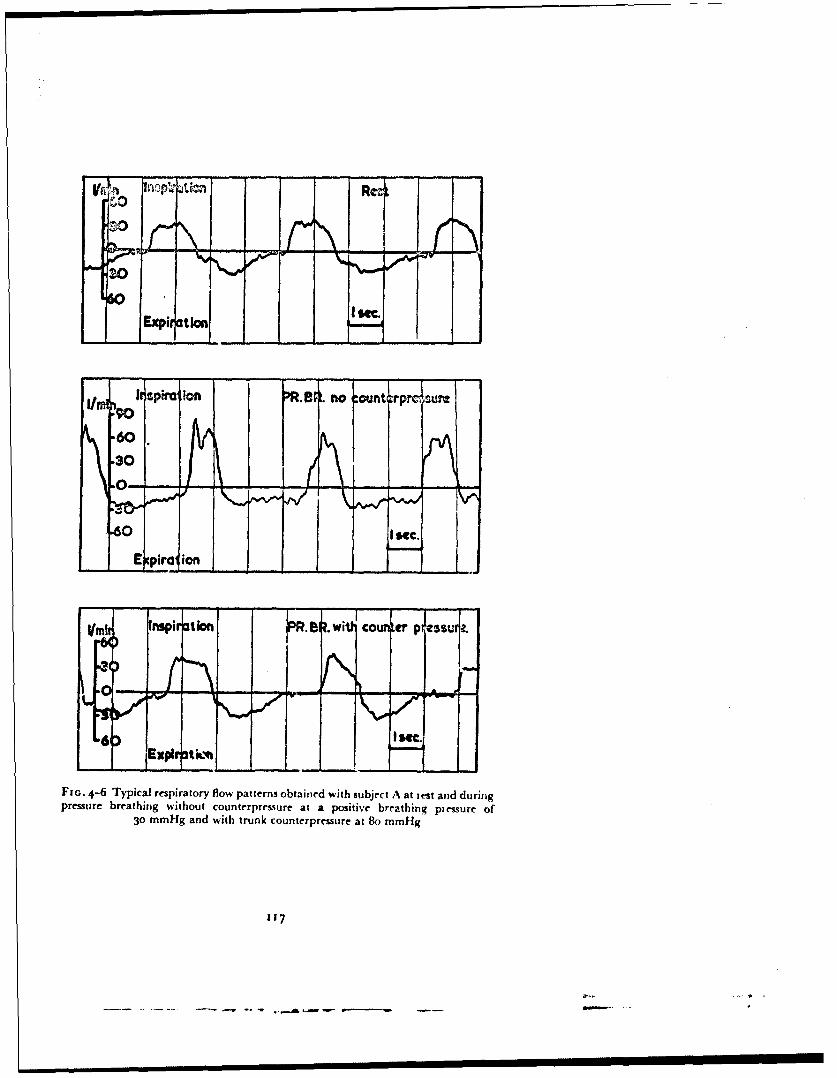
60
II -
Expir ation
It spolIon rR.19R. no :ounterp ,lum
.60.30
.0--"0M - 11 .....
60 Isec.
E pira ion
fInspirationl SR. .WiI counta Ptl"ssuj.
6 Expit tkm•...
FIo. 4-6 Typical respiratory flow patterns obtained with subject A at test and duringpressure breathing without counterpressure at a positive breathing piessure of
30 mmHg and with trunk counterpressure at 8o mmHg
117
S.. . ... .. .. . • .--- -. - A . .L•a e- ------- . ..

RAISED INTRAPULMONARY PRESSURE
TABL.E 4-5
THE CARDIO-THORACIC RATIO MEASURED
FROM ANTERO-POSTERIOR RADIOGI APHS OF THE CHEST
Cardi shoracic ratio
Subject Rest Pressure breathing' Pressure breathing'with chest counterpressure with trunk counterpressure
A 0.52 0.42 0.41B 0.50 0.41 0.43C 0.51 0.39 0.40D 0.49 0.38 0.41
1 At a pouitive breathing pre.-Jre ofgo mmHg.
TABLE 4-6
TIHE CHARACTERISTICS OF THE RESPIRATORY FLOW PATTET.VS
OBTAINED IN SINGLE EXPERIMENTS ON EACH OF FOUR SUBJECTS
(A)Positive breathing Maximum flow ( mrin.) Duration (sec.)
pressure Inspiration Expiration Inspiration Expiration(mmHg) Mean -S.E. Mean -. S.E. Mean Mean
Rest 39.4 --3-5 31.1 --±-3.2 1.94 z 69
Pressure breathing(a) No counterpressure
15 40.8 -4.0 34.6 •4.2 i.61 2. 230 6t.1 *-6.1 38.1 ±5.1 1.32 2.50
(b) Chest counterpressure30 50.o.. 3.9 30.5 -5.2 1.?2 2.6550 65.1 ±7.2 39.1 -4 .1 t.6t 2.718o 84.9 ±6.9 4V.6 =3.9 1.24 2.50
(c) Trunk cc unterpressure30 38.3 =3.2 34.1 -*-3.I 1.95 2.7550 40.5 ±-3.9 30.2 ±3.5 2.o6 2.50go 44.5 =4.1 31.7 ±3.2 2.01 2.49
(B)
Rate of change of flow (1, sec.2 )
Positive breathing pressure Inspiration Expiration(mmHg; Increase Decrease Incresse Decrease
Rest 1.81 1.25 1.38 0.53
Pressure breathing(a) No counterpressure
15 2.52 2.30 2.56 0.7930 6.43 4.31 5..t1 .09
(b) Chest counterpressure30 2,t6 3.05 2.97 0.0,50 3.51 3.-2 3.91 o.6i80 5.01 4-57 5.06 2.35
(c) Trunk counterpressure30 1.92 13.51 .61 0.7150 2.07 1.62 1.53 0.8380 1.85 1.59 t.63 0.75
- 18
AssP

MECHIANICS OF RESPIRATION
tended to be maintained through the greater part of this phase of therespiratory cycle. Similar changes were seen when counterpressure wasapplied v) the thorax during pressure breathing by means of a pressure waist-coat, although at the same breathing pressure the changes were less profoundwhen counteroressure was used. There were only smnall changes in thepneumo'achygrati when pressure breathing was performed with trunkcounterpre.,surc c en at a positive pressure of 8o mmHg.
Each experimental record was analyzed by measuring the maximuminspiratory and expiratory flows, the duration of the inspiratory and expira-tory phases and the rate of increase and decrease of respiratory flow at thebeginning and end of each phase of the respiratory cycle. Since in manybreaths the rate of change of flow varied continuously throughout therespiratory cycle, an arbitrary definition of this measurement was required.The mean rate of increase of flow was measured over the flow range from onetenth to one half the peak flow value. The mean rate of decrease of flow wassimilarly defined as the rate of decrease from a flow of half to one tenth of thepeak value. Each of these measurements was determined for the twelvebreaths recorded under each experimental condition and the mean values,and in certain instances the standard errors of the mean values, were calcu-lated. The results of these calculations are presented in Table 4-6. The valuesfor the maximum inspiratory and expiratory flows obtained ir. the four sub-jects have been averaged and these mean values are presentec in Fig. 4-7.Transpulmonary pressure - The behaviour of the .ranspulnionarypressure during pressure breathing was investigated bN measuring thedifference between the pressure in the oesophagus and that at -he mouth-piece. The simple breathing system used in the study of respiratory flowpatterns was also used in this investigation. In a proportion of these experi-ments a wide bore "T" piece was attached outside the decompressionchamber to the open en-i of the hose attached to the mouthpiece. The twoarms of this "T" piece completed a closed circuit which consisted of a record-ing spirometer, a carbon dioxide absorber and a circulating pump. Befoireeach experiment the circuit was flushed with oxygen. The balloon employedto transmit the pressure in the oesophagus was introduced through the mouthor nose and the polyethylene catheter attached to it was attached to one s;deof a capacitance presrure transducer. A lateral tapping in the mouthpiece wasconnected to the reverse side of the capacitance transducer. Respiratory flowwas measured by means of a heated Fleisch flowmeter placed in the pipebetween the mouthpiece and the chamber wall. The pressure drop createdacross the flowmeter by flow was recorded by a capacitance manometer andan appropriate amplifier. The amplified outputs of the two capacitance trans-ducers were fed on to the galvanometers of a bromide paper recorder. Therespiratory flow and mouth-intraorsophageal pressure difference were c' n-tinuously recorded for six to twelve complete respiratory cycles with faesubject at rest and whilst pressure breathing with various derces of respira-tory count erpressure. The recordings were made during the second and sub-sequent minutes ofe;'posure to pressure breathing. The spirorneter record wascarefully marked when the recording camera was started and stopped.Results - A typical experimental record obtained from a subject at rest andwhilst pressure breathing at a positive pressure of 30 mmHg with trunk
fi9
I - I. . I - -
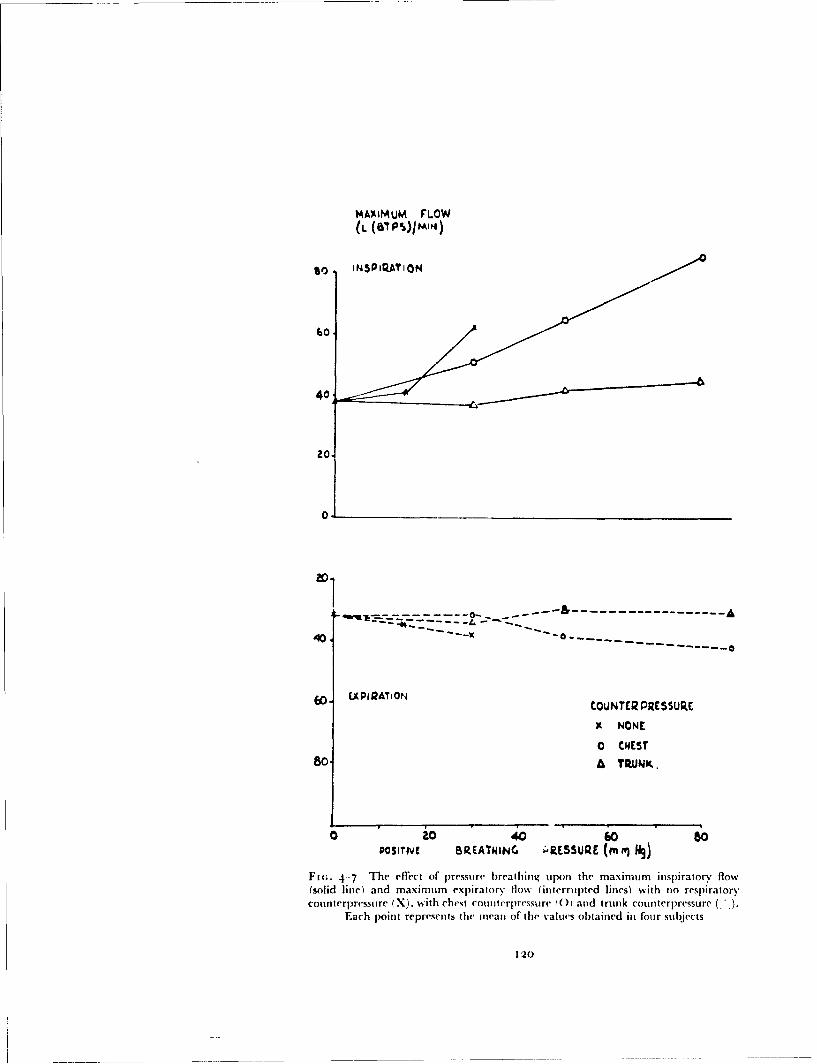
MAXIMUM FLOW(L (SIPS)jM14)
40
20
------- ---- - -
40.-
6o. APiQATION ,OUNTER PRESSURE.
9 NONE
0 CHEST
80 A TRUNK.
0 io 40 60 .80POSIrIVI BIREATNING •RESSURE (mR) iý)
Fit;. 4-7 The effect of pressure breathing upon the maximum inspiratory flow(solid line) and maximum expiratory flow (interrul)ted lines) with no respiratorycounterpresstre (X). with chest coutterpressure (0) and trunk counterpressure (
Each point represents the mean of the values obtained in four subjects
120
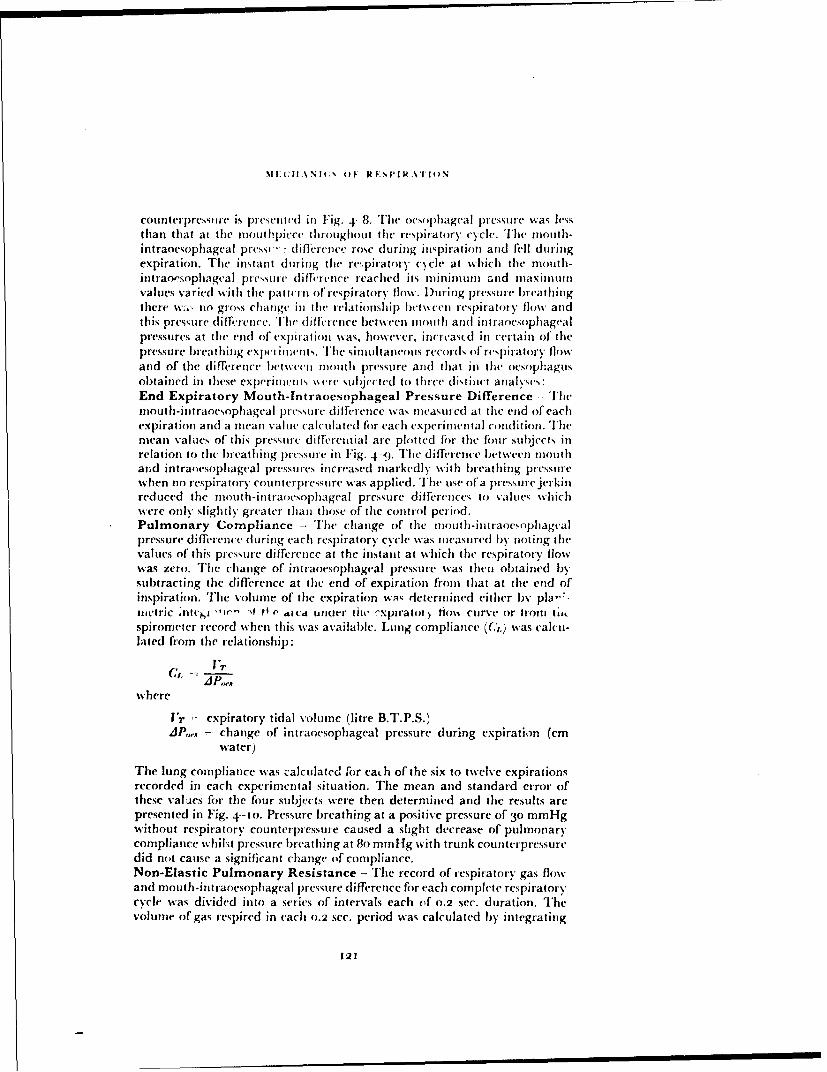
tE eItANiC's M: RESPI'iATi')N
Coul11terpressi IIre is presentied it) Fig. 4- 8. Thel( oe~sophaigeal jplesstiie was lessthan that at thre iout hpicce thr-oughout the respiratory cycle. T[he mouth-intraoesophiageal pressi , difl`ereYnee rose (luring inspiration arid fell duringexpiration. The instant during the repiratorv cqcle at which the mouth-intraorsopliageal prcssur(' d i ferenrce reached its minimium arid maximumvalues varied with thre pattcrn of respiratory flow. During pressure b~reathingthere no gross change iii the relationshipi between respiratory flow anidthis oressure difference. T1he (Iifleirence between niouthf and( in traoesophagealpressures at the end of expiration was, howe-ver, increas~d in certain of' (thepressure breathing expel imJent. The siniuiltaneous records of' rcspiratoi'y flowanid of the di fference betwecti mouthi pressure and( that inl thle ocsopihagusolbtained in these expe'rimnieits ss crc subjected to three dkitjinet analycsesEnd Expiratory Mouth-Intraoesophageal Pressure Difference TIhemouthl-i ntitraoesophagcal pressurec di ffer ence was nin(asured at the end of eachexpiration anid a mecan value calculated for each experimental condition. '[hemean v'alunes of' this pressure di flerential are plot ted for the four subjects inrelation to the b)reathinig ptcsif if' Fig. 4-9. T1he difference between mouthanid intraoesopliag('al pressur-es increased markedly with b~reathing pressurewhen no respir-atory con nterpressure was applied. 'Il'he use of' a pt-essu re jerki nreduced the niouth-intraoesopliageal pressure difrerences to values whichwere only slightly greater thtan those of the control period.Pulmonary Compliance - 'The change of' the mlouiti-intiraoesopiiagealpressure difference dur-ing each rcspirators' cycle was mecasur-ed by noting thlev'alues of this pressure difference at the instant at which the respiratory' flowwas zero. The change of intraoesophageal pressure was thieir ob~tained bysubtracting the difference at the end of expiration fromn that at the end ofinspiration. T'he volume of the expiration ww; determined eith('r liv pla"---mletric al,el -1-'w t 04e tm ct under the ý'xpiratmn) tio\, curve or fromTI tUK
spiromeiter record when this was available. Lung compliance ( 1 )was caicui-lated from the relationship:
CL
%%here
VT expiratory tidlal volume (litre B.T.P.S.)4ý,~ - change of intraoesopliageal pressure during expiration (cm
water)
The lung compliance was calculated for eaLh of the six to twelve expirationsrecorded in each experimental situation. The mean and standard error ofthese va~ies for the four subject~s were then determined and the results arepresented in Fig. 4.-to1. Pressure breathing at a positive Pressure Of 30 mmHgwithout respiratory counterpressure caused a slight decrease of pulmonarycompliance whIil:it pressure bre'athing at go rmmHg with trunk counterpressuredid not cause a significant change of compliance.Non-Elastic Pulmonary Resistance -T'Ihe record of respiratory gas flowanid month-intraoesophageal pressure difference for each complete respiratorycycle Isas divided into a series of intervals each (If 0.2 sec. duration. TheVolumne of gas respired in e'achi 0.2 sec. period was calculated by integrating
121

r 0 Flow I./min. InspirationRetn
0 Olmoph"geoi
pressure. cm. H~o.
50S Flow I./mn. Inspiration Pressure breathin~g.
ExKpiration
O Onoohoqiol.4pressure. cmfHjo.
I sec.
Ft 1. 4 8 A record of trntuth-irtraorsop~haizal pressure arid resp~iratory flow obtainedfrom suibject C at rest anid during~ pressure breathing at a positive breatisinsý prmssure
of l00 rtml-lg with trunk couinterpresstire
122
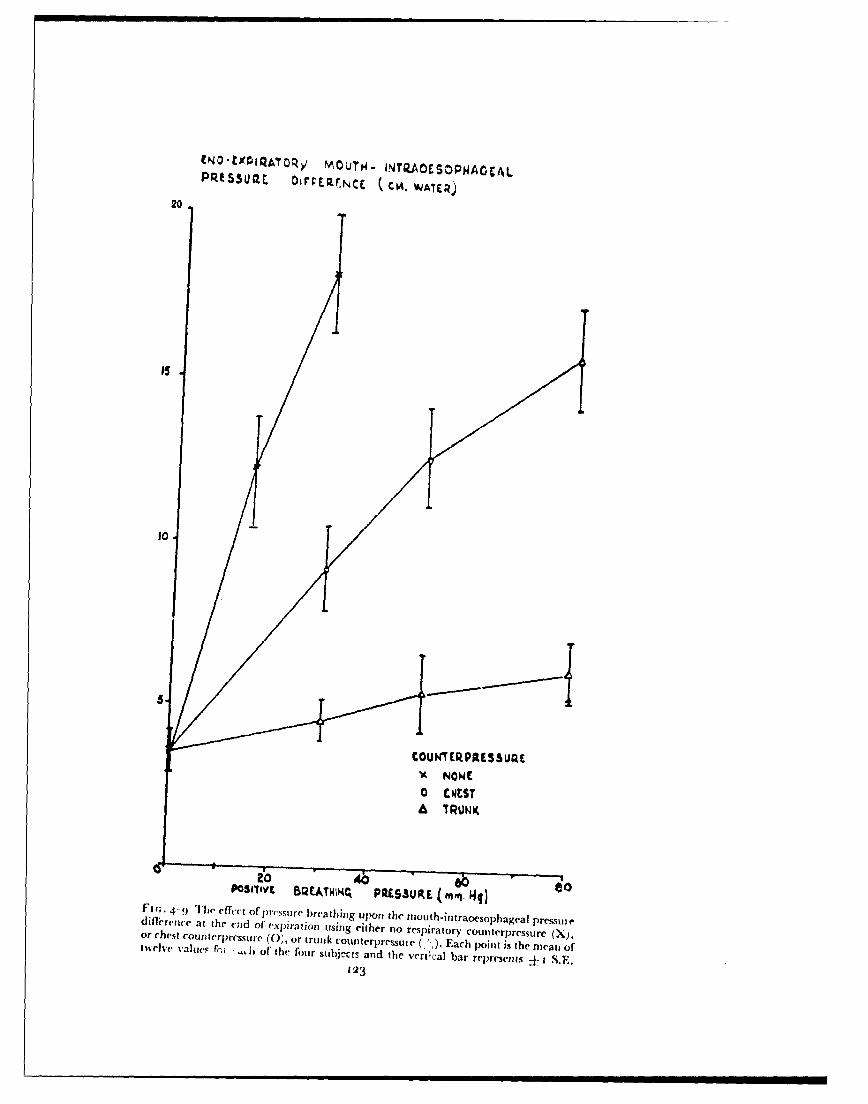
tNO-tX0QATOR>/ MOUTH.4 INTIZAOESOPWAOCALPq'5300t DfrCEQWNCE (. CA. WATER)
20
10
COUNT ERPRESURE*A NOWE
o CNEST
to 4b 60 tPOSrIIyE BQEATHIH4 PRLSsUR.(E . "4q)Fl'- 4- 'I'll efft,(t of pressure breathing upon the ntouth-int~raocsophagral pressuiediflfrejice at the end of expiration using either no respiratorN COu~nlerpressure (X),or chest couInterpresstire. (0, or trutik counterpressuie (".). Each point is the mean oftwelve valuep fr.; -hj of the four subjrcts arnd the vert~cal bar recpresents ± IS.F.
123
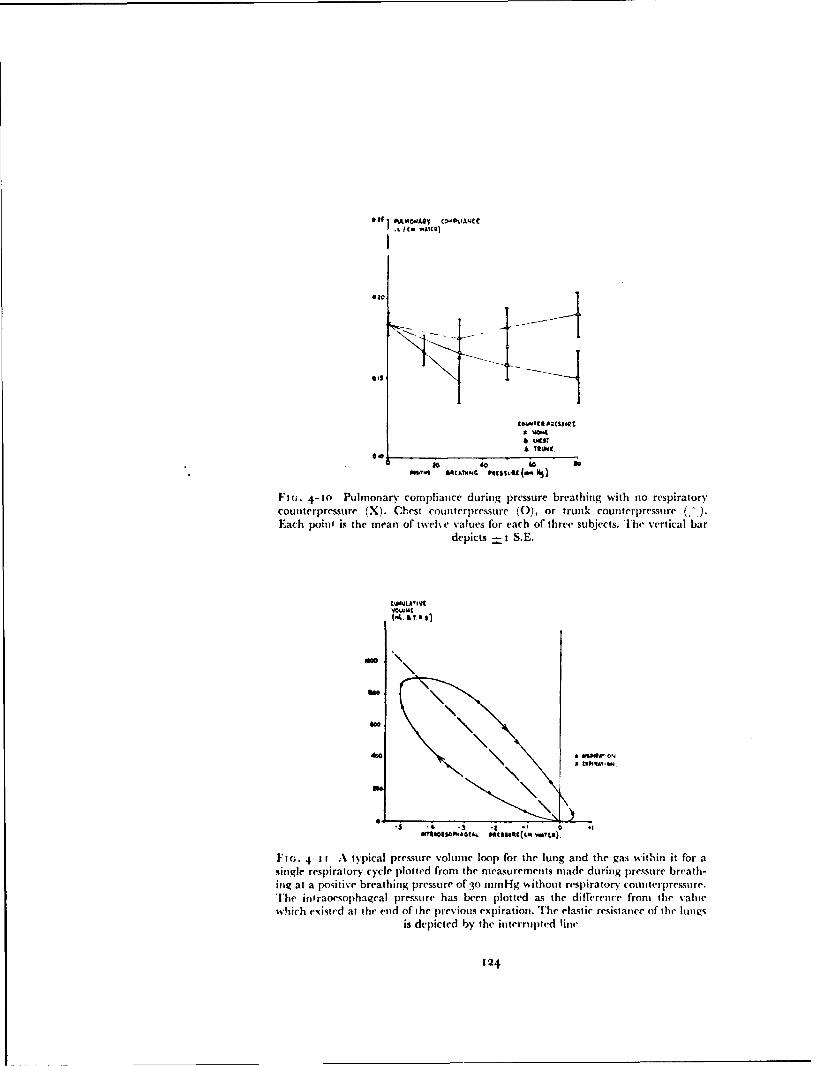
•co Tt ItORESSORL
0*0
0 ,o 4 11
611 sthTM.G patsSulu (04 41)
Fl(-. 4-10 Pulmonary compliance during pressure breathing with no respirator"
counterpressure (X). Chest counterp~ressure (0), or trunk counterpressure ()
Each point is the mean of twcehe values for each of" three subjects. T]he vertical bardepicts -4-1 S.E.
tWQLA'IV9
mow"
\C
4 .
M"A*O&So~wAGtU Imalts4(cm WAtsi).
Ft(;. 4-11 A typical pressure volume loop for the lung and the gas wvithin it for asingle resp-iratory cycle plotted fiaon the d easuremets made during pressure breath-inog at a positive breathinr pressue COf" 3 trnmHg (, ithout respuratory counterpressure.
The intraoesoiphageal pressure has been plotted as the difference front the v'ahtiwhich epinted at the enad of the previous expiration. The elastic resistance of the bnas
is depicted by the interrupted line
124

MECHANICS O1F RESPIRATION
the area between the respiratory flow curve arid the zero flow line for theperiod. The value of the mouth-intraocsophageal pressure difference at theend ofeach 0.2 sec. period was then plotred against the cumulative inspiratorvor e:,piratory volume to give the pressure volume diagram of the lung and thegas within it for that particular breath (Fig. 4-1 1,. The values of the mouth-intraoesophageal p,'-ssure difference were expressed relative to the value ofthe pressure difference which existed at the beginning of the inspiration. Theproportion of the change of the tnouth-intraoenph-,geal pressure differencewhich was expended in overcoming the elastic resistance of the lungs wasassumed to vary directly with the change of lung volume. It was depicted onthe pressure-volumc diagram as a straight line joining the values of mouth-intraoesophageal pressure difference at the beginning and the end ofinspiration. The difference at any point between total change of the mouth-intraocsophageal pressure difference and that depicted by this straight linegave the non-elastic component of the pressure change. The magnitude ofthe non-e!astic compnnent was measured at various respiratory gas flows.NMean curves relating I be non-elastic cormponent of the mout h-intraoAcsa, ,igc alpressure difference to the respiratory gas flow were constructed from the six totwelve breaths recorded in each experimental situation. Typical curves arepresented in Fig. 4-12. All the curves re!ating the non-elastic transpulmonarvpressure to respiratory flow were virtually Inear. Departure frorm linearityonly occurred at 'lows greater than 50 litre Min. The non-elastic resistance ofthe lungs ttissues and air) is given by the siope of such a curve. The slope ofeach of the experimental curves was measured at a flow%' of 3V litreimin. andexpressed as a change of transpulmonary pressure (cm water) per unit ofrespiratory flow (litre,;sec.). The mean values of the non-elastic respiratoryresistance obtained in each experimental condition are presented togetherwidh their standard errors in Table 4 -7. Pressure breathing without counter-pressure caused a marked reduction of the non-elastic resistance of the lungs.A simi!ar reduction %%as caused by pressure breathing with chest counter-pressure at a higher pressure. When full trunk counterpressure was employed,however, no change of non-elastic resistance was produced by pressurebreathing.Intragastric.mouth pressure difference - The behaviour of the ab-dominal prcsstire duiArig pressure breathing was investigated by recording thepressure within tile stomach. In order that the pressure difference across thediaphragm could also be assessed the pressure in the lower part of theoesophagus was also recorded in many of these experiments. The intragastricand intraoesophageal pressures were recorded by means of a double balloonsystem which was swallowed until the distal balloon was in the stomach andthe proximal balloon i~i the oesophagus. The pressures transmitted from theballoons were mcasured by means of a pair of capacitance pressure trans-ducers. The reverse side of each of these transducers was connected to a lateraltapping in the mouthpiece. Respirator)y flow was recorded by means of aheated flowineter an-i a capacitance pressure transducer. Pressure breathingwas induced by the technique employed in the previous group of experiments.Records of mouth-intraoesophageal and intragastric-mouth pressure dif-ferences and re:,piratory flow were obtained at rest and during pressurebreathing with various degrees of respiratory counterpressure. Recordings of
125

NO-.ILASTC PRESSUPEoDIMRENCI(CM, WAXER)
RES
SFRSSUR. SP.AT
USPRTO~y FLOW 1•1I,.N
Fir-. 4-1:2 TIhe relationship) bo.ween the non-elastic component of the change ofintraocsophagea! pressi, re and the corresponding respiratory flow in subject .A at rest(e) and during pressure breathing w*ithout respiratory counterpressure at a positive
breawhing pressure of 13 mmHg (X)
126
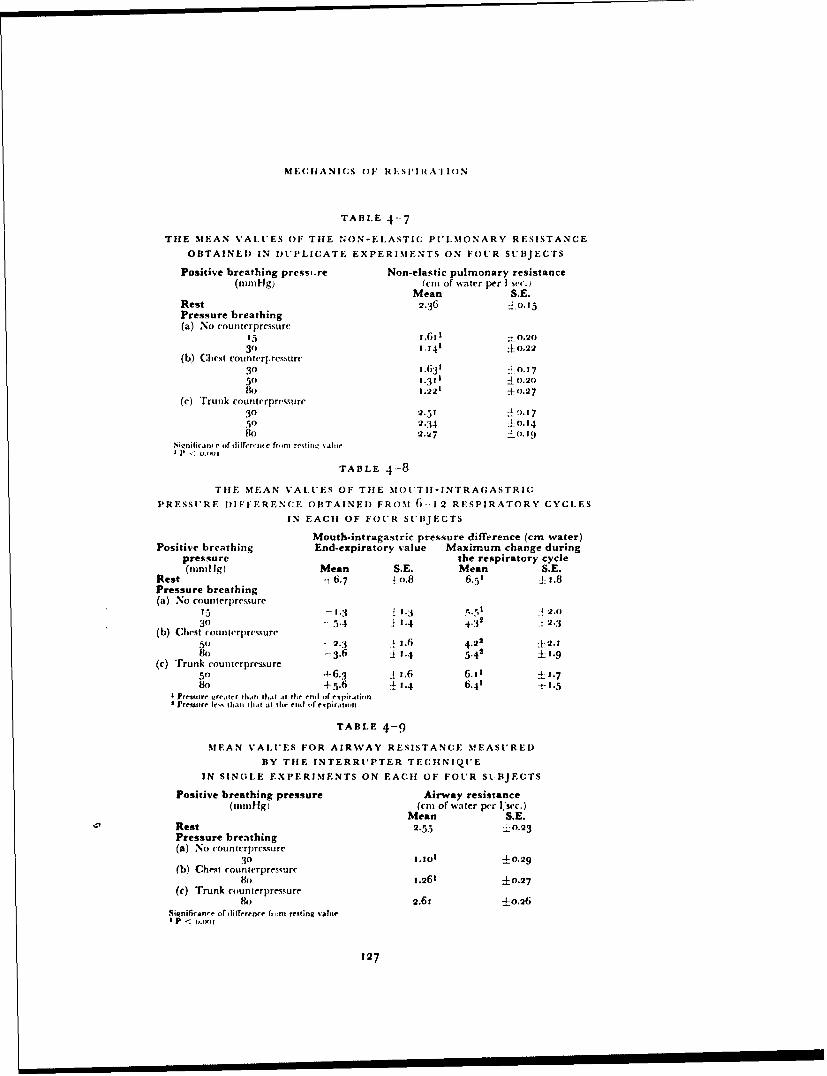
MECHIIANICS O1F RFl'SIIRATION
TABLE 4-7
THE MEAN VALUES OF TilE 4ON-E.LASTIC PULMONARY RESISTANCE
OBTAINED IN DUPLICATE EXPERIMENTS ON FOUR SUBJECTS
Positive breathing pressi.re Non-elastic pulmonary resistance(imnHg) (cm of wvater per I sec.
Mean S.E.Rest 2.36 0. 15Pressure breathing(a) No counterpressure
35 1.601 .o.2o31) 1.141 ±0.22
(b) Chest counterprcssurc30 1.631 0. 175ro .311 01.20lo 1.221 ±0.27
(c) Trunk counterprcssure30 2.519.150 2.34 ±0.14So 2.27 :0. 19
siqnifiic t.e or diffrrs'nr fr,.m rertirnu sahaeI P 5. E .Xlt
TABLE 4-8
TIlE MEAN VALUES OF THE MOITII-INTRAGASTRIC
PRESSURE DIFIFERENCE OBTAINED FROM 6-12 RESPIRATORY CYCLES
IN EACH OF FOUR SUBJECTS
Mouth-intragastric pressure difference (cm water)Positive breathing End-expiratory value Maximum change during
pressure the respiratory cycle(amn I Ig Mean S.E. Mean S.E.
Rest -1 6.7 j1o.8 6.51 ± t .8Pressure breathing(a) No counterpremsure
15 -I. 1 1.3 , 2.o30 - 5.4 1.4 4'32 2.3
(b) Chest countcrpressure5o - 2.3 A j.6 4.22 j'2.180 --3.6 ýi 1.4 5.43 +1.9
(c) Trunk counterpressure50 4-6.3 1 i.6 6.11 ±1.78o +5.6 11.4 6.41 ±1.5
£ Pretssre Lgrealtr tIhan dta at the.. rti| de spiration* Pressuire Jr%% than.I that at thie end (f expiratlion
TABLE 4-9
MEAN VALUES FOR AIRWAY RESISTANCE MEASURED
BY TIlE INTERRUPTER TECHNIQUE
IN SINGLE EXPERIMENTS ON EACH OF FOUR SL BJECTS
Positive breathing pressure Airway resistance(mmigi (c{m of water per Isec.)
Mean S.E.Rest 2.55 --0.23Pressure breathing(a) No counterpremwure
30 1.101 -±0.29(b) Chest counterpressurc
8o 1.261 ±0.27(c) Trunk eounterprmisure
1k) 2.621 4-0.26Significance of difference fr,,m resting value
127
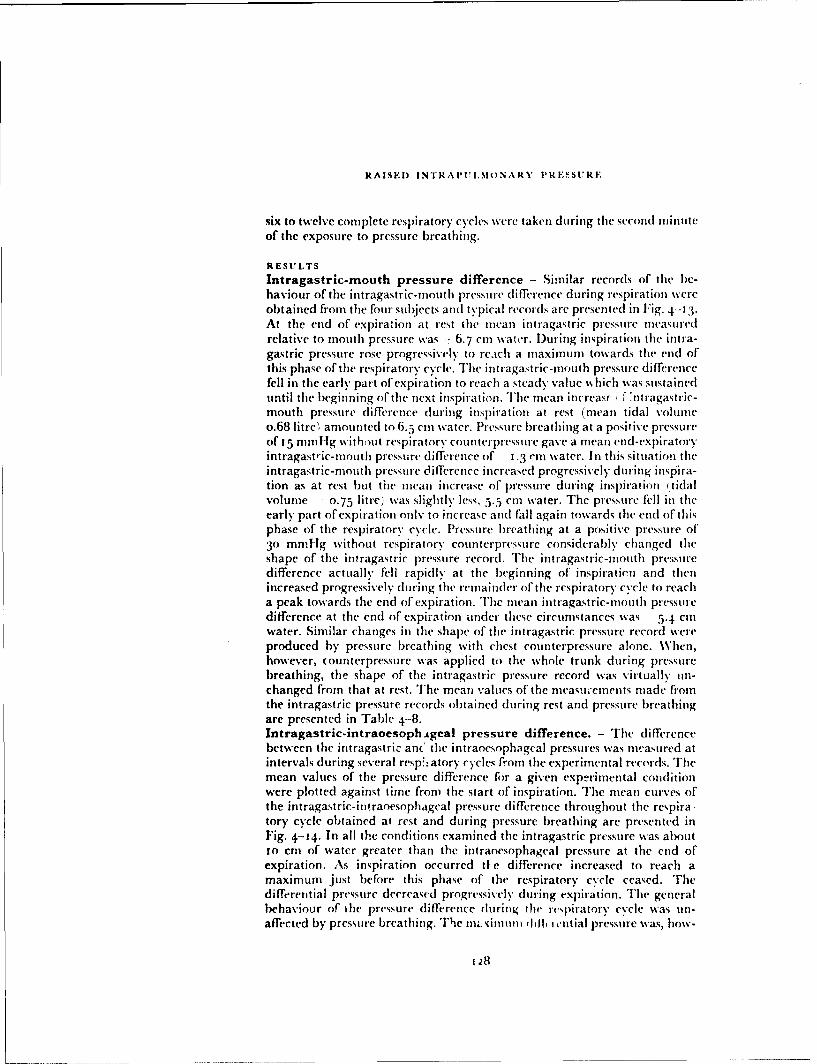
RAISED INTRAPtI.OM()NARY PRESSURE
six to twelve complete respiratory cycles were taken during the second minuteof the exposure to pressure breathing.
RESULTS
Intragastric-mouth pressure difference - Similar records of the be-haviour of the intragastric-mouth pressure difference during respiration wereobtained firom the four subjects and typical records are presented in Fig. 4-i 3.At the end of expiration at rest the mean intragastric pressure measuredrelative to mouth pressure was -: 6.7 cm watr. l)uring inspiration the intra-gastric pressure rose progressively to reach a maxinmum towards the end ofthis phase of the respiratory cycle. The intiagastric-mouth pressure differencefell in the early part of expiration to reach a steady value %% hich was sustaineduntil the beginning of the next inspiration. The mean increase rI .ntragastric-mouth pressure difference during inspiration at rest (mean tidal volunmeo.68 litre) amounted to 6.5 cm water. Pressure breathing at a positive pressureof 15 mmHg without respiratory counterpressure gave a mean end-expiratoryintragastric-niouth pressure difference of - 1.3 cm water. In this situation theintragastric-mouth pressure difference increased progressively during inspira-tion as at rest but the mean increase of pressure during inspiration (tidalvolume - - 0.75 litre) was slightly less, -5 cm water. The pressure fell in theearly part of expiration only to increase and fall again towards the end of thisphase of the respiratory cycle. Pressure breathing at a positive pressure of
30 mmHg without respiratory counterpressure considerably changed theshape of the intragastric pressure record. vhe intragastric-mouth pressuredifference actually fell rapidly at the beginning of inspiration and thenincreased progressively during the remainder of the respiratory cycle to reacha peak towards the end of expiration. The mean intragastric-mouth pressuredifference at the end of expiration under these circumstances was 5.4 cmwater. Similar changes in the shape of the intragastric pressure record wereproduced by pressure breathing with chest counterpressure alone. W\hen,however, (ounterpressure was applied to the whole trunk during pressurebreathing, the shape of the intragastrie pressure record was virtually un-changed from that at rest. The mean values of the measurements made fromthe intragastric pressure records obtained during rest and pressure breathingare presented in Table 4-8.Intragastric-intraoesophAgeal pressure difference. - The differencebetween the it ragastric an(' the intraoesophageal pressures was measured atintervals during several resp!: atory cycles from the experimental records. Themean values of the pressure difference for a given experimental conditionwere plotted against time from the start of inspiration. The mean curves ofthe intragastric-intraoesophageal pressure difference throughout the respiratory cycle obtained at rest and during pressure breathing are presented inFig. 4-14. In all the conditions examined the intragastric pressure was aboutto cm of water greater than the intranesophageal pressure at the end ofexpiration. As inspiration occurred tt e difference increased to reach amaximum just before this phase of the respiratory cycle ceased. Thedifferential pressure decreased progressiv'ely during expiration. The generalbehaviour of the pressure difference during the rcspiratorv cycle was un-affected by pressure breathing. The mxinnimm utlt, i ential pressure was, how-
t 28
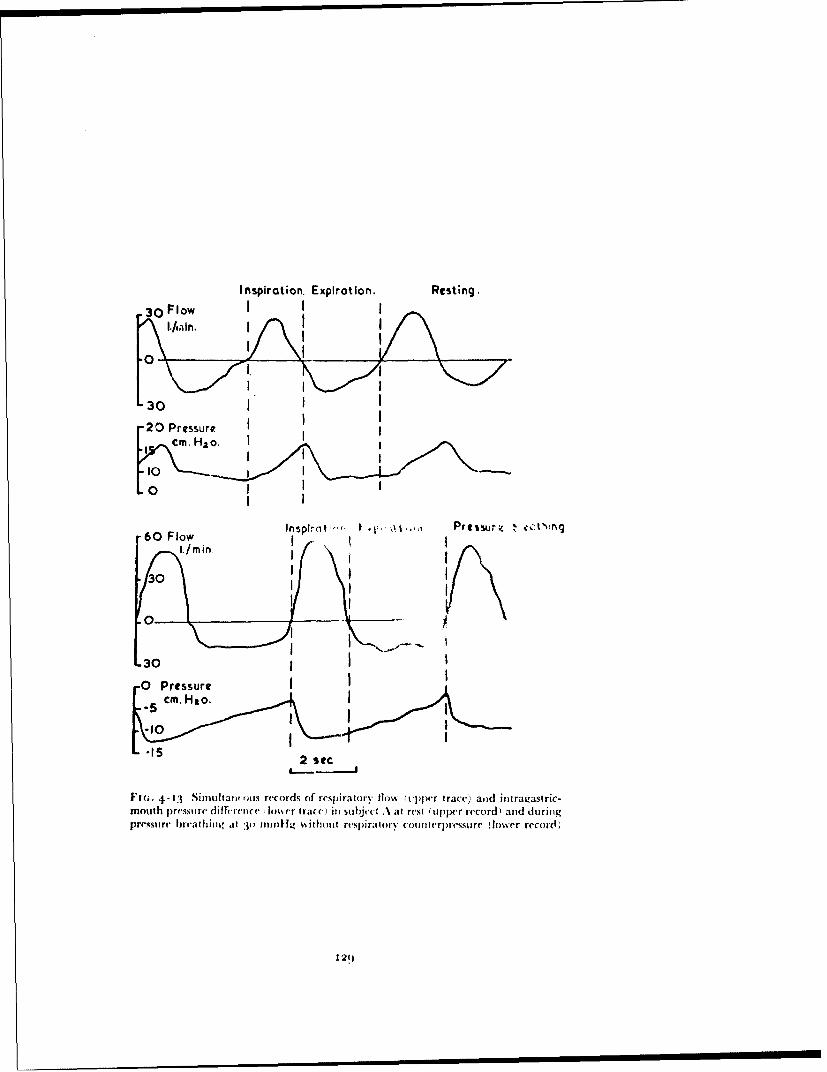
Inspiration. Expiration. Resting.30 FlowJII
30 I
"20 Pressurecm.Hao. 1I I
•o I III I
oInressureII I •, .. • P es u e . c s
-60 FlowI I I
.I I
•ot 0 Pressure dIfrec Insrtrt Ii ujc trs uprrcr'addrn
I 1
0I
L30
F 'IG , 4 .13 S im u hta n ois{() rec(o rd s o f re 'sp ira to ry flo w ( tv])pc•r trace)i a sid in tra qastric '-mouth |)(s•~{ i~ r.l( h •' rc(ini sub~jec(t .at res.t (tl)|),cr r('cord alld dtiritigp ~re 'ss u re • b re a th in g ,, %I : } (o n m m t !g % ith o )u t rt .-lp ira t ()r y c o u wi, n e ss~(' u re " (lo w e 'r r e c •o rd ; ,
• • , = = == = I I I 12(1I
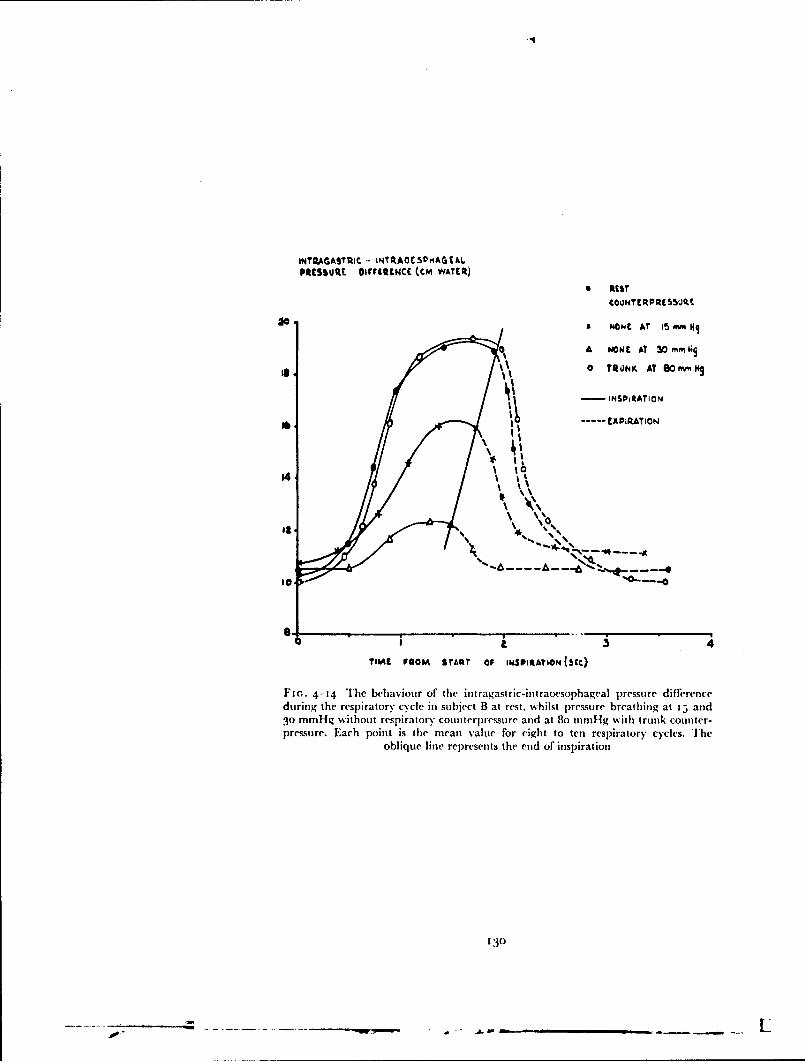
INT7AGAS'IC - INTU.AOE5VHAGtALPRESSuRE oIrritcNCE (CM WATECR)
0 RtEST€00mTE[R, MFSSO(LE.
xo M HONC AT t5 M MI
A NONEM AT 30 mMi
% 0 T/0NK AT SOMMe.0
II I '0 ',"
i • -.. A .~~~~.... " -, ,•- -.
go4
0..0
TIME FROM START OF IMi•hIStATION (5tc)
Fi,.. 4-14 The behaviour of the intragastric-intraocsophageal pressure differenceduring the respiratory cycle in subject B at rest, whilst pressure breathing at t5 and30 mmHg without respiratory counterpressure and at 8o mmHg with trunk counter-pressure. Each point is the mean value for eight to ten respiratory cycles. The
oblique line represents the end of inspiration
130
-" --- -_
MECIIANICS OF RESPIRATION
ever, considerably reduced by pressure breathing without counterpressure.When counterpressure was applied to the whole trunk there was no decrease ofthe intragastric-intraoesophageal pressure di fferenceduringpressurebreathing.Airway Resistance - The resistance offered by the respiratory tract to gasflow was measured during pressure breathing by the interrupter techniquedeveloped by Otis and Proctor (1948) (230). The subject was seated withinthe decompression chamber and wore the modified pressure helmet fittedwith a mouthpiece. The mouthpiece was connected to the external surface ofthe chamber by a smooth bore tube (2 cm internal diameter). The flowthrough this tube was interrupted periodically by means of a pneumaticallyoperated valve which was placed 8 cm from the mouthpiece. A pneumaticcontrol circuit closed this valve for 200 msec every second. The time ta!ken forcomplete interruption of flow through the valve was to to 15 insec. A heatedFleisch flowmeter was placed in the hose between the pneumatic valve and thewall of the decompression chamber. The pressure at the mouth was recordedby means ofa differential pressure transducer which w%,as connected to a lateraltapping in the breathing tube close to the mouthpiece. The reverse side ofthe differential pressure transducer was connected to the external surface oftile decompression chamber. The bladder of the pressure garment, when onewas worn, and the face compartment of the pressure helmet were connectedto the exterior of the decompression chamber by a second wide bore pipe.'[he outputs of the pressure transducer attached to the flowmeter and thediffcre-itial pressure transducer connected to the mouthpiece were fed on tothe galvanometers of a bromide paper recorder. During the second minute ofeach rest and pressure breathing period the interrupter was brought intooperation and a record taken for ten to twelve complete respirator)y cycles.The subject was instructed to increase his respiratory movements towards theend of each recording period. Each of the subjects was exposed to pressurebreathing at a positive pressure of 30 mmllg without respiratory counter-pressure and to pressure breathing at 8o mdlig once when wearing a pressurewaistcoat and again wearing a pressure jerkin.Results - In the majority of the experiments the subject reported no un-pleasant sensations whilst the respirator)y flow was being interrupted. Wheninterruption occurred during pressuie breathing at a positive pressure of30 mmHg without respiratory counterpressure two subjects reported adefinite sensation of obstruction, particularly when interruption occurredduring inspiration.
A typical experimental record is presented in Fig. 4-15. When the inter-rupter valve closed the respirator)y gas flow fell directly to zero. At themoment at which occlusion occurred the mouth pressure changed abruptlyand then performed a series -)f damped oscillations, the mean of which con-tinued to change until the valve was opened. The direction of the pressurechange depended upon tile phase of the respiratory cycle in which interrup-tion occurred. Occlusion daring inspiration reduced mouth pressure whilstocclusion during expiration increased it. The pressure at the mouth at theinstant after the interruption of flow was determined by drawing a straightline through the centre of the pressure oscillations and extrapolating it to cutthe initial abrupt change in pressure. This intercept was taken as the intra-alveolar pressure at the instant before interruption. The mouth-alveolar
131
S I I I I I I I I I is

kC i"'i1 INSPI RATION
II ~~'ON
Fir. 4-15 A typical experimental record of the mouth pressure (upper trace) andrespiratory flow (lower trace) obtained using the interrupter technique, '.'.I subject D
at rest
MMOT - AU VEOLt Plt SSUU.C Oif!UNtV
+ 4.
EIPMR&TiON
400 ,,, ,, ,,
WISPIR&¶OQY nlow (ic
FI(;. 4-J6 The relationship between respiratory flow and mouth-alveolar pressuredifference obtained by the interrupter iechnique in subject C whilst at rest
132

NiMECIIANICS OF RESPIRATION
pressure gradient was the difference between this alveolar pressure and themouth pressure immediately hefore flow was interrupted. The respiratory gasflow at this instant was determined from the flow rer"d The crrerr-pnndn!-.,-values of the mouth-alveolar pressure gradient and the respiratory flow foreach interruption were determined and plotted against each other for eachexperimental condition and subject (Fig. 4-16). No significant difference wasfound between the relationship of the mouth-alveolar pressure gradient toflow during inspiration and that obtained during expiration under the sameexperimental conditions. The relationship between the pressure gradient andflow was only slightly alinear. The value of the respiratory resistance given bythis technique was measured from the slope of each of the plotted curves at aflow of ujo litre/min. The resistance was expressed as the pressure differencce(cm of water) per unit of flow (litre,'sec.). The mean values obtained from therespiratory resistance by the interruption technique in the various experi-mental situations ale presented in Table 4 -9. Whilst pressure breathing with-out counterpressu re or with counterpressure to the chest alone caused amarked reduction of resistance, there was no change of resistance whenpressure breathing was peiforined with counterpressure to the whole trunk.
DISCUISSION
Lung Volume - The observation that positive pressure breathing withoutrespiratory coun terpressure is generally acconmpanied by distension of thelung, was made in the early studies of the effects of this manoeuvre (243). Theresults obtained in the present investigation confirm this observation. Inorder to permit an assessment of the part played by the elastic forces of thelung and thorax in the increase of lung volume induced by pressure breath-ing, the pressure-volume relationships of the respiratory system were deter-mined in the relaxed subject. When the respiratory muscles are relaxedvoluntarily with the mouth and nose shut the position taken up by the lungand thoracic cage is that at which the net pressure created by tile elastic recoiland the weight of these structures is equal and opposite to the pressuredifference between the alveolar gas and the environment. Thus the pressuremeasured at the mouth when it is shut in the relaxed ,ubject at a given degreeof lung distension is a measure of the pressure exerted by the elastic recoil ofthe total respiratory apparatus.
The scatter of the individual experimental points obtained in the presentstudy (Fig. 4-1) was due primarily to the difficulty which the subjectsexperienced in producing complete relaxation of their respiratory muscles.The mean relaxation pressure-volume curve (Fig. 4-2) constructed from theresults obtained from the four subjects was virtually a straight iine over a con-siderable range of lung volume but at both high and low lung volumes themean values deviated from this stra;ght line so that overall the curve wasslightly sigmoid in shape. These results agree closely with those obtained byKnowles, Hong and Rahn 1959 (17 1) under similar experimental conditions.Detailed analyses of the factors contributing to the relaxation pressure-volume curve have been made by Rahn, Otis, Chadwick and Fenn 1946 (243)and Knowles, Hong and Rahn 1959 (171). These investigators have shownthat throughout the vital capacity range thc -!astic recoil of the lung acts soas to reduce the lung volume. At lung volumes which are less than half the
133
w
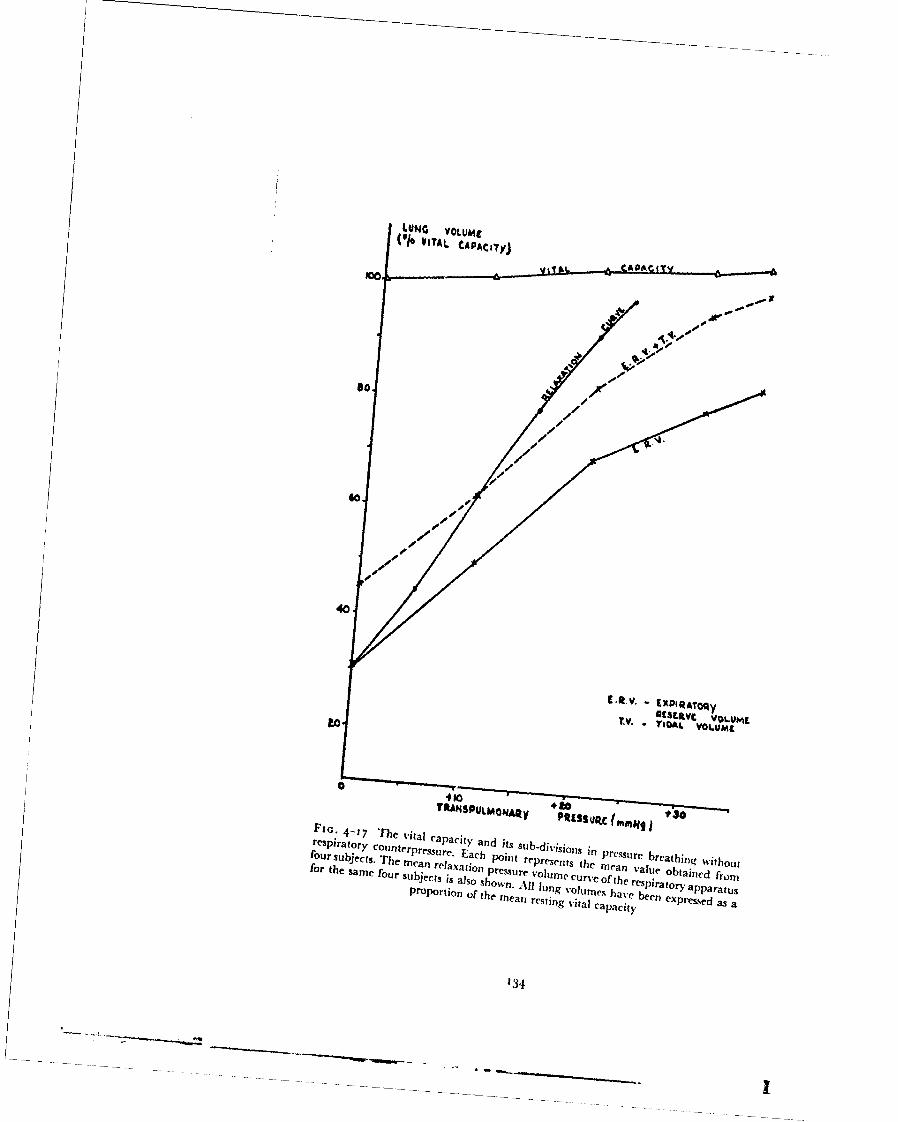
• . ~ ....................
SLuNG VOLUaO(010 A•sAuL CAPA ,t(ym
SJ*
i [.I v.. EXPIRA'rOqy
1[S""VC VOLU f.ST.V. T • L O L UM ~t
0
FrG : 4-17 The vital cpct n t u-/l~nrespiratory counterpra caPaci h and its sub"divisj
0 l in pressure breathing withoutfor supi ecto , zThe rpre .ur Each point qers~ t Whiea ale o t hi~ fout
four subjecth The mean relaxation pressure volume curve of the resp i nd frofor the same four subjects is also shown.
been expreure oss a
Proportion 1 ~ th All lun gq %' him e ha SIra tor.> appa ra tuspan restil g vital capacity
134
MECII NIC;S OF RESPIRATION
viial capacity thet 'lastlic forces of the relaxed thoracic cage tend to increasethe lung voluwm and hence oppose those of the lung itself. WVhen, however,the lung volume exceeds 50",o of the vital capacity the elastic forces of thechest wall and abdomen act in the same sense as those of the lung, bothtending to reduce the v'olun~e of gas within the lung.
The portion of the relaxation pressure-volume curve at lung volumesgreater than that which exists at the end of a normal expiration at rest is ofdirect interest in considerations of the mechanics of respiration duringpositive pressure breathing. This curve describes the degree of lung distensionwhich would be prduced by continuous pressure breathing in the relaxedsubject. It may be seen from the curve obtained in the pressmnt study (Fig. 4-2)
that the lungs of a relaxed subject would be fully distended by a breathingpressure of 24 mmHg. The results of the measurements of the expiratoryreserve volume and tidal volume during pressure breathing %sithout respi-ratory counterpressure have been combined and are presented in Fig. 4-17together with the relaxation pressure-volume curve already described. It isapparent that at all the pressures investigated the lung volume duringpressure breathing was significantly less than that which existed at the samepressure in the relaxed subject. Thus during pressure breathing the respi-ratory muscles were not relaxed at the end of expiration, in contrast to thecondition which exists at the end of expiration during quiet breathing at rest.At positive breathing pressures of" less than to mmHg the lung volume at theend of inspiration was, ho%%eer, grcater than the luIig volume in the relaxedsubject at the same pressure.
Under these conditions, therefore, muscular energy , -as expended duringinspiration in overcoming the elastic forces of the respiratory system. Whenthe breathing pressure exceeded io mmHg, however, the lung volumethroughout the respiratory cycle was less than the relaxed lung volume at thesame pressure. Thus during pressure breathing at pressures of greater thanto mmHg the tone of the expiratory muscles was increased throughout therespirat•ra cycle as compared with their tone at rest. The discrepancybetween the end-expiratory lung volume during pressure breathing and thecorresponding relaxation lung volume became greater as the pressure wasincreased (Fig. 4-17). Thus the tension exerted by the expiratory muscles wasincreased as the breathing pressure was raised. Whilst in quiet breathing atrest the respiratory muscles are relaxed at the end of expiration and the activephase of the respiratory cycle is inspiration, during pressure breathing atpositive pressures in excess of io mmHg expiration becomes the active phaseand there is active muscular contraction throughout the respiratory cycle. Inspite of the maintained contraction of the expiratory muscles throughout thebreathing cycle the expiratory reserve volume was increowed some two and ahalf times by pressure breathing at a positive pressure of 35 mmHg. Since thetidal volume was increased at the higher breathing pressures, the reduction ofthe inspiratory reserve volume caused by pressure breathing was even greater.
Pressure breathing without respiratory counterpressure induces an increaseof the vital capacity (Table 4-2). The mean increase of the vital capacity pro-duced by pressure breathing at a positive pressure of 35 mmHg was 35o mlB.T.P.S. The changes underlying this increase of the vital capacity are un-certain since the factors which determine this quantity are not clearly defined.
135
RAISED INTRAPULMONARY PRESSURE
Since pressure breathing reduces the intrathoracic blood volume at least twofactors could be responsible for the increase of vital capacity induced by thismanoeuvre. Firstly, the rise of pressure could increase the distension of thelungs at maximum inspiration. Secondly, the reduction of the volume of theblood within the thorax could lead to an increase in its capacity to hold gas.Although, as Campbell 1958 (34) has pointed out, many investigators haveassumed that the important factor which limits the maximum inspiratory andexpiratory volumes is the maximum force of contraction of the respiratorymuscles, there is a considerable body of evidence which suggests that this isnot so. Thus Campbell and Green 1953a (55) have shown that the electricalactivity in the abdominal muscles during a maximum expiratory effort ismuch less than that recorded from these muscles during movements of tiletrunk. Further, Mills 1959 (214) and Campbell and Green i 9 5 3b (56) foundthat the abdominal muscles contract at the end of a maximal inspiration,thereby limiting the maximum volume of the lung. It would appcar, there-fore, that the maximum and minimum volumes are limited by reflexchanges of the tone of the respiratory muscles. The sites of the receptors whichinitiate these reflexes are not known but they probably lie within the lungtissue.
Amongst the procedures which have been shown to cause alterations of thevital capacity in normal subjects are those which are associated with changesin the distribution of the circulating blood volume. Thus Hamilton andMorgan 1931 (14o) demonstrated for the first time that the reduction of tilevital capacity induced by changing from the erect to the supine position couldbe reduced or even abolished by placing occlusion cuffs around the upperthighs before the posture was changed. Glaier and McMichael 1940 (123)found that a venesection of 38o ml in blood donors caused a mean increase of153 ml in the vital capacity and i81 ml in the total lung capacity. Theobservation that the vital capacity was significantly increased when thecirculating blood volume was decreased has been confirmed repeatedly (80,213, 270) although the change of vital capacity was always less than thechange of blood volume. The mechanism whereby an alteration in thecirculating blood volume induces a change in the vital capacity is obscure.Changes in the intrathoracic blood volume might be expected to alter thetotal lung capacity since the total capacity of the thoracic cavity is limitedand an increase in the blood content of the lung must be compensated by areduction in the total volume of gas which the lungs can contain. Theexperimental evidence available confirms that an increase in the circulatingblood volume is associated with a reduction of the total lung capacity (269).Mills 1949 (213) concluded that the changes of vital capacity induced byalterations of the blood content of the lungs were probably due to reflexchanges in the limitations of respiratory movements.
In view of the large variation of the expiratory reserve volume betweenone subject and another during pressure breathing, it was decided to measurethe residual volume directly rather than to determine the functional residualcapacity. The nitrogen dilution technique developed by Rahn, Fenn andOtis 1949 (241) was employed as it was simple and rapid. The standarderrors of the values obtained in the present study were very similar to thosegiven by Rahn, Penn and Otis 1949 (241). The results of the present measure-
136
MECHANICS OF RESPIRATION
ments (Table 4-4) showed that pressure breathing without respiratorycounterprcssurc caused an increase of the residual volume, the mean increaseat a positive breathing pressure of 35 mmHg being 300 ml B.T.P.S. Thisamounted to 5.7",o of the resting vital capacity. The observed increase of theresjLdal volume in pressure breathing could have been caused by the raisedintrapulmonary rressure acting directly or by the consequent displacementof blood from within the lung to the periphery. The mechanism of the increaseof residual volume was investigated by repeating this measurement withcounterpressure applied to the trunk by means of a pressure jerkin.
These measurements (Table 4-4) showed that the residual volume wasincreased by pressure breathing even when the external surface of the trunkwas supported. The increase of the residual volume induced by a givenbreathing pressure was reduced by the application of counterpressure to thetrunk. The displacement of blood from the chest caused by pressure breathingis increased by the application of counterpressure. Since trunk counter-pressure prevented the lung distension normally induced by pressure breath-ing it would appear that the increase of the residual volume found in pressurebreathing without trunk counterpressure was in part due to displacement ofblood from the lungs and in part due to a limitation of full expiration.
The changes of the total lung capacity produced by pressure breathingwithout counterpressure have been calculated from the separately determinedvalues of the vital capacity and the residual volume. The results of thesecalculations are presented in Fig. 4-18.
Pressure breathing at a positive pressure of 35 mmHg increased the totalcapacity of the lungs by 9",,. Although part of this increase was due to thedisplacement of blood from within the thorax, it is probable that the lung wasmore distended at the end of a maximal inspiratory effort during pressurebreathing at 35 mmHg than at the end of a full inspiration at rest. Pressurebreathing without trunk coumerpressure at positive pressures in excess of35 mmHg introduces the possibility of lung damage. This aspect has beenstudied in some detail in animals by several investigators. Thus Polak aridAdams i932 (237) studied the effects of raising the intrapulmonary pressureupon the respiratory and cardiovascular systems in the anaesthetized dog.They also placed a bubble trap in the carotid artery. When the intrapul-monary pressure was raised to 8o to ioo mmHg for a period of ten secondsthere was a profound fall of systematic arterial pressure and numerous gasbubbles appeared in the carotid artery trap. In an extensive series of experi-ments it was found that intrapulmonary pressures of 90 mmHg or morecaused immediate air embolism, whilst pressures of less than 8o mmHg didnot give rise to air emboli.
Examination of the lung following the application of intrrpulmonarypressures above 90 mmHg revealed extensive interstitial emph)sema alongthe vascular sheaths within the lung and in the mediastinum arid neck. Therewas microscopic evidence of rupture of alveoli. Polak and Adams alsodemonstrated that these effects could be prevented by applying externalsupport to the chest. They concluded, therefore, that the primary mechanismunderlying the air embolism produced by high intrapulmonary pressures wasoverdistca~sion nf the lung. Henry 1945 (144) extended this type of study toa wide variety of mammals, including the mouse and the steer. In lightly
137

RAISED INTRAPULMONARY PRESSURE
anaesthetized animals he introduced a gradually increasing volume of air intothe lungs until leakage occurred into the tissues. He fiund that no leakage ofair occurred until the intrapulmonary pressure was raised to between 6o andzoo mmHg. He also showed that widely opening the thorax so that the lungswere unsupported reduced the pressure at which leakage into the tissuesoccurred to 30 to 6o mmHg. Henry also confirmed the findings of Polak andAdams 1932 (237) that considerably higher intrapulmonary pressures didnot cause damage when expansion of the thorax and abdomen was prevented.
Recently Malhotra and Wright z96o (200) investigated the effects orincreasing the tracheal pressure in fresh warm human cadavers. They foundthat leakage of air from the lungs with interstitial emphysema occurred at apressure of 8o mmHg. The application of a tight binder to the thorax andabdomen increased the tracheal pressure at which air leakage occurred toabout 19o mmHg. This study confirms the conclusion drawn from theanimal experiments that when the thorax and abdomen are relaxed ruptureof alveoli and air embolism will occur if the intrapulmonary pressure exceedsabout 8o mmHg. During ascent through water the intrapulmonary pressurecan be considerably greater than the pressure at the surface of the trunk,particularly if the subject fails to allow the gas expanding in the respiratorytract to vent freely through his mouth and nose (77). Over fifty cases of airembolism, the majority of which involved embolism of cerebral vessels havebeen reported in the literature of submarine medicine. The mechanismunderlying this condition is considered to be the same as that observed inanimals, i.e. overdistension of the lungs. Overenthusiastic inflation of thelungs in newborn babies suffering from asphyxia neonatorum has also led toa cerebral air embolism and death. The increase of intrapulmonary pre"sureper se cannot be the direct cause of lung damage since very high ,itra-pulmonary pressures of the order of 15o to 2oo mmHg occur during strainingand coughing (263) with no untoward effect upon the respiratory tract. Inthese situations, however, the lungs are supported since the increase of intra-pulmonary pressure is produced by contraction of the expiratory muscles.Thus there is considerable evidence both from animal experiments andclinical observation that the lung damage produced by a high intrapulmonarypressure is due to overdistension of the alveoli and not to the rise of pressureitself.
In the present investigation the inspiratory reserve was reduced to about5°o of the total lung capacity by pressure breathing at a positive pressure of35 mmHg (Fig. 4-18), so that the lungs were almost fully expanded at the endof inspiration. It was considered unwise, therefore, to investigate in detail theeffects of higher positive breathing pressures without applying externalsupport to the respiratory system. On two occasions, however, experimentalsubjects were accidentally exposed to a positive breathing pressure of between6o and 7o mmHg without external support. On both these occasions thepressure applied to the respiratory tract was very much greater than the sub-ject had expected. When the rise occurred there was a marked increase in thecircumference of the chest and the subject experienced retrosternal pain. Thepositive breathing pressure was reduced to zero within ten seconds. The painwhich was dull and ill-localized, persisted, however, for about an hour.Immediate clinical and radiological examination of' the chest revealed no
138

LUNC VOLUME
10 TUTAL LUNG CAPACITY)leO 1 INSPIRATOR.Y MCSERVE
TIDAL.100. VLUMC
Cm PtRATO~y
VOLWEL
40
ILSIDUAL
0 10 i0 40POWrriv BRIATIING PQLSSURL (Mm.N)
Fin.- 4-18 T[he effect of pressure breathing without respiratory courtwrpressure Up~onthe total lung capacity and its sub-divisions
139

RAISED INTRAPULMONARY PRESSURE
abnormality on ether occasion. These accidental exposures to high breathingpressures in the absence of respiratory counterpressure served to emphasizethe potential dangers associated with positive intrapulnonary pressures inexcess of 40 mmHg.
The effect of applying counterpressure to the thorax by means of thepressure waistcoat upon the response to pressure breathing was investigatedby measuring the total lung capacity and its sub-divisions. The mean valuesof these measurements have been calculated and arc presented in Fig. 4-19.The increases of residual volume and of vital capacity produced by a givenbreathing pressure when chest counterpressure was employed were notsignificantly different from those which were produced when no counter-pressure was used. The application of counterpressure to the thorax resulted,however, in a much smaller increase in the functional residual capacity thanthat associated with simple pressure breathing at the same positive pressure(Fig. 4-38). The value of the functional residual capacity associated withpressure breathing without counterpressure at a positive pressure of3 5 mmHgwas not reached when thoracic counterpressure was used until the intrapul-monary pressure was raised to a positive pressure of 8o mmHg. Thus theapplication of counterpressure to the thorax reduced the degree of lung dis-tension produced by a given breathing pressure. It did not, however, preventa significant increase of the volume of gas within the respiratory tract,especially at the higher breathing pressures. Pressure breathing with thoraciccounterpressure at positive pressures in excess of about 4o mmHg was foundto be extremely tiring because of the need to maintain the muscles of theabdominal wall in a state of continuous contraction. The radiographic studiesconducted during pressure breathing with this form ofcounterpressure showedthat in spite of this voluntary contraction there was a marked descent of thediaphragm. The diaphragmatic descent was in fact the principal cause ofthe observed increase of the functional residual capacity.
The effect of the counterpressure applied to the trunk by the pressurejerkin was also assessed. The increase of the total lung capacity during pressurebreathing under these conditions was slightly less than when counterpressureapplied to the chest alone. The most striking effect was the relatively smallincrease of the functional residual capacity (Fig. 4-2o). A positive breathingpressure of 8o mmHg caused a mean increase of o.87 litre B.T.P.S. Thisincrease of the functional residual capacity was probably due to severalfactors, but it was impossible to determine their relative importance from themeasurements available. Direct measurements of limb volume have shownthat pressure breathing at a positive pressure of 8o mmHg with trunkcounterpressure increases the blood content of the limbs by 3o( to 44)) ml. Alarge proportion of the blood displaced from the trunk in this mannerprobably comes from within the thorax. Thus part at least of the observedincrease of the functional residual capacity during pressure breathing withtrunk counterpressure was due to the associated shift in the distribution of thecirculating blood volume.
The increase of functional residual capacity induced by a positive breath-ing pressure of 20 mmtlg amounted to 7o() of that produced by a positivebreathing pressure of 8o mmHg. This relationship cannot be explained fullyon the basis of the displacement of the blood from the hlngs since the total
t 4|o

WW. VOLUnt
ii
F'i(; 4 to The effec t of press. ' ivh ing %it ji clhest coil n t erpt essit re upon the total~
lung '.1' rit and its sub-divisions
a ,a'.. ..wc CA-,.y 141
S•IL &L','g
ICI
U1
1i(;. 4 2(o The (ffect of'pre.ssure breathing with trunk counterp,,,.sure upon the totallung capacity' and its sub-divisions
t41
RAISED INTRAPI'LMONARY PRESSURE
increment of limb volume caused by a positive pressure or 20 mml-g is only30 to 40",, of that produced by a positive breathing pressure of8o nmmHg. Itmight well, however, be produced by a fa'!ure to achieve, via the jerkin, apressure to the surface of the trunk as great as that in the respiratory tract.The relaxation pressure volume curve of the total respiratory system obtainedusing the same group of subjects (Fig. 4-2) showed that the increase of theexpiratory reserve volume obtained during pressure breathing at a positivepressure of 8o mmHg with the pressure jerkin was produced in the relaxedstate by an intrapulmo:nary pressure 3 to 4 mmHg greater than the pressureat the surface of the trunk.
At very low positive breathing pressures the inner lining of the jerkin andthe inner layer of the garment bladder do not take up the contours of thetrunk completely owing to the resilience of the fabric. Further, there arecertain areas of the surface of the trunk, namely the upper part of the front ofthe chest, the supraclavicular fossae and the axillae which are not completelycovered by the inflated jerkin. The pressure exerted by a bladder restrainedby an outer inextensible fabric layer also varies with the distance from theedge along which the garment is reflected off the surface to which it is applied.Thus at the line at which the reflection occurs the pressure applied to theunderlying surface will be only a small fraction of the pressure within tilebladder. However, at some distance from this line beneath the bladder thepressure exerted by the g 1,mtent will equal that of tile gas in the bladder.These coniderations suggest that the mean pressure applied to the totalsurface of the trunk by the pressure jerkin is slightly less than the pressure ofthe gas within its bladder. At a positive breathing pressure of 8o mmHg thisdiscrepancy may well amount to 3 to 4 mmHg, although it is not possible toquantitate this effect accurately.
Under the conditions of the present study the absolute pressure of the gaswithin the respiratory tract and hence of the gas within tile abdomen, wasunchanged by the induction of pressure breathing. Pressure breathing wasfrequently produced, howcver, by raising the absolute pressure of the gasdelivered to the respiratory tract. Even in these circumstances the contribu-tion of the compression of the gas within the abdominal cavity to the increasein the total lung capacity is insignificant. Recent estimates of the volume ofgas within the abdominal portion of the alimentary tract have shown that innormal subjects this volume does not exceed 150 to 200 ml (31). Thus thedecrease of the volume of tie abdominal contents produced by pressurebreathing at 8o mmHg amounts to only 20 ml B.T.P.S. at ground level.Further, Mills 1949 (213) has shown that removal of i litre of watel from thestomach does not alter the vital capacity.
The chest radiographs taken during pressure breathing with trunkcounterpressure at 8o mmHg confirmed that this procedure induced verylittle change in the volume of the thoracic cavity at the end ofa quiet expira-tion. Detailed studies of the apices of the lungs were made in an attempt todiscover whether the absence of counterpressure to the supraclavicular fossaeand the posterior triangle of the neck resulted in a detectable change at thelung apex during pressure breathing. No change was seen in the shape andposition of the lung at a positive breathing pressure of 8o mmHg. Theabsence ofany effect was probably due to the low extensibility of the cervical
142
-AO~- . * --. .

MECHANICS OF RESPIRATION
pleura. The( amoutnt of X-radiation absorbed by the normal lung is deter-mined primarily by the quantity of blood within it. In order to infer changesin blood content from changes in radiotranslucency the conditions underwhich the various radiographs were taken including the lung volume shouldbe strictly similar. These conditions were fulfilled in the experiments in whichchest radiographs were taken during pressure breathing with the pressurejerkin. The obvious increase in the translucency of the lungs during pressurebreathing was due, therefore, to a reduction of their blood content. Theassociated reduction in the transverse diameter of the heart shadow and theconsequent increase in the cardiothoracic ratio produced by pressure breathingwas also evidence that this procedure displaces blood from within the thorax.Respiratory Gas Flow - The gross changes induced in the pneumotachy-gram by pressure breathing without counterpressure were first described byOtis, Sheldon and Rahn 1955 (233). They reported that at positive breath-ing pressures above 2o mmif-g the expiratory pattern consistently showed anabrupt termination, whilst at the beginning ofinspiration flow it increased veryrapidly to reach a peak value considerably greater than that recorded duringrest. The results obtained in the present investigation during pressure breath-ing without respiratory counterpressure confirmed these earlier observations.A striking feature was the extreme variability in the response of each of thefour subjects to pressure breathing. The rcspiratory flow pattern in onesubject at a positive pressure of 30 mmHg wvas very similar to that recordedat rest. At the other extreme another of the subjects exhibited a large increaseof peak inspiratory flow and a flattening of the expiratory flow pattern duringpressure breathing. The mean peak inspiratory flow for the four subjects wvasincreased by 55",, and the mean rates of increase and of decrease ofinspiratoryflow were more than doubled by pressure breathing at a positive pressure of30 mmHg. D)uring expiration the flow remained relatively constant for mostof the phase. This plateau value was generally slightly greater than the restingpeak expiratory flow.
The rate of incr:'ase of expiratory flow to a value equal to about half themaximum value was virtually always equal to the rate of decrease of flowduring the preceding in;piration. The flow declined very slowly towards theend of expiration. Thus on the average pressure breathing without counter-pressure, particularly at the higher pressure (30 mmHg) used in this studymarkedly increased the maximum flow and the rate of change of flow duringinspiration. These changes were associated in three of the four subjects withan increase in the tidal volume, a 5v",, reduction of the duration of inspira-tion and a decrease of the ratio of inspiratory time to total cycle time from amean control value of 0.37 to one of 0.29. During pressure breathing atpositive pressures above io mmHg inspiration occurs by relaxation of theexpiratory muscles. The increased peak flow and the increased rate of changeof flow produced by pressure breathiig at 3o mmHg in three of the floursubjects used in this study suggested that nervous control of respiration underthese conditions is less precise than during normal inspiration, when the lungvolume is increased by contraction of the inspiratory muscles. The flatteningof the expiratory flow pattern produced by pressure breathing was verysimilar to the change produced by the imposition of resistance to expira-tion (268).
143
-- - I= *m. I - W . !I I

RAISED INTRAPUI.M()NARY PRESSURE
The application of counterpressure to the chest by mean% of a p. essuiwaistcoat reduced the disturbances of respiratory flow induced by breathingwithout counterpressure at a positive pressure of 30 mmHg (Fig. 4-7). At thehigher positive breathing pressures, 50 and 8o mmHg, however, there was amarked increase in the maximum flow and the rate of change of flow duringinspiration. At the highest positive breathing pressure studied (8o nmmHg) themean peak inspiratory flow was more than doubled. In contrast to the markedchanges produced by a positive pressure of 8o mmHg with chest counter-pressure, pressure breathing at this lcvel with trunk counterpressure producedonly minor changes in the respiratory flow pattern. Thus the profoundchanges produced by pressure breathing when chest counterpressure alonewas used, was due to the absence of support to the abdomen. This observationsuggests that the nervous co-ordination of the partial relaxation of theabdominal muscles during inspiration under these conditions was less precisethan is the normal co-ordination of the inspiratory muscles.Intraoesophageal Pressure - The valu-' of the intraoesophageal pressureas an indirect measure of the mean intrapleural pressure has been studied byseveral investigators (2 1o) (6o) (208) (171 ). Comparisons of intraocsophagealpressure with the pressure in a small pneumothorax have shown that thereis no consistent relationship between the absolute values of these pressuresalthough in tihe same subject changes ofintraoesophageal pressure do approxi-mate to those of pleural pressure. The agreement between the change ofintraoesophageal pressure and change of intrapleural pressure is best in theerect posture (2o8) and when the former is measured in the lower third ofthe oesophagus. The discrepancies introduced when the pressure is measuredin the middle third of the oesophagus cr when the subject is in the supineposition are probably due to external compression of the oesophagus by thecontents of the mediastinum. The marked increase of the difference betweenthe intranesophageal pressure and that at the mouth which occursduring a maximal expiration is probably due to the same mechanism(171).
Thus changes of intraocsophageal pressure reflect fairly closely the simul-taneous changes of intrapleural pressure in the erect posture provided thatthe lung volume is not reduced below the normal end-expiratory level. \eadand Gaci sler 1959 (2o8) also demonstrated that the flow resistance com-ponent c F the intraoesophageal and intrapleural pressures corresponds moreclosely than do the elastic components of these pressures. Thus greaterreliance may be placed upon the values of the non-elastic resistance to airflow calculated from the recorded changes of intraoesophageal pressure thanon values of pulmonary compliance calculated from the same pressurechanges. Care was taken in the present investigation to place the recordingballoon in the lower third of the oesophagus and the lung volume was alwaysincreased by pressure breathing. Since also all the experiments were con-ducted with the subjtctt in the seated position, it was concluded that thismethod of measuring changes of intrapleural pressure was suitable for thestudy of the mechanics of respiration during pressure breathing.
Rohrer 1r15 (249) was the first to make a detailed analysis of the mechani-cal behaviour of the respiratory system. He considered three groups of forces,namely:
144
__ _ _ _ __ _ _i _ __ _ _ _ t . .
MENIFIANICS OF RESPIRATION
(a) elastic, which depend upon the degree of defcrmation of the systemand heiice up , the volume of the lungs;
(b) frictional, generated by the rcsistance to gas flow of the respiratorytract and the resistance of tile lung parenchyma and surroundingtissues to deformation, which depend upon the rate of change ofvolume of the lungs and
(c) inertial, generated by the acceleration of the system which dependupon the rate of change of tile volume of the lung.
Rohrer considered that under normal conditions the inertial forces werenegligible. Recently Mead i956 (207) demonstrated experimentally thatduring normal breathing the pressure required to overcome tile inertia of thelungs and the gas within them amounts to about o.5"', of tile total pressurechange in the pleural space dus ing the respiratory cycle. Even during heavyexercise Mead calculated that tihe fraction of the total pleural pressure swingwhich is exerted against inertial forces is less than 5.,,. Thus when consideringthe lungs and the gas within them the fbrces which must be overcome duringrespiration may be separated into two ti-actions: an elastic component whichi.- directly proportional to tihe change in volume and a non-,,daic componentwhich varies with the rate of gas flow (28) (210) (21 j). This is the form ofanalysis which was used in the present investigation.Lung Compliance - At the end of expiration when there is no air flowthrough the airways, the difference in pressure between the mouth and thepleural space is a function of the elastic properties of tihe lungs. In all theexperiments the iimtrancsophageal pressure was less than the pressure at themouth at the end of expiration and this pressure difference was increased bypressure breathing. Pressure breathing without respiratory counterpressurecaused a marked increase of this pressure difference, the increase beinggreater at the higher breathing pressures. The application ofcounterpressureto the chest reduced the increase of the mouth-oesophageal pras.sure differenceinduced by a positive breathing pressure of 30 mmHg in the absence ofcounterpressure, but e-en with chest counterpressure a positive breathingpressure of 8o mmHg induced a very large increase of this pressure difference.When trunk counterpressure was employed the increase of the mouth-intraoesophageal pressure was relatively small. Since in some of these experi-ments the change of lung volume induced by the pressure breathing was alsorecorded it is possible to compare the latter with the corresponding increaseof the mouth-intraoesophageal pressure difference, Fig. 4-21. Fo, a givensubject there was, over a wide range of lung volumes, a linear relationshipbetween the change of the expiratory reserve volume and the end-expiratoryvalue of thle inouth-intraoesophageal pressure difference. The linearity of thisrelationship suggests that the elastic properties of the lungs are unchangedover a wide range of lung volumes and further that these properties are notaffected by pressore breathing. These conclusions were confirmed by thevalues of the lung compliance obtained in these experiments (Fig. 4-to).The increase in the end-expiratory rnouth-intraoesophageal pressure dif-ference produced by pressure breathing was due, therefore, to the concomitantincrease of the end-expiratory lung volume which this manoeuvre induced.
The absence of any significant chan:; :of pulmonary compliance followingthe induction of pressure breathing at a positive pressure of 8o mmHg when
145
J I I I I I I II I I I I I I
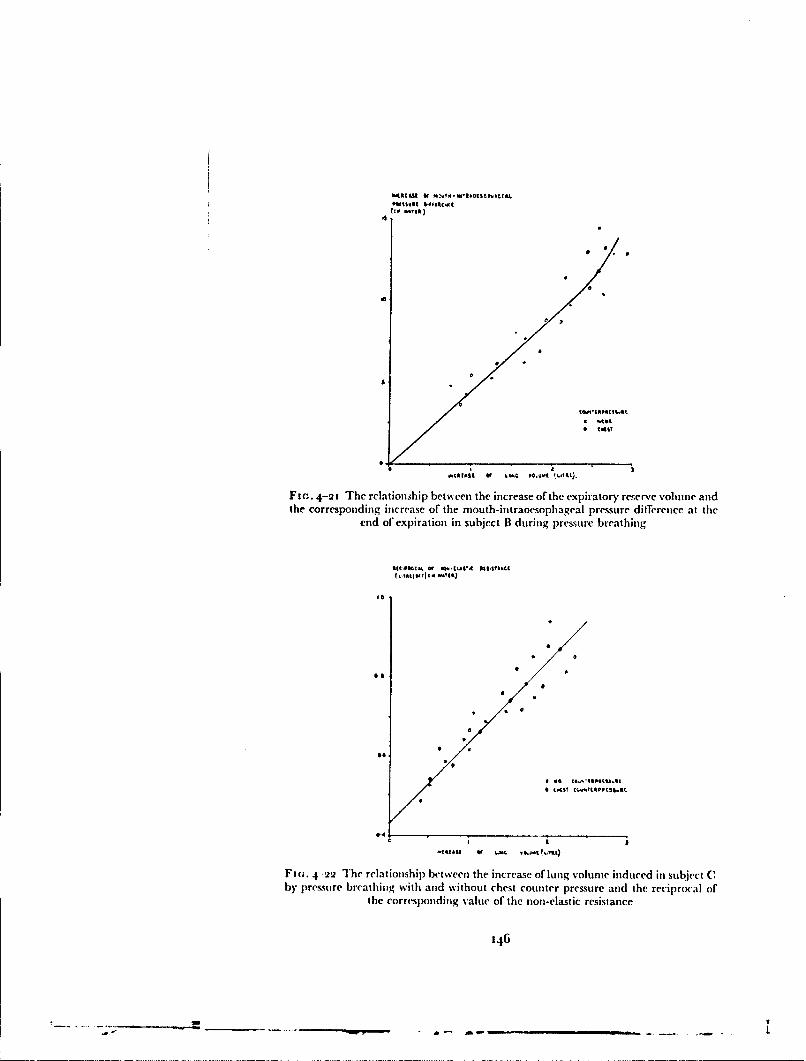
ToC* reiS ) ,.~StIf~l
Fic,. 4-ai The relations•hip between the increase of tile expiratory reserve volume andthe corresponding increase of the mouth-intraoesophageal pressure difference at tile
end of expiration in subject B during pressure breathing
ft *S tuvaoc(
0.0
6.4
I I
FIm. 4 22 The relationship bet ween the increase of lutng voelme induced in subject C
by pressure breathin~g with and without chest counter pressure and the reciprocxal ofthe corresrpding value of the non-elastic resistance
146

MECHANICS OF RESPIRATION
trunk counterpressure was employed is of particular interest. In this conditionthe blood content o, the lungs was considerably reduced. This observationsuggests, therefore, that the elasticity of the lungs was not influenced by areduction of their blood content. Several studies of the effect of pulmonarycongestion upon lung compliance have been made in animals but there issome conflict between the results of various investigators. Thus Drinker,Peabody and Blumgart I922 (81) showed that constriction of the pulmonaryveins about halved the compliance of the lungs of cats with intact chests. Inisolated dog's lungs, Mack Grossman and Katz 1947 (199) found that theinjection of blood into the pulmonary vessels markedly reduced the distensi-bility of the lung. These and other studies (153) were, however, marred bythe absence ofany measurement of the pulmonary vascular pressures achievedduring congestion. In 1955 Frank, Radford and Whittenberger (1 13) foundthat increasing the pulmonary capillary pressure from o to 12 mmHg inexcised lungs did not change the compliance. Hughes, May and Widdicombe3958 (16o) investigated the effects of' increasing the vascular pressure inperfused lungs in the rabbit and cat and in the intact cat. In isolated lungsthey found that the mean reduct'on of compliance per mmHg of increase ofpulmonary vascular pressure was o.8",, whilst in cats with intact chests themean decrease of compliance was 0.3"o per mmHg increase of left atrialpressure.
These animal experiments suggest. therefore, that even moderate pul-monary congestion causes only a smali decrease of pulmonary compliance.Studies in man have also given rise to conflicting results. Thus there is nodoubt that in mitral stenosis and congestive heart disease the pulmonarycompliance is reduced (62,) (26o). Saxton et al found, however, that no correla-tion existed between compliance and pulmonary wedge pressure in patientswith heart disease. Further following alleviation of the pulmonary congestionby mitral valvulotomy, the compliance did not increase. There is little do:zbtthat in chronic pulmonary congestion the reduction of compliance is due tosecondary vascular and parenchymal changes such as fibrosis. Further, pul-monary ocdema is known to produce a marked reduction of compliance (16o)and to some degree oedema generally exists in chronic pulmonary congestion.In normal subjects, Pryor and Page 1954 (239) showed that large intravenousinfusions of saline produced a marked reduction of pulmonary compliance,but they did not measure pulmonary vascular pressures and further interstitialocdema may have occurred.
Bondurant, Hickam and Isley 1957 (39) induced pulmonary congestionby either compressing the lower limbs and abdomer. with a pressure suit or byimmersion up to the neck in water, whilst Ernsting 1958 (92) and Ting,Hong and Rahn 196o (276) used negative pressure breathing as a means ofincreasing the blood content of the lungs. All these manoeuvres induced anapproximately 50% reduction of the compliance of the lung. Since, however,these procedures also reduced the functional residual capacity below theresting value the intraoesophageal pressure probably bore little relation tothe pleural pressure and no reliance can be placed upon the compliance valuesobtained in these circumstances (276). Thus the effect of pulmonary con-gestion upon compliance in man is uncertain. In all these studies, however,the blood content of the lung was increased above the normal resting value
1.17
I I I I I II I I ! i i .
RAISED INTRAPULMONARY PRESSURE
whereas in positive pressure breathing the pulmonary blood volume is reducedbelow the resting level. The absence of a significant change of compliance inpositive pressure breathing is in agreement with more recent animal studies.There is, however, a need for further experiments in man in order to deter-mine the effects upon compliance of an increase of the pulmonary bloodvolume above the resting value.Airway Resistance - The non-elastic component of the resistance to move-ment of the lungs is due partly to the resistance to the flow of gas through theairways and partly to frictional resistance in the lung tissues themselves. Nodirect method of measuring the viscous resistance of the lung tissue has yetbeen developed. Indirect measurements of tissue viscous resistance based uponthe determination of airway resistance using the interruption technique (230)or by the use of gases of different viscosities and densities (222) have yieldedwidely varying values fbr the magnitude of this quantity. In 1956, however,Marshall and Du Bois (204) made simultaneous determinations of total non-elastic resistance and airway resistance using an intraoesophageal balloon tomeasure the former and a body plethysmograph (83) to measure the latter.They found that the tissue viscous resistance amounted to about one sixth ofthe total pulmonary non-elastic resistance. Thus by far the greater part of thenon-elastic resistance to lung movement is due to the resistance to gas flowthrough the airways.
For a given experimental situation in the present investigation there was aconsistent relationship between the non-elastic component of the change ofintraoesophageal pressure and the simultaneous respiratory gas flow. Thisrelationship was slightly alinear at the higher values of flow and other investi-gators (Mead and Whittenberger, 1953) (2 1o) have treated the curve relatingflow to pressure difference as a parabola. In view, however, of the relativelysmall degree of alinearity, it wvas considered that the non-elastic resistance ata single flow value could be used in order to simplify comparison between oneexperimental condition and another. Since the peak inspiratory flow in themajority of the conditions investigated was between 40 and 8o litre/min., thenon-elastic rcsistance was calculated for a flow of 30 litre/mmn. The normalconvention ol expressing the non-elastic resistance as the non-elastic com-ponent of the mouth-intraoesophageal pressure change (cm H20) per unit ofrespiratory gas flow (I litre per second) was followed. No measurable dif-ference was found in any of the conditions studied between inspiratory andexpiratory non-elastic resistance and the inspiratory and expiratory valueshave been used together in the calculation of the mean non-elastic resistance.
The mean value of 2.36 cm water per litre/sec. obtained for the non-elasticresistance in the four subjects at rest agrees closely with the mean value of2.4 cm water per litre/sec. obtained by NIclIlroy, Eldridge and Stone 1956(219) and the me-rn value of 2.29 cm water per litre/sec. obtained byMarshall 1957 (203). Marshall and Du Bois 195'i (204), however, obtaineda considerably lower value (1.2 cm water per litre/sec.) for the total non-elastic resistance in the course of their measurements of the tissue viscousresistance, but their subjects were instructed to breathe rapidly and shallowlywhich reduced the airway resistance. Pressure breathing without respirator'counterpressure caused a marked reduction of the non-elastic resistance, thereduction being greater at a positive breathing pressure of 30 mmHg than at
148
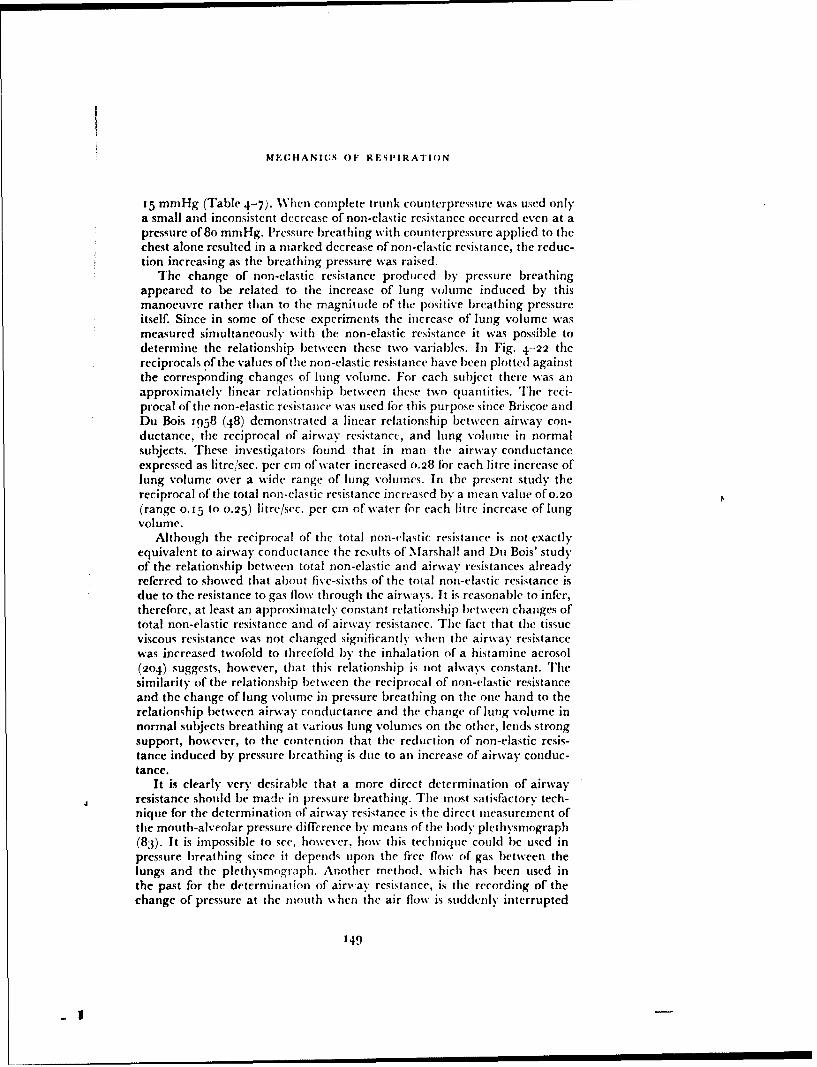
MECHANICS OF RESPIRATION
15 mmHg (Table 4-7). Wi\hen complete trunk counterpressure was used onlya small and inconsistent decrease of non-elastic resistance occurred even at apressure ofBo mmHg. Pressure breathing with counterpressure applied to thechest alone resulted in a marked decrease of non-elastic resistance, tile reduc-tion increasing as the breathing pressure was raised.
The change of non-elastic resistance produced by pressure breathingappeared to be related to the increase of lung volume induced by thismanoeuvre rather than to the magnitude of the positive breathing pressureitself. Since in some of these experiments the increase of lung volume wasmeasured simultaneously with the non-elastic resistance it was possible todetermine the relationship between these two variables. In Fig. 4-22 thereciprocals of the values of the non-elastic resistance have been plot ted againstthe corresponding changes of lung volume. For each subject there was anapproximately linear relationship between these two quantities. The reci-procal of the non-elastic resistance was used for this purpose since Briscoc andDu Bois I958 (48) demonstrated a linear relationship between airway con-ductance, the reciprocal of airway rcsistanct, and lung volume in normalsubjects. These investigators found that in man the airway conductanceexpressed as litre "sec. per cm of water increased o.28 for each litre increase oflung volume over a wide range of lung volumes. In the present study thereciprocal of the total non-elastic resistance increased by a mean value of0.20(range o. 15 to 0.25) litre/sec. per cm of water for each litre increase of lungvolume.
Although the reciprocal of the total non-elastic resistance is not exactlyequivalent to airway conductance the results of Marshall and Du Bois' studyof the relationship between total non-elastic and airway resistances alreadyreferred to showed that about five-sixths of the total non-elastic resistance isdue to the resistance to gas flow through the airways. It is reasonable to infer,therefore, at least an approximately constant relationship between changes oftotal non-elastic resistance and of airway resistance. The fact that tile tissueviscous resistance was not changed significantly when the airway resistancewas increased twofold to threefold by the inhalation of a histamine aerosol(204) suggests, however, that this relationship is not always constant. Thesimilarity of the relationship between the reciprocal of non-elastic resistanceand the change of lung volume in pressure breathing on the one hand to therelationship between airway conductance and the change of lung volume innormal subjects breathing at vairious lung volumes on the other, lends strongsupport, however, to the contention that the reduction of non-elastic resis-tance induced by pressure breathing is due to an increase of airway conduc-tance.
It is clearly very desirable that a more direct determination of airwayresistance should be made in pressure breathing. The most satisfactory tech-nique for the determination of airway resistance is the direct measurement ofthe mouth-alveolar pressure difference by means of the body plethysmograph(83). It is impossible to see, however, how this technique could be used inpressure breathing since it depends upon the free flow of gas between thelungs and the plethysmograph. Another method, which has been used inthe past for the determination of airvay resistance, is the recording of thechange of pressure at the mouth w~hcn the air flow is suddenly interrupted
149

RAISED INTRAPULtMONARY PRESSURE
(230). As has been pointed out, however, by Marshall and Du Bois 1956(204) the movement of the chest and lungs must be halted when interruptionoccurs and the energy which is being exerted against tissue resistance at themoment of interruption is transformed into pressure in the lung. Thus theinterruption pressure measured is really the sum of the pressures exertedaga-inst both airway and tissue resistance. That this technique measures totalnon-elastic resistance has been shown experimentally by Mead and Whitten-berger 1954 (21i). A limited series of measurements using the interruptertechnique were made in the prese,,t study. Resuits obtained for the pulmonaryresistance both at rest and during pressure breathing were very similar tothe values of the non-elastic resistance found in the corresponding experi-mental situation. The results given by the interrupter technique serve toconfirm, therefore, the measurement of the tota! non-elastic resistanceobtained with an intraoe.sophageal balloon.
Thus pressure breathing produces a reduction of airway resistance whenthere is a concomitant increase in the lung volume. There arc severalmechanisms by which the airway resistance could be reduced in these circum-etances. The most obvious and the most important mechanism is an increasein airway diameter, caused by the distension of" the lungs. The direct correla-tion bctween the change of non-elastic resistance and the increase of lungvolume during pressure breathing supports this contention. The increase ofairway diameter produced by distension of the lungs has been well docu-mentated by anatomical, radiological and physiological studies. ThusShepard, Campbell, Martin and Enns 1957 (267) and Birath 1959 (36) havedemonstrated that the anatomical dead space increases directly with thefunctional residual capacity when the lung volume is voluntariFy increased innormal subjects. The results of these investigations and of calculations byBriscoe and Du Bois 1958 (48) suggest that those airways which have themajor part of the airway resistance of the lungs as a whole, are as distensibleas the alveoli.
The measurements of the effect of pressure breathing upon the anatomicaldead space presented in Chapter 5 add further support to the hypothesis thatthe reduction of airway resistance caused by this manoeuvre is due to anincrease in the diameter and hence the volume of the resistance airways. Theairway resistance can also be modified by reflex and humoral activity. Theabsence of any significant change of airway resistance when trunk counter-pressure was employed suggests, however, that this mechanism is not impor-tant in pressure breathing. Finally, changes in airway calibre could beproduced in pressure breathing by alteration in the vascularity of the bron-chial mucosa. The blood content of the lungs and presumably the degree offilling of the vascular bed of the bronchial mucosa are reduced during pressurebreathing. Again the absence of a significant reduction of airway resistanceduring pressure breathing with trunk counterpressure suggests that thismechanism does not contribute to the reduction of airway resistance foundwhen lung distension is produced by pressure breathing.Respiratory Work - The modern analysis of the mechanical work per-formed by the respiratory muscles was first proposed in detail by Otis, Fennand Rahn 1950 (229). They measured the total mechanical work of breath-ing by passively ventilating the subject in a respirator. With the advent of the
550
I
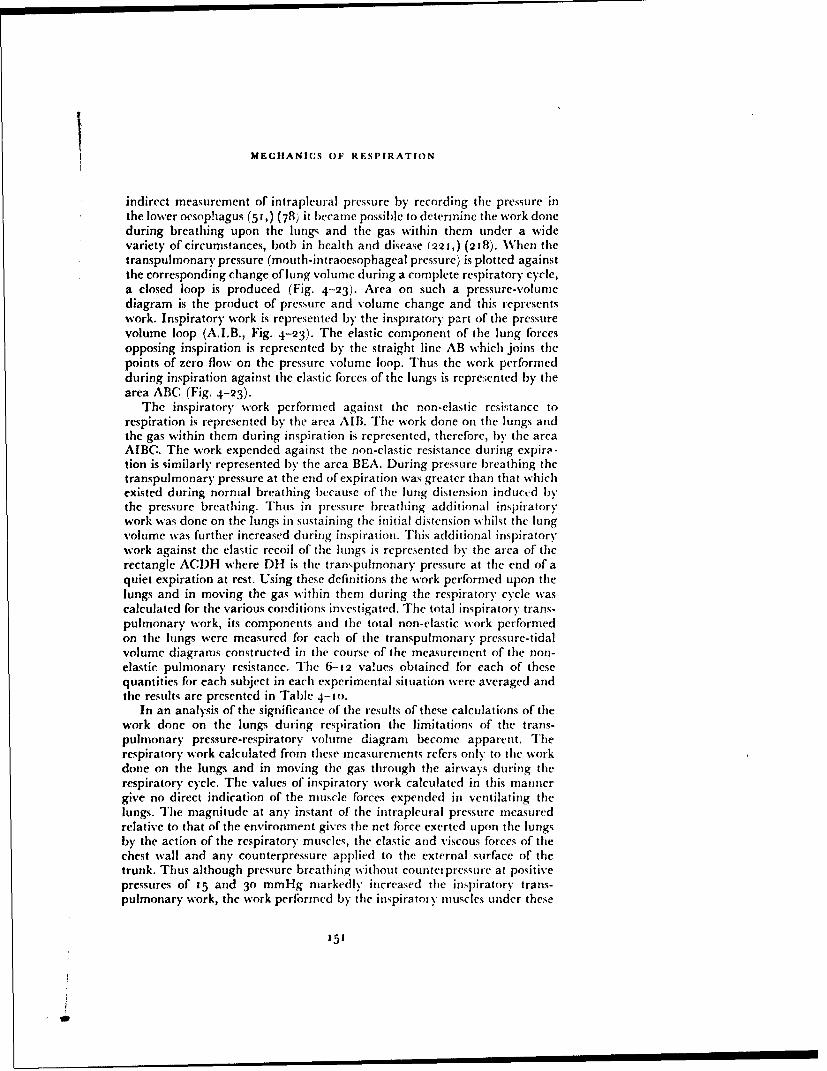
MECHANICS OF RESPIRATION
indirect measurement of intrapleural pressure by recording the pressure inthe lower oesophagus (51,) (78) it became possible to determine the work doneduring breathing upon the lungs and the gas within them under a widevariety of circumstances, both in health and disease (221,) (218). When thetranspulmonary pressure (mouth-intraoesophageal pressure) is plotted againstthe corresponding change of lung volume during a complete respiratory cycle,a closed loop is produced (Fig. 4-23). Area on such a pressure-volumediagram is the product of pressure and volume change and this representswork. Inspiratory work is represented by the inspiratory part of the pressurevolume loop (A.I.B., Fig. 4-23). The elastic component of the lung forcesopposing inspiration is represented by the straight line AB which joins thepoints of zero flow on the pressure volume loop. Thus the work performedduring inspiration against the elastic forces of the lungs is repre:;ented by thearea ABC (Fig. 4-23).
The inspiratory work performed against the non-elastic resistance torespiration is represented by the area AIB. The work done on the lungs andthe gas within them during inspiration is represented, therefore, by the areaAIBC. The work expended against the non-elastic resistance during expira-tion is similarly represented by the area BEA. During pressure breathing thetranspulmonary pressure at the end of expiration was greater than that whichexisted during normal breathing because of the lung distension induced bythe pressure breathing. Thus in pressure breathing additional inspiratorywork was done on the lungs in sustaining the initial distension whilst the lungvolume was further increased during inspiration. This additional inspiratorywork against the elastic recoil of the lungs is represented by the area of therectangle ACDH where DH is the transpulmonary pressure at the end of aquiet expiration at rest. Using these definitions the work performed upon thelungs and in moving the gas within them during the respiratory cycle wascalculated for the various conditions investigated. The total inspiratory trans-pulmonary work, its components and the total non-elastic work performedon the lungs were measured for each of the transpulmonary pressure-tidalvolume diagrams constructed in the course of the measurement of the non-elastic pulmonary resistance. The 6-12 va!ues obtained for each of thesequantities for each subject in each experimental situation were averaged andthe results are presented in Table 4-to.
In an analysis of the significance of the results of these calculations of thework done on the lungs during respiration the limitations of the trans-pulmonary pressure-respiratory volune diagram become apparent. Therespiratory work calculated from these measurements refers only to the workdone on the lungs and in moving the gas through the airways during therespiratory cycle. The values of inspiratory work calculated in this mannergive no direct indication of the muscle forces expended in ventilating thelungs. The magnitude at any instant of the intrapleural pressure measuredrelative to that of the environment gives the net force exerted upon the lungsby the action of the respiratory muscles, the elastic and viscous forces of thechest wall and any counterpressure applied to the external surface of thetrunk. Thus although pressure breathing without counterpressure at positivepressures of 15 and 30 mmHg markedly increased the inspiratory trans-pulmonary work, the work performed by the inspiratoty muscles under these
151
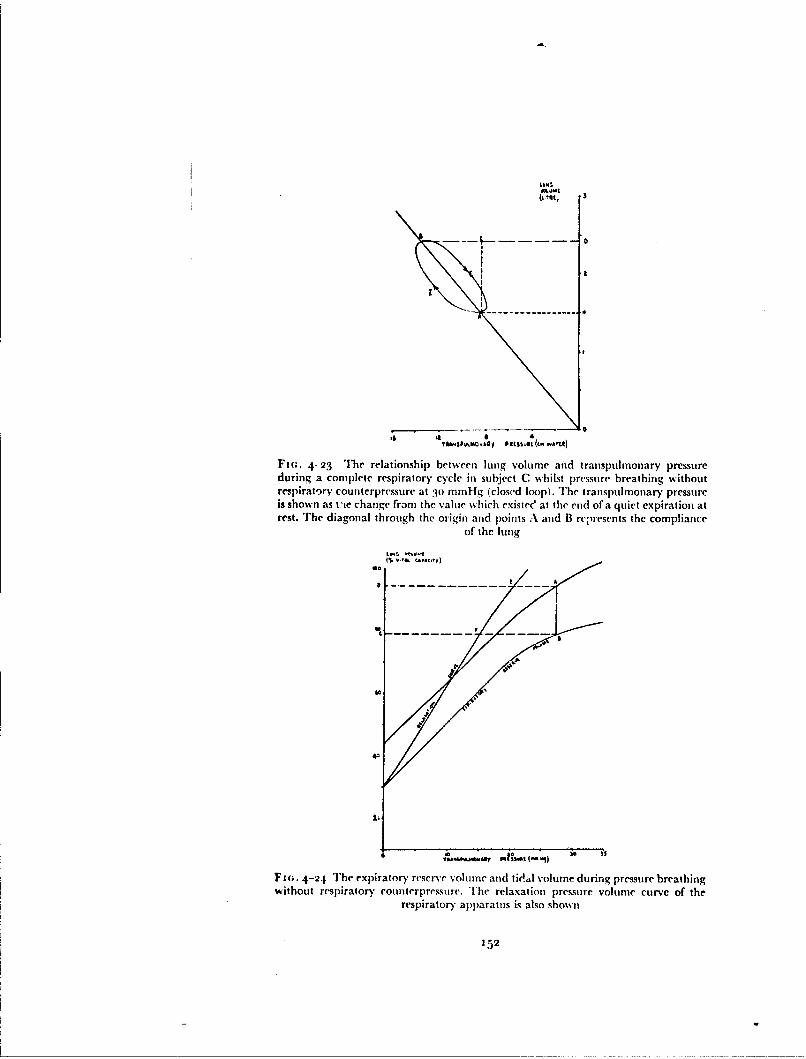
I0.•
-i- A
a a 4yusD oitv II eI(4 aU
FI(;. 4-23 The relationship between lung volurne and transpulmonary pressureduring a complete respiratory cycle in subject C whilst pressure breathing withoutrespiratory counterpressure at Pn mmHg (closed loop). The transpulmonary pressureis shown as t'te change from the value which existec' at the end of a quiet expiration atrest. The diagonal through the origin and points A arid B represents the compliance
of the lung
No
'7;
A• rnG.JA&7 JUlSi 9)
F1n. 4-24 The expiratory reserve volume anid ti t .dl volume during pressure breathingwithout respiratory coullterpressure. 'The relaxation pressure volume curve of the
respiratory apparatus is also shown
152

MECHANICS OF RESPIRATION
conditions was nil (243). Provided, however, that these limitations are recog-nized, the calculation of the work done on the lungs and in moving gasthrough the airways during pressure breathing is of value.
Inspection of Table 4.10 reveals that the total work expended on the lungsand in moving gas through the airways during inspiration was greatly in-creased by pressure breathing in the absence of respiratory counterpressure.Although this increase was reduced by the application of counterpressure tothe chest, pressure breathing at 8o mmHg with a pressure waistcoat increasedthe work sevenfbld. The application of counterpressure to tihe whole of thetrunk greatly reduced the increase in the inspiratory w'-rk induced by pressurebreathing so that even at a positive breathing pressure of Po mmHg the total",'ork performed on the lungs and the gas within them duri ig inspiration wasonly just over twice that expended at rest. The increase r f inspiratory workinduced by pressure breathing was due to increases in both the elastic andnon-elastic components, but most of the increase was contributed by theelastic firaction. The work done against the elastic forces of the lungs has beensubdivided further into that expended in increasing the lung volume duringinspiration and that required to maintain the existing end-expiratory tension(Table 4. 1o).
The elastic work done in increasing the lung volume was increased by athird by pressure breathing without counterp'ressure at 3P mmHg. 'Theapplication of' counterpressure to the trunk prevented most of this increasewhilst the greatest increase of this component of the elastic work occurredduring pressure breathing at 8o mmHg with the press ire breathing waistcoat.Since pressure breathing only caused a small decrease of lung compliancethese increases were primarily a function of the changes of tidal volume in-duced by this manoeuvre. In the resting state the lung arid thorax returnedto the relaxed position so that no work was expended in producing a main-tained distension of the lung. In all the pressure breathing situ.tions, however,there was a maintained distension of the lungs. The work done against thiscomponent of the elastic forces during inspiration was determined by themagnitude of the increase of the transpulnonary pressure indduced by thepressure breathing and the tidal volume. Thus the greatest increase of thiscomponent was produced by pressure breathing with ch,:st counterpressurealone at a positive pressure of8o mmHg (Table 4. 10).
The work expended in overcoming the non-elastic resistance of the lungsand in moving the gas in the airways was only moderately increased bypressure breathing. The decrease in non-elastic resistance which occurredduring pressure breathing when there was distension of the lungs did notcompensate completely therefore for the associated increase of the inspiratoryflow. The greatest increase of non-elastic inspiratory work occurred at apositive breathing pressilre of do mmHg with chest counterpressure. Pressurebreathing caused a relatively small change of the expiratory non-elastic work(Table 4. 1o), because the expiratory flow was not greatly increased arid theincrease which did occur was partially compensated by the decrease of thenon-elastic resistance of the lungs. In all the situations studied no active workwas required to overcome the non-elastic pulmonary resistance to expirationsince this was supplied by the elastic recoil of the lungs.
The relationship between the work performed by the respiratory muscles
153

RAISED INTRAPULMONARY PRESSURE
TABLE 4-10
MEAN VALUES FOR TIlE WVORK DONE ON TIlE LUNG
AND ITS CONTENTS CALCULATED FROM TIlE RESUITSOF DUPLICATE EXPERIMENTS ON FOUR SUBJECTS
WORK PER BREATI! (Kg-Cm) EXPIRA-INSPIRATION TION
Positive breathing Elasticpressure Moving Sustaining Non- Total Non-(rnunHg) Lung Distension Elastic Elastic
Rest 1.37 0.0 o.81 2.18 o.6o
Pressure breathing(a) No countcrprcssure
15 i.6o 3.20 0.9( 5.21 0.62
30 2.03 7.20 1.11 10.34 0.78
(b) Chest counterpressure50 2.09 5.21 0.95 8.25 0.71
8o 3.30 10.00 1.76 15.o6 0.77
(c) Trunk counterpressure50 1.51 1.10 0.85 3.46 o.658o 1.6o 2.00 0.93 4.53 0.71
TABLE 4-I1
MEAN VALUES FOR THE WORK DONE ON THE WHOLE
RENPIRATORY APPARATUS D)URING EXPIRATION CALCU'LATED
FROM TIlE RESULTS OF DUPLICATE EXPERIMENTS ON FOUR
SUBJECTS
Positive breathing pressure Expiratory work per breath (kg-cm)(mmHg) Elastic Non-elastic Total
Pressure breathing with nocounterpressure
15 5.9 1.2 7.120 8.8 A. 10.2
30 13.7 1.6 15.3
154
-- -m ") = m• "" -a- = n*- ' ...

MELIIANI(;5 OF RESi'IRATION
and the actual work done on the lungs and in moving the gas through tileairways, is a complex one. The disturbances of lung mechanics induced bypressure breathing made a quantitative assessment of the muscular effortcxpended in breathing extremely diflicult and tihe( problem is made even moredifficult by the application of counterpressure. At positive breathing pressuresin excess of about to nimHg the pressure applied at tihe mouth was more thanadequate to overcome both the elastic and non-elastic forces of the lungs andthe thoracic cage opposing inspiration. Thus during pressure breathing with-out counterpressure at positive pressures greater than io nimllng no ncchani-cal work was performed by the inspiratory muscles on the lungs and the gaswithin them. There was, however, under these conditions active contractionof tihe expiratory muscles throughout inspiration. Expiration in these circum-stances involved active contraction of the expiratory muscles since the elasticrecoil of the lungs and thoracic cage was inadequate to overcome the pressureapplied at the mouth and the non-elastic resistance of tie respiratory' systemto expiration. The expiratory muscles were assistedl during expiration by theelastic recoil of the complete respiratory .vstem.
in addition to the work involved in displacing the tidal volume from tilerespiratory tract against tile applied breathing pressure, the expiratorvmuscles also expendcd energy in limiting the distension of the lungs andthoracic cage. A serious limitation in the present context to tilth use of tileconventional definition of mechanical work as a florce acting through a dis-tance is that it takes no account of the energy expe-ndcd during the isometriccontraction ofa rnusclt. During pressure breathing without counterpressure alarge proportion of the total energy expended in breathing was consumed bythe isometric contraction of the expiratory muscles which prevented the grossdistension of the lungs which would otherwise occur. It is not possible, there-fore, to estimate this fraction of the work done by the expiratory muscles fromthe pressure-volumie loops obtained fi-om records of mouth-intraoesophagealpressure difference and tidal volume.
Tile work done by tile expiratory muscles in expelling the tidal volumeagainst the pressure applied at the mouth during pressure breathing can,howe" r, be assessed from the position of' the tidal air band relative to therelaxation pressure volume curve for the total respiratory apparatus (24:3).The results of the measurements of these quantities obtained during pressurebreathing without counterpressure are presented in Fig. 4.24. The elasticwork performed in expelling the tidal volume AB whilst pressure breathingat a positive pressure of 28 mmHg is represented by the area ABCI). Part of'this work, represented by the area CI)EF, was done by tihe elastic potentialenergy stored in the thoracic wall and the lungs so that the net work done bythe active contraction of tile expiratory muscles is shown by tile differencebetmseen these two values, i.e. the area ABFE. This work has been estimatedfor each level of pressure brLathing without Counterpressure studied and theresults of these calculations are presented in Table 4.1 . The work expendedagainst the non-elastic resistance of the lungs during expiration at thesevarious levels of pressure breathing has been estimated from tihe results pre-sented in Table 4. to. Further, ifit is assumed that the frictional resistance torespiration offered by the chest wall and abdomen iN equal to the non-elasticresistance of the lungs (220! it is possible to estimate tile total work performted
'55
I I - I I I
RAISED INTRAPULMONARY PRESSVRE
during expiration against the non-elastic resistance of the whole respiratoryapparatus. The results of these calculations are also presented in Table 4.1 L.The work done by the expiratory muscles in reducing the volume of the lungsand chest and overcoming the non-elastic resistance of the respiratory appara-tus was very considerable. 'Fher e valueq r•y be compared with the total workexpended during respiration at rest which amounted to 4.- kg.cm/breath.
The work performed by the respiratory muscles when counterpressurewas applied to the tiunk during pressure breathing could not be assessedquantitatively. If the counterpressure applied to the surface of the trunkexactly equalled the pressure applied to the respiratory tract then the work ofbreathing would not be increased above that expended at the same level ofventilation at rest. The present investigation has demonstrated, however, thatthe counterpressure applied by the jerkin was not perfect. [here was somedistension of the lungs and thorax equivalent to pressure breathing withoutcounterpressure at a positive pressure of 3-4 mmHg. There was also anincrease of the tidal volume. The energy expended by the abdominal musclesduring pressure breathing with chest counterpressure alone was certainlygreatly increased, although the magnitude of this increase could not beassessed quantitatively.
It is of interest to consider briefly the effect of the increased respiratorywork associated with pressure breathing upon the metabolic oxygen consump-tion. Several investigators have measured the additional oxygen consumptionassociated with an increase of ventilation produced either by voluntaryhyperventilation or by adding carbon dioxide to the inspired gaý 189) 226)(58). At rest the oxygen consumption of the respiratory muscles amounts tobetween 2 and 8 ml (S.T.P.) per minute. The efficiency of the respirator)ymuscles can be calculated by measuring the mechanical work performed anddividing it by the energy equivalent of the oxygen consumption of the respi-ratory muscles. Otis, Fenn and Rahn 1950 (229) estimated the efficiency to be3 to 7', whilst Campbell, Westlake and Cherniack 1957 (58) obtainedvalues of between 5 and io",, in three young normal subjects, Thus if theefficiency of the respiratory muscles was unchanged during pressure breath-ing, the oxygen cost of pressure breathing at a positive pressure of 30 mmHwithout counterpressure would be of the order of 12-25 ml per minute.Tihe increase of oxygen consumption over that at rest induced by a positivebreathing pressure of 3o mmHg would be expected therefore to be approxi-mately 10-20 ml per minute. The mean value actually obtained in the presentstudy (Chapter 5) amounted to 2 1 ml per minoite. There was, therefore, goodagreement between the measured and predicted values for the increase ofmetabolic oxygen consumption induced by pressure breathing. The predictedincrease in the metabolic oxygen consumption occasioned by pressure breath-ing with trunk counterpressure at a positive pressure of 8o mmHg would beconsiderably less than 10-20 ml per minute. In fact pressure breathing at8o mmHg with trunk counterpressure did not cause a significant change inthe total oxygen consumption from that measured at rest.Intragastric Pressure - The continuous measurement of the pressure with-in the stomach has been used by several investigators (84) (215) (55, 56) (3),in an attempt to analyze the behaviour of the diaphragm and abdominalmuscles during normal breathing. The relationThip between the pressure
156
.•-- • • .,~I,4 - ..

MECIHANI(.S OF- RESPIRATION
reCdl ded by an intragastric balloovn and that at the abdominal surface of thediaphragm is, determined by the tone of the gastric musculature and thehydrostatic pressure exerted by the abdominal contents lying between thediaphragm and the balloon in the stomach. Agostoni and Rahn 196o (3)found that in the relaxed subject at all lung volumes greater than 2o",, of thevital capacity the pressure recorded by the intragastric balloon was about I Ican water greater than the simultaneously determined intraoesophagealpressure. These authors assumed that the diaphragm was relaxed in thiscondition and that since therefore the pressures on the two surfaces of thediaphragm were equal, the intragastric pressure was some t tcm watergreater than that at the abdominal surface of the diaphragm. In the presentstudy the intragastric pressure at the end of expiration was found to exceedthe corresponding value of the intraoesophageal pressure by a mean value of10.4 cm water (S.E. -- o.8 cm water). These results also agree closely withthose obtained by Duomarco and Rimini 1947 (84).
The general behaviour of the intragastric pressure found during breathingat rest agreed with the studies performed by J)uomarco and Rimini 1947 (84)and Campbell and Green t933 (53, 56). Campbell and Green 1955 (57)demonstrated that even in the erect posture there may be no electricalactivity in the muscles of the anterior abdominal wall. When these musclesexhibited a respiratory rhythm it took the form of a decrease of activity duringinspiration and an increase during expiration. Thus the rise of abdominalpressure during inspiration was not due to contraction of the abdominalmuscles. It was the result of the contraction and the consequent descent of thediaphragm. The marked increase in the difference between the pressures inthe oesophagus and stomach which occurred during inspiration was alsoevidence of (Fig. 4-14) active contraction of the diaphragm. The reductionef the intragastric and transdiaphragmatic pressures which occurred duringexpiration at rest reflected relaxation of the diaphragm. By recording theelectrical activity of the diaphragm with intraocsophageal electrodes Agostini,Sant, Ambrogio and I)el Portillo-Carrasco iq6o (4) have confirmed thispattern of activity of the diaphragm during quiet breathing.
It is possible to calculate the pressure at the abdominal surface of the dia-phragm relative to that of the environment (the abdominal pressure) fi-omthe recorded mouth-intragastric pressure difference, assuming that theintragastric pressure was 10.4 cm water greater than the abdominal pressure.D)uring pressure breathing without respirator)y counterpressure at a positivepressure of 15 mmHg this pressure at the end of expiration "' 1 r 8 mmllg,whilst the corresponding value at a positive breathing pressure of 30 mmllgwas 19 mmHg. These values of the abdominal pressure are a measure of thetension created by the muscles of the abdominal wall during pressure breath-ing. The increase of the transdiaphragmatic pressure during inspirationwhich occurred at rest was reduced by a poitive breathing pressure of 15mmHg and almost eliminated by pressure breathing at 30 mmHg (Fig. 4-14).Thus the contribution of the active contraction of the diaphragm to inspira-tion was progressively reduced as the breathing pressure was increased. Atthe higher pressure inspiration was almost solely due to partial relaxation ofthe intercostal and abdominal muscles.
It is of interest that active contraction of the diaphragm occurred during
157
,- , . , I II I II

RAISED IN'FRAI't. MONARY PRESSURE
pressure breathing at 15 mmHg since relaxation of the expiratory muscles ofitself could produce inspiration at this breathing pressure. Similar results atpositive breathing pressures of up to 22 mnrnHg have recently been obtainedby Agostoni 196 2 (2). He also recorded the electrical activity of the dia-phragmn during pressure breathing and found that there was activity duringinspiration even at a positive breathing pressure of 22 mnilg. The appear-ance of an increase of the gastric pressure during expiration with the induc-tion of pressure breathing is evidence of an increase in the tension of theabdominal muscles during this phase of the respiratory cycle. The trans-diaphragmatic pressure was virtually zero throughout expiration duringpressure breathing at 30 mmHg. At this pressure, threrlbre, the diaphragmwas acting in a passive manner during most of the respiratory cycle. Thefunction of the diaphragm during pressure breathing with chest counter-pressure was similar to that seen when no counterpressure was employed. Thetension created by the contraction of the abdominal muscles during pressurebreathing at positive pressures of 50 and 8o mmHg was much greater, how-ever, as is reflected by the end-expiratory abdominal pressure which anioun-ted to 4 1 and 7o mmHg respectively.
The application of counterpressure to the whole trunk during pressurebreathing raised the intra-abdominal pressure by virtually the pressure appliedto the respiratory tract. Thus the end-expiratory abdominal pressure duringpressure breathing at 8o mmHg was 76 mmHg. The pattern of the intragastricand transdiaphragmatic pressure changes during the respiratory cycle, whenbreathing with trunk counterpressure were almost indistinguishable firomthose recorded at rest (Fig. 4-14). Thus when full trunk counterpressure isused the diaphragm plays an important part in the production of inspirationeven at a positive breathing pressure of 8o mml-Ig.
SUMMARY
This experimental investigation of the effects of pressure breathing uponthe mechanics of respiration confirmed that the primary disturbance inducedby this manoeuvre was pulmonary distension. The elastic recoil of the lungsand of the chest and abdominal walls opposed the distending fbrce and, inaddition, at positive breathing pressures in excess of to mmHg the expiratorymuscles were active throughout the respiratory cycle. In spite of the increaseof tension of the expiratory muscles the lungs were almost filly distended bya positive breathing pressure of 30 mmHg. The compliance of the lungs wasvirtually unaffected by pressure breathing, but the non-elastic pulhonary'resistance was markedly reduced. The work done upon the lungs and inmoving the gas within thenm was however increased during pressure breathingbecause of the concomitant increase of the tidal volume. Pressure breathing atpositive pressures in excess of 8--o mmHg reversed the active phase of respi-ration so that there was an increase of tone in the expiratory muscles duringexpiration and inspiration occurred by partial relaxation of these muscles.There was evidence, however, that even at a breathing pressure of i5 mmHgthere was active contraction of the diaphragm during inspiration. It wasconcluded that the practical limit to pressure breathing without the use ofexternal respiratory counterpressure was a positive breathing pressure of30 mm Hg.
158

ME:IIANICS ()OF RESPIRATION
The application of counterpressure to the thorax by means of a pressurewaistcoat inflated to the same positive pressure as that applied to the respira-tory tract reduced the disturbances induced by simple pressure breathingalone. A positive breathing pressure of about 8o mmHg was required to fullydistend the lungs when chest counterpressure was employed. In these circum-stances, however, the abdominal muscles were actively contracted in order tomaintain a pressure of the order of 70 mmHg at the abdominal surface of thediaphragm throughout the respirator)' cycle. Breathing in this state wasextremely tiring and there was a large increase in the tidal volume. The prac-tical limit to pressure with counterpressure to the chest alone, it was con-cluded, was a positive breathing pressure of the order of 30-40 mmHg.
A study of the mechanics of respiration during pressure breathing whencounterpressure was applied to the whole of the trunk by means of a pressurejerki'. revealed that with this garment even pressure breathing at a positivepressure of So mmHg induced only very minor disturbances. The counter-pressure afforded by the pressure jerkin fell only slightly short of the ideal.Pressure breathing at 8o mmHg induced a small increase of lung volume andthe increase of abdominal pressure was some 3-4 mmHg less than the pressureapplied to the respiratory tract and in the bladder of the garment. Essentially,the behaviour of the respiratory muscles during pressure breathing withcounterpressure applied by means of this garment was the same as at rest.The practical limit to pressure breathing with trunk counterpressure affordedby the pressure jerkin is not defined by respiratory factors since it effectivelyprevents any serious disturbance of the mechanics of respiration duringpressure breathing.
t59
S5 J I I I I I I • i i I I IWN!W

CHAPTER 5
PULMONARY GAS EXCHANGE IN PRESSUREBREATHING
INTRODUCTIONSince pressure breathing is used to maintain the oxygenation of the arterial
blood at greatly reduced environmental pressures the effects of this manoeu-vre upon the gaseous exchange between the inspired gas and the bloodflowing through the lungs is of great interest. Pressure breathing generallyinduces an increase of the pulmonary ventilation even when full trunkcounterpressure is employed. It is important to determine, however, theactual change of alveolar ventilation produced by pressure breathing, sincethis, amongst other factors, controls the actual gaseous exchange with theblood flowing through the pulmonary capillaries. Pressure breathing has verymarked effects upon the circulation, thus the regional distribution of thepulmonary capillary blood flow and hence the oxygenation of the arterialblood could be affected by this manoeuvre. It is also conceivable that thisprocedure could affect the uptake of oxygen from the alveolar gas by theblood flowing through the pulmonary capillaries.
These various aspects of pulmonary gaseous exchange were studied duringpressure breathing with the full trunk counterpressure afforded by the pres-sure jerkin. The maximum positive breathing pressure employed was 8ommHg and in man)y experiments positive pressures of 30 and 6o mmHg wereused. Although pressure breathing with trunk counterpressure was theprimary interest, some of the investigations were repeated during pressurebreathing without counterpressure. However, it was only possible to find twosubjects who were able to maintain a regular breathing pattern when exposedto pressure breathing at a positive pressure of 30 mmHg and these wereinvestigated in the limited study of pressure breathing without counter-pressure. In most of the experiments the same four subjects were studied aswere used in the experiments reported in the previous chapter.
EXPERIMENTAL INVESTIGATION
Pressure Breathing at Ground LevelPulmonary Ventilation and Overall Gas Exchange - The pulmonaryventilation, oxygen consumption and carbon dioxide production weremeasured in the resting subject and during pressure breathing by the opencircuit method at ground level. Th- subject, wearing a pressue -jerkin, wasseated in an ejection seat within the decompression chamber. The mouth-piece of the modified pressure helmet worn by the subject was connecteddirectly to a wide boi'e T piece (2.5 cm I.D.) the other two arms of which wereconnected to thc exterior of the chamber by means of smooth-bore hose. Alow resistance non-return valve was fitted in each of these two hoses. Arecording Tissot spirometer was placed outside the decompression chamber
16t

RAISED INTRAPULMONARY PRESSURE
TABLE 5-1
THE EFFECT OF PRESSURE BREATHING AT 30 mnmlG WITHOUT
TRUNK COUNTERPRESSURE UPON PULMONARY VENTILATION
AND GAS EXCHANGE - INDIVIDUAL VALUES OBTAINED
IN QUADRUPLICATED EXPERIMENTS ON TWO SUBJECTS
Subject B CPulmonary Ventilation
(imrin. B.T.P.S.) 1 2 3 4 I 2 3 4Control' 7.35 7.42 7.31 7.62 7.o8 6.98 6.133 7.12Pressure breathing
2 10.23 i3.0o i 3.56 0o.5() 9.28 10.03 10.85 10(.92Recovery3 6.32 6.7) 53.91 6.21 6.05 3.93 3.76 6.55Oxygen uptake
(ml, min. S.T.P.)Control 28o 285 271 283 260 264) 271 265rPressure breathing 309 2()0 283 318 271) 276 295 311Recovery 273 284 281 2711 263 255 28) 267
Carbon dioxide output(ml min. S.T.P.)
Control 226 236 214 229 213 223 218 212Pressure breathing 294 264 284 29i 259 273 281) 2711Recovery 186 20)2 205 392 182 171 176 3i63Respiratory exchange ratioControl o.81 0).83 0.79 o.81 0.82 0.83 o.81 0.8oPressure breathing 0.95 0.91 0.99 0.93 0.93 0.99) 0.95 0o.!)Recovery o.68 0-71 0.73 0.69 o.69 o.67 0).63 0.61
Expired gas collected for 5 min. tr'fire pressure breathing' Expir"I g3as rotlected .ver 4 th1 to fith ami. of pressure hreathin'!
Expired gai collected f-r 5 rmin. startinv t min. after cessation of pressure breathing
TABLE 5-2
THE EFFECT OF PRESSURE BREATHING AT 6o lmlmiG WITH TRUNK
COUNTERPRESSURE UPON PULMONARY VENTILATION
AND GAS EXCHANGE - INDIVIDUAL VALUES OBTAINED
IN DUPLICATE EXPERIMENTS ON FOUR SUBJECTS
Subject A B C D
Pulmonary Ventilation(i.rain. B.T.P.S.) 1 2 1 2 3 2 I 2
Control' 7.15 7.86 6.85 7.31 6 .y) 7.30 6.75 7.06Pressure breathing
2 o.16 io.5,)) 9.61 9.1f) 8.45 9.63 9.9)6 10.37
Recovery3
5.92 6.13 5.54 6.03 5.92 6.15 3.!5 6.03
Oxygen uptake(ml min. S.T.P.)Control 2719 285 290 275 275 290 2631 258Pressure breathing 2114 278 30) 272 269 286 268 253Recovery 276 293 293 290 263 288 262 252
Carbon dioxide output(ml min. S.F.P.)
Control 226 234 240 222 230 235 220 207Pressure breathing 278 264 2(98 28t) 272 3o)6 266 270Recovery 193 211 218 -,7 t70 199 19) 191
Respiratory exchange ratioControl o.81 0.82 0.83 o.81 0.84 o.81 0.82 o.8,Pressure breathing o.98 0.95 0.() 3.03 1.01 3.)7 3.03 3.07
Recovery 0.70 0.72 0.75 o.68 o.63 0.69 0.73 (0.76t Expired gas collected c.ir loin. tiefire pressure breathing
Expired as c,4Ilectet I er tnt It 4th mrin. of pressure breathingExpired gas t ollected for 5 nin. starting i min. after cessation of pressure bureathing
162
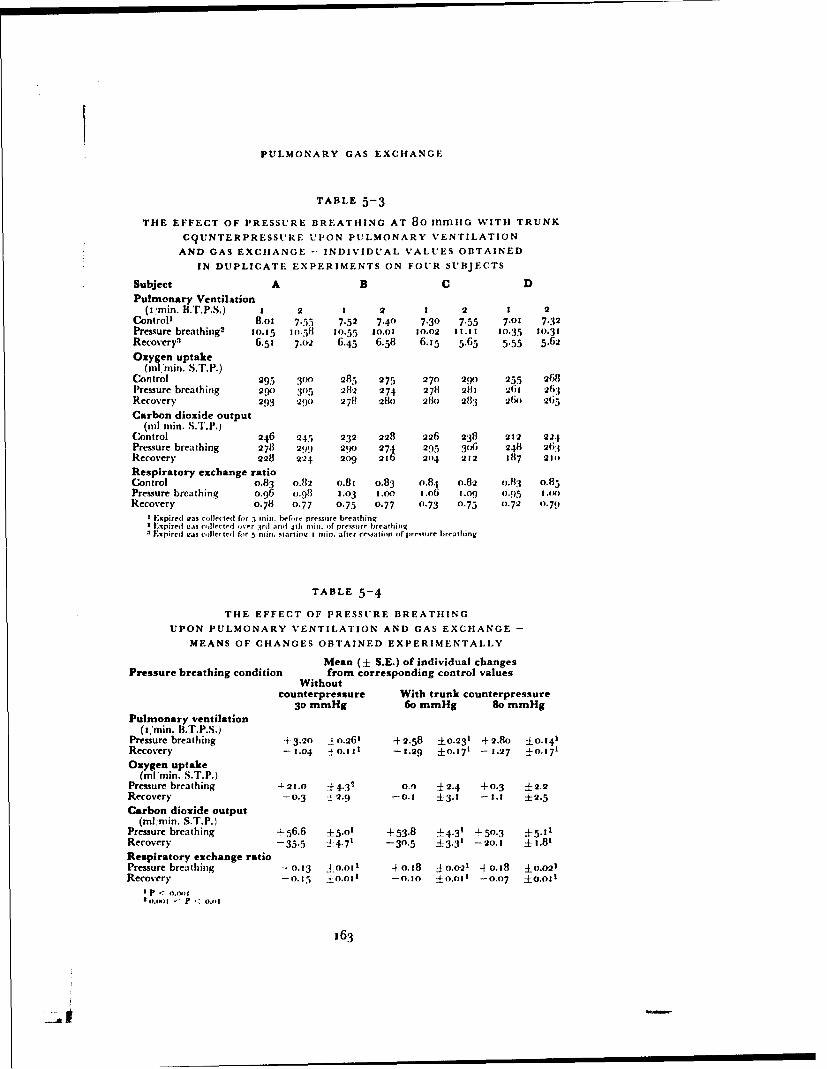
PULMONARY GAS EXCHANGE
TABLE 5-3
THE EFFECT OF PRESSURE BREATHING AT 80 mmnG WITH TRUNK
C9UNTERPRESSURE UPON PULMONARY VENTILATION
AND GAS EXCHANGE - INDIVIDUAL VALUES OBTAINED
IN DUPLICATE EXPERIMENTS ON FOUR SUBJECTS
Subject A B C DPulmonary Ventilation
(i'man. B.T.P.S.) I 2 2 2 1 2 1 2Control
1 8.o0 7.55 7.52 7.40 7.30 7.55 7.01 7.32
Pressure breathing2 10.15 I0.511 10.55 10.01 20.02 11.11 10.35 10.31Recovery
3 6.51 7.2 6.45 6.58 6.15 5.63 5.55 5.62
Oaygen uptake(nil, man. S.T.P.)
Control 295 3o0 285 275 270 2,0 255 268Pressure breathing 2W0 Yo5 28"2 274 278 281 261 263Recovery 293 29() 278 28t) 281o 283 26(2 265
Carbon dioxide output(til ralin. S.T.P.)
Control 246 245 232 228 226 238 212 224Pressure breathing 278 299 290 274 295 3( 6 248 263Recovery 228 224 209 226 204 212 187 21)
Respiratory exchange ratioControl 0.83 0.82 o.81 0.83 0.84 0.82 o.83 0.85Pressure breathing o.96 0.98 2.03 1.0.0 t2.06 2.(0( 0.95 2.K1)
Recovery 0.78 0.77 0.75 0.77 0.73 0.75 03.72 0.79I Expired was coliested ffor 5 mint. heftre pressure breathing
Lxpired seas co lecrted ver rsrd and 4th nin. of pressure breathingExpired was -,,let ted for 5 ["its. starlirl I minu . after re~satirtf of pressure breathing
TABLE 5-4
THE EFFECT OF PRESSURE BREATHING
UPON PULMONARY VENTILATION AND GAS EXCHANGE -
MEANS OF CHANGES OBTAINED EXPERIMENTALLY
Mean (± S.E.) of individual changesPressure breathing condition from corresponding control values
Withoutcounterpressure With trunk counterpressure
30 mmHg 6o mmHg So mmHgPulmonary ventilation
(2min. B.T.P.S.)Pressure breathing +3.20 :j o.261 +2.58 ±0.231 +2.&8 ±0,41Recovery -1.04 ý 0.t1 -1.29 ±0-.71 - 1.27 ±0.171
Oxygen uptake(ml man. S.T.P.)
Pressure breathing -4-21.0 --f 4.3- 0.) ±2.4 -+0.3 ±2,2Recovery -0.3 :• 2.9 -0. 1 3. -2 .1 ±2.5
Carbon dioxide output(mlmin. S.T.P.)
Pressure breathing .- 56.6 0 5.o' +53.8 ±4.3' +-50.3 ±15.211Recovery -35.5 ±4.7' -30.5 ±3.31 -o20.1 ±1.81
Respiratory exchange ratioPressure breathing "`0. 13 4-0.0o1 +o.18 ±0.021 +0.18 ±0o.021Recovery -o.15 ±0.011 -0.0 ±0-.011 -0.07 ±O.OI0
I P < 0.002Io.15I .1 P"3
163
-E
RAISED INTRAPULMONARY PRESSURE
and connected through a two-way tap to the hose through which the subjectinspired gas. Before each experimental period the spirometer was filled withair and the two-way tap turned so that the subject inspired air from it. Whennecessary the spirometer was refilled with room air. The hose carrying theexpired gas was fitted with a two-way tap outside the decompression chamberso that the expired gas could be led into a Douglas bag.
The subject wearing the helmet fitted with the mouthpitce, rested in thequiet for fifteen minutes before a timed five minute collection of expired gaswas made. Pressure breathing at the desired level was induced after thecompletion of the resting collection and a further collection of expired gaswas made during the second or third and subsequent minutes of pressurebreathing. The duration of the collection period during pressure breathingwas varied with the magnitude of the positive breathing pressure. The pres-sure breathing period was followed by a third collection of expired gas whichwas made for five minutes, starting one minute after the cessation of pressurebreathing. In all the experiments at least two hours elapsed between thesubject's last meal and the start of the experiment. The volume of gas collectedin each bag was measured with a water gas meter and the composition of themixed expired gas determined by duplicate analyses by the Haldane technique.Results - Duplicate experiments were performed with each of the four sub-jects whilst pressure breathing with trunk counterpressure at positive pressuresof 6o and 8o mmHg. Four periods of pressure breathing at 30 mmHg withoutcounterpressure were studied in two subjects. The reco:'d of the inspiratoryminute volume obtained by means of the Tissot spirometer in each experi-ment was measured and the volume of air inspired in each minute togetherwith the corresponding number of breaths calculated. The mean values of thepulmonary ventilation in the experiments performed on each subject arepresented in Figs. 5-1, 5-2 and 5-3. In all the four sttbjec+t pressure breathingcaused an increase of pulmonary ventilation which was greatest in the firstminute of exposure. The respiratory frequency was only slightly increasedduring pressure breathing.
The pulmonary ventilation, oxygen consumption, carbon dioxide pro-duction and respiratory exchange ratio were calculated from the volume andcomposition of each collected sample or expired gas. The results of thesecalculations for each of the three conditions of pressure breathing investilhatcdare presented in Tables 5-1 to 5-3. The change of each parameter observedduring pressure breathing and the subsequent recovery period relative to thecorresponding control value has been calculated and the mean changes andthe corresponding standard errors for each of the environmental conditionsarc presented in Table 5-4. Pressure breathing without counterpressure at apositive pressure of 30 mrmHg caused a consistent increase of the pulmonaryventilation, oxygen consumption, carbon dioxide output and irespiratoryexchange ratio (Table 5-4). The increase of oxygen uptak'e was statisticallysignificant (o.oot < P < o.0o). Pressure breathing with trunk counter-pressure also induced an increase of pulmonary ventilation in all the subjects.There was, however, no consistent change of oxygen consumption and in thegroup as a whole pressure lrbcathing did not cause a significant alteration ofoxvgen uptake. The output of' carbon dioxide was howcvcr significantlyraised. "l'ht' icease1 o6 the carbon dioxide output without a concomitant
3est Available Copy

Ft; 5- Th efec of pr r ba Iiga
a~~~~~~ poitv brahigpesueOfV11111
. .
th pulmonar I * C
Ft; -2. rh.fic fpesr rahn
Fm(;. 5-3 The effect of pressure breathing ata positive breathing pressure of 3on mudigwithout respiratory counterrresssre upon
the puhnonary yentioation
165
t * fia. 5-: The effect of' pressure breathingat a positive breathitig pressure of•n mmHgwith trunk counterpressure upon the pul-
rnonary" ventilation
* .
.a
Fiot. 3-3 The effect of pressure breathingz ata positive breathing pressure of Bo> tunt-Igwith trunk counterpresstnre upon the pul-
monary ventilation
165
II

RAISED INTRAPULMONARY PRESSURE
change of oxygen consumption was reflected by tile rise of the respiratoryexchange ratio.The Distribution of Inspired Gas - Tle uniformity of tile di.,tribution ofthe inspired gas within the lungs was investigated at ground level by followingthe concentration of nitrogen in the expired gas when the inspired gas waschanged from air to oxygen. The subject was seated within the decompressionchamber and wore a pressure jerkin and the modified pressure helmet fittedwith a mouthpiece. The sampling needle valve of the I.undin Akesson nitro-gen meter was attached to the mouthpiece so that it lay 3 cm from the lips.Beyond the sampling valve of the nitrogen meter the mouthpiece was attachedto a small dead space valve box. The dead space of the apparatus to thesampling valve of the nitrogen meter amounted to 12 ml, whilst the totaldead space rebreathed on inspiration was 35 ml. A two-way tap was attacheddirectly to the inlet tube of the valve box. The remaining two arms of this tapwere connected by separate smooth-bore hoses (2.5 cm I.D.) to the exteriorof the decompression chamber. One tube allowed air to be inspired fromoutside the decompression chamber whilst the other hose was connected to aioo litre Douglas bag placed outside the decompression chamber. The latterwas filled with cylinder oxygen (,9.5",, oxygen) and before each experimentthe hose up to the two-way tap at the inlet of the valve box was thoroughlywashed through with oxygen. The outlet pipe of the valve box was connectedby smooth-bore hose to the Tissot spirometer which was placed outside thedecompression chamber. A two-way tap was placed outside the decom-pression chamber upstream of the spirometer so that the subject's expired gascould be directed either to the exterior or into the spirometer. In some of thepreliminary experiments a heated Fleisch flow meter was inserted in theexpiratory gas stream at the outlet of the valve box. The pressure differencecreated by expiratory flow was recorded by means of a capacitance pressuretransducer and an appropriate amplifier. The output of the nitrogen meterwas recorded on a direct ink writer. The amplification of the instrument wasincreased when the nitrogen concentration fell below 2o",, to give an in-creased sensitivity at the low nitrogen concentrations. The output of thenitrogen meter was calibrated against oxygen-nitrogen mixtures of knowncomposition before and after each experiment.
After a preliminary rest period of at least five minutes during which thesubject breathed air, the expired gas was directed into the spirometer andone minute later the inlet tap was turned during an expiration so that theinspired gas was changed to oxygen. The expired nitrogen concentration wasrecorded and the expired gas collected in the spirometer until the expirednitrogen concentration fell below .,",. The subject was then returned tobreathing air and at least ten minutes elapsed before a further experimentwas performed. Nitrogen washout curves were obtained in this manner withthe subject at rest and during the second and subsequent minutes of pressurebreathing. Positive breathing pressures of 3o and 6o mmHg were used whentrunk counterpressure was worn whilst a positive breathing pressure of 2ommHg was investigated when no counterpressure was used. In a short seriesof experiments the instantaneous nitrogen concentration and the expiratoryflow were recorded simultaneously on a bromide paper recorder duringoxygen breathing both at rest and during pressure breathing.
t66
------------~

PUL.MONARY GAS EXCHIANGE
Results - The experiments in which the nitrogen concentration andexpiratory flow were recorded simultaneously demonstrated that there wasa definit, plateau of nitrogen concentration in the later part of expirationunder all the conditions used in this investigation. The value of the nitrogenconcentration at the end of expiration was used in the subsequent analysisof the nitrogen washout curve. Since the output of the nitrogen meter wascalibrated with dry gas and the expired gas sampled by the meterhad a water vapour pressure of 47 mmHg a correction was applied to thevalues of nitrogen concentration measured from the output of the nitrogenmeter.
Inspection of the spirometer records showed that in the majority of theexperiments the tidal volume varied only slightly during the nitrogen washoutperiod. In sonic experiments, however, particularly during pressure breathingwithout counterpressure, there were fairly large fluctuations of tidal volume.The effect of these fluctuations of ventilation upon the end-expiratory nitro-gen concentration was minimized by plotting the end-expiratory nitrogenconcentration for each breath after the beginning of oxygen breathingagainst the cumulative expiratory volume. The mean tidal volume over theperiod of the nitrogen washout was then calculated and the values ofend-expiratory nitrogen concentration corresponding to breaths of constantvolume determined from the original curve. These corrected values of theend-expiratory nitrogen concentration were used in the detailed analysis ofthe nitrogen washout curve.
The results of each nitrogen washout were analyzed by plotting the loga-rithm of the corrected end-expiratory nitrogen concentration for a givenbreath against the number of breaths taken from the start of oxygen breathingusing semi-logarithmic paper. A typical curve obtained by this procedure ispresented in Fig. 5-4. Although the curve obtained was always alinear thelatter part of each curve approximated closely to a straight line. It waspossible, therefore, to analyze the nitrogen washout curve expressed in thismanner into its components. The straight line drawn through the latter partof' the original curve was extrapolated to breath zero (Fig. 5-4). The valuesof nitrogen concentration for each of the early breaths given by this extra-polated line were read from the graph and then subtracted from the corre-sponding values of the experimentally determined end-expiratory nitrogenconcentration. The values so obtained were then plotted on the semi-loga-rithmic paper against the corresponding breath number. In all the presentexperiments this plot came very close to a straight line. Each of the experi-mentally determined nitrogen washout curves was expressed in terms ofthese two derived comprnmnts representing a pair of compartments, one ofwhich was washed out more rapidly than the other. From this graphicalanalysis of the nitrogen washout curve the fraction of the total ventilationpassing to each compartment and the volume of the compartment werecalculated using the methods developed by Fowler, Cornish and Ketv (1952)(i 12) and Briscoe and Counand (1959) (47).
The fraction of the alveolar ventilation which was received by each of thecompartments was calculated firom the intercept of the corresponding semi-logarithmic plot on the nitrogen concentration axis at breath 0 according tothe equation:
167
| I t II I I
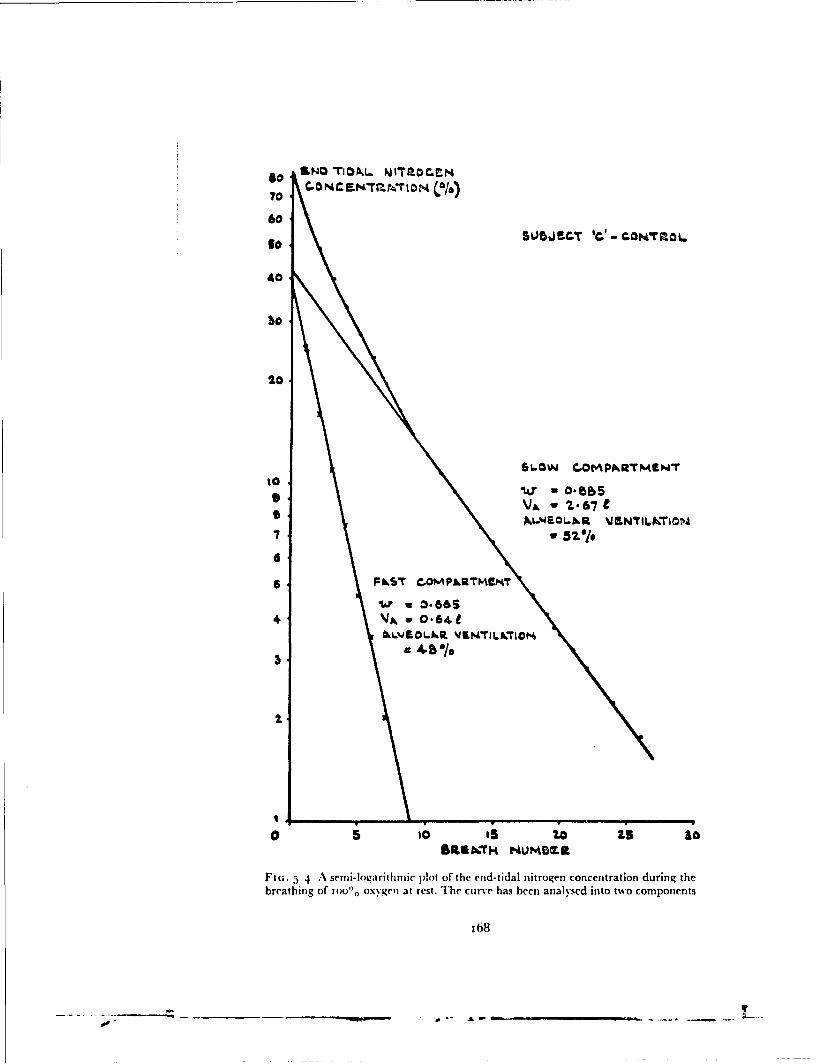
C-NC WAaO 5LS0BT 0)-c~r
40
60
40
SL-soLw .Cot~pklArmewl
V7 - 52- /7
4U a 0-66S
IXL'JOLkR JS~L~O
0 5 0, iS0 Z5 go
Fig;. 5~ 4 A semi-logarithmic plot of thc end-tidal nitrogen concentration during thebreathing of 10000. oxygewi at rest. The curve has been analysed into two components
168

PtUL,.MONARY GAS EXCHANGE
FAx _ AI
FAO VA
Where:F.4A Intercept of straight line representing compartment xFA. Intercept of original nitrogen washout curve (alveolar nitrogen
concentration before breathing oxygen).I'A, Alveolar ventilation per breath received by compartment xVA - Total alveolar ventiiation per breath.
The total alveolar ventilation per breath was obtained by subtracting theanatomical dead space from the mean tidal volume. The appropriate valuesof the anatomical dead space for the subjects and conditions used in thisinvestigation were obtained separately using Fowler's method (1948). Itwas possible with this information to calculate the actual ventilation perbreath received by each compartnment of the alveolar volume.
The alveolar dilution ratio for each compartment of the lung volume,which was an expression of the relation between the volume of the compart-ment and the ventilation it received per breath, was calculated from the slopeof the straight line which represented the compartment in the graphicalanalysis of the nitrogen clearance curve. The alveolar dilution ratio whichwas defined as:
_ VxOX
VX + VI•was related to (ie slope of the straight line by the expression:
mX -- log1091) Co log- 1 ) 17T
Where:
w, Alveolar dilution ratio of compartment x'x =Volume of compartnient x
VAX = Ventilation per breath received by compartment xMX - Slope of semilogarithmic plot representing compartment x
From the value of the alveolar dilution ratio and the corresponding valueof the actual ventilation received by the compartment the volume of thecompartment was calculated. The sums of the volumes of the two separatecompartments gave the functional residual capacity.
Two nitrogen washout curves were obtained during rest for each of tilethree subjects used in this part of the investigation. The values of the func-tional residual capacity, the alveolar dilution ratio, the volume and thefractional ventilation of the fast and slow compartments of the lungs obtainedfrom the analyses of these curves are presented in Table 5-5. Duplicateexperiments were performed during pressure breathing on each subject andthe results of the analyses of these curves are also given in Table 5-5. Pressurebreathing at 30 and 6o mmHg with trunk counterpressure produced a smallincrease in the functional residual capacity and the volumes of both com-partments were also slightly increased. There was no change in the distribu-tion of the alveolar ventilation between the two compartments. Pressurebreathing at 2o mming without counterpressure induced a much greaterincrease in the functional residual capacity. This was accompanied by
169
7 -- • I- -I I -I-I I-I -
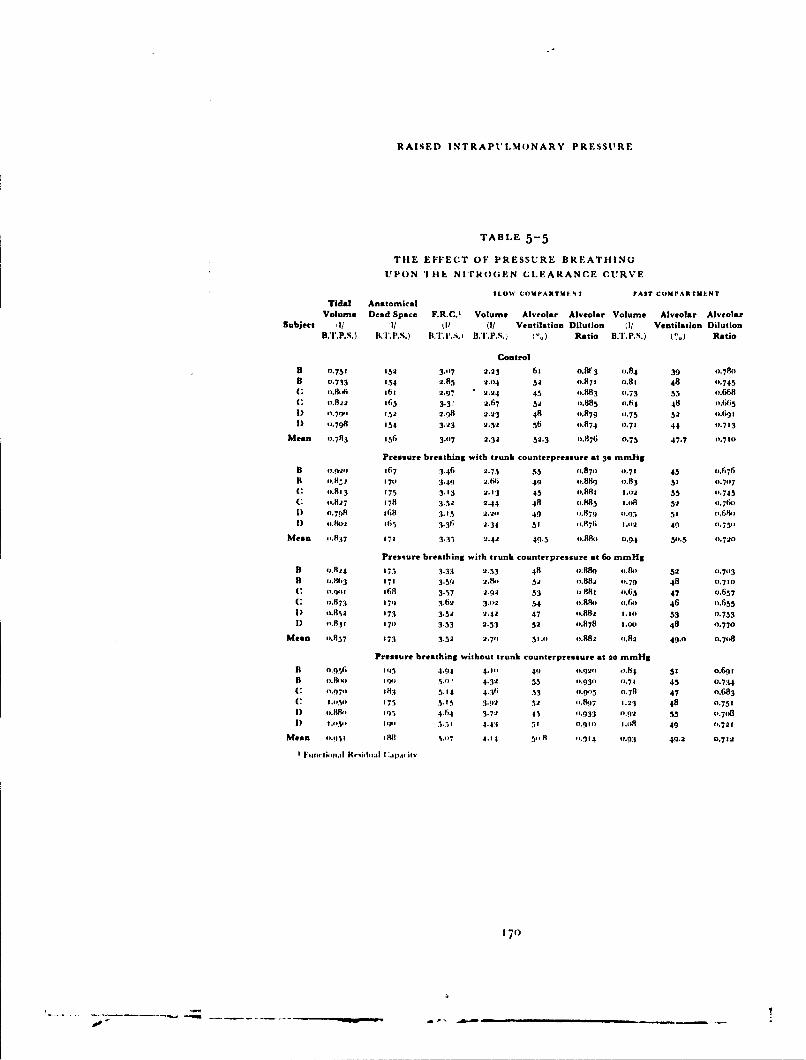
RAISED INTRAPULMONARY PRESSURE
TABLE 5-5
TIlE EFFECT OF PRESSURE BREATHING
UPON 'IHh NI'rROGEN CLEARANCE CURVE
SLOW COM PARTTM'NT FAST COMPARTMUNT
Tidal AnatomicalVolume Dead Space F.R.C.1 Volume Alveolar Alveolar Volume Alveolar Alveolar
Subject il/ 1/ I( (I/ Ventilation Dilution (1/ Ventilation Dilution
B.T.P.S.) B.T.PP.S.) B.T.. .p.s. I.") Ratio BIP..) PS. ) Ratio
ControlB (.753 152 3.-07 2.23 61 0.813 0.84 39 o.78o
B 0.733 134 2.85 2.04 32 0.87 0.81 48 0.745
I: t.8A :61 2.97 " 2.24 45 0.883 0.73 53 o.6681 o.82 1563 3.3: 2.67 32 o.885 0.64 48 (1.665
I) 0.7fI 132 2.q8 2.23 48 0.879 0.75 52 o.691.
I) 31.798 154 3.23 2.32 56 0,874 -.71 44 fo 713
Mean 1.783 156 3.-7 2.32 32.3 0.876 0.75 47.7 0,710
Pressure breathing with trunk counterpressure at 30 mm1-igB 0.02.1 367 3.46 2.75 33 0.870 0.71 45 0.676
B 31.8
Z 170 3.49 2.641 49 o.889 1.83 51 0.707
C 31.813 175 3.13 2.13 45 1.881 1.02 55 0.743C "-.827 178 3.52 2.44 48 (.885 Ij.18 52 -.76)
I) 1.798 368 3.13 2.20 49 -1.879 t.9)3 31 ,68P
I) 3.802 16
. 3.36; 2-34 51 41.87; 1.,02 41) 0.750
Mean -.1837 171 3.3.3 2.42 49.3 o.88 o 0.94 310.5 0.720
Pressure breathing with trunk counterpressure at 6o mmHg
B 0.824 173 3.33 2.33 48 4).889 o4.&)1 52 o1-7113
B 4'.8W3 171 3.59 2.11t 532 4.882 0.79 48 o,7to
* o.qo, t68 3.37 2.92 53 11.881 o.63 47 0.637C 0.873 371 3.62 3.02 34 4).8R&) o.6 46 o.635
I) ').8%2 173 3.32 2.42 47 f'.882 3.31) 53 0.753
D 011.8
3 170 3.33 2.53 32 0.878 .00) 48 0.770
Mean 0.837 373 3.52 2.71) 51.1) f'.88e2 '.82 49.0 0.708
Pressure breathing without trunk counterpressure at 20 mmHg
B o.9q,,6 I5 4.94 4.-81 49 4.920 1..86 5! o.6q
B (,.&x,,1 Igo31 j.", 4-32 55 31.9311 1-71 45 0.734( 0 I.97o 183 5.14 4.31i 33 0.81Y3 01.78 47 0.683(1 I.1,31 373 5.15 3912 52 -.8N7 1.23 48 0.731
I) 31.88, 395 4-64 3.72 43 (1.933 (1.92 535 0.78
I) 1.11311 11,0 3.33 4.43 51 3.911 1.138 49 0.721
Mean 3,.1I)3 in a .17 4.1t r'1.8 -.. 14 0.93 49.2 0.712
170

PULMONARY GAS EXCIIANGE
proportional increases in both the fast and slow compartments of the lungvolume.Respiratory Dead Space - Anatomical and physiological dead spaces weremeasured virtually simultaneously during rest and pressure breathing atground level. The anatomical dead space waas measured by following theconcentration of nitrogen in the inspired gas following a single breath ofoxygen using the technique described in Chapter 3. The physiological deadspace was determined from the carbon dioxide tensions of samples of theexpired gas and the arterial blood collected siniul~aneously.
The experiments were performed within the decompression chamber. Themodified pressure helmet fitted with a mouthpiece was used. The samplingneedle of the Lundin nitrogen meter was fitted directly into the mouthpiece,the distal end of which was connected to a valve box of minimal dead space.The dead space of the apparatus was equal to that of the apparatus used inthe previous stud)'. Two hoses led from tile exterior of the decompressionchamber to a two-way tap which was connected directly to the inlet of tilevalve box. Whilst the subject breathed air through one of the inlet hoses theother hose was connected to a 6 litre bell spirometer placed outside thedecompression chamber. This spirometer was positioned so that the subjectcould clearly see the movements of the pen on the recording paper. Beforeeach experiment the spirometer and the hose to the two-way tap were purgedwith oxygen and the spirometer was filled with this gas before each determi-nation of the anatomical dead space. The outlet of the valve box was con-nected to the exterior of the decompression chamber where the expired gascould be collected in a Douglas bag. A heated Fleisch flowmeter was placedin the expiratory gas stream directly beyond the outlet of' the valve box.The amplified output of the capacitance pressure transducer measuring thepressure difference created across the flow meter by expiratory flow and theoutput of the nitrogen meter were fed on to the galvanometers of a bromidepaper recorder. The flow meter record was calibrated before and after eachexperiment using a standard rotameter. The output of the nitrogen meter wascalibrated at the same time using mixtures of oxygen and nitrogen of knowncomposition. The delay and the response times of the nitrogen meter to asquare wave change of composition of gas at the needle valve were alsodetermined before and after each experiment.
When the subject had donned the pressure jerkin and pressure helmet aRiley needle was introduced into a brachial artery under local analgesia.The patency of the needle was maintained by passing through it a slow in-fusion of physiological saline to which heparin had been added. After a pre-liminary rest period of at least ten minutes a timed three minute collection ofexpired gas was made with the subject breathing air. The number of expira-tions collected in the Douglas bag was counted. During the middle twominutes of this period a 2o nil sample of arterial blood was withdrawn at astead), rate. When the measurement was made during pressure breathing theduration of tile expired gas collection, which was started during the secondminute of the exposure, was reduced to two minutes. The sampling of arterialblood was perfbrmed over the middle ninety seconds of this two minuteperiod. After the completion of each expired gas collection the anatomicaldead space was measured immediately employing the technique described in
171
- A~ W"~"" "~ -. ~---* - - -----

RAISED INTRAPULMONARY PRESSURE
Chapter 3. The volume of expired gas collected was measured by means of awet gas meter and the carbon dioxide concentration in the expired gas wasdetermined in the Haldane apparatus. The carbon dioxide tension of thearterial blood wa,. determined by the Astrup (1957 (iQ) technique.Results - Measurements of dead space were carried out at rest and duringpressure breathing without counterpressure at a positive pressure of 20
mmHg and with counterpressure at positive pressures of 30 and Go mmHgin three subjects. Duplicate determinations were made at rest and at eachlevel of pressure breathing. The mean tidal volume was calculatedfrom the volume of expired gas collected in the Douglas bag. The physio-logical dead space was determined using the Bohr equation, assuming thatthe arterial carbon dioxide tension represented the "effective" alveolarcarbon dioxide tension:
V~D FAco2 - FEco2 VFAc'o2
Where:
VD = Physiological dead spaceVr = Mean tidal volume
FACO 2 -- lean fractional concentration ofcarbon dioxide in alveolar gas.FEC0 2 Mean fractional concentration ofcarbon dioxide in the expired
gas.
The true physiological dead space was obtained by subtracting the instru-mental dead space from the value obtained by this calculation.
The results of these calculations are presented in Table 5--6. The physiolo-gical dead space was consistently greater than the anatomical dead spaceboth at rest and during pressure breathing. Both anatomical and physiologi-cal dead spaces were increased by pressure breathing. The increase of thephysiological dead space was consistently greater than that of the anatomicaldead space.Alve.,_Ar Gas Tension - Two techniques were used to investigate the effectof pressure breathing upon the alveolar gas tensions. Intermittent sampling ofthe alveolar gas by the Haldane-Priestley technique was used extensively inthis study. A limited series of experiments was carried out using a rapidresponse carbon dioxide analyser to measure the end-tidal carbon dioxideconcentration and the effect upon it of pressure breathing.
Sampling of the alveolar gas by the Haldane-Priestley technique was per-formed in the decompression chamber. The subject wore the modifiedpressure helmet fitted with a mouthpiece. The mouthpiece was connecteddirectly to a two-way tap which was attached to the external surface of thehelmet. The arm of the tap whkch was in direct line with the lumen of themouthpiece was connected by smooth-bore horse (I.D. 2.5 cm) to the ex-terior of the decon.pression chamber. A lateral tapping (3 mm I.D.) wasfitted in this tube directly beyond the tap. A previously evacuated loo mlgas sa4mpling tube was attached to this tapping by a short length of rubbertubing. A valve box was connected to the second arm of the tap attached to themouthpiece of the pressure helmet. The inlet and outlet of the valve box wereconnected to the exterior of the decompression chamber by smnooth-bore hoses.
172
""-- !

PULMONARY GAS EXCIIANGE
TABLE 5-6
THIE VOLUMES 01: TIlE ANATOMICAL AND PIIYSIOLOGICAL
DEAD SPACE
Tidal Art. CO 2 Dead Space Volume (mlSubject Volume tension B.T.P.S.)
(ml B.T.P.S.) (mmHg) Anatomical Physiological
A. Control
A 650 41.5 158 221
A 690 40.0 o 6o 195D 690 39.5 165 174D 654 42.0 16q 217
C 612 41.2 148 21n
C 630 40.0 159 '71
Mean 654 40.7 t6o 201
B. Pressure breathing at 20 mmHg without counterpressure
A 674 39.5 199 305A 747 38.0 201 3501) 846 39.5 189 280
D 928 37.5 I88 250
D 796 38.0 176 290
C 685 40.5 190 230
Mean 779 38.8 191 284
C. Pressure breathing at 30 mmHg with trunk counterpressure
A 720 39.2 N70 280
A 658 40.2 173 3331) 697 39.5 161 236D 645 38.0 175 283C 778 38.0 178 348C 870 37.0 161 248
Mean 728 38.7 170 288
D. Pressure breathing at 6o mmHg with trunk counterpressure
A 747 38.0 167 397A 740 37-5 180 290
1) 86o 38.5 176 3391) 894 38.6 164 356C 849 37.6 175 276C 788 39.0 178 334
Mean 813 38.2 173 332
173
w i u I ! I I I I I I

RAISED INTRAI'UTIMONARY PRESSURE
The tap attached to the helmet was normally positioned so that the subjectbre'thed through the valve box. When an alveolar gas sample was requiredthe subject turned this tap at the end of a normal expiration and performeda rapid deep expiration. He then immediately returned the tap to its originalposition and resumed a normal breathing pattern. A sample of the alveolargas trapped beyond the tap was taken rapidly into the evacuated samplingtube which had been previously connected to the side tapping. When thesampling tube had been replaced by another evacuated tube a further alveo-lar sample could be obtained. Normally at least one minute elapsed betweenthe taking of samples. The concentrations of carbon dioxide and oxygen inthe alveolar samples were determined in the Haldane apparatus.
The concentration of carbon dioxide in the respired gases was followedcontinuously by means of a rapid response infra-red analyzer. The measuringhead of a Liston Becker Model 16 carbon dioxide analyzer fitted with abreathe-through cell was supported from the roof of the decompressionchamber. It was attached directly to the mouthpiece of the modified pressurehelmet. The volume of the system from the mouthpiece to the infra-redradiation pathway in the analyzer was 30 ml. The other end of the breathe-through cell of the analyzer was connected directly to a simple valve box, theinlet and outlet of which % erc connected to the exterior of the decompressionchamber by smooth-bore hoses. The output of the carbon dioxide analyzerwas fed on to a direct writing recorder. The carbon dioxide concentration inthe respired gas was measured continuously, before, during and after pressurebreathing at various levels. The output of the carbon dioxide analyzer wascalibrated before and after each experiment with mixtures of carbon dioxidein air of known composition.
Discrete sampling of the alveolar gas and continuous recording of therespired carbon dioxide concentration were performed at rest, duringpressure breathing at a positive pressure of 30 mmHg without respiratorycounterpressure and during pressure breathing with trunk counterpressureat 50 and 8o mmHg. Four subjects, each ef whom had had previous experi-ence of pressure breathing, were studied.Results - The individual values obtained for the carbon dioxide and oxygentensions in the alveolar gas samples obtained in this study are presented inFigs. 5-5, 5-6 and 5-7. The alveolar carbon dioxide tension was markedlyreduced by pressure breathing at a positive pressure of 30 mmHg withoutcounterpressure and there was a corresponding increase of the alveolaroxygen tension. When trunk counterpressure was employed the changes werein the same direction but of lesser degree.
Continuous records of the respired carbon dioxide concentration weremade in duplicated experiments in which each subject was exposed to thesame conditions under which the Haldane-Priestley samples were obtained.The end tidal carbon dioxide tension was measured from each record. dOrm-parison of the results of these measurements with the corresponding val-les ofalveolar carbon dioxide obtained by Haldane-Priestley sampling show thatthere was close agreement between the two sets of results. Curves showing themean time course of the alveolar tensions of carbon dioxide and oxygen havebeen constructed from the results obtained for all four subjects under thevarious conditions studied (Fig. 5-8).
174

40 4*~400 0A,
b.0.40
I€. L 4 •o
T,..lL ,
Fi. The efect of pressure breathingat a positive breathing pressure of 30nitnHg at ground level without respira- %$tory counterpressure uponl the alveolar
oxygen and carbon, diovide tensions
,. c.i¶ . M ,.
Fln. 5-6 The effect of pressure breathinga • at a positive breathing p)ressure of 50mmHg with trunk counterpressure upom
the alveolar oxygen and carbon dioxidetensions
I~o.
Ft, 5 7 T'he effect of pressure breathingat a positive breathing pressure of 90nmrllg at ground level with trunkcoutterpressure upon the alveolar oxygen
and carbon dioxide tensions
175

is* I~ PAO, bftwmar.I5 . u. . to utl 5. 93.
XT 60 Im-m.g45
Alf So 1i. S
tic
too
40.
10 IP
I.n
a 1.4 6 ''time (MIN,.)
Fi(;. 5-8 The menan values of the alv'eolar gas tnsions obtained before, durhig andafter pressure breathing at 30 mmHg with nto counterpressure and at 5o and 8o minHg
with trunk counterprr'ssure
176
-.- -- - , |__ _ _ _ _ _
PULMONARY GAS EXCHANGE
Diffusing Capacity of the Lungs - The effect of pressure breathing uponthe exchange of gases between the alveolar space and the pulmonary capillaryblood was investigated by measuring the diffusing capacity. This was esti-mated for carbon monoxide using the modified breath holding techniquedeveloped by Forster, Fowler, Bates and Van Lingen 1954 (1o9). Theapparent diffusing capacity was measured at different levels of alveolaroxygen tension so that the diffusing capacity could be analyzed into itscomponents (25k-).
The apparatus (Fig. 5H)) which was mounted in the decompressionchamber consisted of two rubber bags, one of"8 litres and the other of 6 litrescapacity, sealed within a metal box. Each bag was connected through thewall of the box to one arm of a two-way tap. The pair of two-way taps wereconnected together and to a third two-way tap in such a manner that thelumen of the third tap could be connected to either of the bags in turn (thesmaller bag was closer to the third tap than the larger bag) or directlythrough the lumens of the two taps. One arm of the third tap ("helmet" tap)was connected to the mouthpiece of the modified pressure helmet. A simplevalve box was attached to the third arm of the helmet tap. The inlet andoutlet of the valve box were connected to the exterior of the decompressionchamber by a pair of smooth-bore hos,:s. The other end of the taps attachedto the bags within the box was connected by smooth-bore hose (2.5 cm 1.1).)to a spirometer placed inmmcdiately' outside the decompression chamber.This hose was also connected to the interior of the box containing the bags.The spirorneter which had a lightweight bell, was fitted with a high speedkymograph which gave a recording paper speed of i cmisec. An electrictime clock and kymograph marker were used to mark one second intervalson the kymograph record.
In order to prepare the apparatus for the determination of the diffusingcapacity, both the bags within the box were emptied. The larger bag was thenfilled with the gas mixture to be inspired. Two gas mixtures were used for thispurpose, both mixtures containing about o.25',, carbon monoxide and io",,helium. In one mixture the only other gas was oxygen, whilst in the otheroxygen and nitrogen were added to give an cxygen concentration of about21",,. Each mixture was made tip before the start ofan experiment in a Tiissotspitotneter and stored in a l)ouglas bag. The composition of each of theinspired mixtures was determined immediately before the actual measure-ment of the diffusing capacity.
The subject, wearing a pressure jerkin, was seated before the apparatus inthe decompression chamber arid the helmet fitted with the mouthpiece wasdonned. Prior to the donning procedure the helmet tap was turned so that themouthpiece was connected to the valve box. After a five-minute rest periodduring which the subject breathed either air or oxygen through the mouth-piece, the kvmograph was started arid the subject instructed to perform amaximutm expiration arid then hold his breath, Whilst the subject held hisbreath the helmet tap and the tap attached to the bag filled with the mixtureto be inspired were opened so that the bag communicated with the mouth-piece. The subject made a maximum inspiration without excessive effort andthen maintained the fully inflated position with his glottis open fbr tenseconds, l)uring this period the tap attached to the inspirate bag was closed so
177
I

¶$ksL OF OSCOMPALS5tOK
UNIOi~cts-Toi4AIL. %JbLES
PIiiSUR!E HELMEiT
BELLO~C MOUTI.MPiIC.
FI'l; 5 9 TUhc apparatuis used for the determination of the diffusing c~apacity duringpressure breathing
178
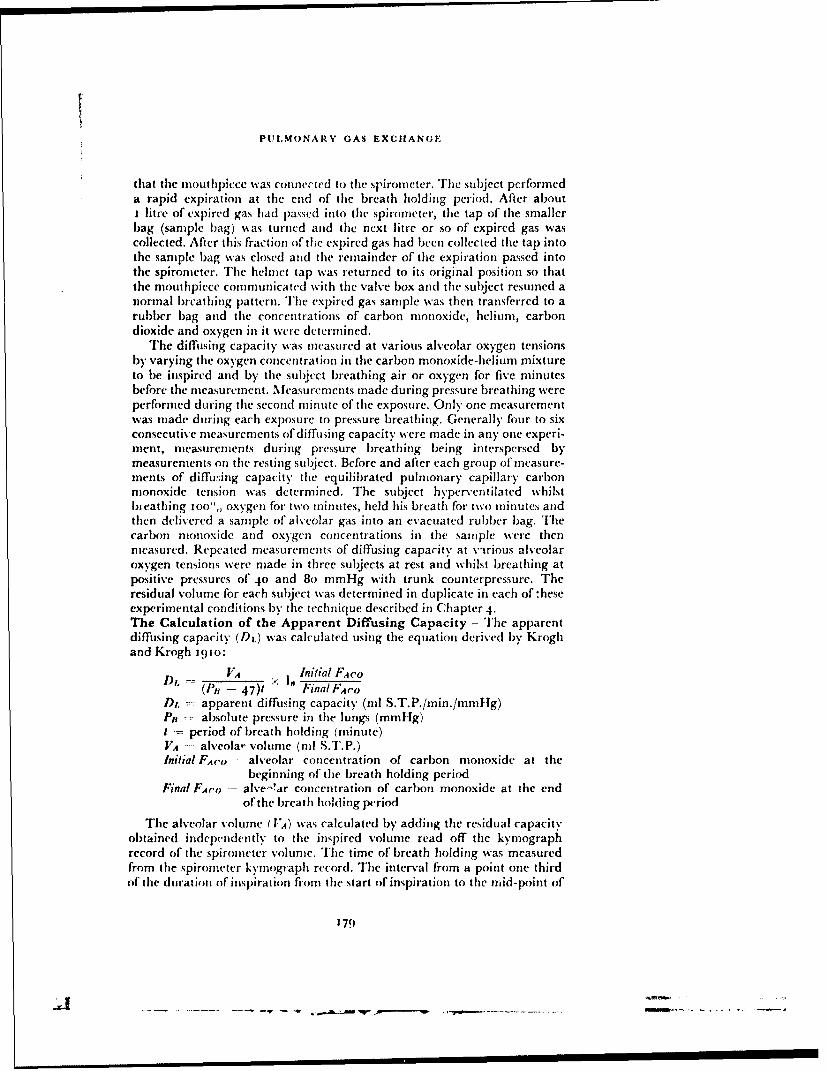
IPULMONARY GAS EXCIIANGE
that tile mouthpiece was connected to the spirometer. The subject performeda rapid expiration at the end of the breath holding period. After abouti litre of expired gas had passed into the spirometer, the tap of the smallerbag (sample bag) was turned and the next litre or so of expired gas wascollected. After this firaction of the expired gas had been collected the tap intothe sample bag was closed and the remainder of the expiration passed intothe spirometer. The helhet tap was returned to its original position so thatthe mouthpiece communicated with the valve box and the subject resumed anormal breathing pattern. The expired gas sample was then transferred to arubber bag and the concentrations of carbon monoxide, helium, carbondioxide and oxygen in it were determined.
The diffusing capacity was measured at various alveolar oxygen tensionsby varying the oxygen concentration in the carbon monoxide-helium mixtureto be inspired and by the subject breathing air or oxygen for five minutesbefore the measurement. Measurements made during pressure breathing wereperformed during the second minute of the exposure. Only one measurementwas made during each exposure to pressure breathing. Generally four to sixconsecutive measurements of diffusing capacity were made in any one experi-ment, measurements during pressure breathing being interspersed bymeasurements on tihe resting subject. Before and after each group of measure-ments of diffu;ing capacity the equilibrated pulmonary capillary carbonmonoxide tension was determined. The subject hyperventilated whilstbieathing too",, oxygen for two minutes, held his breath for two minutes andthen delivered a sample of alveolar gas into an evacuated rubber bag. Thecarbon monoxide and oxygen concentrations in the sample were thenmeasured. Repeated measurements of diffusing capacity at various alveolaroxygen tensions were made in three subjects at rest and whilst breathing atpositive pressures of 4V and 8o mmHg with trunk counterpressure. Theresidual volume for each subject was determined in duplicate in each of:heseexperimental conditions by the technique described in Chapter 4.The Calculation of the Apparent Diffusing Capacity - The apparentdiffusing capacity (Dl,) was calculated using the equation derived by Kroghand Krogh 191o:
DL ( VAI Initial F4 co(P" -- 47)P Final FA o
DL- apparent diffusing capacity (nil S.T.P./min./mmHg)pit• absolute pressure in the lungs (mmHg)I - period of breath holding (minute)VA ý- alveolar volume (ml S.T.P.)Initial FAco alveolar concentration of carbon monoxide at the
beginning of the breath holding periodFinal FAo- alve-'!ar concentration of carbon monoxide at the end
of the breath holding period
The alveolar volume (VA) was calculated by adding the residual capacityobtained independently to the inspired volume read off the kyrmographrecord of the spirometer volunie. The time of breath holding was measuredfrom tile spirometer kymogiaph record. The interval from a point one thirdof the duration of inspiration from the start of inspiration to the mid-point of
1 79
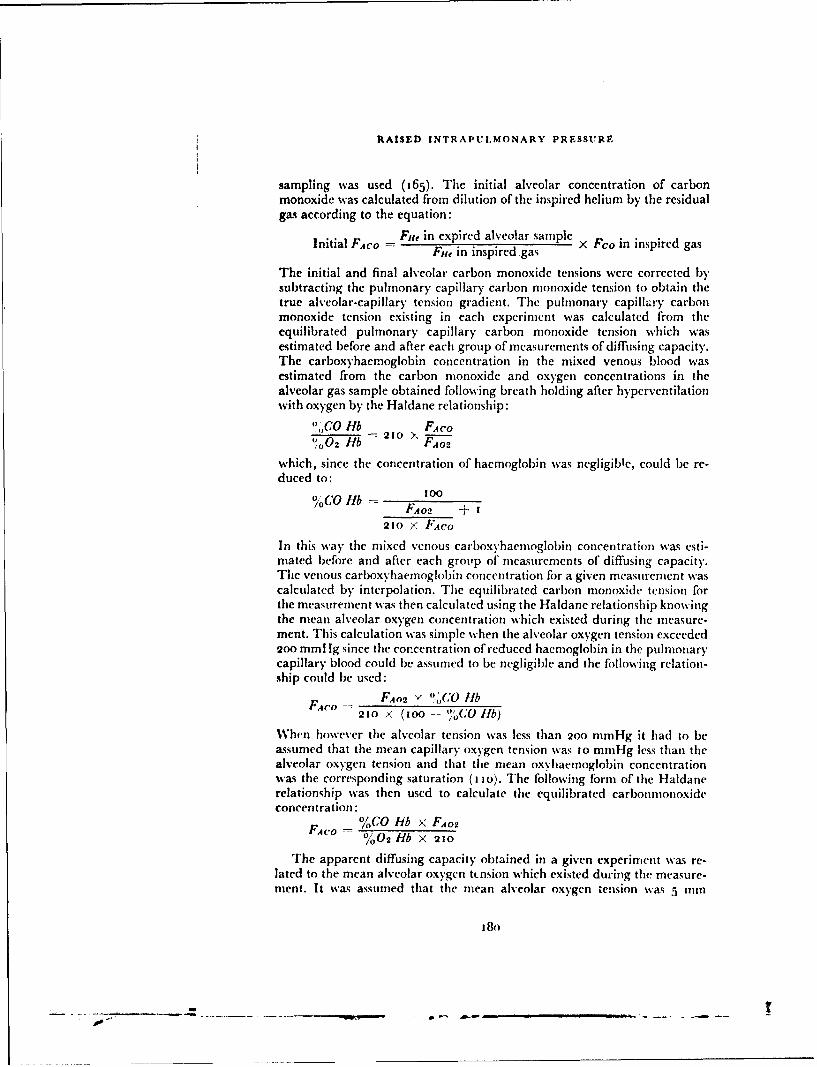
RAISED INTRAPULMONARY PRESSURE
sampling was used (165). The initial alveolar concentration of carbonmonoxide was calculated from dilution of the inspired helium by the residualgas according to the equation:
Initial FAco = Fu, in expired alveolar sample x c in inspired gasFne in inspired gas
The initial and final alveolar carbon monoxide tensions were corrected bysubtracting the pulmonary capillary carbon monoxide tension to obtain thetrue alveolar-capillary tension gradient. The pulmonary capillary carbonmonoxide tension existing in each experiment was calculated frtom theequilibrated pulmonary capillary carbon monoxide tension which wasestimated before and after each group of measurements of diffusing capacity.The carboxyhaemoglobin concentration in the mixed venous blood wasestimated from the carbon monoxide and oxygen concentrations in thealveolar gas sample obtained following breath holding after hyperventilationwith oxygen by the Haldane relationship:
,,,',CO Hib FA co) 002 Hb 20 FA2
which, since the concentration of haemoglobin was negligibl!e, could be re-duced to:
%CO Hb -- 100FA.o2 + 1
210 X FAco
In this way the mixed venous carboxyhaemoglobin concentration was esti-mated before and after each groop of' measurements of diffusing capacity.The venous carboxyhaemoglobin concentration for a given measurement wascalculated by interpolation. The equilibrated carbon monoxide tension forthe measurement was then calculated using the Haldane relationship knowingthe mean alveolar oxygen concentration which existed during the measure-ment. This calculation was simple when the alveolar oxygen tension exceeded200 mmHg since the corcentration of reduced haemoglobin in the pulmonarycapillary blood could be assumed to be negligible and the following relation-ship could be used:
FAFAo. ' OnoCO 1Ib210 X (too -- 'C/0 fib)
When however the alveolar tension was less than 2oo mmHg it had to beassumed that the mean capillary oxygen tension was io mmHg less than thealveolar oxygen tension and that the mean oxyvhaemoglobin concentrationwas the corresponding saturation (i to). The following form of the Haldanerelationship was then used to calculate the equilibrated carbonmonoxideconcentration:
FACo = X C.0 fib X FAo2
/00 02Hb X 210
The apparent diffusing capacity obtained in a given experiment was re-lated to the mean alveolar oxygen ttnsion which existed during the measure-ment. It was assumed that the mean alveolar oxygen tension was 5 inn
I 8o

PULMONARY GAS EXCH1ANGE
greater than the value measured at the end of the breath-holding period sinccin the resting subject the alveolar oxygen tension falls about 1o mml-Igduring a ten second breath hold.Results - The values of the apparent diffusing capacity obtained under thevarious experimental conditions used in this study are present in Table 5-7 inrelation to the corresponding mean alveolar oxygen tension. In each experi-mental condition the diffusing capacity fell as the alveolar oxygen tension wasincreased. Pressure breathing reduced the diffusing capacity at all alveolaroxygen tensions. For each subject in each experimental condition the relation-ship between the apparent diffusing capacity and the mean alveolar oxygentension was used in order to analyse the apparent diffusing capacity into itstwo components, the diffusing capacity of the pulmonary membrane itself(Dji, ml S.'.LP./niin./mrnHg) and the rate of uptake of carbon monoxide bythe blood in the pulmonary capillaries exposed to the alveolar gas. Thisanalysis was based upon the equation developed by Roughton and Forster1957 (254):
I I I
DL D '8.. 6c
Dto ( the apparent diffusing capacity nil S.T.P.imin.immHg)Air= diffusing capacity of the pulmonary membrane (ml S.T.P./
min./mmHg)0 rate of uptake of carbon monoxide (nil S.T.P./inin.) by unit vol-
ume of blood (nil) per unit of carblon monoxide tension(mml1g)
VC ==average volume of blood in pulmonary capillaries (ml)
The value of 6 depends upon the pulmonary capillary oxygen tension;as the oxygen tension increases the value of 0 decreases because of the corn-pet;,on ofoxygen with carbon monoxide for haemoglobin. In order to obtaintile correct value of 0 for each measurement of the diffusing capacity themean capillary oxygen tension was calculated. This quantity was obtainedby subtracting the mean alveolar gas to capillary oxygen tension differencefrom the average alveolar oxygen tension during breath holding. The averagedifference was calculated by dividing an assumed oxygen consumption by theapparent diffusing capacity for oxygen using the relationship:
DL for oxygen 1--- .23 X DL for carbon monoxide
The value of 6 corresponding to the calculated mean capillary oxygentension was obtained from the data of Roughton and Forster (1957) (254)using a value of the ratio of membrane permeability to that of tihe interior ofthe corpuscle of 2.5. It was assumed that the blood of all the subjects had a
carbon monoxide-carrying capacity of 20 ml per 1oo ml of blood. The values
of 1 were calculated fromn the rclationshin:
- .72 -- 0.0057 Pcn,
where P(o 2 is the mean capillary oxygen tension.For each individual series of measurements of diffusing capacity the values
181
=1 -.! ! -. II -- ______! __I I I _ I _ ! __

RAISED INTRAPULMONARY PRESSURE
TABLE 5-7
THE EFFECT OF PRESSURE BREATHING
UPON THE APPARENT DIFFUSING CAPACITY
Condition Control Pressure breathing Pressure breathingat 40 mmHg at so mmHg
Mean alveolar Diffusing Mean alveolar Diffusing Mean alveolar DiffusingSubject ozygen tension capacity oxygen tension capacity oxygen tension capacity
(mmHg) (ml/min.1 (mmHw) (rnl/min.I (mmHg) (ml/min./mmHg) mmHe) mmHg)
1O8 32.8 1o5 29.1 io04 24.4
313 33.1 330 26.o 125 23.7B A28 26.8 256 21.5 232 16.7
433 39.6 205 13.6 390) 14.1
522 18.4 252 14.0 4(0) 11.2563 17.1 530 14.2 530 11.4
o19 33.3 306 26.5 3I4 23.4321 29.6 323 27.4 163 22.5
C 260 25.1 221 21.1 220 18.4
275 23.8 335 19.3 41 135.4285 18.6 440 15.i 473 13315311 19.2 5312 149 5413 13.7
307 29.6 98 21.6 I.,1 25.3153 28.6 313 22.2 162 20.7
D I016 24.7 215 211.2 233 1%.6355 19.2 349 135.1 3x) 14.2472 I8.[ 426 14.8 435 13.4538 15.6 482 12.9 543 33.5
TABLE 5-8
TilE EFFECT OF PRESSURE BREATHING
UPON TIlE DIFFUSING CAPACITY OF THE PULMONARY MEMBRANE
AND THE PULMONARY CAPILLARY BLOOD VOLUME
Diffusing capacity of Pulmonary capillary Mean alveolar volumeSubject pulmonary membrane blood volume during breath hold
(mllmin./mmnit2) trol (litre II.T.P.S.)
Control
B 6n.6 94.2 6.o5C 52.0 1w4.6 5.731) 52.6 89.5 5,-13
Mean 55.0 q6.1 5.88
Pressure breathing at 40 mmHgB 66.o 65.n 6.47C 3,5.3 70.3 5.93D 4 1.2 62-3 6.23
Mean 56.4 65.c 6.23
Pressure breathing at go mmHgB 5V.3 543,5 6.61C Y.13 62.2 6.22D M5.1 33.3 6.33
Mean 54.8 55.4 6.3
182

PUIL'iM)ONARY GAS EXCHIAN(;GE
of the reciprocals of the apparent diffusing capacity were plotted against tile
corresponding calculated values of- In each of the various series of expcri-
mental results the points thus plotted lay close to a straight line (Fig. 5-to).A straight line was fitted to each group of points by the mcthod of least squares
with !as the independent variable. The value of the intercept of this line on
the , axis and its slope were measured. The reciprocal of the I interceptDt. DL
gave the diffihsing capacity of the pulmonary membrane whilst the reciprocalof the slope of the line was the mean pulmonary capillary blood volume.
The results of thiz resolution of the apparent diffusing capacity into itscomponents are presented in Table 5-8. Whilst pressure breathing caused nosigiiificant change in the diffusing capacity of the pulmonary membranethere was a progressive reduction in the pulmonary capillary blood volumeas the positive breathing pressure was increased.
PIRESSUta. BREATHING AT RED1'CED BAROMETRIC PRESSURE
Pulmonary Ventilation - A limited series of measurements of pulmonaryventilation were made during pressure breathing at reduced barometricpressujre in the decompression chamber by recording the inspiratory flow.The subject wore a pressure jerkin and the modified pressure helmet fittedwith a mouthpiece. A standard inlet non-return and compensated outlet valvesystem was connected directly to the mouthpiece. The outlet of a pressuredemand regulator ý.Nlark 20; was connected to the inlet tube of the mouth-piece, the face compartment of the pressure helmet and the bladder of tilepressure jerkin. A Fleisch flowmeter was fitted directly upstream of the inletvalve of the mouthpiece and the pressure difference created across it byinspiratory flow was recorded on a galvanometer recorder by means of aca,',citance transducer and an appropriate amplifier. The pressure in themouthpiece was measured by means of a mercury manometer placed withinthe decompression chamibr. After a preliminary ascent to a pressure altitudeof 25000 ft where a two minute record of the resting inspiratory flow wastaken, the subiect was decompressed in two seconds to a simulated altitude of56000 ft. The demand regulator automatically delivered a positive breathingpres%'re of8o mmHg at 56000 ft. This pressure-altitude was maintained for twominutes and Ibllowed by immediate descent. The flow record wa.s calibratedwith a standard rotaneter at ground level before and after each experiment.Results - Each of the four subjects was decompressed to a pressure altitudeof cf6orO ft on two separate occasions. The positive breathing pressuremeasured at the mouthpiece at the final altitude was 80 mmHg. The volumeof each breath was determined by the planimetric integration of the inspira-"tory flow record The in~piratory minute volume was calculated for eachminute of the rest and pressure breathing periods. These results are presentedin Table 5 -). There was some variability in the response from one subject toanother, although the ventilation was always increased following decom-pression. The mecan increase of pulmonary ventilation during the two minuteperiod of pressure breathing as compared with the corresponding controlperiod was 3.89 litre standard error .0.22).
183
. . .. -.. . . . .-- .- .' .w w' -.- - - - -l | l l l l

0,07
0 .01
0.06
• .o4.taL / / +~~us.tcrq 6
0*01 * " PRSISU.tL
AT tO rmtn. Ms.
0. O .t
0.01
;elFin;. 5- to The relationship between the reciprocal of the apparent diffusing capacity
and ; in subject B at rest and whilst pressure breathing at 8o mmHg with trunk
eounterpressure
- - S a S -18.-
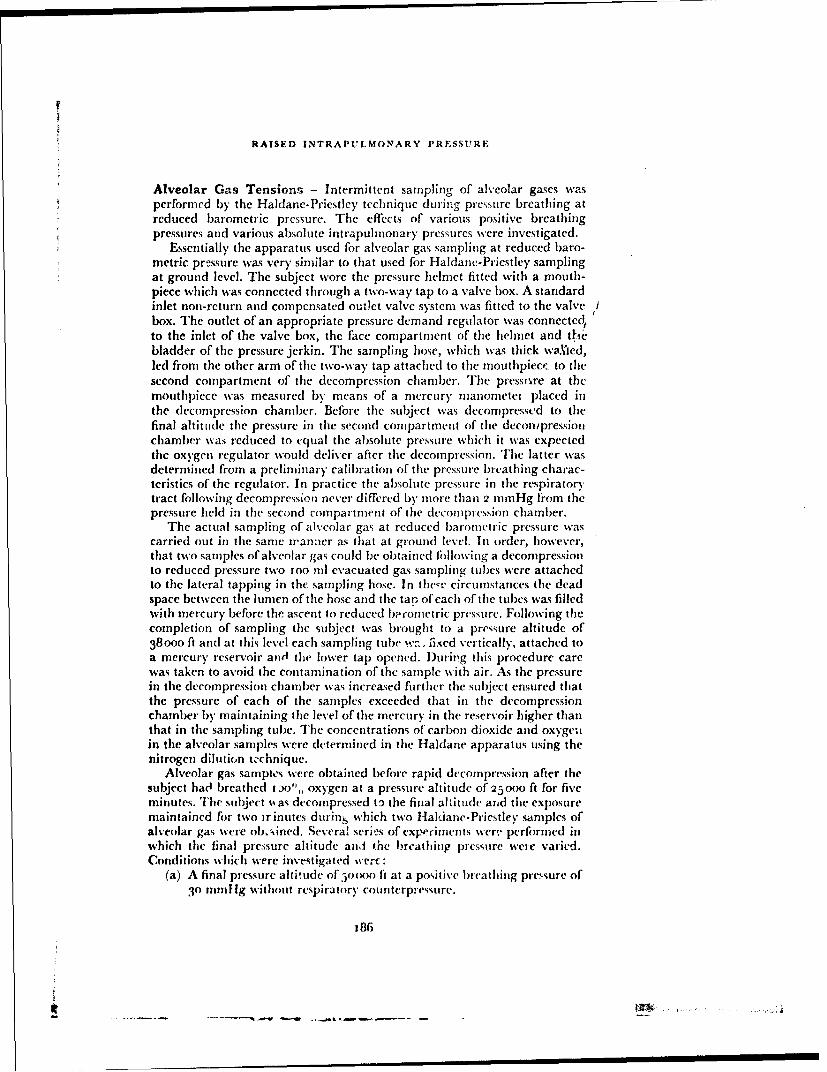
RAISED INTRAPULMONARY PRESSURE
Alveolar Gas Tensions - Intermittent sampling of alveolar gases wasperformed by the Haldane-Priestley technique during pressure breathing atreduced barometric pressure. The effects of various positive breathingpressures and various absolute intrapulnonary pressures were investigated.
Essentially the apparatus used for alveolar gas sampling at reduced baro-metric pressure was very similar to that used for Haldane-Priestley samplingat ground level. The subject wore the pressure helmet fitted with a mouth-piece which was connected through a two-way tap to a valve box. A standardinlet non-return and compensated outlet valve system was fitted to the valvebox. The outlet of an appropriate pressure demand regulator was connected,to the inlet of the valve box, the face compartment of the helmet and tife'bladder of the pressure jerkin. The sampling hose, which was thick walied,led from the other arm of the two-way tap attached to the mouthpiece to thesecond compartment of the decompression chamber. The pressnre at themouthpiece was measured by means of a mercury manometer placed inthe decompression chamber. Before the subject was decompressed to thefinal altitude the pressure in the second compartment of the deconmpressionchamber was reduced to equal the absolute pressure which it was expectedthe oxygen regulator would deliver after the decompression. The latter wasdetermined from a preliminary calibration of the pressure breathing charac-teristics of the regulator. In practice the absolute pressure in the respiratorytract following decompression never differed by more than 2 mmHg lrom thepressure held in the second compartment of the decompression chamber.
The actual sampling of alveolar gas at reduced barometric pressure wascarried out in the same wanner as that at ground level. In order, however,that two samples of alveolar gas could be obtained fbllowing a decompressionto reduced pressure two too mnl evacuated gas sampling tubes were attachedto the lateral tapping in the sampling hose. In thece circumstances the deadspace between the lumen of the hose and the tap, ofeach of the tubes was filledwith mercury before the ascent to reduced bacometric pressure. Following thecompletion of sampling the subject was brought to a pressure altitude of38000 ft and at this level each sampling tube wn. fiixed vertically, attached toa mercury reservoir and the lower tap opened. D)uring this procedure carewas taken to avoid the contamination of the sample with air. As the pressurein the decompression chamber was increased further the subject ensured thatthe pressure of each of the samples exceeded that in the decompressionchamber by maintaining the level of the mercury in the reservoir higher thanthat in the sampling tube. The concentrations of carbon dioxide and oxygeu.in the alveolar samples were determined in the Haldane apparatus using thenitrogen dilution technique.
Alveolar gas samples were obtained before rapid decompression after thesubject had breathed I 0o",, oxygen at a pressure altitude of 25ooo ft for fiveminutes. The subject %,as decompressed t: the final ahitude and the exposuremaintained for two irinutes durins which two Haldiane-Priestley samples ofalveolar gas were obtained. Several series of expeciments were performed inwhich the final pressure altitude and the breathing pressure were varied.Conditions which were investigated werc:
(a) A final pressure altitude of sow)o fi at a positive breathing pressure of30 mnuHg without respiratory Cou ntcrpressure.
j86
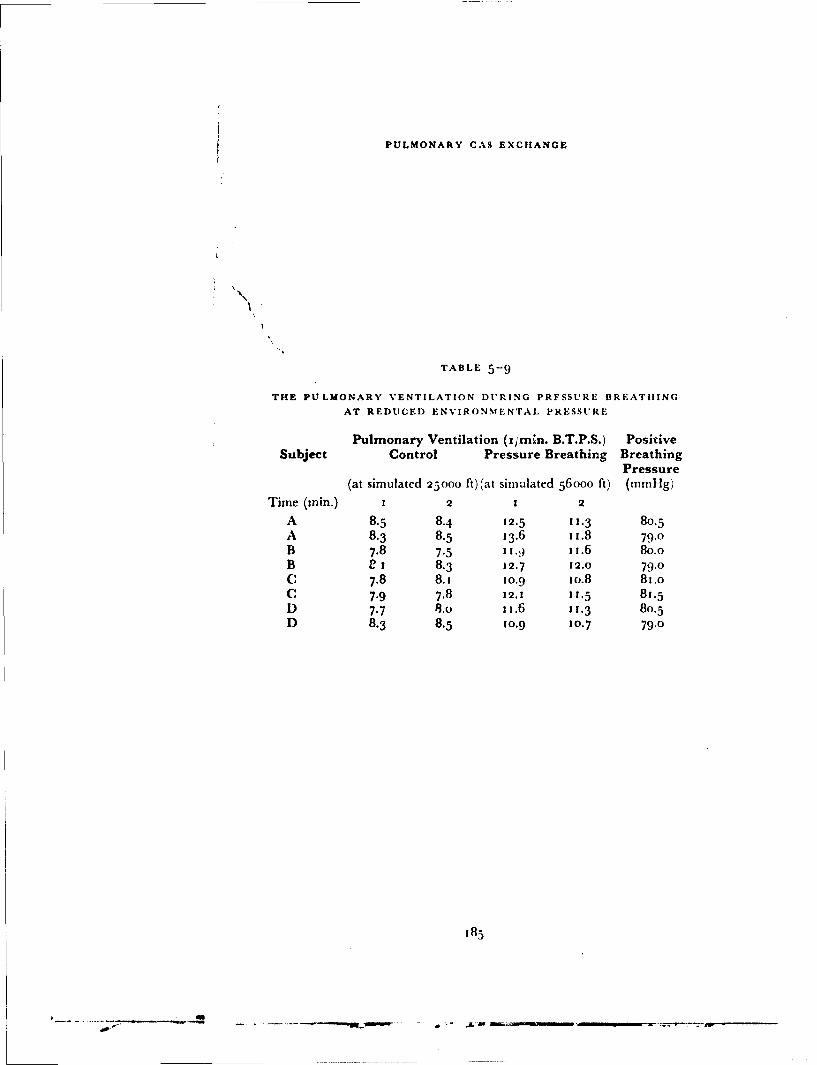
PULMONARY CAS EXCHANGE
N
TABLE 5-9
THE PULMONARY VENTILATION DURING PRFSSURE BREATHING
AT REDUCED ENVIRONMENTAL PRESSURE
Pulmonary Ventilation (i/mhn. B.T.P.S.) PositiveSubject Control Pressure Breathing Breathing
Pressure(at simulated 25000 ft)(at simulated 56000 ft) (mmHg)
Time (min.) 1 2 1 2
A 8.5 8.4 12.5 11.3 80.5A 8.3 8.5 13.6 i1.8 79.0B 7.8 7.5 1 1.,) 11.6 80.0B e 1 8.3 12.7 12.0 79.0C 7.8 8.i 1o.9 xo.8 81.oC 7-9 7.8 12.1 11.5 8j.5D 7.7 8.0 1x.6 11.3 80.5D 8.3 8.5 10.9 10.7 79.0
-85
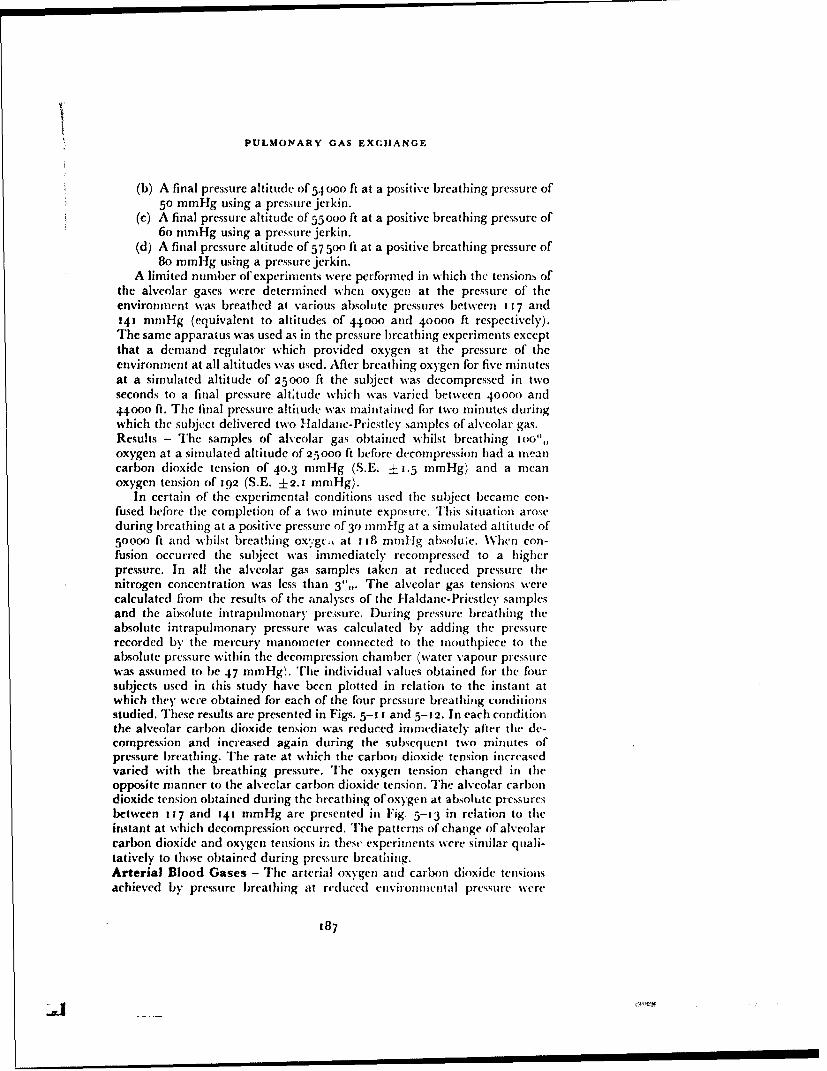
PULMONARY GAS EXCHANGE
(b) A final pressure altitude of 54000 ft at a positive breathing pressure of5o mmrHg using a pressure jerkin.
(c) A final pressure altitude of55ooo ft at a positive breathing pressure of6o mmHg using a pressure jerkin.
(d) A final pressure altitude of 5 7 50o ft at a positive breathing pressure of8o mmHg using a pressure jerkin.
A limited number of experiments were performed in which the tensions ofthe alveolar gases were determined when oxygen at the pressure of theenvironment was breathed at various absolute pressures between 117 and141 mmHg (equivalent to altitudes of 44ooo and 40000 ft respectively),The same apparatus was used as in the pressure breathing experiments exceptthat a demand regulator which provided oxygen at the pressure of theenvironment at all altitudes was used. After breathing oxygen for five minutesat a simulated altitude of 25000 ft the subject was decompressed in twoseconds to a final pressure altttude which was varied between 40ooo and44000 ft. The final pressure altitude was maintained for two minutes duringwhich the subject delivered two Haldane-Priestley samples of alveolar gas.Results - The samples of alveolar gas obtained whilst breathing too",,oxygen at a simulated altitude of 25ooo ft before decompression had a meancarbon dioxide tension of 40.3 mmHg (S.E. ±-.5 mmHg) and a meanoxygen tension of 192 (S.E. ±2.i mmHg).
In certain of the experimental conditions used the subject became con-fused before the completion of a two minute exposure. This situation aroseduring breathing at a positive pressure of 30 nnHg at a simulated altitude of50000 ft and whilst breathing ox*gc,, at ii8 mmHg absoluie. When con-fusion occurred the subject was immediately recompressed to a higherpressure. In all the alveolar gas samples taken at reduced pressure thenitrogen concentration was less than 3"1. The alveolar gas tensions werecalculated firom the results of the analyses of the Haldane-Priestley samplesand the absolute intrapulmonary pressure. During pressure breathing theabsolute intrapulmonary pressure was calculated by adding the pressurerecorded by the mercury manometer connected to the mouthpiece to theabsolute pressure within the decompression chamber (water vapour pressurewas assumed to be 47 mmHg). The individual values obtained for the foursubjects used in this study have been plotted in relation to the instant atwhich they were obtained for each of the four pressure breathing conditionsstudied. These results are presented in Figs. 5-1 1 and 5-12. In each conditionthe alveolar carbon dioxide tension was reduced immediately after the de-compression and increased again during the subsequent two minutes ofpressure breathing. The rate at which the carbon dioxide tension increasedvaried with the breathing pressure. The oxygen tension changed in theopposite manner to the alveclar carbon dioxide tension. The alveolar carbondioxide tension obtained during the breathing of oxygen at absolute pressuresbetween 117 and 141 mmHg are presented in Fig. 5-13 in relation to theinstant at which decompression occurred. The patterns of change of alveolarcarbon dioxide and oxygen tensions in these experiments were similar quali-tatively to those obtained during pressure breathing.Arterial Blood Gases - The arterial oxygen and carlon dioxide tensionsachieved by pressure breathing at reduced environ ncntal pressure were
187
S-JJ tI I I I I

7. Ft00 . H54000 Ft.p'.BeNT'bommns. 10. Pr br. kl o m 13P1. II ralmm . P 0 Ill2. Mm 14.H
60- 60.
00
4.0 48.1
*011
+~ a03 0 4 ... .
o2 0 82
40.u Paco%. 40o.sItHM.)
Fiu. - 1hCav arastij(ISihitddrgprsuehetigsiho gn
Fi(;-,ý-ll Th a bv~rg s ltesionsorapie u rionar pressure iahii ih xg)
at im lardalitde o ,-ooo t nd54)() t 'rB. pAtirbetig eS18e
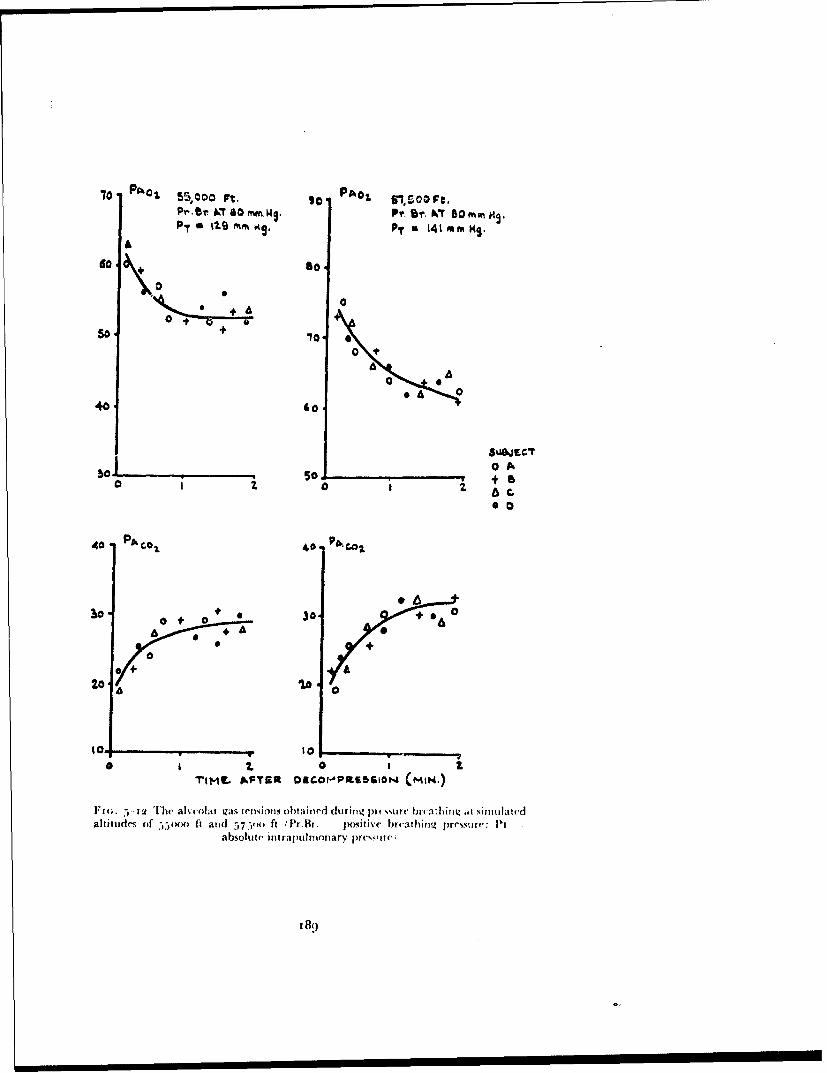
70 PAh0 So o 55,.00 PAO& gl,500 Ft.Pr - A T 0 m~m. Ws. Pf. Sr. W~T Dot"mnH9
P- fm%. Mg.. 141 mm KS.
600 +
0.6 0
40- Go
0 A
I~~~ 0 0 t
40 PA col 40. p.4
10.1 0 + 0+3.+
0+ 10
00
TIMIL AFTS23 0EG.0r-,PltsS61N (MIN.)
Fi4;. T-3 he ak-colar gas ieiisions obta ined durirng In cvsur bi va: hizt simuliatedaltitudes of -).- tad~7i t rB positive bieathng, pressure: IN
absolute int raj wilmoinary prcssiate
I 8o
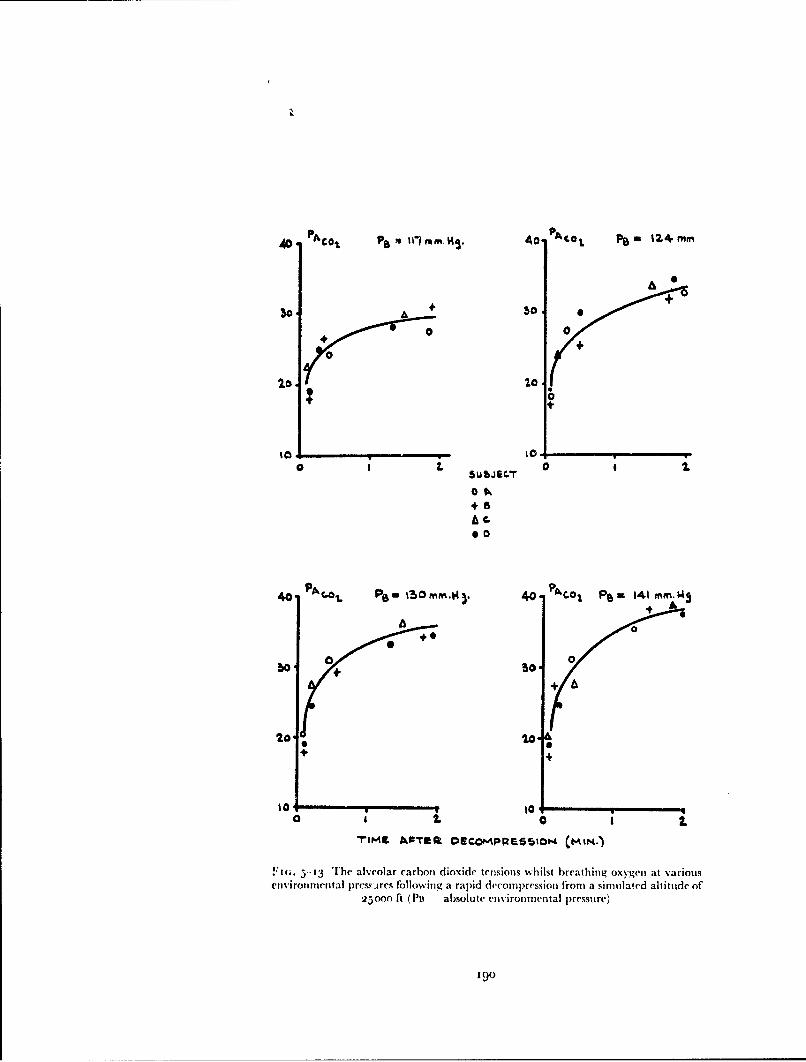
AD. PAO•€ ,aP 1•71 mm. HS. Ao. P4C0 t ea 12.4 mnm
0 ++
+
A 0
0 0
0Ok
000
1 0 +0
bo 0S 0 a2
++A'tt
40 •.• e, on.. 4) A o• P•,- 141 mm.b4
0o 0
2o, , .o*
o a i. 10 I
5-in. 5"13 The alveolar carbon dioxide tensions whilst breathing oxygen at various
environmental press.-res following a rapid decompression from a simulated altitude of
25000 ft (Pt absolute environmental pressure)
Igo

studied by sampling b)lond from th,' brachlal artery following decompressionin the decompression chambet. Two pressure breatlhing sys,,tems were investi-gated at a simutlated altitude of -,(b)ooo ft, nanielv the combination of anoronasal mask, jerkin and anti-g suit with the .Mark 21 pressure demandregulator, and the combination of a pressure helmet, jerkin and anti-g suitwith the Mark 20 pressure demand iegulator. Since the environmentalpressure at a simulated altitude of 56,+no ft was considerably lower than thesum of the partial pressures of the gases in the arterial blood, a special bloodsampling technique was developed in order to avoid the formation of gasbublbles in the arterial sample.
The subject, wearing the appropriate standard pressure clothing assembly,was seated in tile decompression chamlber. The pressure at the mouth wasmeasured I)v means of a mercury manomneter which was mno.inted in thedeconipression chamber. A Riley intra-arterial needle was introduced intoone brachial artery under local analgcsia. The needle was then connected bya short (- cm) length of polyethylene tubing to a pair of three-way taps con-nected in series (Fig. 5-•.1.). The side arm of the first tap was attached throughan adjustable needle valve to a bottle of sterile physiological saline to whichhepaiin had ,wen added. T'ie air inlet to the space above the saline in thebottle was connected to a pre,,sure demand regulator wvhich maintained anoutlet pressure ;oo mmnlig greater than that of the pressure within the de-compression chamber. The side-arm of a "T" piece placed in the connectionbctween the regulater and! the bottle containing saline was closed with aclamp. This system could Ile vented to the decompression chamber byremoving the clamp. A mercury manometer was also attached to the syste.uso that the pressure within it could be determined. The second of tile pair oftaps connected to the intra-arterial needle was attached to a 20 ml syringe.The barrel of the syringe was passed through the wall of a perspex box andclamped so that the piston of the syringe was within the box. A metal rodwhich also passed through a wall of this box was attached to the piston of thesyringe so that the piston could le pulled along the barrel of the syringe whenthe box was sealed. The interior of the box was connected to a pressuredemand regulator which maintained an outlet pressure of 141 mmHgabsolute at pressure-altitudes above 40000 ft. This pressurization system alsocontained a relief valve which operated when the pressure in the box exceededthat in) the chamber by too mmHg. The side arm of the second tap was con-nected to a waste bottle which was also in communication with tle outlet ofthe regulator controlling the pressure within the syringe box.
Before the intra-arterial needle was inserted the dead space of the syringeand of the taps attached to it were filled with mercury and heparin solution.The first tap ,•as then turned so that saline flowed from the reservoir bottle,through the polyethylene tubing to the intra-arterial needle. The flow ofsaline was adjusted to a very slow rate by means of the needle valve. A medicalofficer wearing a partial pressure helmet, jerkin and anti-g suit connected toa Mark 2o regulator accompanied the subject in the decompression chamber.After the insertion of the intra-arterial needle and the setting up of the slowinfusion of heparinized saline the pressure within the decompression chamberwas reduced slowly until a pressure altitude of 25ooo ft was attained. Duringthe reduction of pressure the vent on the system pressurizing the saline bottle
191
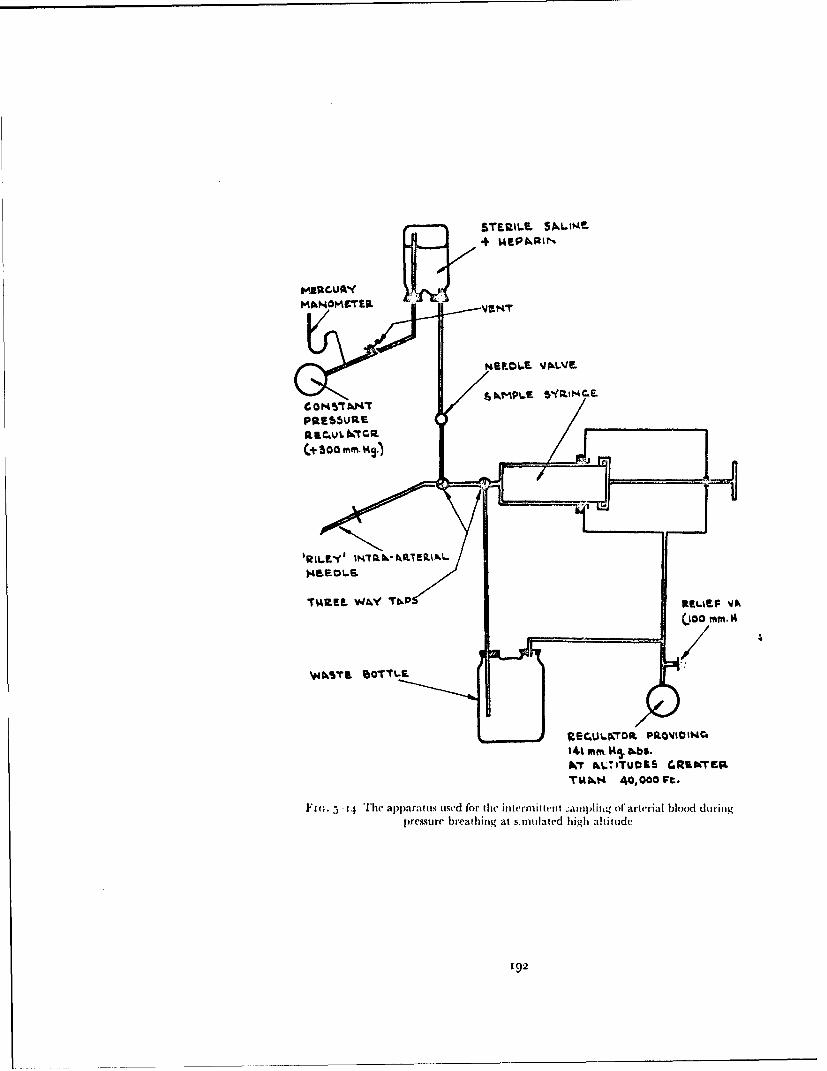
STE.ILM SAMEt!+ UEPAR.IN
mSU06E VAJLVE.
C 0 H 45 AhM*TPRE~SbUIE
(+ 300 mm. K.
'RUI.EY' taRT~RA
TMZREL WJAY TbkP
IM% mm.1I5 bbS.INT hL.ITU09S GRINTEP.
T~&kt4 40,000 Ft.
Fl; 5 -14 The apparat us used for the in term it teut -,ampfl ing if arterial b~lood duringprmiture breathing at s.mutilated high altitude
19.2

Ht'tSioNARY GiAS EXCHiANOtF
was op~ened Periodicall%. to p~revent anl excessive build-up of pressure inl thleýystrni. After a rest period of three to fi~ e minutes at a pressure altitude of25000 It, the sub~ject andl dic acconiponying niedical oflicci were decom-.pressed( to a finial pressure altitude Of 5(iOoo ft in twNo secendls. Immnediatelybefore the deconipression thre vent of the pressuirization systein foi- the salineboitle was opened. It was dlosed agaiin inuinediately after the decomipression.'1'1l( lunien ')f the( iiitia-arterial needle, the polyethlvenle tub~ing between itan~d the taps and( tfie iwnien of' hie taps were flushed~ with arterial blood byturning tire taps so that the needle was connected to tire ss aste boittle. Actunalsaniplin ,~ of the arterial blood was started one mninute af'ter decomipressionanid continued !or two miii utes. D~irectly the( samnpling was finished tilepressure wit bin tile deconmpression cham~ber was increased. D~uring thedlescenit the intra-arterial infusion of saline was reconinienced aril thle tapsremo1ved fromt die svrinige which %%as theni capped and rotated slowly. 'I'lieoxygen content of, thie arterial samnple was detcrio med by- d uplicate analysesin hie inianomectric \'a ir SI yke apparatus; the pTil aiid] carboni dioxide tensionof' the saniple were determnined bý thle interpolation te hiniitue of' Ast rup(15) The oxygen-carrying capacity- of thle blood sart~ple wais also deter-
rninedl in duplicate analy-ses.Ini this investigation each subject wsas uisually dc'coaiprcssed twice in a
A~ngle experiment. T1he exposuires to pi essurc breathing were separa ted by atleast twenty nuin utes. Ill order to redhuce t'me risk of' the developmnent of de-colnlpression sickness, hothi the sub 'ject and the( accomipanlying necchcal officerprcoxygenated for one houir before the ascent !o reduced pressure.Results - Each of the four subjects was, exposcd on two separate occasions toeach of the two breathing pressures at a p' e.;sure altitude of 5600() ft. Theoxygen saturation of each arterial samnple- was calculated froml thle oxygencontent and capacity after ninaking allowance for the physically (hissolIvedoxygen. 'Fli oxvg,-'n saturation, pH anid carbon dioxide tension of' eachsamiple of arterial blood, together -with the corresponding positive breathingpressure, are presetited in Tab~le 5--. i(,. There was somec variation in the Carb~ondioxide tenisio~n anid oxygen saturation of the arterial blood achieved betweenone sub~ject anid another even wfen (lhe samec pressure clothing assemibly wasused. Thle arterial carbon diox~de tension anid arterial saturation were, how-ever, always greater with a positive breathing pressure of' 8o iizitllig thanwith one of 6o ininfg.
DIS CUSIOS50NPulmonary Ventilation -A very striking feature of thle response ,fsub~jectsundergoing training in the utse of pressure breathing equipmient was thezacrease of the depthI of brecathing which was induced by presstire breathing,even when trni k counter pressu re was emnploy-ed :Ernsting, personal observa-tion). Accurate nwasurcrment of' the pulmionary venitilation during pressurebreathing was virtually imnpossib~le, howkever, when standard pressure breath-ing equipmncrt was used, since significatit outboard leakages occurred fromntire biecith:rug conliparttment of the mnask or pressure hlmciet. It was ne(cessary\,therefore, to resort to t~je use of a rtiodified pressure helmect fitted wvith amnouthpiece in or-der to ensure adequate collection of tile expired gas. Theuse of' a special breathing device itncor porating a miouthipiece immeidiat0ly
193

RAISED INTRANtI.NIONARY IRE.SSIRE
TAB.L E 5--10
"1 lIE EFFEC(T OF PRESSURE BREATIIING AT A SIMUIIATI.ED) AI.TIII)E
0OF 5(' )) iF ( i, 63.7 Inlltgi 'I1'ON Trile C:OMPOSITION O(F TIHE
ARTERIAl. BLOOD
Positive Arterial bloodBreathing Carbon dioxidePressure Saturation pH tension(nilHg) ("11) (1inullg)
Control (breathing oxygen at simulated 25000 ft)
A -- 100.0 7.415 4(.(A - - 9,.8 7.41( 18.oB -- 9q.6 7.395 39-5B .. 100.0 7.399 9.0E - !)9.2 7.4()5 42.5E 9(.5 7.415 4'."F ... 100.0 7.425 38.oF -- 100.0 7.42( 38.5
Mean 9(.8 7.409 39.6
Pressure breathing with mask, jerkin and anti-G suit
A 63 83.5 7.476 30.2
A 61 83-5 7.495 28.5B 6 1 85.5 7.51() 26.6B 6o 82.5 7.502 28.3E 63 91.() 7.514 26.5E 6 1 83.2 7.49( 29.4F 6o 82.0 7449 31.0F 6o 83.2 7.495 29.2
Mean 61.4 84.3 7.491 28.7
Pressure breathing with helmet, jerkin and anti-G suit
A 77 88.8 7.435 34.5A 80 92.0 7.510 2(9.5B 77 93.0 7.495 30.2
B 8o 92.2 7.492 3o.6E 79 93-2 7.505 29.0E U0 91.0 7.452 32.5F 8o 92.8 7-4.19 31.5F 78 89.2 7.435 34.5
Mean 78.9 91.5 7.471 31-5
'94

PI'UIMONARY GAS EXCHANGE
restricted the group oflsuhjects which could be used foe this study. AL'empts tomake measurements of pulmonary ventilation using this apparatus in aircrewwho had completed their training in pressure breathing were totally un-successful. This group of potential subjects either refuscd to don the helnctfitied with the mouthpiece or had an abnormall) high pulmonary ventilationwhen wearing the apparatus in the resting state. Shortage of time precluded along period of Iimiliarization with the equipment. Thus these studies of theeffect of pressure breathing upon the pulmonary ventilation were performedupon a small group of subjects who had previous experience of respiratoryexperiments and who had been exposed to pressure breathing of) numerousoccasions.
In the selected group of trained individuals employed in the present study,pressure breathing with trunk counterpressure caused an increase in the pul-monary ventilation (Table 5--4, The greatest increase occurred at the begin-ning of' lpresstre breathing and although the pulmonary ventilation was raisedthroughout the pressure breathing period, the ventilation declined slightly asthe procedure was continued flFigs. 5-1, 5-2 and 5-3). The increase in pul-monarv ventilation was due principally to an increase in the tidal volu:nc,although th: rcspiiatny rate was also increased slightly. The magnitude ofthe increase of the piuhlonary ventilation in a given stll)ject was not related tohiM e'xperiefiec of plle,'iure breathing. The increase in the carbon dioxide out-put in ,the absence of'a concomitant rise of the oxygen uptake suggested thatthe inc(-rvawe of puhlmonarv ventilation wai a true hyperventilation. Thissuggesttoou %as confirmed 1y the increase in the respiratory exchange ratiowlticgn occurred during p'ressure breathing (Table 5-4). Further evidence inriavour of the occurrence of hyperventilation was that the pulmonary ventila-tion during the early part of the recovery period was less than the controlvalue and that the respiratory exchange ratio also fell below the control valueduring the recovery period. Similar evidence suggested that the increase ofpulmonary ventilation produced by breathing at a positive pressure of'
mm Hnulqg without respiratory counterpressure was also a true hypcrventila-tion.
The pulmonary vct.tilation declined progressively during the exposure toprcssure breathing. The duratiot oftan exposure was limited, however, by thecardiovascular disturbances which are associated with pressure breathing atthese ,'eatively high pressures. It was not possible, therefore, to ascertainwhether the pulmonary ventilation would attain a steady value duringpressure breathing under these circumstancs. The complete absence of arespiratory "steady state" t. iring pressure breathing was evidenced not onlyby the changing pulmonamy ventilation but also by the raised respiratoryexcliange ratio. The rate of change of pulmonary ventilation becam, less,however, as the time of exposure to pressure [reathing lengthened. Thecollection of expired gas lor the measurement of oxygen and carbon dioxideexchange was therefore performed as late as possible in the pressure breathiligperiod. Thus, in the measurements performed during pressure breathing atpositive pressures of 6o and 8o mmHg the expired gas collection was startedat the beginning of the second or third mi:nute of the exposure whilst duringbreathing at a positive pressure of 30o intitfg without counterpressure, thecollection was started in the fourth minute.
195

RAISED INTRAPULMONARY PRESSURE
']ile cause of the increase of pulmonary ventilation during pressurebreathing is obscure. There was no significant increase in the oxygen uptakewhen counterpressure was employed so that the raised pulmonary ventilationwas not due to an increase in the metabolic oxygen consumption. The smallincrease of oxygen uptake found during breathing at a positive pressuri of30 mmHg without counterpressure was probably dute to the increased workperformed by the respiratory muscles in this situation. Although pressurebreathing with an oronasal mlask produced a large increase in the volumc ofthe upper respiratory airways ;Chapter 3) the pressure helmet which wasused during tlis measurement of pulnonary ventilation appiied counter-pressure to tile face and neck so that this cause of an increase in the respiratorydead space was eliminated. This was confirmed by the direct measurementsof t,;e anatomical dead space made during pressure breathing with thishelmet. Although ar increase in the physiological dec,-,A space might havebeen one of the thct'rs which gave rise to the increase of pulmonary v'entila-tion, tie observed inereae in the respiratory exchange ratio during pressurebreathing shm~, ed that in fact the increase in pulmonary ventilation more thancompensated for any incieasc of dead st),Dc \ hich might hac o,'urred inthis situat;on. This obv-ervation ,'. ntofi• ithmd by the findlint that pressurebreathing under these circumsmtarces also reduced the alveolar and arterialcarbon dioxide tensions. This latter finding in tact eliminated all incre?,se ofrespiratory dead space as a cause of' the increase of puhlmohnary ventil.ationsince an increase in dead space increases the pulmonary ventilation b•' reduc-ing the alveolar ventilation and raising the alveolar carbon dioxide tinsion.Tlie increase in pulmonary ventilation produced by breathing at a posai.,vepressure of 30 ni1n1g without counterpressure %%as proi ably associated withthe gross alteration of the mode of operation of the respiratory muscles whichoccurred in this situation.
Evidence for tile inlpaii ed nervous co-ordination of the respiratory musclesin pressure breathing without counterpressure was presented in the previouschapter. It was also shown that the mechanics of respiration were not restoredcompletely to normal by tile application of' the eounterpressure afforded b\the pressure jerkin. The slight distension of the lungs which occurred duringpressure breathing with trunk counterpressure might have ouee-i a stinuilus topulmonary ventilation. Furthermore, high pressure breathing caused markedchanges in the pattern of' the afferent nervous impulses passing to the centralnervous system as evidenced by sulbjective sensation. The inflated helmet andpressure jerkin gave ,d'nsations of tightncý;s around the head and trunkrespectively. In addition, discomfort due to vascular congestion occurred inthe upper limbs, particularly during breathing at a positi\e pressure of8o mmHg. These forilms of sensory stimulation eommnronly give rise to anincrease in pulmonary ventilation in the abs'nce of'pressure breathing. It maybe concluded, tentatively, thereflore, that these sensory stimuli are alsoresponsible for the hyperventilation produced by high pressure breatniing withtrunk counterpressure.
In the steady state the uptake of oxygen from the respired gases reflects themetabolic oxygen consumption. Tetnporarv differences call arise, however',between these two rates when the size of the oxygen store of the body ischanging, as duriug an alteration of pulmenary ventilation, which ind ]ce:s a
196
t '•* .. ... _ _
RAISED IN'rRAP, UIMONARY PREtSS'URE
uncertain. The' ability to analyze a nitrogen clearance curve into two compon-ents, each of which appears to be evenly ventilated, does not imply that infact the lung, consist oftwo clearly defined volumes, cach with its own ventila-tion. Indeed, the accepted concept of the ventilation of the lung is that thereis a continuum of different degrees of ventilation amongst the various alveoli.Further, as Briscoe and Cournand 1939 (47) have pointed out, a washoutcurve which can be analyzed into two components. can, in fact, be die resultof the summatimon of a considerably greater number of' components. Theaccuracy of the technique is partly determined by the possibility of detectingdeparture from linearity when the analysis of the components is made by thesemi-logarithmic plot of the experimental data. The method of analysis pro-posed by Fowler, Cornish and Kety 1952 (112) does, however, allow aquantitative assessment of the unevenness of the distribution of the inspiredgas so that the evenness of ventilation may be compared in different experi-mental conditions and Lct%('ecn one subject and another.
The results of the analysis of the nitrogen clearance curves obtained fiomthe subjects at rest (Table 5--5) showed that the compartment with the slowerclearance rate constituted about 75",, of the functional residual capacity andthat it received about half of the total alveolar ventilation. The other com-partment, although it constituted only 2.:)",, of the functional residual capa-city, received th" other half of the alveoiar ventilation. These results agreewell with those obtained by For ihr, ('Crnish and Kety 1952 (112). Theincreases in functional residual capacity caused by pres.,u.' breathing werevery similar to those presented in the previous chapter. The proportions i.-the functional residual capacity occupied by the two compartments remainedvirtually ine lmhanged in pressure breathing, even when the f'unctional residualcapa-ity was markedly increased by pressure breathing without respiratoryColinterpressure. A similar constancy of Ihe proportions of the end-cxpiratorylung volume ott upied by each of the c,.nipartments was demonstrated byBates, Fowler, Forster and Van llingen 19!4 (26). Tl'he subjects in thisinvestigation voluntarily maintained various increase, of the end-expiratoryvolume. Haab and Cimono 196o (134) obtained a similar result in a studyof the distribuei,,n of the inspired gas during pressture brea hing at positivepressures of i t and j8 mmltg without respiratory colinterpressurc.
The alveolar dilution ratios obtained in the present study (Table 5--5)showed that the ventilation of each of the two compartments of the lungvolume was not ;iv:nificantlv changed by pressure breathing. Further, theproportion of the alveolar ventilation distributed to cach conmpartinentremain(-d unchanged during pressure breathing, whether or not trunkcounterpressure was used. Bates, Fowler, F-orster and Van Lingen 1954 (26),whoe subjects varied their end-expiratory lung capacity by voluntary effort,found tha-t the alveolar dilution ratio was slightly increased by an increase of'tht functional residual capacity. In their experiments, however, the tidalvolume, and hence the alveolar ventilation per breath, was held constant inspite of the change of lung volume. In the present experiments the totalalveolar ventilation per breath was increased at the larger lung volumes andthis tended to reduce the increase of the alveolar dilution ratios which wouldotherwise have occurred. Haab and Cimono |96o (1:14) also found nochange in the alveolar dilution ratios during positive pressure breathing.
198
V _______

PULMONARY GAS EXCHANGE
change in the alveolar oxygen tension. Dluring the period over which expiredgas was collected in thc pressure breathing experimcnt•, the pulmonaryventilation was changing relatively slowly. Further, the direct measurementsof alveolar gas tensions confirmed that the alveolai oxygen tension alteredvery little over this period. W\\hen no respiratory counterpresyure was usedonly two subjects could maintain the regular breathing pattern necessary ifsignificant changes of the quantity of oxygen stored in the body were to beavoided. It appeared, therefore, that in tile present experiments the oxygenuptake measured by analysis of the respired gases, 'flected the metabolicoxygen consumption. Breathing at a positive pressure of 30 """fHg withoutrespiratory counterpressure caused a mean increase of 2i ml S.T. P./n in. inthe oxygen uptake (Table 5-4). This increase, which was statistically signifi-cant, was probably associated with the large increase in the work performedby the respiratory muscles in these circumstances (Chapter 4). No significantchange of oxygen uptake could be detected when trunk counterpressure wasused in pressure breathing (Table 5-4). The actual increase in work per-formed by tile respiratory muscles in these circumstances was small (Chap-ter 4) and calculations suggested that the associated increase in the metabolicoxygen consumption would be of the order of 2 to 5 ml per minute, a changewhich could not be dctected.Distribution of inspired gas - The manner inl which the inspired gas isdistributed within the lungs is one of the factors which determines theefficiency of the gaseous exchange between the gaseous and blood phases inthe lungs. Tile presence of uneven ventilation of the lungs in normal subjectswas demonstrated early in this century by Krogh and Lindhard 1 917 (175),Darling, Cournand and Richards 1944 (71) found in several healthy sub-jects that pulmonary nitrogen clearance did not follow the course piedictedfor ulliform ventilation. In 1952 Fowler, Cornish and Kety 1] 2) published amethod of analysis of nitrogen clearance curves which gave a quantitativeexpression for the degree of unevenness of alveolar ventilation. Theyshowed that in most normal subjects there was some unevenness ofventilation.
The method used in the present study to determine the effect of pressurebreathing upon the distribution of inspired gas within the lungs was essentiallvthat developed by Fowler, Cornish and Kety 1q52 (1 12). Their method ofanalysis of nitrogen clearance curves was, however, modified in certainrespects. The original analysis was based upon the mean concentration of'nitrogen for each expiration. The calculation of thls quantity was verylaborious. A preliminary study of the change of the concentration of nitrogenduring expiration over the "plateau'" of nitrogen concentration showed thatthis never exceeded .5",. It was concluded, thei clbre, that it was acceptableto use the' end-tidal concentration of nitrogen in plotting the nitrogenclearance curves. The use of the end-tidal nitrogen concentration required amodification of the analysis propounded by Fowler, Cornish and Ketv1952 (112). Such a ui,,dification has been presented by Briscoe and Cournand1959 (47) who followed the end-tidal gas concentration using a Rahnsampler. No correction was applied in the present analysis for the contribu-tion of the tissue and blood nitrogen to the expired nitrogen since thequantity of nitrogen coming from this source was relatively small and
197
VIAIMONA KY (;AS i.XCIIANGE'
Boil) Bate's, l'05tIvr, Ini-siti ajitl Van i l~igCli I().) '2A anid Ifilal) and(C iiiono Iiot 13 found that thle tlistribul~ton of thec alseolar ventilationibetweenl the( two comlpait nicn'tts wa,, not afrected b\V an increase in the lung\volumell.
'I'lie Present investigation of' Ow liesashout of niitroigen from fihe lung',demnontrated. thereitfo~re, that pressure brieat hing prod iced no detectablechange inl the distribution of' tbe inspired gas within the lungs. 'lhe.e arelimiitationis to tbe sensit ivit\v of' thi Ins ithod of detecting un's'enniess of Pul-monary ventilation. It is, hr ,wecver. thle mlost sensitive mret hod available forassessing the evenness of' the dkisribution of the inspired gas per -e apartfrom those methods emiplo\-ing tb lie dtuction of the radiation from inspiredradio-active gasecs b\v means of' scintillation counters placed ýtvariouspositions over the chest wsall ý85 '[hel( distribtition of the inspired gas to thevarious groups of alveoli within tli' lungs, is not of' itseclf an important factorcontrolling thev gaseous exchange betweevn the gas and] blood phases in thelungs. T[le important factor is the ielationi of thle distribution of' ventilationto the( iistrilmtion of' puiilonaioia capillary- blood flo\. Thie ziitiogen clearancemeasurem~lents, hlowever, give no iniformiation w\itl) regard to this reclationshipunless somie assumptions aie( m~ade conice'rning the (list rilbut ioni of' blood flowth rou g h tl lie nngs. lri scoe mo~ .16; hJIias 1)1 en'iited a nicthod w Iiervb\v thle
contribuitioni of, the 1Inevemnes~s of' the( distribution of' the inspired gas to the(oxvgemi tension1 differenice betwecen tlin' alveolar gas an(]di theSvteliic arterialblood nia- lbe assisse,,d. Such calculations have little appilhation, liossevem', tothle present investigation. T[he absi'riu of'allv chaia,;ge ini t lie dc~g ie( of.1 oev('i-ne('s of' alveolar ventilation with thn' indulctionm of pressure breathing wouldsugge'st that an\- imupairmnent of' tOli exchangev hetweeii lie gas and bloodplusecs withji tilt theuings denionstrated in pressure breathing musvt be due toChanges inl thle (list ribuit ion of' puni o n ariv ca pill a rv bood flow or to c hanugesill the diffusiotn chairacteristics of' the alveolar Catl)lilav Invielrnlwar.Respiratory Dead Space C-(ow'idcrabli' controversy\ has ceiitred aroundile( initerpre tat ion of'd vli'sar101ios ine('s res of' the respi rat r (l eadl space. It ispossib~le, hosseVer, to dist ingukihl ciearlv- two (listinet fiwrms of'r('spirat ory de(adspace, narncl\' the( anatomical and t lit phy-siological dlead space. Thueanatomiical dlead spa'. v is the' vol univ of' the conductinig airwayýs dlown to the
re'gion in the lungs where thle inspired gas, is diluted b\- the alvoags.Ii,theref'ore, that volutne of thle tidal air N\hich does not contribute to tile ventila-tion of the alveoli. It is measured by- recording sinitultaneoumslv the instanta-neous co~ncent ration of eit he(r nitrogien after a single br.'-at h of' ox\-gct orcarbon dioxide at thle lips and the expirator\' flow (IR IV By anl extrapolationof the alveolar concentration plateau tilie coiicent ration of'gas in tile alveolarair which wsashed outilthe dead space is calculated arid thlt s'oliiine of this (leadspace is estimated us, og the Bohr c('Ima:ion. IIt h'I( prescrnt stuidy thet anatomicaldead space w\as mecasuired by\ the single brieathI ofox\vgen t'chnliqiie developedby F'owsler iq4.8 (m I 8). 'I'IH'- ph\,siological dead space, onl the other hand, is ameasure of thle effectivemi'ss w~ith whiich til' inspirr'd gas removtes carbondioxide from (and adds], oxvgi'n tow the' blood flowing through tie lungs. It ismeasured by determining siin ml ta nct'id islv t carbon diox ide tension of theexpired gas and of file s%'strniie arwvrial blood RileN' and Courtiand 9!(244)-
I (y)
RAISED INTRAPUIMONARY PRESSURE
The rate of diffusion of carbon dinxide is so high that iii a normal subjectthe tension of this gas in the blood leaving an alveolus virtually always equalsthat in the gas within the alvcolus. Further, the carbon dioxide dissociationcurve is almost linear over the physiological range so that the carbon dioxidetension of the blood leaving the lungs r.cpresents the mean of the carbondioxide tensions in all the alveoli weighted in proportion to the capillaryblood flow through each alveolus. Since the difference between the mixedvenou., and arterial carbon dioxide tensions ;:, relativelv small the normalright to left anatomical shunt of blood d,;es not significantly change thecarbon dioxide tension of the blood flowing firom the pulmonary capillarybed. T'he systemic arterial carbon dioxide tension mav be used, therefbre, asa measure of the mean alveolar carbon dioxide tension. The (lead spacevolume calculated using this measure of the a) 'eolar carbon diox~de tensionis the volume of the tidal gas which does not remove carbon dioxide from theblood flowing through the alveolar capillaries. The difference between thephysiological dead space and the anatomical dead space, which is termed tilealveolar dead space, is. therefore, an expression of the proportion of and thedegree to which certain alveoli are under-perfused with blood in relation tothe ventilation which they receive. If the ventilated alveoli arc divided intotwo groups, one group of which are not perfused, the other group of whicharc evenly perfused in relation to their ventilation, then the proportion ofalveoli not perfused is given by the ratio of the alveolar dead space volume tothe alveolai tidal volutme (1262).
The values of the volume of the anatomical dead space obtained with thesubjects in the resting state ('I able 5-1 l) were very similar to the mean valueof 156 ml (S.D. ±28 ml) reported by Fowler 1948 (itt) for a group offorty-five normal male subjects. Pressure breathing at a positive pressure of20 mmHg with no respiratory counterpresslire caused a mean increase of theanatomical dead space of 31 ml B.T.P.S. which was highly significant. Themagnitude of this increase of the .inatomical dead space was greatly reducedby the application ofcounterpressure to the trunk. Thus when counterpressurewas employed breathing at a positive pressure of 3o mmHg only increased tlf,anatomical dead space ;)\ to ml B.'I.P.S. Even pressure breathing at apositive pressure of' 6o mmHg with trunk counterpressure only induced amean rise of tin ml B.T.P.S. in the volume of the anatomical dead space. Inall these experiments the bladder of the pressure helmet applied counter-pressure to the head and neck. This counterpressure was probably adequateto prevent any significant distension of the extrathoracic portion of the upperrespiratory tract. The measurements of the anatomical dead space du'-ingpressure breathing with trunk counterpressure certainly dd not show the verylarge increase of (lead space which was produced by pressure breathing withan oronasal mask ,Chapter 3). There was a small gap (2 to 4 cm in width)between the lower border of the neck bladder of the pressure helmet and thetipper border of the prestsure jerkin. The neck bladder did, however, applycol|nterpressure to the neck to within 2 cm of the sternal notch so that all theextrathoracic portion of the sipper respiratory tract, with the exceptionperhaps era 2 -3 cm length of the trachea, was adequately supported duringpressure breathing. Care was taken in these experiments to avoid any altera-tion in the poslture of the head and the position of the lower jaw when pressure
200

I'VI.MO)NAR" GAS EXCHANGE
TABIE 5-1 I
TFlE ALVEOILAR DEAD SPAC:E IN PRESSURE BREATIIIN(;-- MEAN
VALUES FOR DII'PLICATE FXPERIMENTS ON THRIIREE SIrIqJE(rs
Condition A. Control B. Pr. Br. ,a C. Pr. Br. 'a D. Pr. Br. (a2) 1i1i11l Ig :jv 111 ll)g bi( 1 1i1iil lg',
Tidal volume tr 77t 728 1i:1(nil BT, P.S.)
Anatomlical dead space 16o I 91 1740 I 73
I'hysiological dead sIpae '2') 211.1 28P3:'32(nil i.IT,.S,)
Alveolar d(ead Spat'e M lean 44) 94 118 159(l B.T.P.S. S.. A 16 16 16
Ratio of alkcolar dv;icld Nlain O.4p o). 1; o4.21 (4.23
%pace to alveolar S.L. 0.i2 A). 4!.o.) :1 0-")4 o o4tidal volume
I'r*,.,,rr Iwre ihet~hr -iitg -tiink c0 tin tCiprr-llre
201

RAISED INTRAPULMONARY PRESSURE
breathing was induced since Nunn, Campbell and Peckett (1959) (227)demonstrated that such alterations of posture produced considerable changesin the volume of the extrathoracic dead space. It may bc concluded, therefore,that there was no, or at the very most, only a very small increase in the volumeof the extrathoracic portion of the upper respiratory tract in the course ofthese experiments.
Thc observed differences in the increase of the anatomical dead spaceinduced by pressure breathing with and without respiratory counterpressurewere due to variations in the volume of the intrathoracic portion of theanatomical dead space. As has been discussed in Chapter 3 the volume ofthe anatomical dead space is determined by a rumber of factors, of which thevolume of oxygen inspired, the duration of the delay before expiration andthe expiratory flow pattern were carefully controlled in the present experi-ments. Fowler 1948 (1 i t) demonstrated that the anatomical dead space wasincreased by an increase of the end-expiratory lung volume and the relation-ship between these two variables was investigated in detail in one subject byShepard, Campbell, Martin and Entis 1957 (267). They found that therewas an approximately linear relationship between the volume of the ana-tomical dead space and the end inspiratorv lung volume, the increase oranatomical dead space being 12.5 ml B.T.P.S. per litre of increase of inspira-tory lung volume. The experiments described in Chapter 4 showed thatbreathing at a positive pressure of 2o mmHg without respiratory counter-pressure induced a mean increase of 3.0 litre B.T.P.S. in the end-inspiratoryvolume.
Thus on the basis of the results obtained by Shepard, Campbell, Martinand Enns 1957 (267) the lung distension induced by breathing at a positivepressure of 2o mmHg would have increased the anatomical dead spacevolume by 37.5 ml B.T.P.S. The magnitude of this predicted increase may becompared with the mean increase of 3! ml B.T.P.S. found in the presentexperiments (Tabh 5-1 1). Further, the increase of dead space volumeinduced by breathing at a positive pressure of 6o mmHg with trunk counter-pressure predicted froom the results of Shepard, Campbell, Martin and Enns1957 (267) was to ml B.T.P.S. which may be compared with the meanincrease of 13 ml B.T.P.S. obtained experimentally. The observed increase ofthe intradhoracic portion of the anatomical dead space induced by pressurebreathing was due, therefore, to the concomitant increase in the volume ofthe lungs.
The variability of the values of the physiological dead space obtained ineach of the subjects in the resting state (Table 5-6) was relatively small andthe mean values obtained in this series are similar to that reported by Asmussenand Nielsen 1956 (to) and Gray, Grodins and Carter 1956 (126). Tihe meanof the ratios of the physiological dead space to the tidal volume whichamounted to 0.29 (S.1). -0o.o5) was close to the mean value of 0.31 (S.D.-Lo.o6) reported by Larson and Severinghaus 1962. The volume of thephysiological dead space in the resting subject was consi,!derably greater thanthe corresponding value for the anatomical dead spP:e, the mean alveolardead space amounting to 4o ml (S.E. - io ml) B.T.P.'i. Larson and Severing-haus i962 (184) reported a mean value of 41 ml (S.1). ±40 ml) B.T.P.S.for the alveolar dead space in a group of eleven subjects under the same
202
PULMONARY ;AS EXCIIANGFE
conditions as those employed in tlih present study. The ratio of the alveolardead space to the alveolar tidal volume which indicates the proportion ofventilated alveoli which are not perfused, was o.o8 (S.E. ±0.02).
Several investigators have provided evidence that gravitational fbrces mayinfluence the distribution of the pulmonary blood flow within tie lungs, Thusthe bronchospiromnetric studies of Mattson and Carlens 1955 (205) showedthat tile oxygen uptake in the dependent lobes of the lungs was greater thanin the upper and that this relationship could be reversed by reversing thegravitational relationship of the parts. They concluded that the hydrostaticforces acting upon the pulmonary circulation increased tile blood flowthrough the lower parts at the expense of the upper. Riley, Permutt, Said,Godfrey, Cheng, Howell and Shepard 1959 (246) concluded from tile in-crease in the physiological dead space which occurred on standing erectfromn the supine positior that iii the upright poiition approximately oneseventh of the total alveoli were not perfused. More recently the elegantstudies of West and l)ollery io6o (285) in which the clearance rate of radio-active carbon dioxide firom various regions of the lungs was measured withexternally placed counters, demonstrated that in the erect posture thepulmonary capillary blood flow decreases in a linear ianner froml tile baseto tile apex of the lungs where it is virtually zero. Thus the alveolar deadspace detected in the resting subjects in the present investigation was due tothe unevenness of the distribution of -se pulmonary blood flow in the lungsin the seated position.
Pressure breathing, both with and without trunk counterpressure, causeda marked increase in the volume of the physiological dead space (Table 5-11).The increase varied with the breathing pressure. A proportion of tile increaseof the physiological dead space was due to the concomitant enlargement ofthe anatomical dead space. The rise in the volume of the physiological deadspace was, however, considerably greater th;en that of the anatomical deadspace so that ii. the present investigation pressure breathing always inducedan increase of the alveolar dead space (Table 5-t I). The ratio of the alveolardead space volume to the alveolar tidal volume was increased during pressurebreathing, particularly at a positive pressure of 6o mmHg. Thus the prompor-tion of the non-perfused ventilated alveoli was markedly increased by thismanoeuvre. This change in the alveolar dead space could have beet) due toone of several different factors. The physiological dead space as defined inthis context is increased by an increase in the tidal volume. Thus Asmussenand Nielsen 1956 (to) found that the physiological dead space varieddirectly with the tidal volume when the pulmonary ventilation was increasedby exercise. Further, Gray, Grodins and Carter 1956 (126) showed that thisrelationship also held when the pulmonary ventlation was increased byadding carbon dioxide to the inspired gas. The increase in the volume of thephysiological dead space to be expected florm the observed increase in tidalvolume induced by pressure breathing was, however, less than io',',, of themeasured increase.
Severinghaus and Stupfel 1957 (262) determined in tile anaesthetizeddog the effect of changes of the end-expiratory lung volume upon tile physio-logical dead space. They found that when the tidal volume was kept constantthe volume of the physiological dead space was independent of the
203
S...... i

RAISED INTRAPUI.MONARY PRESSURE
end-expii atory lung volume. Since the anatomical dead space increased as tlelung volume was raised the alveolar dead space volume actually decreased asthe lung volume was raised. In the present experiments the increase inphysiological dead space persisted during pressure breathing when the lungdistension normally induced by this procedure was greatly reduced by theapplication of respiratory counterpressure. Further, in the limited number ofconditions studied the magnitude of the increase of physiological dead space,and more particularly of the alveolar dead space, appeared to be related moreclosely to the breathing pressure than to the degree of lung distension whichpressure breathing produced. Thus pressure breathing induced a very signifi-cant increase of the alveolar dead space which appeared to be independent ofany change in the mechanics ofrespiration which accompanied this manoeuvre.Folkow and Pappenheimer 1955 (1o8), using their iso-saturation ttchnique,demonstrated that pressure breathing at 15 mmHg with an oronasal maskalone caused an increase of both the series dead space (equivalent to theanatomical dead space) and of the parallel dead space (equivalent to alveolardead space).
These findings with regard to the increase of the volumes of the physio-logical dead space and of the alveolar dead space caused by pressure breath-ing could only be explained by postulating an increase of the proportion ofthe ventilated alveoli which were not perfused by blood. Since the analysisof the nitrogen clearance curves obtained during pressure breathing showedno evidence of any alteration in the distribution of inspired gas witbin thelungs this increase in the proportion of non-perfused alveoli was due primarilyto changes in the pulmonary circulation. The rise of intrathoracic pressureassociated with pressure breathing produces profound changes in the cardio-vascular system. At the beginning of pressure breathing there is a displace-ment of the blood from the thoracic and abdominal viscera into the periphery.This is accompanied by a fall of the effective pressure in the right atrium(Chapter 6), and by a reduction of the cardiac output (53) (23).
It is very probable, therefore, that the pressure in the pulmonary arterymeasured relative to the intra-alveolar pressure is reduced by pressurebreathing as is the systemic blood pressure in relation to the intra-alveolarpressure (Chapter 6). Thus the transmural pressures of the pulmonarycapillaries throughout the lung are lowered by this manoeuvre. In the seatedposture, therefore, the proportion of the apical alveoli which are not perfusedduring the cardiac cycle is increased, since the flow of blood through tilecapillaries of an alveolus depends upon the pressure within the capillariesexceeding that in the alveolus. The sensitivity of the distribution of the pul-monary capillary blood flow within the lungs to changes in cardiac output isillustrated by the very mild degree of exercise ruquired to abolish the unevendistribution of pulmonary blood flow seen in the resting erect subjcct (WVestand I)ollery, i96o) (285). Thus it is suggested that the reduction of cardiacoutput and fall of effective pulmonary artery pressure induced by pressurebreathing reduce the perfusion of the apices of the lungs and this causes theobserved increase in the volune of the alveolar dead space.
Since pressure breathing enlarges the physiological dead space the totalpulmonary ventilation must be increased during this manoeuvre if the samealveolar ventilation is to be maintained during pressure breathing as at rest.
204
............ -
PULMONARY GAS EXCIIANGE
The metabolic oxygen uptake is virtually uichanged bly prcssure breathingso that. the' maintenance of an alveolar ventilation equivalent to that at restwould ensure that the alveolar gas tensions remain unchanged. With tileobserved increase of the physiological dead space during breathing withoutrespirator\, counterpressure at a positive pressure of 2o mnitlg, ain increase ofabout i..3 litre/min. B.T.IP.S. in the pulnonary ventilation would be necessaryat a respiratory firequency of fourteen per minute to inaintain a normalalveolar ventilation. The corresponding increase in pulmonary ventilationrequired during breathing at a positive pressure of 6o mmHg with trunkcounterpressure would be approximately i.o litre/min. B.T.P.S. If anoronasal mask were used in place ofa pressure helmet during pressure breath-ing with trunk counterpres.ure a: 6o mmHg the total increase in physiologicaldead space would be about 0.3 litres B.T.P S. so that the pulmonary ventila-tion would have to be increased by over 4 litremnin. B.T.P.S. if the alveolarventilation was not to be reduced below normal.Alveolar Gas Tensions - The ltaldane-Priestley 1905 (137) technique ofdirect sampling of the alveolar gas by the performance of a fast, deep expira-tion has been subjected to some criticism of recent years. It has been claimed(Rahn, 1949) (24o) that it yields values for carbon dioxide tension which areslightly higher than the true mean alveolar tension of this gas. As Bannister,Cunningham, and Douglas 1954 (i .) have pointed out, however, thesample must be delivered very rapidly and Bannister el ed 1954 (14) quoteexperimental evidence in support of the conclusion that there is no significantdifference between the carbon dioxide tension given by the end-expiratoryIalda ne-Priestley sample and that of the arterial blood sampled under thesame conditions. In the present investigation, therefore, the end-expiratoryHaldane-Priestley sample was used to follow the composition of the alveolargas. The four subjects used for this part of the study were experienced in theperformance of this technique. This method of sampling the alveolar gas hasthe disadvantage, however, that the breathing pattern is interrupted whenevera sample is given. The gas leaving the respiratory tract at the end of a normalexpiration has been taken as being representative of the alveolar gas bynumerous investigators. End-tidal sampling using the Rahn-Otis 1949 (242)apparatus has been used extensively and several comparisons have been madebetween the end-expiratory carbon dioxide tension given by this method andthe carbon dioxide tension of the arterial blood determined simultaneously(273) (259).
These comparisons have shown that there is no significant differencebetween simultaneously measured end-tidal and arterial carbon dioxidetensions. Lambertsen and his colleagues (Lambertsen, Smyth, Semple andGelfand 1958 (179); Lambertsen and Benjamin 1959 (178) have performedextensive comparisons between the end-expiratory carbon dioxide tensionand the simultaneous arterial carbon dioxide tension. They found excellentagreement between these two measurements when the tidal volume exceededo.6 litre. When, hloý ever, the tidal volume was as low as 0.36 litres they foundthat the end-tidal carbon dioxide tension was 2.9 mmHg less than that of thearterial blood. This discrepancy was due to the failure of the small tidalvolume to wash out the dead space during expiration. Thus the carbondioxide tension of the gas leaving the respiratory tract at the end of expiration
205
I• . . . . . .

RAISED INTRAPU'ILMONARY PRESSURE
is equal to the arterial carbon dioxide tension, provided that the tidal volumeis at least o.6 litrc. This requirement was fulfilled in virtually all the presentexperiments, The agreement between the values of carbon dioxide tensionro,,iieid by c'ld-txpi• aan y IlI'dane-Pr6rstlev ýampnip'g a;lU by the determi-nation of the end-tidal carbon dioxide tension from a continuous recordwhich was found in the present series of experiments confirmed the value ofboth these techniques as a measure of the alveolar carbon dioxide tension.
The reduction of the alveolar carbon dioxide tension induced by pressurebreathing confirmed the conclusions drawn from the measurements of therespiratory gas exchange discussed earlier in this chapter. Although there wasa considerable variation in the response of different subjects to the sameintensity of pressure breathing this manoeuvre always produced a reductionof the alveolar carbon dioxide tension. Since in these experiments there wasno change in the absolute press, re within the respiratory tract with theinduction of pressure breathing, t ie changes observed must have been due tothe effect of pressure breathing up.)n the gaseous exchange between the bloodand the environment. As has been seen the carbon dioxide output in theexpired gas was actually increased during pressure breathing so that the fallof alveolar carbon dioxide tension must have been due to an overall hyper-ventilation of the lungs. Further evidence for this increase of alveolar ventila-tion in pressure breathing was obtained by calculating the alveolar respiratoryexchange ratio for each of the disci ete samuples of alveolar gas.
The alveolar respiratory exchange ratio was calculated from the tensionsof carbon dioxide and oxygen in each Haldane-Priestley sample using thefollowing form of alveolar air equation I03) (245):
PACo2 (I - F 10 2 )P10 2 - PAO2 - F1o2 X PA('o2
RI respiratory exchange ratioFio, = fractional concentration of oxygen in the inspired gasPi., partial pressure of oxygen in the moist inspired gasPAot =partial pressure of oxygen in the alveolar gasPACO, partial pressure of carbon dioxide in the alveolar gas.
The time course of the mean alveolar respiratory exchange ratio in each ofthe three pressure breathing conditions investigated is presented in Table 5-12.The alveolar exchange ratio was increased above the resting value duringpressure breathing, the greatest increase occurring at the beginning of theexposure. The ratio declined slowly during the exposure, but it did not regainthe control value.
Immediately after the cessation of pressure breathing the alveolar exchangeratio fell below the control value and then increased towards the resting level.The changes of the alveolar exchange ratio offered further evidence, there-fore, that pressure breathing induced a true hyperventilation with removal ofcarbon dioxide from the body stores of this gas. These results demonstrated ingreater detail the course of this hyperventilation than did the mean values ofthe expired respiratory exchange ratio obtained during the stud)y of the totalgaseous exchange in pressure breathing. Thus, although during the exposureto pressure breathing the pulmonary ventilation generally declined after theinitial increase the alveolar respiratory exchange ratio declined only slowly
2o6
•-.I
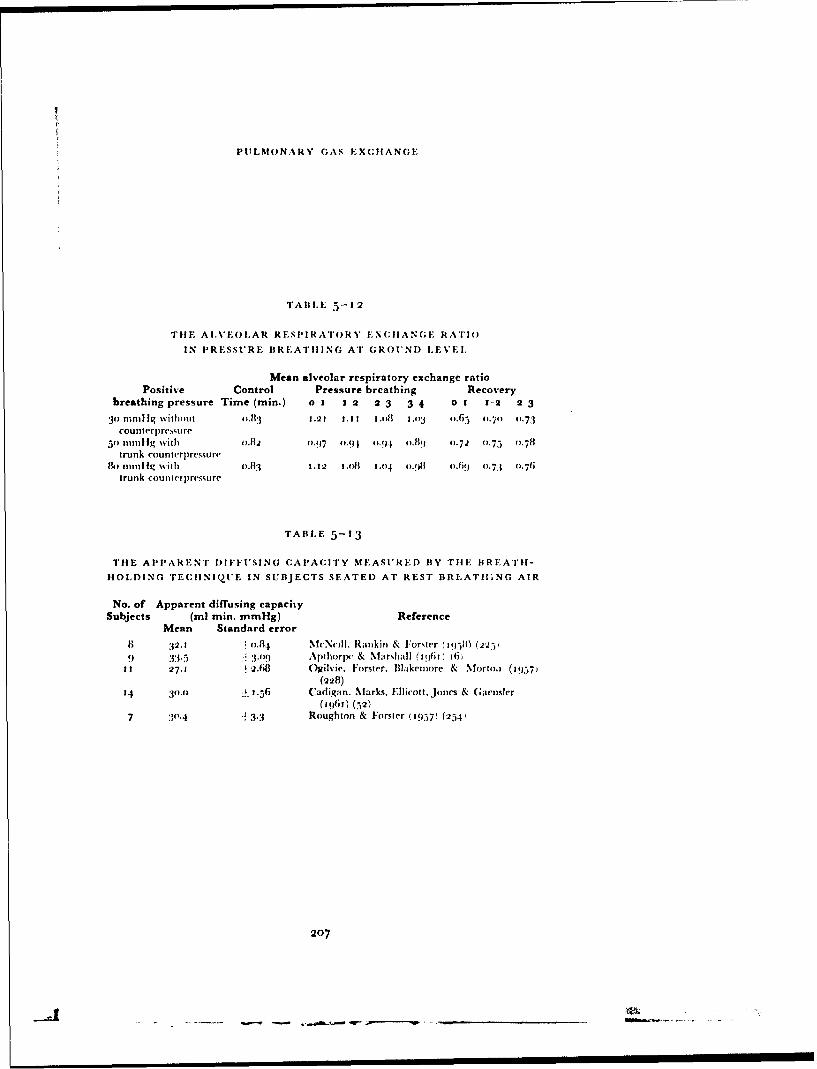
PULMONARY GAS EXCIIANGE
TAIILE 5-12
TIHE AI.VEOLAR RESPIRATORY EXCHANGE RATIO
IN PRESSURE BREATIIING AT GROUND LEVEL.
Mean alveolar respiratory exchange ratioPositive Control Pressure breathing Recovery
breathing pressure Time (min.) 0 1 I 2 2 3 3 4 0 1 1-2 2 3
3) Inin)lIg \hith ut o.1. 1.2 I I.. .1I 1. ll o3 ".65 0.70 0.73counterpressure
5o mm1ig with o.12 0.97 0.94 0.94 0-.8) 0-.72 0.75 0-.78trunk counterpressure
11o 1t11i1 Iq with o.13.13 3.32 1 .oi 1o.04 o.!8 .o9 o.71 0.76trunk counlerpressure
TABLE 5-13
THE APPARENT DIFFUSING CAPACITY MEASURED BY Till BREATII-
HOLDING TECHINIQtUE IN SUBJECTS SEATED AT REST BREATII.NG AIR
No. of Apparent diffusing capacitySubjects (ml min. mmHg) Reference
Mean Standard error
8 32.1 o-.84 MeNcilI. Rankin & Forster ('q5( (2-251
9 33.5 3.-09 Apthorpc & Marshall (3963 16)3t 27.31 2.68 Ogilvie. Forster, Wlakemore & NMorto. (1957)
(228)
14 3o.o 1 -.56 Cadigan, Marks. Ellicott. Jones & (;aensler
(1961) (52)7 30.4 " 3.3 Roughton & Forster ('957) (25.-1
207
ri _________________
RAISED INTRAP'U'LMONARY PRESSI'RE
and did not return to the control value during the pressure breathing periodin any of the experiments. Throughout the pressure bi esthing period, there-fore, the sizes of the various gas stores of the body were undergoing continual
change. The studies of the changes in the gas stores during hyperventilationperformed by Farhi and Rahn 1955 (ioo) suggests that most of the increasein the respiratory exchange ratio dering pressure breathing was due to
.emova! of carbon dioxide from the body store.Pressure breathing without counterpressure at a positive pressure of
30 mmHg produced the greatest reduction of the alveolar carbon dioxidetension of the three conditions of pressure breathing studied in this investiga-
tion. Breathing at positive pressu.-es of 5o and 8o rnmHg with trunk counter-pressure reduced the -lveolar carbon dioxide tension to a small degree, the
magnitude of the reduct!on being proportional to the breathing pressure.These findings confirmed the conchlsions drawn earlier in thi.s discussion that,even with the full trunk counterprussure afforded by the pressure jerkin,
pressure breathing induced a true hyperventilation in iUwjccts xwho had con-siderable experience of this manoeuvre. The reduction of the arterial carbondioxide tension produced by pressure breathing was of significance since
hypocapnia induces important changes in the cardiovascular system, such asthe redistribution of the s -stemic blood flow and in the central nervous svsteri.These effects are discussed latcr h, this chapter and in Chapter 6.Diffusing Capacity of the Lungs - The measurement of the apparentdiffusing capacity of the lungs by the breath-holding technique originallydeveloped by Krogh and Krogh 191o (174) and by Krogh 1o15 (176) andmodified by Forster, Fowler, Bates and Van Lingen 1954 (iog) has been
used by many investigators to study the effects of various environnv.ntalchanges and disease processes upon the exchange of gas between the alveolargas and the blood flowing through the alveolar capillaries. This methodusing carbon monoxide was chosen in the present study since the duration ofthe actual experimental determination is relatively short; it does not require
a steady state of respiratory gas exchange and it miaN be performed in theresting subject. The values obtained for tile pulmonary diffusing capacity of
resting healthy subjects do, however, vary froom one laboratory to another.This difficulty appears to be related primarily to the deficiencies of presentmethods of determining the absolute concentration of carbon monoxide inrespiratory gas mixtures (68).
In the present study repeated checks of the linearity of the infifa-red carbonmonoxide analyzer were made. Further, in this investigation direct com-
parisons were made between the diffusing capacity under various environ-mental conditions in the same subject. Errors in the estimation of theabsolute as opposed to the relative concentration of carbon monoxide, would
have, however, resulted in errors in the estimated values for the diffusingcapacity of the pulmonary membrane and the pulnonary capillary bloodvolume. The mean value of the pulmonary-diffusing capacity of the resting
subjects at an alveolar oxygen tension of 95 to 115 mmHg obtained in thepresent study was 31.7 ml per minute per mmHg. It may be seen froom"I able 5-13 that this mean value agrees well with the values obtained insimilar circumstances by other investigators using this technique. Thus itwould appear that the details of the procedure employed for the measurement
208
AO *.

PUI.MONARY GAS EXCIHANGE
of the pulmonary diffusing capacity in the present study were reasonablysatisfactory. The reproducibility of the measurement in a given subject underthe same conditions was also acceptable.
"The results of the measurements of the apparent diffusing capacity per-formed upon three subjects demonstrated that pressure breathing caused aconsistent reduction of the diffusing capacity at a given alveolar oxygentension (Table 5-7). Ogilvie, Forster, Blakemore and Morton 1957 (228)
found that a rise in the "iit,.•iuiary piessure dr ing the period of breath-hold reduced the apparent diffusing capacity in two out of three subjects. Themaxin-tim reduction of diffusing capacity of I7",, was produced by a positiveintrapulnonary pressure of 44 mml-g. A tendency for thc diffusiiig capacityto be reduced by continuous pressure breathing at j5 mnilHg was reported byCadigan, Marks, Ellicott, Jones and Gaensler jo61 (52) although in theirexperimen ts the alveolar volume during the determination of tLe diffusingcapacity was great,," increased by pressure breathing. In the present experi-ments wh.ere the diffusing capacity was not measurced until the subject hadbeen pressure breathing for at least one minute and the alveolar volume wasvirtually constant it was found that the effects of' pressure breathing weremore consistent and more profound.
The various factors which can influence the magnitude of the apparentdiffusing capacity as measured by the breath-holding technique have beeninvestigated in detail 1b Ogilvie, Forster, Blakemorc and Morton 1957 (228),Forster, Rougghton, Cander, Briscoe and Kreuzer 1957 (1 to) and Cadigan,Mlarks, Ellicott, Jones and Gaenslcr io6r (52). Krogh 1915 (i76) usingher original technique reported that the diffusing capacity of tie lungsincreased in proportion to the alveolar volume above the mid-capacity.Although Ogilvie, Forster, Blakemore and Morton 1957 (228) "vere unableto demonstrate this effect, Marks, Cugell, Cadigan and Gaensler 1957 (201)
confirmed Krogh's original observations. Cadigan, Marks, Ellicott,Jones andGaensler 1(q61 (52) studied the effect of variations of alveolar volume in alarge group of subjects and found that the diffusing capacity was relatedlinearly to alveolar volume over the range from functional residual capacityto almost full lung capacity. At very high volumes the diffusing capacity wasincreased disproportionately. The regression coefficient of diffusing capacityupon lung volume was approximately 4.2 units of diffusing capacity per litreof alveolar volume.
Inspection of Table 5-8 shows that the alveolar volume was gene, allyslightly greater during the measurement of the diffusing capacity in pressurebreathing than when the measurement was made at rest. The largest increasein the alveolar volume during breath-holding was associated with a positivebreathing pressure of8o mmHg. The mean increase in this situation amountedto o.51 iitre B.T.P.S. On the basis of the data of Cadigin, Marks, Ellicott,Jones and Gaensler t(61 (52) this increase of alveolar volume of itself wouldLave increased the apparent diffusing capacity by about 2.1 ml ptr minuteper mmHg, whereas in fact breathing at a positive pressure of 8o mmHginduced a mean decrease of diffusing capacity of 9.7 ml per minute permmHg.
The duration of the breath hold has been shown to influence the valueobtained for the pulmonary diffusing capacity (ioq). A breath-holding period
20()

RAISED INTRAPULMONARY PRESSURE
of ten seconds was used in the present study, and the variation fiom this didnot exceed -4- 1.9 second. The duration of both the period of inspiration of thecarbon monoxide-helium mixtui e and of sample collection aft'. ct the finalalveolar concentration of carbon monoxide (165). The method of allowino,for these effects suggested by Jones and Meade (165) was employed in thepresent study. The durations of inspiration and of the delivery of the alveolarsimplc were similar in the resting and pressure breathing periods.
The influence of changes of pulmonary ventilation and cardiac output"upon the diffusing capacity are of interest since pressure breathing producedhyperventilation and a reduction of the cardiac output. ()gilvie, Forster,Blakemore and Morton 1957 (228) and Ross, Frayser and Hickhai 195a(g52) have investigated the effect of hypeo.-'ntilation upon the diffusingcapacity as measured by the modified Krogh breath-holding technic ue. Aconsiderable degree of hyperventilation amounting to a trebling of the restingpulmonary ventilation had no effect upon the value of the diffusing ,apacityin resting subjects. Ross, Frayser and Hickham 1959 (252) also demonstratedthat a doubling of the resting cardiac output by tile intravenous infusion ofadrenaline, noradrenaline or atropine or by re-active hyperaeinia in thelower limbs had no significant effect upon the difftising capacity. 'l'urino,Brandfonbrener and Fishman 1959 (277) reduced the blood flow to onelung in supine subjects by partial occlusion of one branch of the pulmonaryartery. They found that the diffusing capacity of the lung was not reduceduntil the blood flow was decreased to less than half tile control value. Rosen-berg and Forster 196o (251) studied the effects of pulnmooary blood flowupon the diffusing capacity in isolated cat lungs. They fbund that, providedthe pressure across tht! walls of the pulmonary vessels was unchanged, thediffusing capacity was constant over a wide range of pulmonary blood flows.Thus it would appear that the reduction of the diffusing -,apacity of !he lungsinduced by pressure breathing was not to be explained by either the hyper-ventilation or the reduction of pulmonary blood flow which were also pro-duced by this manoeuvre.
The analysis of the apparent diffusing capacity into its two components,the diffusing capacity of the pulmonary membrane and tile rate of uptake ofcarbon monoxide in the pulmonary capillary blood as developed by Roughtonand Forster 1957 (254) was used in order to analyze the changes underlyingthe observed reduction of the apparent diffusing capacity in pressure breath-ing. Implicit in this theoretical analysis is the assumption that there is uniformdistribution of diffusing capacity and capillary blood volume in relation toalveolar volume. Experimental evidence obtained by Forster, Fowler, Batesand Van Lingen 1954 (io9) suggested that in normal resting subjects thisassumption is not precisely true and tile results of the measurements of theanatomical and physiological dead space in pressure breathing suggest thatthis manoeuvre causes an alteration in the distribution of the pulmonarycapillary blood flow to ventilated alveoli. In the analysis of the presentexperimental data, however, the basic assumption male by Roughton andForster 1957 (254) was adopted as it was considered that tile error intro-duced by so doing would be small. The plot of the reciprocal of the apparentdiffusing capacity against the reciprocal of the rate of upcake o•l' carbonmonoxide by the pulmonary capillary blood at the corresp)onding nican
210

PULMONARY GAS EXCIIANGE
capillary oxygen tensions fin- each subject in each experimental situation wasfound to be virtually linear. The linearity of' these plots showed that the con-ditions produced by exposure to a given level of' pressure breathing werereproducible since each point was obtained in a separate exposure to pressurebreathing.
The absolute values obtained for the diffusing capacity of the pulmonarymembrane and for the pulmonairy capillary blood volurne firom the data fbrthe apparent diffusirg capacity at various mean pulmonary capillary oxygentensions were determined by the relationship between 0 and the mean pul-monary capillary oxygen tension used in the calculations. The relationshipbetween 8 anri tile oxygen tension in tile plasma surrounding the red cells isdetermined by the ratio of the permeability of the red cell membrane to thepermeability of the red cell interior for oxygen (A). In the original descriptionof this technique Roughton and Forster 1957 (254) used values of 0 corre-sponding to two extremes of'red cell membrane permeability (A 1.5 , A ot)and then they averaged the values of the diffusing capacity of the pulmonaryneinbrane and the pulmonary capillary blood 1 volurne so obtained. Theyshowed that thie %alues obtained for tilhe pu!mnonarv capillary blood volumewere relatively insensitive to the value of A employed. '11e values obtained forthe diffusing capacity of the iplJronary membrane weme, however, sensitiveto the chosen value of' the red cell membrane permeability. In the presentinvestigation the procedure devised by McNeill, Rankin and Forster 1958(225) of using an average value of red cell permeability A 2.5, wasadopted. Although this assumption may have affected the calculatedabsolute values of the diffii.ing napacity of' the pulmonary me'mibrane and tlecapillary blood volumie, it did not affect their relative values.
The results of the analysis of the apparent diffusing capacity into its com-ponents demonstrated that pressure breathing did not change the diffusingcapacity o. the pulmonary membrane (Table 5--8). The reduction in theapparent diffusing capacity of tile lungs was due to a decrease in the rate ofthie uptake of carbon mnonoxide by the red cells in the pulmonary capillaries.The rate of uptake of carbon monoxide by unit volumne of blood is dir':ctlyproportional to the concentration of haemoglobin in it (254). Thus tilecalculated reduction in the rate of uptake of carbon monoxide by the redcells in the pulmonary capillaries produced by pressure breathing could havebeen due to a reduction of' either the pulmonary capillary blood volune or ofthe concentration of' haemnoglobin in it. Pressure breathing would havc toproduce a very large decrease approximately 5o",,) in the haematocrit of thepulmonary capillary blood in order for this change to account for the observedchange in the diffusing capacity. In fact the haematocrit of the venous andsystemic arterial blood is increased by pressure breathing (146).
It may lbe concluded, theref'ore, that tile reduction of the diffusing calacityproduced by pressure breathing was due to a reduction of tile volume ofblood in the pulmonary capillaries. The pulmonary capillary blood volumeduring pressure breathing varied inversely with the magnitude of the breath-
ing pressure A'l'ale 5 -8. In the previous chapter spirom(etric and radiologicalevidence was presented which suggested that at least a fraction of tile bloodwhich was displaced from the trunk into the limbs by pressure breathingoriginated in the lungs. Although the pulmonary capillary blood volume
211
kAISED INTRAPI'LMONARY PRESSURE
forms only a small fi-action of the total volume of blood contained within thethorax it probably shared in this gcneral shift of blood from the viscera tothe limbs. Such an association has been demonstrated to occur duringchanges in posture and during the Muller manoeuvre. Thus the reductionof the diffusing capacity associated with changing from the supine to the erectposture (Bates and Pearce 1956) (26) has been shown to be due to a reductionof the pulmonary capillary blood volume (185). Such a change of pe:'ture isknown to produce a marked shirt of blood from the heart and lungs into thelower limbs (270). Cotes, Snidal and Shepard i96o (6o) found that, in onesubject, a reduction of the alveolar l)T.s1ure to 24 mmHg below that of theenvironment during the period of breath-holding increvaied the pulmonarycapillary blood volume at rest 1rom 73 to 132 nil. Negative pressure breathingis known to increase the I)lood content of the lungs. Central venous engorge-ment produced by the inflation of a bladder around the lower halfofrthe bodyals'• resulted in an increase in the pulmonary capillary blood volume (25'3).Thus there is considerable evidence that the blood in the pulmonary capil-laries participates in any general shift of blood out of or into the thoax. Itmay be concluded, therefore, that the reduction of pulmonary capillar'y !Aloodvolume produced by pressure breathing was a part of the general ,hift ofblood from the central part of the circulation which was induced by this pro-cedure.Alveolar Gas Tension at Reduced Environmental Pressure - Samplingof the alvcolar gas following rapid decompression to a low pressure was per-formed with fbur different combinations of final environmental pressure andpositive breathing pressure so that the absolute intrapuhlnonary pressuremaintained fbllowing the decompression also varied with the positive breath-ing pressure (,Fig. 5-15). Further, whilst in three of these conditions trunkcounterpressure was used, no respiratory counterpressure was applied at apositive pressure of 3V mmHg, the lowest breathing pressure studied. Theseparticular conditions were chosen since they represented certain pressurebreathing systems which had been used, or were proposed for use in highaltitude aircraft. Thus a system based up(.n a positive breathing press,,re of30 mmHg at an altitude of 5oooo ft (barometric pressure - - 87 mmHg) andusing no respiratory counterpressure was in current use in the Royal AirForce, whilst the system maintaining an absolute intrapulnonary pressureof 141 mmHg as was provided by a breathing pressure of 8o mmHg at asimulated altitude Of5 7500 ft was considered adequate to prevent significanthypoxic effects upon the central nervous system.
The time course oo" the changes of the alveolar carbon dioxide tensionobtained d(uring pressure breathing following rapid decompression differedmarkedlyv fiom the course of the changes found during pressure breathingunder comparable conditions at ground level. l)uring pressure breathing atground lev-dl Fig. 5--8) the carbon dioxide tension fell progressively, thechange being rapid at first and then slower. When pressure breathing wasinduced by a rapid decompression to simulated high altitude the alveolarcarbon dioxide tension was lowest immediately after the decompression andit increase(] during the exposure, rapidly at first and then more slowly (Figs.5-1 1 and 5- 2). AlhhIough the values of the alveolar carbon dioxide tensionimmediately after the decompression were similar in the four diffierent
212
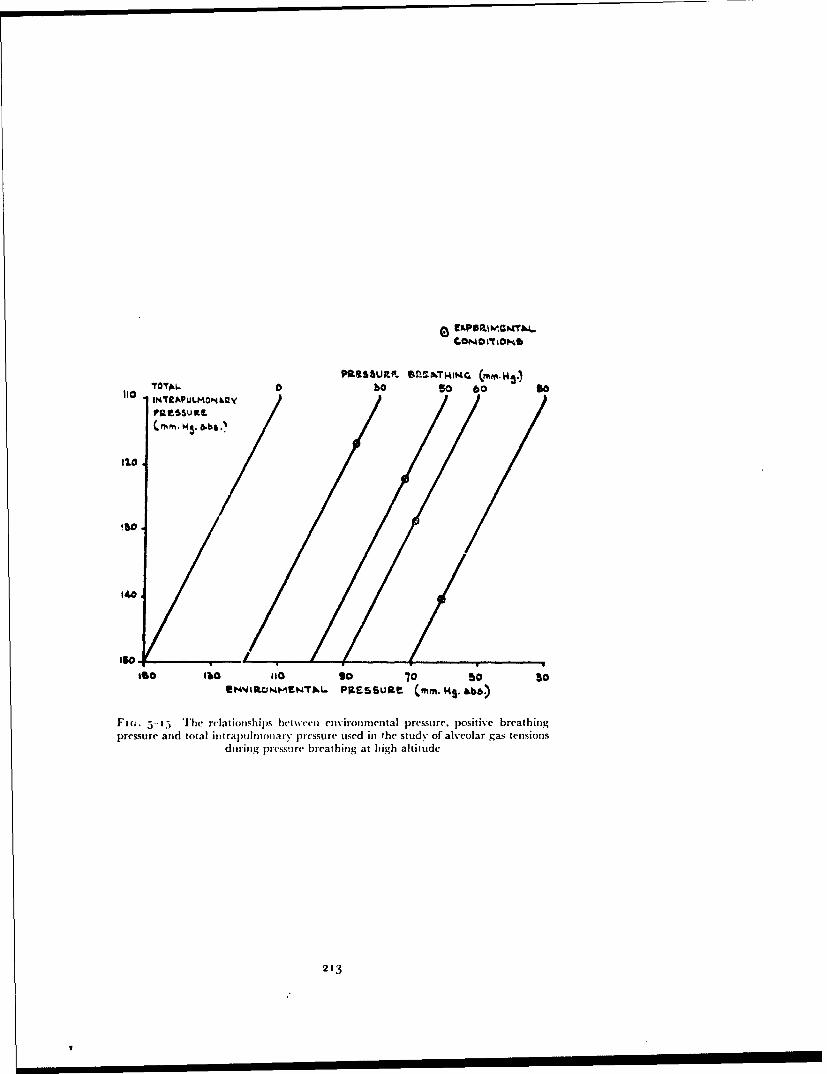
*roTAL. Pf!S oJ9 u SoM~c (mo 14g
a ssso 60/
!6.0
140
ISO I1O '10 90 "0 10S'. OthJMFN'IL. PiESSURE (mm. M4s. ab.•)
Fi;. 5-1 Tihe rflatiouihil)s between environmental pressure, positive breathingpressure and total intrapull•onary pressure used in the study of alveolar gas tensions
during pressure breathing at high altitude
213

RAISED INTRAP'ULIMONARY P'RES•UiR-E
pressure breathing conditions studied, the rate at which the carbon dihxid,.tension increased during the exposure varied with the experimental con-dition. When oxygen was breathed at the pressure of the environment(Fig. 5-13) the alveolar carbon dioxide tension immediately after the de-compression was reduced to between 17 and 2o mmHg, which was verysimilar to the range of values obtained when the pressure breathing wasinduced following rapid decompression. Subsequently, the alveolar carbondioxide tension rose more rapidly than in the pressure breathing experiments.The values of the carbon dioxide and oxygen tensions obtained after breathingtoo",, oxygen for one and a half to two minutes at the various absolutepressures used in this study are plotted in Fig. 5-t6 together with the corre-sponding values obtained after one and a half to two minutes exposure topressure breathing. The carbon dioxide tensions in the alveolar gas whenoxygen was breathed at the pressure of the environment were uniformlygreater than those found when pressure breathing was performed at the sameabsolute intrapulmonary pressure.
The sudden reduction of the alveolar carbon dioxide tension whichoccurred with the rapid decompression from a simulated altitude of 25ooo ftwas a direct effect of the reduction of the absolute intrapulmnonary pressureproduced by the fall of environmental pressure f.iq6) (95).. As the environ-mental pressure fell during the rapid decompression th! alveolar gasexpanded, increasing the lung volume and passing through the mouth andnose to the environment until the absolute pressure within the re.,piratorytract equalled that delivered by the pressure demand oxygen regulator (99).In the present experiments where the duration of the decompression wasapproximately two seconds the time course of the absolute intrapulnonarypressure was very similar to that of the environmental pressure until theabsolute pressure equalled that delivered by the oxygen regulator at whichlevel the intrapulmonary pressure was maintained until recompressionoccurred (Ernsting, unpublished observation). The partial pressures of thealveolar gases were reduced as the total intrapulmonary pressure fell. Sincethe alveolar lining is moist and the hlngs together with the blood flowingthrough them have a high heat capacity the expansion of alveolar gas underthese conditions of decompression was probably isothermal so that at the endof the decompression the alveolar gas was fully saturated with water vapourat body temperature. When the assumption that no gaseous exchangeoccurred between the alveolar gas and the blood flowing through the pul-monary capillaries during the decompression was made, it was possible tocalculate the expected tensions of alveolar gases immediately after the de-compression from the corresponding gas tensions which existed before de-compression and the initial and final absolute intrapulmonary pressures usingthe relationship:
p (6~ .. 47) ,¢pý.S-(Pý 47) "
PA, alveolar tension of gas X before decompressionP•.ý, alveolar tension of gas X immediately after decompressionPý -:total intrapulmonary pressure before decompression (mmHgnP; total intrapulmonary pressure after decompression (mmHg).
214

pp4
~~0
"" ou PuVo2
40S
0A
6Oa÷B
10 J# A
ICOI0, a1 lb 14 IS'
ý00
ImItN~pU)m0KW~ POES~Ua (mm.14s.&bs.)
Fm-. 5-1i6 The relationship between alveolar gas tensions and absolute intrapul-nionary pressure whilst breathimi oxygen at the environmental pressure (solid line)
and during pressure breathing (interrupted line)
215
I1s- I -
RAISED INTRAPULMONARY PRESSURE
Such calculations have been made using the mean values of the alveolargas tensions obtained before decompression at a simulated altittde of25ooo ft and the highest and lowest intrapulmonary pressures studied in thisinvestigation (Table 5-14). The carbon dioxide tensions in the alveolarsamples obtained two to five seconds after decompression in the present seriesof experiments were, however, not as low as the values calculated in Table5-14. The assumption that no gaseous exchange occurred between thepulmonary capillary blood and the alveolar gas during the decompressionwas not strictly true. In fact as the alveolar carbon dioxide tension flIll duringthe decompression tl;c carbon dioxide tension gradien: between the mixedvenous blood and the alveolar gas rose progressively so that the rate at whichcarbon dioxide passed from the blood into the alveolar space was increased.Since the carbon dioxide tension of the mixed venous blood does niot changeuntil about twelve rcconds after a sudden reduction of the arterial carbondioxide tension Ernsting (i963) (93) the mixed venous-alveolar carbondioxide tension gradient was increased to about five times the resting valueimmediately after the decompression. The rate of exchange of carbon dioxidebetween the pulmonary capillary blood and the alveolar gas is so rapid thateven with the greatly increased carbon dioxide tension gradient at the begin-ning of the pulmonary capillaries there was probably almost completeequilibrium between the carbon dioxide tension of the blood leaving thepulmonary capillaries and that of the alveolar gas. This mechanism issupported by the detailed studies of the behaviour of the alveolar carbondioxide tension and arterial pH during and following rapid decompressionover a larger pressure range performed by Ernsting and McHardy 1q62 (16).The pH of the arterial blood was recorded continuously and the measuredchanges of pH produced by rapid decompression from 56o to 140 mmHgabsolute in 1.5 sec. were consistent with those predicted from the change ofthe alveolar carbon dioxide tension assuming that the end pulmonarycapillary carbon dioxide tension equalled that of the alveolar gas. The veryrapid passage of carbon dioxide into the alveolar gas reduced the fall of thetension of this gas during the decompression and brought about the rapidrise of carbon dioxide tension after the decompression.
The composition of the alveolar gas following rapid decompression whenoxygen was breathed throughout the exposure at the pressure of the environ-ment (Fig. 5-13) reflected the interaction of several factors. The alveolartension of carbon dioxide was reduced by tile rapid decompression and thenit rose progressively to reach a level which was related to the absolute intra-pulmonary pressure (Fig. 5-16). As the alveolar carbon dioxide tension in-creased in any given exposure the corresponding alveolar oxygen tensiondecreased since the sum of the partial pressures of these two gases was con-stant. The level of the alveolar oxygen tension over the whole range ofintrapulmonary pressures was such that it constituted a stimulus to anincrease of pulmonary ventilation at the resting subject (42) (242). Thealveolar oxygen and carbon dioxide tensions obtained at the various absoluteintrapulmonary pressures used both decreased as the total pressure wasreduced. The relationships between the alveolar carbon dioxide and oxygentensions which were operative two minutes after the decompression weresimilar to those obtained after considerably longer periods of breathing air at
216
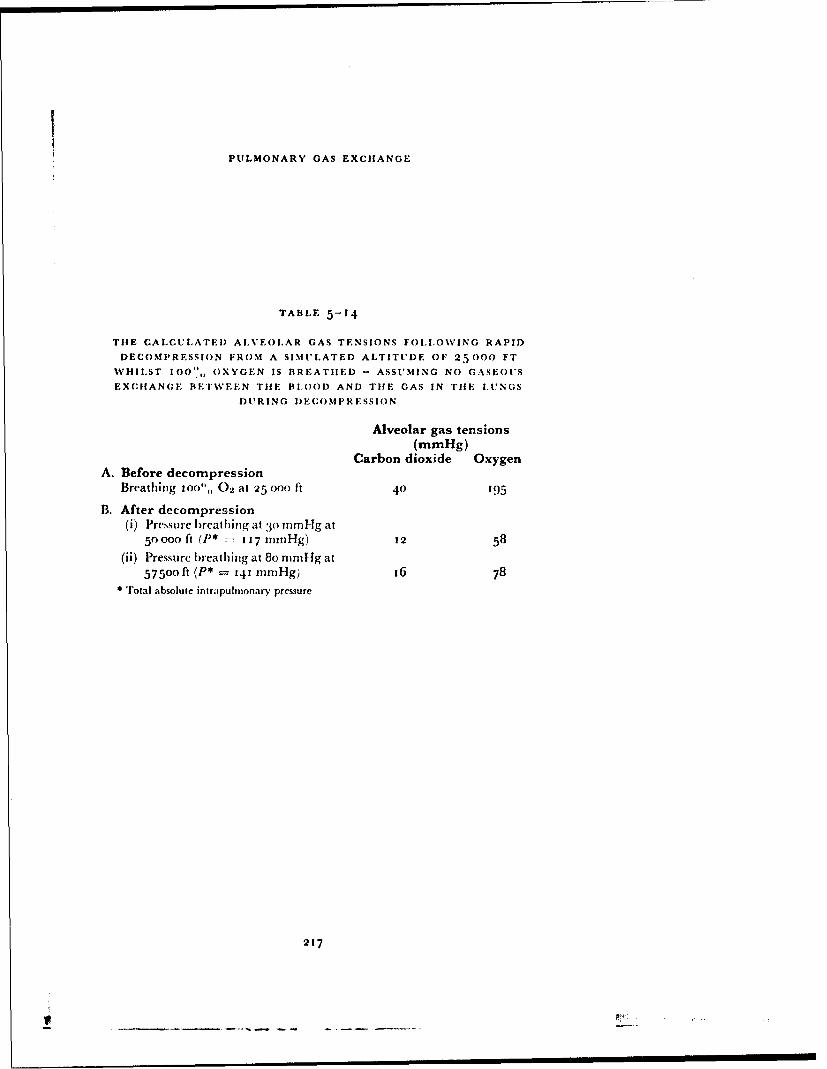
PULMONARY GAS EXCHANGE
TABLE 5-14
THE CALCULATED ALVEOLAR GAS TENSIONS FOLLOWING RAPID
DECOMPRESSION FROM A SIMULATED ALTITUDE OF 25000 FT
WHILST 100', OXYGEN IS BREATHED - ASSUMING NO GASEOUS
EXCHANGE BETWVEEN THE BLOOD AND TIHE GAS IN TIlE LUNGS
DURING DECOMPRESSION
Alveolar gas tensions(mmHg)
Carbon dioxide OxygenA. Before decompression
Breathing 1OO",, 02 at 25 000 ft 40 195
B. After decompression(i) Pressure l)reathing at 30o nmHg at
50000 ft (P* -7 117 nuniHg) 12 58
(ii) Pressure breathing at 8o rnitIg at57500 ft (P* = 141 mmHg) 16 78
* Total absolute intrapulnionary pressure
217
V ___! ___ I I

RAISED INTRAPULMONARY PRESSURE
reduced barometric pressure (40). Thus the values of the alveolar tensions ofoxgyen and carbon dioxide obtained aftcr two minutes exposure to reducedpressure appeared to be the result principally of the interaction between thehypoxic drive to ventilation of the low alveolar oxygen tension and thereduction of the normal carbon dioxide drive to ventilation. Even after thistime, however, although the rates of change of the alveo!ar gas tensions weremarkedly reduced the gas stores of the body, particularly the carbon dioxidestore, were far from an equilibrium state (too). It is impossible, therefore, tostate with certainty the relative contributions of the various factors controllingthe pulmonary ventilation in these circumstances.
It has been seen that the mean alveolar carbon dioxide tension at a givenabsolute intrapulmonary pressure two minutes after decompression wasconsiderably less in the pressure breathing experiments than when oxygenwas breathed at the pressure of the environment (Fig. 5-16). Since theabsolute intrapulmonary pressures after decompression were strictly com-parable, the reduction of the alveolar carbon dioxide tension produced by thedecompression must have been similar in the two conditions. The slower rateof increase of alveolar carbon dioxide tension after decompression in thepressure breathing experiments must have been due to a greater alveolarventilation and perhaps a lower pulmonary capillary blood flow duringpressure breathing than when oxygen was breathed at the pressure of theenvironment. It was seen earlier in this chapter that pressure breathing atground level with a normal alveolar oxygen tension produced a true alveolarhyperventilation. Further, the pulmonary ventilation associated with pressurebreathing at reduced barometric pressure was found to be greater than theventilation produced by pressure breathing at the same pressure at groundlevel (Table 5-)). The lowest alveolar carbon dioxide tension found in thepresent study was produced by pressure breathing at a positive pressure of30 mmHg without respiratory counterpressure at a simulated altitude of50000 ft which gave an intrapulmonary piessure of 117 mmHg absolute.Pressure breathing at this level without counterpressure produced a verymarked increase of pulmonary ventilation, even at ground level and in spiteof the very low alveolar carbon dioxide tension the alveolar oxygen tensionwas the lowest encountered during pressure breathing. In the other threeconditions, in which trunk counterpressure was employed, tihe absoluteintrapulmonary pressure was increased as the positive breathing pressure wasincreased (Fig. 5-15). The increase of the absolute intrapulmonary pressurecaused a corresponding rise of the alveolar oxygen tension.
The most important finding obtained from the analysis of the alveolar gassamples obtained during pressure breathing at reduced environmentalpressures was the low tension of carbon dioxide in the alveolar gas under theseconditions. As a direct result of this reduction of the alveolar carbon dioxidetension below the normal level, the alveolar oxygen tension was raised. Fur-ther, since tihe pH of the blood flowing through the pulmonary capillaries wasincreased by the reduction of the alveolar carbon dioxide tension and by thereduction of the oxygen saturation of the blood (61) the roncc-tration ofoxygen in the arterial blood at a given oxygen tensiov was also raised. Inaddition, the reduced arterial carbon dioxide tension will have had importanteffects upon the cardiovascular system, in particular tht cerebral circulation.
2n8
p .-- ... ,- - a-, . .. -. -. . . . ...... .

PULMONARY GAS EXCHANGE
Arteri]l Wlood Gas Teitsions - The efficiency with which these pressurebreathing systems preveted hypoxia at low environmetatal pressures wasassessed finally by determining the composition of the arterial blood underthese conditions. All the mneasurements were made following rapid decom-pression to a simulated altitude of 56ooo ft (PI, = 65.7 mmHg). The totalpressure of the arterial gases during pressure breathing at a pressure of 6o-ommHg at this simulated altitude was considerably greater than the environ-mental pressure, so that under these conditions bubbles were expected inarterial blood withdrawn by the usual techniqie. Ar ,::•pcrii.icid ai v, hicn atechnical failure occurred and the arterial blood sample was taken at thepressure of the environment confirmed this prediction. The technique wherebythe sampled arterial blood was maintained at an absolute pressure of greaterthan 141 mmHg (Fig. 5-14) was developed to avoid the errors which couldarise from the formation of discrete gas bubbles in a blood sample beforeanalysis. Preliminary experiments demonstrated the importance of maintain-ing the pressure in the whole of the sampling system considerably above thatof the environment. Originally it was intended that the sampling systemshould be flushed by opening the side arm of tihe tap attached to the syringeto the environment. Directly this manoeuvre was performed at a simulatedaltitude of 56ooo ft, however, large bubbles of gas formed in the blood in thesampling system. The waste bottle was therefore pressurized as well as th boxcontaining the sampling syringe. The final technique was found to be verysatisfactory and blood samples completely free of gas bubbles were obtainedin all the experiments, the results of which are presented in Table 5-1o.
The pressure clothing assemblies used in this part of the investigationdiffered from those employed during the sampling ofalveolar gases at reducedenvironmental pressure. Standard pressure breathing masks and pressurehelmets were worn and counterpressure was also applied to the lower limbsby means of an anti-g suit. These assemblies represented those which it wasproposed should be used in flight. The use of an oronasal mask for thedelivery of a positive breathing pressure of 6o--63 mmHg introduced thediscomfbrts which have been discussed in Chapter 3. The application ofcounterpressure to the lower limbs reduced the volume of blood displacedfrom the trunk into the periphery by the raised intrapulnonary presure(Chapter 6). There was a small variation in the pressure maintained in thebreathing cavity of the mask or helmet by the pressure demand regulator(Mark 20 or 21) used in these experiments (Table 5-1o). This variation wasdue principally to the presence of outboard leakage of oxygen from the maskor pressure helmet.
Since each arterial sample wa.s drawn at a constant rate over a two minuteperiod its carbon dioxide tension represented approximately the mean valueof the arterial carbon dioxide tension over this period. The values obtainedduring the control period with the subject breathing oxygen at a simulatedaltitude of 25000 ft gave a mean value of TO.6 mmHg for the arterial carbondioxide tension. TIhis did not differ significantly from the mean value of 40.3mmHg obtained for the alveolar carbon dioxide tension determined underthe same conditions by Haldane-Priestley sampling. The normal venousadmixture contributed by the true anatomical right to left shunts and byalveoli with very low ventilation-perfusion ratios Riley and Cournand
219
A n

RAISFD INTRAPULMONARY PRESSURE
1949 (244) was responsible for the slight desaturation of the arterial bloodobtained under these circumstances, in spite of the high alveolar oxygentension.
Sampling of arterial blood during pressure breathing was not started untilat least one minute had elapsed following the rapid decompression so that thegross disturbances of gas exchange induced by the sudden reduction of theenvironmental pressure had partially subsided. The arterial carbon dioxidetension was considerably reduced and the values obtained in these experi-mernts (Table 5-16) were similar to the values of the alveolar carbon dioxidetension obtained by Hdldane-Priestley sampling under comparable condi-tions. The arterial carbon dioxide tension was consistentlv lower wher.pressure breathing was performed with an oronasal mask jerkin and anti-gsuit than when a pressure helmet, jerkin and anti-g suit were wvorn. In theseexperiments the discomfort of breathing at a positive pressure of 6o mmHgwith an oronasal mask was added to the lower intrapulmonary pressure (127mmHg absolute) employed when this assembly was used. Although a higherpositive breathing pressure (79 mmHg) was experienced in the series in whicha pressure helmet was worn, the absence of discomfort in the head and neckand the higher intrapulmonary pressure (145 mmHg absolute) resulted in asmaller degree of hypocapnia one to three minutes after the decompression.
The oxygen saturation of the arterial bloud obtained during pressurebreathing with an intrapulnonary pressure of 145 mmHg absolute was con-sistently greater than that of the blood obtained when intrapulnonarypressure was only 127 mmHg absolute. The mean increase in the percentagesaturation associated with the 17.2 mmHg increase in the total intrapul-monary pressure in the eight pairs of experiments was 6.3",,. Of greaterinterest, however, was perhaps the associated increase in the tension ofoxygen in the arterial blood (Table 5-15). The oxygen tension of each bloodsample was calculated using D)ill's oxygen dissociation curves for whole blood(74). The accuracy of this indirect technique of assessing the oxygen tensionof a blood sample varied with the actual value of the oxygen saturationbecause of the shape of the oxygen dissociation curve. The slope of the dis-sociation curve changes markedly over the range of saturations recorded inthe present experiments (Table 3-16: so that the accuracy with which theoxygen tension could be predicted from the oxygen saturation was reduced
by more than three-fold as the saturation increased from 82..5",, to 92.5",.An increase of the ipH of the blood from 7.40 to 7.50 slightly decreased theslope of the dissociation curve over the range of interest in the present con-text. Since the difference be'tween duplicate analyses of the oxygen saturationof the same blood sample did not exceed I",,, the probable error of the pre-dicted oxygen tension %aried from about 1.2 mmHg at a saturation of 82.5",,to 4 mmHg at 92.5". The accuracy with which the pH of each blood samplewas measured was such that the inaccuracy in the predicted oxygen tensiondue to variations in this factor was negligible. A further variation was intro-duced by the use of a standard oxygen dissociation curve rather than thecurve for the subject's own blood. The magnitude of the error introduced inthis manner was probably small.
The sum of the partial pressures of oxygen, carbon dioxide and watervapour in the arterial blood sampled during pressure breathing have been
222o

PI'IMONARY GAS EXCHANGE
TABLE 5-15
TIlE ARTERIAL (;AS TENSIONS DIRING PRESSURE BR'-..ATIIING AT
A SIMULATED ALTITUDE OF 5600o ft (Pi, 7 65.7 mnilng)
Positive Alveolar - arterialSubject breathing Arterial gas tensions total pressure
pressure Carbon dioxide Oxygen difference(jnrnHg) (rnnil-g) (nuinHg) (mnnfHg)
Pressure breathing with mask, jerkin and anti-G suit63 26.5 51.0 4.2
6x 29.4 45.0 5.6o 31.0 54.0 2.76o 29.2 44.0 5.563 26.6 47.0 8.16o 28.3 43.5 6.963 302 46.0 5.561 28.5 44.5 6.7
Mean 61.4 28.7 45.8 5.6Stanrdar-derror ±0-.56 ±-0.85 ±().5)
Pressure breathing with helmet, jerkin and anti-G suit79 29.o 63.0 5.780 32.5 6o.0 6.280 31.5 62.o 5.2
78 34.5 57.n 5.277 30.2 62.5 3.)80 :30.6 62.0 6. 177 34.5 56.o 5.28o 29.5 6o.5 8.7
Mean 78.9 31.5 60.4 5.7Standarderror ±0.23 ±0.92 40.56
TAIIIE 5-6
TH E SL.OPEF OF TIlE OXYGEN DISSOCIATION (:I'RV'E FOR H3 UMAN
BLOOD) AT '37 U AT VARIOUS t, EVELS OF OXYGEN SATURATION
(DILL, 1944)
Oxygen saturation Slope of dissociation curve (mmHg per(,)i, saturation)
pH 7.4 pH :- 7.5
7o--80 0.96 o.868O-85 1.20 I.o885-T) 1.94 1.739"9.5 4.00 3.53
221
_J----------
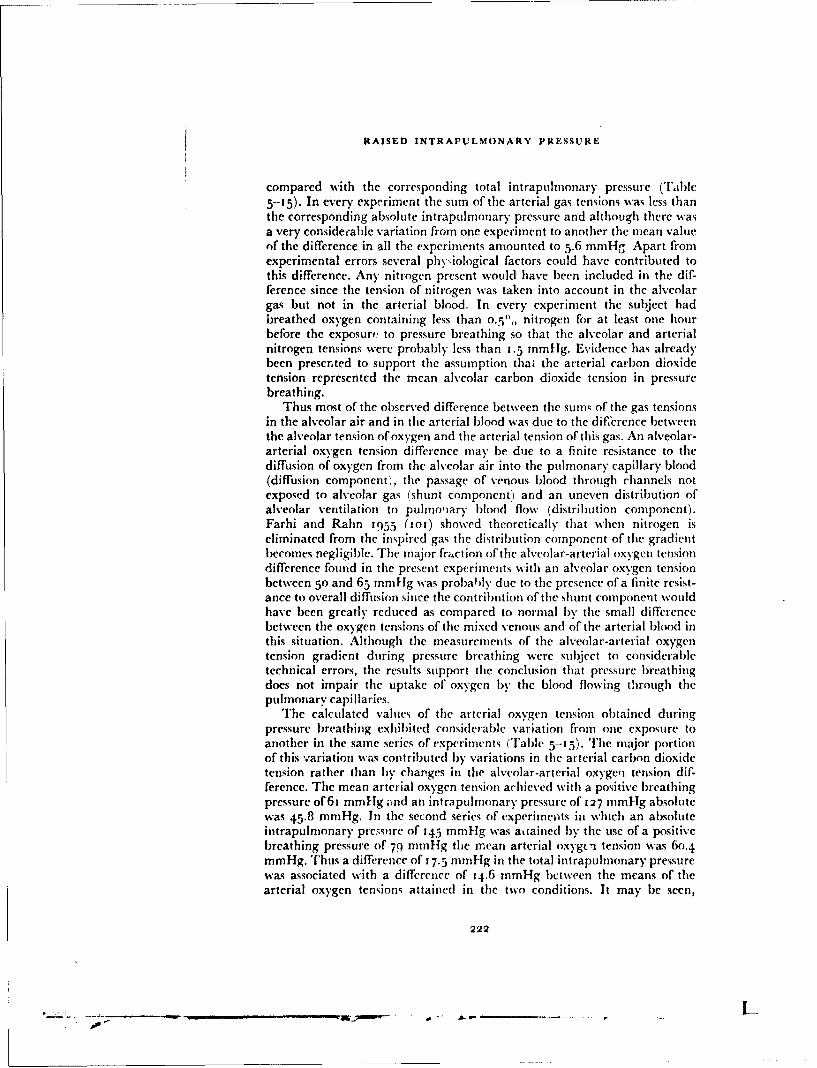
f RAISED INTRAPULMONARY PRESSURE
compared with thle corresponding total nt rapulmonary pressure (Tl',blc5--15). In every experiment thc sum of thle arterial gas tensions was less thanthe corresponding absolute intrapulmonary' pressure and although there wasa very considerable variation from one experiment to another the mean valueof the difference in all thle experiments amounted to 5.6 mmHo- Apart fromexperimental errors several phydiological factors could have contributed tothis difference. Any, nitrogen present would have been included in the dif-ference since the tension of nitrogen was taken into account in the alveolargas but not in the arterial blood. In every experiment the subject hadbreathed oxygen containing less than 0..5o"" nitrogen for at least one hourbefore the exposurv: to pressure breathing so that the alveolar and arterialnitrogen tensions were probably less than 1.5 mmHg. Evidence has alreadybeen presernted to support the assumption thai the arterial carbon dioxidetension represented the mean alveolar carbon dioxide tension in pressurebreathing.
Thus most of the observed difference between the sums of the gas tensionsin the alveolar air and in the arterial blood was due to the dif'erence betweenthe alveolar tension of oxygen and the arterial tension of this gas. An alveolar-arterial oxygen tension difference may be due to a finite resistance to thediffusion of oxygen from the alveolar air into the pulmonary capillary blood(diffusion component), the passage of venous blood through channels notexposed to alveolar gas (shunt component) and an uneven distribution ofalveolar ventilation to puhuo'iary blood flow (distribution component).Farhi and Rahn 1955 (iOt) showed theoretically that when nitrogen iseliminated from the inspired gas the distribution component of the gradientbecomes negligilble. The major fraction of the alveolar-arterial oxygen tensiondifference found in the present experiments with an alveolar oxygen tensionbctween 50 and 65 mmHg was probably due to thle presence of a finite resist-ance to overall diffusion since the contribution of the shunt comnponent wouldhave been greatly reduced as compared to normal by the small differencebetween the oxygen tensions of the mixed venous and of the arterial blood inthis situation. Although the measurements of the alveolar-arterial oxygentension gradient during pressure breathing were subject to considerabletechnical errors, the results support the conclusion that pressure breathingdoes not impair the uptake of oxygen by the blood flowing through thepulmonary capillaries.
The calculated values of the arterial oxygen tension obtained duringpressure breathing exhibited considerable variation from one exposure toanother in the same series of experiments (Table .5-15). The major portionof this variation was contributed by variations in thle arterial carbon dioxidetension rather than by changes in the alveolar-arterial oxyge'1 tension dif-ference. The mean arterial oxygen tension achieved with a positive breathingpressure of6i mml-Ig •.nd an intrapuhmnonary pressure of 327 mml-g absolutewas 45.8 mmHg. In the second series of experimenlts in which an absoluteintrapulmonary pre.ssure of 145 mnml-g was attained by the use of a positivebreathing pressure of 79 mnmHg the mean arterial oxygt'i tension was 60.4mmHg. Thus a difference of 37.5 mml-g in thle total intrapulmonary pressurewa~s associated with a difference of 14.6 nml-Ig between the means of thlearterial oxygen tensions attained in the twvo conditions. It may b~e seen,
222
S. . . . il. l-

PUI.MONARY GAS EXCHIANGE
however (Table 5 -16) that the arterial oxygen tensions round at the greaterin-rapuilioniary pressure were associated with slightly higher values of thearterial carbon dioxide tension. The difference between the mean values )fthe sums of the individual valtus of the exgen and carbon dioxide tensionsin each series was 17.3 mm11g. Thus the difference between the sum of thearterial oxygen and carl)on dioxide tensions in the two series of experimentswas equal to the difference between the respective intrapulmonarypressures.
Previous investigations of the composition of the arterial blood duringpressure brea.hing at low environmn ntal pressures have been restricted to thestudy of the effects of positive breathing pressures of tip to about T) mmHg.Dill and Penrod I948 (75) found that breathing oxygen at the environ-mental pressure at a simulated altitude of 44 8oo ft (environment pressure --112 mmHg) gave, in a group of cight subjects, a mean arterial oxygen satura-tion of 66.5",, and a mean arterial carbon dioxide tension of 26 mmHg.Barach, Eckman, Eckman, Ginsburg and Rumsev 1947 (16) studied theeffect of a positive breathing pressure of 15 mmHg at this simulated altitude(45 oO0 ft) which gave an intrapulnoitary pressure of 125 minHg absoluteand found that it produced a mean arterial saturation in five subjects of8o.o",, arid a mean arterial carbon dioxide tension ot'32.9 mmHg. They foundfurther that breathing oxygen at the pressure of the environment at a simu-lated altitude of 42300 ft 1126 mmllg al)bolute- produced a mean arterialoxygen saturation of 8o.6",, in a group of live subjects and a mean arterialcarbon diox'de tension of 35.2 mrnHg. Thus even a positive breathingpressure of 15 mnilg induced a certain degree of h~ perventilation andproduced the arterial oxygen saturation obtaine(-, when oxygen was breathedat an environmental pressure equal to the total intrapulmonary pressurewhich existed during pressure bieathing.
Taylor, Marbarger and Power 1948 (275) investigated, in a group ofthree subjects, the composition of the arterial blood during pressure breathingwith trunk counterpressure at a positive pressure of 32 ninHg at a simulatedaltitude of 5oooo ft which gave an intrapulmonary pressure of i i9 mmllgabsolute. The mean arterial oxygen saturation attained under these condi-tions was 77.5.,,, the mean arterial carbon "ioxide tension was 32 innilIg andthe mean arterial oxygen tension was 4o mmHg. A comparison of the resultsobtained in the present study with those of pievious investigators shows thatat similar absolute intrapulmonary pressures the arterial carbon dioxidetension was considerably lower in the present experiments. The experimentalconditions employed b)y ,Iavlor, Marbarger and Power 19.18 (275) andBarach, Eckma1, Eckman, Ginsburg and Rumsey 1947 (16) differ-d inthree important respects from those of the present study. The positive breath-ing pressures used in the latter were between twice and four times thoseinvestigated by Taylor and Barach. The low environmental pressure wasattained in the experiments of both Taylor ct al and Barach et al by a rela-tively slow reduwtion of pressure and the arterial blood was sampled betweentwo anrd fifteen minutes of the exposure whereas in the present expetiimentsthe exposure was commenced with a rapid decompression and sampEng wasperformed much earlier. These differences in thr experimental conditions alltended to produce lower values of the arterial carbon dioxide tension in the
223
- - -,.- ~ .. -.---. I_____________________ _ I I

RAISED IN'IRAPIII.ONARY IPRISSU'RF
arterial blo(xd as sampled in the pr'sent experiments as compared with thevalues obtained Iiv the cailie, investigators.
In some respects it was desirable that the sampling of arterial blood shouldhave been perf!rmed when a respiratory "steady state" had been attainedduring pressure breathing at reduced environmental prcssure. It was notpossible, however, to expose the sul)jects to a prolonged period of pressurebreathing at the high positive pressures used in this study. 'The severe cardio-vascular disturbances induned by pressure breathing at these pressures limitedthe acceptable duration of an exposure to a simulated altitude of 56oo0 ft toless than four minutes. Since each arterial sample was taken over a two minuteperiod after an initial delay of'one minute the time available for the inductionof pressure breathing was short. Thus the environmental pressure was re-duced over two seconds in order to produce a rapid onset of pressure breath-ing. This form of induction of pressure breathing at reduced environmentalpressure was also of practical interest since failure of the pressure cabin of anaircraft during flight may occur very rapidly.
The relatively high values of arterial oxygen tension and saturation foundduring pressure breathing at simulated high altitude with an intrapunhmonarvpressure of 127 mmHg absolute wce due to the low value of the alveolarcarbon dioxide tension which existed in this condition ('I'able 5-15). Thus itmay be calculated ATable 5-17) that if, in these circumstances, the alveolarcarbon dioxide tension had been 4o mmllg, the arterial oxygen saturationwould have been only 67,, as compared with the value of . obtainedexperimentally. The reduction of the alveolar carbon dioxide tension pro-duced this effect hy two mechanisms. Firstly the alveolar oxygen tension wasraised from the value which would have existed with an alveolar carbondioxide tension of 40 mniHg by I I nnHg to about 5o mmHg. Secondly, theassociated increase in the pli of the pulmonary capillary blood raised theoxygen saturation of the arterial blood by V,,. At the higher intrapulnonarypressure of 145 mmHg absolute the calculated arterial oxygen saturationproduced by an alveolar carbon dioxide tension of 4) n"mHg was 835.5", sothat the observed degree of hypocapnia raised the arterial oxygen saturationby 6",,. Thus the observed hvpocapnia contributed only about a third of theincrease of the arterial oxygen saturation at an intrapulmonary pressure ofi.1,. mmHg absolute as compared with that induced by a similar degree ofhypocapnia at an absolute intrapulnionary pressure of' 127 onmHg. Thisdifference was due to the increased steepness of the oxygen dissociation curveat the lower arterial oxygen tension.
The primary purpose of pressure breathing at high altitude is the main-tenance of normal cerebral activity. The function of' the central nervoussystem depends upon its oxygen supplv which is determined by the oxygensaturalion and tension of the arterial blood and t)-- blood flow which itreceives. The effect of pressure breathing under the conditions used in theseexperiments upon the cerebral blood flow has not been measured. In Chapter6 it will be shown, however, that pressure breathing with countcrpressureapplied to the trunk and lower limbs produces only a small change in thecerebral arterio-venous vascular pressure difference. It would appear unlikely,therefore, that pressure breathing under these conditions causes any grosschange of cerebral blood flow by a mechanism involving a change in driving
224

PULMONARY GAS EXCIIANGE
TABLE 5-17
TIlE PREI)ICTED EFFECT OF AN AlI.VEOLAR CARBON DIOXIDE TEN-
SION OF 40 11m1g IUPON THE ARTERIAL GAS TENSIONS AND TIlE
MEAN CEREBRAL CAPILLARY OXYGEN TENSION DURING PRESSURE
HREATIIING AT 61 limnlig WITH AN INTRA'PULMONARY PRESSURE OF
127 moillg AB!SOi.UTE
Pressure breathing with an intra-Breathing pulmonary pressure of 127
air at ground mmHglevel With observed With assumed
alveolar carbon alveolar carbondioxide tension dioxide tension
Alveolar gas tensionsCarbon dioxide (tnun lgg 40 29 40Oxygen (ninilgý lO 51 40
Arterial bloodCarbon dioxide tension
(nhHg) 40 29' 40
Oxygen tension (rnm0Hg) 90 461 35Oxygen saturation (",,) 97 84.3' 67
Cerebral metabolismOxygen consumption
(rnlninin./ioog brain) 3.3 3.3 3.3Blood flow (ml;min./i oog
brain) 6o 4o 72
Cerebral blood oxygen tensionInternal jugular (ninifg) 4o 22 24.5Mean cerebral capillary
imniHg) 57 30 28
' Experiun t.t ly determined va lues
225
SI

RAISED INTRAPI'LMONARY PRE'SSURE
pressure across the cerebral vascular bed. The tensions of carbon dioxide andoxygen in the arterial blood do, however, play an important part in the con-trol of the cerebral vascular resistance. Hypocapnia causes conqtriction of thecerebral vessels whilst moderate or severe hypoxia induces a vasodilatation(170). Thus at a constant arterial oxygen tension above 40 mmHg a reductionof the arterial carbon dioxide tension from the normal level of 40 mndig to30 mmHg decreases the cerebral blood flow by one third (170, 177). At aconstant arterial carbon dioxide tension hypoxaemia does not change thecerebral blood flow until the arterial oxygen tension is reduced below 50mmHg. The increase in cerebral blood flow induced by a reduction of thearterial oxygen tension to 45 mmHg amounts to less than 5",, of the restingvalue (177).
Thus the mean arterial carbon dioxide and oxygen tensions (29 and 46mmHg respectively) fbund during pressure breathing at a simulated altitudeof 56o0o ft with an intrapulmonary pressure of 127 mmHg absolute wouldhave reduced the cerebral blood flow to about two-thirds of the normal rest-ing value. If, however, the arterial carbon dioxide tension had been normal(40 mmHg) the arterial oxygen tension would have been about 35 mi1l1g atthe same total intrapulmonary pressure (Table 5-18) and these conditionswould have resulted in an approximately 2o",, increase of the cerebi'al bloodflow above the normal resting level. Thus, although the hypocapnia foundduring pressure breathing at reduced environmental pressure fibllowing arapid decompression resulted in a considerably higher arterial oxygen satu-ration than would have occurred if the arterial carbon dioxide tension hadbeen 40 mmHg, the blood flow to the brain would have been some 75",greater if no hypocapnia had occurred. 'Fihe experimental results upon whichthese calculations are based were all obtained in the steady state. The velocityat which these changes of cerebral vascular resistance occur when the arterialgas tensions are suddenly changed is uncertain. Studies using radioactivekrypton suggest, however, that cerebral vascular responses to alterations ofcarbon dioxide tension occur within one minute of a change of arterial gastension (186).
The relative effects of these changes of arterial oxygen saturation andblood flow upon the oxygen supply to the cerebral tissues may be expressedquantitatively by using Barcroft's concept ,24" of a mean tissue capillaryoxygen tension. This is the tension which, if it existed along the whole lengthof all the capillaries of the tissues, would result in the transfer of oxygen at therate at which it actually occurs. If a steady' state of respiratory gas exchangewithin the brain is assumed then it is possible to calculate the mean capillaryoxygen tension corresponding to the two conditions which have been con-sidered during pressure breathing ATable 5-t 7. Thus, although as comparedwith the state which obtained with an arterial carbon dioxide tension of 40mmHg the observed hypocapnia increased the arterial oxygen saturationfrom 67",, to 84",', and the arterial oxygen tension fr'om 35 to 46 mmHg, itwas associated with an increase of only 2 mmHg in the mean cerebral capil-lary oxygen tension. Although several of the assumptions made in thesecalculations have not been tested experimentally, the results serve to empha-size that the observed hypocapnia produced a relatively small increase in thetension at which oxygen was delivered to the brain.
226

PUIlMONARY GAS EXCIIANGE
S UUM MA R V
The investigations described in this chapter confirmed that the most irn-portant disturbance of pulmonary gas exchange induced by pressure breath-ing was an increase of pulmonary ventilation. Although this mnanoeuvreincreased the physiological dead space the increment in the total pulmonaryventilation was such that the alveolar ventilation was also increased. Therewas a reduction of the alveolar carbon dioxide tension whichi was more pro-found during pressure breathing in the presence of mild hyp:.xia at reducedenvironmental pressure than at ground level. The distribution of the inspiredgas within the lungs was not affected by pressure breathing but evidence wasobtained which suggested that this procedure disturbed the distribution of thepulmonary blood flow and reduced the volume of the blood within the pul-monary capillaries. Thei-e was, however, no impairment of diffusion acrossthe alveolar capillary membrane proper. Although pressure breathingproduced a disturbance of the relationships between alveolar ventilation andpulmonary capillary blood flow in the lungs, the increase of pulmonaryventilation prevented any significant impairment of the overall exchange ofcarbon dioxide and oxygen between the inspired gas and the blood flowingthrough the lungs. The vascular changes were thought to be the result of theshift of blood to the periphery which was produced by pressure breathing.The alveolar hyperventilation during pressure breathing at simulated highaltitude with an alveolar oxygen ten ion of the order of 5 o--6o mmHg resultedin a considerably higher arterial oxygen saturation than would have other-wise occurred.
227
- - r

CIlAPTER 6
THE CARDIOVASCULAR EFFECTS OF HIGHPRESSURE BREATHING
INTRO)DUCTIOUN
The early investigations (1 19) (30) of the effects of pressure breathing atpositive pressures above 30 mmHg showed that the time for which thismanoeuvre could be performed was limited by the occurrence of syncope.The application of counterpressure to the chest or trunk allowed the use ofgreater positive breathing pressures liut the time for which pressure breathingcould be performed without circulatory collapse was found to be progressivelyreduced as the breathing pressure was raised. Thus the practical use ofpositive pressure breathing with oxygen as a means of preventing serioushypoxia at altitudes above 40o00o ft was primarily limited by the cccurrenceof syncope.
Direct observation of the superficial veins of the limbs shows that one ofthe most important effects of positive pressure breathing is the displacementof blood into the peripheral capacity vessels. Limited studies of the amountof blood displaced in this manner were made by Henry 3953 (146) whofound that pressure breathing with counterpressure applied to the chest at apositive pressure of 4 o mmHg displaced about 3oo ml of blood into the lowerlimbs in the erect posture. In the present investigation using the completetrunk counterpressure afforded by the pressure jerkin, the volume of blooddisplaced into various segments of the upper and lower limbs has been deter-mined at positive breathing pressures of up to 130 mmHg. The progressiveincrease of limb volume subsequent to the displacement of blood into the partat the beginning of pressure breathing has also been studied as a measure ofthe increase in the volume of extnrvascular fluid within the limb. The in-fluence of these disturbances of the aistribution and the volume of the circu-lating blood induced by positive picssure breathing upon the cardiovascularsystem have been investigated by measuring the heart rate and the pressuresat various sites within the circulation. The nature, incidence and causationof the syncope which arises during pressure breathing has also been examined.The effects of the application of various degrees of counterpressure to thelimbs upon the cardiovascular disturbances produced by pressure breathinghave been determined together with the limits of the protection afforded byvarious combinations of pressure garments. When the degree of positivepressure which can be employed wi'h a given pressure breathing system islimited as it is in a system using an oronasal mask, the maximum altitude towhich this system can be used safely will depend upon the minimum absoluteintrapulnonary pressure which can be tolerated. The latter in turn dependsupon the degree of hypoxia which is acceptable under the conditions in whichthe system will be used. Experiments have been performed in order to deter-mine the effects of various degrees of hypoxia upon the cardiovascular respon-ses to positive pressure breathing.
229
-- .-- -. --. ~-w-~------Y -~-- 1- .. ...

RAISED INTRAI''IANMONARY PRESSURE
Changes of Limb Volume - In separate experiments the volume of thehand, forearm, thigh or calf was recorded continuously using a water-filledplethysmograph. The subject was secured in the ejection seat by means of thestandard seat harness in order to reduce to a minimum the movements of thelimb segment under study with the induction and cessation of pressurebreathing. The upper limb plethysmographs were placed at such a height thatthe mid-plane of the segment within the plethysmograph lay io cm below thesternal angle. When the volume of a lower limb segment was measured thelimb was supported in the horizontal position with the hip joint flexed to 9o°.The changes in the impedance between the electrodes of the plethysmographproduced by alterations in the level of water within it were fed on to a galva-nometer of a photographic recorder by means of a suitable amplifier. Thesubject wore a Type D partial pressure headpiece and a pressure jerkin whichwas supplied by a demand regulator, the outlet pressure of which could bevaried between o and 15o mmHg gauge. The pressure in the headpiece wasmeasured by means of an unbonded strain gauge pressure transducer, theoutput of which was fed on to the second galvanometer of the photographicpaper recorder.
In any given experiment the behaviour of only one limb segment wasstudied. In most of the experiments a series of four exposures to variouspositive breathing pressures was made. The duration of an exposure topressure breathing was varied inversely with the positive breathing pressurefrom five minutes at a pressure of ` 50 mmHg to two minutes at a pressureof + 130 mmHg. Following an exposure to pressure breathing a period of atleast ten minutes was required before the limb volume had returned to itsresting value. In a few of the experiments in this series in which the volume ofthe forearm was measured, the pressure in an antecubital vein was recordedby means of a capacitance manometer. Two individuals who were experi-enced in pressure breathing were used for the majority of the experiments inthis study. A series of experiments was also performed on a further group offour subjects trained in pressure breathing. In this series only the forearmvolume was recorded.Results - The general shape of the curve relating limb segment volume totime before, during and after pressure breathing was found to be independentof the site of the limb r-mcnt and of the positive breathing pressure at whichthe curve was obtained. A record obtained in a typical experiment in whichforearm volume, pressure in the homolateral antecubital vein and headpiecepressure were measured is presented in Fig. 6-1. At the beginning of pressurebreathing there was a rapid increase both in limb volume and of venouspressure over a period of ten to twenty seconds. The rate of increase of limbvolume then declined progressively until a relatively constant minimumvalue was attained. This minimum rate of increase of volume was maintainedfor as long as pressure breathing was continued. The rate of rise of venouspressure at the beginning of pressure breathing increased progressively untila value which was very nearly equal to the positive breathing pressure wasattained. The venous pressure then remained constant except for smallfluctuations which were respiratory in timing until pressure breathing wasterminated. The time at which the venous pressure reached the final plateauvalue was the same as that at which the rate of increase of limb volume
230

mm g-- -
LMtA9IC
VOLUME
223
VINOU0 I- - --S .S,----w ~ .----
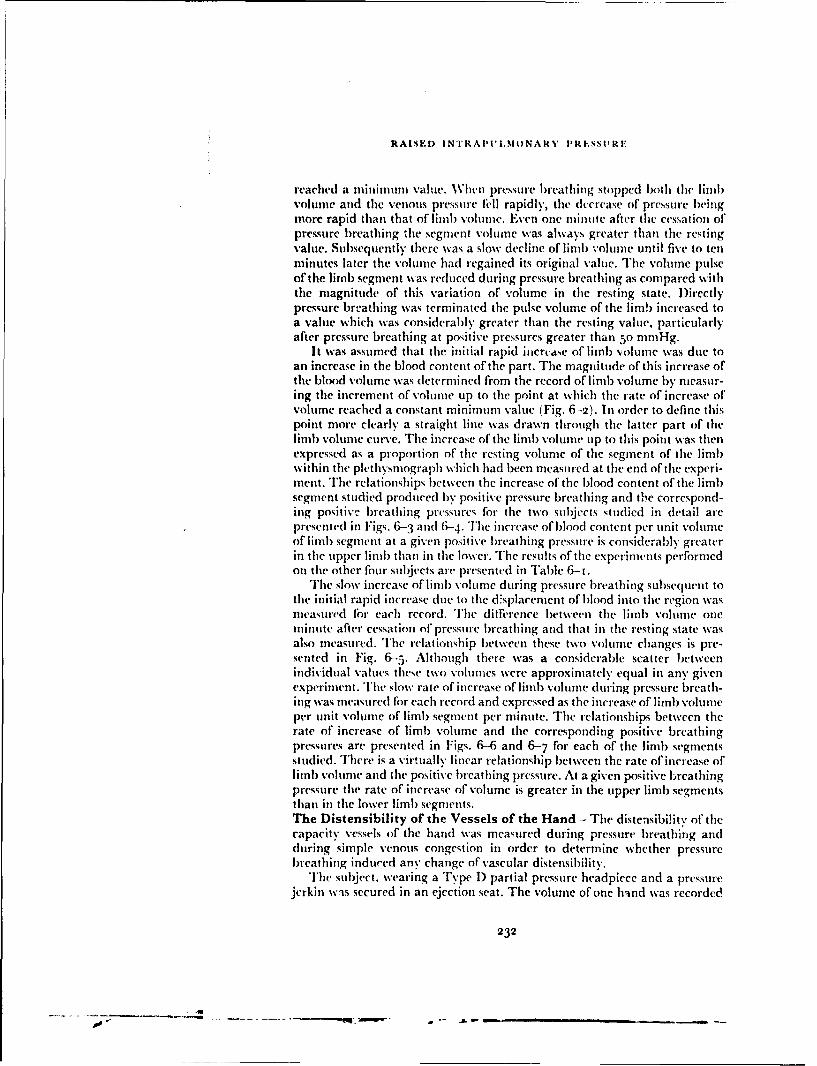
RAISED INIRAPI'UI.MONARIY PRESSURE
reached a minimum value. When pressure breathing stopped both the lind)volume and the venous pressure HIel1 rapidly, the decrease of pressure beingmore rapid than that of limb volume. Even one minute after the cessation of'pressure breathing the segment volume was always greater than the restingvalue. Subsequently there was a slow decline of limb volume until five to tenminutes later the volume had regained its original value. The volume pulseof the limb segment was reduced during pressure breathing as compared withthe magnitude of this variation of volume in the resting state. Directlypressure blreathing was terminated the pulse volume of the limb increased toa value which was considerably greater than the resting value, particularlyafter pressure breathing at positive pressures greater than 50 mmlHg.
It was assumed that the initial rapid incrtarse of limb volume was due toan increase in the blood content of the part. The magnitude of this increase ofthe blood volume was determined from the record of limb volume by nicasur-ing the increment of volume up to the point at which the rate of increase ofvolume reached a constant minimum value (Fig. 6-2). In order to define thispoint more clearly a straight line was drawn through the latter part of thelimb volume curve. The increase of the limb wolume tip to this point was thenexpressed as a proportion of the resting volume of the segment of the limdbwithin the plethysmograph which had been measured at the end of the experi-ment. The relationships between the increase of the blood content of the limbsegment studied produced by positive pressure breathing and the correspond-ing positive breathing pressures for the two subjects studied in detail arepresented in Figs. 6-3 and 6-4. The increase of blood content per unit volumeof limb segment at a given positive breathing pressure is considerably greaterin the upper limb than in the lower. The results of the experiments performedon the other four subjects are presented in Table 6-i.
The slow increase of limb volume during pressure breathing subsequent tothe initial rapid increase due to the d'splacement of blood into the region wasmnasured for each record. The ditrerence between the limb volume oneminute after cessation of pressure breathing and that in the resting state wasalso measured. The relationship between these two volume changes is pre-sented in Fig. 6 --5. Although there was a considerable scatter betweenindividual values these two volutmes were approximately equal in any givenexperiment. The slow rate of increase of limb volutme dutring pressure breath-ing was measured flor each record and expressed as the increase of limb volumeper unit volune of limb segment per minute. The relationships between therate of increase of limb volume and the corresponding positive breathingpressures are presented in Figs. 6-6 and 6-7 for each of the limb segmentsstudied. There is a virtually linear relationship between the rate of increase oflimb volume and the positive breathing pressure. At a given positive breathingpressure the rate of increase of volume is greater in the upper limb segmentsthan in the lower limb segments.The Distensibility of the Vessels of the Hand - The distensibility of thecapacity vessels of the hand was measured during pressure breathing andduring simple venous congestion in order to determine whether pressurebreathing induced any change of vascular distensibility.
The subject, wearing a Type I) partial pressure headpiece and a pressurejerkin wis secured in an ejection seat. The volume of one hand was recorded
232
p ,,.,.e. m ~ - ,,.- .L m --- -- • _

CARDIOVASCUILAR EFFECTS
TABLE 6--I
TIlE INCREASE IN BLO)OD CONTENT OF THIE FOREAR13 DURING
PRESSURE BREATHIING
Subject Positive breathing pressure Increase of blood content(itun Igl (m|)l, IM) utnl fireatrni)
C") 1.9314) '2.3134) 14
!) 41) '.4&)) 1.7
1Io0 2.4
E 54) 1.62.0
12) 2.5
F 31) 1.0&) 1.8
94) 2.2
TABLE 6-2
SYSTEMIC ARTERIAl. PULSE PRESSURE DURING PRESSURE BREATIIING
Positive breathing pessurc Subject Arterial pulse pressure(n11 l1 g, (1111J1g)
Rest Pressure breathingA. No counterpressure
3() A 55 2)35 C 6o 2550 D 45 15
B. Chest counterpressureCM) A &) 286o F. 52 328) F 55 3ý
C. Trunk counterpressure6o) 1 6o 356 () 55 3)[k) A 55 258A B 62 33&k D 53 32
I) C 5d 25m01 B 6, 22120 A 57 28n 220 B 65 30
D. Trunk and lower limb counterpressure6x) F 55 4)6 A 53 38&) F &, 41Ro F 54) 28
8 1) 51) 25100 A 56 35J(X) 1) 54 223120 F 55 25120) F 61 25
233
I . , i i i , - - -I I I I
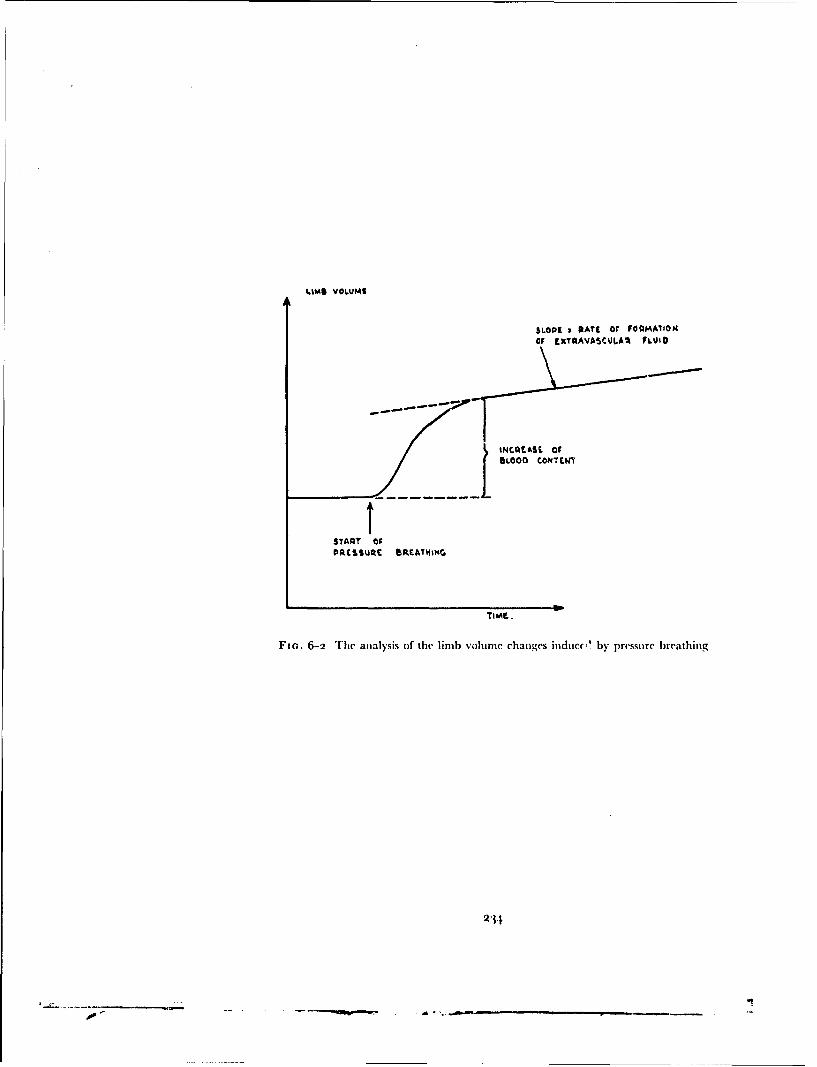
tams VOLUME
SLOPE 2 PATI Or FOQIAAIION
OF FxTQAVASCUJLA, FLkUMi
BLOCO CONTEWY
START OFPDCSSUQE BRAT4I NG
Fie.. 6-2 The analysis of the limb volume changes induce', by pressure breathing
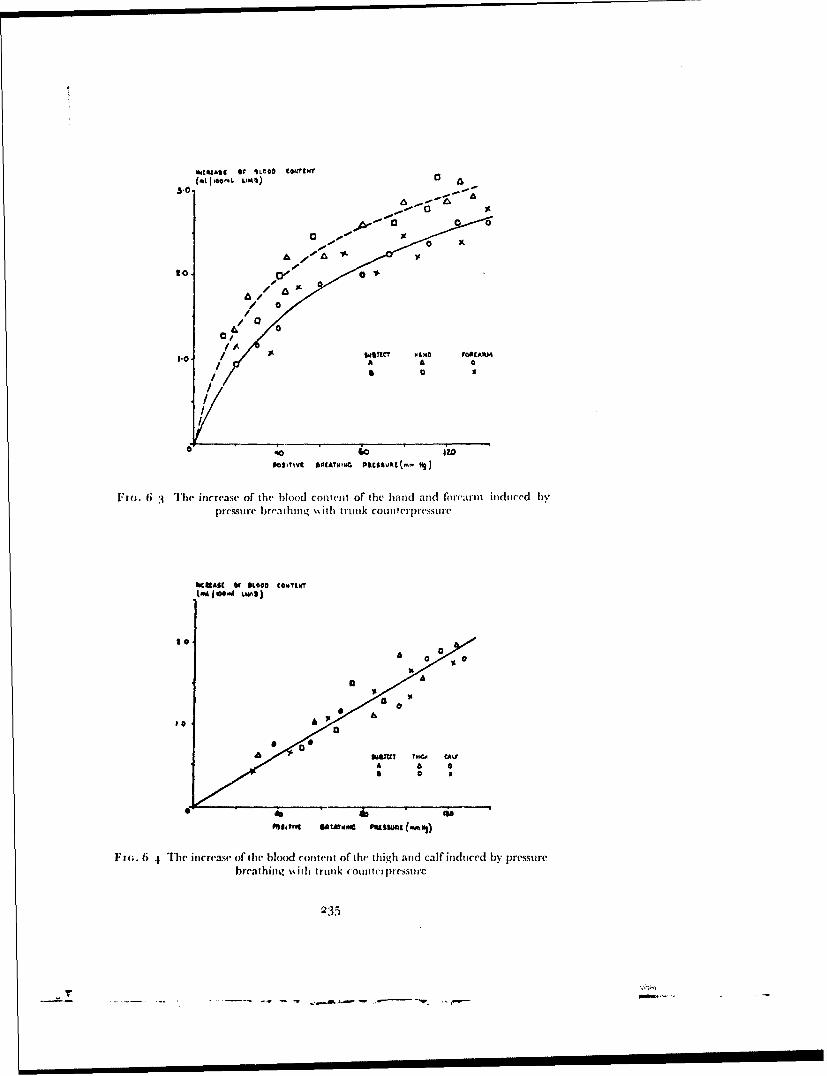
MIeAst [of WLeOO C8.1INT(01.00tfo' Lim%)C
3-~0
o/
lob- A A 0
0 x
2 10
JIGc. 6 3 Ihe increase of' the blood conven'kt of the hand and fio,'arm induced bypressure breathing '\ ith trunlk coun ttrerprssure
900
brea[ q thing ito** trukcutr ie+
a', IV o- 40+l
S.... •- . - -. ..,
6"(. •4 The incre'ase- of Ithe" blood colnt(nt of thel tih and ardficalf I induced | byresr
picsrealheming ý%ith trunk ot miltirliressut-c
AK4[~t WSLOO COY 35
TwIO LuA";*'
.~e 0 , 0
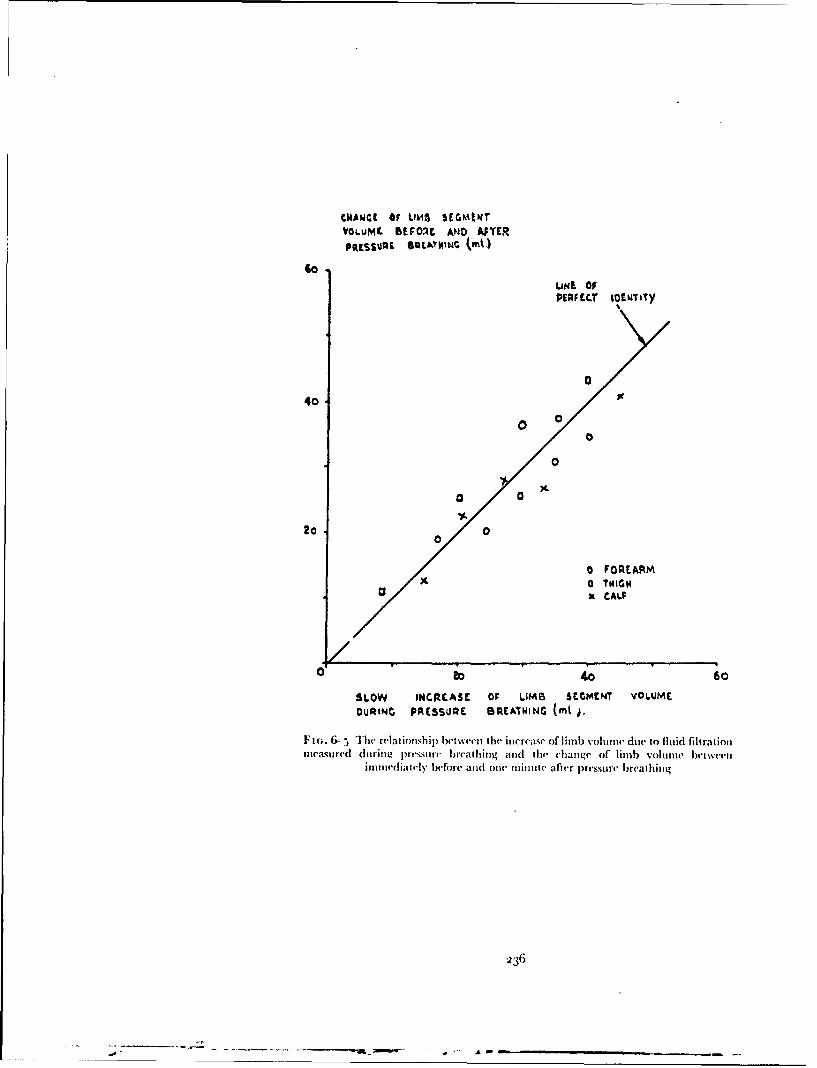
CNAWC[ Or LIMA S[•EWtT
VOLUML BEFORE AND AOYER
10LINE OFPERFCC.1T iOENTiTy
040
40
0
0
20 02o o/ O
0 FOREARM/• a TWIGS
X CAL;
/0 40 60
SLOW INCRELASE OF LIMB SEMENT VOLUMEOURINC PRESSURE BRSEAIING (ml i.
FI(;. 6--, The relat ionsh ip bet ween I hr in reuase of li lu) vol o(w due to fluid filtratimo
me'asu.red (litring p)t.ssurt. breat hinga tad h change of limb volume betwemeeitom t ed ijtty |elfiOrc. atd orv mintu.ite after pressur(e breathitntg
ý236
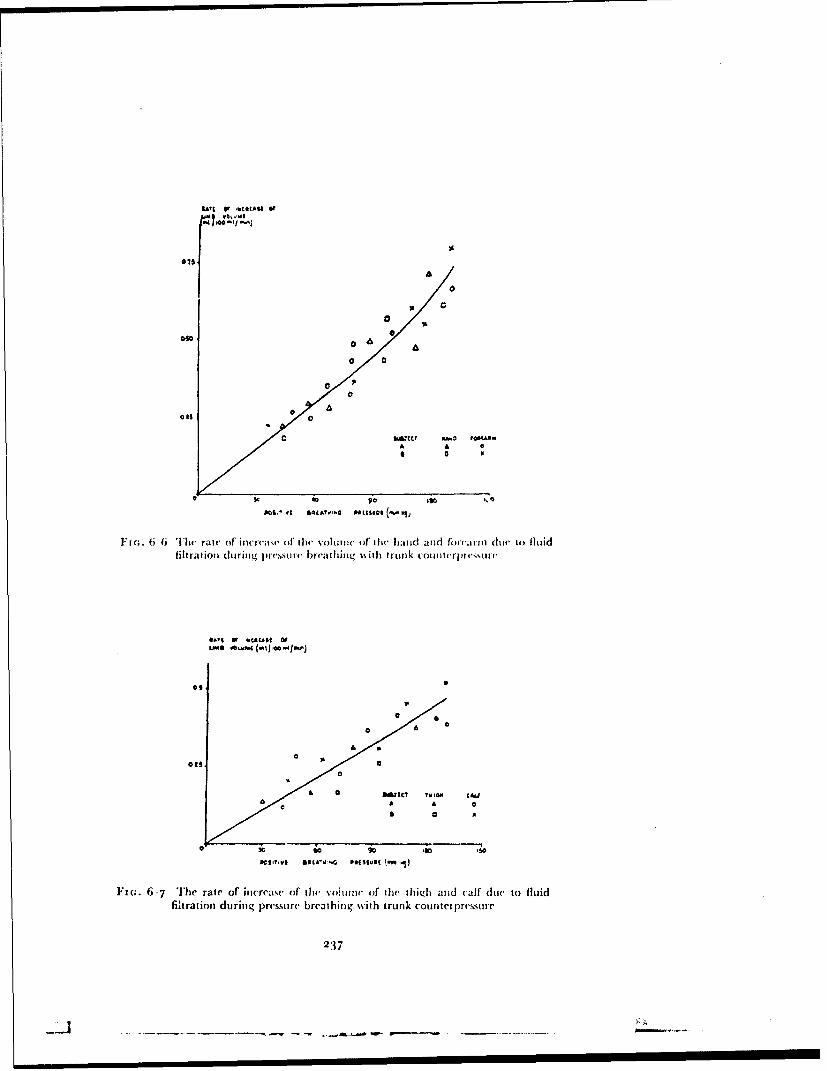
L MBAr E Or 4CAA O
I 00/
0~0
00
00
3c 40
SCs~~~ro am.•
0011. it SL•ATI1.6 Od[ssfe (ý ýj,
l~¢.6 6 Tlhe" rate of' incre';isr, of the" volume, of Ow•, hiand and forc'mr dluv to) fluid
0* a• a•/
lf(; 6- Thlie rate of itic reatse of thW volritt of t1Whe thid a (firoad rrrl ciut to fluid
filtration durinig pressurie breathinrg %i tro nik counterpre'ssurt
IWI I I I Ist OF
.9 0
DelaS wac'j.G p*aIMIu' ý. 'i)
Ftm. 6-7 The rate of itirreae (of thre volutiiv tif the thich atid calf' due to fluidfiltration during pressurc breathing with trunk countet pressure
237
I'r

RAISED INTRAI'IPLMONARY PRESSURE
continuously by means of a water-filled plhthysinograph. The mid-plane ofoF the hand was 1o cm vertically below the sternal angle. The local venouspressure was recorded through a 2o-gauge needle inserted in a suitable veinon the lateral aspect of the distal part of the forearm. The needle was con-nected by a polw'thylene cannula to a capacitance pressure transducer whichwas placed in the horizontal plane which contained the tip of the intravenousneedle. The electrical outputs from the amplifiers connected to the pressuretransducer and the electrodes in the plethysmograph were fed on to two ofthe galvanometers of a photographic paper recorder. Simple vascular con-gestion of the hand was produced by inflating a standard sphygmomano-meter cuff placed around the upper arm. Care was taken to ensure that whenthe cuff was uninflated it did not constrict the limb beneath it.
Two subjects, each of whom were experienced in pressure breathing, werestudied. The blood content of the hand vessels was increased either by localcongestion by the inflation of the sphygmomanometer cuff or by pressurebreathing with or without trunk counterpressure. The positive breathingpressure used in a sphygmomanometer cuff were varied between to and 50mmtfg. Each exposure was maintained until the venous pressure had beenconstant for at least thirty seconds and each exposure was separated firom thepreceding one by a rest period of at least five minutes. The order of the ex-posures to the various procedures was randomized. In one experimentperformed on each of the subjects, a total nerve block was performed at thewrist by infiltrating the median, ulnar and radial nerves and their brancheswith 2",, lignocaine hydrochloride. The nerve block produced completeanalgesia below the wrist and parplysed the small muscles of the hand. Follow-ing the wrist block the hand was inserted in the plethysmograph and theneedle placed in a vein just above the wrist and the blood content of the handincreased by local congestion and by pressure breathing.Results - The increase in hand volume caused by the displacement of bloodinto the part was measured from each record from the start of the volumeincrease to the instant at which the venous pressure reached a plateau. Therelationships between the increase of hand volume and the correspondingvenous pressure obtained by local congestion, pressure breathing withoutrespiratory counterpressure and pressure breathing with trunk counter-pressure are presented in Fig. 6 8. The increase of hae.d volume associatedwith the rise of venous pressure to a given value was very similar when thedistension was caused by pressure breathing with or without trunk counter-pressure. D)uring pressure breathing. however, the increase of hand volumeassociated with a given venous pressure was about 25",, less than the increaseproduced by local congestion. Very similar results were obtained with asecond subject used in this investigation.
Following the nerve block at the wrist, the skin of the hand became warmerand bright red in colour. The rate of blood flow into the hand was calculatedfrom the record of the increase of hand volume produced by the inflation ofthe sphygmomanometer cuff. The mean rate of blood flow was found to be44 ml '0oo ml of hand min. in one subject and 40 ml moo mnl,min. in the otheras compared with a mean blood flow of 5 ml moo ml rmin. in the non-nerveblocked hand. The response of the capacity vessels to local congestion ob-tained in the nerve-blocked hand is shown in Fig. 6-9. The resting venous
238
-4-.

,tott A! %I Of Le*,* €CCU'161imftIAlft WANC@CCJ~d
I rI a-- p A
/,, 6 LO,,• , U04SI
/C(0
LO A 'M U M " M (" %I)€ • ~~
I F w .. 6 .8 T h e rv la tio -~ h i1 p b e t w -en' loc a l v e n o u s p~re ssu r e " i d th e i n~ c I T -se -O f th e
blood content of the hand durinlg pressure bre'athin~g (soiid line-.) and local congestion
(interrupted line)
%441tA$• Of 6I1•4060~~lt
- -
I
Io ao
LOA 09.& PAUO(AL ~94)S.
F t'(;. 6-- 8 The relationship betisee n local venous pressure and the increase of the
blood content of the hand during pressure breathijg and local congestion following a
total netve block at the wrist
239

RAISED INTRAPU'I.MONARY PRE.SSURE
pressure was greater than in the normal hand (Fig. 6-8). The relationshipsbetween the raised values of venous pressure and the corresponding increasesof' hand volume produced by pressure breathing with and without trunkcounterpressure were very similar to that obtained with local congestion(Fig. 6--). A nerve block at the wrist also abolished in the second subject thedifference between the responses of the capacity vessels to pressure breathingand local congestion obtained in the normally innervated hand.Peripheral Venous Pressure - The effects of pressure breathing withoutand with counterpressure applied to the trunk upon the peripheral venouspressure in the hand, arm and foot were studied in three subjects. The subjectwas fitted with a partial pressure headpiece and a pressure jerkin which wereconnected to a demand regulator, the outlet pressure of which could be variedbetween o and 150 mmHg. Venous pressure was measured through a 2o-gauge needle introduced into the vein under study after the induction of localanalgesia with 2",, lignocaine hydrochloride. The needle was connected by a1o to 12 cm length of polyethylene cannula to a capacitance pressure trans-ducer. The pressure transducer was placed in the same horizontal Plane asthat which contained the tip of the intravenous needle. The output of thepressure transducer was fed on to one galvanometer of a photographicrecorder. The pressure in the headpiece was also measured and fed on to asecond galvanometer of the recorder. In a few experiments the subject worethe modified pressure headpiece fitted with a mouthpiece so that the respira-tory flow could be recorded with a Fleisch flow meter and a suitable pressuretransducer placed between the mouthpiece and the valve box. The pressurein an antecubital vein w- ,neasured in the majority of the experiments whenthe subject was in the seated position. The arm was placed so that the tip ofthe needle was io cm vertically below the sternal angle. Care was taken toensure that the arm did not move in relation to the sternal ang'e with theinduction of pressure breathing. The remaininmg experiments in whichrecords were obtained of venous pressure in the head, arm and foot were per-formed in a supine subject. A subject with a prominent superficial forcheadvein was used for the study of the Ibehaviour of the venous pressure in thehead. In this instance an oronasal mask was used in place ofa partial pressurehelmet to deliver air at the desired positive breathing pressures. The venouspressure in the foot was recorded by means of a needle placed in a dorsal vein.On each occasion the desired positive breathing pressure was applied forninety seconds and each exposure to pressure breathing was separated by arest period of at least three minutes.Results - The general behaviour of the peripheral venous pressure duringpressure breathing was similar in the three sites from which it was recorded.Almost immediately after the beginning of pressure breathing. the venouspressure started to rise, the rate of rise increasing slightly with time until thepressure reached a valuc which was maintained throughout the remainder ofthe exposure (Fig. 6-mo). The venous pressure returned very rapidly to theresting value directly pressure breathing ceased. The rate of rise of venouspressure at the beginning of pressure breathing in the fiorehead was consider-ably greater than that in the forearm which in turn was greater than that inthe foot (Fig. 6-i i ).
Once the venous pressure had reached a plateau value during pressure
240
------------
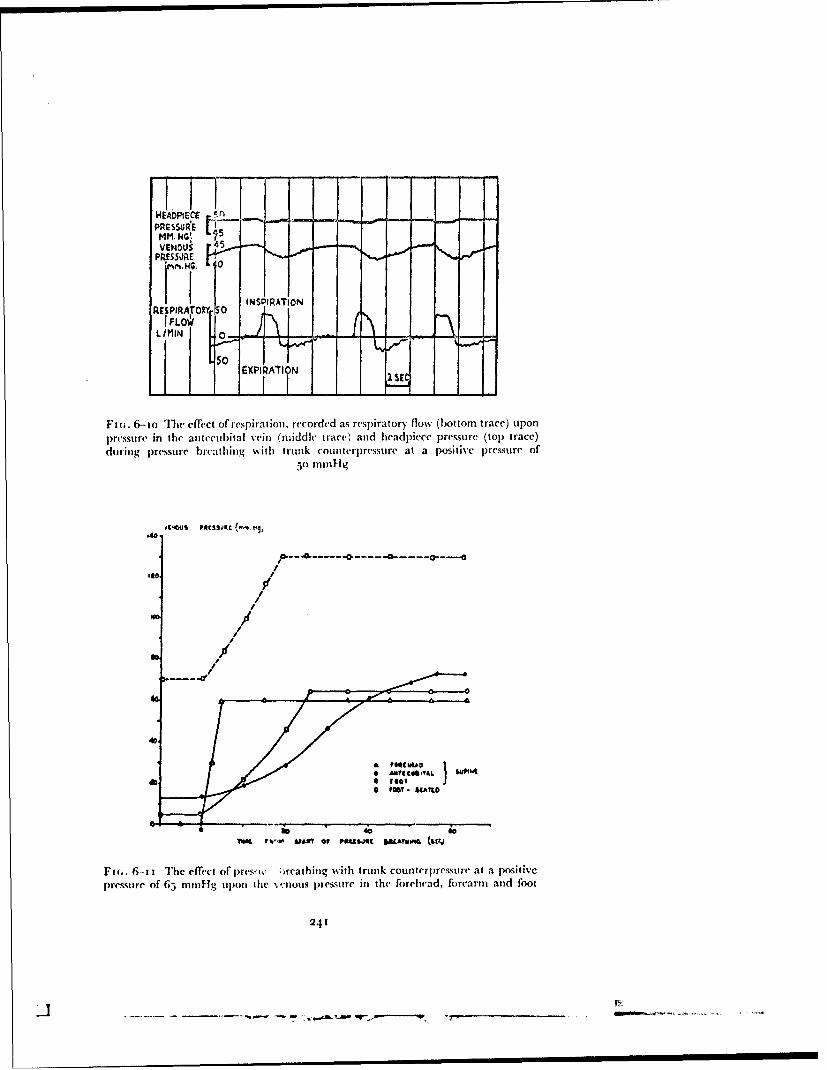
LiiHEADPIEC
Amr.l I"
PRES50)RE
RE PIftTRIFLO
EXPIPA II N 25,
Fi(,. 6--o The effect of respiration, recorded as respiratory flow (bottom trace) upon
pressure in the ae(tecubital vein (middle trace) and headpiece pressure (top trace)
during pressure breathing %%ith trunk counterpressure at a positive pressure of5( mnl-lg
Mdk.
.40.
I
706% If-AUWO •"JM ~MV &~
//
/
Ftc.. 6-- ti The effect of' prmsw 'rcathing wvith trunk counterpressure at a positive
pressure of 65 mmHg upon the ve'nous pressure in the forehead, forearm and foot
241
i -- - ----- ------- w-|----I-
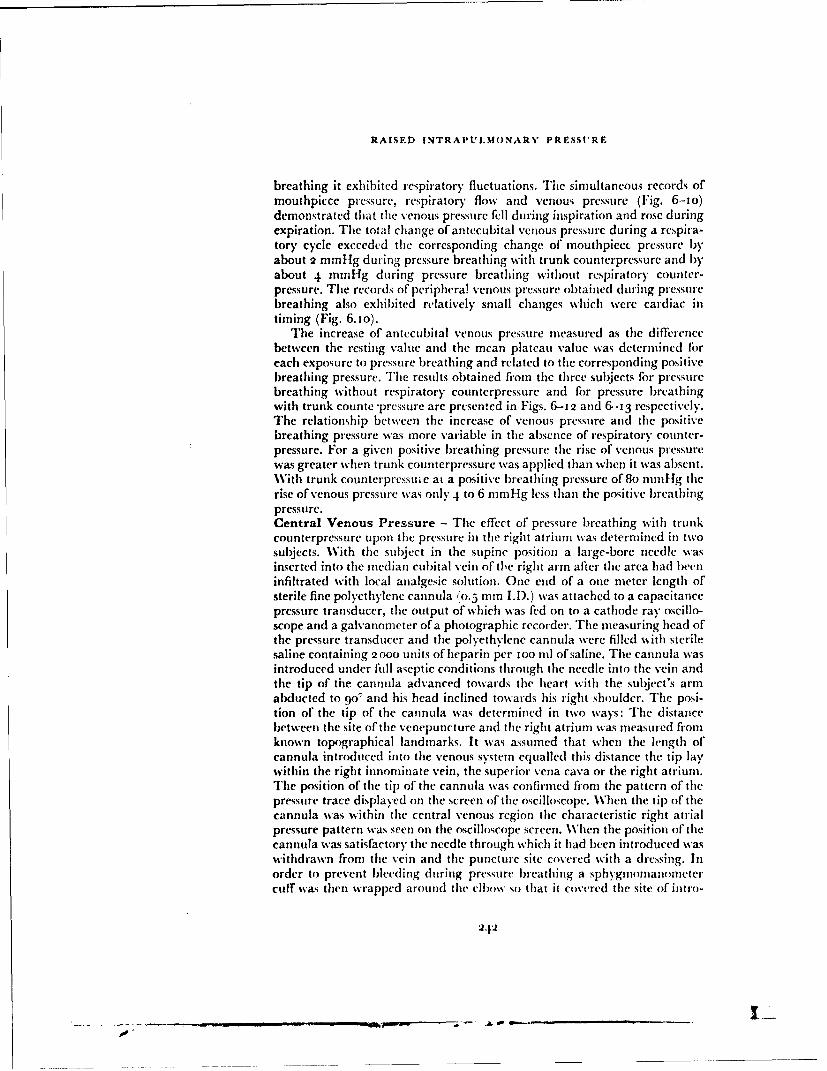
RAISED INTRAPULMONARY PRESStRFE
breathing it exhibited respiratory fluctuations. The simultaneous records ofmouthpiece pressure, respiratory flow and venous pressure (Fig. 6-10)demonstrated that the venous pressure fell during inspiration and rose duringexpiration. The total change of antecubital venous pressure during a respira-tory cycle exceeded the corresponding change of mouthpiect pressure byabout 2 mmntg during pressure breathing with trunk counterpressure and byabout 4 mmHg during pressure breathing without respiratory counter-pressure. The records of peripheral venous pressure obtained during pressurebreathing also exhibited relatively small changes which were cardiac intiming (Fig. 6.io).
The increase of antecubital venous pressure measured as the differencebetween the resting value and the mean plateau value was determined fbreach exposure to pressure breathing and related to the corresponding positivebreathing pressure. The results obtained fi'omn the three subjects for pre';surebreathing without respiratory counterpressure and for pressure breathingwith trunk counte -pressure are presented in Figs. 6-12 and 6-13 respectively.The relationship between the increase of venous pressure and the positivebreathing pressure was more variable in the absence of respiratory counter-pressure. For a given positive breathing pressure the rise of venous pressurewas greater when trunk counterpressure was applied than when it was absent.With trunk counterpressuie at a positive breathing pressure of 8o mmil-g therise of venous pressure was only 4 to 6 mmHg less than the positive breathingpressure.Central Venous Pressure - The effect of pressure breathing with trunkcounterpressure upon the pressure in the right atrium was determined in twosubjects. With the subject in the supine position a large-bore needle wasinserted into the median cubital vein of tile right arm after the area had breninfiltrated with local analgesic solution. One end of a one meter length ofsterile fine polyethylene cannula (0.5 mm I.I).) was attached to a capacitancepressure transducer, the output of which was fed on to a cathode ray oscillo-scope and a galvanometer of a photographic recorder, The measuring head ofthe pressure transducer and the polyethylene cannula were filled s ith sterilesaline containing 2 ooo units of heparin per 0oo ml of saline. The cannula wasintroduced under full aseptic conditions through the needle into the vein andthe tip of the cannula advanced towards the heart with the subject's armabducted to 9°° and his head inclined towards his right shoulder. The posi-tion of the tip of the cannula was determined in two ways: The distancebetween the site of the venepuncture and the right atrium was measured firomknown topographical landmarks. It was assumed that when the length ofcannula introduced into the venous system equalled this distance the tip laywithin the right innominate vein, the superior vena cava or tihe right atrium.The position of the tip of the cannula was confirmed from the pattern of thepressure trace displayed on the screen of the oscilloscope. When the tip of thecannula was within the central venous region the characteristic right atrialpressure pattern was seen on the oscilloscope screen. When the position of thecannula wa-s satisfactory the needle through which it had been introduced waswithdrawn from the vein and the puncture site covered with a dressing. Inorder to prevent bleeding during pressure breathing a sphygmomanometercuff was then wrapped around the elbow so that it covered the site of intro-
242
A_....

/
/ /°
/ 0
/i// *//
/ oc
Fm1(. 6-12 The increa~se of forearmn venous prcssure induced by pressure breathingwithout res~piratory counterpressture
so/40a
'B"
/ 0
//
//
* 1111 46
Fin;. 6-13 The increase of forearm venous pressure induced by pressure breathingwith trunk counterpressure
243
, , ii I I II I0
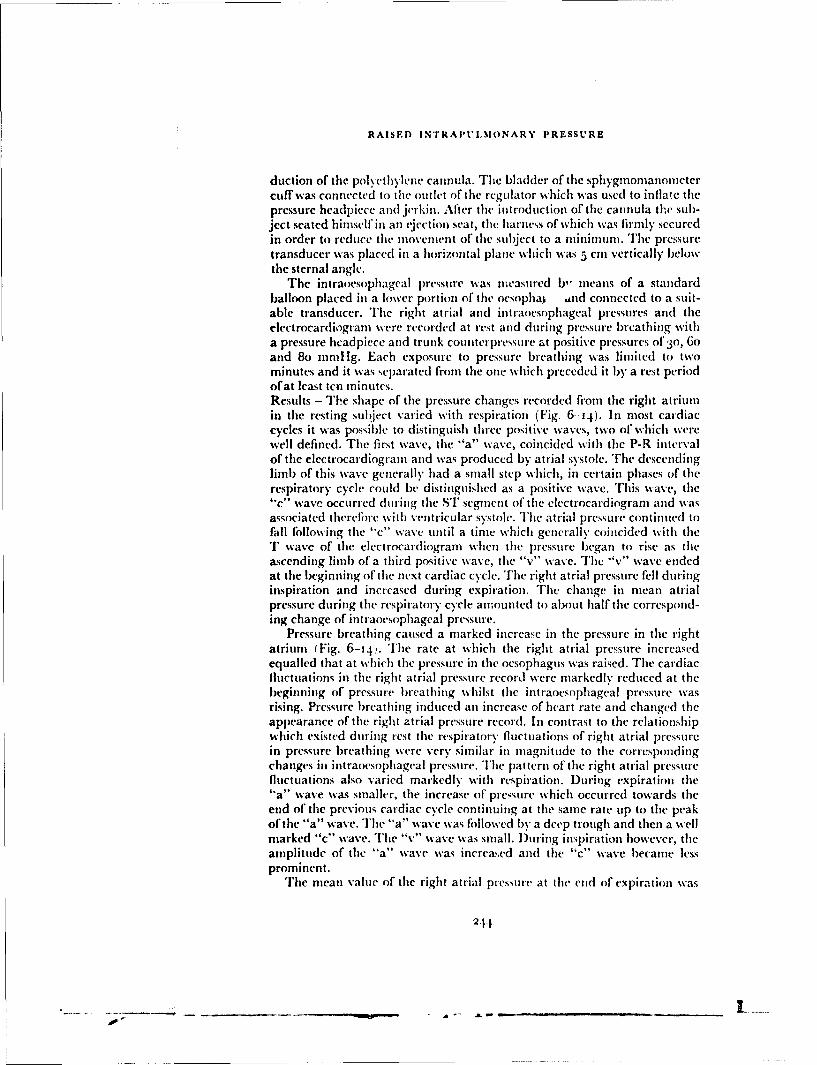
RAISED INTRAPI'LMONARY PRESSURE
duction of the polyethylene cannula. The bladder of the sphygionmanomctercuff was connected to thle outlet of the regulator which was used to inflate thepressure headpiece and jerkin. After the introduction of the cannula the sub-ject seated himself in an ejection seat, the harness of which was firmly securedin order to reduce the movenent of the subject to a minimum. The pressuretransducer was placed in a horizontal plane which was 5 cm vertically belowthe sternal angle.
The intraoesophageal pressure was measured b-' means of a standardballoon placed in a lower portion of the oeso)ha , ind connected to a suit-able transducer. The right atrial and intraoesophageal pressures and theelectrocardiogram were recorded at rest and during pressure breathing witha pressure headpiece and trunk counterpressure at positive pressures of 30, 6oand 8o mmHg. Each exposure to pressure breathing was limited to twominutes and it was separated firom the one which preceded it by a rest periodofat least ten minutes.Results - The shape of the pressure changes recorded firom the right atriumin the resting subject varied with respiration (Fig. 6--14). In most cardiaccycles it was possible to distinguish three positive waves, two of' which werewell defined. The first wave, the "a" wave, coincided with the P-R intervalof the electrocardiogram and was produced by atrial systole. The descendinglimb of this wave generally had a small step which, in certain phases of therespiratory cycle could be distinguished as a positive wave. This wave, the"c4" wave occurred during the S'IT segment of the electrocardiogram and wasassociated therefore with ventricular systole. The atrial pressure continued tofall following the "c" wave until a time which generally coincided with theT wave of the electrocardiogram when the pressure began to rise as theascending limb of a third positive wave, the "v" wave. The "v" wave endedat the beginning of the next cardiac cycle. The right atrial pressure fell duringinspiration and increased during expiration. The change in mean atrialpressure during the respiratory cycle amounted to about half the correspond-ing change of intraoesophageal pressure.
Pressure breathing caused a marked increase in the pressure in the rightatrium (Fig. 6-14). The rate at which the right atrial pressure increasedequalled that at which the pressure in the oesophagus was raised. The cardiacfluctuations in the right atrial pressure record were markedly reduced at thebeginning of pressure breathing whilst the intraoesophageal pressure wasrising. Pressure breathing induced an increase of heart rate and changed theappearance of the right atrial pressure record. In contrast to the relationshipwhich existed during rest the respiratory fluctuations of right atrial pressurein pressure breathing were very similar in magnitude to the correspondingchanges in intraoesophageal pressure. The pattern of the right atrial pressurefluctuations also varied markedly with respiration. During expiration tile"a" wave was smaller, the increase of pressure which occurred towards theend of the previous cardiac cycle continuing at the same rate up to the peakof the "a" wave. The "a" wave was followed by a deep trough and then a wellmarked "c" wave. The "v" wave was small. During inspiration however, theamplitude of the "a" wave was increa~wd and the "c" wave became lessprominent.
The mean value of the right atrial pressure at the end of expiration was
244.

•70 -F•.aI;
so left
F16. 6-14 Simultaneous records of the intraoesophageal pressure (top trace), rightatrial pressnre' (middle trace) and the electrocardiogram (bottom trace) in a seated
subject at rest and whilst pressure breathing at a positive pressure of 6o mmHg
243
-- .--

RAISED IN'FRAPULMONARY PRESSURE
determined in each condition studied. The mean atrial pressure over thecardiac cycle which coincided with the end of expiration was estimated byplanimetric integration of the pressure curve for the cycle. This measurementwas made for the five to eight respiratory cycles which occupied the last thirtyseconds of each two minute exposure to pressure breathing. The correspond-ing values of the intraoesophageal pressure were determined from the recordand the difference between each value of the right atrial pressure and thecorresponding intraoesophageal pressure calculated. The mean of the five toeight values of the right atrial-intraoesophageal pressure difference (effectiveright atrial pressure) obtained for each experimental condition, was calcu-lated and plotted against the corresponding positive breathing pressure(Fig. 6-t5). In both subjects the effective right atrial pressure fell progres-sively as the positive breathing pressure increased.Systemic Arterial Pressure - The effect of pressure breathing at variouspositive breathing pressures and with varying degrees of counterpressureapplied to the trunk and limbs upon the systemic arterial pressure wasmeasured by direct puncture of the brachial artery in several experiments oneach of six subjects.
The subject, wearing the appropriate pressure clothing assembly, sat inan ejection seat, the harness of which was secured firmly in order to reduce toa minimum movement of the subject in inflation and deflation of the pressureclothing. The brachial artery pressure was measured by introducing a Rileyneedle into the artecy and connecting it to a capacitance pressure transducer.The pressure transducer and the tip of the intra-arterial needle w%,ere placedin the same horizontal plane which w,',s io cm vertically below fhe sternalangle. The pressure in the partial pressure headpiece was also measured witha strain gauge pressure transducer. The output of the transducer amplifierswere fed on to the galvanometers of a photographic recorder.
Pressure breathing was performed using a partial pressure helmet witheither no counterpressure applied to the body or varying degrees of counter-pressure applied to the surface of the body. In different exposurts counter-
pressure was applied to the chest alone with the pressure breathing waistcoat,to the trunk alone with the pressure jerkin and to the trunk and lower limbswith a pressure jerkin and an anti-g suit. In the majority of experiments eachexposure to pressure breathing was limited to one and a half minutes. Onsome occasions, however, the duration of the exposure was prolonged to fouror five minutes. Each exposure to pressure breathing was separated firom thepreceding one by a rest period of at least three minutes duration.Results - Pressure breathing always increased the systemic arterial bloodpressure. The general form of the change was independent of the degree ofpositive breathing pressure employed and the counterpressure applied to thebody. Both the systolic and diastolic pressures increased as the pressure in theheadpiece was raised (Fig. 6--16). The arterial pressure was raised for as longas the positive pressure was applied to the respiratory tract. The respiratoryfluctuations of arterial pressure were more prominent during pressure breath-ing. The heart rate increased with the induction of pressure breathing whilstthe pulse pressure fell as the pressure in the headpiece was increased. Thepulse pressure was reduced below the resting value throughout the pressurebieathing period. The shape of the arterial pres.'ure wave was changed by
246
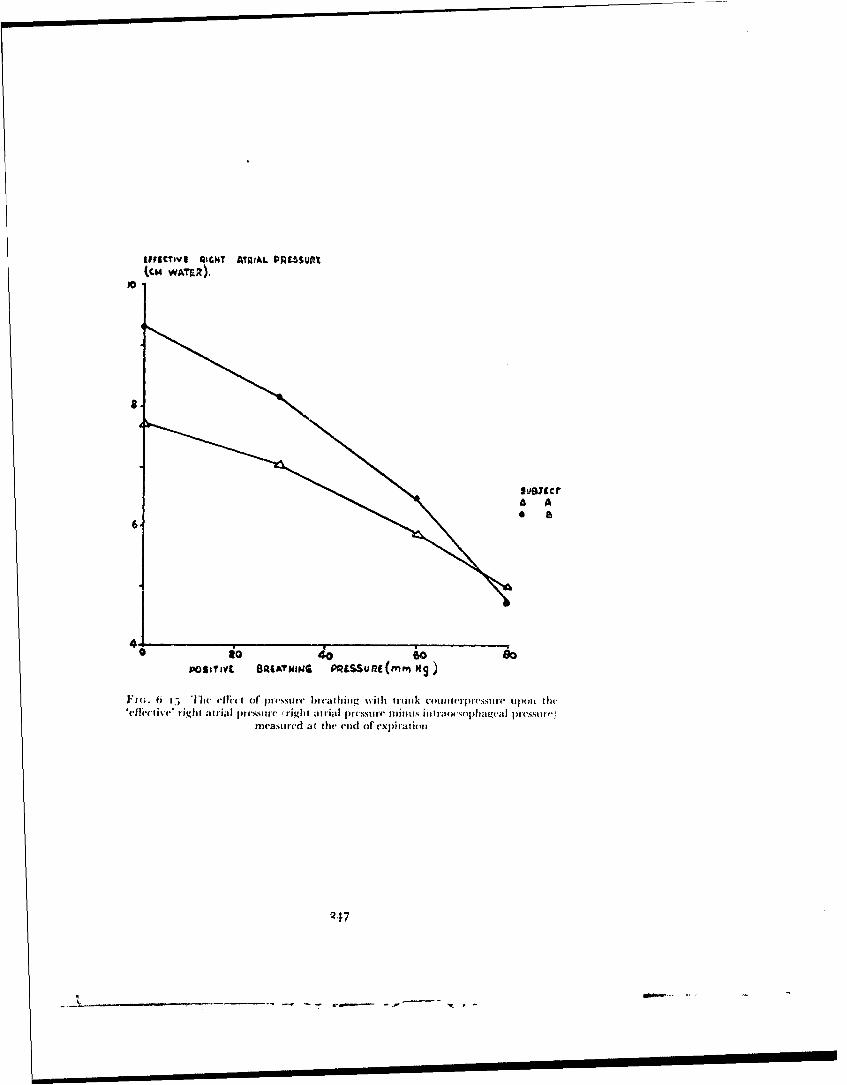
&VIFFCTev AIGHT AIAIAL PAMUt.SP
A A
POSMrYC BRATANING PRLSSUflE(mnrn Mg
F,(;. t i jI-) efni, mi or J)i(ssti!I breathing %ith ttrunk couiiteipi-cstire iipo~i thcIc11clt j '. tight atrial I nc,,sre (rcight atrnial pr st-mure minuits iiitnxsra ~plageai pressm")
nivasured at the enid of exp~irationt
247

I'ic b lh ii tof ~t'SI ehiet 'cc ~ iiT I-uc "71c r ieaic taJOII
pi-~ ic' F cc urnH ~ Upoc 1w pcssi -c cc hebrahia ater loertrae 00c
hed ec7 ~iISIIi- i c cpli ed~ ~ PP'i0t0c*0 00~.* (co
AtL.
@w 4 *w~ 7, 0
F I -6 7 1 e rit onhi bt% cn hepoit% bew6n prftC1Sean teinres
in ~ ~ ~ ~ ~ ~ ~ ~ j 7rnatra rsuedrnzpeurb:ahn %~ s~uvlcdi n
varou dgresoft unn resue ppie t te )<,,
248
01* -ý

(CARDIOVASC(ULAR EFI-FEC(TS
pressure breathing, the diet otic notch and wave being tiuch more prominentduring pressure breathing than at rest. With the cessation ofprcssure breathingthe arterial pressure Jell rapidly with the pulse pressure rcmaining lowfor three to fbur beats (Fig. 6- 16). '[his preliminary fall was followed byseveral beats in which the pulse pressure was vcry large. Thus followingpressure breathing at a positive breathing pressure of 8o mmHg the maximumpulse pressure was o5 mil-ig as compared with a resting pulse pressure of 45mlnHg. The very large pulse pressure which occurred three to five secondsafter the cessation of pressure breathing was also associated with a markedcardiac slowing and a rise of the diastolic pressure. The pulse pressure anddiastolic pressures then declined over twenty to thirty seconds to regain thevalues which existed befbre pressure breathing was started.
The magnitude of the increase of arterial pressure produccd by pressurebreathing varied with the positive breathing pressure and with the degrce ofcounterlpressure applied to the body. The mean arterial pressures over thelast thirty seconds of rest and over the last thirty seconds of the period ofexposure to presstire breathing were obtained firom each record of arterialpressure. The increase of the mean pressure produced by pressure breathinigwas then related to the positive breathing pressure. There was only a smallvariation bIntwece' the responses of different subjects to a given intensity ofpressure breathing under the same conditions, so all the results obtained inthis study arc plesented together ill Fig. 6--1 7. For a given degree of'counter-pressure the intcrv'ase of mean arterial pressure was directly proportional tothe positive breathing pressure. At a specified positive breathing pressure theincrease i mllean arterial pressure was iinimal with no counterpressure androse progressively with pressure applied to chest, trunk and trunk with limbs,reaching a value which feqiieintly exceeded the applied positive breathingpressure. The arterial pressu re records were anyalyzed further by measuringthe mean pulse pressure during the last thirty seconds of the rest and of thepressure Ircathing periods. The results of these calculations are presented illTable 6 -2. Pressure brcathing per se rcducecd the pulse pressure but theapplication of counterpressure raised tile pulse pressure above the valueachieved by pressure breathing alone.The Heart Rate -- Oie of the standard limb leads of the electrocardiogram,generally lead 1I, was recorded in many of the experiments in which subjects%%ere exposed to pressure breathing at various po,;itive breathing pressuresand with various degrees of respiratory coutitcrpressure. Ill all these experi-ments the subject was in the seated position atid had rested for at least threeminutes before pressure breathing was initiated. In a small series of cxperi-ments simultaneous records were taken of the three standard limb leads.
Two specific scrivi of experiments were performed on six subjects. Ill thefirst series of experiments each subject was exposed on a number of occasionsto a poitive breathing pressure of 6o mimig fbr a period of three minutesusing a partial pressure ielincl. D)uplicate experiments were perfbrmed witheach subject wearing I0ur differmcit coribitiationms of pressure clothing, viz..the pressure breathintg •,ai•tcoat. the presure jerkin, the p)ressure jerkin andthe anti-g suit and the a-n jetkiul and anti-g suit. The second series of experi-ments consistcd of exposing each of the subjects whilst %%caring a pressurejerkitn oil two sepaiate occasions to three different positive breathing
249
, - Now'
RAISED INTRAPI'tiMONARlY 'RESSstRE
pressures. The positive breathing pressures used were lo, 7o and too mmHgand the duration ofeach exposure o tlhe two lower pressures was three minuteswhilst the exposure to the highest pressure was limited to one and a halfminutes. In both series of experiments the order ofexposutres was randomizedwith regard to positive breathing pressure and combination of garments.Results - In general no gross electrocardiographic abnormalities were seenduring positive pressure lreathing at ground level unless syncope occurred.In subjects who exhibited an occasional premature systole at rest this abnor-mality did not arise during pressurt' breathing. When lead I of the electro-cardiogram was recorded only small changes were seen in the shape of theQ.R.S. complex during pressure breathing but records of the three standardlimb leads showed that in certain circumstances pressure breathing causeddistinct changes in the shape of the Q.R.S. complex (Fig. 6--18). With theinduction of pressure breathing the R wave in lead I became smaller, whilstin lead III the height of the S wave was decreased. At a given positivebreathing pressure these electrocardiographic changes were most markedwhen pressure breathing was performed without respiratory counterpressureand they were least apparent when counterpressure was applied to the wholetrunk tFig. 6--18 . With a given degree of counterpressure the changes be-came more prominent as the positive breathing pressure was increased.
The magnitude of the effect of pressure breathing upon the heart rate in agiven individual varied with the positive breathing pressure employed, theduration of the exposure and the degree Of countenrprCssure applied to thebo)dy. At low positive breathing pressures and where counterpressure wasapplied to the greater part of the body the heart rate was either unchangedor only slightly increased by pressure breathing. At positive breathing prcs-sures alboe 4(; mmHg pressure breathing with either no counterpressure oronly trunk counterpressure always caused an increase of heart rate. Thuspressure breathing at 6o mmHg with trunk counterpressure caused an almostimmediate increase of the heart rate ;Fig. 6-iqx. The heart rate was increasedrapidly during the firt thirty seconds of pressure breathing and then the rateof increase generally fell. (;enerally, however, when the positive breathingpressure exceeded 40n miniig and only trunk counterpressure was applied, theheart rate continued to rise throughout the exposure to pressure breathing.
The electrocardiographic records obtained in the two series of specificexperinments were analyzed by coutnting the number of heart beats in eachthirty second period and calculating tile corresponding heart rate in beats perminute for each of the intervals. The mean values for the heart rate for eachthirty secondl interval over the last minute of the rest period, during pressurebreathing and for the first two minutes of the recovery period fior the twoseries of experimnents are presented in Figs. 6--io and 6-20. The rate of' in-increa,e of' heart rate and€ the maximunm heart rate induced by pressurebreathing at 6o iniItsg %%ere greatest when c( unterpressure was applied tothe chest alone and %%erc minimal % hen counterpressure was applied to thetrunk and tipper and lmwcr limbs Fig. 6--i . When trunk cou|nterpresutrewas used the rate of rise and the maximum value of the heart rate both in-creas,-d as the positive breathing pre-omire was increased Fig. 6-2,
"Two subjects were expo)sed on one occasion each to a positive breathingpresture of 30, mntilig whilst wearing a partial pressure headpiece, pressure
250

PA. bfkrN* COVNTEP PRE56.uaE
I *
PR aR.-COUNTERPRESSURE
F 1(;. 6 i 11 cif(.c't of f'j~r na~iiim at a POsitilf- pressuItc of 4o mmlitz1 withand withount tittivk roctimctlmI1,,rl upOim thr thure stantdard ljimb leads of the
clcttx. ...........mn
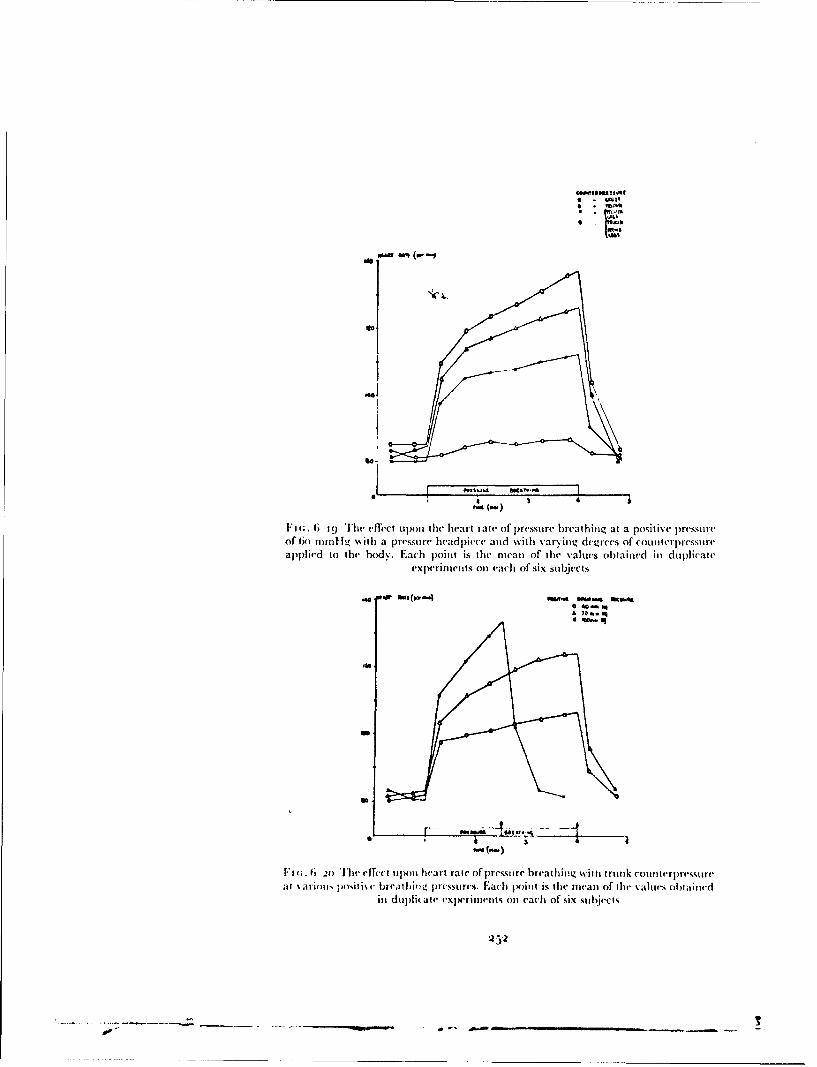
tots
11
maw IMF (w -
ll; - The eff-ct upon the heart rate of pressu~re breathijng at a positive pressureof tio mntill %%ith a pressu,'e hleadlpice( and with varying deglrees oif counllterpre',ssure(aplpliedl to the body%. Each point is the mean of thle values obtained h) dtiplicate'
exiperiments on each of six sub~jectsW, WN A4(- 5oft ~ A K A
-~ C-
Fi';. 6 3o The effect upon hehart rate of presures breathing i trnk COuItMITrpressure
ai \arip•p! je )sitoth brhd Ealbiv rcssures. Each tx)int is thhe mealn of ahr aeis obtalineadin duplicate txorimtt e ach of six s ubjects
•o 4@.

CARDIOVASCI-LAR EFFECTS
jerkin and anti-g suit. 'This procedure rapidly produced a very high hieartrate (Fig. 6-21). In an attempt to reduce arm discomfi,rt the sub ject periodic-ally tensed the muscles of the tipper limbs and flexed the elbows. Thismanoeuvre was associated with a mar'ked but temporary reduction of theheart rate.Duration of Protection at Ground Level - Several series of exposures topositive pressure breathing were performed at ground level with variousdegrees of counterpressure applied to the body in order to define the timecourse of the cardiovascular effects in a number of subjects. Two differentgroups of subjects were used in these experiments. One group consisted ofmembers of the staff of the Institute of Aviation Medicine who had con-siderable previous experience of pressure breathing. The other group con-sisted of aircrw volunteers who had no previous experience of pressurebreathing at positive breathing pressures above 30 mmHg. The latter groupwas always given a series of exposures to pressure breathing over one or twodays before the final experimental determination of their tolerance to highpositive pressure breathing. This training was performed using the assemblyof pressure clothing which was to be worn in the final experiment. It consistedoffaimiliarization with the equipment and adjustment of fit so as to ensure themaximum possible degree of comfort. The positive breathing prcssure and theduration of exposure to it were gradually increased in this series of preliminaryexperiments.
The subject was strapped in an ejection seat and was at rest for at least fivemiautes beibre the exposure to pressure breathing was started. The experi-inents were performed in a room, the temperature of which varied between18' and 2oC(.. 'Ihe duration of the exposure to a given breathing pressure wasvaried with the degree of counterpressure worn by the subject (Table 6-3).
In each experiment lead II of the electrocardiogram was recorded con-tinuously and the arterial blood pressure was measured by the indirect tech-nique using a sphygmnomanoneter cuff amid a piezoelectric transducer.
An exposure to pressure breathing was terminated if the subject signifiedthat symptonms of an impending collapse had arisen. The subject was closelyobserved and pressure breathing was stopped directly there was any impair-ment of consciousness a, indicated bv a failure of the subject to respond to asimple command. An exposure was also terminated if the heart rate suddenlyfell to a value of less than eighty beats per minute or if the systolic pressurefell by more than y) mmnlg. In the event of a collapse the subject remainedseated in the ejection seat until his heart rate and arterial pressure approachedthe resting value. The pressure headpiece -- oronasal mask was usuallyremoved directly pressure breathing was stopped. Facilities were availablefor placing the subject supine with his head 20 cm lower than his feet shouldhe fail to reg,,in tonsciousness within ten seconds of the cessation of pressurebreathii.g. A subject was not exposed to pressure breathing for at leasttwenty-four hours following a syncopal attack.Results - The overall results of these experiments are summarized in Table6---. Most of the subjects, both experienced and inexperienced, successfullycompleted the various exposures to pressure breathing. The cause of a prema-ture termination of an exposure to pressure breathing was always the develop-ment of a syncopal attack.
253
I' r1V
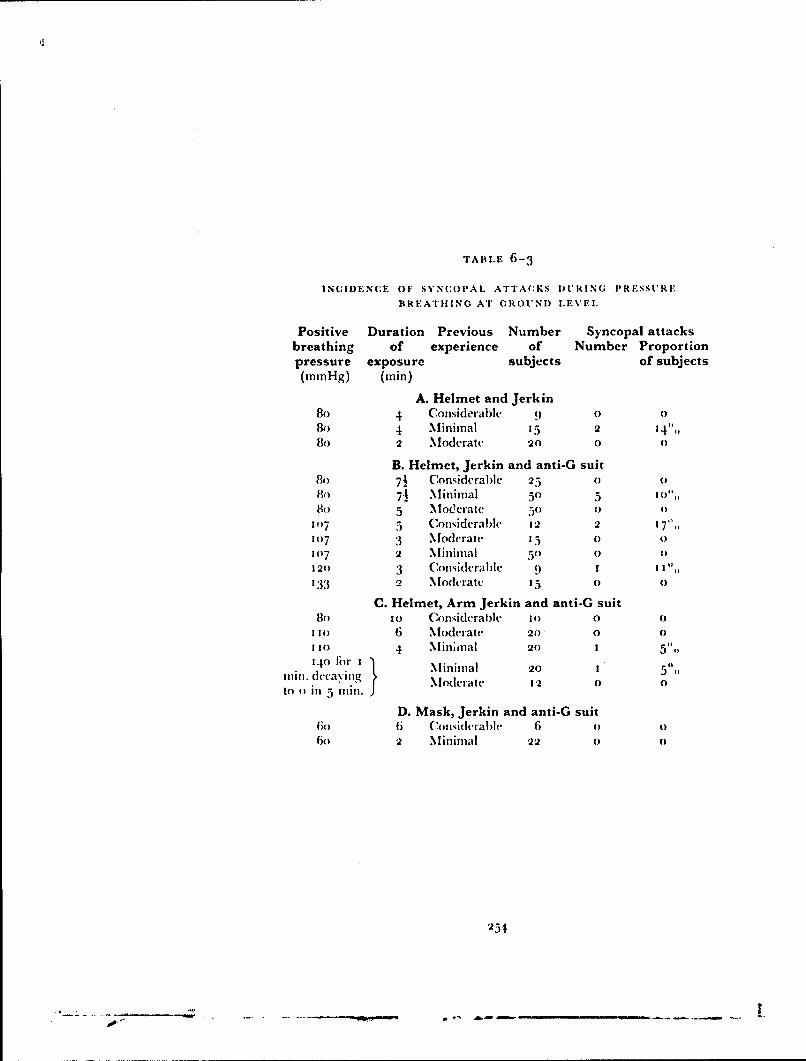
TABLE 6-3
INUIDENCE OF SYNCOPAL ATTACKS DURING PRESSURE
BREATHIING AT GROUND LEVEL
Positive Duration Previous Number Syncopal attacksbreathing of experience of Number Proportionpressure exposure subjects of subjects(mmHg) (ain)
A. Helmet and Jerkin80 4 Considerable 90 0Bo 4 Minimal 15 2 14",,8o 2 Moderate 20 0 0
B. Helmet, Jerkin and anti-G suitBo 7½ Considerablc 25 0 08o 71 Minimal 53 5 o0',,
8o 5 Moderate 50 0 0
1()7 5 Considerable 12 2 I 7',,107 3 .Modcrate 15 0 0107 2 .Minimal 50 0 0120 3 Considerable 9 1 Il%,,133 2 Moderate 05 o o
C. Helmet, Arm Jerkin and anti-G suit8o 1o Considerable 10 0 0
1 30 6 Moderate 20 0 0
1 0 4 .Mininal 20 I 51,,340 tur I "- Minimal 20 1 5"'
rin. dcca~ving Moderate 12 0 0to 0 if' 5 Olin.
D. Mask, Jerkin and anti-G suit6 Ii C(, midcrablh 6 o o
60 2 Minimal 22 0 0
253
'* -- - - -- - - - - - - - , s
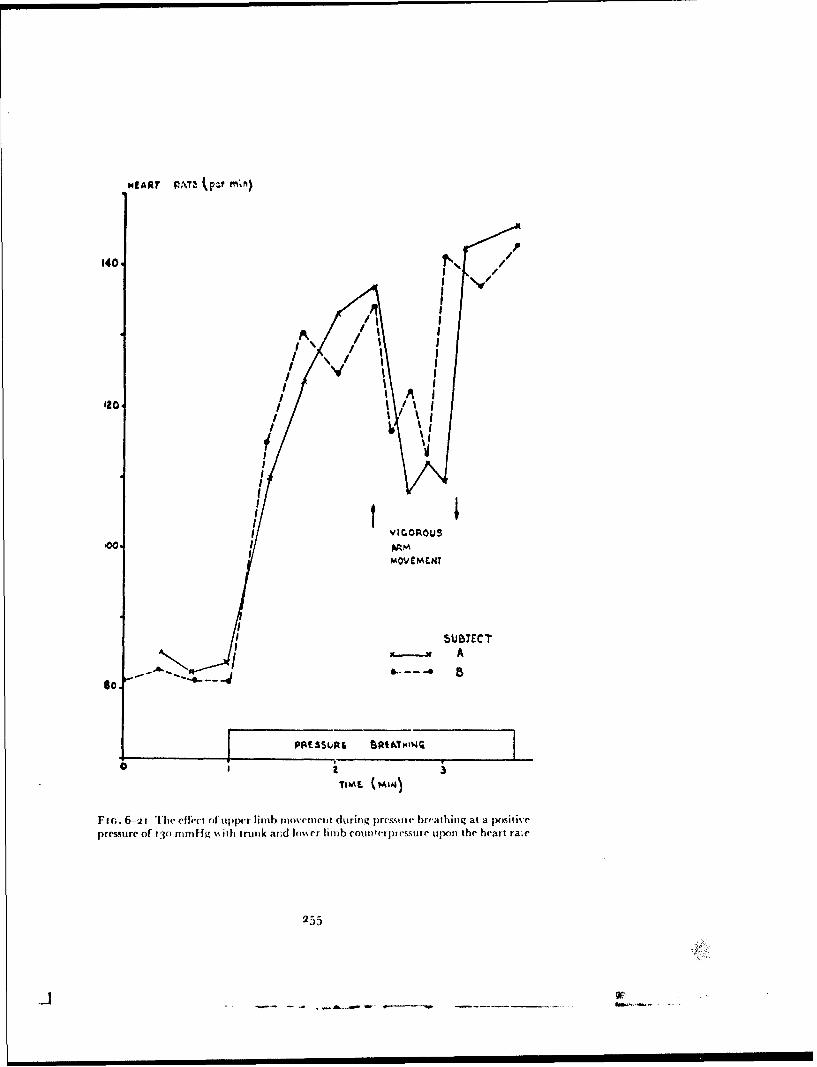
HfART PAT4, kp m
140-N
I' A
IoIFI
IA m
'AA
PAES0P I /1 I4
TIE044
premurcof ~ ~ 13)/nHg%%t rn n Im~rlnbonepCSr l~ltehatr~
255
/ 'W

w I
\ t
* a4
Ft(;. 6 -.:2 The arterial blood pressure and heart rate during an exposure to pressurebreathing with trunk counterpi essure at 8fo mmn-ig which w-as terminated by a
syticoptal attack
'0
0 40
Fm ;. 6 -•15 T'he relationship httween the time at which syncope occurred and thepositive breathing press .rc during prcssure breathing with trunk counterpimessure
256
A 1 0- l - ....
CARDIOVASCI'U.AR EFFECTS
The clinical features of syncope induced by pressure breathing varied onlyslightly from one individual to another. The onset of syncope was generallyheralded by a feeling of nausea and uneasiness. These symptoms were usuallypreceded or accompanied by the sudden onset of sweating, especially on theface and hands. At this stage there was marked facial pallor. The symptomswere rapidly fillowed by dimming of vision and then complete loss of vision.Unconsciousness occurred within a further few seconds. Los., of consciousnesswas sometimes accompanied by a diminution of postural tone, particularlyin the limbs. On several occasions unconsciousness was associated withspasmodic movement of the limbs which were sometimes followed by a majorepileptiforin convulsion. Recovery of consciousness followed rapidly uponcessation of pressure breathing. Following syncope the subject usually ex-hibited facial pallor and often complained of slight nausea firom half to onehour. Although pressure breathing was nearly always stopped when thesubject developed facial pallor and dimmning of\'ision, consciousness was lostin about half of the instances in which syncope terminated an exposure topressure breathing.
The changes of heart rate and arterial blood pressure which occurredduring the development of syncope were very similar on all occasions. Theheart rate and arterial blood pressure during a typical syncopal attack arepresented in Fig. 6--22. l)aiag one or two minutes before syncope occurredthe heart rate increased rapidly to attain a value of between 13o and 170beats per minute when collapse was imniinent. Over the same period thearterial pressure, both systolic and diastolic declined. The rate of fall ofarterial pressure suddenly accelerated and the heart rate suddenly fell,usually to a rate of less thai 6o beats per minute. These sudden cardiovascularchanges were associated \ith the impairment and loss .)f vision and finallyloss of consciousness already described. At this point pressure breathing wasalways terminated. This was followed by a slow increase of heart rate and arise of arterial blood pressure towards the control values which pertairiedbefore pressure breathing was commenced.
The primary factors which determined the incidence of syncope duringpressure breathing were the positive breathing pressure, thie duration of theexposure and the degree of counterpressure applied to the body CTab!e 6-3).The incidence of syncope was also influenced by the prcviocs experience ofthe subject of high pressure breathing. Other factors being equal the incidenceof collapse was lower in experienced subjects than in those who had only avery limited experience of this procedure. Two-thirds of the subjects who hada syncopal attack experienced severe discomfort or firank pain during theexposure to pressure breathing 1 Table C)-4). Whilit 67(',, of the subjects whodeveloped pressure breathing syncope had a previous history of vasovagalsyncope, only I5",, of tile subjec-ts who did not develop pressure breathings\ neope had a previous history of syncope.
A number of experiments were perfbrmed in which three subjects, each ofwhom had had consideraole pre% ious experi.'nee of pressure bircathing, wereexposed to various positive breathing pressures whilst using trunk counter-pressure alone, Particular care was taken in these experimnits to ensure thatthe pressure headpiece and jerkin fitted the subject correctly. Each of theseexposures %% as continued until !le subject dcvelh ped siiitpoms of an impending
257
- -- -,- -... .
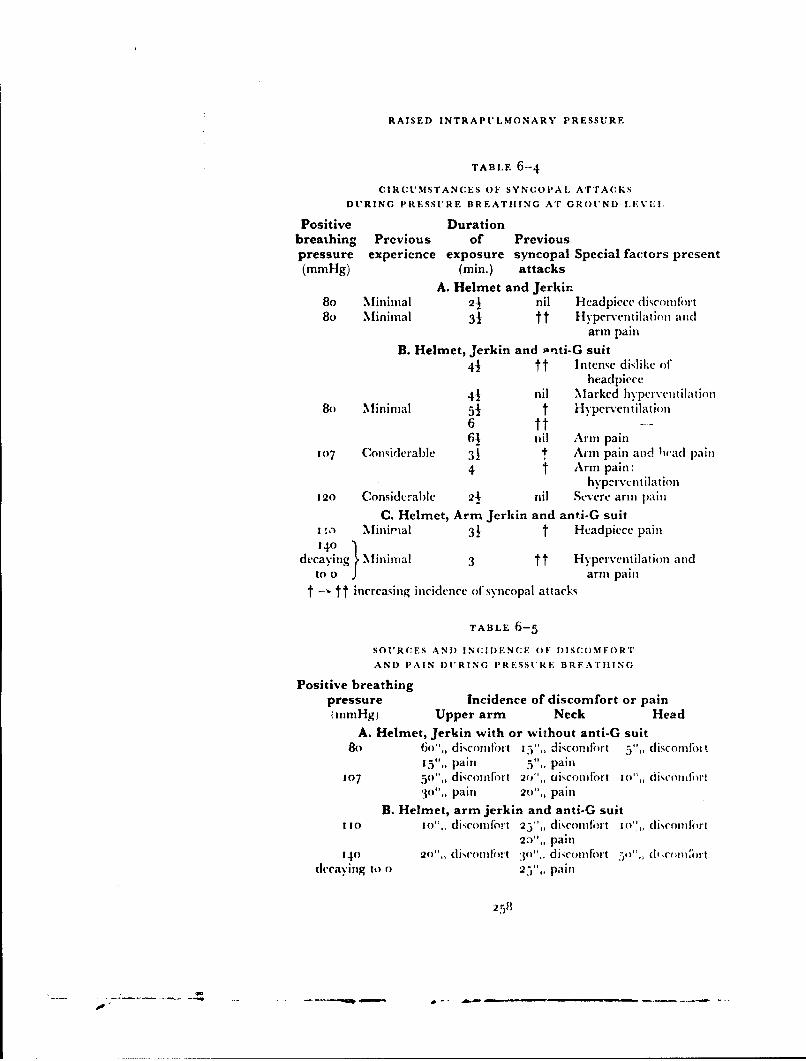
RAISED INTRAPULMONARY PRESSURE
TABLE 6-4
CIRCUMSTANCES OF SYNCOPAL ATTACKS
DURING PRESSURE BREATHING AT GROUND LEVLI,
Positive Durationbreathing Previous of Previouspressure experience exposure syncopal Special factors present(mmHg) (min.) attacks
A. Helmet and Jerkin80 Miniznal 21 nil l-ieadpiece discomfort8o Minimal 31 tt Hyperventilation and
arm pain
B. Helmet, Jerkin and ,-nti-G suit41 tt Intense dislike of
headpiece
4-1 nil Marked hyperventilation8o Minimal 51 t Hyperventilation
6 tt--61 nil Arm pain
107 Considerable 31 t Arm pain and Iiad pain
4 t Arm pain:hyptr\cntilation
120 Considerable 24 nil Severe arm pain
C. Helmet, Arm Jerkin and anti-G suitI Minirmal 31 t Headpiece pain140
decaying Minimal 3 tt Hyperventilation andto 0 1 arm pain
t -" tt increasing incidence of sy1ncopal attacks
TABLE 6-5
SOURCES AND INCIDENCE OF DISCOMFORT
AND PAIN DURING PRESSURE BREAT11ING
Positive breathingpressure Incidence of discomfort or painImmHg) Upper arm Neck Head
A. Helmet, Jerkin with or without anti-G suit8o 6o",, discomfort IV5,, disconifirt V,, discomfoit
I"V,, pain 5',, pain107 5o',, dicomfi'rl 2W',, aisconiort Io",, dikcotnii rt
30",, Pain 20",, painB. Helmet, arm jerkin and anti-G suit
110 io",, discoindlrt 25",, diomlfort 1o'',, di"somnort23",, pain
140 2o",, diconcifi fr 5o",, discomfilort d1,, c ,16rtdecaying to o 25",, pain
258

CARi)IOVAS(:tLAR EFFECT:,S
collapse. In every instance the electrocardiogram showed that thesymptomls were accompanied by a sudden and profound bradycardia. In noinstance did the subject stif]'er any severe discomfort or pain during thecxposure to p~re:ssure breathlung. iT'c relationship lnetweenI tile positive breathi-ing pressure and the duration of' the exposure when syncope occurred ispresented in Fig. 6- 2,J. The durlation of' aa exposure to pressure br-cathingwhen syncope arose tlecreased as the pv.iitive breathing pressure was in-creased.*
A considerable proportion of the subjects experienced sonie discomifortduring pressure breathing, particularly at the higher positive breathingpressures. The incidence of' the main types of discomifort which occurredditring positive pressure b~reathinig with either a standard pi essure jerkin orant arm jerkin and( a partial pressure headpiece and anti-g suit are presentedin Table 6--5. There were two main sites of severe discomfobrt, namely theneck and tupper limib. TIhe pain in the neck arose in association with) thealbsence of counterpressure to the lower part of' this region. Severe paingenerally arose when the lower edge of the neck bladder of the headpiece layacross the larynx. At positive breathing pressures above 110o ininlig d~s-comlfor-t occurred in association with a !enidency of the headpiece to rise uipover the head. In the absence of counterpressure to tie ulpper limbs mostsubljects complained of some discomfort in the uipper arml durin~g exposure ZOpositive breathing pressures ab~ove 6o mmnilg lasting for mnore than onemninute. '11w discomfort was generally located onl the nmedial aspect of thetupper part of the uipper arm. It wsas of' the ill-localized sickening type. T1heintensity and ilicidlence of, t his diseomnfr"Ot increased as tise positive breathingpressure was raised above 8o minfig. A proportion of subjects experienced1firank pain in the uipper armis whnlii pressure breathing at positlive breathingpressures above 8o minnHfi. The occurrence of severe pain wvas sonietilliesassociated with a syncopal attack. '[he discomufort or pails in] tile upper limlbscould be relievei temporarily by tensing the inumscies of the upper arms.
In thecse experiments the subject's skinl was also inspeC~ted f~llowinig eAChIexposure to pre"sure breathing. Wh'len the positive breathing pressureexceeded Go nminflg pressure breathing produced petechial hiaemsorrhages ;nthe skill, the incidence of'petechial hiaemorrhages depending upon the Inagni-ttmde of' the posýitive breathing prc',ure and the duration of the exposure.''lums few petechmiae were seent after pressure breathing at 40 nufli~g for" tenmniuties whilst anl exposure to a positive breathing pressure of 8o mm Hfg forfive mnintutes always produced large showers, o Oiminute haemuorrhages in theskin. At a posýitive breathing plesslireý Of 13o ninnil-g many petechiiae werepresent after an exposure lasting only one mlinute. The distributitin of, these"liaeniorrhages was relatively constant. '[hey were most numerous in the skillat tihe upper border of the 10.01j~erkin beyond the armholes avd above theneck of the gar'neimt. The proximal bord-r of the rash was clearly L'-ljned andcoincided with the line. of' reflection of the bclader of the jerkin off the skill of'the trunk. D~istally the density of' the I e-techiae fell off so that flew were seenbeyonld the deltoid musxcle or onl the tipper part of the tieck. 1Petechiaz -~ -reonly seen in the forearm and hiand at positive hi eathingr pressures; above12t; mod 1g. No petechiae occurred ii (lie low\er liimibs. Occa~ionalhv atJ)o~iti~te breathimng pre~sutres mit excess of' oo mumnfg petecluiae wecre fiundI (.It
RAISED INTRAPt'LMONARY t'RFSSt',.E
tile trunk beneath the pressure jerkin. The diribution of these haemnorrhagescoincided with the fblds in the inner layer of the garment.The Effect of Hypoxia -Thc reactions of the individual to pressure breath-ing in the presence of hypoxia were investigated using two techniques. In onegroup of experiments acute hypoxia was produced by exposing the subjectwho was breathing air to an absolute pressure of either 349 or 380 nmiHg.Pressure breathing was then induced without changing the absolute intra-pulmonary pressure. In the other group of experiments hypoxia was Jroducedby exposing the subject, who was breathing too",, oxygen, to pressurebreathing with an intrapuhnonary pressure of less than tgo mmlig absolute.Pressure Breathing with Air - Each of the thirteen subjects used in thisstudy had had considerable experience of high-pressure breathing. Thesubject wore a pressure jerkin and a partial pressure headpiece and wassecured in an ejection seat placed in one compartment of the decompressionchamber. The inlet hose to the pressure jerkin and p ressure headpiece wasconnected to a two-way tap by means of which the :;ubject could be made tobreathe from either of the two compartments of the decompression chamber.The pres1,re in the pressure headpiece relative to that in the subject's com-partment was measured by means of a mercury manometer. The electro-cardiogram (lead 11) was recorded continuously for one minute hefbre andthroughout the exposure to pressure breathing. Two observers were in thedecompression chamber \,ith the subject throughout the experimentalprocedure. The observers breathed oxygen when the pressure within thedecompression chamber \was reduced to below 520 mmlig absolute.
The effect of pressure breathing at a positive breathing pressure of 52mmHg was investigated in each subject at three differert absolute intra-pulmonary pressures:
(a) 7,1o-77O ,nmdl/g abolute (inspired o'%ygen tension calculated fbr gassaturated with water vapour at body temperature of 144-153 mmHg.)The pressure in the subject's compartment was reduced to 52 "nmHg lessthan the prevailing barometric pressure, whilst the subject was breathingair from within the compartment. Pressure breathing was instituted byturning the tap so that the jerkin and headpiece were connected to theother compartment which was at atmospheric pressure. Pressure breathingwas continued for two minutes.(b) 380 mmHg abso!L:te inspired oxygen tension, calculated for gassaturated with water vapour at body temperature of 69 mmHg.) Thesubject breathed air throughout the procedure. The doors which separatedthe two compartments were open and the pressure within the compart-nents reduced to 38o mmHg absolute in four minutes. The recording ofthe electrocardiogram vwas started inmmediately the pressure reached 380mmHg absolute and the doors between the compartments were closed.
One minute after a chamber pressure of 38o mndIg absolute was attainedthe pressure headpiece and jerkin were connected to the second compart-ment and the pressure in the subject's compartment reduced rapidly by a
further 52 mmHg (the induction of pressure breathing took five seconds).Pressure breathing was continued for two minutes unless unconsciousnessoccurred or syncope was imminent. At the end of the pressure breathingperiod the subject was given oxygen to breathe.
26o

CARtt)I0 .\"(A I A R 1,tf-II
(c, 341) hnif!Ig abs"olute (ill pitecd oxygeii triusiol, (afiat( iw? gassatuorated wsith wsater vapour at lhody teiilrprall- of' 6: 111110g) Thetechnique cilployed wa-is smrn:iar if) tha;t (leserilted in thle precedingparagraphl, excepjt that the absolute precssilre used ill the SecondI COitipart-fliCnt wasO :349 "'Mitttg kll)s"olite.The order o t'i he xpos ures to ilie thri ee levels of partial precss ii r of ox genl
in the' inspiredl as wa,;s iaiidoniitic. The (J(.giie.5 oIf" ltN)oxia induliced by tilt-twso levels ol, absolute intrapridwin~uyt pressure used in this s: udv v.(redeterintirid by taking cndl-vXjil-atol\ I laldanle-Pr-icstley sa iitj)Is of' ivcolaigas. Tihe techniique ( i)\ hich l thes saliiples wecre obtained was, sitnilar io thatentplovecd to ob~taini sanil)les dtiiiini pi esuire breathing at shiimmrated ahltudesabove 5" tooo It Jtlpe 5).Results - 'Ilre results of' this group &f experinucnts are Jprestitmed in Table6 6. 'I'l( ittart vatres of(hher titl'liii ae befo6re art]du(trigill( th\%to minuteperiod1 of p less iir( I )ea t lin kig t at positivye pressuiire of' :t2 iii in Jig are piese ntedwith their. respective standard err-ors ill Fig, 6 -24. YEach subJect successfull\-cout~plvted an exposure to pressure bre'athIting at groundrc level. Thle mecanincrease of' heart rate over thIis period was 27.6 b~eats pr iiiin ute. E-Ileven ofthe( thirteen Subje'itcts exposed to pressure breathing at art in traprilitonarypressumre of' 38o ittifu ig ai)solurte suiccesfu'lly conlipleted tirle requinred two111mt nI'es. M ost of' the-se, however, wereC Moderately cvanowe d (uring thisperiod. Tlhe iisr of' iute; heart rate over the pressure b)reathing period wasniirelveit bea';ts J)L1 Ilii Iutte. Ill(- rentaitrirg twso sriitjects bvai'ciit nauseatedanrd sufifemed dinuri irg of' vision t hirt v and( one hundred seconds respectivelyafter tit(e beginnin lg or' pressure breathiung. Tlhere wa~s facial pallor anid aimuarked Itrad scard ia d uring the collapse in each case.
TWelve subl jects perforniedl pressure breathting wit Ii ant aitsoltite intra-Pill m1ollarv' rreso ""- of* z to -- mnl(T "' rollqtl C-flt !-I.
srace,.sý 1, , Ialgh ill(e\ exhtibited well-inarked cyanosis throughout thlelttle spenit at at chtair)Tlr presslure of' 349~ ninii iIg absolurte. 1 hre meanl hecart.rate was increased by 2,2.9) heats per- mininie over the p~ressure~ breathingperiod. Two of' tilt- three otfier sub~jects were restless arid severely confusedthroughout tite( exposurve to pressure breathing. Botlt these SUbjects had rapidb~ounidintg radial pulses whilst pressure btreathing. Tlhe remiaining subjectibecamet runcontsciorus fifteen seeconds after the( beginning of' pressure breathingand hiad a inajor convulsion. Thelire wa-is miarked br-idveardia and] the pulsewas imipalpable at the wrist during tihe collapse. Pressure breathing was('eased imnunedia tel)' and oxy'gen w~as adininistered. Recovery followedrapidly.
T1he results of the analyses of the end expiratory I lalda ne- Priest ley sali plesof alveolar gas obtained under thec conditions of the experiments performiedat reduced environnineital pressure in relation to the period of pressurebreathing are presentred in Fig. 6-25. T[he alveolar oxygen tension variedlXetween 37 and 12 vnifig (luring pressure breathing with art ab~soluteintrapulnionary pr-essure of 380 inrttig. At an ititrapulrnoriary pressure of349 miznlg albtolutv tile alveolar oxygen tension lay bet-weeni 35 and 40m111-g.Effect of Hypoxia upon Limb Volume The effect of hypoxia upon thechanges of forecarmn volumne induced by) pressure breathing was investigated
261
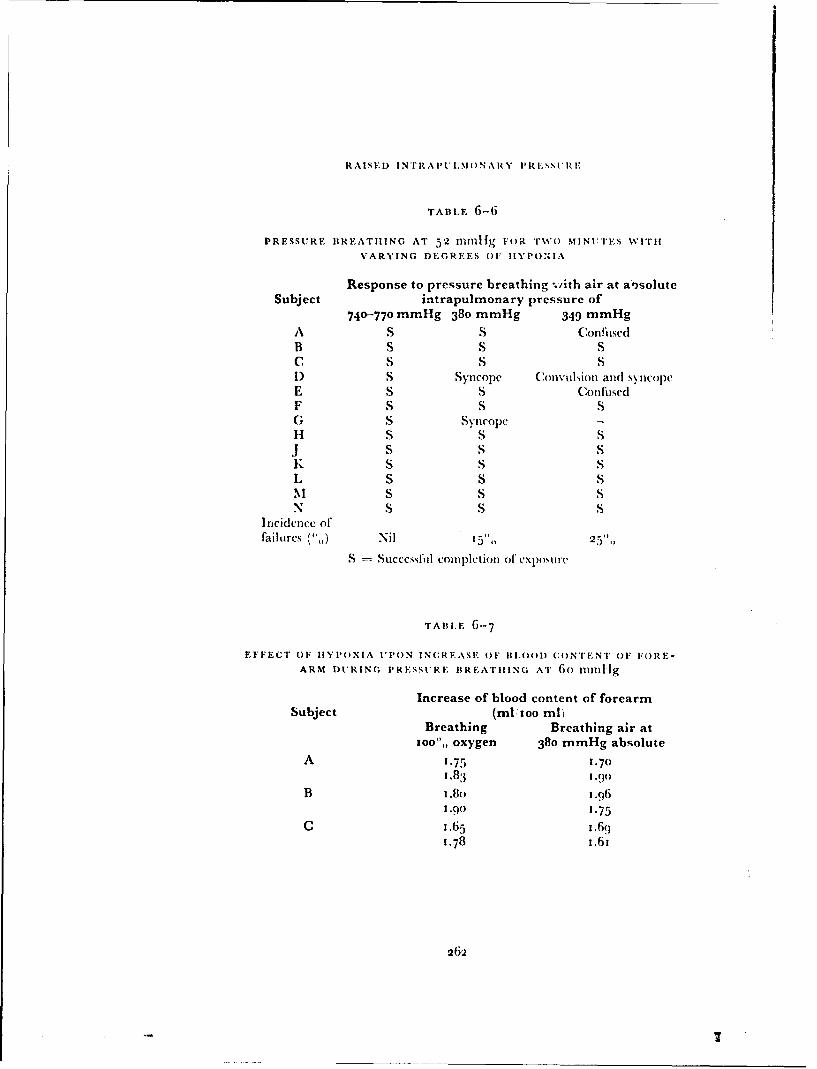
RAISED INTRAP'ULIM)ONARY PRFESS1'RI7
TABLE 6-6
1PRESSURE BREATIIING AT 52 rn"l119 FOR Trso MINUiTES wUITI
VARYING DEGREES OF IIYPONIA
Response to pressure breathing :,ith air at a~soluteSubject intrapulmonary pressure of
740-770 mmHg 380 mmHg 349 mmHg
A S S ConflisedB S S SC S S SI) S Syncope Convulsion and syncopeE S S ConfusedF S S SG S SyncopeH S S SJ S S SK S S SL S S SN1 S S SN S S S
Incidenice offailores (',) Nil 153',, 25 ,,
S Succcssfhl co0ft)lotioll of CXl)oS1Ic
TABLE 6-7
EFFECT OF IIYI'OXIA UPON INCREASE OF 111,001) CONTENT OF FORE-
ARM DURING PRESSURE BREATHING AT 6o ninlllg
Increase of blood content of forearmSubject (ml'Ioo ml)
Breathing Breathing air at1oo",, oxygen 380 mmHg absolute
A 1.75 1.701.83 1.(o
B 1.8o 1.961.o0 1.75
C 1.65 1.691.78 1.61
262

-N?ftAPý.MOWAlkyPat SSOgc
K 349 fI"M KS ASS.
T~D4'MN)
F IG 6 2.4 TlW Vfrf-CI of livpox ia upon the hearit rate diiitin g presstlire birathini ii %it hirutik oun i c ipressu ic at a positlive presit I c of 52 IIinii I (inwan values -- I ST.)E
2b3
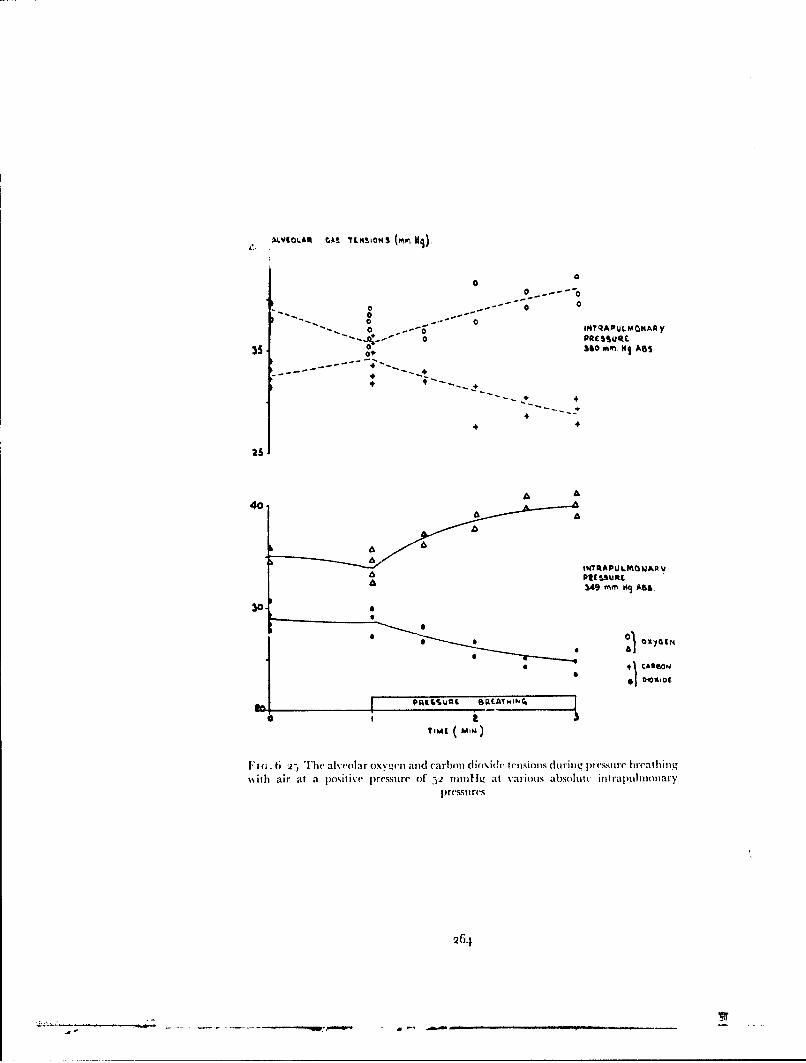
0
000
oo.o ---C
0 IM"QAPULMOKAA Yo PRES ul
35 A,- 360 mm. HI ASS
44
4 4.
+5+
25
A A40.
S~~INTqAPU LMOWAIV
3,49 mm 09 ASS.
300 i
• 149' .... As.
IMI MN)
"n(;. 6 t -.) '[he alveolar oxye-n and carbon dioxide teisioms during pressure breathing%with air at a positive pressure of )2 nmnlig at various absolhtv intrapulmnonary
pressures
26,1

I, IN It 1. 1 1 1 1 S
'i .tib.:cts e'xperientcetd in pre~ssure lireathiing. Ilie ;rettCI i aI', Ircr hea Id piece ait I I 'I d tir) jerk~n itiid ie wkas secu tred inl an cjcct' ion Seat
placed wit Jun one Conll)part nil nt of' a dccomipression cliahtibcir. l~rcssti rebreathinig and ltVp)Ox a we-re iuidticed ayi techiniquie sirni~lar to that uised inthet previol.s series of' ('xperintwnts. 'I'lie suibject %%as exposed to a posittivebreathing pressuire of(3o minnifg at anl intiapuilmunary pressuire of 38o innil igalisoltite. Tihe subject breathecd eithier air or too",, oxvgenl for five IliuJiHtesbefote anl]ditrouighouit the( sulbsequient tso m11inutes vXposurle to pressulrelweca i ing. Di )ring a single experimetnt eaz'hi sublject %\as exposed to pressuirebieathiting oil hoitit occas5ions. Tllc order ini 55licilt air. 0o' oxygen %Wd5 h~ct(lhiedwais randloini'/d. O ne tipper limib w\as suipported onl a table in a conlifloitableposition withi rublber pads p)lacetd benecathi the elb~ow% and \%lrist. *I'llte fiorearinlay itt anl horizontal platte %dhichi w\as aliotit 7 cml below% the sternal angle. 'Ilteciteulniferenlce of the litilb was i ecordled contintiotisis' by a nteciur\'-in-rtihbher,train gauige (2861, placed arotinid the u tpper part of the( f'orearnt. Tliei oilttpitof (lthe bridge aliitjlifierl ti) which the gauge wscotnnected wsf''d onl to atgalvatt nicter of a plitovtieral)hi re coidrResuilts -- 'I'lie itncrease of f'oreartn circtitttfet cnce duie to thie pet'ipht't'al dis-placenrien t of' Wood \i\.(1;ws nicatea ret fritnt Olie phliotgigrapl tic record Iy ~vtIt etecliniqltie describ~ed earlier' in this ('hapter. Tihe acttial increase of' voltitie
tir nit vol1111 t teof'foreal Iii wýas cal (' tat ed 286-, 'I'lt( reitstilts of lici; tt' e (%l'i -
titents ate( pt('senited inl Table 6 7. 'Illtete wast' no( signifi('alit tiff'rIenlee b~e-tw%-een the( initial itci ceat of, toterc1 lit v'tltiitle indtic(l dlb\ prcý,tlrc brt'athtingtunder 1Iv poxic condition', as k 11Iilao'd withI the itictease whionti te srtbjcetbreathedi loo", ox\vgeti.Pressure Breathing with oxygen at low environmental pressures'I'lese exlperinietlts we-re pet'fotiteld in t lie smiall conipart iltett of tltt ft'coitt-prt'ssion chiarllel. All the stil jeets hvidu st('cessftillv etainjt'tcd a pi ogrartnilieof' traininig in pressuire breat Iitig at giotittd levecl before thit' expotsure topressturet breathing at lo%\ eitvironnictnetal prt'ssuire w~as carried otiti . 'lTbesubject, wecaring thei a~sst'tblv of' prtssttirc elothiig, unidter inivestigationi. w~assec ti ted in lie seat fillted ili tit lie ch a tpress iona clhaniii e r. 'I lie ortatasa I niask
orpresstit'e hecadpiece andtil le pressuire clothitig wevre cotnnected tto all altitt-inatic pressure deinand repulattr MNark- 20 or 21) Set to deliver 100"',,
oxygen Ohrouggho.it *1cC", .sptriii . Tlic pi esstit' at thec lips wNas niteastiredrelative to that with~ini tlit' stibiject's cottipart nietit of thet deconipressiotichiamber by irn ans of a nictrctir\' inaiiornicer. 'Ilte siibject was deconipressedto an initial pres-mie alt it tide be:twVen 251 otI atd 2700)0 ft anid after a periodicofrrtite to two minutes lie wkas th'totitpressed in otie second to the final alt ittidle.Th'le OXygen: rTi ato itointicam t eivrd oxygen at the required positive
breatliiug pressurec as the decotinpreIssion OCetirred. 'Ill(e final altit ride wasniaintaitted f'or a period whlichi varied bettween a half atid two iiiinutes.
'Ihle expotsure to pressure breathiring at simutlated hgig altit tide was ter-titilated by recotitpressieiit to below% a pressure altit udt of 4"()0(1 ft. Thellrate of iccotuipress ion varietl fr-oi very- rapid timec to retturn to a presstire-al1titulde of 4o~00t f't of less t hat' five seconds],) to controlled rates of' reconi-prcssion whichi simutlated rates of descent of either jotoo I't or 15000 ft pertutinitte to a presstirc-alt ittidt' of lo ooo ft. 'Illme electrocardiogramn lead 11)wýas r'ecor'ded dtiritig all tie expostimes whbilst inii any the arterial pressture
2165
RAISED) INT RAPt NIM NA HY P.tLý'URs i:
was also nicasureci indirectly using a sphvgmjomlanlOlmter ctiffI and piez elec-tric transducer. Ani exposure to siulla~ted li gh altitutde was termninatedimmtediately if the subject comiplained of any% ot the symllptomls of' anl impenld.ing collapse or thle. E.C.G. record showed a bradycardia which exceeded
30 beats per miinute or a fall of arterial presýsure which ('xceeded :jo minlig.Thie comnbinations of' pressure clothing invest igatedI, tile duration of thleexposure to the miaximium simiulated altitude, the ab~soluite intrapmmlinonarvpressure and the positive bireathiing pressure duiti ug that p)eriod and( the( rateof' recomipression to a simiulated altitude Or 4()(('( ft are presented in 'lal)le6i--8.Results - The overall results for thle experimients in w\hich subjects wereexposed to pressure breathing with oxygen at environmiental pressures of lessthan 140 innifg absolute are presented in TFable 6--8. 'Il'hc features of' theexperimnents in which the suibject did not successfully comiplete the intendedexposure are presented in 'Iabl- 6--As,. W\hen the( intrapulmnonary pressure was126 innM~g absoitute or greater the incidence of'uwnsccessFul1 experinwnts lavbetween t and( 6'",, whiL.t with anl absolute intrapidlmno'tarv pres.sure Of 121nlai ijg. there was a dlist urbance of conscioustuiess in a quarter of the suibjects.
In those experimlents inl which the absolute int!raptilintonary p~ressure'during nressurc breathing was between 1 26 and 15 y11mini Ig thle two causes Ofan unsuccessful comipletion of' exposure were ab~domiinal pain and syncope.(Table 6-o)q~. T[he abdomiinal pain occurrecd imninediately after dec onipressiomiand often the subject had coniplained of' mild abdomninal disconifbt beforethe decomipression occurred. The syncopal attacks were heralded by nausea,sweating and diimming of' v~sion. '[he electrocardiogramn showed a niarkedbradycardia at this timie. The pressure in the elmamnler was always increasedas rapidly as possible to 1o Vmmflg ab~solute at this point but in two of' the(
ta c.the subject lost consciousness for fificen to twventy serC)Ods-.I~ Iii, A_.` value of the heart rate and thle mnean arterial pressure obtained
in three of thieeleven zseýries of' experimienits a-e presenited in Figs. 6-26, 6-27and 6-28. In each of the Figures the( mecan values of heart rate and arterialpressure durizig thle exposure of the samec subjects to a simnilar positive. breath-ing pressure-timie relationship whilst breathing air at gi ound level are alsogiven. In each series of experimients thle heart rate durimig pressure breathinigwas consistently greater in the altitude experimecnts as comipared with thevalues obtained at ground level. '[here was, how -ver, no such difference illthe \,aluies of the :nean arterial pressu! -
Marked swelling of'the back of'the hand occut red fifteen to thirty secondsafter the decomipression in all the subjects exposed to at pressure altitude of,70000 ft. 'rhis swelling was crepitant but there \-.a% no imipairmient of Function.The swelling resolved when the pressure within the duconipression chamiberwas increased. There were no residual yit ipt Omls Or imllairilleot of' senlsoryor miotor function subsequent to the expost;,e.
D IS C U SS1O N
Displacement of blood into the limbs - T1he inception of positivepressure' breathing caused a progressive incre.'se of, thle v'olume (,r each of'thesegmients of tile uppt'm'and lower linmbs examiined in this studyV. Direct observa-tion of the superficial veins sh-wt'd that the blood content of hese vesse'ls wast,
266

(:A k )l10VA 1(C:U*I A R F FIIE:;C S
A'r RILDUCLD I 'V lRt~mENrAL. I'RESSIREI
Time, at Intrapulm~onaryRestulator Nfasamum maximum Rate of pres~ure at Number of t~n~uc,-r.,ful attempts
type altitIde altitude des tnt maximum. altitude subject* Number Proportion
A. Headpiece and pressure jerkin
Bi. Headpiet e. pressure jerkin and anti.G suit
lilt.... 0i illl 14-6 i
C. Mask and pressure jerkin
D. Mask, pres.%ure jerkin and anti-G suit
it Ill "Iltllii $ 18tu 4
E. Headpiece. Arm jerkin and anti-C suit
T A 1l.E 6-q
(.At'SES OIF FAII.IHEFS lDURING P'RESSUR.R I REATjiING,
AT SIMULATEDB HIGHi AJ.TII lDE
Altitude Number of Number of failures Cause of failure6-'1' subjects expotsed
B. Headpiece, jerkin and anti-C suit
I - M cvi prt, t Iniri. and I lon
C. Mask and jerkin
r 2 - cserr onttfu6.n it
-3 - utlil tinf~tioti"
D. Mask, jerkin and anti-G suit
51;lei tilt $ rt - vitwlpti artcr l; 5 ,s-c.
E. Headpiece, Arm .Jerkint and anti-C suit
(runt I~t 2 - mIl.ttnniti.. paini
26)7

so.
0.
1AEAP4 W t I A1
" ESULE(^ S
It
120 I
LEVE
IdLART PnrE(P rt~
TIM ( IN) E SAAIIC
F i . G-26 Tb'he upon t lit lhiat Ira -~ atnd arter ial )Ievsi ti of prt'st itel)Ie bCt bittwit %kila head piece and trun k an d lime- limnb tounwlit ttssureI at groun11 d 1leel an d at
Giomoft nicait val tics for t wety itsil ijec( s

POSITIV t " B '~T4114G
Go
i0.
114.
It
100'I
SMtAR? sItAT (PCMJ
110
90 l t'
N.IIIUOI
I it- ~ I lic culbr( heart nticl anid aitevial prrssuiic ofi pit 'IiIC livathioii%%iith it (oi(Ii~,il iii,rk anid inmk anid lowry tnlim coilr.icrp)r'(ýSirj at' r.j Lrj~rirr lexcl anid
;11 560o"i~ 1: u ;-a altts for VCi't%)sitib)Jc is
26o(

Piassue~L 1~M,'•9)
0.
1601 A 6 1(1 % % %
/ ,
ID
""0I x 14 -UI
W~ART NVL (p4 ffufl
'r,,,,9 (MN)
FIG;. 6-2H} ThC eff-cts IIponI IIIV heart rate and arterial pressure of pressu~re br-cathingwith a headpiece and trunk. uppe(r and Ioser limb cout, e(rpre.ssture at groundlel
and at 7o0o00 ft nean values fior ten stubjc'cts
270
CARDIV)I\ASCIt.AR FIFE.CTS
increased (huinng pressare breathing. The relatively large increase of liimbvolume which occurredl at the beginning of pressure li, ',,uling wN, due to anincrease in the volume of' blood contained within the peripheral vasculartree. The central venous pressure was increased directly the intrapulnonarypressure was raised (Fig. 6-i. so that the pressure gradient which normallyexisted b)etween the p(ipheral and central parts of the venots system wasreverse(]. The venous valves prevented anyv retrograde flow of blood. Since,however, arterial flow into the limil) contin;,e(t, blood collected in its ve'scularbed. The vessels were progressively distended bv the inflow of blood. therewas a consequent rise oflpressure throughout the vascular bed until the venouspressure in the limb exceeded the central venous pressure and blood startedto flow aigain from tile limlb. The relationship between the increase of thevolume of blood in the limbn and the corresponding pressures within thevascular bed reflected the distensibiiies of the various component': of thebed. T'he rate of increase of limb volumen was high at the beginning of pressurebreathing and it fell progressivelv over the ensuing ten to twenty seconds toreach a mininumn rate which wats maintained for as long as the raised intra-pulmonary pressure remained c )nstant.
Simultaneous records of Ih'earm volunm and the pressure in tile corre-sponding antecutbital veins (Fig. 6--i , showed that, in the forearm at least,the initial large increase of limb 'volune was associated with a low venouspressure. As the pressure in the vascular bed increased the increase of limbvolume per unit rise of' venous pressure fell progressively. Thus the distensi-bility of the vascular bed fell as the pressure within it w,.as increased. Directlvthe pressure within the capillaries of the vascular bed ofa limbt was increasedexcess fluid passed from the blood into the extravascular space. Even if it isassumed that the rate of increase of extravazcular fluid during the period inwhich blood was accumulating in the liml) was as high as the rate measuredafter the changes of blood volume were completed, it may be calculated thatthe increase of extravascular fluid volume was less than 8",, of the total in-crease of limb volume over this period. The error associated with assumingthat all the initial increase of limb volume in pressure breathing was due to aniincrease in the volume of blood in the part was therefore small.
The relationship between the volume of blood displaced into a limb andthe corresponding positive breathing pressure is determined by a number offactors. The most important factors are the magnitudes of the increases of thepressure differences across the walls of the various components of the peri-pheral vascular bed and the distensibilities of these components. The increaseof the transmural pressure produced by a given positive breathing pressure isa function of the effect of pressure breathing upon the intravascular andextravascular pressures in the limb. The response of the vessels to a givenincrease of transmural pressure may be modified by local factors such as thetemperature and activity of the tissues, by humoral influences and by nervousreflexes.
Pressure breathing with the trunk counterpressure applied by the pressurejerkin increased the mean intra-arterial pressure by 8o to loo",, of the appliedpositive breathing pressure (Fig. 6-1 7). When this garment was used the riseof peripheral venous pressure virtually equalled the corresponding positivebreathing pressure (Fig. 6-13). Thus when counterpressure is applied to the
271

RAISED INTRAI'I'LMONARY PRESSURE
trunk the pressure within the sholeh pewripheral vascular bed is raised by aiiamount which is nuarly equal to the positive breathing pressure.
In order to define the effect of pressure l'reathing upon the extravaw;cularpressure the tissue pressure was meastured during pressure breathing bydetermining the pressure required to introduce a minute quantity (i.7 cu.mam.) of saline into the tissue through a hypoder,-' needle (9i). Theseexperiments showed that the pressure in the subcutaneous tissues of the limbsand the relaxed muscles of the upper limb was not significantly increased bythe induction of pressure breathing at positive breathing pressures of up totoo mmHg. The maximum increase of tissue pressure found ;iI these regionsafter pressunc breathing for five minutes was 5 mmHg. Whilst the pressure inthe anterior tibial and soleus muscles behaved in the same manner as themuscle pressure in the upper limb, the pressure in the quadriceps femoris andgastrocnemi us muscles increased by between 3o and 45",, of the appliedpositive breathing pressure within twenty seconds of the commencement ofpressure breathing. The ;ncrease of tissue pressure induced by pressurebreathing in these muscle groups of the lower linm) was believed to rdtlect theproperties of the thick indistensible fascial layers which envelop them. Thedistensibilities of the fascial sheaths which surround these muscle groups areprobably comparable with the distensibilities of the vascular beds containedwithin the muscles. When blood collects in the vessels of these region, thedistension of the vascular bed is restricted by the enveloping fascia and thiscauses the observed increase of tissue pressure. Wells, Youmans and Millert938 (284) found similar changes in the tissue pressures at various sites ilthe upper and lower limbs when the vascular pressure was increased byvenous congestion. Thu, the tissue pressure in the relaxed upper limb and inlthe lower limb, with the exception of the ;; :;.driceps and soleus musclegroups, was only slightly increased so that t, vessels in these legions weresubjected to an increase of transmural pressure which virtually equalh'l therise of intravascular pressure. Inl the deep muscle groups of the lower limb,however, there was a considerable rise of tissue pressin e at the beginning ofpressure breathing, so that tht transmural pressures of the vascular beds inlthese muscles was only increased by 55 to 70", of the increasc ofintravascularpressure.
It is possible to estimate approximately the proportion of the overall in-crease of the volume of blood in the limb which is contained by each com-ponent of the peripheral vascular bed. The volume elasticity coefficients ofthe arteries have been investigated extensively in vitro. Hallock and Benson1937 (t39) found that there was aii approximate linear relationship be-tween the increase of the capacity of an artery and its transmural pressureover the raige of pressures of interest in the present study. The volunie elasticcoefficients of the arteries of the upper anJ lower limbs is approximately I",,increase in volume per mmHg increment of transmural pressure. Since thevolume of the arterial vessels of the tipper I mb amounts to about to ml (2q)it can be calculated that the additional volume of blood contained by thetipper limb arteries during pressure breathing lies between 5 and to",, of thetotal increase of the volume of blood in the limb. The arteries of the lowerlimbs take up a similar proportion of the total increase of the blood contentof these parts. The part played by the capillary b'd is difficult to assess. The
272

CARI)iOVASCULAR EFFECTS
capillaries contain a relatively small proportion, about one fifth, of the bloodvolume of the resting limb (128). The bed is, however, capable of very largeincreases of capacity under conditions of work and presumably of raisedtransmural pressure ( 73). The veins contain the major fraction, about twothirds of the blood content of the peripheral vascular bed at rest. At lowtransmural pr ires the distensibility of the venous portion of the system isvery high. \Vhii the veins are collapsed a very large increase in capacity isproduced by a small increase of transnmural pressure. Thus in isolated veinsthe distensibility is great at low intral uminal pressures, but at a pressure ofabout 4 mmHg an inflection occurs in the pressure-volume diagram and athigher pressures the distensibility is much reduced (257). The distensibilityof the veins at transmural pressures above 4 mnmi 1g is, however, far greaterthan the distensilbility of a comparable artery over the same pressure range(63). The vins constitute the major po'tion of the capacity of the peripheralvascular bed and these vessels probably accommodate nmst of the increase ofthe blood content oft the limbs induced by pressure breathing.
Studies of the pressure volume characteristics of the vascular bed of theforearm (xi,) and of the calf' (i 93) (64 have shown that the distensibilityfalls markedly as the trawn;mural pressure is increased. The results of thepresent study appear to be in conflict with the findings of other workers,partieularl\ in the lower limb where the relationship between the increase ofblood volunmc and the applied positive breathing pressure was found to bevirtually linear )Fig. 6-4'. In tIle experiments performed by previous investi-gators, however, the subjects were recumbent and the limb under study wasplaced either at or above heart level. In the present study the primary interestwas the increase o" the blood content of the limbs induced by pressure breath-ing in the seated subject. Both the upper and lower limbs were placed con-siderably below heart level and the resting venous pressures were of the orderof no and 30 mmttg respectively. It was not possible to study the calf with thelong axis of the part vertical so that the venous pressure in this segment wassomewhat less than the venous pressure which normally exists when the feetare dependant. When allowance is made for the higher resting values of thevenous pressures which existed in the present experiments, the shapes of thepressure-distension curves for the forearm and c-ilf obtained during pressurebreathing are comparable with those obtained by the application of sub-atmospheric pressures to these regions (131) (64).
The increment of blood content produced by a given positive breathingpressure was somewhat greater in the hand than in the forearm (Fig. 6-3).This difference may have been a reflection of the differences in the proportionof skin and muscle in the two regions and their respective vascularities. Thus
hilst by volume the hand contains approximately 55",, skin and bone andtI",, muscle (i) the forearm contains 8",, skin and 6o",, muscle (66). Thisfinding suggests that thL skin has a greater vascular capacity than muscle.The vascularity of the skin varies from one region to another, however, andthe relative importance of these two tissues as sites for the accommodation ofblood during pressure breathing cannot be assessed from the present data.
The thigh and calf" had very similar vascular distensibilities during pressurebreathing. The mean distensibility of the lower limb amounted to o.oi)6ml' ion ml of limb per mmHg positive breathing pressure. These results may
273

RAISED INTRAi'ULMONARY PRESSURE
be compared with that obtained by Henry 1951 (146) who determined theincrease of the volume of the lower limbs produced by pressure breathingwith chest counterpressure. His subjects stood in a plcthysmograph which wasfilled with water to the level of the top of the thighs. A positive breathingpressure of 40 mmHg increased the volume of the lower limbs by 140 mlwhich gives a calculated distensibility of approximately o.om8 mll/ioo ml oflimb per mmHg positive breathing pressure. Although Henry's subjects werestanding, the water in the plethysmograph prevented virtually any increaseof transmural pressure due to gravity below the surface of the water. Thus thetransmural pressures of the lower limb vessels were very similar in Henry'sand the present study. The value for the overall distensibility of the vesselsobtained in the present study agreed well with the value obtained by Henry.
In the present investigation care was taken to maintain a constant thermalenvironment. Further, the temperature of the water in the plethysmographwas maintained at the value at which Barcroft and Edhohn 1943 (21)
showed resulted in the same vascular behaviour as that exhibited by thenormally clothed part at a room temperature of 18 to 22"C. The effect o0'changes of limb temperature upon the quantity of blood displaced into thelower limbs was investigated in a few experiments by Henry 195i (146).He found that increasing the temperature of the water of thl plethysmographin which the lower limbs were immersed fr'om 25' to 4 oC increased thequantity of blood displaced by a given positive breathing pressure, by 6o",.Greenfield and Patterson 1956 (x'3), however, ibund that the capacity ofthe forearm vessels defined as the volume of blood in the part when a sub-atmospheric pressuzre of ioo mmHg was applied to it, was unchanged byraising the temperature of the water in the plethiysmograph or by generalheating of the body.
Similar results were obtained by Wood and Eckstein 1958 (289) whomeasured the additional volume of blood held by the vessels of the forearmwhen the venous pressure was raised by 30 mmHg using local congestion.This additional volume of blood was not increased by either the local orgeneral application of heat. These investigators did find, however, thatreducing the temperature of the environment below the comfort level resultedin a decrease in the distensibility of the forearm veins. Although the resultsobtained by Greenfield and Patterson 1956 (1,31) and by Wood and Eckstein1958 (289) suggest that an increase in the temperature of the environmentabove the comfortable range does not increase distensibility of the capacityvessels of the forearm, the)y do not necessarily conflict with the re,•i,,tz ob-tained by Henry 1951 (146). The studies were performed on different limbsegments. Further there is evidence that pressure breathing causes a reflexreduction of the distensibility of the capacity vessels. It is conceivable thatthis reflex reduction of distensibility may be impaired by a rise of theenvironmental temperature.
It is possible to estimate approximately the total quantity of blood dis-placed into the four limbs at the beginning of pressure breathing with trunkcounterpressure from the measurements made on the individual limb seg-ments. The amount of blood pooled in certain limb segments, namely theupper arm and the fbot was not determined in the present study. It wouldappear likely, however, that the distensibility of the capacity vessels of the
274
- 1'-
CARI)IOVASCUL'AR i: I" E ITS
upper arn is very similar to tIhat of the vcssels of the for'arnm. Thus it hasbeen assunmed that the upper lim1 ), with the exception of the hand, may betreated as a single region with a vascular distensibility cqual to that found inthe forearml. Although no mcasurements were made on the foot, the volumeof this region is less than to",, of the volume of the lower limb so that theoverall error introduced by assuming that the distensibility of the vessels ofthe foot is similar to that of the rest of the lower limb will be small. Themeasurements of the change in the blood content of the thigh and calf pro-duced by pressure breathing scre performed with the subjects in the seatedposition with the limb horizontal. When the knee is flh::cd and the foot isplaced on the floor the vascular pressures in the calf will be increased abovethose which were opr.:'ativc in the present study. The present results and thoseobtained b% Coles, Kidd and Patterson t956 (64) at venous transmuralpressures of up to 200 mml-lg show, however, that at the vascular pressuresconcerned the pressure-volunie curve of the vessels of the calf is virtually astraight line. Thus it is unlikely that the quantity of blood displaced into thecall' by pressure breathing at a given positive brcathing pressure with thesubject in the normal seated position will differ very much fi-om that foundwith the lower linm) horizontal in the seatcd subject. In order to calculate thetotal volume of blood displaced by a given positive breathing pressure fromthe results given in Figs. 6- 3 and 6-4 and Table 6- 1, the total volunms of eachsegment must be known. These volunmes were measured fbr tile subjectsused in this study. (Table 6--io). The rel.,tionship between the quantity ofblood displaced into all four limbs of a seated subject and the correspondjigpositive bleathing pressure is pt cseited ill Fig. 6-20.
The magnitude oftthe volume of'blood displaced into the limlbs by pressurebreathing in the seated position may be compared with the effects of venouscongestion and changes of posture upon the volume of blood in the limbs.Thus Ebert and Stead 1940 (87) measured the effect in supine subjects ofdisplacing blood into one upper linmb and both lower limbs by inflating cuffsaround the proximal ends of the limbs to diastolic pressure (7o to 8o mmnHg)for ten minutes upon the volume of blood in the remainder of the body(measured by a dye dilution technique). They found that this degree ofvenous congestion reduced the volume of blood in the remainder of the bodyby about 7oo ml. Nearly a third of this reduction was due to the passage offluid into the intravascular spaces of the congested limbs. The greater in-crease of the blood content of the limbs produced by venous congestion thanthat produced by a co•ipaiabi, jx),itive breathing pressure is primarily dueto the difference in the posture of the subjects in the two series of experiments.The initial venous distension was considerably less iii the experiments per-foirmed by Ebert and Stcad 194o (87) than in the present pressure breathingexperiments. Asnmussen 1943 (9) studied the amount of blood contained inthe lower limbs under various conditions by occluding the circulationthrough these parts and measuring the remaining blood volume by a carbonmonoxide technique. He found that the volume of blood in the lower limbsat rest in the horizontal position averaged 0.72 litre and that tilting the sub-ject 6o' head-up increased this volume by 0.35 litre. The bltrod displaced bypressure breathing is, however, in addition to that pooled in the lower linibsby the assumption of a seated posture. The total volume of blood displaced
275
----- , -... - -s ,,.L.:r •€ - p , . __ __ ___,,_ __ __ __,--,-
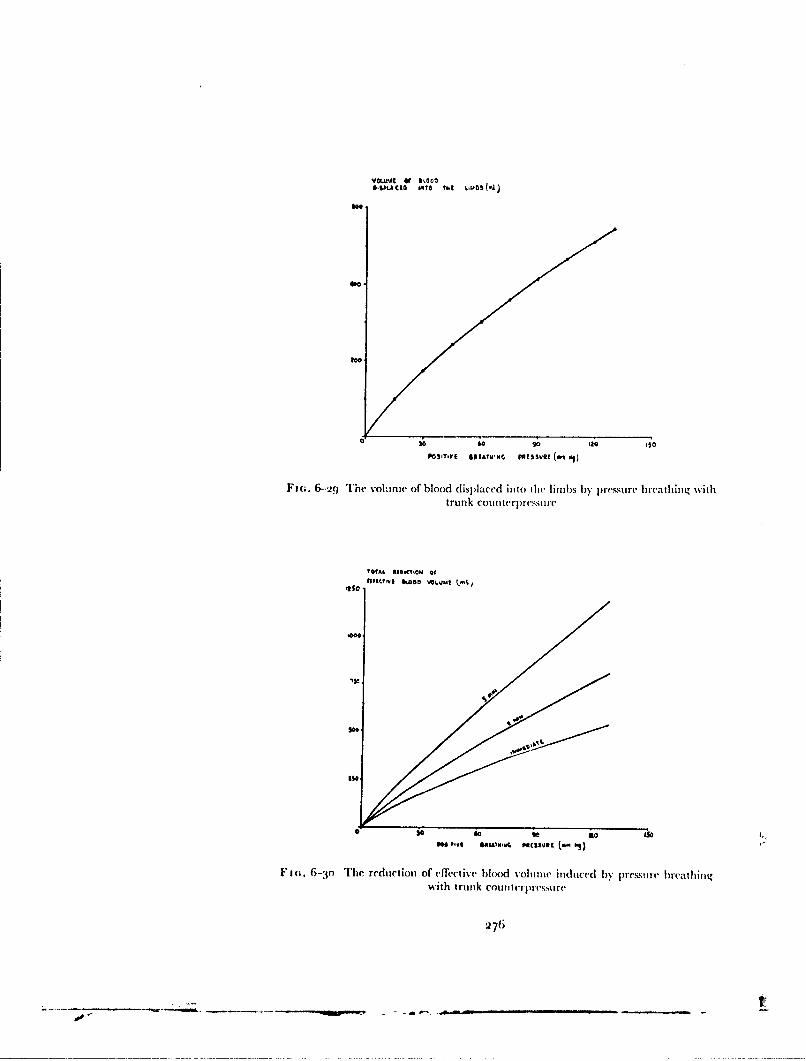
VGLWJC ef110114A CIO WqTO UtI k.IWb (L
41..
*O0
too
a 3il 68 90 129 050POSITIVE IN[ATWMN, POISSuO (m o1
Fm.. 6-29 The vohml e of blood displaced into the limbs by p,'e.iure breathing withtrunk coun terplessui le
10tAL. 010OCTIOM Of#I SO c •,lost I I• & A G O • V LU. * +
Ise
PM ''Ve IM&AIWS9 MiSS-At.~O
FmI. 6-'jo The redtiluOtiom of ('ffectivC blood volunie induced by pressmure breathing-ith trunk cotnttcurprtssri re
,27(i

(;AR DIO V' C (U'I.AR E -'FE'(;TS
TABL.E 6- 10
TIME VOIUMES OF I.I!.Ifl SEGMENTS OF SUBJECT.S USED IN STUDY OF
LIMB VOLUMES IN PRESSURE BREATIIING
Volume (litre)Segment Subject A B
Hand 0.45 0.53Upper lifn) to shoiilch'r 2.,95 3.10
Lower liti) tosylflphysis pubis 9.5o ) o.o8
277

RAISED INTRAPULMONARY PRESSURE
into the limbs by the assumption of the seated position and pressure breathingat a positive breathing pressure of 6o to 8o mm lIg is similar to that producedby venous congestion of the limlbs induced in the heorizontal position as inEbert ar,! Stead's experimnent,.Reflex Changes of Vascular Distensibility - The effect of the centraldisturbances induced by pressure breathing upon the distensibility of theperipheral vasculature was investigated by comparing the increase in handvolume produced by pressure brcathing with that produced by local venouscongestion. The increase of the volume of blood in the hand produced by agiven increase of venous pressure was greater when the rise of venous pressurewas produced by local congestion than when it was induced by pressurebreathing (Fig. 6-8). Thus the distensibility of the vessels of the hand wasreduced by pressure breathing. Since the arterial pressure was raised duringpressure breathing but not during local venous congestion the quantity ofblood contained in the arterial portion of the vascular bed of the hand wasprobably greater during pressure breathing than during local congestion.Following a complete nerve block at the wrist there was no difference in theincrease of hand volume produced by a given rise of venous pressure whetherit was induced by pressure breathin.g or by local congestion. The reduceddistensibility of the capacity vessels of the hand produced by pressurebreathing under normal conditions was mediated thereflore by efferent nervesto the vessels of the hand.
The major fraction of the capacity of the peripheral vasculature residesin the vei .,. Goltz 1864 (124) demonstrated that the capacity of the veinsmay be changed independently of the pressure existing within them and thisfinding has been confirmed repeatedly. D)onegan 192! (76) found that thecapacity of various veins in the dog. cat and rabbit could be changed bystimulation of certain afferent nerve trunks. Exposure to a low environmentaltemperature was shovwn by Doupe, Krynauw and Snodgrass 19:38 (79) t(increase the pressure in an isolated segment of forearm vein. Page, Ilickham,Sieker, McIntosh and Pryor 1955 (234) demonstrated that tilting from thehorizontal position to the erect increased the pressure in an isolated segmentof the forearm vein. They also found that the Valsalva manoeuvre was apotent stimulus to active veno-constriction. Wood and Eckstein iq58 (289)studied the effect of displacing blood into the lo\ser limbs by the inflation ofcuffs placed around the upper thighs upon the distensibility of the forearmivasculature as measured by the increase of limb volurne produced by raisingthe effi-ctive local venous pressure by 3o mmHg. They found that poolingblood in the lower limbs reduced the distensibility of the forearm vessels byabout 2•o".
Sharpey-Schafer I96t (263) developed a technique for measuring venoustone by relating the rate of increase of volume to the rate of increase of venouspressure rise when a venous congestion cuff was inflated around the upperarm. He demonstrated a very marked increase of venous tone during theValsalva manoeuvre. Blair, Glover and Kidd 1959 (37) were unable, how-ever, to show any change in the distensibility of the forearm vessels duringpressure breathing at a positive pressure of i5 mmHg. In the present experi-
ment positive breathing pressures of tip to 50 mniHg were employed and asignificant reduction of the distensibility of the vasculature of the hand was
278
CARDIOVAS( I.AR E.FFE('rs
found during pressure breathing. The behaviour of the capacity vessels of thehand may differ, however, from that of the forearm vessels in pressure breath-ing. The intramusculatutre veins are thin and have a paucity of ziiuscle fibresin their walls as compared with the superficial veins (114). Also Donegan1921 (76) found in ani.nal experiments that whilst thr calibre of the super-ficial veins of the limbs could be altered readily by stimulating the sympa-thetic chain, the intramusculature veins were not affected by this procedure.Studies of the effects of the peripheral pooling of blood have shown, however,that the distensibility of the capacity vessels of the forearm can change (289).It would appear likely, therefore, that pressure breathing induces a reflexreduction of the distensibility of the capacity vessels of the arm and lowerlimb as well as those of the hand.
It is of interest to consider the nature of the stimulus which may be respon-sible for the reflex reduction of the distensibility of the peripheral capacityvessels induced by positive pressure breathing. Relatively little is known ofthe reflex mechanism which controls venous tone. Goltz 1864 (124) demon-strated that the normal tone of the intestinal veins depended upon anintact medulla and spinal cord. Heymans, Bouckaert and I)outrebande1931 (155) showed that innervated perfused mesenteric veins constrictedwhen the pressure in the carotid sinus was reduced. The reflex venoconstric-tion which occur,, in man when blood is displaced in the periphery bytiltinginto the erect posture (265) or by congesting the lower limbs (289) is notusually accompanied by a fall of arterial blood pressure so it is unlikely thatthe observed reflex venoconstriction arises fiom the carotid or aortic barore-ceptors. Reflex venoconstriction occurs during the Valsalva mealnoeuvre inwhich the transmural pressure of the carotid sinus is increased, although theaortic transmural pressure is generally decreased by this procedure. Pressurebreathing with trunk counterpressure and a pressure headpiece which appliescounterpressure to the skin overlying the carotid bifurcation induces little orno change in the transmural pressures of either the carotid sinus or the archof the aorta. In all these situations, however, there is a reduction of the effec-tive right atrial pressure. It if probable, therefore, that the receptors responsi-ble for the reflex venoconstriction produced by these various procedures lie inthe low pressure region of the intrathoracic vascular bed, probably in theright atrium or the venae cavae. Roddie and Shepherd 1956 (247) havepostulated that receptors in this region are responsible for the reflex arteriolarvasodilatation which occurs in the forearm when blood is emptied from thelegs into the chest. It is also probable that the peripheral arte iolar vaso-constriction induced by positive pressure breathing arises from receptors inthe low pressure portion of the intrathoracic circulation.
A further possible cause of the reduction of thie distziuibility of the peripheralcapacity ves.,els in pressure bicathing which should be considered is hyper-ventilation. Thus Page, Hickham, Sicker, McIntosh and Pryor (955 (2:34)ibund that ovcrbreathing induced a rise of the pressure in a temporarilyisolated segment of forearm vein. The distensibility of the forearm vascularbed was studied in voluntary hyperventilation by Eckstein, Hamilton andMcGammond 1958 (89) by determining the increase in the blood contentof the forearm associated with increasing The effective venous pressure fromzero to :10 mniniIg. They found that a reduction of the end-expiratory carbon
279
...........
RAISED INTRAI'II.MO!NARY PRESSURE
dioxide tensih n firom 43 to '25 niniHg was associated with a 24'",, decrease ofthe distensibility of the capacity vrssels of the forearm. They further demon-strated that a considerable proportion of this change of'distensibility was dueto the mechanical effects within the thorax of the hyperventilation since theeffect was only partially abolished when carbon dioxide was added to theinspired gas in order to prevent hypocapnia. Although pressure breathingdoes produce an increase of pulmonary ventilation and a reduction of' thealveolar carbon dioxide tension, the magnitude of these changes at positivebreathing pressures of up to 5o mmltg when trunk counterpressure was usedis small (Chapter 5). Thus the hypocapnia induced by pressure breathingprobably plays only a minor role in the prodoction of the reflex reduction ofthe disensibility of the capacity vessels f'und in the present study.Fluid Filtration -- The volume of each limb segment studied during pressurebreathing continued to increase after the local venous pressure had becomeconstant. This rate of increase of limb volume remained unchanged throughan exposure to pressuie breathing. The actual increase of linm) volunme pro-duced by preesure breathing in addition to that associated with the displace-ment of blood into the part was measured from the experimental records. Itwas found that after the circulatory changes associated with the terminationof pressure breathing had subsided the limb segment volume was alwaysgreater than the volume of the part immediately before the exposure topressure breathing. It was found that the magnitude of the increase of limbvolume during pressure breathing measured froom the point at which the rateof increase of limb volume became constant was approximately equal to thedifference of limb volumes immediately before and immediately after theexposure to pressure breathing , Fig. G6-5 . This increase of limb volume wasdue to a nett passage of fluid from the blood into the tissues of the limb.Starling 10o9 (272) demonstrated that the intracapillary pressure was themost important single factor governing the exchange of fluid between thieblood and the tissues. '[lie rise of capillary pressure induced by pressurebreathing disturbs the normal balance between the hydrostatic and osmoticforces across the wvalls of the capillaries so that there is a considerable hydro-static force driving fluid from the capillaries into the surrounding tissues.Although there was some variability in the rates of increase of volume inpressure breathing, the relationship between the rate of filtration and thepositive breathing pressure was virtually linvar both in the upper and lowerlimbs (Figs. 6-6 and 6-7).
Starling 1909 (272) and later Landis and Gibbon 1933 (182) demon-strated that the rate of filtration of' fluid is closely related to the venouspressure. Pappenheimer and Soto-Rivera 19-18 (235) showed in the perfusedhind linmb of the cat and dog that increasing the venous pressure by 0.5mmHg produced a readily detectable movement of fluid from within thecirculation into the extravascular space. Further they found that in order toproduce a given filtration rate the arterial prcsure must be raised by five toten times the increase of venous pressure required to induce the same rate offiltration. Landis and Gibbon 1033 (182) measured the rate of increase offorearm volume during veenous congestion produced by a cuff placed aroundthe upper arm by means of a pressure plethysmograph. They found that therate of filtration was linearly related to the venous pressure and that the mean
280
lop-

CARDIOVASCUTLAR EFFECTS
rate of increase of filtration amonuntedI to 0.0045 nil Thin.j too nil of forearmper mrnrrHg increase of venrous pressure. 'This value may be comrpared with tilmean rate of increase ob~tai ned in tire p~resenrt prc!ýslrrrebrent hilrg experi n 1(111
which amounted to 0.0048 mnImniri oo ml of forearmn per nurn JI g increase of'positive b~reathinig pressure.
TIhe ratc offilt rat ion of flidnc from the circulation during pressure brcathinirgat a given positive ibreathing pressure was some 3o0', slowe'r in tile lowecr limllithan in the uipper. The studies ELrnsting 1955 (9 1 of the behaviour of' thletissue pressure during pressure breathing already described showv that iii thledeep muscle groups of the lowver limbs the tissue pressuire %%as raised by be-tween 30 and 45' ', of thle applied piositive breathing pressi ire. Thurs in thecseregions the transmnural pressure of tire tissue capillaries was increased by onrlv55 to 70",, of the positive breathing pressu-e. Thew hydrostatic pressture cirivinlgfluid into these tissues %s as therefore considcrably less thrani the foirce ac tinrg iiithe superficial tissues of thle lower limibs amlc in the muitscles anrd superficialtissues of the upper limbs. Tihe mecasureirrilats of tissue pressure also Qiowedthat the pressure in the tissues beneathI the deep fascial lay-ers of' the lowcrlimbs increased progressively durir ng pressure breathrinrg. urlis i ncrease of,tissue pressure was due to tire increase of extra\ ascular fluid birreatir tire deepfascial layers. 'Ilre rise of tissue pressure observed over five minutes amnouintedito 10-15 mnr ig at a positive breathing pressuire offio triririg. lie const-qrerrtfurther decrease of tranisiural pressure of' tire capillaries- in tirese reg. 'nrswould be expected to reduce the rate of filtration of fluid into tire deepmuscles. It is unlikely, however, tirat this rise of tissue pressmre would result iiia detectable reductiorn of the overall rate of irncrease of limrb volurri. I ndeed.in tire present experimrenlts rio redu rctiorn ir tire rate of increase of lirrrb %oluirrrwvas found.
'Tie measurenments oif tire rtaes at which fluid passed frorir tire circurlat ioninto tire tissues of inrdividual lirmb segnments irave been used to calculate tireoverall loss of fluid fi~ro the circulationr associated with pressurec bre'atiringwith trurrk counterpressure. Thiese calculations were b~ased upon tire( assurnrp-lions already described in tire calcridatiorn of' tire volurire of blood displacedinto tire limbs at tire b~eginnrinrg of pressuure b~reathring. Tire overall rare offiltration of fluid from tile circulation into the tissues of tire limrbs calculatedfrom tire meas;urements made on tire irrdividual linrrb segm~enits was ().()fml/rnin.,'mnrrHg of positive b~reathinrg pressure. Since trunrk colnrterprt-,surewas used in these experiments, tire increase of peripheral venouis presshure wasvery near]) equal to tire applied positive breathinrg pressure. Landis aridHortenstine 1950 (M,5j) ca!cuiated tirat a general rise of venorus pressure of'10 cm water throughout tire body w.ouild filter about '25o tI'l of fluid frornr tieplasma iii tile first terl minutes. Thiis calculation gives a rate of fil trationi of'fltuid fromr tire circulation Of 3.4 rrrlrrrin.i1 unirrrg rise of venous presuare. 'Thisvalue is nearly four timres as great a.; thle rate of filtration fournd iii the presentinvestigation. Inn presstir breathinrg withn trunrk courrterpres:,uire, however,the vascular trninrsuiral pressure is orrly raised in thne linnibs wirereas tire n ateof filtration calculated by Landis arid] Hortenistine applies to a rise of vienoulspressure throughout thi e i)(dly.
Henry, Hendrickson, Movitt arnd Meeihan 1945' (n149) and Henry r951(146) investigated thre loss of fluid frorn tire circurlat ion during pre-ssure
281
---------- ~~-R- 0 e-- ... * r .
RAISED INTRAPULMONARY PRESSUl'k.
breathing by making serial measurements of the hacniatocrit. The subjectswere exposed to positive breathing pressures of up to 55 mmHg with eitherno respiratory counterpressure or counterpressure applied to the chest andupper abdomen by means of a vest. After a rest period which lasted for thirtyminutes, each subject was exposed, in the seated position, to pressure breath-ing for a period of thirty minutes. Blood for the determination of the haema-tocrit was taken from either a dorsal vein of the hand, which hd beenpreviously heated or in a few cxperiments from an artery. No difference wasfound between the values given by the arterial and arterialized venous blood.When the vest was used the mean reduction of the blood volume induced bypressure breathing for thirty minutes at a positive pressure of 5o mmHg was9",,. Assuming a resting blood volume of 5.. litre this represented a loss ofabout 5oo ml of fluid from the circulation and hence a rate of loss of fluid of0.33 ml/min.!mmHg of positive breathing pressure. The rate of filtration offluid from the circulation induced by pressure breathing obtained by Henrywas only one third of the rate of filtration calculated from the rates of increaseof limb volume found in the present investigation.
There are a number of possible explanations for the discrepancy betweenthe overall rates of filtration found during pressure breathing by Henry andin the present study. Firstly the methods used in the two studies for themeasurement of the rate of loss of fluid from the circulation were dissimilar.Henry et al I943 (144) carefully considered the errors which could havearisen from using the change of haematocrit to predict the loss of fluid fi-omthe circulation. Simultaneous measurements of the change of haemoglobinconcentration showed that the total rtd cell volume calculated from thehaemoglobin concentration and the hae|.n, c'crh was unchanged by pressurebreathing. In the present stud-y it w:N.s assum•d that the blood content of thelimb remained constant following the initial displacement of blood at thebeginning of pressure breathing. Although the venous pressure remair.edunchanged after the initial rise it is conceivable that the distensibility of thecapacity vessels increased with the duration of the exposure to pressurebreathing was, however, grcater than the resting volume by an amount whichon average equalled the increase of limb volume during the period of pressurebreathing measured from the point at which it was assumed that the bloodcontent of the limb had become constant (Fig. 6-5). Thus although the esti-mation of the fluid loss from the circulation into the linbs was made by anindirect method, it is unlikely that the calculated rate of filtration was muchin error.
Secondly the degree of respiratory counterpressure used by Henry wassomewhat less than that provided by the pressure jerkin. Thus the volume oftissue into which filtration occurred was greater with the vest than with thepressure jerkin. The magnitude of the rise of venous pressure induced by agiven positive breathing pressure was, however, less in Henry's experimentssince the vest did n, t prevent an increase of the functional residual capacity.At a positive breathing pressure of 5o mmHg the difference in the rise ofvenous pressure associated with the vest and pressure jerkin was probably ofthe order of 6 to 8 mmHg. Although this difference in the effect of a givenpositive breathing pressure upon the peripheral venous pressure would resultin a lower filtration rate in Henry's experiments the magnitude of this effect
28.2

CARDIOVASCULAR EF.FEC r.c
is too small to account for the difference between the calculated overallfiltration rates.
Finally, the duration of the exposure to pressure breathing over which themeasurements of filtration rate were made differed widely in the two series.All Henry's measurements were made over a period of thirty minutes whereasin the present study pressure breathing was only performed for five minutes.The accumulation of fluid in the extravascular space would be expected toreduce the rate of filtration over a period as long as thirty minutes. ThusLandis and Gibbon 1933 (182) found that the rate of filtration in the fore-arm when the venous pressure was raised to a constant value for thirtyrnnutes, declined progressively with time. Moreover, an examination of thedetails of the results obtained by Henry, Hendrickson, Movitt and Meehan1945 (i.t4) shows that the rate of increase of haematocrit during pressurebreath:ing fell progressively. Thus in one experiment over half the total changeof haemnatocrit found in a thirty minute exposure occurred in the first fiveminutes. The haematocrit change in this experiment gave an overall rate offluid loss of approximately i.o ml'niin./mmHg positive breathing pressureover the fir.;t five minutes of the exposure. In the other experiment, of whichadequate experimental delails were given, the rate of fluid loss over the firstten minutes of pressure breathing was 0.62 mlimin.immHg of positive breath-ing pressure. Thus the discrepancy betwen the results of the present experi-ments and those obtained by Henry is due principally to the differences iln theduration of the pressure breathing exposure over which the mcasuremcentswere made. There is reasonable agreement when similar periods of exposureare compared. This comparison emphasizes the fact that the rate of filtrationinduced by pressure breathing at a given positive breathing pressure declinesas the duration of the exposure is lengthened.The Effective Blood Volume - It has been seen that pressure breathingproduces a displacemert of blood into the peripheral capacity vessels and aloss of fluid from the blood into the extravascular spaces of the limbs. Boththese changes reduce the volume of blood in the central part of the circulation.Tile concept of the "effective blood volume" Landis and Hortenstine 1950(183) is of value in this context. In many situations the total blood volunemay be normal but an increase in the volume of some or all of the peripheralvessels can reduce the volume of blood available to the heart per unit time foractive recirculation. The "effective" blood volume is the volune of bloodavailable at a given instant for tlhe maintenance of the circulation. Althoughno satisfactory method is available as yet fbr measuring the absolute value ofthe effective blood volume, it is freqw-ntly possible to estimate the change ofthis quantity induced by a given proccdure. Thus during pressure breathingthe effective blood volume is reduced by the accunulh.tion of blood in theperipheral vessels and by the passage of fluid from the capillaries in regionsin which there is an increase of the vascular transmural pressure.
The b!ood content of a region will be increased and fluid will be lost fromthe capillaries of its tissues as long as the increase in tissue pressure producedby pressure breathing is less than the corresponding increase in central vcnouýpressure. Within the thorax the tissue pressure will be raised by an amountwhich equals the increase of the intrapleural pressure, whilst within theabdomen the increase of tissue pressure will be only slightly less. Thus little or
28:3

RAISED INTRAPULNMONARY PRESSURE
no pooling of blood or increase of extravascular fluid will occur within thethoracic or abdominal cavities during pressure breathhlig. In thc ablclcc ofcouiitcrpressure to the trunk an increase of the blood content and rate of fluidfiltration will occur in the skin, subcutaneous tissues and muscles outside thesecavities. When trunk counterpressure is employed, however, little pooling orfiltration of fluid from the circulation will occur within the trunk. Pressurebreathing does not increase the transmural pressures of the capillaries or ofthe capacity vessels of the central nervous system since the pressure of thecerebro-spinal fluid is increased by an amount which equals the rise of venouspressure. Blood pooling and fluid filtration will occur into those superficialtissues of the head and neck to which counterpressure is not applied. When apressure headpiece is worn only a small portion of the neck and the crown ofthe head are unpressurized. Thus the blood and fluid displaced into the limbsrepresents virtually all the reduction of the effective blood volume producedby pressure breathing, particularly when trunk counterpressure is used.
"Tihe amount by which the effective blood volume is reduced by pressurebreathing with trunk counterpressure has been estimated from the measure-ments of the volume of blood displaced in the limbs by various positivebreathing pressures (Fig. 6-29), and the overall rate of filtration of fluid intothe tissues of the limbs (o.99 mll/min..'mmHg positive breathing pressure).The results of these calculations are presented in Fig. 6-30. At a given positivebreathing pressure the rate of reduction of effective blood volume caused bythe immediate displacement of blood into the limbs is approximately doubledby the loss of fluid from the circulation induced by pressure breathing forfive minutes. The effects of the reduction of the effective blood volume in-duced by pressure breathing are maniik,!d and are considered later in thisdiscussion.Peripheral Venous Pressure - The time taken for the venous outflow froma region to restart at the beginning of pressure breathing and hence for theperipheral venous pressure to become stabilized at a raised value dependsupon the relationship between the rate of flow of blood into the region andthe distensibility of its capacity vessels. The behaviour of the peripheralvenous pressure during pressure breathing was investigated in three regions,,'amely the forehead, the upper limb and the lower limb. The venous pressurein the forehead increased to a steady value within five seconds of the hzLgin-ning of pressure breathing (Fig. 6-1t) whilst the pressure in an antecubitalvein did not achieve a steady value until twenty seconds later. The blood flowto the skin of the head is relatively high (Kerslake, personal communication)while the veins of the scalp probably have a relatively low distensibility. Therapid rise of forehead venous pressure is also related to the valveless con-nections through the orbit between the intracranial and extracranial venous-ystems (167). The venous pressure within the skull rises very rapidly at thebeginning of pressure breathing because the intracranial circulation lieswithin an indistensible container and the rise of venous pressure within theskull is transmitted to the extracranial veins of the forehead.
In the supine posture the pressure within a dorsal vein of the foot (lid notreach a steady value until nearly sixty seconds had elapsed from the com-mnencement of pressure breathing. The time taken for the venous pressut e inthe foot to attain a steady value was reduced to fourteen seconds by the
284
(:ARDIOVASC:ItTAR E FFE('rs
assumption of the seated posture (Fig. 6-1 t). The increaed rate of rise ofvenous pressure associated with the seated position was probably dwe to thepostural re(duction in the distensibility of the capacity vessels of the lowerlimb. In a relaxed subject the venous pressure at a given horizontal level inthe lower limb is the pressure exerted by the column of blood between thatlevel and the right atrium. When seated, therefore, the veins are already sub-jected to a high transmural pressure and the distensibility will be much lessthan in the supine posture when many of the veins are collapsed. The increasein the rate of rise of the venous pressure in the foot at the beginning ofpressurebreathing when a subject is in the seated position is unlikely to be due to anincrease of the rate of blood flow into the limb. The assumption of the seatedor erect posttre is associated with a generalized arteriolar vasoconstriction(45) so that the arterial inflow into the lower limb will be lower in the seatedposition than in the supine, at least in the resting state before the commence-ment of pressure breathing.
After the initial increase in pressure at the beginning of pressure breathingthe periphezdai venous pressure always exhibited obvious variations whichcoincided in time with respiration. In some experiments small respiratoryfluctuations were seen at i.st but these always disappeared during the periodin which the venous pressure was rising at the beginning of pressure breath-ing. Detailed analysis of these pressure fluctuations showed that the pressurein the antecubital vein fell during inspiration and rose in expiration bothatrest and during pres.ure breathing (Fig. 6--to). These fluctuations of' peri-plieral venous pressure are a reflection of the changes of the right atrialpressure during the respiratory cycle. Changes of intrapleural pressure aretransmitted directly through the walls of the heart to the blood within itscavities. D)uring inspiratioi the intrapleural pressure falls and thus ind,.ces asimilar change in the mean pressure in the right atrium which, under certaincircumtances, is reflected in the peripheral venous pressure The peripheralvenous pressure will only follow changes in the right atrial pressure whenthere is a continuous column of blood between the peripheral site of measure-merit and the right atrium. Thus if the dependent arm is placed in a suitableposition respiratory fluctuations are apparent in the peripheral venous pressure.
At the beginning of pressure breathing the valves in the veins at the rootof the limb are shut since the central venous pressure exceeds the peripheralvenou.s pressure. OMce, however, the peripheral venous pressure has risen sothat venous return recommences, the peripheral veins are widely distendedby the high transnural pressure and changes of right atrial pressure arereflected in the peripheral veins. The magnitude of the respiratory fluctua-tions seen in the record!; of peripheral venous pressure in the upper limb werealways greater during pressure breathing than at rest. This difference wasdue to the consideraliy lower di.ýtensibility of the peripheral veins when thepressure within themr was raised and to the increase of the respiratory fluctua-tions of intrapleural pressure associated with the hyperpnooa of pressurebreathing. The part played by the reduction of the venous distensibility atincreased venous pressure was confirmed by the decrease in the fluctuation3of limb volume produced by pressure breathing Fig. 6--j i). When the upperlimb was placed in a suitable position at rest, fluct.ations in the volune of theforearm occurred which were respiratory in timing. In these circumstances
285
- r- .rzr -
RAISED INTRAPULMONARY PRESSt'RE
the magnitude of the fluctuations of limb volume (ie to respirLtion wasreduced during pressure breathing, whereas the fluctuations ill local venouspressure were increased.
In pressure breathing the peripheral venous pressure measured in theantecubital veins exhibited small fluctuations, the frequency of which %sasequal to the hitart rate. These particular pressure changes persisted when asphygmomanometer cuff, placed around the upper arm, was inflated to apressure 20 nimHg greater than the applied positive breathing pressure. Thefluctuations did not depend, therefore, upon the presence of a continuouscolumn of blood from the peripheral veins to the right atrium. Hence theywere not a reflection of the pressure changes in the right atrium during thecardiac cycle. Very similar fluctuations in peripheral venous pressure wereproduced by local venous congestion of the upper limb in a subject at rest.Simultaneous measurements of the pressures in the brachial artery and theantecubital vein of the same limb showed that the increase in venous pressurewith each cardiac cycle coincided with the systolic rise of arterial pressure.The cardiac fluctuations which occurred in the peripheral venous pressureduring pressure breathing are due, therefore, to the direct transmission of thearterial pulse to the blood in the venae comitantes of the arterial system in thelimb. This transmission occurs in pressure breathing and with local venouscongestion because the veins accompanying the arteries are distended and thevolume pulse in the arterial tree is transmitted to their contents.
The relationship between the increase of peripheral venous pressure(measured at the end of expiration) produced by pressure breathing and thecorresponding positive breathing pressure, varied with the degree of counter-pressure applied to the trunk (Figs. 6-i2 and 6-13). In the absence ofrespira-tory counterpressure the difference between the positive breathing pressureand the corresponding increase of peripheral venous pressure increasedprogressively with the magnitude of the applied breathing pressure (Fig.6-12). At positive breathing pressures above 25 mmHg this difference wasrelatively constant at approximately 12 mmHg. Similar results were obtainedby Otis, Rahn and Fenn 1946 (232) who also studied the effects of pressurebreathing upon the peripheral venous pressure. The primary cause of thediscrepancy between the applied positive pressure and the consequent in-crease ot venous pressure is the increased elastic recoil of the lung associatedwith the raised functional residual capacity which occurs in pressure breath-ing without respiratory counterpressure. The magnitude of the difference
between the positive breathing pressure and the change of venous pressurewas of the same order as the change in expiratory intraoesophageal pressureproduced by the same positive breathing pressure (Table 6-1 1). The impor-tance of the incicase of the functional residual capacity was confirmed by themarked reduction of the difference between the applied breathing pressureand the corresponding increase of venous pressure produced by the applica-tion of counterpressure to the trunk during pressure breathing (Fig. 6-13).
At higher positive breathing pressures the rise of venous pressure was 4 to 6mmHg less than the corresponding increase of intrapulmonary pressure whentrunk counterpressure was employed. This difference was greater than thecorresponding change of end-expiratory intraoesophageal pressure inducedlby pressure breathing with trunk counterpressure (Table 6-11).
286
.00.

CARDIOVASCULAR EFFECTS
TABLE 6--1
TIlE EFFECT OF PRESSURE BREATIHING UPON PERIPHERAL VENOUS
PRESSURE AND MOL'TII-INTRAOESOPIIAGEAL PRESSURE DIFFERENCE
Positive breathing Difference between posi- Change* of mouth-pressure tive breathing pressure intraoesophageal(nmmHg) and change* of venous pressure difference
pressure (inrnHg) (uimHg)A. No counterpressure
10 3.2 3.520 8.0 7.330 10.5 11.0
B. Trunk counterpressure20 0.5 0.340 4.0 2.06o 6.o 2.580 8.0 2.8
\Mcasured frorn the value in the resting state
TABLE 6-12
TIlE REI.ATIONSIIIP BETWEEN REDUCTION OF EFFECTIVE RIGHT
ATRIAL PRESSURE AND REDUCTION OF EFFECTIVE BLOOD VOLUME
DURING PRESSURE BREATHING
Positive Reduction of right Reduction Mlean reduction of rightbreathing atrial pressure of atrial pressure per xoopressure (cin of water) effective ml reduction of blood(mmHg) blood volume
volume(ml)
Subject A Subject B Subject A Subject B30 0.8 1.1 230 0.35 0.486o 1.9 2.9 430 0.45 0.678o 2.8 4.6 540 0.52 0.85
287
SRAISED INTRAI"tLMONARY PRESSURE
Since the peripheral veins were distended and the rate of blood flowthrough the limbs was reduced during pressure breathing, the pressuregradient between the peripheral veins and the right atrium was probablyreduced by this manoeuvre. Thus the increase of peripheral venous pressureinduced by a given positive breathing pressure was probably slightly less thanthe corresponding rise of right atrial pressure. Further, the induction ofpressure breathing increased the right atrial pressure by an amount whichwas slightly less than the corresponding rise of intraoesophageal pressure(Fig. 6-15). Both these factors would tend to reduce the rise of peripheralvenous pressure for a given increase of intraoesophageal pressure and theyprobably account for the difference observed experimentally between thechanges in these two pressures (T!.ble 6-i t).
The increase of peripheral venous pressure induced by pressure breathingat a given positive pressure without respiratory counterpressure was con-sid-rablv increased by the application of counterpressure to the trunk (Figs.6-12 and 6-13). Thus at a given positive pressure the use of trunk counter-pressure increased the amount of blood displaced into the limbs and the rateof loss of fluid from the circulation. If it is assumed that the application ofcounterpressure to the trunk does not change the distensibility of the peri-phcrat capacity vessels, it is possible to calculate the increase in the reductionof the effective blood volume associated with the use of this counterpressure.Thus at a positive breathing pressure of 3o mmHg the application of counter-pressure to the trunk will increase the immediate reduction of the effectiveblood volume from 125 mIl to 175 ml and the subsequent rate of reduction ofblood volume from 20 ml 'rin. to 3o nl Trin. The use of trunk counterpressureduring a five minute exposure to a positive breathing pressure of :3o mmHgwill cause a reduction of the effective blood volume which is 50",, greaterthan that produced by pressure breathing without respiratory counter-pressure. This greater reduction of the effective blood volume associated withthe use of counterpressure to the trunk is a distinct disadvantage. The reduc-tion of respiratory fatigue which trunk counterpressure affords, however,outweighs the increased circulatory embarrassment, particularly at positivebreathing pressures greater than 30 mmHg.Central Venous Pressure -- During diastole the relationship between thepressures in the right atrium and the pleural cavity (effective right atrialpressure) is determined by the tone of the atrial wall and the rate of thevenous return to the heart. If these factors remain constant then a given riseof intra-pleural pressure will produce an equal rise of pressure in the rightatrium. At rest the amplitude of the respiratory fluctuations of right atrialpressure amounted to about half the corresponding changes of intraoesopha-geal pressure (Fig. 6-14). A similar result was obtained by Bloomfield,Lawsen, Cournand, Breed and Richards q.,1.6 (38) who recorded simul-taneously the pressure changes in the right atrium and in a small pneumo-thorax. The smaller amplitude of the respiratory fluctuations of right atrialpressure was probably due to an increase in the venous return during in-spiration which increased the effective right atrial pressure.
The relatively large increase of intrapleural pressure associated with theinduction of preisstre breathing was transmitted directly to the blood withinthe heart so that there was an equally rapid rise of right atrial pressure at the
288
CARDIOVASCUL.AR EFFECTS
beginning of pressure breathing. At this time the fluctuations of right atrialpressure during the cardiac cycle were markedly reduced. This diminutionof the cardiac fluctuations of pressure was due to a reduction in the venousreturn to the heart since the central venous pressure was raised above thevenous pressure in the limbs. The tissue pressure within the thorax, the skulland, to a considerable extent, the abdomen increases with the central venouspressure at the beginning of pressure breathing so that there is little or noimpairment of venous return from these regions, except that which arisesreflexly. At rest about 65",, of the total venous return to the right heart comesfrom the organs within the thorax, skull and abdomen (280). Thus, if noreflex changes in the arteriolar and venous tone occur, the venous return tothe heart would be reduced by at least one third directly pressure breathingwas commenced. It has been shown, however, that pressure breathing inducesconstriction of the resistance vessels in both the skin (io2) and the muscle (37)of the limbs. Such constriction if localized to the limbs, would reduce themagnitude of the fall of the venous return since it would divert the cardiacoutput to regions in which there is y -) increase in the capacity of the vascularbed.
Following. the recommencement of venous return friom tile limbs, therewas, however, a reduction in the effective right atrial pressure as comparedwith that which existed at rest (Fig. 6-i5). The pattern of the right atrialpressure changes during the cardiac cycle and the modifying effects of respira-tion were also altered in pressure breathing. During expiration the amplitudeof the "a" wave, which is produced by atrial systole was much smaller duringpressure breathing than at rest (Fig. 6--14). The fall of mean right atrialpressure induced by inspiration was greater in pressure breathing and theamplitude of the "a" wave was markedly increased. These more profoundchanges produced by respiration during pressure breathing suggest thatrespiration exerts a greater influence on the venous return during pressurebrcathing than it does at rest.
I he fall of the effective right atrial pressure induced by pressure breathingwas a result of the reduction of the effective blood volume which is producedby this manoeuvre. The changes of the effective blood volume produced bypressure breathing for two minutes at the positive pressures used in thestudies of right atrial pressure have been determined from the curves of Fig.6.-30 and are presented in Table 6-12, together with tile correspondingchanges of the effective right atrial pressure. The reduction of effective rightatrial pressure per unit reduction of effective blood volume may be comparedwith those obtained when the blood volume is reduced by venesection or bythe application of venous torniquets to the limbs. McMichael and Sharpey-Schafer 1944 (224) used both these procedures and measured the corre-sponding changes of right atrial pressure by means of a cardiac catheter.They found that a venesection of 420 ml reduced the right atrial pressure by2.5 cm water, whereas venous congestion of the lower limbs, whuich reducedthe effective blood volume by about 700 ml, reduced the right atrial pressureby 5 cm water.
Gauer, Henry and Sicker 1953 (121) bled six subjects and determinedthe effect of this procedure upon the right atrial pressure. The fall of rightatrial pressure was directly proportional to the volume of blood removed and
289
wy-- ~ ~ ~ ~ ~ ~ ~ ~ i 9. .... w-. ~-'-- ~ --
RAISED INTRAPUI.MONARY PRESSURE
amounted to 0.7 cm water per ino nil blood removed. Thus the relationshipbetween reduction of effective blood volume and the consequent fall of effec-tive right atrial pressure found during pressure breathing was similir in onesubject (subject B, Table 6-1 2) to that obtained by McMichael and Sharpey-Schafer 1944 (224) and Ganer, Henry and Sicker t953 (121). In the othersubject (subject A, Table 6-12) the fall of right atrial pressure inducedby pressure breathing was somewhat less than that found in hacmorrhage.Although the number of experiments in which the effective right atrialpressure was measured in pressure breathing was small, the results obtainedsupport the concept that the effective right atrial pressure was reduced bythe peripheral displacement of blood and the loss of circulating fluid into thetissues of the limbs.Cardiac Output - A fall of the filling pressure of the right atrium Nas shownby Knowlton and Starling 1912 (172) to reduce the output of the heart inthe heart and lung preparation. Sarnoff and Mitchrll 1961 (258), whorepeated Starling's experiments, confirmed in the isolated dog's heart therelationship between atrial pressure and ventricular output embodied inStarling's law. In 1944 McMichael and Sharpey-Schafer (2'z4) showed thatin the intact man there was a broad direct relationship between right atrialpressure and cardiac output when the former was varied by venesection andby the infusion of saline. There was, however, considerable variation inresponse of the cardiac output to a given change of right atrial pressure fromone experiment to another. Part of this at least was due to the variability inthe response of the heart rate to the changes of right atrial pressure. RecentlyBraunwald, Bloodwell, Goldberg and Morrow 196i (43) showed that thehuman heart obeys Starling's law when nervous influence is reduced byganglion blocking agents. In the intact individual however, the sympatheticand vagal efferent nerves to the heart modify its response to a given change ofright atrial pressure. It is probable, however, that the very marked fall ofeffective right atrial pressure induced by pressure breathing would lead to areduction of the cardiac output.
Although no direct measurements of cardiac output were made in thepresent study, other investigators have shown that pressure breathing reducesthe output of the heart. Using a ballisto-cardiographic method Otis, Rahn,Brontinan, Mullins and Fenn 1946 (231) found that in trained individualspressure breathing at a positive pressure of 22 mmHg reduced the cardiacoutput by 14"o. The stroke volume was decreased by 26",, hut there was asimultaneous increase in the heart rate. A similar reduction of cardiac outputwas found by Barach, Eckman, Ginsburg, Rumse .orr, Eckman andBesson 1946 (17) who determined the change of cardiac output producedby pressure breathing using the direct Fick m'thod. Cain and Mahoney1953 (53) also used a ballisto-cardiograph to determine the changes ofcardiac output induced by pressure breathing. They found a positive breath-ing pressure of 4o rnmHg reduced the cardiac output by 35 to 50,, ullen norespiratory counterpressure was used and by 30 to 40",, when a vest wasemployed to apply counterpressure to the upper part of the trunk. Using theacetylene method developed by Grollinan 1929 (i33), Parry (personal com-munication) measured the cardiac output during pressure breathing withand without trunk counterpressure at a positive pressure of 3o mmHg. In
2()0

CARDIOVASCULAR EFFECTS
the absence ofcounterpressure pressure breathing reduced the cardiac outputby 30',,. When counterpressure was applied to the trunk the reduction ofcardiac output induced by a positive breathing pressure of 30 mmHgamounted to between 15 and 2o",,. It would appear likely, therefore, thatpressure breathing with respiratory counterpressure at a positive pressure of30 mmHg reduces the cardiac output by about 30",,. Apart from a fewdeterminat,'on made by Cain and Mahoncy 1953 (53) in which their subjectswore the capstan partial pressure suit, there have been no measurements ofthe effects of pressure breathing upon the cardiac output at positive pressuresabove 40 mmHg. It would appear probable, however, that the cardiac outputfalls as the positive breathing pressure is increased.The Arterial Pressure - The systemic arterial pressure was always in-creased by pressure breathing, although the relationship between the increaseof arterial pressure and the positive breathing pressure varied with the degreeof counterpressure applied to the surface of the body. In the experiments inwhich a bladder garment was used the pressure in the headpiece did notachieve the desired value for about five seconds and the arterial pressureincreased simultaneously with the rise of intrathoracic pressure (Fig. 6--16).When no counterpressure was used, however, the headpiece pressure in-creased abruptly at the beginning of pressure breathing and there was anequally rapid increase of arterial pressure. The magnitude of this increase ofarterial pressure was equal to the rise of intrathoracic pressure. This increaseof arterial blood pressure which was maintained for only two or three beats,wai followed by a reduction of the mean pressure and of the pulse pressure.The mechanism underlying the initial rapid rise of arterial pressure inpressure breathing is analogous to the initial increase of arterial pressureproduced by the Valsalva manoeuvre (264). It is due to the direct transmis-sion of the rise of intrapleural pressure to the left ventricle and the systemicarteries within the thorax and abdomen. The decline of the arterial pressureand the reduction of the pulse pressure which followed the initial increase ofarterial pressure is a reflection of the decrease in the venous return to theright atrium. Although these two phases in the arterial pressure response wereclearly discernible when the intrathoracic pressure was raised rapidly bypressure breathing without ccunterpressure, the initial rapid increase becamesubmerged in the subsequent fall of pressure wh,-n the intrathoracic pressurewas increased more slowly over four to five seconds. Thus the initial changesof arterial pressure in pressure breathing are due to the direct transmissionof the rise of the intrapleural pressure to the intrathoracic vessels and thesubsequent decrease in the venous return to the right side of the heart.
Following the initial changes associated with the increase of intrathoracicpressure the arterial pressure usually became steady until ten to fifteenseconds after the beginning of pressure breathing. At this point the arterialpressure frequently increased by a small amount to reach a level which wasmaintained, with respiratory fluctuations, for the remainder of the exposureto pressure breathing. This small additional increase of arterial pressureoccurred at a time when the venous return from the limbs restarted. It wasprobably due, therefore, to the consequent increase in the cardiac output.Sharpey-Schafer 1955 (264) suggests that the increase of mean arterialpressure and pulse pressure seen five to six seconds after the beginning of the
291
"4&

RAISED INTRAPULMONARY PRESSURE
Valsalva manocuvre is due to the onset of arteriolar constriction. It isprobable that such peripheral vasoconstriction also played a part in this riseof arterial pressure seen ten to fifteer, seconds after the beginning of pressurebreathing.
In the steady state the increase of arterial pressure induced by pressurebreathing was less than the positive breathing pressure even when counter-pressure was applied to the whole of the surface of the trunk (Fig. G-17).However, there was a marked decrease of the arterial pulse pressure (Table6-2). If no circulatory disturbances occurred, a given rise of intrapleuralpressure should produce an equal increase in the arterial pressure with nochange of pulse pressure. The primary factor responsible for the failure of thlearterial pressure to follow precisely the increase of intrapleural pressure inpressure breathing is the reduction of the effective blood volurme and theconsequent reduction of the cardiac output induced by this procedure.Counterpressure to the limbs serve to reduce the fa.ll in the effective bloodvolume and so the mean arterial and pulse pressui'es were raised (Fig. 6-17,Table &-2). The application of respiratory counterpressure also increases thearte. ial pressure at a given positive breathing pressure by reducing the lungdistension and hence producing a greater increase of intrapleural pressurethat would otherwise occur. This latter mechanism is of particular significanceat positive breathing pressures less than 3T mmtIg since at this level a largefraction of the applied breathing pressure may be expended in overcomingthe elastic recoil of the lungs.
The increase of arterial pressure and the decrease of pulse oressureobserved duri.?g pressure breathing is not, however, simply an expression ofthe interaction between the rise ofintrapleural pressure and !he Call of cardiacoutput. Pressure breathing induces a marked increase of peripheral resisitanceas does the Valsava manoeuvre (37) (142). Thus the peripheral resisiance intile forearm is approximately doibled by pressure bieathing at a positivepressure of 6o mmHg when trunk counterpressure is employed (Ernsting,unpublished observation). A similar arteriolar constriction may well occurin the abdominal viscera during this procedure, although no direct measure-mernts have been made of the blood flow through these organs in this condi-tion. Such a generalized arteriolar constriction would tend to maintain thearterial pressure during pressure breathing in the face of a decrease in thecardiac output. The importance of this mechanism in maintaining the arterialpressure when the intrathoracic pressure is raised is shown by the effect ofsympathetic ganglion blocking agents upon the response to the Valsalvamanoeuvre. Thus, when the Valsalva manoeuvre is performed following theadministration of a ganglion blocking agent such as tetracthylanunioniumchloride, the arterial pressure continues to fall following the initial rise at thebeginning of the manoeuvre.The normal secondary increase of arterialpressure which occurs whilst the intrathioracic pressure is raised is absent afterthe administration of such a blocking agent (13o).
The reflex constriction of the peripheral resistance vessels induced bypressure breathing is an important factor in the maintenance of an effectivesystemic arterial p iessure during this manoeuvre. There are several possiblesites for the receptors which are responsible for this reflex. A decrease of theactivity of the carotid and aortic baroreceptors results in reflex peripheral
2!12
_________ ___________________________________,__
CARDIO\VAS CI' LAR EFFIECTS
vasoconstriction. Ihe activity of these receptors depends upon the vasculartransmural pressure. When a pressure headpiece, which applies counter-pressure to the skin overl >ing the carotid sinus, is used the vascular trans-mural pressures of both the carotid sinus and the aorta are reduced by theinduction of pressure breathing since the rise of arterial pressure is less thanthe increase of the pressure applied to the neck by the headpiece and the rise
of intrapleural pressure. Not only is the mean arterial transmural pressurereduced by pressure breathing, bivt ,'-obably of greater importance, withrespect to baroreceptor activity, is the concomitant reductin of the arterialpulse pressure. Thus Ead, Green and Neil 1953 (86) have shown that thereflex effect upon the systemic pressure of a pulsatile pressure in the carotidsinus is much greater than that of a steady pressure at the same mean value.
Stimulation of receptors in the low pressure regions of the intrathoracicvascular bed can also produce reflex chauges of peripheral vascular resistance.Thus raising the pressure in the right side of the heart in the dog proc.uecd areflex bradycardia and peripheral arteriolar dilatation (12) although theactual site of4the receptors underlying thwse reflex changes is uncertain. Thereis also a considerable body or evidence (7o) (12) that reflex changes of peri-pheral resistance can arie from receptors situated in the walls of the pul-monary veins and the left atrium. In man, Roddie and Shepherd 1956 (247)have demonstrated reflex changes in the tone of the resistance vessels ofthe fbrearm as a result of alterations of the volume of blood within the chest.These changes occurred without any significant change ,f systemic arterialpressure so it is unlikely that they were due to alterations in arterial baro-rtceptor activity. The reflex increase of peripheral resistance induced bypressure breathi ng prolbably arises, therefore, 1i-om changes in the activity ofreceptors situated both in the low pressure regions o" the intrathoracic circula-tion ard the aortic and carotid sinus regions.
In most of the exposures to pressure breathing in which Counterpressrirewas applied to the lower limbs as well as to the trunk the increase of meanarterial pressure actually exceeded the positive breathiog pressure (Fig. 6--i 7)-Even with this degree ofcounterpressure, however, the arterial pulse pressurewas less during pressure breathing than at rest (Table 6--2) which suggeststhat the stroke volume of the heart was reduced by pressure breathing underthese conditions. This increase of arterial pressure relative to the intraplei alpressure during pressure breathing was due primarily, therefore, to a markedincrease of peripheral resistance, although the as¢ociated tachycardia wouldalso have contributed to the increase of blood pressure in view ofth, reductionof the stroke volume.
The rapid decrease of the arterial pressure when the headpiece pressurewas reduced to zero at the end of a period of pressure breathing (Fig. 6--16)was a direct effect of the reduction of the intrathoracic pressure. The arterialpulse pressure which remained less than normal for several beats after thereduction of the headpiece pressure increased to a value which was con-siderably greater thar the pulse pressure in tile resting state. This increasewas due primarily to the rise in stroke volume of the left ventricle whin hoccurred at this time. As the intrapleural pressure fell the venous return to theright iole of the heart was greatly at gmented by the release of the blood heldin the widely distended capacity vessels during pressure breathing. Although
293
F- ~- - n' -

(:ARDIOVAS(:ULAR EFFEI,:rS
this influx of blood occurred very rapidly there was a delay of about twoseconds before the stroke volume of the left ventricle was increased because ofthe capacity and resistance of the intervening pulmonary vascular bed. Thepersistence of the increase in peripheral resistance induced by pressurebreathing into this period also played a part in the genesis of the largearterial pulse pressure and the increase in mean arterial pressure whichoccurred after the cessation of pressure breathing. This response is analogousto the "overshoot" of arterial pressure which follows cessation of the Valsalvamanoeuvre. The increase of arterial pressure which follows release of raisedintrapulmonary pressure is abolished by the administration of a ganglionblocking agent which prevents peripheral vasoconstriction (130). The cardiacslowing associated with the large increase of arterial pulse pressure whichfollowed cessation of pressure breathing probably arose from stimulation ofthe carotid and aortic baroreceptors.
The blood flow through an organ is determined by the difference betweenthe local arterial and venous pressures and the resistance to flow offered bythe vascular bed. Although in pressure breathing the arterial pressure israised considerably, in most situations the peripheral venous pressure is raisedby an amount which either equals or exceeds the increase of arterial pressureafter the initial fifteen to twenty seconds of pressure breathing. Thus thearterio-venous pressure difference is slightly reduced by pressure breathing sothat in the absence of any change of peripheral resistance the regional bloodflow would be reduced. Although there is an overall increase of peripheralresistance in pressure breathing, only limited studies of regional blood flowhave been performed in this condition. There is strong evidence that arteriolarvasoconstriction occurs in both the skin and muscles of the limbs with a con-sequent reduction of blood flow (io2) (37); Ernsting, personal observation.No direct measurements have been made of cerebral blood flow duringpressure breathing at high positive pressures, although it is known that themost important factors controlling blood flow through the brain are thetensions of oxygen and carbon dioxide in the arterial blood. The significanceof this control mechanism during pressure breathing was discussed in theprevious chapter. Nothing is known concerning blood flow through otherregions during pressure breathing, although there must be an overall reduc-tion of blood flow since the cardiac output is reduced.Heart Rate - The magnitude of the increase of the heart rate induced bypressure breathing depended upon the positive breathing pressure, the areaof the body to which counterpressure was applied and the duration of theexposure (Figs. 6--9 and 6-20). Thus the greater the positive breathingpressure and the longer the time for which it was operative, the higher was,he heart rate. The cardiac acceleration generally commenced within fiveseconds of the beginning of an exprisure to pressure breathing, particulaIly atthe higher positive pressures. The reflexes underlying the tachycardia inducedby pressure breathing probably arise from receptors similar or identical tothose which are respnnsible for the reflex peripheral vasoconstriction whichalso occurs in this condition. Thus a reduction in the cffective filling pressureof the right or left side of the heart will give rise to tachycardia (12). Further-more a reduction of the mean and pulse p:essure in the .arotid baror.ceptorregioii causes a reflex cardiac acceleration (86). The observed rise of tie heart
294

(CARI)1OVAsC I.AR I, F rI. (L'TS
rate with ehiher an increase in the loiltive bit C'athingt preisii r re or Ill(" h lrolonga-tion of an exposure was probab!v due to the associated decrease of theeffective bl"od volume and hence of the effective filling pressure of the heartThe effects of applying counterpressure to a large proportion of the surface ofthe body is probably also explicable on the basis of the increase in theeffective blood vAlutne associated with the application of counterpressure.The temporary reduction of heart rate associated with contraction of themuscles of the upper limbs (Fig. 6 21) was due to a transient increase of thevenous return to the heart. This increase in venous return was produced bythe rise of tissue pressure in the limbs associated with muscular contraction.
The electrocardiographic changes produced by pressure breathing (Fig.6-n 8) indicated that there was an alteration of the electrk al axis of the heart.A detailed analysis of these changes was not undertaken but the recordings ofthe standard limb leads showed that pressure breathing rotated the electricalaxis of the heart in the frontal plane in a clockwise direction. Since theapplication of counterpressure to the trunk reduced the magnitude of thisrotation (Fig. 6-18) the rotation was probably associated with the respiratorydisturbance induced by pressure breathing, in particular the increase o. thevolume of gas within the respiratory tract. A similar clockwise rotation of theelectrical axis of the heart was produced by a deep inspiration. In bothinstances the mechanism underlying the rotation of the electrical axis was aclockwisw rotation of the heart itself in the frontal plane. This rotation wasinduced by descent of the diaphragm.Pressure Breathing Syncope - Under certain circumstances the subjectexposed to pressure breathing may suffer a syncopal attack. The clinicalfeatures of the syncopal attacks which were observed in the present investiga-tion were remarkably uniform and they confiormed closely to those of vaso-vagal syncope. L~ewis 1932 (187) studied the mechanism of fainting and hedemonstrated that the acute fall of arterial pressure which characterizes thiscondition persisted when the associated hiadycardia was abolished by theadministration ofatropine. He intl oduced the term "vasovagal" to emphasizethe importanc'e of peripheral vasodilatation as well as bradycardia in thegenesis of the acute hypotension which characterizes a faint.
Interest in vasovagal syncope was intensified during World War II sinceit frequently occurs in inidividuals who have suffered a haemorrhage. ThusWallace and Sharpey-Schafer 1941 (281) showed that the incidence offainting increased with the volume of blood withdrawn from the circulation.Although Mcl)owall 1938 (217) had suggested that John Hunter's observa-tion that the blood flowing from a vein became bright red when a patientfainted indicated that peripheral vasodilatation occurred in fainting, nodirect measurements of peripheral blood flow were made in this conditionuntil 1944. Borcroft, Edholm, McMichael and Sharpey-Schafer '944 (23)found that there was a dlecrease of vascular resistance in the forearm duringa faint and Barcroft and Edholin 1945 (22) showed that this was due toactive vasodilatation in tuNscles and a constant feature of vasovagal svncopewhatever the precipitating cause. In several experiments the change of peri-phwral resistance was determined during pressure breathing syncope by thetechnique developed by Hayter and Sharpey-Schafer 1958 (142). Itt eachinstance of syncope in these experiments the fall of arterial pressure was
295
RAISED INTRAPULMONARY PRESSURE
associated with a marked decrease of peripheral resistance in the foreatmil(Ernsting, personal observation). Thus the cardiovascular changes whichhave been observed during pressure breathing syncope are exactly similar tothoe which characterize vasovagal syncope due to haeinorrhage, prolongedstanding in the upright posture etnotion,1! disturbanre P-d Lrypoxia.
A reduction of the -ffectivc b!':cJ volume, whether produced by haemor-rhage or by venous congestion ofthe limbs (87) wil, ifofstfficient magnitude,induce a vasovagal faint. Since pressure breathing reduces the effective bloodvolume it would appear likely that this disturbance may be responsible forsyncope in pressure breathing. This manoeuvre does, however, produce otherdisturbances which are known to precipitate vasovagal syncope in susceptiblesubjects. These inriude emotional disturbances such as dislike of wearing aheadpiece, which may occur in an inexperienced subject, and discomfort orfrank pain duw to an ill-fitting garment. In certain circumstances in whichexperienced ,ubjects developed syncope during pressure breathing, none ofthese additional disturbances was evident and it is probable that syncopeunder these circumstances was due primarily to a reduction of the effectiveblood volume. Whcre experiments were performed with trunk counter-pressure, it is possible to estimate from the positive breathing pressure and theduration of the exposure when syncope occurred the approx:mate reductionof the effective blood volume using the curves presented in Fig. 6-30. Thereduction of effective blood volume which had been produced in each of theseexposures when syncope occurred lay between 66o and qoo ml (Table 6--i '3).
These values may be compared with the relationship bet\ween the volumeof blood withdrawn from semi-reclining subjects and the incidence of laintingfound'by Wallace and Sharpey-Schafer 1941 (281). Approximnately 20",, of
their subjects fainted when 7oo ml of blood was withdrawn whereas syncopeoccurred in 5o00, when 0ooo ml was removed. Thus the reductions of theeffective blood volume induced by pressure breathing when syncope occurredwere of the same order as that which induced vasovagal syncope in 20",, to40",, of normal subjects. Furthermore, Ebert and Stead i9.lo (87) foundthat the application of venous tourniquets to one upper and both lower limbsfor ten minutes, which reduced the volume of blood circulating in the head,trunk and one arm by an average of 720 ml, induced symptoms of vasovagalsyncope in four out of seven subjects. This evidence supports the hypothesisthat pressure breathing syncope in instances where there is no discomfort oremotional disturbance is due primarily to a reduction of the effective bloodvolume.
However, many incidents of pressure breathing synrope occurred, wherethe reduction of effective blood volume was not so great and the presence ofother precipitating factors had to be considered (Table 6-4). Since in themajority of these syncopal attacks counterpressure was also applied to thelower limbs by means of an anti-g suit, it is necessary to consider the effect ofthis counterpressure upon the displac,.ment of blood and fluid into the lowerlimbs. W\hen a jerkin and anti-g suit are used during pressure breathing,counterpressure is applied to between 75 and 80)o' of the surface of the lowerlimbs. Measurement of the tissue pressure beneath an anti-g suit has shownthat this garment raises the pressure in the underlying tissues by an amountwhich equals the gas pressure in the suit bladder, Ernsting 1955 (9i). It has
296
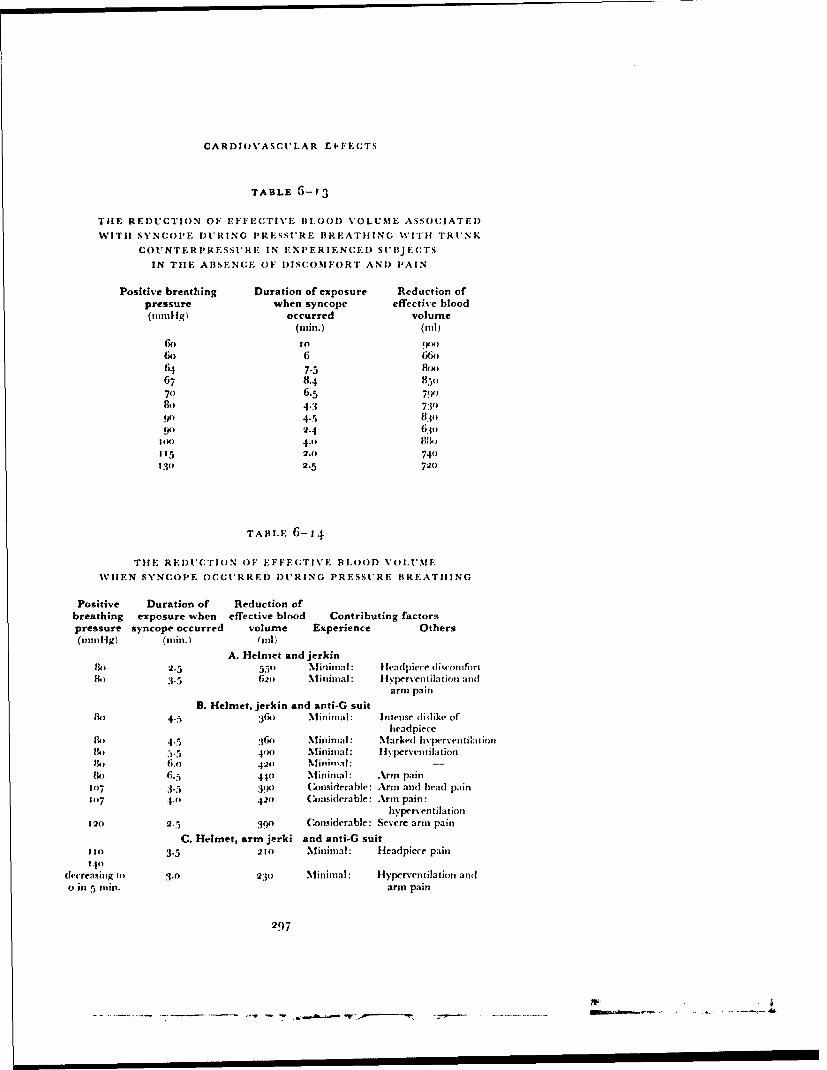
CARDIOVASCULAR El FECTS
TABLE G--3
TilE REDUCTION OF EFFECTIVE BLOOD VOLUME ASSOCIATED
WITH SYNC'OPE DURING PRESSURE BREATHING WITH TRUNK
COUNTERPRESSI'RE IN EXPERIENCED SUBIJ EC'TS
IN THE ABSENCE OF DISCOMFORT AND PAIN
Positive breathing Duration of exposure Reduction ofpressure when syncope effective blood(ninn1g) occurred volume
(nin.) (ill)
6X) to (pil
6o 6 66o64 7.5 84x)67 8.4 8 5°70 6.5 79(1)84) 4"3 7309') 4.5 830•
4) 2z.4 630,DIM 4.n 8N)I15 2.o 740130 2.5 7(20
TApi.E 6-14
" "I!E REDUCTION OF EFFECTIVE BI.OOD VOLUME
WHEN SYNCOPE OCCURRED DURING PRESSURE BREATHING
Positive Duration of Reduction ofbreathing exposure when effective blood Contributing factorspressure syncope occurred volume Experience Others(nmlilg) (mmn.) (ilI
A. Helmet and jerkin130 2.5 550 Mininial: Headpiece (liqcomfirth) '5 62o Mininal : llyperventilation and
arm pain
B. Helmet, jerkin and anti-G suito 4.5 :316o Miininal: Intense dislike of
headpieceM) 4.5 :36o Minimal: Marked hyprv'eniation11) 5.5 44)o Mm ninial: I yperventilation
6.0 420 Minitilal: -
13 6.5 440 Mininmal: Arm pain1o7 3.5 3901 Considerable: Arn and head pain1417 4.0 42) (Considerable: Arm pain:
hyperventilation120 2.5 3.90 Considerable: Severe arm pain
C. Helmet, arm jerki and anti-G suit130 3.5 21) Minimal: Headpiece pain
340decreasing to 3.0 230 Minimal: Hyperventilation andu in 5 inn. arm pain
297
- - . - -- - . -- ----- ----- .... ............ -..------ t-. -
RAISED INTRAPIIMONARY PRESSURE
been assumed, therefore, that the inflation of the anti-g suit to a pressure(gauge) which equals the positive breathing pressure reduces the volume ofblood displaced and the rate of loss of fluid into the tissues of the lower limbsto 25•o, of the values which were measured during pressure breathing withoutcounterpressure. The results of the calculations of the reduction of theeffective blood volume produced by pressure breathing when syncopeoccurred are presented in Table 6--14. These calculations show that syncopeoccurred in more than half the subjects when the reduction of effective bloodvolume did not exceed 40o ml. In each of these instances there was an obviousdisturbance in addition to that of pressure breathing. The potentiating effectof emotional disturbances, pain and hypoxia upon the development of vaso-vagal syncope due to a small reduction of effective blood volume is welldocumented (9o). Hypocapnia which occurred frequently during pressurebreathing in inexperienced subjects also increased the likelihood of pressurebreathing syncope. Thus pressure breathing with trunk counterpressure at apositive pressure of 6o mmHg induced collapse in three out of six subjectswhen the alveolar carbon dioxide tension Nsas reduced to 25 mmHg whereasnone of the subjects collapsed when the alveolar carbon dioxide tensionremained above 35 mmHg (Ernsting, Green, McHardy and Wagner, tin-published observation).
The reflexes which give rise to the cardiovascular changes which occur inpressure breathing syncope are probably the same as those which occur invasovagal syncope due to haemorrhage, emotional disturbances, etc. Whilstit is known that the vagal fibres to the heart and the sympathetic vasodilatorfibres to the vessels of the skeletal muscle form the efferent limbs of thesereflexes the receptors and afferent pathways have not been defined. "1 heevidence which is available suggests that the receptors concerned lie withinthe heart. Thus the left atrium contains receptors, the rate of firing of whichdepends upon the degree ofdistension of these cavities (1 5o). Sharpey-Schafer,Hayter and Barlow 1958 (266) have suggested that the large pressuretransients which occur in the left ventricle during systole when the volume ofblood in it is reduced to virtually zero may stimulate receptors which areresponsible for the vasovagal reflexes. This hypothesis is supported by theabsence of fainting in patients in heart failure following large venesections(159). In such paticrits even a large venesection does not reduce the fillingpressure of the heart to a point at which the left ventricle is emptied coim-pletely during systole. It is likely, therefire, that when syncope occurs inpressure breathing the reduction of effective blood volune induced by themanoeuvre has decreased the effective filling pressure of the heart to such anextent that the consequent change in the pattern of afferent impulses fromreceptors within the heart fires the central tnechani-:n which induces peri-pheral vasodilatation and bradycardia.Duration of Protect'on - T'he occurrence of syncope forms the absolutelimit to the time for which pressure breathing can 1e performed. Althoughthe primary cause of syncope during pressure breathing is the reduction ofthe effective blood volumt beyond a certain value, in many instances beforethis value was reached syncope was precipitated by emotional disturbances,the presence of discomfort or pain and by hypocapnia. The several groups ofexperiments which were perforrmed at ground level ("Fah)le 6i-3) gave an
2(8
- |
CARDIOVASCULAR EFFECTS
indication of the relationship between the time for which pressure breathingcould be peribrmed without the occurrence ofsyncope, the poastive breathingpressure arid the degree of counterpressure applied to the surface of the body.Although the number of subjects used in some of these experiments wasrelatively small it is possible to draw certain conclusions with regard to thetinie fbr which pressure breathing can be performed using a particularassembly of pressure clothing. Thus, at a positive breathing pressure of 8omnmHg the duration of protection against syncope afforded to inexperiencedsubjects by thejerkin alone is less than four minutes whilst the addition of thecounterpressure given to the lower fimbs by the anti-g suit prevents syncope
arising within this time. At a higher positive breathing pressure (107 mmHg)syncope occurred within fotir minutes even when the anti-g sui: was used withthe pressure jerkin. In nearly all the exposures to this positive breathingpressure the subjects experienced upper arm discomfort (Table G--5) and theduration ofpi otection given by this assembly is limited to about two minutes.The application of counterpressure to the tipper limbs by means of the armjerkin in addition to the lower limbs extended the duration of protectionafforded against a positive breathing pressure of i to mmnHg to at least fourminutes.
These experiments a!so demonstrated the influence of previous experienceof pressure breathing at positive pressures of the order of 6o--8o mnmHg uponthe incidence of syncope during a given exposure. Tihe main factors respon-sible for the decrease in the incidence of pressure breathing syncope withtraining are fuamiliarity with the equipment.. with the discomfort, particu-larly that arising in the upper arm arid the adoption of a more nearly normalbreathing pattern. Many subjects hyperventilate markedly during their firstfew exposures to pressure breathing. Most subjects, however, rapidly adaptto the unusual sensations associated with high positive breathing pressuresand exhibit only a small degree of hyperventilation after training. With amoderate degree of training consisting of approximately six exposures topositive breathing pressures above 5o mmHg the incidence of syncope wassignificantly reduced as compared with tihe incidence when the subjects hadhad no previous experience of the manoeuvre.
The time for which pressure breathing was performed by nioderatelyexperienced subjects without the occurrence of syncope is sumnmarizc I inTable 6-15, in relation to the positive breathing pressure arid the degrte ofcounterpressure applied to the surface of the body. After adequate trail ingthe principal factors precipitating syncope during pressure breathing %u eresevere discomfort or firank pain in the upper arm, neck or head. Whcn thestandard pressure jerkin was used tIh iircidence of severe upper arm discomn-fort became considerable at positive breathing pressures above 8o mmHg,whilst pain was common when the positive pressure was greater than 107mmHg (Table 6G-5). T'he pain in the upper arm was relieved by the applica-tion of' cointerpressure to this region. It probably arose from the extremedistension of the veins on the mehdial aspect of the tippetr arm which occurredat the higher positive breathing pressures. l)isconfOrt in the neck and headwas generally absent at positive breathing pressures of up to 8o mmnlg. At apositive pressure of r 07 mmul-Ig about one fifth of tVe subjects had severe neckdiscomfort when tire standard pressure helmet was employed. Subsequent
2I()!
RAISED INTRAAPULMONARY PRESSURE
experiments in which a pressure helmet fitted with a lengthened neck bladderwas used showed that the incidence of this pain could be reduced to aninsignificant level by the application of adequate counterpressure to the neck.This increased comfort during pressure breathing was, however, associatedwith a reduction of head mobility. Although it was possible to reduce some ofthe head discomfort induced by the pressure helmet at the highest positivebreathing pressure investigated, many subjects experienced discomfort underthese conditions.
The reduction of the effective blood volume associated with pressurebreathing for the time which did not give rise to syncope in moderatelyexperienced subjects, has been calculated for each of the conditions in whichthe standard jerkin was used (Table 6-15). It was also possible to estimatethe reduction of effective blood volume which occurred when the arm jerkinand anti-g suit were used to apply counterpressure to the body. The bladdersin the sleeves of the arm jerkin cover about 75",, of the upper limbs above thewrists, and no counterpressure was applied to the hands. The results of thesecalculations, which are only approximate, suggest that the reduction of theeffective blood volume induced by pressure breathing for the periods givenin Table 6-15 did not exceed 400 ml except when the anti-g suit was notworn. It is of interest that the reductions of effective blood volume produc,-dby the various combinations of positive breathing pressure and duration ofexposure which were found to be acceptable for moderately experiencedsubjects when counterpressure was applied to the trunk and either the loweror all tbur limbs were very similar. This finding lends support to the conceptthat the magnitude of' the reduhction of the effective blood volume may beused as an indication of' the dhgree of stress imposed by a given exposure topressure breathing, Wallace aild Sharpey-Schafer 19.11 (281) found thatthe incidence of syncope when 4 o, ml of blood was withdrawn from restingsubjects was less than 2",,. Thus the proportion of subjects exhibiting a col-lapse during pressure breathing with counterpressure to the trunk and thelower limbs within the limits given in Table (6-15 would be expected to bevery low.
The experimental results and calculations presented in Table 6-15 demon-strate tile marked reduction in the cardiovascular stress during pressurebreathing associated with the application of counterpressure to the lowerlimbs by means of the anti-g suit. In practice, no additional disadvantagesaccrue from the use of the anti-g suit in this manner since this garment mustbe worn in order to gain protection against the effects of positive accelera-tions. When the pressurejerkin is used alone at a positive breathing pressureof 8o mmtlg the reduction of etfictive blood volume, which is considerablealter two minutes, reaches 700 ml during a four minute exposure (Fig. 6--3o).Thus at positive breathing pressures above 5o mmHg counterpressure shouldbe applied to the lower limbs by means ofan anti-g suit as well as to the trunkby means of the pressure jerkin. '"'he application of counterpressure to thetipper limbs by the bladders of the arm jerkin reduced even further tilecardiovascular stress induced by a given positive breathing pressure. Thebladders in the sleeves of the arm jerkin do, however, restrict movement whenthey are inflated so that there are practical disadvantages to the use of thisgarment. The experimental results showed that the combination of standard
300

CARDIOVASCUI.AR EFFECTS
TABiE 6--15
TIHE DURATION OF PROTECTION AFFORDED BY VARIOUS PRESSURE
CLOTHING ASSEMBI.IES AGAINST SYNCOPE DURING PRESSURE
BREATHING IN MODERATELY EXPERIENCED SUBJECTS
Positive Duration of Reduction ofPressure clothing breathing pressure effective blood
assembly pressure breathing volume(mmHg) without syncope (.1l)
(min.)Helmet 80 2 540JerkinHelnet 8o 5 380Jerkin 107 3 380Anti-g suit 133 2 400
HehlOetHeme 110 6 39°Arm jerkinAnti-g suit 14o decaying to o in 5 mill. 2401
SMaximium reduction
301
- - - -

RAISEID INTRAPLt'LIONARY PIR.ESSUREIIt
jerkin and anti-g suit provided adequate counterpllssurc at positive breathingpressures of up to 107 mniHg for exposures lasoog for three I!Iinutes. Abovethis breathing pressure, however, the incidence of severe arm pain was high(Table 6--5) and the time for which pressure breathing could be performedwith this combination was reduced ,o a value which was of little practicaluse. Thus counterpressure must be applied to the upper linibs as well as thetrunk and lower limbs at positive breathiag pressures above 1o7 mmHg.Effects of Hypoxia upon the Cardiovascular Responses - Since theredluction of effective blood volume anrd the intensity of the subjective dis-turbances induced by pressure breathing increased as the positive breathingpressure rose it was clearly desirable that the positive pressure used at a gi\cnaltitude should be the mitinmu which could be accepted. This mininnun isset by the maximtim degree of hypoxia which could be tolerated fbllowingthe induction of pressutre breathing at high altitude. Two considerationsdetermine the maximum degree of hypoxia which can be allowed in thissituation. The first is the influence of hypoxia upon the cardiovascular re-sponses to pressure breathing. The second consideration is the effect ofhypoxia upon the higher finctions of the central nervous system and thedlegradation of performance which ensues. The former can be determined bymeasuring the time of incidence of syncope and the latter by performancetests.
The cardiovascular effects of hypoxia during presstire breathing werestudied in stibjects breathing air at reduced environmental pressure. Thismethod was used since it sinmplified the experimental procedure and allowedimmediate treatment to be given in the event of a collapse since a medicalofficer accompanied the subject in the decompression chamber. It wasassumed that changes of absolute intrapulmonary prenstire per se had no speci-fic effect tipon the tolerance to pressure breathing and that any effects foundwith a reduction of absolute intrapulmonary pressure were due to theassociated redtiction of the alveolar oxygen tension. It wvas known thatbreathing oxygen at anl environmental pressure of I1t 7 1nmHg 'eqtivalent toan altitude of 44 o() ft) ý% hich resulted in an alveolar oxygen tension of 35--4()mmHg, rapidly produced a detectable impairment of' performance. It wasconsidered, therefore, that this absolute intrapulnmonary pressure wasprobably the lowest which would be acceptable during pressure breathing of'oxygen at high altitude. Calculations suggested that the al,,oltite intraptil-monarv presstire which would result in a similar vahlu of the alveolar oxygentension when air was breathed was , 8o mmHg. Since the effects of' hypoxiacould be determined with greater safety at this al)solite pressure, hypoxiawas induced by the subject breathing air at anl absolute pressuire of 38omnit-Ig (equivalent to anl altitude of 18 o0o ft ý. In order to allow ant assessmentof the effects of a more profound degree of hypoxia anl intrapuhlonarvof 349 nmmHg absolute (equivalent to anr altitude of 20 ooo ft) was also ulsedas a few preliminary experiments had shown that pressure breathiing with allintraptilmonary pressure of 321 nimHg (equi,'alent to an altitude of 22 000
ft') regularly produced umconsciousness. The alveolar gas samples obtainedlduring pressure breathing with air at reduced environmental pressutre (Fig.G-25) showed that with anr intrapulmonary pressure of3:8o nmmHg absolutethe alveolar oxygen tension lay between 35 and 4-2 mmtl-g and was on the
302
a#.¢" - ' W- ,'.. -4 - '.-. -'- -
CARMIOVAS(l.AR EFFECrS
average sonic 2 niinlIg lower when the intrapuhnonary pressure %%,as i4.!)mmHg absolute. The relatively higher alveolar oxygen tensions which wereohtained at a pressure of 3V9 ininTg absolute were due to the greater degreeof hyperventilation induced at this pressure and the consequent lowering ofthe alveolar carbon dioxide tension.
The control series of experiments confirmed that pressure breathingwithout hypoxia at a positive pressure of 52 mmHg for two minutes withtrunk counterpressure does not induce any serious cardiovascular stress (Fig.6-24). The degrees of hypoxia used in these studies induced a considerabletachycardia in the resting state. Thus the mean heart rate of the restingsubjects was increased from 75 per minute at ground level to io8 per minuteat an intrapulmonary pressure of 38o mmHg absolute. The induction ofpressure breathing increased the heart rate both at ground level and whenhypoxia was present. The increase of heart rate produced by pressure breath-ing was greater when the alveolar oxygen tension was normal than whenhypoxia was present. The final heart rate, achieved after pressure breathingfor two minutes was, however, considerably greater in the hypoxic state thanat ground level F Fig. 6-24i. The heart rate changes suggest, therefore, that thecardiovascular stresses induced b)y hypoxia and pressure breathing areadditive. Two types of failure occurred when pressure breathing xsas per-fi)rmed with a low alveolar oxygen tension. In one type loss of consciousnesswas associated with arterial hyvpotension and bradycardia (vasovagal syn-cope) whilst in the .:ther type tile subject became confused whilst his pulseremained rapid and bounding. The cerebral disfunction which occurredin the latter instances was not due to a sudden fall of cerebral blood flow asoccurred in the syncopal attacks. It was produced by the low oxygen contentof the arterial blood whilst the cerebral circulation was maintained.
This group of experiments demonstrated that the degree of hypoxia asso-ciated with an alveolar oxygen tension of the order of 35-40 mmHg causedsyncope during pressure breathing under circumstances in which syncope didnot occur when the alveolar oxygen tension was within normal limits.Anderson, Aden, Barcroft, Edholm and Manning 1946 (5) studied the effectof displacing blood into the lower limbs by means of congestion cuffs placedaround the tipper thighs upon the manner in which consciousness was lostwhen the oxygen tension in the inspired gas was progressively reduced. Theyfound that whilst three of their thirteen subjects lost consciousness by vaso-vagal syncope when there was no displacement of blood into the lower limbs,ten of the subjects developed vasovagal syncope when hypoxia was inducedafter the application of congestion cuffs to the thighs. The application ofcongestion cuffs to the thighs did not of itself induce vasovagal syncope inthese subjects. These experiments showed that vasovagal syncope is muchmore likely to occur when a reduction of the effective blood volume is com-bined with hypoxia than when hypoxia is absent. This is a similar effect tothat found during pressure breathing. The manner in which hypoxia rendersa subject more liable to vasovagal syncope during pressure breathing isuncertain. The hypoxia mighi act peripherally, in that it accentuated thecirculatory disturbances induced by the raised intrapulmonary pressure.Thus the volume of blood displaced into the limbs or the filtration of fluidfrom the vessels into the tissues of the limbs might be increased by hypoxia.
303
5",''

RAISED INTRAPUL1MONARY PRESSURE
The increased susceptibility to syncope could, however, be due to centralcffects in that hypoxia might render the central nervous mechanism under-lying vasovagal syncope more sensitive to the peripheral circulatory dis-turbances induced by pressure breathing.
The possibility that hypoxia of the degree associated with an alveolaroxygen tension of 35-4o mmHg might affect the distensibility of the peri-pheral capacity vessels was investigated in a small series ofexperiments (Table6-6). It was found that, at least in the forearm, hypoxia did not increase thevolume of blood displaced into the limb by a given positive breathingpressure. Confirmatory evidence that hypoxia does not affect the distributionof blood within the circulation is given by the results of the studies of the effectof hypoxia on the pulmonary circulation performed bv Fritts, Odell, Harris,Braunwald and Fishman i96o (1t16). They found that the central bloodvolume was unchanged by moderate hypoxia and that there was no move-ment of the centre of gravity of subjects lying on a teeter-board when hypoxiawas induced. It would appear probable, therefore, that the volume of blooddisplaced into the limbs by a given positive breathirm; pressure is not affectedby the presence of moderate hypoxia.
Severe anoxia has been shown to damage the walls of tissue capillariesand to render them permeable to plasma proteins so that oedema follows aperiod of anoxia (081 ). Furthermore, .Maurer 194o 2o61 demonstrated thatsevere hypoxia increases the flow of lymph firom the lung. Nc'Michael andMorris 1936 (223) studied the effect of breathing !.5, oxygen in nitrogenupon the rate ofincrease ofvolume ofthe congested ibrearm. 'i'hey found, how-ever, that the degree of hypoxia induced by this gas mixture did not change therate of fluid filtration in this region. The effect of acute anoxia upon capillarypermeability in mran was investigated by Henry, Goodman and Nleehanl1947 (147) who measured the concentration of plasma protein in venousblood fiorn a congested arm and compared it with the protein concentrationin blood from a control arm both at sea level and whilst the subject breathedair at a simulated altitude of 20000 ft. They found that when the venousoxygen tension was reduced to below 15--235 mmHg there was a significantincrease in the permeability of the capillary wails to protein. The oxygentension in the venous blood from the co:,trol arm did not reach this low levelduring air breathing at 20 ooo ft. The lower tension in the venous blood fr-omthe experimental arm was produced by the congestion and consequentreduction of local blood flow. It is unlikely, however, that the venous oxygentension fell as low as this level during pressure breathing with air at an intra-pulmonary pressure of 38o mmHg absolute. The rate of filtration of fluid intothe tissues of the limbs was probably not increased by the level of hypoxiaused in the pressure breathing experiments.
It would appear improbable, therefore, that the hypoxia associated withan alveolar oxygen tension of 35 to 40 mnmHg either increases distensibilityof the peripheral capacity vessels or the rate of fluid filtration during pressurebreathing. The experimental studies of the amount of blood displaced in theforearm by pressure breathing were, howevcr, very limited in that only threesubjects were investigated and no measurements were made before or duringa syncopal attack. Although the possibility that hypoxia increases the likeli-hood ofa syncopal attack during pressure breathing by increasing the volume
304
CARDIOVASCt'LAR EFFECTS
of fluid displaced into the unprcssurized regions cannot be completely ex-cluded, the evidence available suggests that this mechanism is improbable.It may be concluded tentatit ely that hypoxia acts by incrcasing the sensitivityof the central nervous mechanismn responsible for the vascular and endccrinechanges which underly vasovagal syncope to the circulatory disturbancesinduced by pressure breathing.Acceptable Degree of Hypo:da during Pressure Breathing - The ex-periments discussed in the previous paragraphs showed conclusively thathypoxia of the degree associated with an alveolar oxygen tension of 35 to 40nmmtlg increased the possibility of syncope occurring during pressure breath-ing. They also confirmed that, in a proportion of subjects, even a shortduration exposure to this degree of hypoxia gave rise to mental confusion. itwas concluded, therefore, that the albolute intrapulnonary pressure duringpressure breathing with oxygen at high altitude must be consider ably greaterthan 117 innil-g since the alveohr oxygen tension at this intrapulmonarypressure would be of the order of 4 mnmHg unless gross hyperventilationocoirred. On the other hand oxygen can be breathed at an absolute pressureof 141 mmitg (equivalent to an altitude of 40000 ft) with virtually noimpairnent of' performance. It appeared prolbable that an absolute intra-pulmonary pressure of 141 n-.ullg was the lowest which could be used duringpressure breathing with oxygen at high altitude without untoward effectsarising due to hypoxia. Furthermore, this absolute pressure had been used inother high altitude partial pressure assemblies such as the capstan partialpressure suit (162) (157). The pressu-e demand oxygen regulator (Mark 18)used in the initial asscssment of the headpiece and( re'ssure jvrkin assembliesin the decompression chamtber delivered a slightly higher absolute pressure,145 nlJg (Table 6-8).
The subjects used in tics;C experiments, each of' whoTl had had an exten-sive experience of hypoxia, did not detect any itnpairnicnt of consciousness.The simple tests of pclrfirniance, such as the ability to peribininmental arith-metic which were used at this time, showed no impairment during the ex-posures to pressure altitudes of 6) ooo and 7() oo I. LIn addition, none of theexperienced subjects used in these preliminary studies developed anysymptoms or signs of syncope whilst pressure breathing at pressure altitudesabove 40000 ft. It was decided, therefore, that the intraputnionary pres.ureused with assemblies incorporating a headpiece should not lbe less than 141-145 minl-Ig absolute. For various technical reasons the pressure demandregulator ýMark 20) developed for use in thd Royal Air Force maintains anabsolut pressure of the order of 55 mnnlHg at altitudes al)ove 38 ooo ft. Th'l'esul)sequent experience gained in the training ofaircrew using this regulator inthe use of either the standard jerkin or the arm jerkin in combination with aheadpiece and anti-g sttit showed that no impairment of perfirllrance occur.sdue to hypoxia during pressure breathing when intrapulmonary pressure is ofthe order of 155 mmnHg absolute (Table G--8). There was a small incidenceof' syncope during the exposure of these aircrew to a simulated altitude of6o ooo ft in the jerkin, headpiece, anti-g suit con;rbination (Table 6-9), but inboth instances the subjects exhibited gross hvpeivcntilation whilst pressurebreathing.
The experiment described in (Ihaptcr 3 had shown that wlhen an oronasal
A0L-
RAISED INTRAPULMONARY PRFSSI.VRE
mask was used during pressure breathing the maximum positive pressurewhich could be tolerated lay between 6o and 65 m11Hg. Thus an assetlnlblemloying anr oronasal mask could only be used to an altitude of 52 000 ft ifthe intrapu!monary pressure was not to be reducAd below 141 nmilg abso-lute. The acceptability of a slightly greater degree of hypoxia when anoronasal mask was used with a pressure jerkin was investigated. In the firstgroup of experiments of this series twenty subjects were exposed whilstwearing an oronasal mask and a pressure jerkin to a positive breathingpressure of 52 mniHg at a pressure altitude of 55ooo ft (an environmejItalpressure of 6o mmHg absolute) which gave an intrapulmonary pressure of121 mmHg. The hypoxia associated with this intrapulmonary pressureresulted in mental confusion in five out of the twenty subjects during an ex-posure lasting one minute, although none of the subjects exhibited any
symptoms or signs of pressure breathing syncope (Table 6-4). The results ofthe alveola" gas sampliog given in Chaptcr 5 showed that in these exposuresthe alveolar oxygen tension lay between 5( and 55 mmnHg and the alveolarcarbon dioxide tension between 18 and 22 mmHg. Thus, although thealveolar oxygen tension was considerably greater than that which was Ibundto induce syncope and confusion during pressure breathing with air, it wasaccompanied by a more profound degree of hypocapnia as compared withthat which occurred in the air breathing experiments.
A further small group of experiments were peribrmed with the oronasalmask and pressure jurkiu in which the positive breathing pressure during theexposure to a pressure altitude of 5 5 ooo ft was increased froni 52 to 6o nimHg(Table 6-8). One of the five subjects used in these experiments developed atypical syncopal attack after one minute at 55 noo ft, although none of theremaining subjects had any subjective disturbance of consciousness (Table6--). This result suggested that, whilst the increase of intrapulihonarypressure might be adequate to prevent impairment of performance due tohypoxia during an exposure lasting one minute, the increase of the positivebreathing pressure might be sufficient to induce pressure breathing syncopein the presence of this degree of hypoxia. It had been shown (Table 6-3i thatsyncope did not occur when subjects were exposed to a positive breathing
pressure of 6o mmHg at ground level. In these latter experiments, ho\wever,counterpressure was also applied to the lower limbs by means of the anti-gsuit. It was decided, therefore, that the decrease of the effective blood volumeimposed by this positive breathing pressure at high altitude should be reducedby the use ofan anti-g suit.
A more extensive group of experiments were performed in which pressurebreathing was carried out with an oronasal mask and counterpressure wasapplied by means of the pl essurc jerkin and anti-g suit. A positive breathingpressure of 6o-62 mmHg was used at a simulated altitude of 56 oo' ft ýanenvironmental pressure of' 66 mmHg absolute). Since the previous experi-ments had shown that a significant impairment of consciousness could occurduring pressure breathing at a positive pressure of 6o mmHg with a simnilardegree of hypoxia, the duration of the exposure to 56 ooo ft was reduced fromone minute to half a minute. The subsequent rate of descent to a pressure-altitude of4oooo ft was, however, kept at to ooo ft per minute. All the twenty-two subjects who underwent this exposure did so without any serious

(:ARDIOVASCUI.AR EFFE(CTS
disturbance of consciousness. The l)rforniance of each subject was assessedduring pressure breathing by neans of a tracking task. This test presented thesubject with a task which was similar to that required of a pilot carrying outinstrumcnt flyii)g (:5). Immediately after decompression to 56000 ft therewas a small but significant impairment of performance at the task (32). Thelevel of perfoirmance had, however, returned to the control level before thethirty seconds exposure to 56ooo ft was completed. This transient impairmentof performance was probably caused by the disturbances associated withthe sudden inflation of the pressure clothing and the difliculty in seeing thetask instrument owing to the formation of a mist of water vapour within thedecompression chamber. This mist formed at the instant of decompressionand cleared during the subsequent fifteen seconds. Since the performance atthe task had returned to the control level before descent was commenced itwas concluded that the hypoxia associated with all intrapulmonary pressureof 126 to 128 mmlIg absolute was within acceptable limits.
The conclsion, drawn from this group of experiments using tile mask,jerkin/anti-g suit combination were confirmed by the results of training onehundred aircrew in the use of this assembly (Table 6-48). Only one of thesesubjects developed pressure breathing syncope. The time for which thesesubjects were exposed to a pressure-altitude of 56 ooo ft was, however, rela-tively short, being only thirty seconds, although each subject was exposed topressure breathing for a total tine of two minutes. Thlw effect of prolongingthe duration of the exposure to a pressure-altitude of 56ooo ft to six minuteswas investigated by Ernsting, Green, Nagle and Wagner 1i 6o (94). Two oftheir five subjects developed symptoms and signs of syncope about two andthree-quarter minutes after the rapid decompression to 56o0o ft. All fivesubjects had previously completed a six-minute exposure to pressure breath-ing in the same equipment at ground level at a positive pressure of6o mmHgwithout any suggestion of syncope. In an attempt to determine the relativeparts played by the hypoxia and the disturbance associated with the use ofan oronasal mask in the genesis of the syncopal attacks, each subject was alsoexposed to 5600o ft for six minutes at the same intrapulnonary pressurewhilst wearing a pressure headpiece, pressure jerkin and anti-g suit. None ofthe subjects developcd any of the features of pressure breathing syncope dur-ing this latter exposure and the mean heart rates were consistently lower thanthe mean heart rates when the exposure was performed with an oronasalmask. The performance of the subjects at a tracking task was unimpairedafter the first minute of the exposure to pressure breathing with a pressureheadpiece at 56ooo ft. Furthermore, no impairment of performance wasfound in those subjects who successfully completed the full six minute expo-sure to 56ooo ft whMiLt uizng an oronasal mask.
These results showed that the hypoxia produced by pressure breathing at56000 ft with an intrapulnonary pressure of 126 mmHg absolute did notsignificantly impair perfbrmance even when tile exposure was extended tosix minutes. The occurrence of syncopal attacks during pressure breathingat the same positive pressure and absolute intrapulnonary pressure when anoronasal mask was used in place of a pressure headpiece was probably due tothe sutmuation of the effects of hypoxia with the cardiovascular disturbancesand discomforts produced by pressure breathing with an oronasal mask. This
307
RAISED INTRAPULMONARY PRESStRE
study confirmed that the length of time for which the mask, jerkin and anti-gsuit combination, using a positive pressure of6o mnwfg, would protect againsthypoxia at a pressure-altitude of 56ooo ft was limited. When the descent from56ooo ft was commenced thirty seconds after the rapid decompression andthe subsequent rate of descent to 40000 ft was ioooo ft per minute, syncopedid not occur.
These experiments demonstrated that the degree of hypoxia associatedwith an intrapulmonary pressure of 126 to 128 minHg absolute did riot causea significant impairment of performance during preIN,1 hr,''y"e w,,
oxygen at a positive pressure of 6o ninHg, provided that syncope did notoccur. Even this degree of hypoxia did, however, increase the likelihood ofsyncope when presstire breathing was combined with additional stresses, suchas the neck discomfort which occurred when an oronasal mask was used.Unless the duration of the exposure to pressure breathing urder such addi-tional stresses was severely limited the use of an intrapulmonary pressure of'126 to 128 mmHg resulted in a significant incidence of pressure breathingsyncope. The effects ofintrapulmonary pressures between 128 and 141 mmHgabsolute upon the incidence of pressure breathing syncope were not investi-gated. The extensive series of exposures of both experienced and relativelyinexperienced subjects of pressure breathing at pressures of up to Ito minHgshowed, however, that the use of an intrapulmonary pressure of the order of145 to 155 mmHg absolute prevented any increase in the incidence of syncopeover that associated with pressure breathing at ground level with an alveolaroxygen tension greater than too mml-g. When either the positive breathingpressure exceeds 6o mmHg or the time for which pressure breathing is per-formed at positive pressures above 5o mmHg exceeds one minute, the intra-pulmonary pressure should be of the order of 141 mmHg absolute if syncopeis to be avoided.Pressure Breathing at Reduced Environmental Pressure - Thepattern of the exposures to low environmental pressure used in this investiga-tion was based primarily upon the form such an exposure would take shouldthe pressure cabin of an aircraft fail during flight at high altitude. In flightsuch an exposure frequently occurs suddenly. Thus pressure breathing wasinitiated in the decompression chamber by a rapid decompression to themaximum pressure-altitude concerned. Since pressure breathing onlyprovides protection against hypoxia, the pilot of an aircraft flying at highaltitude would initiate descent immediately decompression occurred. Thusthe exposure to the maximum altitude in these experiments was relativelyshort, either half or one minute and was follewed by a descent at a controlledrate of either moooo ft or 15ooo ft per minute to below 40000 ft. The rate ofdescent used was that which could be attained by the aircraft in which theeuipmlWnt was to be used.
Abdominal pain following rapid decompression was the commonest causeof failure of a subject to complete an exposure to pressure breathing in thedecompression chamber (Table 6-9). The pain was generall) referred to theperiumbilical region or the ep'gastrium and always occurred immediatelyafter the rapid decompression. It wa, relieved very rapidly by recompressionto below a pressure-altitude of 25 000 ft. The pain arose from the effects of theexpansion of gas within the gastrointestinal tract. Whilst expansion ofgastro-
0o8
-i --.- a ..____- - sO ,. ----
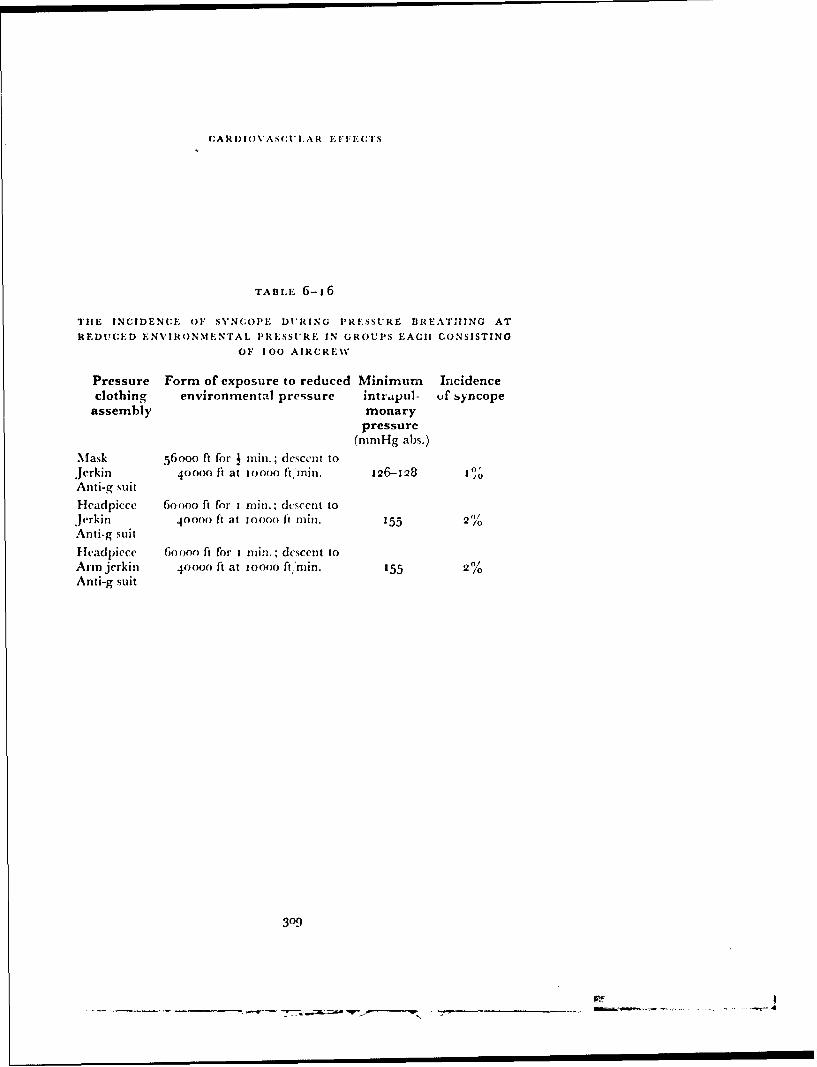
(CARDIO\VASC;tLAR EFFE;CTS
TABL.E- 6-16
TIE INCIDENCE OF SYNCOPE DURING PRESSURE BREATHING AT
REDUCED ENVIRONMENTAL. PRESSURE IN GROUPS EACH CONSISTING
OF 100 AIRCRE\V
Pressure Form of exposure to reduced Minimum Incidenceclothing environmental pressure intrapul- uf syncope
assembly monarypressure
(mmHg abs.)
Mask 56000 ft for j rain.; descent to
Jerkin 40oo0 It at ioooo ft, rinm. I 26-128 10
Anti-g suit
Headpiece 6oooo ft for I rill.; descent toJerkin 400oo ft at 0oooo it rmin. 155 2)/o
Anti-g suit
Headpiece 6oooo ft for I nuin.; descent toAnn jerkin 40000 ft at ioooo ft min. 155 2%Anti-g suit
309
__________ _________________ -WT.

RAISEID INTRAPUI•MONARY PRESSURE
intestinal gas must have occurred in all the subjects, symptoms necessitatingrapid recompression occurred only in a bout 3",, of all the rapid decompres-sions performed in the present investigation. The incidence of severe abdo-minal symptoms could have been related either to the volume of gas withinthe gastrointestinal tract before decompression or to the site in which the gasexpansion occurred, or a combination of both these fhctors. Thus, Bedell,Marshall, Du Bois and Harris t956 (31) found that thcrc were fairly largevariations in the volume of gas in the abdominal cavity in normal subjects.The occurrence of severe abdominal pain following rapid decompression was,however, most probably related to the expansion of a volume of gas trappedin a loop of gut so that there was locAl distension of the region sufficient togive rise to the sensation of pain.
The other cause of failure during pressure breathing 3t low environmentalpressure was syncope. As a result of the considerations presented in the pr,vious section of this discussion, three assemblies of pressure clothing, basedupon the pressure jerkin, were adopted for use in flight, and separate groupsof aircrew were trained in the use of these assemblies. The incidence ofsyncope during pressure breathing at low environmental pressurc is sum-marized in Table 6--16. The incidence ofsyncope in all three groups was verylow. It may be concluded, therefore, that these assemblies of pressure clothingprovide adequate protection against hypoxia within the altitude-timerelationships used in these experiments.
The results of the measurements of the heart rate and arterial pressuremade during certain of the exposures to reduct I environmental pressure areof interest. In each of these three groups of experiments the heat rate andarterial pressure responses to pressure breathing at simulated high altitudewere very similar in general form to those seen at ground level (Figs. 6-26,6-27 and 6-28). No significant difference was found between the arterialpressure changes during pressure breathing at reduced environmentalpressure and thosc produced by an exactly similar positive breathing pressure-time exposure at ground level with an alveolar oxygen tension greater than1oo mmHg. The results obtained with the mask, jerkin and anti-g suitassembly (Fig. 6-27) suggested that the arterial pressure response to apositive breathing pressure of 6o mmHg was not affected by a reduction ofthe alveolar oxygen tension from above 0oo mmHg to approximately 50mmHg. A certain degree of caution must be used, however, in acceptingthese conclusions since the arterial pressure measurements were made by anindirect method, the accuracy of which was probably of the same order as thatof the standard sphygmomanometric technique.
In contrast to the arterial pressure responses the mean heart rates wereconsistently greater during pressure breathing at simulated high altitude thanduring an exposure to a similar positive breathing pressure-time relationshipat ground level (Figs. 6-26, 6-27 and ,5-28). The heart rates during theminute before the beginning of pressure breathing were some ten beats perminute greater at reduced environmental pressure than at ground level. Theincrease of heart rate produced by the induction of pressure breathing wasalso greater at reduced environmental pressure than at ground level. Therelative tachycardia seen at reduced environmental pressure before theinduction of pressure breathing was probably due to apprehension with
310
- . - -- - - - - .
CARDIOVASC'UL.A R iEFFEC(TS
regard to the imninent rapid decompression. The subject was always a%%arethat rapid decompression would follow within one to two minutes of thereduction of the pressure within the decompression chamber to a pressure-altitude of2 5 o00 ft to 27000 ft. lThis tachycardia could not have been due tohypoxia as the alveolar oxygen tension at this time was of the order of 190mmHg and the subject always breathed ioo",, oxygen during the ascent tothis altitude. In each group of experiments this preliminary tachycardia wasassociated with a slightly higher mean arterial pressure than was obtained atground level. These cardiovascular changes were typical of those which wereproduced by nervous apprehenion. The greater increase of heart rate in-duced by pressure breathing at reduced environmental pressure was probablydue to the addition of the effects of hypoxia, hypocapnia and nervousapprehension to the cardiovascular stresses induced by this manoeuvre.
SUMMARY
These investigations of the cardiovascular effects of pressure breathing atpositive pressures of up to 13o mnmHlg showed that the rise of intrapleuralpressure produced by this nmanoeuvre was transmitted to the venous andarterial parts of the circulation. At the beginning of pressure breathing theimmediate increase of right atrial pressure prevented any venous return fromthe unpressurized regions of the limbs. Since the arterial flow into these partscontinued, blood was displaced from the central reservoirs, primarily theheart and lungs, into the capacity vessels of the limbs. The accumulation ofblood in the peripheral capacity vessels eventually rcsulted in the local venouspressure exceeding the raised right atrial pressure and the recommencemcntof[venous return to the right side of' the heart. The increase in the transinuralpressures of the capillaries in the unpressurized regions resulted in the loss ofcirculating fluid into the extra\vascular space. The peripheral displacement ofblood and the passage of fluid into tile extravascular space reduced the effec-tive blood volume. As the duration of an exposure to pressure breathing wasprolonged this reduction of the effective blood volume increased, since theloss of circulating fluid continued at approximately tile same rate for at leastfive mintutes. The reflex responses to this reduction of effective blood volumewere peripheral arteriolar and venous constriction together with tachycardia.The systemic arterial pressure was raised by an amount which varied with thedegree of the lung expansion and the magnitude of the reduction of effectiveblood volume which were induced by pressure breathing.
When the duratimo of an exposure to pressure breathing was prolongedsyncope occurred. These collapses had all the features of vasovagal syncopeand evidence was obtained which suggested that a reduction of the effectiveblood volume was the primary cause of this syncope. A number of precipi-tating factors were also fIund. These included discomfort or pain, hypocap-nia and hypoxia. There was no incidence of syncope when pressure breathingwas performed with a headpiece and trunk counterpressure, at a positivepressure of Flo inmig for two minutes. When either the positive breathi-igpressure or the duration of the exposure exceeded these values syncope beganto appear. The magnitude of the reduction of the effective blood volumeproduced by an exposure to a given positive breathing pressure and theassociated incidence of syncope were reduced by the application of counter-
31'

RAISED INTRAPUIMONARY PRESSUIRE
pressure to the surface of the limibs. Since in practice an anti-g suit would alsobe worn, it was decided that counterpressure should be applied to the lowerlimbs with this garment whenever the positive breathing pressure exceeded5o mmHg. TFile use ofcounterpressure to the trunk and lower limbs provided
adequate protection against pressure breathing syncope for exposures lastingup to three minutes at positive breathing pressures of up to 1o7 mmHg. At
positive breathing pressures above 1 1o mmHg the reduction of effectiveblood volume together with the occurrence of severe pain in the tipper armgave rise to syncope within this time and hence counterpressure must also beapplied to the upper limbs at positive breathing pressures above this level.
Detailed experimental studies showed that hypoxia increased the incidenceof syncope during pressure breathing as compared with the incidence whichoccurred during a similar exposure to pressure breathing with at) alveolaroxygen tension of the order of 0oo mmHg. The incidence of syncopal attackswas increased \s lien the alveolar oxygen tension was reduced to between 45and 50 mmHg, particularly when this hypoxia was associated with moderateor severe hypocapnia. The experimental exposure of subjects to pressurebreathing with oxygen at reduced environmental pressure showed that if theintrapulmonary pressure was greater than 145 mmHg absolute, neitherimpairment of performance nor syncope occurred due to hypoxia. When theintrapultmonary pressure was reduced to 126 mmHg absolute pressurebreathing syncope occurred after two and a half minutes when pressurebreathing was combined with the discomforts associated with the use of anoronasal mask.
Thus tile time for \which the maintenance of an intrapulmonary pressureof the order of 145 mmHg absolute will provide protection against hypoxia
at environmental pressures of less than 145 mmHg is determined by theoccurrence of syncope. Syncope in these circumstances arises because of theassociated reduction of effective lflood volume, the magnitude of whichdepends upon the positive breathing pressure and the degree of counter-pry sure applied to tile surface of the body. Respiratory considerationsdemand counterpressure to the trunk at positive breathing pressures above30 mmHg. Counterpressure to the limbs is required when the positivebreathing pressure exceeds 50 mmHg or the duration of the exposure exceedsabout five minutes. Finally, counterpressure must be applied to the upperlimbs as well as to the trunk and lower limbs when the positive breathingpressure exceeds to7 to i to mmHg.
3.. ...

CiIAPTER 7
GENERAL SUMMARY AND CONCLUSIONS
Although pressure breathing with oxygen was proposed by Gagge in 194tas a means of increasing the altitude tolerance of'man at Leights above 400o0ft the possibilities of this technique were not fully exploited until nearlyfifteen years later. During this interval pressurization of the aircraft cabin wasadopted universally as the routine md,:hod for protecting aircrew against the40000 ft. Thus the role of pressure breathing in aviation changed fi-om beingessential for flight at altitudes above 4o000 ft to an emergency procedurewhereby consciousness was maintained following failure of the aircraft pres-sure cabin. The possibility of breathing at positive pressures greater than 25
to 30 mmHg was introduced by Bazett who proposed the use of a bladder toapply counterpressure to the chest arnd suggested the use of the anti-g suit toapply counterpressure to the lower limbs. These proposals were studied exten-sively by Henry and hi., colleagues, and as has been seen, resulted eventuallyin the development of the capstan partial pressure suit. Pressure breathing withan intrapulmonary pressure of the order of 141 minlig absolute does not, how-ever, prevent the occurrence of decompression sickness. Furthermore the cap-stan partial pressure suit did not provide any protection against the effects ofexposure to low temperature. Thus, although a suitable garment will permitpressure breathing at high positive pressures for a consideriable period of time,the time for which pressure breathing may be used following loss of pressuriza-tion at high altitude is severely limited. These considerations led to the develop-ment ofthe British philosophy (225) which envisaged partial pressure garmentsas a means of providing short duration protection against hypoxia followingloss of cabin pressure at altitudes above 40 00o ft. It is especially important fiomthe practical point of view to limit the amount of special clothing to be wornby aircrew, especially pilots of interceptor aircraft. The realization of thesevere restriction of the time fbr which pressure breathing with partialpressure suits could be used led to the proposal that counterpressure shouldbe applied to as small an area of the surface of the body as was compatiblewith adequate protection aga;ist the eiffects of pressure breathing.
The aim of the work described in this thesis was to determine the degreeofcounterpressure which must be applied to the surface of the body in orderthat the physiological disturbances induced by the positive breathing pressurerequired at a given altitude were reduced to within acceptable limits. Theselimits were considered to be those which would allow (5',, or more of thenormal aircrew population to initiate and control the deso- nt of an aircraftfollowing loss of cabin pressure at high altitude. These manoeuvres require amoderate degree of skill and thus it was inferred that the pressure breathingequipment must prevent any impairment of consciousress at high altitude.Since sonic of the disturbances induced by high pressure breathing, particu-larly those in the cardiovascular system, increase with the duration of the
313
RAISED INTRAPULMONARY PRESSURE
exposure, it was considered important to define tIll time for which aircrewwould be exposed to pressure breathing following depressurization of thecabin. The time required to initiate a controlled rapid descent in the type ofaircraft for which this equipment was required was of the order of :cn tofifteen seconds. It was considered, therefore, that the partial pressure equip-ment should be designed to allow a period of tip to one minute for the initia-tion of descent. Since the aircraft concerned were capable of rates of descentconsiderably in excess of Io ooo ft, min. the estimation of the duration of theexposure to altitudes above 40000 ft were based upon this descent rate.The need for respiratory counterpressure - Previous experience ofpressure breathing with an oronasal mask without counterpressure to theremainder of the body had shown that even a positive breathing pressure of30 mmHg induced fatigue and that higher positive breathing pressures werepoorly tolerated. In early experiments in the present investigation counter-pressure was applied to the thorax by means of a bladder which was con-nected to the regulator delivery tube upstream of the pressure headpiece.Although this counterpressure reduced some of the lung distension normallyinduced by pressure breathing and reduced the conscious effort associatedwith pressure breathing at positive pressures of up to 40 mmHg it wasinadequate at higher positive pressures. It was found that this inadequacywas due to the absence of support to the abdomen and the consequent descentof the diaphragm. Although the addition of counterpressure to part of theabdomen by means of the abdominal bladder of the anti-g suit reduceddescent of the diaphragm, breathing remained difficult at positive pressuresof the order of 8o mmHg. Subsequent experiments showed that the respira-tory disturbances induced by positive breathing pressures above 4o mmHgcould only be reduced to within acceptable limits by the application ofcounterpressure to virtually the entire surface of the trunk. The bladdergarment which was developed for this purpose, the pressure jerkin, becamethe basic component of all the partial pressure assemblies subsequently intro-duced into the Royal Air Force.Respiratory disturbances induced by pressure breathing - Althoughthe pressure jerkin applied counterpressure to the whole surface of the trunk,pressure breathing with this garment produced certain disturbarces of
respiration. The increase in the functional residual capacity caused by pres-sure breathing was limited to about 50o ml at a positive pressure of8o mml-lgand at this breathing pressure the total lung capacity was only increased by400 ml. A significant firaction of this increase of lung volume was due to areduction in the volume of blood contained within the trunk. Pressurebreathing with this degree of respiratory colnterpressure caused an increase
of pulmonary ventilation which was associated with alveolar hyperventilationand hypocapnia. The intensity of the hypocapnia varied with the ragnitudeof the positive breathing pressure and the duration of the expos,,re. Thealveolar carbon dioxide tensi.n did not, Lowever, fall below 30 mmH'g evenat a positive breathing pressure of 8o niniIg at ground level. This degree ofhypocapnia would not be expected to cause any significant impairment ofperformance and subsequent experiments showed that it did not affect the
cardiovascular responses to high positive breathing pressures. Studies of thecompliance of the lungs, of the resistance of the airways and of the work
31.4
. .......... _______________

SUMMARY AND CONCLUSIONS
performed upon the lungs demonstrated that there were miniimal changes inthe mechanics of respiration when trunk counterpressure was applied bymeans of the pressure jerkin during pressure breathing.
Detailed investigations of the gaseous exchange between the alveolar gasand the pulmonary capillary blood showed that during pressure breathingwith trunk counterpreissure tihe alveolar dead space was increased. Since therewas no significant increase in the u,.venness of the distribution of inspiredgas within the lungs this increase of alveolar dead space was probably due toa disturbance of the distribution of the pulmonary capillary blood flow. Itwas found that the decrease of the apparent diffusing capacity produced bypressure breathing was due to a reduction of the pulmonary capillary bloodvolume. Both these changes were probably the result of the displacement ofblood from within the thorax which was produced by pressure breathing.These changes did not, however, produce a detectable impairment of theoverall function of the lung since the alveolar-arterial oxygen tension gradientduring pressure breathing at a pressure-altitude of 5500o ft was withinnormal limits. The failure to demonstrate any significant change in tile overalltransfer of oxygen fr'om the alveolar gas to the pulmonary capillary blood wasprobably due to tilhe studies being performed in otherwise resting subjects. Itis probable that the marked reduction of the pulmonary capillary bloodvolume produced by a positive breathing pressure of 8o mit lg would resultin a detectable impairment of pulmonary gas exchange in an exercisingsubject. Thus extensive investigations should be perfbrmed before a pressurebreathing system which has been shown to maintain adequate oxygenationin the resting subject is approved for use under conditions in which the subjectperforms vigorous muscular exercise.Disturbances in the neck and head - Although the use of a pressureheadpiece reduced the disturbance induced in the head and neck by pressurebreathing, such equipment has obvious shortcomings in practical aviation.The limitations to the usc of an oronasal'mask for the delivery of positivepressures to the respiratory tract were found to be related primarily to theconsequent distension of tile mouth and pharynx. This distension gave rise todiscomfort which, at positive breathing pressures above 65 mmltg, becamefilank pain. This experimental study showed that when an oronasal mask wasused the maximunm acceptable positive pressure was of the ord,_r of"65 mmHg.Even at this pressure, there was some evidence that the use of an oronasalmask in place of a pressure headpiece increased the incidence of syncopalattacks when the duration of the exposure was prolonged beyond threeminutes. The absence of support to the floor of the mouth and neck dur-ing pressure breathing with an oronasal mask induced a large increase inthe volume of the respiratory dead space. The increase of pulmonary ventila-tion produced by pressure breathing in these conditions, however, more thancompensated for the increase of dead space and hypocapnia resulted. Duringpressure breathing v ground level there wa; usually no rise of pressure in themiddle ear. Pressure breathing following a sudden decompression to highaltitude, however, produced a considerable rise of middle ear pressure whichresulted in an easily detectable, but acceptable, reduction of auditory acuity.The vessels of the conjunctivae, which are only poorly supported, weredilated by positive breathing pressures of the order of 6o mnrumlg although
315
a - ----- m a-sn,. I - I.-

RAISED INTRAPU'LMONARY PRESSURE
actual rupture of a conjunctival vessel occurred only very rarely. Capillaryrupture occurred, however, in the skin of the external auditory meatus atpositive breathing pressures of the order of 8o to oo mtimil Ig.
The R.A.F. type of partial pressure headpiece used in this study did notcause a rise of pressure in the external auditory meatus. Although the tuse ofan oronasal mask to deliver oxygen under pressure to the respiratory tractinduced certain disturbances, it was concluded that these were withinacceptable limits at positive pressures of up to 65 imnHg provided that theduration of the exposure was limited to four minutes. Subsequent experiencegained in the training of 5o0 aircrew in the use of a pressure breathingassembly employing an oronasal mask to deliver positive pressures of up to 65mmHg confirmed that the use of an oronasal mask under these circumstanceswas acceptable to over 97",, of the sulljects (Aikman, personal communica-tion). \\ hen positive breathing pressures above 65 minHg are required, someform of pressure headpiece \ hich provides stipport to the greater part of theface and neck must be employed.Cardiovascular distt.'bances - Measurements of the prcssure in the rightatrium showed that when pressure breathing was commenced there was animmediate i.,c of central venous pressure. The venous return firom the un-pressurized regions of the body, in particular the limbs, ceased until sufficientblood had accumulated in the capacity vessels of these parts to raise the localvenous pressure above the central venous pressure. Thus at the beginning ofpressure breathing blood was displaced from within the thorax into the limbs.Circulating fluid was also lost into the cxtravascular spaces of these regionsbecause of the increase in the capillary transinural pressure associated withthe general rise of intravascular pressure. Thus pressure breadting, particu-larly when trunk counterpressure is employed, directly affects the effectivecirculatory blood volume and is a nmanoeuvre by which tie effects of changesin the distribution of the blood volume within the body may be studied. Thereduction in the effcetive presstre in tile right atrium produced by pressurebreathing was associated with a fall in the cardiac output although the heartrate was increased. When no counterpressure was applied to the limbs therewas a fall in the effective systemic arterial pressure. 'I he reduction of theeffective blood volume was associated with reflex peripheral arteriolar andvenous constriction.
As the positive breathing pressure was raised above 50 tnllg the factorwhich determined the maximum duration of' a given exposure to pressturebreathing with a pressure headpiece and trunk counterpressure was theincidence of syncope. The pressure b)reathing collapses had all the features of'classical vasovagal syncope. The magnitude of the displacement of' blood andof the loss of circulating fluid in the limlbs was measured and was found to liebetween 7oo and 9oo nil at the point at which syncope occurred in trainedsubjects. This reduction of' effective blood voluime was similar to that re-quired to induce vasovagal syncope during a simple venesection. It was con-
cluded that pressure breathing syncore was due primarily to a reduction ofthe effcctive blood volume. It was found that the occurrence of severe dis-comfort or pain during pressure breathing predisposed to syncope. Severehypoxia or severe hypocapnia also rendered a subject more liable to syncopeduring pressture breathing.
:j16

SU'MMARY AND C:ONCLUtSIONS
Reduction of the peripheral displa-cilent of circuilating flulid normallyproduced by pressure breathing was shonwn to deccrease tile( incidevnce ofsyncope and to increase the time for which a stil)ject conlld b~e exposed to atgiven positive brecatmi ng pircissure without the occurrence of a col lapsec. Sincein practice the ai rcrew for wýhom this eq uipnwnct w%-is intended wýould wearanti-g suits, it was p055i1)e to apply couinterp~resslmre to the( greater part of' thesurface of thie lower limbhs dur-ing pressure breathing without adoi ng at fnrt hergarment to the clothing which was requiredl. Ihus the coiniterpr-sstireapplied to the h~ody during precssure breathing at positive pressures ab~ove 30o
nimf-g was extended to include most of the lower limibs as well as; tie trunk.It was important, hiowever, to retain fireedomn of' movement of the uppel~rlimbs during pressure breathing, but all the available methiods of' apf)lv]ingcounterjpressurc to these region, produced some restriction of mobility. It wasfound that the limit to the positive breathing p)ressure which could be tolera-ted with counterpressure appJlied to Othe head, trunk and lower lirnbý, wa-isdetermined by the occurence of dliscomfort and pain in the uipper arml.Thus at positive pressures al)ove 8o nmm! g some suilljects had pain inthe upper armns and( at positive breathing pr'ssmmres above i to mnunlg therewas a high incidence of severe pain. In certain stil)ijects armn pain was associ-ated withI syncope~ during ipresstire breat lung and at positive pressures abovetao mninT-g pain from this region uas a comnmon cause of' collap~se. T[hemaximum positive b)reathing pr-essure wliich could b~e employed flor anlexposure lasting three minuttes wit houtt a ,ignificant incidlence of' collap~sedue to the ab~sence of couinterpressure to thle upper limblls Was 107 Mnfig.The application of couniterpressure to the tUl)I)ci- armn andl forearmn preventedpain in this region. 'l'luits at piositive br-eathing PreIT',11es gr-eater- than" io
mill Hg uipper litmb con tvim erlessurei was iieocessa iv in add (it ion to coliitrpresssmr' to the trutnk and lower limbs.Hypoxia. and pressure breathing - Since the incidence of vas;r'vgalSyncope mndl uced by conugestion of' thie lower. limbhs had becen shlown to lxeincrease'd by hop~oxi 5. it appeared probable that hyp~oxia would increasethe incidence of syn cope during pressure brecathing. It was found that withpressure breath~ing at pre'ssures Of 50 to 601io 111 m ill(th illicdllece' of'sYncopewas increased if the alveolar oxygenl tension w-as bel]ow 55 nimig hut not ifthe( Oxygen tension was greater thanl 55j 11i111g. Furthermor-e, ab~ove thiscritical valuec there was no detectable impairment of pci forniance. Measure-ments of the( gas, tensions in the alveolar gas and arterial blood showed thatanl absolute ititrapilrmoioarv pressure Of 141 niniFig Inaimuta tied anl alveolaroxygen tension of 6o to 70) mninHg dunring 1)rt'sstirt breathing with oxygen ataltitudes al"ove 400000 ft. It was decided, therefore. that the intitrapitalmon arvpre'ssure during pressutre breathing withi assemblies incorporating a pressureheadpiece should not b~e less than 141 innifg ab!;oliite at altitudes ab~ove40000 ft. Thus since the maximium positive br-eathing pressure which wasfound to be acceptable when no coutitlerpressure was, applied to the uipperJiinl) was 107 nin~g the maximumin altitude to whichi the c onibinatioti of'pressure headlpiece, pressure jerkin and anti-g suit could he used w\as 70000 ft(environmental pressuire at 70000 ft is 34 mmnifg pi~s a breathing pressure of107 ninlf-Ig provides an intrapulnionary pressure Of 141 inifig al)\oltmte),In practice thie oxygen regulators dev:eloped for use with this assembly
317
- '% - *--. - ----- -~ --------- ~ -- 4
RAISED INTAPI'IMONARY PRESStREI
provided an intrapuhnonary pre~sure of 155 mtnllg absolute, so that tilemaximum altitude to which it could be used was reduced to 66 ooo ft.
The use of an intrapulmonary pressure of 141 nmllg absolute w;th anassembly based upon an oronasal mask would limit the maximum altitudeto which this combination could be used to 53 000 ft (environmental pressureat 53 000 ft is 76 mmttg plus a breathing pressure of 65 mmHg providing anintrapulmonary pressure of 141 mmHg absolute). Since there was a welldefined practical need for such an assembly to provide short durationprotection against txposure to altitudes of up to 56 ooo ft (environmentalpressure - 66 mmHg) the influence of a slight degree of hypoxia upon theresponses to pressure breathing was investigated. Provided that the totalduration of the exposure to pressure breathing was limited to two minutesand that counterpressure was applied to the lower limbs as well as to thetrunk, there was no impairment of perlbrmance when the intrapulmonarypressure was reduced to 126 mmlHg absolute. This lower limb counterpressurewas essential since it was found that the disturbances produced by the use ofan oronasal mask at a positive breathing pressure of 6o mmHg induced syn-cope wvhcn a mild degree of hypoxia was induced in the absence of counter-pressure to the lower limbs. An assembly consisting of an oronasal mask,pressure jerkin and anti-g suit was shown to provide adequate protectionagainst hypoxia at altitudes of up to 56ooo ft provided that descent wascommenced within half a minute of the beginning of the exposure and thatan altitude of4oooo ft was reached within a further one and a half minutes.Concept of minimal counterpressure - As was demonstrated by Hal-dane in m q'33, the hypoxia which ensues on exposure to altitudes greater than400o0 ft even when oxygen is br-'athed, can be prevented without anyphysiological disturbance by enveloping the entire individual within a gas-tight suit which is inflated with oxygen to an absolute pressure of at least 141mmllHg. The experimental studies described in this thesis showed that thehigh positive breathing pressures required to prevent hypoxia at altitudesbetween 5oo(oo and 7oo0o ft are well tolerated over a period of severalminutes even when counterpressure is applied to only a portion of the surfaceof the body. ThIe minimum degree of body counterpressure which was foundacceptable in relation to the time for which the subject was exposed to alti-tudes above 40ooo ft was that providledI by the pressure jerkin and anti-g suit.The three assemblies which have been introduced into the Royal Air Forcehave been based upon this combination of pressure garments (Table 7-1).No decomopression sickness other than an occasional mild bend was experi-enced by the subjects who were exposed to pressure breathing at simulatedaltitudes of between 50000 ft and iooooo ft even when no preliminarybreathing of oxygen was performed. Two of the subjects used most firequentlyin these investigations were, in fact, coniderably more susceptible to decom-pression sickness than the great nuiaority of aircrew. Neither of these subjectsexperienced any serious decompression sickness during short duration ex-posures to high altitude, aithough both developed severe bends after a tenminute exposure to a pressure altitude of 37000 ft. These observations lendstrong support to the hypothesis that the incidence of serious decompressionsickness during and following an exposure to an altitude greater than '3()(,() ftis negligible provided that the duration of the exposure is less than ten minute';.
318
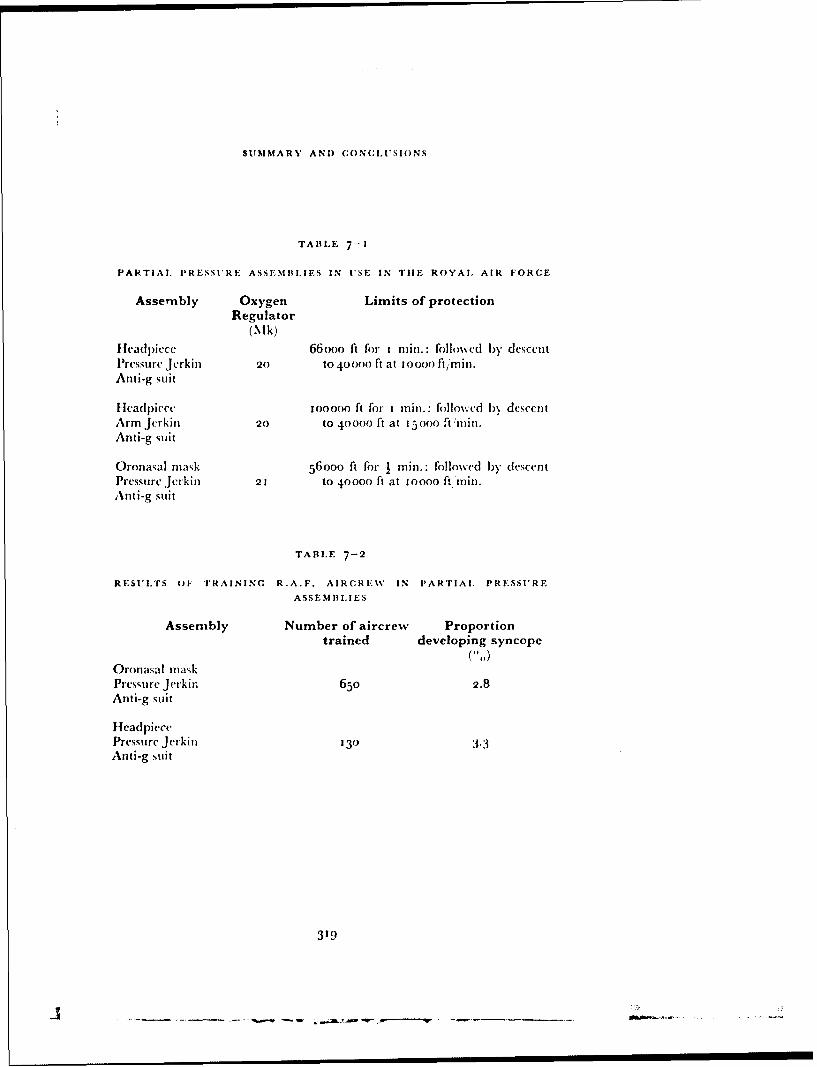
SUMMARY AND CONCLt'SIONS
TABLE 7-I
PARTIAL. PRESSI*tRE ASSEMIILIES IN USE IN TIlE ROYAL AIR FORCE
Assembly Oxygen Limits of protectionRegulator
(Mk)fHea(lpicce 66ooo ft for rinmm.: foilowcd by descentPressure Jerkiii 20 to 40400 ft at 0ooo0 ftinin.Anti-g suit
Hea(l)iece 1ooooo ft for rinii.: followed 1)\ descentArm Jerkiii 20 to 40000 ft at 1500 ftimi.Anti-g suit
Oronasal mask 56ooo ft for I mini.: followed by descentPressure Jerkin 21 to 40000 ft at Ioooo ft Thin.Anti-g suit
TABLE 7-2
RESULTS (OF TRAINING R.A.F. AIRCREWV IN PARTIAl, PRESSURE
ASSEMBIIES
Assembly Number of aircrew Proportiontrained developing syncope( I)
Oronasal maskPressure Jerkin 65o 2.8Anti-g suit
HeadpiecePressure Jerkin 130 3.3Anti-g suit
319
-,- - .ais - -:
RAISED INTRAPI'LMONARY PRESSURE
Although from the point of view of practical aviation the advantages ofreducing the area of the sturface of the body covered by pressure clothing tothe smallest possible value arc considerable, the application of the conceptof minimunm counterpressure must introduce a degree of uncertainty withregard to the protection afforded against the cffects of' exposure to highaltitude. The values of the heart rate recorded during the exposure of sub-jects to reduced environmental pressures in the decompression chambersuggested that pressure breathing at high altitude using various counter-pressure assemblies places a certain degree of stress upon the cardiovascularsystem. In these exposures to high altitude the cffective blood volume wasdecreased I)y 300 to 400 ml and this disturbance would be expected to leadto vasovagal fainting in a small proportion of subjects. Indeed, five cases ofsyncope occurred during the exposure of 3oo aircrew to pressure breathing atsimulated altitudes of either 56ooo ft or 6oooo ft (Table 6-16). Subsequentexperience in the training of larger numbers of aircrew (Aikman, personalcommunication), the results of which are presented in Table 7-2, hasconfirmed that the ii-:idence of syncope during such exposures is very low. Itis impossible, however, to infer with certainty the effects of the circumstancessurrounding an actual loss of cabin pressure during flight at high altitudeupon the physiological responses to high pressure breathing. Such a decom-pression generally occurs without any preliminary warning and thus may wellproduce the mental and physiological disturbances associated with anysudden physical event.
The magnitude of these changes will be influenced greatly by the previousexperience of the pilot and they will vary from surprise followed by theappropriate corrective procedure, to panic and perhaps loss of control of theaircraft. This situation is in distinct contrast to that which pertained in theexperiments performed in the decompression chamber where the subject wasalways aware of when the dc ompression would occur. Furthermore the pilotof an aircraft will have to retain control and initiate descent during the periodimmediately following a decompression. In the decompression chamber,however, there was no such sense of urgency and in many experiments thesubject had no specific task to perform following the decompression. In thedecompression chamber experiments many of the subjects had a moderatetachvcardia immediately before the decompression whilst some of themexhibited overt apprehension. These emotional disturbances probably accen-tuated the hyperventilation normally seen during pressure breathing and mayhave been a factor contributing to tile incidence of syncope. In many subjectsthe sudden emergency arising during flight will probably produce a rise ofcardiac output, a rise of arterial pressure and splanchnic vasoconstrictiom.These cardiovascular reactions will tend to reinforce the normal reactions topressure breathing and hence to oppose the effects of the reduction of effectiveblood volume which is produced by this manoeuvre. The likelihood of syn-cope occurring during and following a rapid decompression during flight isvery low provided that a rapid descent is initiated immediately, especially asin practice those aircrewv who are particularly susceptible to pressure breath-ing syncope will have been excluded during training.Limits of Partial Pressure Suits - This investigation has demonstrated,therefore, that pressure breathing with oxygen has a definite place in the
320
AOU

SUMMARY AND CONCLUSIONS
prevention of hypoxia following loss of cabin pressure at altitudes greaterthan 40ooo ft. It is possible by this manoeuvre to prevent any serious impair-Blent of consCiousness at altitudes of up to 1ooooo ft. The cardiovasculardisturbances which ensue when pressure breathing is performed at the highpositive pres:iures necessary to prevent hypoxia with counterpressure appliedto only part of the surface of the body imposes, however, a definite limit uponthe time for which this procedure can be used. Furthermore, the absolutepressure which can be maintained in the body by this type of equipment issuch that decompression sickness will occur if the exposure to high altitudeis prolonged. The only satisfactory solution to the problem of providing pro-tection against the effects of prolonged exposure to high altitude following lossof cabin pressurization is the full pressure suit.
321
- .- -. - - .. '- - - - -- - - - * - -
RE F. HE EN (CES
i. ABRHAMSON, 1). 1. and] FERRIS, E. B3. "Responses of b~lood vessels in theresting hand anid forearm to various stimuli.'' Amler. Heart J., ig,541-53, 1q,40.-
2. AcoSTONI, E. "D~iaphiragm activity and thoraco-abdominal mechanicsduring positive pressure lbreathing.' j. appi. Phvsiol., 17, 215-2o, 1962.
3. AGOSTONI, E. anid RAYIN, H. "Abdorninal and] thoracic pressures atdifferent lung volumecs.''j. app!. Physiol., 15, I 087-9ý2, qioo.
4. A(;oSTONI, E., -SNT'ANmnROcrO, C., D)EL POR'rLLttO-C ARRASCO, H."Electromyography of the diaphragm in man anid transdiaphragmaticpressure.''j. app!. lPhysiol., 15, 1091-97, 1()C)(.
5, ANDER~SON, 1). P., ADEN~, W. J., BARCRi~:Ror, It., Emitoi~m, 0. G., andMANNINCG, . W. "Circulatory cha-nges during fainting arid colna.caused by oxygen lack." J. Phvsiol., io.j, 42 19416.
6i. Ami't1oRv, G. HT. and( MARIL.si.stJt., It. ''Pulmonary diffusing capacity. acomparison of' breath-holding anid steady state methods using carbonmionoxidle.''J. clin. I nvest., .40, I775--84, io6i.
7. ARmsTrRoNG, 1H. G. "l'rineipies and] practice of aviation medicine." 1sted. Baltimore, Williams anid Wilkins, ioý3.
8. ARMSTRONC;J, A.,IFRYER. 1). 1., -SrTEWA~RT, W. K., anid 'Inirrimm1Axt,
H. E.. ''Interpretation of' injuries in the Comzet aircraft disasters.''Lancet, 1 1135-144 '9355-
9. ASstUSSEN, E. "The distribution of blood between the lower extremitiesanid thre rest of the body.'" Acta. phvsiol. scarid., 5, 31-38, 1913.
1o. ASMtSSEN, E. and] NtIsELSE. M. "Phytsiological dead space anid alveolargas pressures at rest anid during muscuilar exercise."' Acta. phy ,siol.scand., :38, 1-21, 195-6.
itj. ASTrIT, P. "'A simple electrometric technique for the determination ofthe carbon dioxide tension in blood( and plasmna, total content of carbondioxide in plasmia. and b~icarb~onate content in 'separate' plasmia at a fixedcarb~on dioxide tension." Scand. j. clin. & lab. Inrvest., 8, 3334 1957.
G. W\., HESS, ýM. E., anid Wriss, A. J. "Respirator., and circulatoryrefle'xes f'y-ro the perfused heart anid palmonary circulation of th(e dog."Amner. j. Physiol., 16,r, 261-77, 1951.
13. BADGER.IJ, 1j EHNrlNG.j.. and Rox-mscit, H. L. "TIhe pressure jel kin."F.P.R.C. Report No. 948. London, Air Ministry, 1956.
i14. BA-NsxxlsrR, R. G., CUNNINGHAMS~. 1). J. C., anid D~OUGLAS, C. G. "Thecarbon dioxide stimulus to breathing in severe exercise.'' J. Physiol.,125, y -If 17, 1954.
i.BAR-WCt, A. L. ''Recent advances ill inhalation therapy in the tr-eatmlent ofcardiac anid respiratory (Iisf'as'.- N.Y'. St. J. Med., r37, 1095-1 1to, 197
i16. BARAI.uIt, A. L., LLKm..N, M., EK1N.I., (tNS11t-iz, E., anid Ri-%sFs~,,C . C. "Studies on) positive w'st.re-piration. III. 'The effect ofconitinuousý pressure breathlung onl arterial blo~od gnaws at high altituode.''
j.Aviat. M.ed., 1 8,t :3O -48, 19 17
323
RAISED INTRAPULMONARY PRESSURF
17. BARACIi, A. L., ECKMIAN, 1M., GINSBURG, E., RuMSEY, C. C., KoRR, I.,ECKMAN, I., and BEssoN, G. "Studies on positive pressure respiration.I. General aspects and types of pressure breathing. II. Effects onrespiration and circulation at sea level." J. Aviat. Med., 17, 29c'-320,
1946.18. BARACI1, A. L., FENN, W. 0., FERRIS, E. B., and ScImnxr, C. F. "The
physiology of pressure breathing."J. Aviat. Med., i8, 73-87, 1947.19. BARACII, A. L, MARTIN, J., and ECKMAN, "J. "Poditive pressure respira-
tion and its application to the treatment of acute pulmonary oýdema."An. intern. Med., 12, 754-95, 1938.
20. BARCROFT, H. and D)OPNIIORST, A. C. "The blood flow through thehuman calf during rhythmic exercise." J. Physiol., 1o9, 402-1 1, 1949.
21. BAItCR•FT, H. and EDIIOLNI, 0. G. "The effect of temperature on bloodflow and deep temperature in the human forearm." J. Physiol., 102,
5-20, 1943.22. BARCROFT, H. and EmIoLMi, 0. G. "On the vasodilatation in human
skeletal muscles during post-haemorrhagic fainting." J. Physiol., 104,161-75, 1945.
23. BARCROFT, H., Emioi.\t, 0. G., M(:,MICHAEt., J., and STIARPLY-SCuAFER,
E. P. "Post-haemorrhagic tainting - Study by cardiac output and fore-arm flow." Lancet, 1, 489-9o, 1944.
24. BARCROFTr, J. "Features in the architecture of physiological function."Cambridge, University Press, 1938.
25. BAkC:ROFr, J., DOUGLAS, C. G., KENDEL, I,. P., and ,MARGARTA, R."Muscular exercise at low barometric pressures." Arch. Sci. kiol.Napol i, 16, 6o9 -15, 1931-
26. BATES, I). V., FOWiER, W. S., FORSTER, R. E., and VAN LINGEN, B."Uniformity of alveolar ventilation at different lung volumes." J. appl.Physiol., 6, 598-602, 1954.
27. BATES, 1). V. and PEARCE, J. F. "The pulmonary diffusing capacity;a comparison of methods of measurement and a study of the effect ofbody position." J. Physiol., 132, 232-8, 1956.
28. BAYI.Iss, L. E. and ROBER'rSON, G. WV. "The visco-elastic properties ofthe lungs." Quart.j.. exp. Physiol., 29, 27--47, 1939.
29. BAZETT, H. C., CoTTON, F. S., LAPLACE, L. B., and ScorT, J. C. "Thecalculation of cardiac output and effective peripheral resistance fromblood pressure measurements with an appendix on the size of the aortain man." Amer. J. Physiol., 113, 312-34, 1935.
'3o. BAZErr, H. C. and MACDOUGALL, G. R. "Pressure breathing and alti-rde -- practical methods for its use." Report to the Associate Committeeon Aviation Medicine Research of the N.R.C. of Canada, 1942.
31. BEDEL., G. N., MARSHAi., R., I)u Bois, A. B. and HARRIS, J. H."Measurement of the volume of gas in the gastro-intestinal tract.Values in normal st.*jects and ambulatory patients." J. clin. Invest. 35,
3 3 G--4 5 , 1956.
32. BENSON, A. J., ERNSTING, .j., and PARRY, I). J. "The pressure breathingmask, pressure jerkin and anti-g suit combination." F.P.R.C. ReportNo. 1120, L.ondon, Air Ministry, 1957.
33. BENZlIN6ER, T. "Physiological principles in the construction and
324
R E F RE NR(. .E S
operation of stratospliherc aircraft." l)tzch. Akad. Iuftfahrtfoirschung.,7, 2 9-45, 1943.
34.. lByR-", P. '".a pression barometrique." Parik, G. Masson, 1878.35. BII.l.IN(l.A ',I,J.,JACKSON, K. F., and i\MWBSTER, MI. E. 1). "Measurement
of performiancc decrement in the heat." FP.R.C. Memo 77. London,Air Ministry, 19 5b.
36. BiAvrAI, G. "Respiratory dead space measurements in a model lungand healthy human subjects according to the single breath method."J. appl. PhYsiol., 14, 517-20, 1959.
37. BLAIR, 1). A., Gt.ov'E1, W. E., and KiNm, B. S. L. "The effect of con-tinuous positive and negative pressure bireathing upon the resi:itanceand capacity blood vessets of the human forearm and hand." Clin. Sci.,t8, 9--16, 1959.
38. Bt.OOMFIEim, R. A., L,,1,•, H. D., COtRNAND, A., B;,.nEr, E. S., andRu:ICHARDS, I). W. "Recording of right heart pressures in normal subjectsand in patients with chronic pulnonary disease and various types ofcardio-circulatorv disease." J. clin. Invest., 63q--6 4 , 1946.
39. Bo.DURANr, S., HICKAM, J. B., and Isi.EV,', J. K. "Pulmonary and circu-latory effects of acute pulmonary vascular (engorgement in normalsubjects." J. clin. Invest. 36, 59--66, 1957.
40. Boo'riim, V. \I. "Alveolar oxygen and carbon dioxide pressures andalveolar ratios at various altitudes while breathing air." In Bronk. I). B.,Handbook of Respiratory Data in Aviation. Committee or- AviationMedicine. National Research Council, Wadhington, D).C., 1944.
41. Boori-w, W. M, and lovE'Lim,:E, \W. R. "Oxygcn i:;, A..iation. Thenecessity for the use of oxygen and a practical apparatu, fbr its adniini-stration to both pilots and pa:;scigcrs.'J. Aviat. Med., o, 172-98, 1938,
42. BOYCOTT, A. E. and HALA.NF., J. S. "T'he effects of low atmosphericpressures on respiration." J. Physil., 37, 355--407, 1918.
43. BRAt'NWAT.D, E., BLoorwEtL, R. D., (;oi.r~mRo, L. I., and MoRRowV,A. G. "Studies on digitalis: IV. Observations in man on the effects ofdigitalis preparations on the contractility of the ,' m-faihing heart andon total vascular resistance."J. clin. Invest., 4o, 52-59, 196i.
44. BRE-wIN, E. G., Goui.n, R. P., NASItAr, F. S., and NM:I., E. "An investi-gation of problems of acid-base equilibria in hypothermia." Guy'sHosp. Rep., 1o4, 177-214, 1q955.
45. B.IDGEN, W'., HOWARTI!, S., and SItARPEY-ScIIAni"R, E. P. "Posturalchanges in the peripheral blood flow of normal subjects wxith observa-tions on vasovagal fainting reactions as a result of tilting, the lordoticposture, pregnancy and spinal anaesthesia." Clin, Sci., (, 79-yq, 1950.
46. BRISCoK, WV. A. "A method for dealing with data conrerning unevenventilation of the hng and its effects on blood gas transfer." J. appl.Phvsiol., 14, 291-8, 1959.
47. BISCoCE, W. A. a,-i COURNAN., A. "I'neven ventilation of normal anddiseased lungs studied by an open circuit nicthod."J. appl. Physiol., 14,284--9, 1959.
48. BRISC:, W. A. and Du" Bo•rs, A. B. "The relationship bctween airwayresistance, airway conductance anrd lung volume in subjects ofdifferentage and body size." J. clin. Invest.,37, 12•7 -85, 1ý8.
325
-AL.
RAISED) INTRAPULNMONARY PRESSURE
49. BiRONK, 1). WN. and SrTELLA.,, G. "Afferent impulses ill thle carotid sinusneve 1. ~The relationship of the discharge f-rom single cud organs toarterial blood pressure." J. cell. comp. Physiol., 1, 113- 30, 1932-
50. BURCII, B. I-f., KF-wPiij. P., VAIL, B. C., FRYE, S. A., and HrIT(ItCO(K,F. A. "Someceffects of explosive decomipression and subsequent exposure
to 30 ninf-g upon the hecarts of dogs." J. Aviat. Med., 23, I 59-67,1952.
51. BuYTENDIJK, 11. J. ''Oesophiagusduk en longelasticiteit." Gronigingen:Oppenhecim, 1Q419.
52. CAD1GANJ B., MARKS, A., Ei.u.col-rT, MI. F.,JONES, R. H., and GAENS-LiR, E. A. "Ani analysis of factors affecting the measurement of pul-monary diffuising capacity by the single breath niethod."J. dlin. Invest.,40, 1495--514, 1961.
53. CAIN, C. C.. and MAHO1NEY, 1). 1. 'I'Tht effect of high pressure breathingon cardiac output with and without counterpressure." J. Aviat. Med.,24, 308--21, 1953.
54. CAti'nBtur, E. J. MI. "The respiratory muscles and thle mechanics of'breathing." London, Llioyd L.uke, 1958-
55. CAP~. E. J. MI. and GRE.EN, J. 11. "The expiratory function of' theabdominal muscles in man. An elect romyographic sttudy." J. 1Physiol.,120, 409h1 8 , 1953a.
56. CASIPBEI.., E. ~JAL, and GREEN, J. H. "The variations in pressure andtime activity of' the abdominal muscles during breathing, a study inlMan." Ph\ySiol, 122, 282-90. (19 5 3 b).
57. CAPEL E. J. MI. anid (;REF.,J. H. "The behaviour of the abdominalmuscles and intra-abdomninai precssure duiring quiet brecathing aridincrea.;e-d pulmonary ventilation. a suyin manl.'' J. Physiol., 127,
423-6, 1955-58. CAti'nwi.i.t, E. J. MI., W\ESTLA.-KE, E, K., and CIIERNIACK, R. M. '"Simple
methods of estimating the oxygen consumption and efficiency of' themuscles of breathing." J. appl. PhYsiol., 1', 303--8, 1957.
59). CHADWICK, L. F., FENN, WN. 0., Oris, A. B., and RAWNt, H. "Theliphysiology of pressure breathing." Report NO. 249. C~ommnittee oilAviation M ed icin e. National Rese~arch Council, Washington, D).C.,1943.
00. CIIERNIACK, R. MI., FARIiI, L.. E., ARMSTRONG. B. WN., and PROUr"OR,
1). V. "A comparison of oesophageal and intrapleui-al pres;sures in mail."
6:. Cm1RisTrANSEN, J.' GIAo C s, C. G. and HAsiLDsAN, .. S. "The -IbsorpItionl
and dissociation of carbon dioxide by humnan blood." J. Phy1siol., 48,244-71, 1914.
62. CHRISTIE. R. V. and NIEAKINS, j1. C. "The intrapleural pressureil- incongestive heart failure and its clinical significance." J. cliii. Invest., 13,
323-45,1~934-6,j. CLARK, J. H. "'The elasticity of veins." Amier. J. Physiol., 1o5, 418-27,
11)33-64. Coitrs, 1). R., Kim), B. S. L. and P~A TERSON, G. C. "Thle reactions of
thle blood vcssel- of the huiman calf to increase in transmural pressure.''J. Ph-,siol., V'14, 665 -74, 1()5f.
326
Ri I. . IEt N R I E C s
65. OI.Ilt;Y, 1. 1. '"I)iscussion oil o inrreI topics iii naval aviation mcdi-CHin,." Proc. iR. Soc. M'd., 52, 410 -3, I39.o.
66. COOPiER, K. E'., L'mtit.!,l, 0. (;. an(d N•r() TTA.t, R. F. "The partition ofthe1 blood flow blutw•en skin and nluscle into tle human forearm." .Physiol., 123, 33-3.1i, I954.
67. CooP.:R, K. E. and Ki-ER~sL.AKE;, 1). McK. -'An electrical volume re-corder for use with plhthysmographs." J. Physiol., 1 14, i-2P, 1951.
68. Coi.:s, J. E. "The effects o'variability in gas analysis oi, it pioducibilityof the pulmonary diffiising capacity by the single breath method."Thorax, 18, 151-4, 1q63.
6(. Coris, J. E., S.N•I:\, 1). P., and SIIEPARD, R. 1I. "The effect of negativeintra-alveolar pressure on pulmonary diffusing capacity." J. appl.lPhVsiol., 15, 372-6, io6o.
70. l)AiL, I. mi.: B., IUDANY, G., To01, A., and V'lE kM -, E. B. "Sensoryreceptors in the pullneIler)y vacular bed." Qua rt. J. exp. Physiol. 27,123-46, 1937.
71. D)ARLItNG, R. C., COURN-.ND, A., and Rici\itims, 1). \V. "Studies on theintrapuhlnonary inixing of' gaws. V. Forms of' inadequate ventilationin Inormal all (l'111)hys('matous hlngs analysed by means of breathingpure o.ell'... olin. TInVeSt., 2:3, 55 (7. 19414.
72. 1A).&ViS, R. G. "]BreaCthing in irrespiralhle atmosphre.''" London, (G. Gib..b)olls, l.46.
73. l)l(:Ks.N, E. E. I)., NMCGIBBO)J. E. G., HARVEY, NV., and Tu1RNFR, W'.
*''An in\vesle~ation ilnto the inc(idence of acute otitic barotrauima asdisability an Iongxt I oo0 aircrew cadtlts during a decozyiprcssion test."
," Larv'ng., 59. 267-95, 194-1-74. I)I.i, 1). B. "Oxygen disýsociation curves {,io human blood at 37 (C.'
Ir. Bronk. 1). WV., I landbook of Re.'spiratory Data ill Aviation. (Conmit-
tee( on o\\iation Medicine, Naliional Rcscarch Council, Washington,l).C., 194.4.
75. I)iil, 1). B. and PENROD, K. E. "Man's ceiling as determined ill the
altitude chamber.".'. app!. Physiolt.. I, 4o9 -17, 1948.76. D)OiNEGAN, J. F. "The phiysiology of the vileis. " J. Phlysiol., 55, 22(; -,,
1921.
77. D)O(NAI,, K. IW., l),.\vn)sO, W'. MI., and Si.i-irea). WV. 0. "'Sul)bnari.leescape br'atlhing air.J. I tyg., (ainib., 4;. 17( 7-I83, 10148,
78. DI)OlWtORSr, A. C. and I.EA'I IIART, (G. L. Imiethliod of assesiing themechanical properties of'lung and air ]'Silages." Liancet, 2, 10() - i, 152.
79. i)ourI,' J., KRYNAiTW, K. A., and S.,')I)r;RA.S, S. R. "Somle factorsinfluenicing venous pressure in a .J. Physiol., 92., 383 -400, 1938.
8o. Dlow, P. "Venous retuirn ats a factor aff-ecting vital capacity.' Amer. J.Phlysiol., 127, 793-5, 1939.
81. D)RINKER, C. K., PE,.itons', F. WV., and BIUMOART. H. L. "The eff('cl of
puillth nary congestion on the veintilalion of tile lung,." J. exp..Med..
35, 77-95, 1922.832. I)DRURY, 1). R., IIENRYJ. P., and (GooDM.AJ, 1. "TIllh' efft'ts ofContin1ll-
ous prissur"e breathing oin kidney function. J. clin. Ihvest., 26, 945--51,
1947.8:j. DI Bois, A. B., BoiF1.II , S. Y., aind ( ( IROF., J. H. "A lnt- i method fo 'r
:327

RAISED) INTRAPIULMONARY PRESSURE
measuring air-vay resistance in man usi'lg a body plethysmograph;%,allues in normal subjects and in patients with respiratory disease." jclin. Invest., 35, 327-35, 1956.
81. DVtONIARCO, J. L. and RIMINI, R. "La presion intra-abdonlinal en cihombre." Buenos Aires; Ell Atenen, 1947.
85. I)YsoN, N. A., Ht011-Jo-NFs, P., NEWBERY, G. R., SINC:LAIR, J. 1)., andW~EST, J. B. "Studies of regional lung function using radio-activeoxygen." Brit. nmed.j., 1, 231-8, 1(,6o.
86. EADn, H. XV., G-'REEN, J. H. and NEIL, E. "A comparison of the effectsof pulsatile and non-pulsatile blood flow through the carotid sinlus on thlereflexogenic activity of the sinus baroreceptors in the cat." J. Physiol.,118, 501Y-19, 1953.
87. EBIERT, R. V. and STEAD, E. A. "Thle effect of the application of tourni-quets on the hacmodvnamics of the circulation." J.cliii. Invest. 19,561-7, 1940.
88. ECKMAN, MI., BA.RAcii, B., Fox, C., RUM~SEY, C. C., and BARACI!, A. L."Ar. appraisal of intermittent pressure breathing as a method of in-creasing altitude tolerance."j .Aviat. Mled., 18, 565-74, 1947.
8q. WC~uJ s., HAM!LrON, W. K. and NICCSN1NOND, J. LI "Thipressure volume changes in the fiorearmn veins of ma!) during hyper-
!)o. EDHOLM. 0. G. -Physological changes during fainting." In WVolsten-holme, G. E. WN. Visceral Circulationj & A. Churchill, Ltd., London,1052.
1.ERN-Iixr.,J. "Tile tissue pr'essures of the extr emities during high pressurebrra.,hing.'' F.P.R.C. Rep)ort NO. 027, London, Air Ministry, 1955.
f)2. ERNSTtIc,,J. -TlW conMplialie of the human lungs during positive andnegative pres;sure lbreatliing.- J. Pliv\sio!., 143' I 4-I 61l1, ;9q58.
93.LiisnGJ. ?le efet o lrie hpoxia uponl thle. aeral and venousoxygen tensions in man.''j. Phvs;iol. In the prcss. i(963.
94. ERsIG J., GREEN, 1. D)., NAGLE, R. E., and WAG;NER, P3. R. "Highaltitude prote-ction fr-om pressure breathing miasks with trunk and lowerlimb counterpressoure.- J. Avist. .NlIed., 31, 40-48, 100-
95. ERxs-rtxr, J. and NICHARDM. G. J1. R. "Brief anoxia following rapiddlecompression f'rom) 560 to 140 mmHg abslu.OLte." J. Physiol., 153, 73 P,I (1
6o.
!)6. ERNSTixc;, J. anid NMcHAxRDY,. .J. R. "The oxygen sacuration and pHIof [lhe arterial blood during brie-f 1profound anoxia induced by rapiddecomnpressýion from' 56o to 140 mmHg.'" In Cunninghiam. 1). J. C. andI .ovd, B. B., "1 hei regulation ofihumian respiration'', Oxford, Blackwsell,1()62.
97. ER.Ns-rING, J., Nm;i+i., R. E., and PARRY, 1). J. "Thle boiling of tissleefluids at low; baromrctric pretsur(.s." j. Phys;iol., 142, 50P, 1958.
(?8. ERxs-rixo, J. and PARRY, 1). J. "SomeC observations onl the effect ofstimulating the stretch receptors in the carotid artery of min." J.P11%siOl., 137, 4 5 P, 19)57.
9.ERNSTING, J., Roxist-RG11, 11. L., and ~\VACGNER, P. R. "Rapid de-compression in the helmect, jerkin, anti-g suit system. A preliminaryreport." F.P.R.C. Report No. 11i50. London, Air Ministry, 1961.
328

REFERENCE S
t oo. FARMi, L. R. and R,\1tN, 11. "The gas stores of' the body and thet un-steady, state." J. app!. PiiYsiol., 7, 472-84, 1955.
tci. F'AR111, L. E. and RAH N, IfI. "A theoretical analysis of thle akclar-darterial oxygen difference with sptceiai refer ence to the- dior l~ibt it 1
effect." J. app!. Phy~siol., 7, 6og-70, '3, 1 o9%-.102. I'ENN, W. 0. and (1t..xWmK', LE. FL 'A'Eect of* pressure b~reathinig oni
blood flow through tile finger.'' Amer. J1. i'hN siol., 5 51, 2T) 75, I 9117.103. FENN, W. 0)., RAIIN, If., and Otis, A. 13. "A theore-tical stuidy of the
composition of the alveolar air at altitude.'' Ametr. J. Phiiviol., 1 4i,637-53, 1946.
304. FFRRts, El. B. and ENGEL., G. L. "T[le clinical nature of' hi, atiludedecompression sickness.'' lii Fulton, J. F'., "IDcCollplpreSioll sicknless.''London, Saunders, 193 i.
105. F..RRis, E.. B., WEOO, J. P., E.NG~i., Gi. L., andi STEVENS, C. 1). "THieeffect of* pressure breathiing on decomprecSsion Sicknless undcr di f~rciit
altitude conditions.'' Comlit tee on Aviati on M edicine Report No. *
National Re~earch Council, WVashiingtoni, D).C.,io6. FF:IzRts, E.. B., WEBIdij. P., RN-m*.R, If. W.. LNGEI., G. L.., Ri I~tAN. I.
and Bi.ANKEN11ORNE ', MI. A. "ille inllen11ce of' physical act ivity andphysical relaxation oti susceptib~ilityV to dieomipit'ssini sickness." C oml-
rmittee on Aviation M edicine Report No. 126. .Nationial Reseat tblCouncil, Washington, D.C.X, 194.
i07. 1'FIFscI, A. "New methods of' St udying gasot-(is exciiaige and pul -Inonary function.'' Springfield, Ilhlinois. Chlarles; C. 'I'lonlaS, 1,J4.
io8. Foi.Kow, B. and I'APPi'1:NFTMVNER. J. R. - .ompnl)1ilts (If the ltsJpil at4)l\
(le-ad Spare' and their varialton %\ith p)it'sslre bieathirig and bi)? 111¾-
actiVe drus.'*J.a)p. I'l\siol., 8, 3102-310, 1
wo. F(;RsrF.;x, R. E., FOWL~tER, W\. S.. B.-IES, 1). V., and VANs I ING1 N. B." Absorption ot cariolt)11 oltloxicC hy tile ltings during brett i iniiJ. Clii1. Invest-. 33, 11:35-45, '934-
310. FoiRSTER, R. E., Rotnhmio-1N. F.J.. W., (XANokR, L., BRISCOF., W. .,anldKREUZER, F'. '"Apparent pulmonary diffu'iiag capacity fin- carbm m1 11n1-
oxide at varying ox\ygenI telisioll''.1j. appi. Pii\siol.. 11, 277 ll() I(-,iii. Fowi.F.R, W. S. "LI ung flinct ion SItidies. II. 11w respiratory(t'Aý d pace
Amer. J. Physiol., 154' 403--I 6, 3948.-11. FoWL.iR, WI. S., (mzmiRiI , E.. R. and K:rn-. S. S, "Luniig ftiniction1
studies. VHII AtialySis of alveolar ventilationl by pulmoilrmay niltlogelcl('aranice cureTs.'' J. clili. Invyest., 31, 40- , W,1 ! 9,2.
113~. FRANK, N. R., RAso1omo, F. P., anid NVI~ii'lEN~il R(;t.R. I I. Litr
relationships of voltimie - presstue characteristics; of lul)i2'S antd 1)11nionary blood vessels ini (exisell cats ILungs.''Anvier. J. Il'ysi' 1.. .6t
114. F'RANKLIN, K. I. "A monotgiapi on vctiiS.- Baltimore. TIhomuas,135. FRASER, A. Mi. --SCIrViCe 1'iils and Foirthier developmient of P oss lir
brea thing equiipmnilt.'" F. P.R .C . Report NVo. 6A8. L~ondion, A\irMinistry, 19-15
tj6. F'Rurts, H1. W., (Thjim n, J. E.., HARRIS, P., BRAVNWAs3D, F.. W., andFisiINAN, A. P. FEffhucs of acuite ix poxia upon the volume of blood inthe th(;rax.'' Circulahtionl. 22. 2 6--% io,161).

INDEX
SUB-DIVISIONS OF TIHE TOTAL LUNG TYMPANIC MEMIBRANE - appearanceVox.UE, io6 of- pressure b•-cathing, 77
SWAIN, SQDN. [DR., 3SYSTEMIC ARTERIAL PRESSURE, 2.46 VITAL CAPACITY AND ITS SUB-
DIVISIONS, I 10
VAN SLYKE A.'% NEIL, 55TrECINIQUIE OF EXPERIMENTS AT RE- VASCULAR DAMAGE IN THE EAR, 97
DUCEi) PRESSURE, :JG VENOUS CO.LLECTION CUFF, 100TRANSPUIMONARY PRESSURE, 1 19 VENTILATION - pressure Suit, 8
343
- - - - - - • ,- -.. " -- - --
Related Documents