Intraday Return Predictability, Informed Limit Orders, and Algorithmic Trading DARYA YUFEROVA * July 19, 2018 ABSTRACT I study the effect of algorithmic trading on the strategic choice of informed traders for market versus limit orders. I proxy for this choice by means of intraday return predictability from market and limit orders around the NYSE Hybrid Market introduction. My findings show that the increase in algorithmic trading by 16% leads to an increase in informed trading through both market and limit orders at the inner levels of the limit order book by 3.5% and 6.2%, respectively. The change in the informativeness of different order types depends on the change in the competition among algorithmic traders. JEL classification: G12, G14. Keywords: Price Discovery, Limit Order Book, Liquidity Provision, Algorithmic Trading. * Norwegian School of Economics (NHH); email address: [email protected]. I am grateful to Dion Bongaerts, Mathijs Cosemans, Sarah Draus, Thierry Foucault, Wenqian Huang, Lingtian Kong, Albert Menkveld, Marco Pagano, Christine Parlour, Loriana Pelizzon, Dominik R¨ osch, Stephen Rush, Asani Sarkar, Elvira Sojli, Mark Van Achter, Mathijs van Dijk, Wolf Wagner, Jun Uno, Marius Zoican, participants of the FMA Europe 2018, the SGF conference 2018, the NFN 2016 Young Scholars Finance Workshop, the FMA 2015 Doctoral Consortium, the PhD course on “Market Liquidity” in Brussels, and seminar participants at Gothenburg University, Goethe University, Norwegian School of Economics, Norwegian Business School, Paris Dauphine University, Erasmus University, NYU Stern, and the Tinbergen Insitute for helpful comments. I gratefully acknowledge financial support from the Vereniging Trustfonds Erasmus Universiteit Rotterdam. I am also grateful to NYU Stern and Rotterdam School of Management, Erasmus University, where some work on this paper was carried out. This work was carried out on the National e-infrastructure with the support of the SURF Foundation. I thank OneMarket Data for the use of their OneTick software.

Welcome message from author
This document is posted to help you gain knowledge. Please leave a comment to let me know what you think about it! Share it to your friends and learn new things together.
Transcript
Intraday Return Predictability, Informed Limit Orders,
and Algorithmic Trading
DARYA YUFEROVA∗
July 19, 2018
ABSTRACT
I study the effect of algorithmic trading on the strategic choice of informed traders for marketversus limit orders. I proxy for this choice by means of intraday return predictability frommarket and limit orders around the NYSE Hybrid Market introduction. My findings showthat the increase in algorithmic trading by 16% leads to an increase in informed tradingthrough both market and limit orders at the inner levels of the limit order book by 3.5%and 6.2%, respectively. The change in the informativeness of different order types dependson the change in the competition among algorithmic traders.
JEL classification: G12, G14.
Keywords: Price Discovery, Limit Order Book, Liquidity Provision, Algorithmic Trading.
∗Norwegian School of Economics (NHH); email address: [email protected]. I am grateful to DionBongaerts, Mathijs Cosemans, Sarah Draus, Thierry Foucault, Wenqian Huang, Lingtian Kong, AlbertMenkveld, Marco Pagano, Christine Parlour, Loriana Pelizzon, Dominik Rosch, Stephen Rush, Asani Sarkar,Elvira Sojli, Mark Van Achter, Mathijs van Dijk, Wolf Wagner, Jun Uno, Marius Zoican, participants of theFMA Europe 2018, the SGF conference 2018, the NFN 2016 Young Scholars Finance Workshop, the FMA2015 Doctoral Consortium, the PhD course on “Market Liquidity” in Brussels, and seminar participantsat Gothenburg University, Goethe University, Norwegian School of Economics, Norwegian Business School,Paris Dauphine University, Erasmus University, NYU Stern, and the Tinbergen Insitute for helpful comments.I gratefully acknowledge financial support from the Vereniging Trustfonds Erasmus Universiteit Rotterdam.I am also grateful to NYU Stern and Rotterdam School of Management, Erasmus University, where somework on this paper was carried out. This work was carried out on the National e-infrastructure with thesupport of the SURF Foundation. I thank OneMarket Data for the use of their OneTick software.

The limit order book is the dominant market design in equity exchanges around the
world.1 The prevalence of limit order book markets calls for a detailed understanding of
how such markets function. In particular, understanding the price discovery process on
these markets required a detailed study of the trader’s choice between submissions of market
and limit orders. The conventional wisdom in the microstructure literature used to be that
informed traders use only market orders, while uninformed traders use both market and
limit orders (see Glosten and Milgrom (1985); Kyle (1985); Glosten (1994); Seppi (1997)).
Only recent studies explicitly consider the choice of informed traders for market or limit
orders.2 Informed traders can submit a market order and experience immediate execution
at the expense of the bid-ask spread (consume liquidity). Alternatively, informed traders
can submit a limit order and thus bear the risk of non-execution, as well as the risk of
being picked off, but earn the bid-ask spread (provide liquidity). In sum, understanding
how informed trading takes place and how this process was altered by recent technological
advances are important questions to explore in modern market microstructure. In this paper,
I investigate how the increase in algorithmic trading affects the relative informativeness of
different order types.
The informational advantage of algorithmic traders (and especially their subset, high-
frequency traders) is based on superior technologies for information collection and processing,
1According to Swan and Westerholm (2006), 48% of the largest equity markets are organized as purelimit order book markets (e.g., the Australian Stock Exchange, Toronto Stock Exchange, and Tokyo StockExchange), 39% are organized as limit order books with designated market makers (e.g., the New York StockExchange (NYSE) and Borsa Italiana), and the remaining 12% are organized as hybrid dealer markets (e.g.,NASDAQ and the Sao Paulo Stock Exchange) as of the beginning of 2000.
2For theoretical studies on the choice of uninformed traders between market and limit orders, see Co-hen, Maier, Schwartz, and Whitcomb (1981), Chakravarty and Holden (1995), Handa and Schwartz (1996),Parlour (1998), Foucault (1999), Foucault, Kadan, and Kandel (2005), Goettler, Parlour, and Rajan (2005),and Rosu (2009); for theoretical studies on the choice of informed traders between market and limit orders,see Kaniel and Liu (2006), Goettler, Parlour, and Rajan (2009), and Rosu (2016); for empirical stud-ies on the choice between market and limit orders on equity markets, see Bae, Jang, and Park (2003),Anand, Chakravarty, and Martell (2005), Bloomfield, O’Hara, and Saar (2005), and Baruch, Panayides,and Venkataraman (2014); for empirical studies on the choice between market and limit orders on foreignexchange markets, see Menkhoff, Osler, and Schmeling (2010), Kozhan and Salmon (2012), and Kozhan,Moore, and Payne (2014).
1
and also on the ability to continuously monitor and respond to market conditions. Previ-
ous research has focused mainly on informed algorithmic trading via market orders. Only
Brogaard, Hendershott, and Riordan (2017) examine informed trading via both market and
limit orders by a subset of algorithmic traders (high-frequency traders). They document that
high-frequency traders contribute to price discovery mainly through limit orders. However,
they do not establish the causal effect of high-frequency trading on the relative informative-
ness of different order types, which is crucial given the increasing trend of high-frequency
traders’ participation in modern markets.
In order to establish causal effects of algorithmic traders on the relative informativeness of
order types, I follow the approach of Hendershott, Jones, and Menkveld (2011) and use NYSE
Hybrid Market introduction as an instrumental variable to help determine the causal effects
of algorithmic trading activity on the choice made by informed traders. The introduction
of the NYSE Hybrid Market was a permanent technological change in market design that
resulted in increased automation and speed of trading (Hendershott and Moulton (2011)).
The rollout of stocks to the NYSE Hybrid Market was implemented in a staggered way
from October 2006 through January 2007, which allows for a causal effect identification. I
proxy for algorithmic trading activity by means of the ratio of best bid-offer quote updates
relative to the daily trading volume following Hendershott, Jones, and Menkveld (2011) and
Boehmer, Fong, and Wu (2015), and I proxy for the relative informativeness of different
order types by means of intraday return predictability using tick-by-tick consolidated trade
and quote data and data on the first 10 best levels of the NYSE limit order book from the
Thomson Reuters Tick History (TRTH) database.
Naturally, orders submitted by informed traders contain information about future price
movements. If an informed trader actively uses market orders, an imbalance between buyer-
and seller-initiated volume may be informative about future price movements. If an informed
trader actively uses limit orders, the limit order book may contain information that is not
yet incorporated into the price. Therefore, strategies employed by informed traders may
2
induce intraday return predictability from market and limit order flows alike.
I develop two alternative hypotheses of the effects of algorithmic trading on informed
traders’ choices: the competition hypothesis and the efficient technology hypothesis. Com-
petition between algorithmic traders for (trading on) the same information makes market
orders more attractive to them because they guarantee immediate execution (the compe-
tition hypothesis). The technological advantage of algorithmic traders makes limit orders
more attractive to them because they are able to reduce pick-off risks better than the other
market participants (the efficient technology hypothesis).
The results show that the increase in algorithmic trading activity leads to increases in
the relative informativeness of market order imbalance and depth imbalance at the inner
levels of the limit order book by 3.5% and 6.2% relative to the sample average, respectively.
The relative importance of the depth imbalances at the deeper levels of the limit order book
decreases. The latter is in line with the anecdotal evidence that algorithmic traders tend
to acquire short-lived information, and thus operate mainly at the inner levels of the limit
order book.
Furthermore, I show that the relative importance of market order imbalance increases
significantly only for small and mid-cap stocks by 3.4% and 5.2% relative to the sample
average, while the relative importance of the limit orders at the inner levels of the limit order
book increases significantly only for mid-cap and large stocks by 5.6% and 15.9% relative
to sample average, respectively. The former findings are consistent with the competition
hypothesis, while the latter findings are consistent with the efficient technology hypotheses.
One potential explanation for such phenomena is that large stocks are likely to be more
saturated with algorithmic traders, and thus less likely to exhibit new algorithmic traders
entering the market than smaller stocks are.3 Therefore, the competition hypothesis is more
3Hagstromer and Norden (2013), Brogaard, Hendershott, and Riordan (2014), ESMA (2014), andAvramovic, Lin, and Krishnan (2017) document that algorithmic traders (especially high-frequency traders)are more present in large stocks than in small stocks. In addition, Baron, Brogaard, Hagstromer, and Kir-ilenko (2017) show that there are strong entry barriers in high-frequency traders’ business, and therefore,
3

profound in smaller stocks, while the efficient technology hypothesis is more profound in
large stocks. Put differently, the overall effect of algorithmic traders on the choice of the
order types used for informed trading depends on the change in the amount of competition
between them.
My main contribution to the literature is twofold. First, I contribute to the literature on
intraday return predictability by documenting that the main source of the intraday return
predictability is private information embedded in limit orders for a wide cross-section of
stocks. Among other papers studying intraday return predictability from limit order book
are Kavajecz and Odders-White (2001); Bae, Jang, and Park (2003); Anand, Chakravarty,
and Martell (2005); Harris and Panchapagesan (2005); Kaniel and Liu (2006); Cao, Hansch,
and Wang (2009); Baruch, Panayides, and Venkataraman (2014); Cenesizoglu, Dionne, and
Zhou (2014); and Putnins and Michayluk (2015). However, these papers focus only on the
limited amount of stocks (mainly the largest and most actively traded stocks).
Second, my paper contributes to the ongoing debate on the effect of algorithmic traders
(especially high-frequency traders) on market quality. Among other papers taking part in
this debate are McInish and Upson (2012); Hagstromer and Norden (2013); Hirschey (2013);
Brogaard, Hendershott, and Riordan (2014); Biais, Foucault, and Moinas (2015); Jovanovic
and Menkveld (2015); Foucault, Hombert, and Rosu (2016); and Foucault, Kozhan, and
Tham (2017). Biais and Foucault (2014), O’Hara (2015), and Menkveld (2016) provide a
comprehensive review of papers on high-frequency trading activity and market quality. While
Brogaard, Hendershott, and Riordan (2017) show that high-frequency traders actively use
limit orders for informed trading, my paper is the first one to establish a causal relation
between algorithmic trading and the informativeness of different order types.4 My evidence
the degree of competition largely remains constant for top 25 Swedish stocks.4My paper is closely related to Hendershott, Jones, and Menkveld (2011), who also look at the causal
effect of algorithmic trading on price changes related and unrelated to trading. They come to the conclusionthat large stocks exhibit an increase in price discovery not related to trading activity. However, theydocument a confounded effect of inventory costs and information incorporated in the quotes, and additionallyfocus only on the best bid-offer level, thus not taking into account information embedded in deeper levels of
4
shows that an increased degree of algorithmic trading activity leads to an increased usage of
both informed market and informed limit orders at the inner levels of the limit order book
accompanied by a decreased usage of informed limit orders at the deeper levels of the limit
order book. The ultimate effect of algorithmic trading activity on the way price discovery
takes place depends on the competition among them.
The paper is structured as follows. Section I develops the hypotheses. Section II discusses
the data and methodology used in the paper. Section III provides the main empirical results.
Section IV contains additional analysis. Section V concludes.
I. Hypotheses
In this section, I develop the hypotheses for the effects of algorithmic trading on the
choice between limit and market orders by informed traders. Under the traditional view
(see, e.g., Glosten and Milgrom (1985); Kyle (1985); Glosten (1994); and Seppi (1997)), only
market orders are used for informed trading, which may be an inadequate approximation of
reality. Later studies build upon this initial work and allow both informed and uninformed
traders to choose between the order types (Kaniel and Liu (2006); Goettler, Parlour, and
Rajan (2009); Rosu (2016)).
Based on theoretical predictions from Goettler, Parlour, and Rajan (2009), an informed
trader who receives good news about a stock has three different options to exploit this
information. First, the trader can submit a buy market order and consume liquidity. Second,
the trader can submit a limit buy order at the inner levels of the bid side of the limit order
book (this limits execution probability, but saves transaction costs). Third, the trader can
also submit a limit sell order at the outer levels of the ask side of the limit order book, in
combination with one of the two other order options, to lock in the benefit from the price
difference. The opposite is true for the bad-news scenario.
the limit order book.
5

During the past decade, a new group of market participants — algorithmic traders — has
emerged and evolved into a dominant player responsible for the majority of trading volume.
Algorithmic trading “is thought to be responsible for as much as 73% of trading volume in
the United States in 2009” (Hendershott, Jones, and Menkveld (2011), p. 1). Therefore, it
is natural to ask what role algorithmic traders are playing in the price discovery process and
to what extent their presence affects the informed trader’s choice between market and limit
orders.
Possessing private information is equivalent to having the capacity to absorb and analyze
publicly available information (including information from the past order flow) faster than
other market participants (Foucault, Hombert, and Rosu (2016); Foucault, Kozhan, and
Tham (2017); Menkveld and Zoican (2017)). Efficient information-processing technology is
a distinct feature of algorithmic traders, hence they are more likely to be informed than
other market participants. However, ex ante, it is not clear whether algorithmic traders
would prefer to use market or limit orders to profit from their informational advantage.
On the one hand, competition among informed traders will lead to a faster price discov-
ery and a shorter lifespan for the information obtained by the informed trader. Algorithmic
traders compete for the same information by processing the same news releases or by ana-
lyzing past order flow patterns as fast as possible. In a competitive market, a trader must
be the first in line to trade on information in order to profit from it. Given that only mar-
ket orders can guarantee immediate execution, algorithmic traders may be inclined to use
market orders for informed trading.
On the other hand, limit orders are attractive for traders who can accurately predict
execution probabilities, continuously monitor the market, and quickly adapt to market con-
ditions. Algorithmic traders possess all of these characteristics. Thus, they may be inclined
to use limit orders for informed trading.
Therefore, I formulate two alternative hypotheses for the effect of increase in algorithmic
trading on the informed traders’ choice between market and limit orders.
6

HYPOTHESIS 1: With the increase in algorithmic trading activity, the proportion of price
discovery that occurs via market orders increases. (The competition hypothesis)
HYPOTHESIS 2: With the increase in algorithmic trading activity, the proportion of price
discovery that occurs via limit orders increases. (The efficient technology hypothesis)
II. Data and method
In this section, I describe my data and variables (see Section II.A) as well as methodology
to identify the causal effects of algorithmic trading on the choice of order types used for
informed trading (see Section II.B).
A. Data and variables
I obtain the data for the period from June 2006 till May 2007. I obtain intraday data on
trades and best bid-offer quotes as well as the 10 best levels of the limit order book for the
U.S. market from the TRTH database. The TRTH database is provided by the Securities
Industry Research Centre of Asia-Pacific (SIRCA). The limit order book data provided
by TRTH does not include order-level information (e.g., it contains no order submission,
revision, or cancellation details), only the 10 best price levels and the depth on bid and ask
sides of the book that are visible to the public. The data for limit order book comes from
the NYSE. The data for trades and best bid-offer quotes comes from the consolidated tape.
In other words, the best bid-offer reported in the data is the best bid-offer for any exchange
in the U.S.
TRTH data are organized by Reuters Instrumental Codes (RICs), which are identical to
TICKERs provided by the Center for Research in Security Prices (CRSP). Merging data
from CRSP and TRTH allows me to identify common shares that indicate the NYSE as
their primary exchange and to use company-specific information (e.g., market capitalization
7

and turnover). This study is limited to NYSE-listed stocks only due to the limit order book
data availability. I require all stocks to be present in CRSP database for the whole sample
period. I discard stocks with an average monthly price bigger than $1,000 and smaller than
$5. I winsorize all the variables at the 95% level (2.5% at the each tail of the distribution).
For the purpose of further analysis, I aggregate intraday data from TRTH in the follow-
ing way. I compute one-minute mid-quote returns and market order imbalances, and take
snapshots of the limit order book at the end of each one-minute interval. I filter the intraday
data following Rosch, Subrahmanyam, and Van Dijk (2016). First, I discard trades, quotes,
and limit order book data that are not part of the continuous trading session. Continuous
trading session hours for NYSE are 9:30-16:00 ET and they remain unchanged during the
sample period. Second, I discard block trades (i.e., trades with a trade size greater than
10,000 shares) because these trades are likely to receive special treatment. Third, I discard
data entries that are likely to be faulty. Faulty entries include entries with negative or zero
prices or quotes; entries with a negative bid-ask spread; entries with a proportional bid-ask
spread bigger than 25%; and entries that have a trade price, bid price, or ask price that
deviates from the 10 surrounding ticks by more than 10%. In addition, I require that at
least five levels of the limit order book are available in the end of each one-minute interval.
For a stock-day to enter my sample, at least 100 valid one-minute intervals with at least one
trade are required. If there are less than 200 days in my sample period for a particular stock,
I exclude this stock from the analysis. Overall, I am left with 944 common NYSE-listed
stocks.
A.1. Proxy for algorithmic trading
My data does not allow me to identify algorithmic traders directly. However, anecdotal
evidence suggests that algorithmic traders tend to send multiple messages per each individual
transaction. Therefore, I consider the following two proxies for algorithmic trading activity in
8

the spirit of Hendershott, Jones, and Menkveld (2011) and Boehmer, Fong, and Wu (2015):
QTE/DV OL, a daily number of best bid-offer quote updates relative to daily trading volume
(in $10,000) and QTE/TRD, a daily number of best bid-offer quote updates relative to the
daily number of transactions. I use theQTE/DV OL in a baseline analysis, whileQTE/TRD
is used for robustness check.
A.2. Proxy for order-type informativeness
I use intraday predictive regressions to proxy for the informational content of different
order types. I construct intraday data on returns, market order imbalances (MOIB)5, and
limit order book imbalances at a one-minute frequency. For all the variables, I discard
overnight observations. I use these variables to predict returns one minute ahead.
I follow Chordia, Roll, and Subrahmanyam (2008) and compute one-minute log returns
(Ret) based on the prevailing mid-quotes (the average of the bid and ask prices) at the end of
the one-minute interval, rather than the transaction prices or mid-quotes matched with the
last transaction price. In this way, I avoid the bid-ask bounce and ensure that the returns
for every stock are indeed computed over a one-minute interval. I implicitly assume that
there are no stale best bid-offer quotes in the sample, and thus I consider a quote to be valid
until a new quote arrives or until a new trading day starts.
To calculate a one-minute MOIB, I match trades with quotes and sign trades using the
Lee and Ready (1991) algorithm. TRTH data are stamped to the millisecond, therefore the
Lee and Ready (1991) algorithm is quite accurate. In particular, a trade is considered to be
buyer initiated (seller initiated) if it is closer to the ask price (bid price) of the prevailing
quote. For each one-minute interval, I aggregate the trading volume in USD for buyer- and
seller-initiated trades separately at the stock level. Thereafter, I subtract seller-initiated
dollar volume from buyer-initiated dollar volume to obtain MOIB and normalize it by the
5Market order imbalance is based on both market and marketable limit orders.
9

total trading volume. For stock i on date d at one-minute interval t,
MOIBi,d,t =Buyer initiated volumei,d,t − Seller inititated volumei,d,tBuyer initiated volumei,d,t + Seller inititated volumei,d,t
(1)
There are multiple ways to describe the limit order book. Most of the papers that study
intraday return predictability either focus on different levels of the limit order book or on the
corresponding ratios of these levels between the ask and bid sides of the limit order book.
For instance, Wuyts (2008), Cao, Hansch, and Wang (2009), and Cenesizoglu, Dionne, and
Zhou (2014) use slopes and depth at different levels of the limit order book to summarize
its shape. However, due to variation in the shape of the limit order book as well as in the
number of available levels of the limit order book, I believe that definition of inner, middle,
and outer levels by means of a relative threshold is more suitable than definition by means
of the number of levels in the limit order book (e.g., levels from 1 to 3 are inner levels, levels
from 4 to 6 are middle levels, and levels from 7 to 10 are outer levels).
Examples of a relative approach to limit order book description are Cao, Hansch, and
Wang (2009), who also use volume-weighted average price for different order sizes to describe
the limit order book, and Kavajecz and Odders-White (2004), who use a so-called “near-
depth” measure, which is a proportion of the depth close to the best bid-offer level relative
to the cumulative depth within a certain price range.
For the purpose of testing the private information hypothesis, I focus on the ratios of
depth concentrated at inner, middle, and outer levels of the limit order book between the
ask and bid sides. I use a modification of the “near-depth” measure introduced by Kavajecz
and Odders-White (2004). First, I compute a snapshot of the ask and bid sides of the limit
order book at the end of each one-minute interval. Then, I define the inner levels as price
levels between the mid-quote and one-third of the minimum across bid and ask sides of the
total distance between the 10th available limit price and the mid-quote. Outer levels are
defined as price levels above two-thirds of the minimum across bid and ask sides of the total
10

distance between the 10th available limit price and the mid-quote. I refer to the remaining
levels as middle levels of the limit order book. For stock i on date d at one-minute interval
t,
Heighti,d,t = min[(PAsk,10i,d,t −MidQuotei,d,t), (MidQuotei,d,t − PBid,10
i,d,t )] (2)
Inneri,d,t =
∑10k=1Depth
Bid,ki,d,t ∗ 1(|PBid,k
i,d,t −MidQuotei,d,t| <= 13Heighti,d,t)−∑10
k=1DepthBid,ki,d,t ∗ 1(|PBid,k
i,d,t −MidQuotei,d,t| <= 13Heighti,d,t)+
−DepthAsk,ki,d,t ∗ 1(|PAsk,k
i,d,t −MidQuotei,d,t| <= 13Heighti,d,t)
+DepthAsk,ki,d,t ∗ 1(|PAsk,k
i,d,t −MidQuotei,d,t| <= 13Heighti,d,t)
(3)
Middlei,d,t =
∑10k=1Depth
Bid,ki,d,t ∗ 1(1
3Heighti,d,t < |PBid,k
i,d,t −MidQuotei,d,t| <= 23Heighti,d,t)−∑10
k=1DepthBid,ki,d,t ∗ 1(1
3Heighti,d,t < |PBid,k
i,d,t −MidQuotei,d,t| <= 23Heighti,d,t)+
−DepthAsk,ki,d,t ∗ 1(1
3Heighti,d,t) < |PAsk,k
i,d,t −MidQuotei,d,t| <= 23Heighti,d,t)
+DepthAsk,ki,d,t ∗ 1(1
3Heighti,d,t) < |PAsk,k
i,d,t −MidQuotei,d,t| <= 23Heighti,d,t)
(4)
Outeri,d,t =
∑10k=1Depth
Bid,ki,d,t ∗ 1(|PBid,k
i,d,t −MidQuotei,d,t| > 23Heighti,d,t)−∑10
k=1DepthBid,ki,d,t ∗ 1(|PBid,k
i,d,t −MidQuotei,d,t| > 23Heighti,d,t)+
−DepthAsk,ki,d,t ∗ 1(|PAsk,k
i,d,t −MidQuotei,d,t| > 23Heighti,d,t)
+DepthAsk,ki,d,t ∗ 1(|PAsk,k
i,d,t −MidQuotei,d,t| > 23Heighti,d,t)
(5)
My relative approach allows me to define in a unified fashion the levels that are close to
the best bid-offer level, as well as the levels that are far away from the best bid-offer level
across stocks and through time.
In order to estimate order-type informativeness, I run stock-day predictive regressions
at a one-minute frequency using one-minute mid-quote returns as the dependent variable.
As explanatory variables, I use lagged returns, lagged market order imbalance (MOIB),
and lagged depth imbalances at the inner, middle, and outer levels of the limit order book.
Controlling for lagged returns allows me to differentiate between temporary effect (inventory
11
management) and permanent effect (private information). The regression equation for each
stock i on day d is given by:
Reti,d,t = α + β1Reti,d,t−1 + β2MOIBi,d,t−1+
+ β3Inneri,d,t−1 + β4Middlei,d,t−1 + β5Outeri,d,t−1 + εt(6)
For each stock-day I proxy for order-type informativeness by contribution of the each
variable to the R2 of the predictive regressions averaged across all possible orderings of the
variables as in Lindeman, Merenda, and Gold (1980).
B. Instrumental variable approach
The main contribution of this study is the identification of causal effects of algorithmic
trading on the relative informativeness of different order types. Identifying the causal effects
of the algorithmic trading activity is not a trivial task, as the degree of algorithmic trading
activity in each stock on each day is an endogenous choice made by the algorithmic trader.
Therefore, I adopt an instrumental variable approach following Hendershott, Jones, and
Menkveld (2011) to identify the causal effects of the algorithmic trading on the choice of
order types used for informed trading.
I focus on the period surrounding the introduction of the NYSE Hybrid Market – an
exogenous change in market design that led to increased speed and automation of the NYSE
– from June 2006 till May 2007 (following Hendershott and Moulton (2011)).6 Among
other changes, after the NYSE Hybrid Market’s introduction, orders were allowed to “walk”
through the limit order book automatically; before this technological change, market orders
were executed automatically at the best bid-offer level only. I obtain data on the NYSE
Hybrid Market’s rollout, which was when the actual increase in the degree of automated
6I prefer the introduction of the NYSE Hybrid Market to the Autoquote introduction used in Hender-shott, Jones, and Menkveld (2011) because the effects of Autoquote’s introduction are likely to be con-taminated by the recent effects of making the NYSE limit order book publicly available as of January 24,2002.
12

execution and speed took place, from Terrence Hendershott’s website. This rollout was
implemented in a staggered way from October 2006 through January 2007 (see Figure 1),
which allows for a causal effect identification.
INSERT FIGURE 1 HERE
I follow Hendershott, Jones, and Menkveld (2011) and estimate the following IV panel
regression with stock and day fixed effects (implicit difference-in-difference approach) and
with standard errors clustered by stock:
Yi,d = αi + γd + β1ATi,d + β2MCAPi,m−1 + β3(1/PRCi,m−1)+
+ β4Turnoveri,m−1 + β5PQSPRi,m−1 + β6Rangei,m−1 + εi,d
(7)
where Yi,d is the contribution of each variable to the R2 of predictive regressions (see equation
(6)) averaged across all possible orderings of the variables as in Lindeman, Merenda, and
Gold (1980) for stock i on day d, and αi and γd are stock and day fixed effects, respectively.
ATi,d is a proxy for algorithmic trading activity for stock i on day d (the daily number of
quotes relative to daily trading volume in USD 10,000, QTE/DV OL). In addition, I control
for the daily log of market capitalization in billions (MCAPi,m−1), inverse of price (1/Pi,m−1),
annualized turnover (Turnoveri,m−1), closing quoted spread (PQSPRi,m−1), and the square
root of high minus low range (Rangei,m−1) averaged over the previous month, m− 1. As a
set of instruments, I use all explanatory variables with ATi,d replaced by Hybridi,d, a dummy
variable that equals one if the stock i on day d is rolled out to the NYSE Hybrid Market
and 0 otherwise.
III. Empirical results
In this section, I discuss my empirical results. First, I provide summary statistics for
the algorithmic trading activity in my sample (see Section III.A). Second, I document the
13
informativeness of different order types (see Section III.B). Finally, I analyze the effect of
algorithmic trading on the informativeness of different order types (see Section III.C).
A. Algorithmic trading activity
I present the average proxies for algorithmic trading activity (averaged across stock-days)
in Table I for the whole sample of 944 stocks and for different market capitalization terciles
(based on market capitalization in the beginning of June 2006). I show that amounts of best
bid-offer quote updates, trades, and trading volume increase monotonically from small-cap
stocks to large-cap stocks from 6,655 to 21,798 quote updates, from 1,432 to 8,271 trades,
and from USD 9,530,000 to USD 130,820,000, respectively. On average, in my sample,
for each USD 10,000 of daily trading volume, I observe 6.49 best bid-offer quote updates,
and for each trade, I observe 4.46 best bid-offer quote updates. For instance, Hendershott,
Jones, and Menkveld (2011) document 5.42 electronic messages for each USD 10,000 of
daily trading volume for the largest stocks quantile, while the corresponding statistic of the
largest tercile in my data is 2.48. I note that my measure is different from the one used
in Hendershott, Jones, and Menkveld (2011) as I do not have access to the whole order
history (i.e., submission, modification, and cancellation) and I use only updates at the best
bid-offer level. In other words, the number of electronic messages for each USD 10,000 must
be by definition higher than number of the best bid-offer quote updates. I also note that the
changes in the algorithmic trading measure from large-cap stocks to small-cap stocks are in
line with those documented by Hendershott, Jones, and Menkveld (2011).
INSERT TABLE I HERE
B. The informativeness of different order types
Table II presents the estimation results of the predictive stock-day regressions of one-
minute mid-quote returns on one-minute lagged mid-quote returns, one-minute lagged mar-
14
ket order imbalances, and one-minute lagged depth imbalances at the inner, middle, and
outer levels of the limit order book (see equation (6)) for the whole sample and market capi-
talization terciles. Controlling for lagged returns allows me to separate inventory effects from
the effects of private information, as information should result in a permanent price change. I
discuss the whole sample results only as the results for different market capitalization terciles
are in line with the results of the whole sample.
INSERT TABLE II HERE
Panel A of Table II reports average coefficients together with the proportion of the regres-
sions that have significant individual t-statistics. MOIB is positively related to future stock
returns (in line with, e.g., Chordia, Roll, and Subrahmanyam (2005, 2008)). In particular,
the MOIB coefficient is 0.596 and is positive and significant in 27.3% of the stock-day regres-
sions.7 Depth imbalances at the inner and middle levels of the limit order book are positively
and significantly related to the future price movements in 46.5% and 12.7%, respectively,
while depth imbalances at the outer levels of the limit order book have, on average, negative
effects; however, the proportion of positive and negative significant stock days is almost the
same. The latter could be due to the fact that outer levels are used for informed trading if
and only if an informed trader receives a relatively strong signal, which is unlikely to happen
regularly on the market.
In order to measure the relative importance of different order types, I look at the R2
decomposition of the predictive regressions averaged across all possible orderings of the
variables as in Lindeman, Merenda, and Gold (1980). Panel B of Table II shows that the
average adjusted R2 of the predictive regressions is equal to 2.5% for the whole sample.
MOIB contributes 19.4% to the R2 (0.49% in absolute terms), while limit order book
imbalances, LOIB, jointly account for 57.6% of the R2 (1.44% in absolute terms). The
7As a comparison, Rosch, Subrahmanyam, and Van Dijk (2016) document that coefficient of MOIBis positive and significant in 30.07% of the predictive regressions using only lagged dollar market orderimbalance as predictive variable over the period between 1996 and 2010 for NYSE common stocks.
15

largest predictive power comes from depth imbalances at the inner levels of the limit order
book (30.9% in relative terms). As a comparison, Chordia, Roll, and Subrahmanyam (2008)
document an adjusted R2 of 0.51% for predictive regressions using only lagged dollar market
order imbalance as predictive variable for the 1993-2002 period.
My results are consistent with Cao, Hansch, and Wang (2009), who document an increase
in adjusted R2 after inclusion of additional levels of the limit order book with a monotonic
decrease of the added value for each additional level. My results are, however, at odds with
Cont, Kukanov, and Stoikov (2014), who argue that only imbalances at the BBO level drive
intraday return predictability.
All in all, this suggests that private information is the main source of the intraday return
predictability: roughly 20% of this predictability is attributable to the informed market
orders, and roughly 60% is attributable to the informed limit orders. The remaining 20%
stem from inventory-management concerns (lagged returns).
C. The effect of algorithmic trading on order-type informativeness
In this section, I discuss the casual effect of algorithmic trading on the relative informa-
tiveness of different order types. Table III reports the results of the first-stage instrumental
variable regression (see equation (7)), with the NYSE Hybrid Market’s introduction as an
instrument for algorithmic trading activity.
INSERT TABLE III HERE
I document that algorithmic trading activity, as proxied by the number of best bid-
offer quote updates relative to daily trading volume in USD 10,000 (QTE/DV OL) increases
significantly for the whole sample as well as for different market capitalization terciles. In
particular, algorithmic trading increases by 1.01 best bid-offer quote update per USD 10,000
trading volume or 16% relative to its average value for the whole sample period.
16

Interestingly, I observe a monotonic decrease in the changes of algorithmic trading due
to the NYSE Hybrid Market’s introduction, moving from small to large stocks. However,
the relative effect exhibits the opposite pattern: from a 14% increase for small stocks to a
25% increase for large stocks.
INSERT TABLE IV HERE
The results for the second-stage regression for the whole sample are presented in Table
IV. In particular, I estimate the effect of algorithmic trading on the R2 decomposition from
predictive regressions (see equation (6)).8 Algorithmic trading increases price informative-
ness as manifested by an increase of adjusted R2 by 0.31% – or, in relative terms, by 12.4%
(0.31%/2.5%). Algorithmic trading activity increases the relative importance of both mar-
ket orders and limit orders at the inner levels of the limit order book by 0.68% and 1.92%,
or by 3.51% and by 6.21%, relative to the sample mean, respectively. This implies that
on average, adjusted R2 attributable to market order imbalances increases from 0.49% to
0.56% and adjusted R2 attributable to the depth imbalances at the inner levels of the limit
order book increases from 0.77% to 0.92%. Depth imbalances at the middle and outer levels
of the limit order book decrease their relative importance. This finding is in line with the
fact that algorithmic trading operates with short-lived information extracted from the order
flow, and thus traders will not be inclined to use the middle and outer levels of the limit
order book in their trading strategies due to the long elapsed time between order submission
and execution. Overall, there is a shift of relative importance to both market orders and
limit orders at the inner levels of the limit order book, which is consistent with both the
competition and efficient technology hypotheses.
Among others, Hagstromer and Norden (2013) and Brogaard, Hendershott, and Riordan
(2014) provide empirical evidence that algorithmic traders (especially high-frequency traders)
8I use the relative decomposition of the R2 rather than the absolute one because I want to isolate thechange of different order types’ relative informativeness from the general effect of the changes in R2 due tothe increase in algorithmic trading activity.
17
are more present in large stocks than in small stocks. Therefore, the effects of increase in
algorithmic trading activity might be different for stocks with different market capitalization.
INSERT TABLE V HERE
Table V presents the second-stage results for different market capitalization terciles. In
line with the competition hypothesis, I document that the relative importance of market
order imbalances increases significantly for small and medium-size stocks by 0.64% and
0.96%, or by 3.35% and 5.22%, relative to sample average, respectively, but not for the large
stocks. A possible explanation for medium-size stocks having a larger increase in importance
of market orders for the price discovery process than small stocks is that small stocks have
the largest spread, which makes it more costly to use market orders in the first place. At
the same time, the relative importance of inner levels increases significantly with algorithmic
trading for medium and large stocks by 1.86% and 4.29%, or by 5.63% and 15.89%, relative to
sample average, respectively, but not for the small stocks. Put differently, the competition
hypothesis manifests itself more in small stocks, while the efficient technology hypothesis
manifests itself more in large stocks. This is consistent with strong entry barriers within
high-frequency traders’ business (see Baron, Brogaard, Hagstromer, and Kirilenko (2017)),
which lead to a larger increase in competition between high-frequency traders in stocks with
ex-ante low presence of high-frequency traders.
To sum up, I contribute to the debate on whether algorithmic traders adversely select
other market participants. I provide evidence that the increased participation of algorithmic
traders has caused an increase in the relative importance of the price discovery process for
both market orders and limit orders concentrated at the inner levels of the limit order book.
Moreover, in large stocks, which were likely to have a lot of algorithmic trading activity
before the introduction of the NYSE Hybrid Market, prices become more informative purely
via limit orders. This suggests that, in the absence of new algorithmic traders entering the
18

market, any increase in algorithmic trading activity will lead to an increase of the informed
liquidity provision.
IV. Additional analysis
In this section, I provide additional results to support the baseline analysis discussed in
the Section III.C. I show that my results are robust to using another proxy of algorithmic
trading activity (Section IV.A) and also conduct a placebo test (Section IV.B). I provide
additional support to the competition versus efficient technology hypotheses by looking at
the NYSE Hybrid Market’s rollout sequence (Section IV.C). In Section IV.D, I confirm that
algorithmic traders are focused on short-lived information.
A. Another proxy for algorithmic trading
In this section, instead of using QTE/DV OL, the daily number of best bid-offer quote
updates relative to daily trading volume (in $10,000), as a proxy of algorithmic trading, I use
QTE/TRD, the daily number of best bid-offer quote updates relative to the daily number
of transactions. I note that this proxy of algorithmic trading activity is inferior to the one
used in the baseline analysis because it does not take into account the size of each individual
transaction.
INSERT TABLE VI HERE
The results for the second-stage of the instrumental variable regression (see equation (7))
for the whole sample are presented in Table VI. Overall, the results are consistent with my
findings in the baseline analysis. However, the shift in the relative importance of different
order types for the price discovery process is more profound. Algorithmic trading activity
increases the relative importance of both market orders and limit orders at the inner levels
19
of the limit order book by 2.36% and 6.70%, respectively (as opposed to the baseline case:
0.68% and 1.98%, respectively). Depth imbalances at the middle and outer levels of the limit
order book decrease their importance for the price discovery process.
B. Placebo test
In order to ensure that my results are indeed driven by the NYSE Hybrid Market’s
rollout, which resulted in increased algorithmic trading activity, I perform a placebo test. In
particular, for each stock, I randomly pick an NYSE Hybrid Market rollout date from a pool
of all rollout dates observed in my sample, excluding the actual rollout date for this stock.
Afterwards, I re-estimate second-stage of the instrumental variable regression (see equation
(7)) with randomly assigned rollout dates. I repeat this exercise 1,000 times and report the
average coefficient in front of algorithmic trading from the second-stage regression and also
the proportion of cases in which this variable was statistically significant at the 10%, 5%,and
1% levels.
INSERT TABLE VII HERE
The results for the placebo test are presented in Table VII. Remarkably, the proportion
of cases with a statistically significant effect of algorithmic trading is always well below the
significance level. To sum up, I confirm that my results indeed have a causal interpretation
rather than the common-trends explanation.
C. Rollout sequence
New algorithmic traders would require some time in order to set up their systems for
algorithmic trading (e.g., colocate their servers and develop software). I expect that such
traders will not appear in the stocks that were rolled out to the NYSE Hybrid Market
first, but rather in the stocks that were rolled out later. New algorithmic traders are likely
20

to rely more heavily on using market orders in their trading strategies because it requires
less experience and less expensive connections to exchange than engaging in market-making
business (i.e., an active usage of limit orders) – for example, Brogaard, Hagstromer, Norden,
and Riordan (2015) document that mainly high-frequency market makers undertake the
colocation upgrade offered by NASDAQ OMX Stockholm voluntarily. Besides that, entry of
the new algorithmic traders to the market increases competition for the same information,
which in turn leads to increased attractiveness of market orders for informed trading (the
competition hypothesis).
INSERT TABLE VIII HERE
The results for the second-stage of the instrumental variable regression (see equation (7))
split by the rollout sequence to the NYSE Hybrid Market are presented in Table VIII. I show
that stocks that were rolled out first experience an increase in the relative importance of the
depth imbalances at the inner levels of the limit order book, but not stocks that were rolled
out later, while the opposite is true for market order imbalances. All in all, my findings are
consistent with the fact that new algorithmic traders are likely to rely on trading strategies
involving market orders and with the fact that increased competition among algorithmic
traders leads to increased relative informativeness of market orders.
D. Lifespan of information
Anecdotal evidence suggests that algorithmic traders rely on short-lived information.
Therefore, I expect that the effects of algorithmic trading on the relative importance of
different order types deteriorates with an increase in the predictive horizon (i.e., the lifespan
of the information).
INSERT TABLE IX HERE
21

I start by providing summary statistics for the relative importance of different order
types for the price discovery process for different predictive horizons: one minute (baseline
analysis), two minutes, and three minutes (see Table IX). Panel A of Table IX presents
the average coefficients of the predictive regressions (see equation (6)) together with the
proportion of stock-days when they were significantly different from zero. Interestingly, I
observe that inventory effects become stronger when I increase the predictive horizon from
one minute to three minutes. In particular, the size of the coefficient in front of lagged
returns increases monotonically, as does the proportion of stock-days when this coefficient is
negative and significant.
Panel B of Table IX presents R2 decomposition averaged across all possible orderings of
the variables as in Lindeman, Merenda, and Gold (1980). I confirm that the importance of
inventory effects increases while moving from a one-minute horizon to a three-minute horizon:
from 22% to 25% of the overall predictive power. If information has a longer lifespan, an
informed trader does not mind waiting longer (conditional on getting a better price), and
therefore an informed trader is likely to submit limit orders deep in the limit order book if
her information lives long enough. In line with this consideration, the importance of market
order imbalances and depth imbalances at the inner levels of the limit order book decreases
from 19.4% to 16.2% and from 30.9% to 23.1%, respectively, while increasing the predictive
horizon. At the same time, the importance of depth imbalances at the middle and outer
levels of the limit order book increases from 13.6% to 17.6% and from 13.2% to 17.2%,
respectively, while increasing the predictive horizon.
INSERT TABLE X HERE
Table X presents the results of the second-stage regressions for the different predictive
horizons. I observe that algorithmic traders become more concerned about their inventory
with an increase in the horizon: the relative importance of the lagged returns in predicting
future price movements increases significantly by 1.43% and 1.14% for the two-minute and
22

three-minute horizons, respectively. The importance of market order imbalances either does
not change or decreases with increase in algorithmic trading activity for the two-minute
and three-minutes horizons, respectively. The importance of depth imbalances at the inner
levels of the limit order book increases with an increase in algorithmic trading activity by
0.59% and 0.66% for the two-minute and three-minute horizons, respectively. However, this
increase is almost three times smaller than the increase observed for the one-minute horizon
(1.92%). If algorithmic traders also collect long-lived information, one can expect that the
relative informativeness of the depth imbalances at the middle and outer levels of the limit
order book will increase with the increasing horizon. However, the relative informativeness
of depth imbalances at the middle and outer levels of the limit order book decreases as well,
suggesting that algorithmic traders are not acquiring long-lived information.
Overall, my findings suggest that market orders and orders at the inner levels of the limit
order book are used for short-lived information, while orders deep in the limit order book are
used for long-lived information. Besides that, algorithmic traders are focused on short-lived
information only.
V. Conclusion
The recent public debates regarding algorithmic traders (and high-frequency traders)
adversely selecting retail investors highlighted the importance of understanding how informed
trading is taking place and how it was affected by the emergence of algorithmic trading.
Motivated by this, I investigate the intraday return predictability from informed market
limit orders around introduction to the NYSE Hybrid Market – a change in market design
that I use as an instrumental variable for algorithmic trading activity.
To the best of my knowledge, I am the first to establish a causal relation between al-
gorithmic trading activity and the relative informativeness of different order types. In line
with the previous literature, I confirm that both limit and market orders are actively used for
23

informed trading. I show that an increase in algorithmic trading activity leads to a shift of
relative informativeness from the limit orders deep in the limit order book to the limit orders
at the inner levels of the limit order book and market orders. The net effect of algorithmic
trading depends on the change in competition between them.
One important implication of my analysis concerns measures of asymmetric information
and/or informed trading (e.g., the PIN measure by Easley, Kiefer, and O’Hara (1996) and
the adverse selection component of bid-ask spread by Glosten and Harris (1988) and Huang
and Stoll (1997)), which have been used widely in studies on market microstructure, asset
pricing, and corporate finance.9 These measures are exclusively based on market orders, and
thus neglect the lion’s share of informed trading on the equity markets – informed trading
via limit orders.
In conclusion, in the market where new algorithmic traders are not likely to enter, any
increase of algorithmic trading should lead to more informed liquidity provision, keeping
constant informed liquidity demand. This fact should not be neglected while analyzing the
adverse selection effects on financial markets as well as regulatory actions targeted at the
important subset of algorithmic traders known as high-frequency traders.
9E.g., Easley, Hvidkjaer, and O’Hara (2002), Vega (2006), Chen, Goldstein, and Jiang (2006), Korajczykand Sadka (2008), Bharath, Pasquariello, and Wu (2008), and Easley, de Prado, and O’Hara (2012).
24
References
Anand, A., S. Chakravarty, and T. Martell (2005). Empirical evidence on the evolution
of liquidity: Choice of market versus limit orders by informed and uninformed traders.
Journal of Financial Markets 8 (3), 288–308.
Avramovic, A., V. Lin, and M. Krishnan (2017). Market structure: We are all high frequency
traders now. Credit Suisse: Trading Strategy Report .
Bae, K.-H., H. Jang, and K. S. Park (2003). Traders choice between limit and market orders:
evidence from nyse stocks. Journal of Financial Markets 6 (4), 517–538.
Baron, M., J. Brogaard, B. Hagstromer, and A. Kirilenko (2017). Risk and return in high-
frequency trading. Forthcoming .
Baruch, S., M. Panayides, and K. Venkataraman (2014). Informed trading before corporate
events: Theory and evidence. Working paper .
Bharath, S. T., P. Pasquariello, and G. Wu (2008). Does asymmetric information drive
capital structure decisions? Review of Financial Studies 22 (8), 3211–3243.
Biais, B. and T. Foucault (2014). HFT and market quality. Bankers, Markets and In-
vestors 128, 5–19.
Biais, B., T. Foucault, and S. Moinas (2015). Equilibrium fast trading. Journal of Financial
Economics 116 (2), 292–313.
Bloomfield, R., M. O’Hara, and G. Saar (2005). The make or take decision in an electronic
market: Evidence on the evolution of liquidity. Journal of Financial Economics 75 (1),
165–199.
Boehmer, E., K. Y. Fong, and J. J. Wu (2015). International evidence on algorithmic trading.
Working paper .
25

Brogaard, J., B. Hagstromer, L. L. Norden, and R. Riordan (2015). Trading fast and slow:
Colocation and market quality. Review of Financial Studies 28 (12), 3407–3443.
Brogaard, J., T. Hendershott, and R. Riordan (2014). High-frequency trading and price
discovery. Review of Financial Studies 27 (8), 2267–2306.
Brogaard, J., T. Hendershott, and R. Riordan (2017). Price discovery without trading:
Evidence from limit orders. Working paper .
Cao, C., O. Hansch, and X. Wang (2009). The information content of an open limit-order
book. Journal of Futures Markets 29 (1), 16–41.
Cenesizoglu, T., G. Dionne, and X. Zhou (2014). Effects of the limit order book on price
dynamics. Working paper .
Chakravarty, S. and C. W. Holden (1995). An integrated model of market and limit orders.
Journal of Financial Intermediation 4 (3), 213–241.
Chen, Q., I. Goldstein, and W. Jiang (2006). Price informativeness and investment sensitivity
to stock price. Review of Financial Studies 20 (3), 619–650.
Chordia, T., R. Roll, and A. Subrahmanyam (2005). Evidence on the speed of convergence
to market efficiency. Journal of Financial Economics 76 (2), 271–292.
Chordia, T., R. Roll, and A. Subrahmanyam (2008). Liquidity and market efficiency. Journal
of Financial Economics 87 (2), 249–268.
Cohen, K. J., S. F. Maier, R. A. Schwartz, and D. K. Whitcomb (1981). Transaction
costs, order placement strategy, and existence of the bid-ask spread. Journal of Political
Economy 89 (2), 287–305.
Cont, R., A. Kukanov, and S. Stoikov (2014). The price impact of order book events. Journal
of Financial Econometrics 12 (1), 47–88.
26
Easley, D., M. M. L. de Prado, and M. O’Hara (2012). Flow toxicity and liquidity in a
high-frequency world. Review of Financial Studies 25 (5), 1457–1493.
Easley, D., S. Hvidkjaer, and M. O’Hara (2002). Is information risk a determinant of asset
returns? Journal of Finance 57 (5), 2185–2221.
Easley, D., N. M. Kiefer, and M. O’Hara (1996). Cream-skimming or profit-sharing? the
curious role of purchased order flow. Journal of Finance 51 (3), 811–833.
ESMA (2014). Economic Report: High frequency trading activity in EU equity markets.
Foucault, T. (1999). Order flow composition and trading costs in a dynamic limit order
market1. Journal of Financial Markets 2 (2), 99–134.
Foucault, T., J. Hombert, and I. Rosu (2016). News trading and speed. Journal of Fi-
nance 71 (1), 335–382.
Foucault, T., O. Kadan, and E. Kandel (2005). Limit order book as a market for liquidity.
Review of Financial Studies 18 (4), 1171–1217.
Foucault, T., R. Kozhan, and W. W. Tham (2017). Toxic arbitrage. Review of Financial
Studies 30 (4), 1053–1094.
Glosten, L. R. (1994). Is the electronic open limit order book inevitable? Journal of
Finance 49 (4), 1127–1161.
Glosten, L. R. and L. E. Harris (1988). Estimating the components of the bid/ask spread.
Journal of financial Economics 21 (1), 123–142.
Glosten, L. R. and P. R. Milgrom (1985). Bid, ask and transaction prices in a specialist
market with heterogeneously informed traders. Journal of Financial Economics 14 (1),
71–100.
27

Goettler, R. L., C. A. Parlour, and U. Rajan (2005). Equilibrium in a dynamic limit order
market. Journal of Finance 60 (5), 2149–2192.
Goettler, R. L., C. A. Parlour, and U. Rajan (2009). Informed traders and limit order
markets. Journal of Financial Economics 93 (1), 67–87.
Hagstromer, B. and L. Norden (2013). The diversity of high-frequency traders. Journal of
Financial Markets 16 (4), 741–770.
Handa, P. and R. A. Schwartz (1996). Limit order trading. Journal of Finance 51 (5),
1835–1861.
Harris, L. E. and V. Panchapagesan (2005). The information content of the limit order book:
evidence from NYSE specialist trading decisions. Journal of Financial Markets 8 (1), 25–
67.
Hendershott, T., C. M. Jones, and A. J. Menkveld (2011). Does algorithmic trading improve
liquidity? Journal of Finance 66 (1), 1–33.
Hendershott, T. and P. C. Moulton (2011). Automation, speed, and stock market quality:
The NYSE’s hybrid. Journal of Financial Markets 14 (4), 568–604.
Hirschey, N. (2013). Do high-frequency traders anticipate buying and selling pressure? Work-
ing paper .
Huang, R. D. and H. R. Stoll (1997). The components of the bid-ask spread: A general
approach. Review of Financial Studies 10 (4), 995–1034.
Jovanovic, B. and A. J. Menkveld (2015). Middlemen in limit-order markets. Working paper .
Kaniel, R. and H. Liu (2006). So what orders do informed traders use? Journal of Busi-
ness 79 (4), 1867–1913.
28
Kavajecz, K. A. and E. R. Odders-White (2001). An examination of changes in specialists
posted price schedules. Review of Financial Studies 14 (3), 681–704.
Kavajecz, K. A. and E. R. Odders-White (2004). Technical analysis and liquidity provision.
Review of Financial Studies 17 (4), 1043–1071.
Korajczyk, R. A. and R. Sadka (2008). Pricing the commonality across alternative measures
of liquidity. Journal of Financial Economics 87 (1), 45–72.
Kozhan, R., M. Moore, and R. Payne (2014). Market order flows, limit order flows and
exchange rate dynamics. Working paper .
Kozhan, R. and M. Salmon (2012). The information content of a limit order book: The case
of an FX market. Journal of Financial Markets 15 (1), 1–28.
Kyle, A. S. (1985). Continuous auctions and insider trading. Econometrica 53 (6), 1315–1335.
Lee, C. and M. J. Ready (1991). Inferring trade direction from intraday data. Journal of
Finance 46 (2), 733–746.
Lindeman, R. H., P. F. Merenda, and R. Z. Gold (1980). Introduction to bivariate and
multivariate analysis. Scott, Foresman, Glenview.
McInish, T. H. and J. Upson (2012). Strategic liquidity supply in a market with fast and
slow traders. Working paper .
Menkhoff, L., C. L. Osler, and M. Schmeling (2010). Limit-order submission strategies under
asymmetric information. Journal of Banking and Finance 34 (11), 2665–2677.
Menkveld, A. J. (2016). The economics of high-frequency trading: Taking stock. Annual
Review of Financial Economics (8).
29
Menkveld, A. J. and M. A. Zoican (2017). Need for speed? Exchange latency and liquidity.
The Review of Financial Studies 30 (4), 1188–1228.
O’Hara, M. (2015). High frequency market microstructure. Journal of Financial Eco-
nomics 116 (2), 257–270.
Parlour, C. A. (1998). Price dynamics in limit order markets. Review of Financial Stud-
ies 11 (4), 789–816.
Putnins, T. J. and D. Michayluk (2015). Liquidity provision in limit order book markets.
Working paper .
Rosch, D. M., A. Subrahmanyam, and M. A. Van Dijk (2016). The dynamics of market
efficiency. Review of Financial Studies 30 (4), 1151–1187.
Rosu, I. (2009). A dynamic model of the limit order book. Review of Financial Stud-
ies 22 (11), 4601–4641.
Rosu, I. (2016). Liquidity and information in order driven markets. Working paper .
Seppi, D. J. (1997). Liquidity provision with limit orders and a strategic specialist. Review
of Financial Studies 10 (1), 103–150.
Swan, P. and P. J. Westerholm (2006). Market architecture and global exchange efficiency:
One design need not fit all stock sizes. Working paper .
Vega, C. (2006). Stock price reaction to public and private information. Journal of Financial
Economics 82 (1), 103–133.
Wuyts, G. (2008). The impact of liquidity shocks through the limit order book. Working
paper .
30
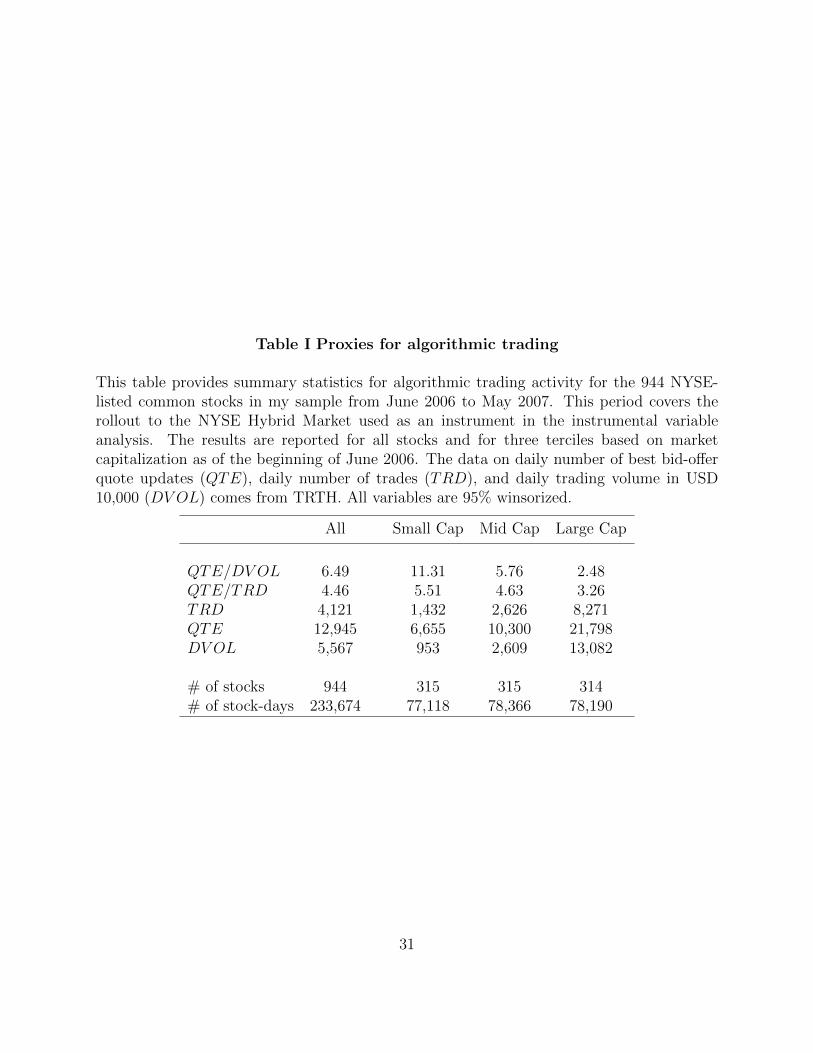
Table I Proxies for algorithmic trading
This table provides summary statistics for algorithmic trading activity for the 944 NYSE-listed common stocks in my sample from June 2006 to May 2007. This period covers therollout to the NYSE Hybrid Market used as an instrument in the instrumental variableanalysis. The results are reported for all stocks and for three terciles based on marketcapitalization as of the beginning of June 2006. The data on daily number of best bid-offerquote updates (QTE), daily number of trades (TRD), and daily trading volume in USD10,000 (DV OL) comes from TRTH. All variables are 95% winsorized.
All Small Cap Mid Cap Large Cap
QTE/DV OL 6.49 11.31 5.76 2.48QTE/TRD 4.46 5.51 4.63 3.26TRD 4,121 1,432 2,626 8,271QTE 12,945 6,655 10,300 21,798DV OL 5,567 953 2,609 13,082
# of stocks 944 315 315 314# of stock-days 233,674 77,118 78,366 78,190
31

Table II Informational content of order types
This table provides the results of intraday return predictability regressions (see equation (6)) for the 944 NYSE-listed commonstocks in my sample from June 2006 to May 2007. This period covers the rollout to NYSE Hybrid Market used as an instrumentin the instrumental variable analysis. Panel A reports average coefficient estimates across stock-days and proportion of thestock-days on which coefficients were significantly different from zero at a 10% significance level separately for positive andnegative coefficients. Panel B reports the results of the R2 decomposition (average across all possible orderings). The resultsare reported for all stocks and for three terciles based on market capitalization as of the beginning of June 2006. The data ontrades, best bid-offer quotes, and NYSE limit order book snapshots comes from TRTH. All variables are 95% winsorized.
Panel A: Coefficients from intraday regressions
All% significant
Small Cap% significant
Mid Cap% significant
Large Cap% significant
Pos Neg Pos Neg Pos Neg Pos Neg
RET -0.003 15.7% 16.4% -0.016 12.2% 19.0% 0.004 17.6% 15.4% 0.004 17.2% 14.8%MOIB 0.596 27.3% 0.7% 0.752 27.6% 0.7% 0.531 27.1% 0.7% 0.507 27.3% 0.7%INNER 1.779 46.5% 0.7% 2.631 48.6% 0.6% 1.718 51.5% 0.6% 1.000 39.3% 0.9%MIDDLE 0.304 12.7% 6.1% 0.428 13.0% 5.3% 0.275 13.0% 6.3% 0.210 12.2% 6.7%OUTER -0.143 6.7% 9.3% -0.170 6.4% 8.5% -0.169 6.5% 9.8% -0.091 7.0% 9.4%
Panel B: R2 decomposition from intraday regressions
All Small Cap Mid Cap Large Cap
Adjusted R2 2.5% 2.8% 2.7% 2.0%
RET 22.0% 21.3% 21.6% 23.1%MOIB 19.4% 19.1% 18.4% 20.5%LOB 57.6% 58.6% 59.0% 55.2%INNER 30.9% 32.5% 33.0% 27.0%MIDDLE 13.6% 13.3% 13.1% 14.3%OUTER 13.2% 12.8% 12.8% 13.9%
# of stocks 944 315 315 314# of stock-days 233,674 77,118 78,366 78,190
32
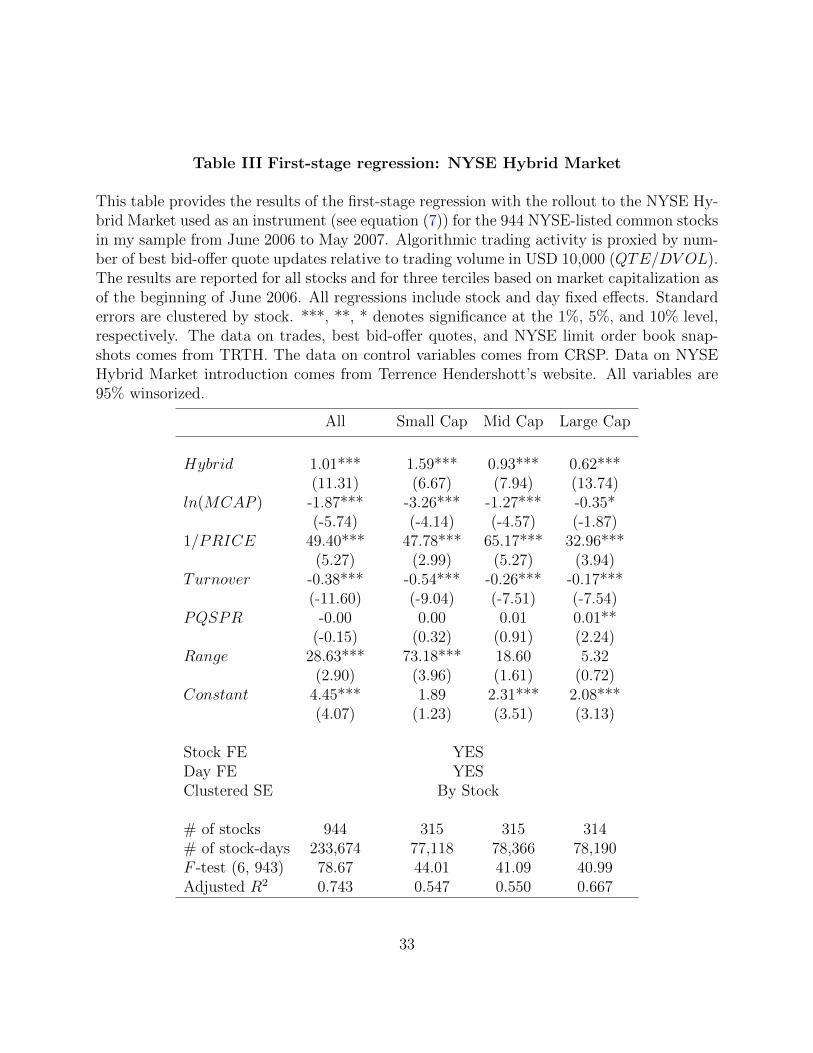
Table III First-stage regression: NYSE Hybrid Market
This table provides the results of the first-stage regression with the rollout to the NYSE Hy-brid Market used as an instrument (see equation (7)) for the 944 NYSE-listed common stocksin my sample from June 2006 to May 2007. Algorithmic trading activity is proxied by num-ber of best bid-offer quote updates relative to trading volume in USD 10,000 (QTE/DV OL).The results are reported for all stocks and for three terciles based on market capitalization asof the beginning of June 2006. All regressions include stock and day fixed effects. Standarderrors are clustered by stock. ***, **, * denotes significance at the 1%, 5%, and 10% level,respectively. The data on trades, best bid-offer quotes, and NYSE limit order book snap-shots comes from TRTH. The data on control variables comes from CRSP. Data on NYSEHybrid Market introduction comes from Terrence Hendershott’s website. All variables are95% winsorized.
All Small Cap Mid Cap Large Cap
Hybrid 1.01*** 1.59*** 0.93*** 0.62***(11.31) (6.67) (7.94) (13.74)
ln(MCAP ) -1.87*** -3.26*** -1.27*** -0.35*(-5.74) (-4.14) (-4.57) (-1.87)
1/PRICE 49.40*** 47.78*** 65.17*** 32.96***(5.27) (2.99) (5.27) (3.94)
Turnover -0.38*** -0.54*** -0.26*** -0.17***(-11.60) (-9.04) (-7.51) (-7.54)
PQSPR -0.00 0.00 0.01 0.01**(-0.15) (0.32) (0.91) (2.24)
Range 28.63*** 73.18*** 18.60 5.32(2.90) (3.96) (1.61) (0.72)
Constant 4.45*** 1.89 2.31*** 2.08***(4.07) (1.23) (3.51) (3.13)
Stock FE YESDay FE YESClustered SE By Stock
# of stocks 944 315 315 314# of stock-days 233,674 77,118 78,366 78,190F -test (6, 943) 78.67 44.01 41.09 40.99Adjusted R2 0.743 0.547 0.550 0.667
33

Table IV Second-stage regression
This table provides the results of the second-stage regression with the R2 decomposition asdependent variables and with the rollout to the NYSE Hybrid Market used as an instrument(see equation (7)) for the 944 NYSE-listed common stocks in my sample from June 2006 toMay 2007. Algorithmic trading activity is proxied by number of best bid-offer quote updatesrelative to trading volume in USD 10,000 (QTE/DV OL). All regressions include stock andday fixed effects. Standard errors are clustered by stock. ***, **, * denotes significanceat the 1%, 5%, and 10% level, respectively. The data on trades, best bid-offer quotes, andNYSE limit order book snapshots comes from TRTH. The data on control variables comesfrom CRSP. Data on NYSE Hybrid Market introduction comes from Terrence Hendershott’swebsite. All variables are 95% winsorized.
Adjusted R2 R2 decomposition
RET MOIB INNER MIDDLE OUTER
QTEDV OL
0.31*** 0.32 0.68*** 1.92*** -1.10*** -1.71***(6.64) (1.06) (2.58) (4.88) (-4.77) (-6.96)
ln(MCAP ) 0.41** 3.16*** -2.20** 2.88** -1.32* -2.44***(2.02) (3.34) (-2.45) (2.05) (-1.70) (-2.71)
1/PRICE -9.37* 10.07 -25.07 -87.73** 48.74** 49.97**(-1.90) (0.39) (-1.11) (-2.46) (2.40) (2.03)
Turnover 0.12*** 0.22 0.42*** 0.63*** -0.47*** -0.76***(4.98) (1.50) (3.31) (3.11) (-4.08) (-6.31)
PQSPR -0.00 0.03 0.01 -0.01 -0.02 0.00(-0.61) (1.30) (0.59) (-0.50) (-1.61) (0.12)
Range -28.03*** 6.31 -43.90 -157.45*** 71.76*** 110.16***(-5.52) (0.22) (-1.61) (-3.88) (3.33) (4.45)
Constant 1.35** 12.62*** 25.28*** 23.72*** 16.60*** 20.92***(2.13) (4.31) (9.24) (5.42) (6.88) (7.29)
Stock FE YESDay FE YESClustered SE By Stock
# of stocks 944# of stock-days 233,674
34

Table V Second stage regression by market capitalization
This table provides the results of the second-stage regression with the R2 decomposition as dependent variables and with therollout to the NYSE Hybrid Market used as an instrument (see equation (7)) for the 944 NYSE-listed common stocks in mysample from June 2006 to May 2007. Algorithmic trading activity is proxied by the number of best bid-offer quote updatesrelative to trading volume in USD 10,000 (QTE/DV OL). For brevity, I report only the coefficients in front of the algorithmictrading proxy for three terciles based on market capitalization as of the beginning of June 2006. All regressions include stockand day fixed effects. Standard errors are clustered by stock. ***, **, * denotes significance at the 1%, 5%, and 10% level,respectively. The data on trades, best bid-offer quotes, and NYSE limit order book snapshots comes from TRTH. The data oncontrol variables comes from CRSP. Data on NYSE Hybrid Market introduction comes from Terrence Hendershott’s website.All variables are 95% winsorized.
Adjusted R2 R2 decomposition# of stocks # of stock-days
RET MOIB INNER MIDDLE OUTER
Small Cap0.15*** 0.37 0.64** 0.63 -0.70*** -0.88*** 315 77,118(3.15) (1.08) (2.08) (1.51) (-2.89) (-3.38)
Mid Cap0.33*** -0.29 0.96** 1.86** -1.37*** -1.04*** 315 78,366(3.99) (-0.49) (2.04) (2.43) (-3.15) (-2.85)
Large cap0.56*** 0.60 0.94 4.29*** -1.42** -4.24*** 314 78,190(4.92) (0.78) (1.27) (4.80) (-2.27) (-7.01)
Controls YESStock FE YESDay FE YESClustered SE By Stock
35

Table VI Second stage regression: another proxy for algorithmic trading activity
This table provides the results of the second-stage regression with the R2 decomposition asdependent variables and with the rollout to the NYSE Hybrid Market used as an instrument(see equation (7)) for the 944 NYSE-listed common stocks in my sample from June 2006to May 2007. Algorithmic trading activity is proxied by the number of best bid-offer quoteupdates relative to number of transactions (QTE/TRD). All regressions include stock andday fixed effects. Standard errors are clustered by stock. ***, **, * denotes significanceat the 1%, 5%, and 10% level, respectively. The data on trades, best bid-offer quotes, andNYSE limit order book snapshots comes from TRTH. The data on control variables comesfrom CRSP. Data on NYSE Hybrid Market introduction comes from Terrence Hendershott’swebsite. All variables are 95% winsorized.
Adjusted R2 R2 decomposition
RET MOIB INNER MIDDLE OUTER
QTETRD
1.09*** 1.11 2.36** 6.70*** -3.84*** -5.95***(5.66) (1.06) (2.48) (4.53) (-4.32) (-5.86)
ln(MCAP ) -0.26 2.48*** -3.67*** -1.26 1.05 1.24(-0.93) (3.15) (-4.70) (-0.77) (1.05) (1.13)
1/PRICE 6.60 26.19 9.40 9.98 -7.25 -36.77(1.14) (1.23) (0.48) (0.28) (-0.35) (-1.49)
Turnover 0.17*** 0.28 0.53*** 0.95*** -0.65*** -1.04***(4.96) (1.45) (3.15) (3.46) (-4.04) (-5.72)
PQSPR -0.01** 0.02 -0.00 -0.06* 0.00 0.04*(-2.17) (0.90) (-0.24) (-1.80) (0.06) (1.87)
Range -20.05*** 14.36 -26.67 -108.62** 43.78* 66.81**(-3.48) (0.54) (-0.97) (-2.51) (1.92) (2.23)
Constant 0.22 11.48*** 22.84*** 16.81*** 20.56*** 27.05***(0.22) (3.11) (6.58) (2.70) (5.35) (6.29)
Stock FE YESDay FE YESClustered SE By Stock
# of stocks 944# of stocks 233,674674
36

Table VII Second stage regression: Placebo test
This table provides the results of the second-stage regression with the R2 decomposition asdependent variables for 1,000 repetitions of the random assignment of rollout to the NYSEHybrid Market used as an instrument (see equation (7)) for the 944 NYSE-listed commonstocks in our sample from June 2006 to May 2007. In particular, this table reports theaverage coefficient in front of the proxy for algorithmic trading activity, and the proportionof significant cases at the 1%, 5%, and 10% levels. Algorithmic trading activity is proxiedby the number of best bid-offer quote updates relative to trading volume in USD 10,000(QTE/DV OL). All regressions include stock and day fixed effects. Standard errors areclustered by stock. The data on trades, best bid-offer quotes, and NYSE limit order booksnapshots comes from TRTH. The data on control variables comes from CRSP. Data onNYSE Hybrid Market introduction comes from Terrence Hendershott’s website. All variablesare 95% winsorized.
Adjusted R2 R2 decomposition
RET MOIB INNER MIDDLE OUTER
QTEDV OL
0.43 -1.23 -1.13 3.58 -1.94 0.67
1% 0.2% 0.0% 0.0% 0.0% 0.1% 0.3%5% 1.2% 0.4% 0.1% 0.4% 0.8% 1.9%10% 3.2% 2.3% 0.5% 2.3% 1.9% 5.9%
Controls YESStock FE YESDay FE YESClustered SE By Stock
# of stocks 944Observations 233,674
37
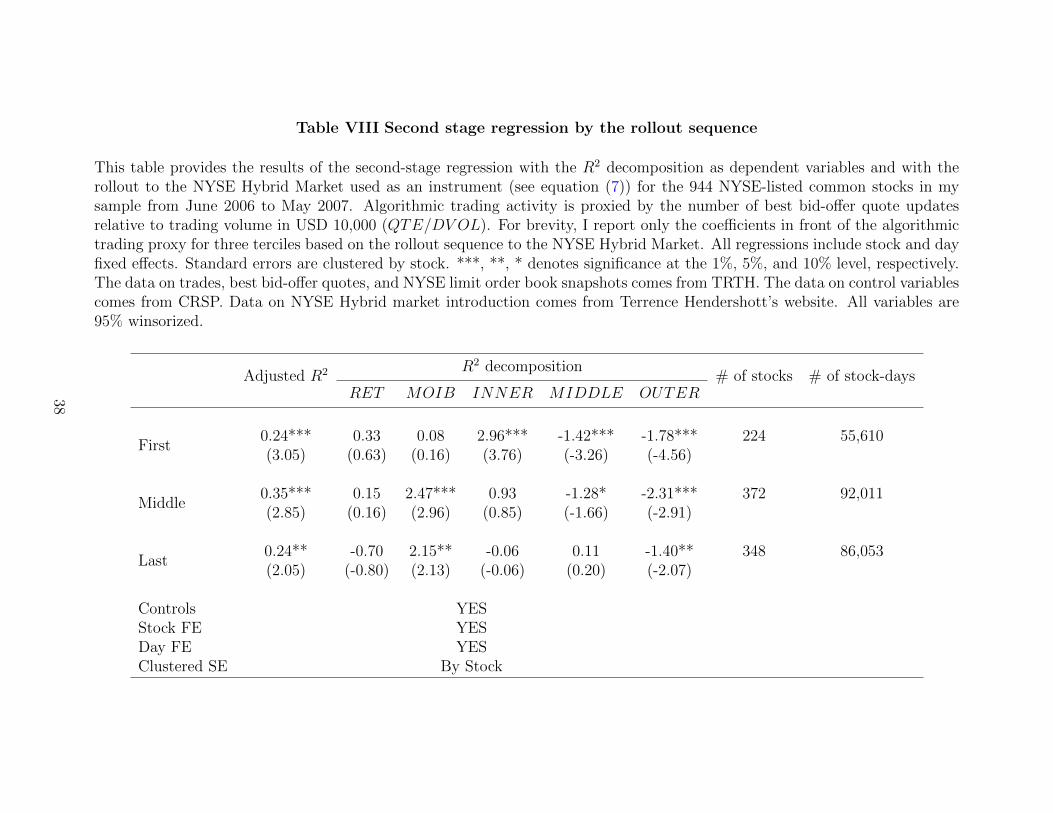
Table VIII Second stage regression by the rollout sequence
This table provides the results of the second-stage regression with the R2 decomposition as dependent variables and with therollout to the NYSE Hybrid Market used as an instrument (see equation (7)) for the 944 NYSE-listed common stocks in mysample from June 2006 to May 2007. Algorithmic trading activity is proxied by the number of best bid-offer quote updatesrelative to trading volume in USD 10,000 (QTE/DV OL). For brevity, I report only the coefficients in front of the algorithmictrading proxy for three terciles based on the rollout sequence to the NYSE Hybrid Market. All regressions include stock and dayfixed effects. Standard errors are clustered by stock. ***, **, * denotes significance at the 1%, 5%, and 10% level, respectively.The data on trades, best bid-offer quotes, and NYSE limit order book snapshots comes from TRTH. The data on control variablescomes from CRSP. Data on NYSE Hybrid market introduction comes from Terrence Hendershott’s website. All variables are95% winsorized.
Adjusted R2 R2 decomposition# of stocks # of stock-days
RET MOIB INNER MIDDLE OUTER
First0.24*** 0.33 0.08 2.96*** -1.42*** -1.78*** 224 55,610(3.05) (0.63) (0.16) (3.76) (-3.26) (-4.56)
Middle0.35*** 0.15 2.47*** 0.93 -1.28* -2.31*** 372 92,011(2.85) (0.16) (2.96) (0.85) (-1.66) (-2.91)
Last0.24** -0.70 2.15** -0.06 0.11 -1.40** 348 86,053(2.05) (-0.80) (2.13) (-0.06) (0.20) (-2.07)
Controls YESStock FE YESDay FE YESClustered SE By Stock
38
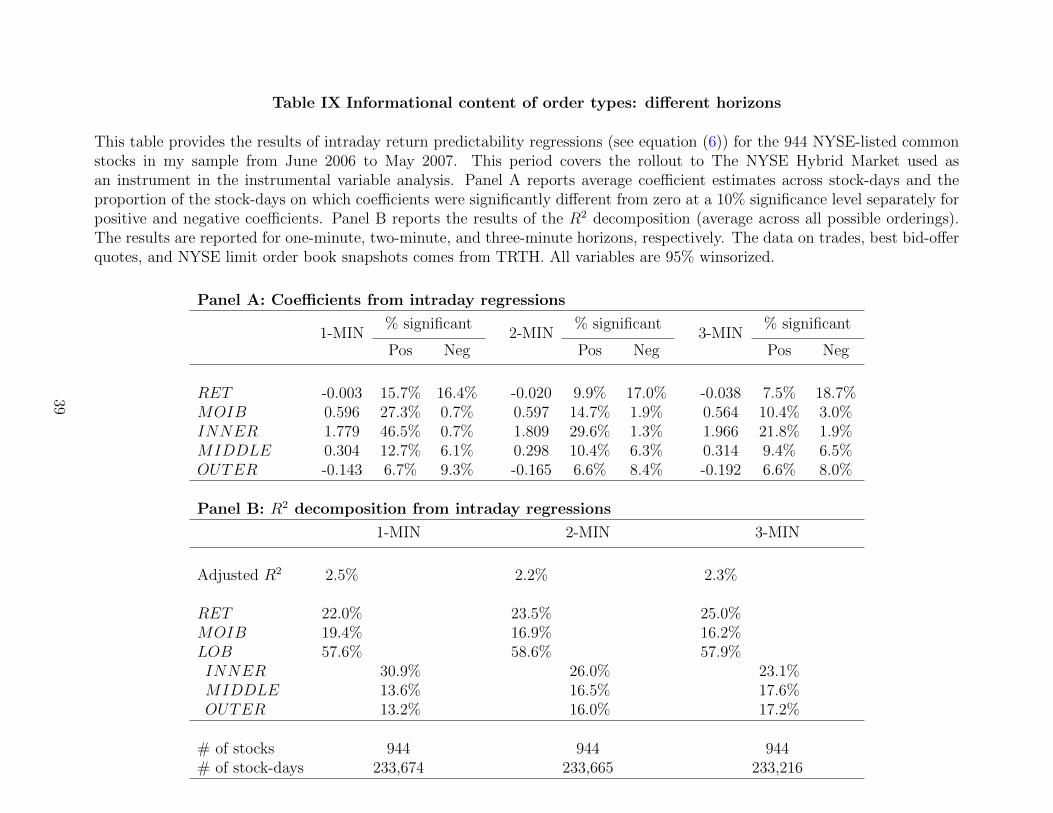
Table IX Informational content of order types: different horizons
This table provides the results of intraday return predictability regressions (see equation (6)) for the 944 NYSE-listed commonstocks in my sample from June 2006 to May 2007. This period covers the rollout to The NYSE Hybrid Market used asan instrument in the instrumental variable analysis. Panel A reports average coefficient estimates across stock-days and theproportion of the stock-days on which coefficients were significantly different from zero at a 10% significance level separately forpositive and negative coefficients. Panel B reports the results of the R2 decomposition (average across all possible orderings).The results are reported for one-minute, two-minute, and three-minute horizons, respectively. The data on trades, best bid-offerquotes, and NYSE limit order book snapshots comes from TRTH. All variables are 95% winsorized.
Panel A: Coefficients from intraday regressions
1-MIN% significant
2-MIN% significant
3-MIN% significant
Pos Neg Pos Neg Pos Neg
RET -0.003 15.7% 16.4% -0.020 9.9% 17.0% -0.038 7.5% 18.7%MOIB 0.596 27.3% 0.7% 0.597 14.7% 1.9% 0.564 10.4% 3.0%INNER 1.779 46.5% 0.7% 1.809 29.6% 1.3% 1.966 21.8% 1.9%MIDDLE 0.304 12.7% 6.1% 0.298 10.4% 6.3% 0.314 9.4% 6.5%OUTER -0.143 6.7% 9.3% -0.165 6.6% 8.4% -0.192 6.6% 8.0%
Panel B: R2 decomposition from intraday regressions
1-MIN 2-MIN 3-MIN
Adjusted R2 2.5% 2.2% 2.3%
RET 22.0% 23.5% 25.0%MOIB 19.4% 16.9% 16.2%LOB 57.6% 58.6% 57.9%INNER 30.9% 26.0% 23.1%MIDDLE 13.6% 16.5% 17.6%OUTER 13.2% 16.0% 17.2%
# of stocks 944 944 944# of stock-days 233,674 233,665 233,216
39

Table X Second stage regression for different horizons
This table provides the results of the second-stage regression with the R2 decomposition as dependent variables and with therollout to the NYSE Hybrid Market used as an instrument (see equation (7)) for the 944 NYSE-listed common stocks in mysample from June 2006 to May 2007. Algorithmic trading activity is proxied by the number of best bid-offer quote updatesrelative to trading volume in USD 10,000 (QTE/DV OL). For brevity, I report only the coefficients in front of the algorithmictrading proxy for one-minute, two-minute, and three-minute horizons, respectively. All regressions include stock and day fixedeffects. Standard errors are clustered by stock. ***, **, * denotes significance at the 1%, 5%, and 10% level, respectively. Thedata on trades, best bid-offer quotes, and NYSE limit order book snapshots comes from TRTH. The data on control variablescomes from CRSP. Data on NYSE Hybrid Market introduction comes from Terrence Hendershott’s website. All variables are95% winsorized.
Adjusted R2 R2 decomposition# of stocks # of stock-days
RET MOIB INNER MIDDLE OUTER
1-MIN0.31*** 0.32 0.68*** 1.92*** -1.10*** -1.71*** 944 233,674(6.64) (1.06) (2.58) (4.88) (-4.77) (-6.96)
2-MIN0.44*** 1.43*** -0.20 0.59* -0.63*** -1.15*** 944 233,665(7.64) (4.49) (-0.88) (1.72) (-2.59) (-4.74)
3-MIN0.50*** 1.14*** -0.59** 0.66** -0.19 -0.96*** 944 233,216(7.61) (3.23) (-2.53) (2.21) (-0.81) (-3.97)
Controls YESStock FE YESDay FE YESClustered SE By Stock
40

Figure 1. NYSE Hybrid Market introduction
This figure shows the staggered introduction to the NYSE Hybrid Market for the 944 NYSE-
listed common stocks in my sample from June 2006 to May 2007. I split stocks into terciles
based on market capitalization as of the beginning of June 2006. Tercile 1 corresponds
to small stocks. Tercile 3 corresponds to large stocks. Data on NYSE Hybrid Market
introduction comes from Terrence Hendershott’s website.
41
Related Documents