ELSEVIER Electroencephalography and clinical Neurophysiology 94 (1995) 191-220 Intracerebral potentials to rare target and distractor auditory and visual stimuli. I. Superior temporal plane and parietal lobe Eric Halgren a,b,*, Patrick Baudena b, Jeffrey M. Clarke a,1, Gary Heit b,2, Catherine Li6geois a,b, Patrick Chauvel a,b, Antonino Musolino a,b,3 a INSERM CJF 90-12, Clinique Neurologique, CHRU Pontchaillou, Rennes 35033, France b INSERM U 97, Service de Neurochirurgie, H~pital Sainte-Anne, Paris 75014, France Accepted for publication: 19 September 1994 Abstract Event-related potentials were recorded from 537 sites in the superior temporal plane and parietal lobe of 41 patients. Depth electrodes were implanted to localize seizure origin prior to surgical treatment. Subjects received an auditory discrimination task with target and non-target rare stimuli ("stanAard oddball paradigm"). In some cases, the target, distracting and frequent tones were completely balanced across blocks for pitch and volume. Variants included an analogous visual discrimination task, or auditory tasks where the rare target event was the omission of a tone, or the repetition of a tone within a series of alternating tones. In some subjects, the same auditory stimuli were delivered but the patient ignored them while reading. Three general response p~ttterns could be distinguished on the basis of their wave forms, latencies and task correlates. First, potentials apparently related to rarity per se, as opposed to differences in sensory characteristics, or in habituation, were observed in the posterior superior temporal plane, beginning with a large positivity superimposed on early components. This positivity peaked at 150 msec after stimulus onset and inverted in sites superior to the Sylvian fissure. Subsequent components could be large, focal and/or inverting in polarity, and usually included a positivity at 230 msec and a negativity at 330 msec. All components in this area were specific to the auditory modality. Second, in the posterior cingulate and supramarginal gyri, a sharp triphasic negative-positive-negative wave form with peaks at about 210-300-400 msec was observed. This wave form was of relatively small amplitude and diffuse, and seldom inverted in polarity. It was multimodal but most prominent to auditory stimuli, appeared to remain when the stimuli were ignored, and was not apparent to repeated words and faces. Third, a broad, often monophasic, wave form peaking at about 380 msec was observed in the superior parietal lobe, similar to that which has been recorded in the hippocampus. This wave form could be of large amplitude, often highly focal, and could invert over short distances. It was equal to visual and auditory stimuli and was also evoked by repeating words and faces. The early endogenous activity in auditory cortex may embody activity that is antecedent to the other patterns in multimodal association cortex. The "triphasic" pattern may embody a diffuse non-specific orienting response that is also reflected in the scalp P3a. The later broad pattern may embody the cognitive closure that is also reflected in the scalp P3b or late positive component. Keywords: P3; N2; Mismatch negativity; Orienting; Generators; Auditory cortex; Cingulate gyms; Supramarginal gyrus * Corresponding author. Tel.: 99 28 43 21; Poste: 85199; Fax: 99 28 41 32. Also at the Dept. of Psychiatry and Brain Research Institute, UCLA; and the Regional Epilepsy Center, Wadsworth Veterans Affairs Medical Center, Los Angeles, CA 90073, USA. 1 Also at the Dept. of Psychology, University of North Texas. 2 Also at the Dept. of Neurosargery, Stanford University Medical School, Stanford, CA, USA. 3 Also at the Istituto Scienze Neurologiche e Neurochirurgiche, Neurochirurgia 2, Messina, Italy. 0013-4694/95/$09.50 © 1995 Elsevier Science Ireland Ltd. All rights reserved SSDI 0013-4694(94)00259.-2 EEG 94510

Welcome message from author
This document is posted to help you gain knowledge. Please leave a comment to let me know what you think about it! Share it to your friends and learn new things together.
Transcript
ELSEVIER Electroencephalography and clinical Neurophysiology 94 (1995) 191-220
Intracerebral potentials to rare target and distractor auditory and visual stimuli. I. Superior temporal plane and parietal lobe
Eric Halgren a,b,*, Patrick Baudena b, Jeffrey M. Clarke a,1, Gary Heit b,2, Catherine Li6geois a,b, Patrick Chauvel a,b, Antonino Musolino a,b,3
a INSERM CJF 90-12, Clinique Neurologique, CHRU Pontchaillou, Rennes 35033, France b INSERM U 97, Service de Neurochirurgie, H~pital Sainte-Anne, Paris 75014, France
Accepted for publication: 19 September 1994
Abstract
Event-related potentials were recorded from 537 sites in the superior temporal plane and parietal lobe of 41 patients. Depth electrodes were implanted to localize seizure origin prior to surgical treatment. Subjects received an auditory discrimination task with target and non-target rare stimuli ("stanAard oddball paradigm"). In some cases, the target, distracting and frequent tones were completely balanced across blocks for pitch and volume. Variants included an analogous visual discrimination task, or auditory tasks where the rare target event was the omission of a tone, or the repetition of a tone within a series of alternating tones. In some subjects, the same auditory stimuli were delivered but the patient ignored them while reading.
Three general response p~ttterns could be distinguished on the basis of their wave forms, latencies and task correlates. First, potentials apparently related to rarity per se, as opposed to differences in sensory characteristics, or in habituation, were observed in the posterior superior temporal plane, beginning with a large positivity superimposed on early components. This positivity peaked at 150 msec after stimulus onset and inverted in sites superior to the Sylvian fissure. Subsequent components could be large, focal a n d / o r inverting in polarity, and usually included a positivity at 230 msec and a negativity at 330 msec. All components in this area were specific to the auditory modality. Second, in the posterior cingulate and supramarginal gyri, a sharp triphasic negative-positive-negative wave form with peaks at about 210-300-400 msec was observed. This wave form was of relatively small amplitude and diffuse, and seldom inverted in polarity. It was multimodal but most prominent to auditory stimuli, appeared to remain when the stimuli were ignored, and was not apparent to repeated words and faces. Third, a broad, often monophasic, wave form peaking at about 380 msec was observed in the superior parietal lobe, similar to that which has been recorded in the hippocampus. This wave form could be of large amplitude, often highly focal, and could invert over short distances. It was equal to visual and auditory stimuli and was also evoked by repeating words and faces.
The early endogenous activity in auditory cortex may embody activity that is antecedent to the other patterns in multimodal association cortex. The "triphasic" pattern may embody a diffuse non-specific orienting response that is also reflected in the scalp P3a. The later broad pattern may embody the cognitive closure that is also reflected in the scalp P3b or late positive component.
Keywords: P3; N2; Mismatch negativity; Orienting; Generators; Auditory cortex; Cingulate gyms; Supramarginal gyrus
* Corresponding author. Tel.: 99 28 43 21; Poste: 85199; Fax: 99 28 41 32. Also at the Dept. of Psychiatry and Brain Research Institute, UCLA; and the Regional Epilepsy Center, Wadsworth Veterans Affairs Medical Center, Los Angeles, CA 90073, USA.
1 Also at the Dept. of Psychology, University of North Texas. 2 Also at the Dept. of Neurosargery, Stanford University Medical School, Stanford, CA, USA. 3 Also at the Istituto Scienze Neurologiche e Neurochirurgiche, Neurochirurgia 2, Messina, Italy.
0013-4694/95/$09.50 © 1995 Elsevier Science Ireland Ltd. All rights reserved SSDI 0013-4694(94)00259.-2 EEG 94510
192 E. Halgren et al. / Electroencephalography and clinical Neurophysiology 94 (1995) 191-220
1. I n t r o d u c t i o n
Across a wide variety of stimulus-response paradigms, a consistent series of generic components may be identi- fied in the human scalp-recorded evoked potential (EP) on the basis of their scalp polarity and topography, relative latency, and general cognitive correlates. Strictly sensory EP components are followed by the "vertex N1-P2" (N~i~it~inen and Picton 1986b), a negativity at around 200 msec (the "N2") , followed by a positivity ("P300" or " P 3 " ) and slow wave (SW) (Halgren 1990). Each of these components has in turn been divided into a series of subcomponents based on topography and task correlates. Identification of the generators of these potentials should greatly increase their utility for tracking the neural activity of particular brain areas during cognition, and for probing their dysfunction in disease.
The earliest components in the auditory modality that are determined mainly by cognitive variables are a series of "process ing negativit ies" including the mismatch neg- ativity (MMN or N2a) and the N2b (Ritter et al. 1984; N~i~it~inen and Picton 1986a; Pritchard et al. 1988). The M M N is evoked by a stimulus that (classically) does not match preceding stimuli on simple sensory characteristics, even if that stimulus is neither attended nor detected (N~i~it~inen et al. 1982; N~i~it~inen and Gaillard 1983). Scalp EEG (Scherg et al. 1989) and MEG (Hari 1989) topogra- phies suggest generation mainly in the posterior superior temporal plane (pSTP). The N2b is evoked by attended and processed stimuli. It has a modality-specific topogra- phy, and it has been proposed that it reflects activity in both sensory association and multimodal association cor- tices (Renault et al. 1982; N~i~it~inen and Picton 1986a).
The P3 has a widespread scalp topography with no clear modality specificity, consistent with either widespread cortical generators, or a deep generator, or both (Vaughan et al. 1980). Differences in P3 topography across single trials, subjects or tasks have suggested that the P3 may consist of a fronto-central P3a relatively enhanced to non- target rare or novel stimuli, and a later parietal P3b enhanced by certainty of target detection (Squires et al. 1975; Snyder and Hillyard 1976). Although multiple scalp N2s and P3s can thus be identified, their task correlates and scalp topographies overlap substantially, posing the question of to what degree these scalp "components" are produced by distinct brain generators with overlapping propagations, vs. with overlapping task correlates.
Extracerebral mapping of evoked magnetic fields corre- lated with the scalp P3 have suggested that its generator lies in either the medial temporal lobe (MTL; Okada et al. 1983; Lewine et al. 1989), in the association cortex spe- cific to the modality of stimulation (Richer et al. 1983), or in specific sensory association cortex and then the thala- mus (Rogers et al. 1991). In the auditory modality, this suggests that the postero-superior temporal lobe may con-
tribute to the P3, a suggestion supported by the reduced auditory P3b observed after lesions to the temporo-parietal junction (Knight 1990). Conversely, parietal lesions abol- ish the N2 to targets but do not affect P3b (Knight et al. 1989). However, these effects are predominantly bilateral even though the lesions are unilateral, suggesting that at least some of the effects could be ascribed to the disrup- tion of necessary neural calculations antecedent to the generator. Furthermore, in cats, lesions of the specific auditory cortex or of the entire association cortex did not significantly affect skull " P 3 " amplitude (Buchwald 1990).
A more direct method for localizing EP generating structures is to record within the candidate structures them- selves, using depth electrodes implanted in order to define surgical treatment of intractable epilepsy. In contrast to the indirect inferences of generator localization from scalp topography, lesion and pharmacological studies, and ani- mal models, direct and definitive localization is sometimes possible using human intracranial recording from im- planted electrodes. That is, if depth recording demonstrates large local voltage gradients in a particular structure, and if these gradients are absent from surrounding structures, then there is no alternative to the conclusion that one is recording from a local generator. Note that even large local potentials might not propagate to the scalp. However, if depth potentials are found to be highly correlated with a scalp component, then one can still infer the localization of brain activation from scalp recording, at least in normal subjects. Intracranial recording is for the most part per- formed only in subjects with rather severe epilepsy, raising the issue of pathological hypo- or hyper-responsiveness. Although phenomena of both types may be observed (Squires et al. 1983; Altafullah and Halgren 1988; Wood et al. 1988; Meador et al. 1989; Puce et al. 1989; Clarke et al. 1993), they are minimized by selecting for analysis time periods and brain sites relatively free of epileptiform activ- ity, and by accepting only phenomena which appear to be constant across patients with widely varying brain pathol- ogy and anticonvulsant medications.
Using depth electrodes, a very large P3b generator has been localized to the hippocampal formation, but lesion studies indicate that this potential is unlikely to be the main generator of the scalp P3 (Halgren et al. 1986; Stapleton et al. 1987a; Polich and Squire 1993). Few studies have recorded P3 generators outside of the MTL. Evidence for a diffuse non-specific N 2 a / P 3 a / S W genera- tor in cingulate, frontal, lateral temporal and parietal cor- tices is found in the moderately large potentials and mild voltage gradients recorded in these areas (Wood and Mc- Carthy 1985; Stapleton and Halgren 1987; Alain et al. 1989; Smith et al. 1990). Case studies have reported possible polarity-inverting P3s in the parietal lobe (Kiss et al. 1989) and posterior cingulate (Ojemann and Lettich 1983). These extratemporal potentials commonly have
E. Halgren et al. / Electroencephalography and clinical Neurophysiology 94 (1995) 191-220 193
shorter latencies than those seen at the scalp, whereas the MTL-P3 4 usually has a longer latency than the scalp P3, suggesting independent generating systems. However, these latency differences could in part be due to overlap with other non-P3 components (Halgren 1990).
In summary, depth recording supported by other data clearly demonstrates that a P3 is locally generated in the hippocampus. Furthermore, scalp recording after hip- pocampal lesions clearly implies the existence of other P3 generators. The location of these generators has been suggested by depth recording outside the MTL, but such recordings have been limiited in scope. Since depth elec- trodes are only implanted in order to localize the epilepto- genic zone so as to define subsequent surgical therapy, and inasmuch as the most common form of partial epilepsy (as well as the one with the highest rate of surgical cures) is that arising in the MTL, the most complete investigations of P3 generators have concentrated on that region (Halgren et al. 1986). Since depth electrode recording is ineffective for localizing generators that are distant from the recording contacts, this has significantly limited previous studies. The current series of studies attempts to partially redress this difficulty, by presenting the results of a relatively large number of recordings during a variety of tasks (Baudena et al. 1995; Halgren et al. 1995). This paper concentrates on the endogenous potentials evoked by simple stimuli in the posterior cortex, with particular emphasis on the superior temporal plane and parietal lobe. Multiple components with multiple generators for the N2 and P3 (as well as earlier and later components) are described. Although all of these components are evoked by attended rare target or distractor auditory stimuli, they are found to display dis- tinct changes to other task manipulations.
4 It must be emphasized that we do not wish to imply that the scalp N2a/P3a/SW or the scalp P3b are generated entirely or in part by the depth potentials with the corresponding appellations. Rather, we and others have identified by visual inspection consistent patterns in depth records. Since these patterns seem to have similar wave form, latencies and task correlates to the scalp N2a/P3a/SW, and the scalp P3b, respectively, we have proposed using similar names. It is clear from the results described herein (and in Baudena et al. 1995) that rare stimuli evoke multiple overlapping components over the 100-600 msec latency range, and that each component i~as many generators. Consequently, it is highly likely that the latency and amplitude of peaks measured at the scalp in these tasks represent the contribution of multiple overlapping generators, and so to search for a one-to-one exact correlation between depth and scalp peaks would be fruitless. It must be pointed out that even across different scalp sites, that components bearing the same name very often do not have identical latencies or task correlates. Further research is necessary to determine the exacl relation of the "scalp N2a/P3a/SW" and "scalp P3b" to the "depth--N2a/P3a/SW" and "depth-P3b," but already it is clear that they are not identical. For example, as noted above, the latency of the depth-P3a is in most cases significantly shorter than that which is observed simultaneously at the scalp, and that of the depth-P3b is significantly longer. Yet the "familial" or "generic" resemblance of the scalp and depth components are undeniable, and so they merit similar names, without asserting any absolute identity.
2. Methods
Patients
Adequate records were obtained from 41 patients with grossly normal personality and intelligence, suffering from epilepsy that had proved resistant to trials of all appropri- ate anticonvulsant medications (Table 1). Electrodes were implanted for 4 - 1 4 days in order to localize the sites of seizure onset. While awaiting spontaneous seizure onset, records were obtained during cognitive tasks. Patients were not recorded if they were having frequent or major seizures, if they had had a complex partial seizure within the previous hour, or if their speed and accuracy on the cognitive tasks were clearly impaired. Selection of patients and sites to implant, as well as the duration of implanta- tion, was made entirely on clinical grounds without refer- ence to the experimental protocol. Cognitive recordings were made only after fully informed consent monitored by the appropriate human subject protection committees.
Electrodes and localization
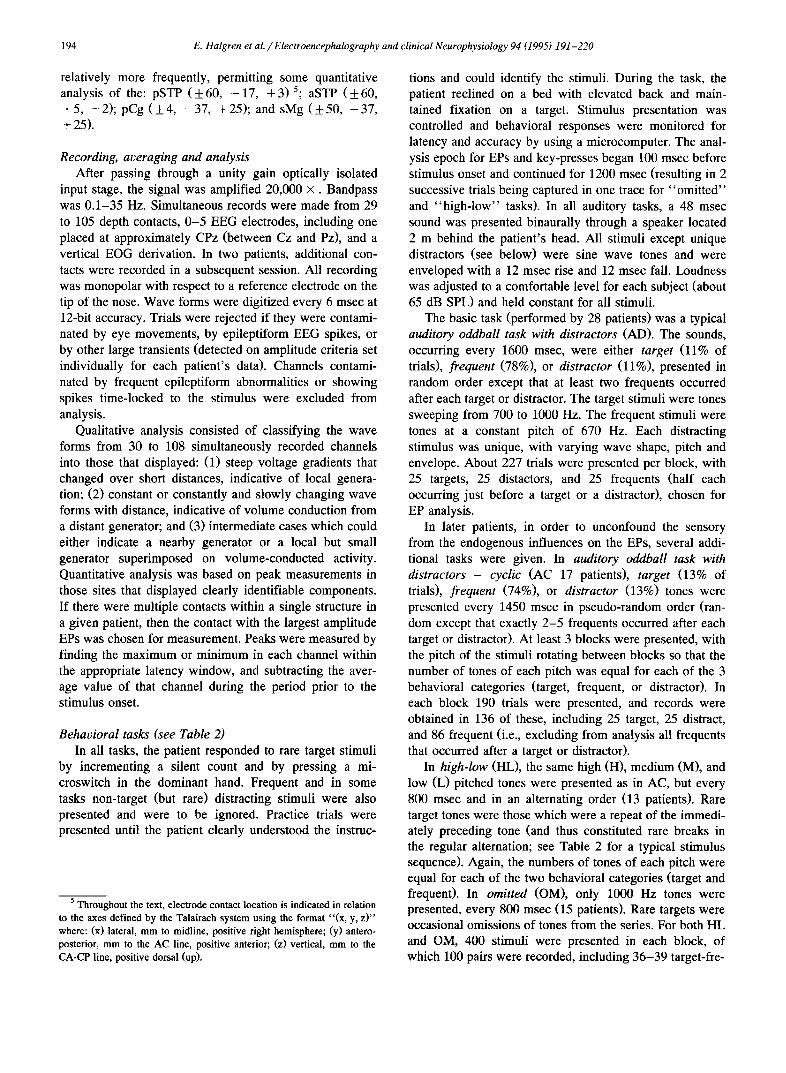
A total of 537 sites (121 left hemisphere, 416 right) were recorded. Each patient received 1 -4 electrodes in the temporal a n d / o r parietal lobes (total 81 electrodes). Elec- trodes were 0.8 mm in diameter, were blunt-tipped, and had 5, 10 or 15 recording contacts. Each contact was 2.0 mm in length, and successive contacts were separated by 1.5 mm. Initial electrode trajectories were chosen using the method of Talairach et al. (1967), which uses a standard baseline (the CA-CP line) and a proportional grid system to compensate for variations in the size and shape of the brain, and which indicates the average location and statisti- cal variation for the major neocortical gyri and telen- cephalic subcortical structures. Approximate Brodmann (1909) areas are also indicated, as mapped in Talairach et al. (1967) and Talairach and Tournoux (1988).
Statistical localization was confirmed and refined by direct visualization of vessels tracing the structure's out- lines, using stereoscopic stereotaxic angiography (Szikla et al. 1977). Angiograms were made in the same stereotaxic frame as was used for electrode implantation, and at a distance of 4.85 m (thus eliminating significant parallax). This method also allowed avascular trajectories to be chosen for the electrodes. Post-implantation stereotaxic MRI, with slices parallel to the interhemispheric plane and with the CA-CP line indicated, allowed direct visualization of electrode tracks in some patients (Musolino et al. 1990). Localization of electrode contacts was performed blind as to the results of recording.
Electrode placement was individualized to test possible sites of seizure onset (cf. Fig. 1). The dorsal, posterior and ventral extremes of the hemispheres were relatively poorly sampled due to the standard electrode trajectory that was perpendicular to the midline. Because of their ability to sample several areas frequently involved in epileptogenesis with a single electrode, certain trajectories were selected
194 E. Halgren et al. / Electroencephalography and clinical Neurophysiology 94 (1995) 191-220
relatively more frequently, permitting some quantitative analysis of the: pSTP (+60 , - 1 7 , +3) 5; aSTP (___60, + 5, - 2); pCg (__+ 4, - 37, + 25); and sMg ( + 50, - 37, + 25).
Recording, averaging and analysis After passing through a unity gain optically isolated
input stage, the signal was amplified 20,000 x . Bandpass was 0.1-35 Hz. Simultaneous records were made from 29 to 105 depth contacts, 0 -5 EEG electrodes, including one placed at approximately CPz (between Cz and Pz), and a vertical EOG derivation. In two patients, additional con- tacts were recorded in a subsequent session. All recording was monopolar with respect to a reference electrode on the tip of the nose. Wave forms were digitized every 6 msec at 12-bit accuracy. Trials were rejected if they were contami- nated by eye movements, by epileptiform EEG spikes, or by other large transients (detected on amplitude criteria set individually for each patient's data). Channels contami- nated by frequent epileptiform abnormalities or showing spikes time-locked to the stimulus were excluded from analysis.
Qualitative analysis consisted of classifying the wave forms from 30 to 108 simultaneously recorded channels into those that displayed: (1) steep voltage gradients that changed over short distances, indicative of local genera- tion; (2) constant or constantly and slowly changing wave forms with distance, indicative of volume conduction from a distant generator; and (3) intermediate cases which could either indicate a nearby generator or a local but small generator superimposed on volume-conducted activity. Quantitative analysis was based on peak measurements in those sites that displayed clearly identifiable components. If there were multiple contacts within a single structure in a given patient, then the contact with the largest amplitude EPs was chosen for measurement. Peaks were measured by finding the maximum or minimum in each channel within the appropriate latency window, and subtracting the aver- age value of that channel during the period prior to the stimulus onset.
Behavioral tasks (see Table 2) In all tasks, the patient responded to rare target stimuli
by incrementing a silent count and by pressing a mi- croswitch in the dominant hand. Frequent and in some tasks non-target (but rare) distracting stimuli were also presented and were to be ignored. Practice trials were presented until the patient clearly understood the instruc-
5 Throughout the text, electrode contact location is indicated in relation to the axes defined by the Talairach system using the format "(x, y, z)" where: (x) lateral, mm to midline, positive right hemisphere; (y) antero- posterior, mm to the AC line, positive anterior; (z) vertical, mm to the CA-CP line, positive dorsal (up).
tions and could identify the stimuli. During the task, the patient reclined on a bed with elevated back and main- tained fixation on a target. Stimulus presentation was controlled and behavioral responses were monitored for latency and accuracy by using a microcomputer. The anal- ysis epoch for EPs and key-presses began 100 msec before stimulus onset and continued for 1200 msec (resulting in 2 successive trials being captured in one trace for "omit ted" and "high-low" tasks). In all auditory tasks, a 48 msec sound was presented binaurally through a speaker located 2 m behind the patient's head. All stimuli except unique distractors (see below) were sine wave tones and were enveloped with a 12 msec rise and 12 msec fall. Loudness was adjusted to a comfortable level for each subject (about 65 dB SPL) and held constant for all stimuli.
The basic task (performed by 28 patients) was a typical auditory oddball task with distractors (AD). The sounds, occurring every 1600 msec, were either target (11% of trials), frequent (78%), or distractor (11%), presented in random order except that at least two frequents occurred after each target or distractor. The target stimuli were tones sweeping from 700 to 1000 Hz. The frequent stimuli were tones at a constant pitch of 670 Hz. Each distracting stimulus was unique, with varying wave shape, pitch and envelope. About 227 trials were presented per block, with 25 targets, 25 distactors, and 25 frequents (half each occurring just before a target or a distractor), chosen for EP analysis.
In later patients, in order to unconfound the sensory from the endogenous influences on the EPs, several addi- tional tasks were given. In auditory oddball task with distractors - cyclic (AC 17 patients), target (13% of trials), frequent (74%), or distractor (13%) tones were presented every 1450 msec in pseudo-random order (ran- dom except that exactly 2-5 frequents occurred after each target or distractor). At least 3 blocks were presented, with the pitch of the stimuli rotating between blocks so that the number of tones of each pitch was equal for each of the 3 behavioral categories (target, frequent, or distractor). In each block 190 trials were presented, and records were obtained in 136 of these, including 25 target, 25 distract, and 86 frequent (i.e., excluding from analysis all frequents that occurred after a target or distractor).
In high-low (HL), the same high (H), medium (M), and low (L) pitched tones were presented as in AC, but every 800 msec and in an alternating order (13 patients). Rare target tones were those which were a repeat of the immedi- ately preceding tone (and thus constituted rare breaks in the regular alternation; see Table 2 for a typical stimulus sequence). Again, the numbers of tones of each pitch were equal for each of the two behavioral categories (target and frequent). In omitted (OM), only 1000 Hz tones were presented, every 800 msec (15 patients). Rare targets were occasional omissions of tones from the series. For both HL and OM, 400 stimuli were presented in each block, of which 100 pairs were recorded, including 36-39 target-fre-
E. Halgren et al. / Electroencephalography and clinical Neurophysiology 94 (1995) 191-220 195
q u e n t pa i r s , a n d 6 1 - 6 4 f r e q u e n t - f r e q u e n t p a i r s ( the f i r s t 8
f r e q u e n t s a f t e r a t a rge t w e r e e x c l u d e d f r o m ana lys i s ) .
In visual oddball with distractors ( V D ) , s i n g l e l e t t e r s o r
s y m b o l s s u b t e n d i n g 0 .43 d e g r e e s o f v i s u a l a n g l e w e r e
p r e s e n t e d in w h i t e o n a v i d e o m o n i t o r fo r 2 0 0 m s e c e v e r y
1600 m s e c (14 pa t i en t s ) . T a r g e t s t i m u l i w e r e t he s y m b o l
" * , " f r e q u e n t s w e r e an " O " (o r an " x " in p a t i e n t s a f te r
p a t i e n t no . 12), a n d d i s t r a c t o r s w e r e cap i t a l le t te rs . B e -
t w e e n s t imul i , f i x a t i o n w a s m a i n t a i n e d o n a c en t r a l " + . "
F ina l ly , 6 p a t i e n t s w e r e p r e s e n t e d w i t h the s a m e s t i m u -
lus t ra in as w a s p r e s e n t e d in o n e o f t he aud i t o ry p a r a d i g m s
(3 A C a n d 3 H L ) , b u t w h i l e r e a d i n g a b o o k a n d i n s t r u c t e d
Table 1 Patient characteristics
Paper a Pt. no. Se, x Age Implanted Sz focus b Dominance Tasks d sites b man (hemi) c
12 1 F 22 RTP RT R 123 2 F 34 RTPCF RT R
13 3 M 20 RPCF, LCP RFP, LFC ¢ 12 4 F 25 RTOP, LT RT R
123 5 F 39 RTPCF RT R 123 6 M 50 RTPCF RT L (L)
13 7 M 29 RPRF RF R 123 8 M 21 RTPF RTP R 123 9 M 37 RTPCF RT R 123 10 M 40 RTPF RT R
12 11 F 25 LTOP LT R 123 12 M 32 RTOPF RT L (R) 123 13 M 52 RTF RT R 123 14 M 35 LTPCF LT R 123 15 M 22 LTCF, RTF LT L (R) 123 16 F 26 LTF RT R 123 17 M 26 RTOPCF RT R 123 18 M 39 RTCF RT R
12 19 F 19 RTP, LT RT R 123 20 M 22 RTOCF RT R 123 21 M 31 RTOCF RT R 123 22 M 30 RTPF RT R 123 23 M 28 RTOPCF RJ R 123 24 M 24 RTF RT R
12 25 M 18 LTOP LT R 123 26 M 27 RTPC RTF R 123 27 M 24 RTPCF RT R 123 28 M 26 LTOF LT L (L) 23 29 M 20 RFF, LTF RT R 23 31 F 24 LTF, RTF BF R 23 32 M 20 RTF RT R
123 33 F 40 RTPCF RJ R 123 35 F 35 LTPOCF, RC LC L (R) 123 36 F 28 LTPF, RTPF BP R 123 37 F 32 LTF LT R
3 38 F 18 LCF, RF LF R 13 39 M 19 RPCF, LC RPC R 3 40 F 24 LF, RF LF R
12 42 M 15 RTP RT R 13 43 f F 20 RTCF, LF, RPCF RF R 12 44 M 34 LT LT R (L) 12 45 M 18 RTP RT R 12 46 F 24 RTPO, LT RT R 12 47 M 49 RT, LT BT R 13 48 F 30 LPF, RPF BF R
123 49 M 42 RTF RT R
AD VD, F AD W , F AD VD, F, W A D F AD F ,W AD VD, F AD VD, F AD VD, F, W A D F , W AD VD, W AD F ,W AD VD, F, W AD VD AD VD, F, W AD AD VD, F A D F A D F AD VD, F, W AD AC, VD, F, W AD VD, F, W AD AC, HL, OM, VD, F, W AD AC, HL, OM, F, W AD AC, HL, OM, F AD 0M, W AD OM AD AC, OM, F, W AD AC, HLai, F, W VC AC, VC, W AC, W AC, OM, HL AC, OM, W OM, HL, W AC, OM, HL, W ACai OM, HL HL, OM ACai, HL ACai, HL AC, OM, HL, W HLai ACai, OM, W HLai AC, OM, W AC, OM
a Patients included in the currenl series: (1) this paper; (2) Halgren et al. 1995; (3) Baudena et al. 1995. b T = temporal, O = occipital, P = parietal, F = frontal, C = central, J = junction of TPO, R = right, L = left, B = bilateral. e Hemispheric dominance was determined by language function after unilateral intracarotid amytai (Wada test) in left handed subjects. d AD, AC, HL, OM, VD, see Table 2 for details; a = attended, i = ignored, F = face recognition, W = word recognition.
Data not available. f Pt. 43 was implanted on two different occasions.
196 E. Halgren et al. / E lectroencephalography and clinical Neurophysiology 94 (1995) 191-220
to ignore the tones. Although not illustrated here, EPs to potentials, which provided confirmation of the responses feedback tones in word and face recognition tasks (Halgren reported here. The distribution of tasks across patients is et al. 1994a) were also found to produce endogenous shown in Table 1.
LATERAL , ' ' '
, , , ~ ' , ,
i / - "
-r ~" "~-- " "
4
5
6 O9 LU7 I" ~8
9
1C
11
12
I H G F E D C B A
MEDIAL
y - " " ' 1
paC 2
>
~ 4
5
~ 6
7
CA - CP /') ~ , 8
,o
12
A B C D E F G H I
Fig. 1. Location of electrode implants. The entry points of electrodes are indicated on lateral views of the patients' heads (left column), with the terminations of those electrodes that passed to the inner surface shown on the medial views (right column). Electrode implantation sites into the left hemisphere are shown in the top row, and into the right hemisphere are shown in the middle row. Each electrode contained 5-15 separate contacts, spaced 3.5 mm on centers. All electrodes took a lateral to medial course perpendicular to the midline plane, except for two approximately vertical electrodes in pt no. 8, one passing from the parietal lobe to the posterior cingulate gyrus, and the other from the frontal lobe to the posterior hippocampal formation (not illustrated). The schemas from individual patients were superimposed using the proportional system of Talairach et al. (1967), relative to a coordinate system based on a horizontal line passing through the anterior and posterior commissures (CA-CP), and the size of the brain (measured from lateral teleradiographs obtained under stereotaxic conditions during ventriculography). At the bottom of the figure, the anatomical regions that statistically correspond to the proportional coordinates are indicated (see list for abbreviations). It must be emphasized that these locations are approximate: confirmation of electrode sites in individual subjects was accomplished with reference to gyri outlined by stereotaxically visualized blood vessels (Szikla et al. 1977). Note that this figure displays electrodes from Halgren et al. (1995) and Baudena et al. (1995), as well as the current paper.
E. Halgren et al. / Electroencephalography and clinical Neurophysiology 94 (1995) 191-220 197
3. Results
Behavioral performance Subjects detected correctly 92 _ 10% (mean -t- S.D.) of
the target tones in AD with a reaction time of 511 _+ 101 msec, and 8 9 _ 12% of the target tones in AC with a reaction time of 527 _+ 91 msec. False detections were less than 5% in all cases. Patients whose seizures arose in the temporal lobe (N = 28) had a better performance (94%, combining data from AD and AC) at a shorter latency (486 msec) than patients whose seizures arose in extratemporal structures (N = 9), who responded to only 77% of the stimuli (2-tailed group t test P < 0.05) at an average latency of 614 msec ( P < 0.01). The extratemporal group included patients with seizure origins in frontal (N = 3), central (N = 1), temporo-parietal (N = 3), temporo-frontal (N = 1), or fronto-parietal (N = 1) cortices. These groups were too small to allow poor performance to be associated with any particular anatomical locus. These results are consistent with the observation that patients with extratem- poral seizure origin typically suffer from more extensive
cortical damage than do patients with temporal lobe seizures (Swartz et al. 1990).
Discrimination and identification of endogenous potentials Behavioral task criteria. Endogenous potentials were
identified as those which did not appear to be related to sensory or motor variables in any simple way. Opera- tionally, endogenous potentials were identified as those that were evoked by rare target and/or distractor stimuli, but not by the frequent stimuli. In the AD task, target, distractor and frequent stimuli were approximately matched on sensory variables; thus differential responses would probably reflect non-sensory effects. This inference could be confirmed in most patients by observing the same components evoked either by auditory stimuli where the 3 types of stimulus were exactly matched on all sensory characteristics (AC and HL tasks), by visual stimuli (VD), and/or by the absence of an expected stimulus (OM). In all these cases, since the frequent stimuli were attended and processed, the differential responses to rare stimuli must reflect an additional process evoked by these distinc-
Table 2 Behavioral tasks
AD : auditory oddball task with distractors typical trial sequence: . . . . F-F-T-F-F-F-F-_D-F-F-F-_F-T-F-F-T-F-F-F-F-_F-_D-F- a...
stimulus types: T = target, 11% of trials, ascending pitch 700- > 100 Hz D = distractor, 11% of trials, each trial unique F = frequent, 88% of trials, 670 Hz tone ISI = 1600 msec
AC: auditory oddball task with distractors - cyclic ...-F-F-T-F-F-F-F-D-F-F-F-F-T..F-F-T-F-F-F-F-F-D-F- a...
block 1 block 2 T (13%) 2500 Hz 320 D (13%) 320 1000 F (74%) 1000 2500 ISI = 1450 msec
HL: high-low ...-L-M-H-L-M-H-L-M-H-L-M-M-H-L-M-H-L-M-H-L-M-H-L-M-H-H-L- a...
H (33.3%) 2500 Hz; M (33.3%) 1000 Hz; L (33.3%) 320 Hz T 10% (3.3% H, 3.3% M, 3.3% L) F 90% (30% H, 30% M. 30% L) ISI = 800 msec
OM: omitted a ... - , - , - , - , - , - , - , - , - , - , - , - , - , - , - , - , - , - , - , - , - , - , - , - , - , - , - , - ...
F (90%) 1000 Hz T (10%) tone omission ISI = 800 msec
VD: visual oddball with distractors . . . . F-F-T-F-F-F-F-_D-F-F-F-F-T..F-F-_T-F-F-F-F-F-D-F- a...
T (11%) D (11%) any letter F (88%) X ISI = 1600 msec
block 3 1000 2500
320
a Bold indicates behavioral targets, underline indicates periods that were digitized for evoked potentials.
198 E. Halgren et al. / Electroencephalography and clinical Neurophysiology 94 (1995) 191-220
A AD B AD
,~_ ~"~,,,,,,RARE FREQUENT
Pz Pz ' ~ I I "F'" './)~" DISTFIACT
31.5 I 28
24.5
21 21
17.5 14
14 10.5
/ /
10.5
3.5 3.5
¢ - .
f 'X -~"
~ - 1 j
0 400 800ms 0 400 800
C AD
CPz
P3
17.5 w= ;,~ ~ ~,w~= ~-
14,=,, ' ~ ~ , ~
I
10.5 "
I
t
/ I
~7 Y/" '\
3 . 5 ~ , ~ ~ ~
o~. ~
0 400 800
O AD
Pz ~ "
P3
28~'
24.5 ~,
21~
17.5 ~,
h #1
0 - "
mm • to tip ~
0
, \
t o
400
~ , r , v ,
T 800
I i I [ " / i = 1 r
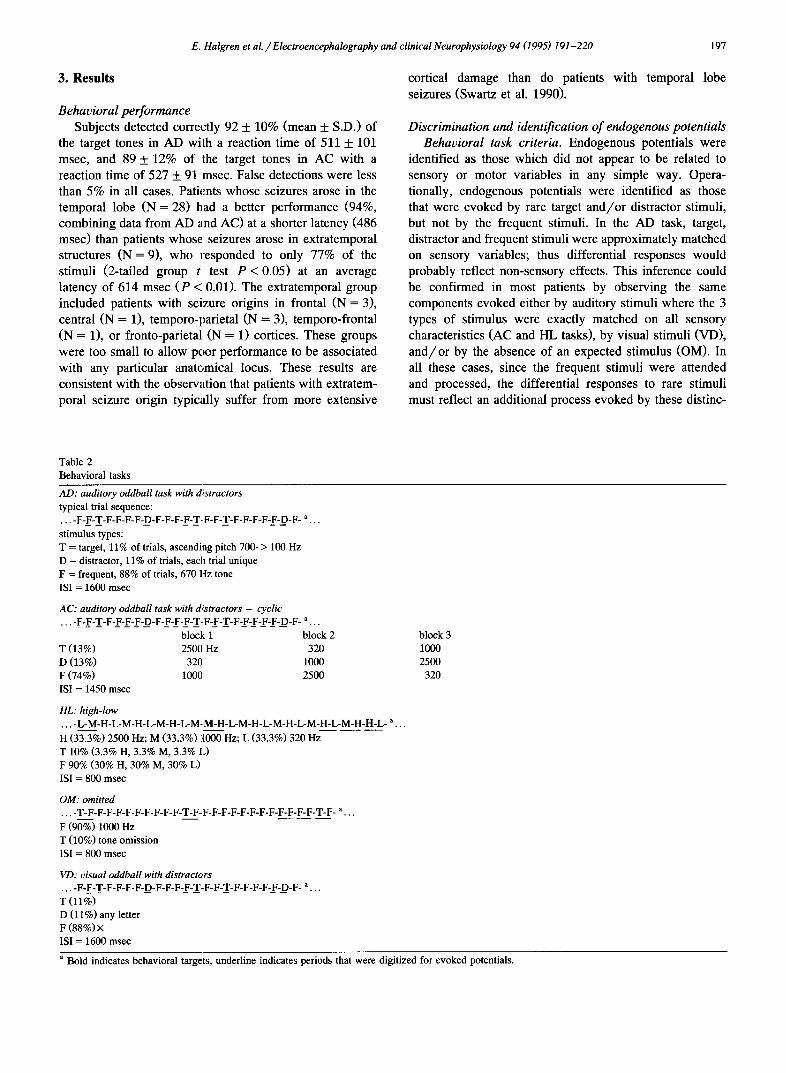
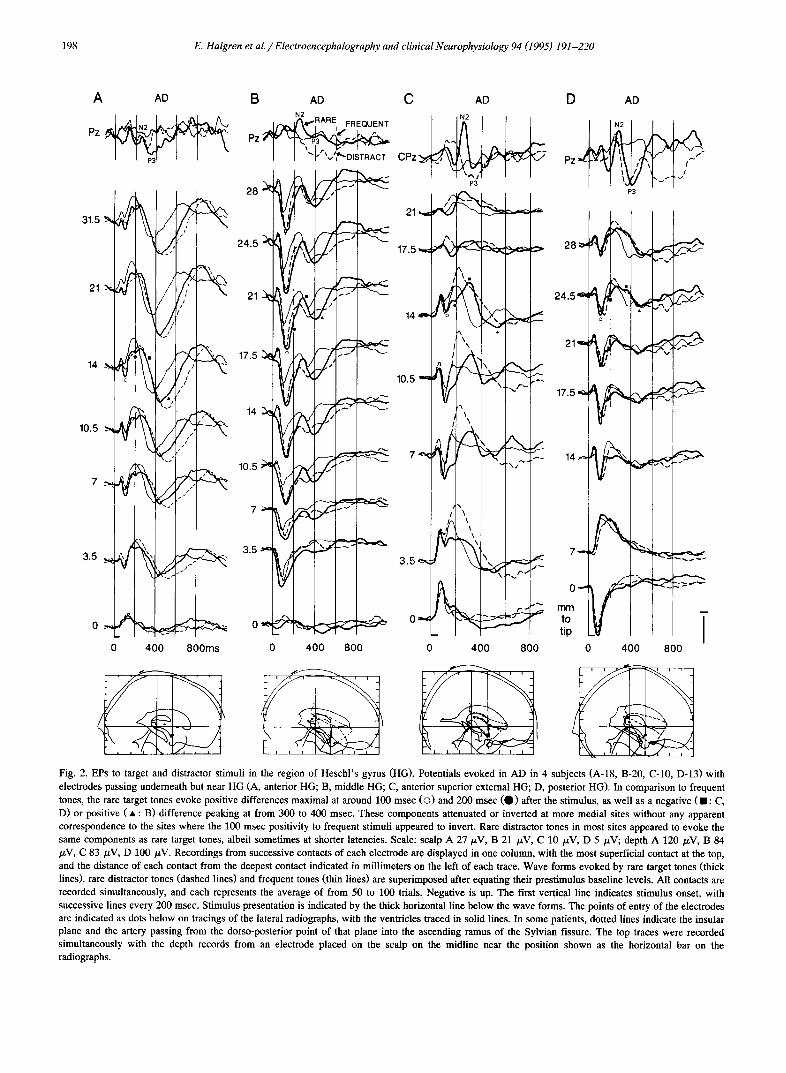
Fig. 2. EPs to target and distractor stimuli in the region of Heschl 's gyrus (HG). Potentials evoked in AD in 4 subjects (A-18, B-20, C-10, D-13) with electrodes passing underneath but near HG (A, anterior HG; B, middle HG; C, anterior superior external HG; D, posterior HG). In comparison to frequent tones, the rare target tones evoke positive differences maximal at around 100 msec (O) and 200 msec (O) after the stimulus, as well as a negative (11: C, D) or positive ( • : B) difference peaking at from 300 to 400 msec. These components attenuated or inverted at more medial sites without any apparent correspondence to the sites where the 100 msec positivity to frequent stimuli appeared to invert. Rare distractor tones in most sites appeared to evoke the same components as rare target tones, albeit sometimes at shorter latencies. Scale: scalp A 27 p.V, B 21 /zV, C 10 /zV, D 5 /xV; depth A 120 /zV, B 84 /zV, C 83 /xV, D i00/xV. Recordings from successive contacts of each electrode are displayed in one column, with the most superficial contact at the top, and the distance of each contact from the deepest contact indicated in millimeters on the left of each trace. Wave forms evoked by rare target tones (thick lines), rare distractor tones (dashed lines) and frequent tones (thin lines) are superimposed after equating their prestimulus baseline levels. All contacts are recorded simultaneously, and each represents the average of from 50 to 100 trials. Negative is up. The first vertical line indicates stimulus onset, with successive lines every 200 msec. Stimulus presentation is indicated by the thick horizontal line below the wave forms. The points of entry of the electrodes are indicated as dots below on tracings of the lateral radiographs, with the ventricles traced in solid lines. In some patients, dotted lines indicate the insular plane and the artery passing from the dorso-posterior point of that plane into the ascending ramus of the Sylvian fissure. The top traces were recorded simultaneously with the depth records from an electrode placed on the scalp on the midline near the position shown as the horizontal bar on the radiographs.
E. Halgren et al. / Electroencephalography and clinical Neurophysiology 94 (1995) 191-220 199
rive stimuli. Since no overt or covert response was re- quired to the non-target distractors, this process could not be motor in any simple sense if the potential occurred to non-target as well as to target rare stimuli.
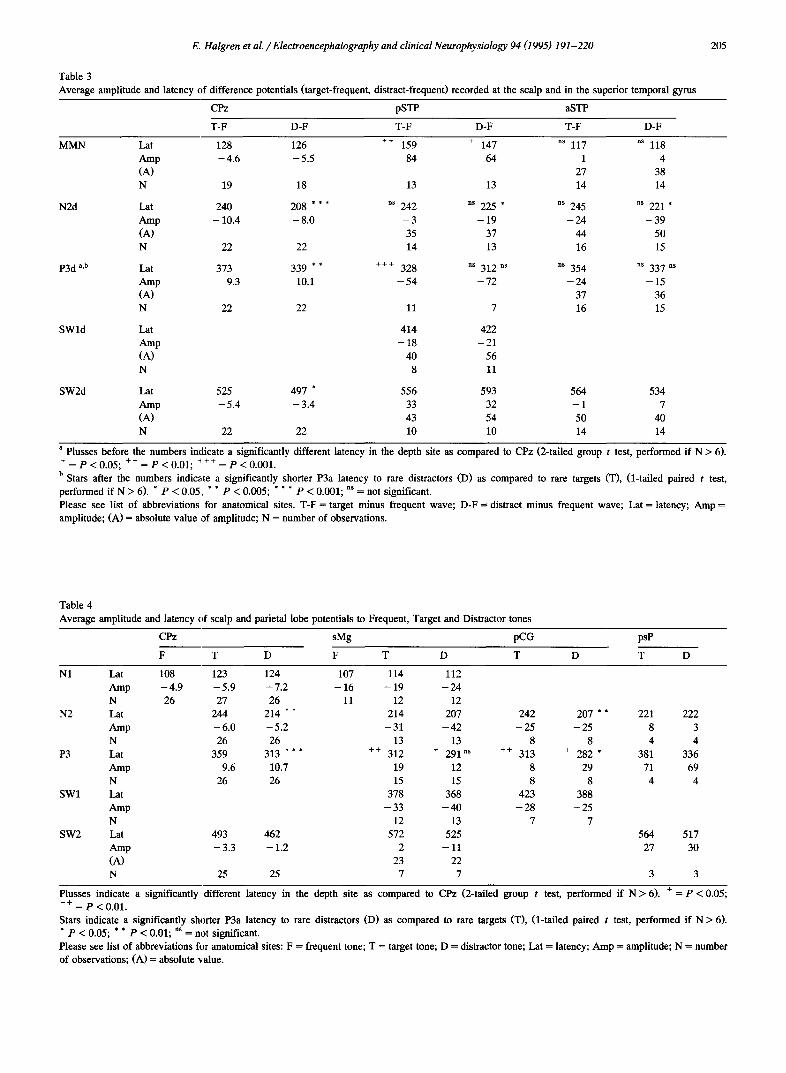
MMN/N2aud/P3au d. Visual inspection revealed 3 dis- tinct wave form patterns. The first was recorded by elec- trodes passing in or near the superior temporal plane (STP). Large endogenous potentials in this region were specific to the auditory modality and appeared to be less regular in wave form than the other two patterns (Fig. 2). However, this variability was partly due to large overlap- ping exogenous auditory potentials. When the responses to frequent tones were subtlacted from those to targets or distractors, 3 components could commonly be observed, usually with positive-negative-positive polarities (Figs. 3, 4, 5 and 6). These wave forms had latencies of 138-243- 341 msec to target minus frequents, and 132-223-324 msec to distractor minus frequents (average of anterior and posterior STP), similar to those observed at CPz to target minus frequents (128-240--373 msec) and distractor minus frequents (126-208-339 rnsec; Table 3). These endoge- nous components recorded in STP were labeled the STP- MMN, STP-N2au0, and STP-P3]u d.
N 2 a / P 3 a / S W . The second pattern recorded was a triphasic (usually negative-positive-negative), sharply peaked wave form. This was observed in all records from the supramarginal gyrus (sMg; Fig. 10 - P50, U'47, $54, S'41; Fig. 12 - P45; Fig. 13 - Q54, Q57) and posterior cingulate gyrus (pCg; Fig 10 - P6, U'4, S'5; Fig. 11 - L12, H7; Fig. 13 - Q12, Q8) 6. Across the sMg and pCg, the average latency of the 3 peaks was 227-313-373 msec to targets, and 207-287-378 msec-to distractor stimuli. Simultaneous recording from the scalp at CPz (between Cz and Pz) also revealed a typical negative-positive-negative wave form, with average latencies of 244-359-493 msec to targets, and 214-313-462 msec to distractor stimuli. The latencies of the corresponding positive peaks were found to be significantly shorter in the sMg and pCg than at the scalp (Table 4). The early latency and task correlates of this triphasic depth waw~ form led to it being labeled the depth-N2a/P3a /SW 1. In most trajectories, no polarity inversions were observed (see below for exceptions). How- ever, in many cases, the N 2 a / P 3 a / S W was larger both medially and laterally than in intermediate sites.
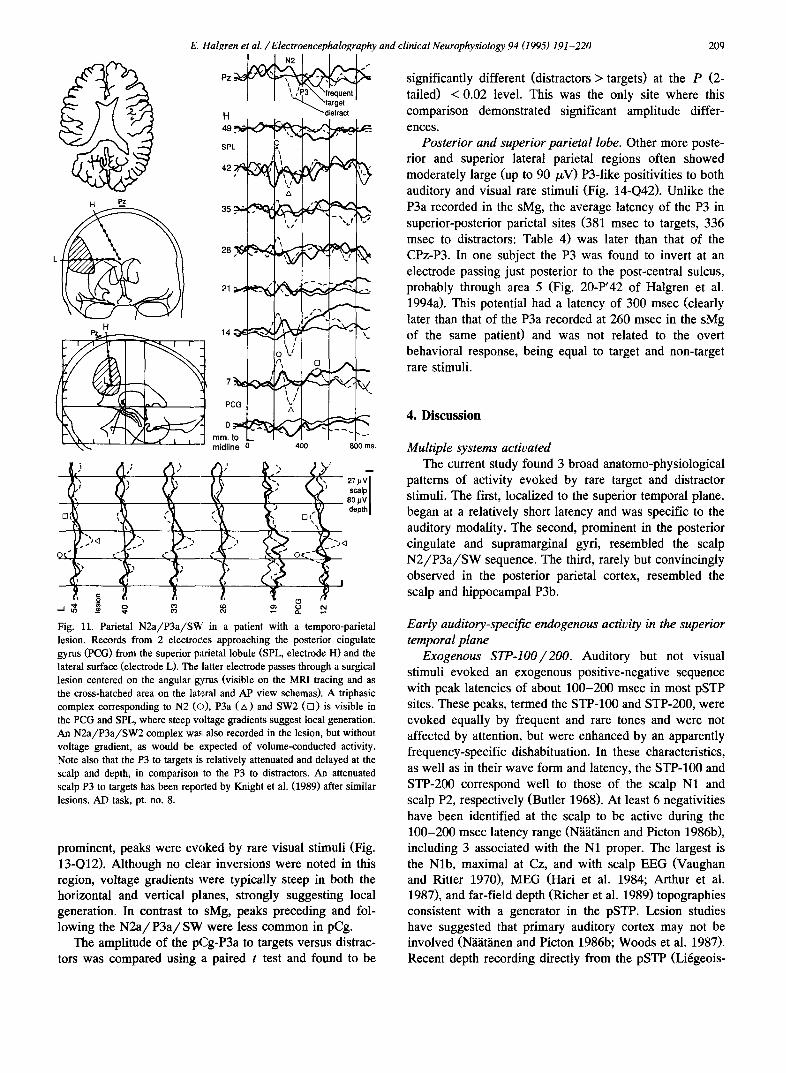
N2/P3b . The third pattern was a large, primarily monophasic, wave form. This potential tended to be very focal, with steep voltage gradients and common inversions. It was recorded principally in psP (Fig. 14 - Q42), where it resembled the well-known hipppocampal P3 (Fig. 14 - B20). The average latency of this potential was 381 msec
6 Note that in the text, figure numbers are followed by the electrode letter (omitted if only one electrode is displayed in the figure), followed by a prime if the electrode is in the left hemisphere, and then the distance in mm from the center of the contact to the interhemispheric plane.
to targets and 336 msec to distractor stimuli in the psP, later than that measured at CPz (Table 4), although too few measures were obtained to permit statistical comparison. This potential was termed the depth-P3b 1.
Superior temporal plane - early endogenous components Electrode localizations. Evoked potentials were recorded
from the STP in 34 patients. These potentials were ana- lyzed according to whether they were recorded from poste- rior (23 electrodes) or anterior (24 electrodes) STP. The electrode position in pSTP was measured relative to: (1) the posterior angle of the insula (defined as where the most posterior branch of the middle cerebral artery turns superfi- cially from the insula toward the surface); (2) the insular plane (visualized in the frontal views from the network of vessels on its surface); and (3) the Sylvian fissure (for details see Li6geois-Chauvel et al. 1991). The pSTP elec- trodes included 11 (66 contacts) that passed through or underneath Heschl's gyrus (including 3 which may have passed just anterior to it); 1 electrode (4 contacts) that passed just above HG in the parietal operculum; 1 elec- trode (5 contacts) that passed just posterior to HG (under- neath the transverse sulcus medially and posterior to the transverse sulcus laterally); and 10 that passed under the planum temporale just posterior to HG. Responses recorded from the posterior bank of the ascending limb of the supramarginal gyrus are discussed with other parietal lobe responses.
Underlying late exogenous components to frequent stimuli. Large exogenous components from 25 to 200 msec were recorded by all pSTP electrodes (i.e., those electrodes passing near HG). Details of the topography of these exogenous components and their relation to scalp poten- tials are discussed elsewhere (Li6geois-Chauvel et al. 1991, 1994). The later exogenous components (i.e., from 100 to 200 msec post-stimulus onset) will only be very briefly described here so as to permit their delineation from the superimposed endogenous components. All pSTP records to frequent tones were characterized by a large positive- negative sequence with peaks at about 100 msec (STP-100) and 200 msec (STP-200; see Figs. 2 and 3). The same electrode sites were recorded in 7 patients during both auditory and visual oddball tasks. The STP-100 averaged about 100/zV in absolute amplitude (range 70-150) in AD but could not be distinguished in VD (Fig. 6). In 6 patients, the STP-100 was observed to invert to negative in passing from lateral to medial under the STP (Fig. 2). Similarly, in 2 patients this peak was observed to be negative just superior to HG (Figs. 7 and 8). Thus, the STP-100 is modality-specific and locally generated.
Topography of early STP endogenous components. En- dogenous components were common in the STP (Figs. 2-6), especially after subtracting the potentials evoked by frequent stimuli from those evoked by target or distractor stimuli (Figs. 3, 4, 6). The resulting difference wave form showed a single large positivity before 200 msec, peaking
200 E. Halgren et al. / Electroencephalography and clinical Neurophysiology 94 (1995) 191-220
at 159 msec in target-frequent (T-F), and at 146 msec in distract-frequent (D-F) difference wave forms from pSTP sites (Table 3). This positivity was termed the STP-MMN (see below).
The STP-MMN was recorded by electrodes in various antero-posterior levels of the pSTP, including those pass- ing anterior or posterior to HG. Conversely, those pSTP
contacts that recorded little or no difference between fre- quent as opposed to target or distractor stimuli (i.e., no STP-MMN), and which showed little or no potentials after 250 msec, were located near the postero-medial HG, that is, near the area that has been identified anatomically and physiologically as primary auditory cortex in humans (Fig. 2D; Li6geois-Chauvel et al. 1991). In most pSTP electrode
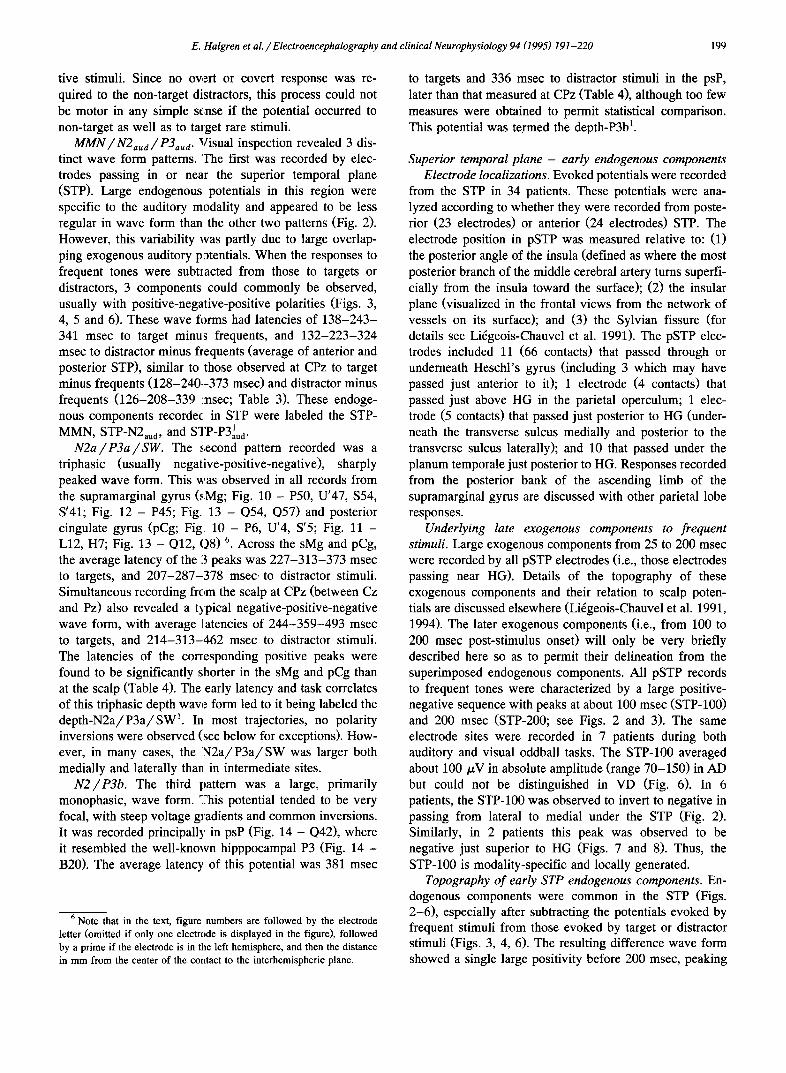
A AC-subs AC
N2 I r ~ .-~tar~et-frequent I
24
21.5
P3
,s
14.5 J
10.5
7 J
, , - -
o _ . .
mm. to tip
40Q 800ms
HL OM
18uV
15uV subs
L-
i, /aV
E. Halgren et al. / Electroencephalography and clinical Neurophysiology 94 (1995) 191-220
B
Fig. 3B. Location of recorded contacts in Fig. 3A. According to MRI, the electrode passed through the fundus of a sulcus running within lateral contact lying just outside 1:he lateral cortical surface of the superior temporal gyms.
201
HG, with its most
trajectories, the pSTP-MMN was small in the most lateral and medial leads with a 1--2 cm plateau across the middle leads (Figs. 3, 4-right and 5). In no case did the pSTP- MMN invert polarity laterally after passing through the lateral cortical surface of the superior temporal gyrus (e.g., Fig. 3-24). In contrast, like the pSTP-100, the pSTP-MMN consistently inverted pol~trity to negative in electrodes located above the pSTP (Figs. 7 and 8).
Similar potentials were sometimes observed in aSTP, where the STP-MMN could occur in the absence of a significant STP-100 (Fig. 5-right). However, more often, aSTP peaks in this latency range were small, could be either positive or negatiw~, and had substantially earlier latencies (averaging 117 msec to T-F, 118 to D-F; Table 3).
Although the superimposed positivity revealed by sub- traction thus had an intracranial topography that was simi- lar to that of the STP-100 to frequent tones, details of their topography in any given electrode track were clearly dis- tinct, with the STP-MMN having sometimes a slightly more lateral topography (e.g., Figs. 3 and 4). These dis-
tinct topographies imply that the STP-MMN has at least a partially distinct generator from that of the STP-100. This voltage topography is qualitatively consistent with the STP-MMN being generated in the parts of the pSTP that lie lateral, posterior and anterior to HG, i.e., in a region that largely overlaps the STP-100 generator, but lies some- what more lateral and anterior.
Often, simultaneous recording on the scalp showed no significant difference between target, distract and frequent stimuli at the same time that a large difference was seen in the depth, suggesting that the STP-MMN may propagate less effectively to the scalp than does the STP-100/200 (e.g. Figs. 3 and 4).
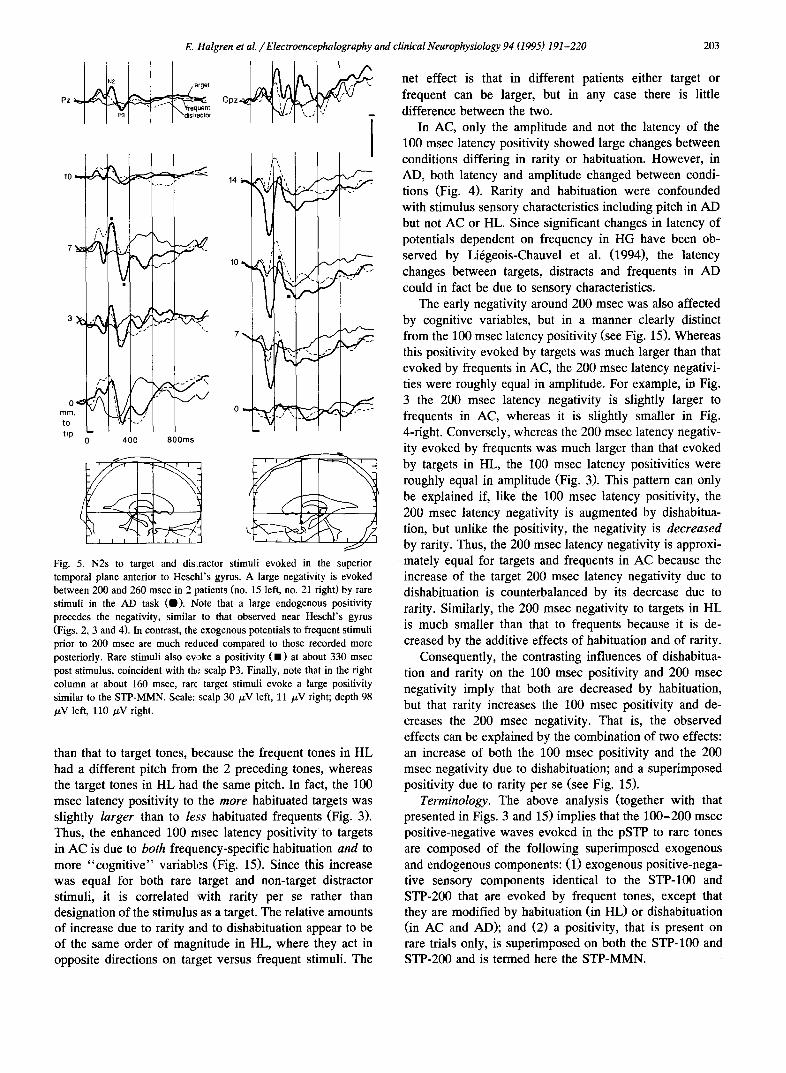
Task correlates of early endogenous components. The nature of these components was sought in a careful exami- nation of amplitude changes between and within tasks. This analysis distinguished two sources for the short la- tency (100-200 msec) rare/frequent differences observed in the pSTP: frequency-specific habituation, and rarity per se (Fig. 15). Evidence for habituation is seen in the greater amplitude of the STP-100 and STP-200 evoked by fre-
Fig. 3A. Cognitive correlates of early endogenous positivity in posterior STP. Simultaneous records from the scalp (Pz) and 8 sites in or near HG during 3 tasks wherein the patient (no. 24) counts tones of a particular pitch (AC), repetitions of the immediately preceding tone (HL), or omissions of tones from a regular series (OM). An examinaton of the wave forms derived by subtracting frequents from targets or distractors in AC (AC-subs) reveals a positivity peaking at about 100 msec (STP-/VIMN: upward triangle) and overlapping the exogenous positive-negative sequence (STP-100, STP-200) prominent in the original wave forms. The superirnposed positivity (STP-MMN) is largest 18 mm from the tip and thus is clearly distinguishable topographically from the underlying exogenous positivity to frequent tones (STP-100), which is largest 3.5 mm from the electrode tip. This superimposed positivity could not be due to targetness (it is seen to both talget (thick line) and non-target (thin line) rare stimuli), but it could be due either to rarity or to sensory dishabituation (in AC, rare tones are a different piitch from the preceding tones). These possibilities were distinguished in HL, where it is the frequent tones that are dishabituated (rare tones are repetitions of the preceding tone). In this task, the positivity recorded under the superior temporal plane at 100 msec (the STP-100) is about the same size Io rare and frequent tones, whereas the following negativity (STP-200) is much larger to frequent tones. This would be explained if the response to rare tones reflected the sum of a decrease in both the STP-100 and STP-200 due to sensory habituation, plus a superimposed STP-MMN positivity due to rarity (see Fig. 15 for clarification). Demonstration that sensory habituation decreases the exogenous STP-100 and STP-200 is found in comparing the EPs to frequent tones in OM (where stimuli are presented every 800 msec) to AC (where stimuli are presented every 1450 msec). Sensory dishabituation would also explain the larger STP-100/200 evoked in OM by the tone following a stimulus omission. There is even the suggestion in the OM wave forms of a positivity to rare stimulus omissions (STP-MMN) with the same topography and approximate latency as that seen in AC (the "latency jitter" in this average could account for its broader wave form). Interestingly, the scalp shows no significant difference between rare, distract and frequent stimuli at the same time that a large difference is seen in the depth ( zx ). This suggests that the endogenous STP-MMN component may propagate poorly to the scalp. In all 3 tasks, rare target tones also evoke a large negative potential, especially at the deepest contact (o) , that peaks just after 400 msec. Rare distractor tones do not evoke this potential, but rather a broader positivity that is maximal more laterally and peaks after 500 msec.
202 E. Halgren et al. /Electroencephalography and clinical Neurophysiology 94 (1995) 191-220
quent tones in AC which has a 1450 msec ISI, as com- pared to OM which has an 800 msec ISI (Fig. 3). That this habituation may be frequency-specific is implied by the greater amplitudes of the STP-100/200 components to frequent tones in HL as compared to OM (Fig. 3). Even though both of these tasks had the same ISI of 800 msec, in OM all tones were of the same pitch whereas in HL tones of 3 different pitches rotated across trials, resulting in 2400 msec passing between presentations of tones of the same pitch.
It was consistently noted that the 100 msec latency positivity evoked by the rare target and distract tones in AC was far larger than that evoked by frequent tones (Figs. 2, 3, 4 and 5). This difference could not be due to sensory variables, inasmuch as all 3 behavioral conditions included equal numbers of tones of the 3 pitches. Neither could the larger responses to target and distractor tones be completely due to greater frequency-specific habituation to the frequent tones. If this were so, then in HL the 100 msec latency positivity to frequent tones should be larger
AD AD - SUB AC AC - SUB
~ i
10.5
I
0
/I
I
7
3.5
0
mm.
to
i '°T
t
t,. A
m O"
50pV
400 800 ms.
- )
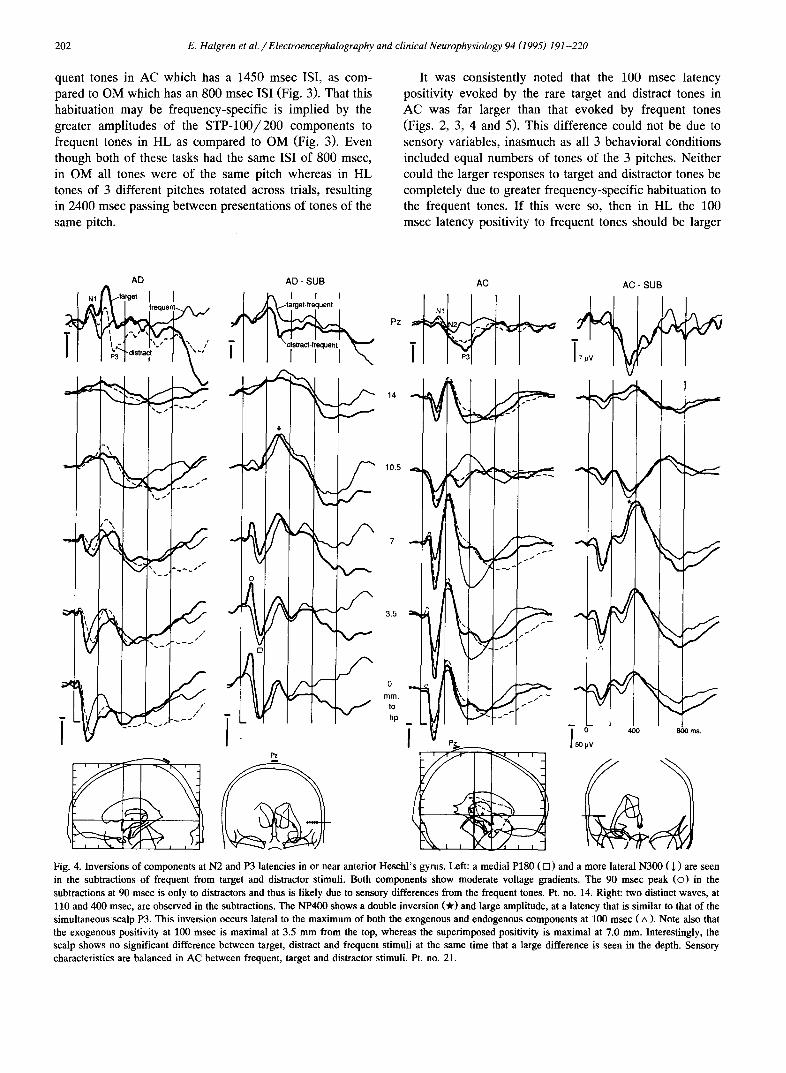
Fig. 4. Inversions of components at N2 and P3 latencies in or near anterior Hescht's gyms. Left: a medial P180 ( [] ) and a more lateral N300 ( J, ) are seen in the subtractions of frequent from target and distractor stimuli. Both components show moderate voltage gradients. The 90 msec peak (O) in the subtractions at 90 msec is only to distractors and thus is likely due to sensory differences from the frequent tones. Pt. no. 14. Right: two distinct waves, at 110 and 400 msec, are observed in the subtractions. The NP400 shows a double inversion (-k) and large amplitude, at a latency that is similar to that of the simultaneous scalp P3. This inversion occurs lateral to the maximum of both the exogenous and endogenous components at 100 msec ( A ). Note also that the exogenous positivity at 100 msec is maximal at 3.5 mm from the top, whereas the superimposed positivity is maximal at 7.0 ram. Interestingly, the scalp shows no significant difference between target, distract and frequent stimuli at the same time that a large difference is seen in the depth. Sensory characteristics are balanced in AC between frequent, target and distractor stimuli. Pt. no. 21.
E. Halgren et al. / Electroencephalography and clinical Neurophysiology 94 (1995) 191-220
10 ~ .
7 ~
O~ m m .
to t ip
V
400 800ms
10 ,~
7 ~
V j t i r l a'~
V
/ - -
I I I I I I
Fig. 5. N2s to target and dis'~ractor stimuli evoked in the superior temporal plane anterior to Heschl's gyrus. A large negativity is evoked between 200 and 260 msec in 2 patients (no. 15 left, no. 21 right) by rare stimuli in the AD task (0 ) . Note that a large endogenous positivity precedes the negativity, similar to that observed near Heschl's gyrus (Figs. 2, 3 and 4). In contrast, the exogenous potentials to frequent stimuli prior to 200 msec are much reduced compared to those recorded more posteriorly. Rare stimuli also evoke a positivity ( • ) at about 330 msec post stimulus, coincident with the scalp P3. Finally, note that in the right column at about 160 msec, rare target stimuli evoke a large positivity similar to the STP-MMN. Scale: scalp 30 ~V left, 11 /xV right; depth 98 /xV left, 110 ~V right.
than that to target tones, because the frequent tones in HL had a different pitch from the 2 preceding tones, whereas the target tones in HL had the same pitch. In fact, the 100 msec latency positivity to the more habituated targets was slightly larger than to less habituated frequents (Fig. 3). Thus, the enhanced 100 msec latency positivity to targets in AC is due to both frequency-specific habituation and to more "cognitive" variables (Fig. 15). Since this increase was equal for both rare target and non-target distractor stimuli, it is correlated with rarity per se rather than designation of the stimulus as a target. The relative amounts of increase due to rarity and to dishabituation appear to be of the same order of magnitude in HL, where they act in opposite directions on target versus frequent stimuli. The
203
net effect is that in different patients either target or frequent can be larger, but in any case there is little difference between the two.
In AC, only the amplitude and not the latency of the 100 msec latency positivity showed large changes between conditions differing in rarity or habituation. However, in AD, both latency and amplitude changed between condi- tions (Fig. 4). Rarity and habituation were confounded with stimulus sensory characteristics including pitch in AD but not AC or HL. Since significant changes in latency of potentials dependent on frequency in HG have been ob- served by Lirgeois-Chauvel et al. (1994), the latency changes between targets, distracts and frequents in AD could in fact be due to sensory characteristics.
The early negativity around 200 msec was also affected by cognitive variables, but in a manner clearly distinct from the 100 msec latency positivity (see Fig. 15). Whereas this positivity evoked by targets was much larger than that evoked by frequents in AC, the 200 msec latency negativi- ties were roughly equal in amplitude. For example, in Fig. 3 the 200 msec latency negativity is slightly larger to frequents in AC, whereas it is slightly smaller in Fig. 4-right. Conversely, whereas the 200 msec latency negativ- ity evoked by frequents was much larger than that evoked by targets in HL, the 100 msec latency positivities were roughly equal in amplitude (Fig. 3). This pattern can only be explained if, like the 100 msec latency positivity, the 200 msec latency negativity is augmented by dishabitua- tion, but unlike the positivity, the negativity is decreased by rarity. Thus, the 200 msec latency negativity is approxi-
mate ly equal for targets and frequents in AC because the increase of the target 200 msec latency negativity due to dishabituation is counterbalanced by its decrease due to rarity. Similarly, the 200 msec negativity to targets in HL is much smaller than that to frequents because it is de- creased by the additive effects of habituation and of rarity.
Consequently, the contrasting influences of dishabitua- tion and rarity on the 100 msec positivity and 200 msec negativity imply that both are decreased by habituation, but that rarity increases the 100 msec positivity and de- creases the 200 msec negativity. That is, the observed effects can be explained by the combination of two effects: an increase of both the 100 msec positivity and the 200 msec negativity due to dishabituation; and a superimposed positivity due to rarity per se (see Fig. 15).
Terminology. The above analysis (together with that presented in Figs. 3 and 15) implies that the 100-200 msec positive-negative waves evoked in the pSTP to rare tones are composed of the following superimposed exogenous and endogenous components: (1) exogenous positive-nega- tive sensory components identical to the STP-100 and STP-200 that are evoked by frequent tones, except that they are modified by habituation (in HL) or dishabituation (in AC and AD); and (2) a positivity, that is present on rare trials only, is superimposed on both the STP-100 and STP-200 and is termed here the STP-MMN.
204 E. Halgren et al. / Electroencephalography and clinical Neurophysiology 94 (1995) 191-220
STP - later endogenous components STP-N2a, d. his early endogenous positivity (the STP-
MMN) was followed in many cases by a negativity peak- ing in pSTP at about 242 msec to T-F, and 225 msec to D-F. At more anterior sites, where this component was more regular, it peaked at 245 msec to T-F and 221 msec to D-F (Table 3). This component is termed the STP-N2a, d.
The N2au d was difficult to identify in the records obtained near the primary auditory cortex. In some cases this was due to overlap with the large early negativity, and the N2au d could be observed in subtracted wave forms (Fig. 4). In other areas, however, it could be distinguished from the early negativity by its longer latency and its absence or very small amplitude to frequent stimuli (Fig. 5). In these sites, relatively large amplitudes (up to 210 /xV) and moderate voltage gradients over short distances could be observed (Figs. 2A and 4). In such sites, it was often preceded by a negativity at about 165 msec.
STP-P3=, d. Typically, large amplitude activity contin- ued to be evoked by rare stimuli in the STP until the end of the recording epoch 1100 msec after stimulus onset. In
some cases, subtraction of frequents from targets and distracts revealed a large wave in the STP, well correlated in time and even wave form with the P3 recorded simulta- neously from the scalp at Pz. For example, in Fig. 4-right, the pSTP-P3, negative in most contacts, polarity inverts from - 1 0 0 to + 60 /xV in amplitude over 3.5 mm, and then polarity inverts again to - 2 0 #V. The double polar- ity inversion on the same electrode track cannot result from a distant dipole and, thus, strongly suggests local generation. Similar potentials could be recorded from the aSTP (Fig. 5-1eft).
Later potentials. The STP potentials evoked by infre- quent attended tones with latencies greater than 500 msec may correspond principally to the "s low wave" recorded at the scalp in the same circumstances. These STP poten- tials also appeared to be locally generated, inasmuch as they sometimes showed significant voltage gradients or even inversions (Figs. 2, 4 and 5; see also Fig. 5 of Halgren et al. 1995). It appears that in some cases the STP potentials after 500 msec sometimes .reflected also peri- movement potentials generated in the Rolandic cortex,
H 5 1
A D
• . t a r g e t
f r e q u e n t
A D - s u b s V D V D - s u b s Pz
H 5 3
Pz
T 5 9
tu rn . t o ' rn ld l ne
4 e e 4 e e a e e e 4 c o a c e e o o e e
Pz
I I 1
50uV scalp
200uV depth
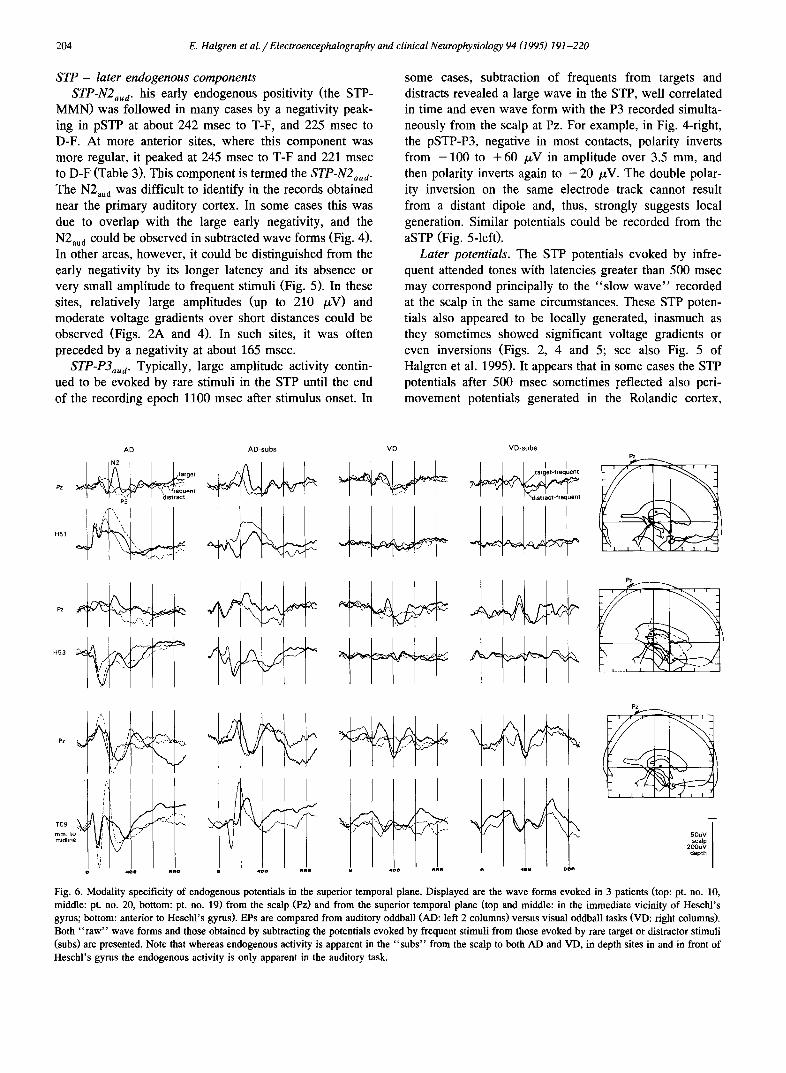
Fig. 6. Modality specificity of endogenous potentials in the superior temporal plane. Displayed are the wave forms evoked in 3 patients (top: pt. no. 10, middle: pt. no. 20, bottom: pt. no. 19) from the scalp (Pz) and from the superior temporal plane (top and middle: in the immediate vicinity of Heschl's gyms; bottom: anterior to Heschl's gyms). EPs are compared from auditory oddball (AD: left 2 columns) versus visual oddball tasks (VD: right columns). Both "raw" wave forms and those obtained by subtracting the potentials evoked by frequent stimuli from those evoked by rare target or distractor stimuli (subs) are presented. Note that whereas endogenous activity is apparent in the "subs" from the scalp to both AD and VD, in depth sites in and in front of Heschl's gyrus the endogenous activity is only apparent in the auditory task.
E. Halgren et al. / Electroencephalography and clinical Neurophysiology 94 (1995) 191-220
Table 3
Average amplitude and latency of difference potentials (target-frequent, distract-frequent) recorded at the scalp and in the superior temporal gyrus
205
CPz pSTP aSTP
T-F D-F T-F D-F T-F D-F
MMN Lat 128 126 +÷ 159 + 147 ns 117 ns 118
Amp --4.6 --5.5 84 64 1 4
(A) 27 38 N 19 18 13 13 14 14
N2d Lat 240 208 ** * ns 242 ns 225 * ns 245 ns 221
Amp - 10.4 - 8 . 0 - 3 - 19 - 2 4 - 3 9
(A) 35 37 44 50
N 22 22 14 13 16 15
P3d a,b Lat 373 339 ** +++ 328 ns 312 as ns 354 as 337
Amp 9.3 10.1 - -54 - 72 - 24 -- 15
(A) 37 36 N 22 22 11 7 16 15
S W l d Lat 414 422
Amp - 18 - 2 1
(A) 40 56
N 8 11
SW2d Lat 525 497 * 556 593 564 534
Amp - 5.4 - 3 . 4 33 32 - 1 7
(A) 43 54 50 40
N 22 22 10 10 14 14
a Plusses before the numbers indicate a significantly different latency in the depth site as compared to CPz (2-tailed group t test, performed if N > 6). + = P < 0 . 0 5 ; + + = P < 0 . 0 1 ; ÷ + + = P < 0 . 0 0 1 .
b Stars after the numbers indicate a significantly shorter P3a latency to rare distractors (D) as compared to rare targets (T), (1-tailed paired t test, performed i f N > 6). * P < 0.05; * * P < 0.005; * * * P < 0.001; ns = not significant.
Please see list of abbreviations for anatomical sites. T-F = target minus frequent wave; D-F = distract minus frequent wave; Lat = latency; Amp =
amplitude; (A) = absolute value of amplitude; N = number of observations.
Table 4
Average amplitude and latency of scalp and parietal lobe potentials to Frequent, Target and Distractor tones
CPz sMg pCG psP
F T D F T D T D T D
N1 Lat 108 123 124 107 114 112
Amp - 4 . 9 - 5 . 9 - 7 . 2 - 16 - 19 - 24
N 26 27 26 11 12 12
N2 Lat 244 214 * * 214 207 242 207 * * 221 222
Amp - 6 . 0 - 5 . 2 - 3 1 - 4 2 - 2 5 - 25 8 3
N 26 26 13 13 8 8 4 4 P3 Lat 359 313 ** * ++ 312 + 291 as ++ 313 + 282 * 381 336
Amp 9.6 10.7 19 12 8 29 71 69
N 26 26 15 15 8 8 4 4
S W l Lat 378 368 423 388
Amp - 3 3 - 4 0 - 2 8 - 2 5
N 12 13 7 7
SW2 L ~ 493 462 572 525 564 517 Amp - 3.3 - 1.2 2 - 11 27 30
(A) 23 22 N 25 25 7 7 3 3
Plusses indicate a significantly different latency in the depth site as compared to CPz (2-tailed group t test, performed if N > 6). + = P < 0.05;
+ + = P < 0.01. Stars indicate a significantly shorter P3a latency to rare distractors (D) as compared to rare targets (T), (1-tailed paired t test, performed if N > 6). * P < 0.05; * * P < 0.01; ns = not significant.
Please see list of abbreviations for anatomical sites: F = frequent tone; T = target tone; D = distractor tone; Lat = latency; Amp = amplitude; N = number
of observations; (A) = absolute value.
206 E. Halgren et al. / Electroencephalography and clinical Neurophysiology 94 (1995) 191-220
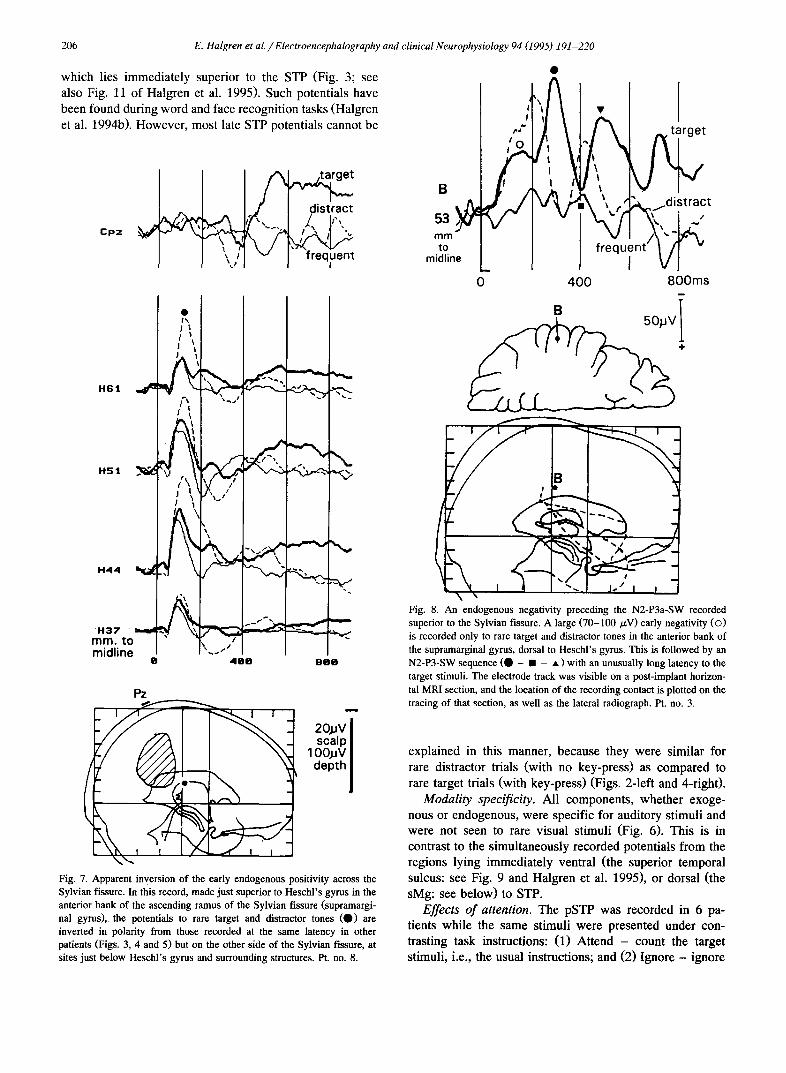
which lies immediately superior to the STP (Fig. 3; see also Fig. 11 of Halgren et al. 1995). Such potentials have been found during word and face recognition tasks (Halgren et al. 1994b). However, most late STP potentials cannot be
m istract
frequent I
t,L
I~ t ,~
Cpz
\
4 0 0 0 0 0
H6'J. . 4 ~
J ~ t
:,a /~ \ ] ,
H 4 4 ~ _ ~
H 3 7 ~ , ~ ~ I ~ ram. to midline
o
20jJV I scalp I
100)JV I depth I
Pz
Fig. 7 . Apparent inversion of the early endogenous positivity across the Sylvian fissure. In this record, made just superior to Heschl's gyrus in the anterior bank of the ascending ramus of the Sylvian fissure (supramargi- nal gyms), the potentials to rare target and distractor tones (O) are inverted in polarity from those recorded at the same latency in other patients (Figs. 3, 4 and 5)but on the other side of the Sylvian fissure, at sites just below Heschl's gyrus and surrounding structures. Pt. no. 8.
I I
,o
53
mme L to midlin
0
get
/ I~ , r " ~.~,.~jdistract
N, , I ~ , ,°.ur°¢ 400 800ms
i
,P
\ i
~. j . .1 1 I
Fig. 8. An endogenous negativity preceding the N2-P3a-SW recorded superior to the Sylvian fissure. A large (70-100/zV) early negativity (©) is recorded only to rare target and distractor tones in the anterior bank of the supramarginal gyms, dorsal to Heschl's gyms. This is followed by an N2-P3-SW sequence (O - • - • ) with an unusually long latency to the target stimuli. The electrode track was visible on a post-implant horizon- tal MRI section, and the location of the recording contact is plotted on the tracing of that section, as well as the lateral radiograph. Pt. no. 3.
explained in this manner, because they were similar for rare distractor trials (with no key-press) as compared to rare target trials (with key-press) (Figs. 2-1eft and 4-right).
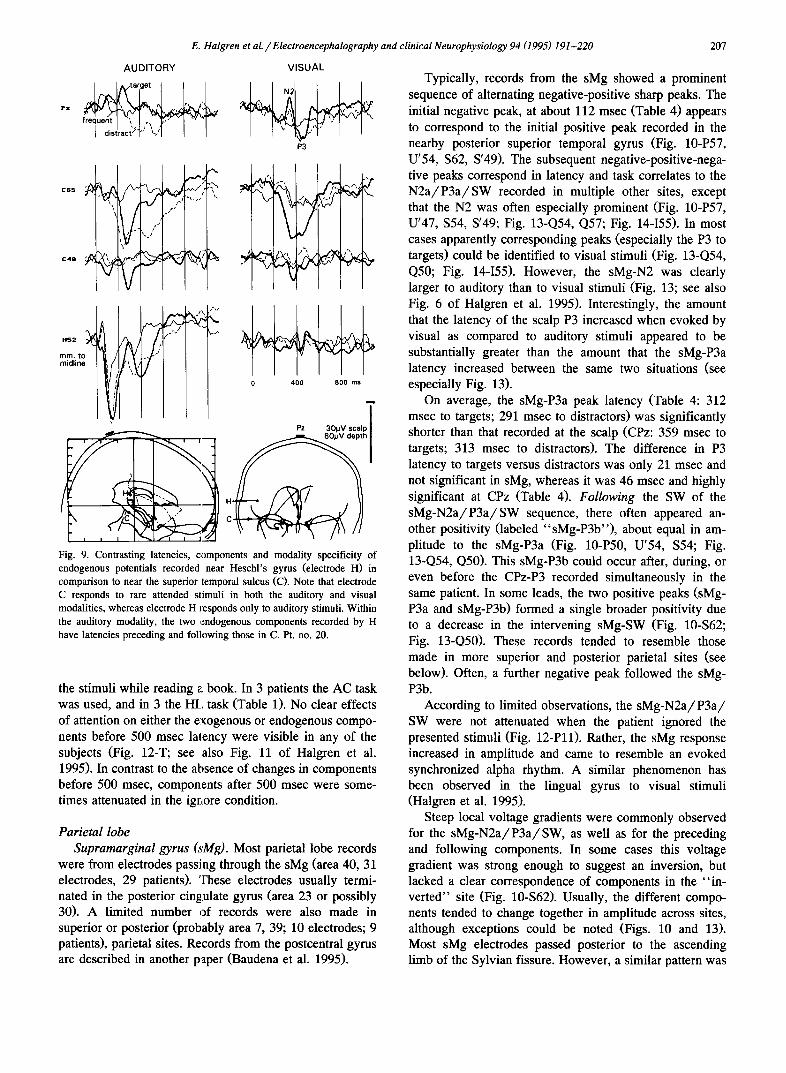
Modality specificity. All components, whether exoge- nous or endogenous, were specific for auditory stimuli and were not seen to rare visual stimuli (Fig. 6). This is in contrast to the simultaneously recorded potentials from the regions lying immediately ventral (the superior temporal sulcus: see Fig. 9 and Halgren et al. 1995), or dorsal (the sMg: see below) to STP.
Effects of attention. The pSTP was recorded in 6 pa- tients while the same stimuli were presented under con- trasting task instructions: (1) Attend - count the target stimuli, i.e., the usual instructions; and (2) Ignore - ignore
cG5
c4e ~ '
ram. to rnidline
E. Halgren et aL /Electroencephalography and clinical Neurophysiology 94 (1995) 191-220
VISUAL
P3
AUDITORY
frequent I 4 I ,, ~'~ " J TM "J
Ii V ~
X!
i .ee
t ~ I
0 400 800 ms
m
k N ~ ; I
i i
Pz 30pV =
Fig. 9. Contrasting latencies, components and modality specificity of endogenous potentials recorded near Heschl's gyrus (electrode H) in comparison to near the superior temporal sulcus (C). Note that electrode C responds to rare attended stimuli in both the auditory and visual modalities, whereas electrode H responds only to auditory stimuli. Within the auditory modality, the two ,zndogenous components recorded by H have latencies preceding and following those in C. Pt. no. 20.
the stimuli while reading ~ book. In 3 patients the AC task was used, and in 3 the HI_, task (Table 1). No clear effects of attention on either the exogenous or endogenous compo- nents before 500 msec lalency were visible in any of the subjects (Fig. 12-T; see also Fig. 11 of Halgren et al. 1995). In contrast to the absence of changes in components before 500 msec, components after 500 msec were some- times attenuated in the ignore condition.
Parietal lobe Supramarginal gyrus (sMg). Most parietal lobe records
were from electrodes passing through the sMg (area 40, 31 electrodes, 29 patients). These electrodes usually termi- nated in the posterior cingnlate gyrus (area 23 or possibly 30). A limited number of records were also made in superior or posterior (probably area 7, 39; 10 electrodes; 9 patients), parietal sites. Records from the postcentral gyrus are described in another paper (Baudena et al. 1995).
207
Typically, records from the sMg showed a prominent sequence of alternating negative-positive sharp peaks. The initial negative peak, at about 112 msec (Table 4) appears to correspond to the initial positive peak recorded in the nearby posterior superior temporal gyrus (Fig. 10-P57, U'54, $62, S'49). The subsequent negative-positive-nega- tive peaks correspond in latency and task correlates to the N 2 a / P 3 a / S W recorded in multiple other sites, except that the N2 was often especially prominent (Fig. 10-P57, U'47, $54, S'49; Fig. 13-Q54, Q57; Fig. 14-I55). In most cases apparently corresponding peaks (especially the P3 to targets) could be identified to visual stimuli (Fig. 13-Q54, Q50; Fig. 14-155). However, the sMg-N2 was clearly larger to auditory than to visual stimuli (Fig, 13; see also Fig. 6 of Halgren et al. 1995). Interestingly, the amount that the latency of the scalp P3 increased when evoked by visual as compared to auditory stimuli appeared to be substantially greater than the amount that the sMg-P3a latency increased between the same two situations (see especially Fig. 13).
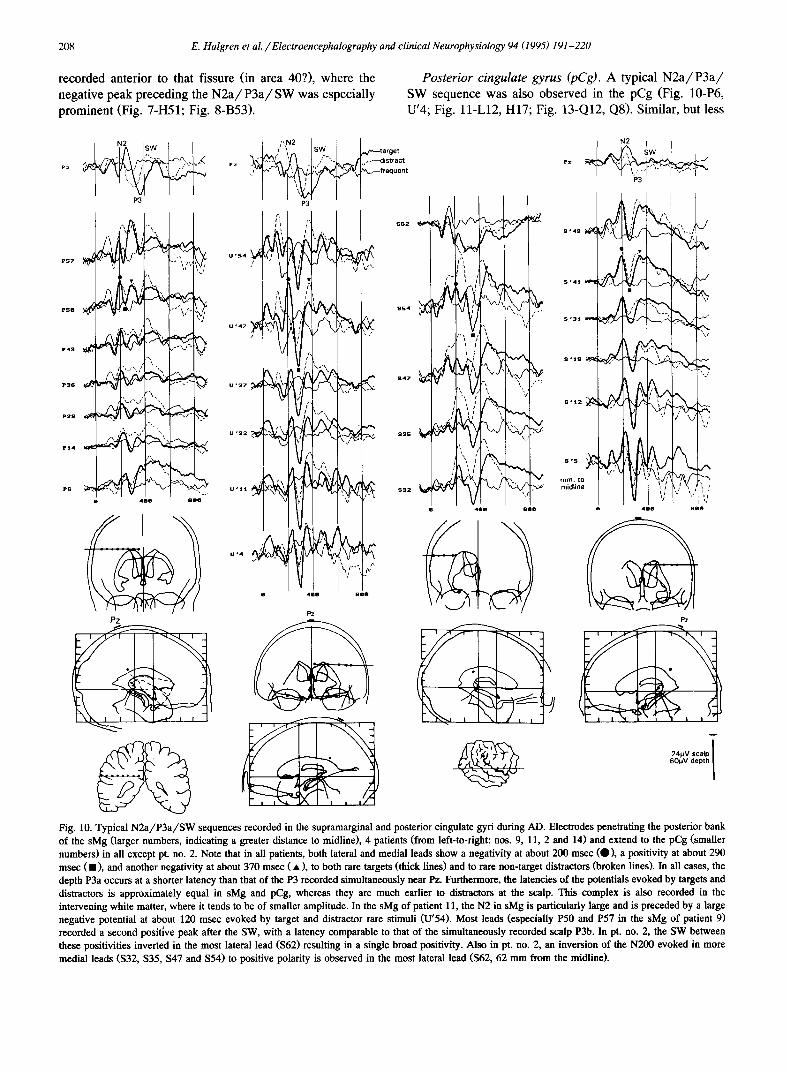
On average, the sMg-P3a peak latency (Table 4 :312 msec to targets; 291 msec to distractors) was significantly shorter than that recorded at the scalp (CPz: 359 msec to targets; 313 msec to distractors). The difference in P3 latency to targets versus distractors was only 21 msec and not significant in sMg, whereas it was 46 msec and highly significant at CPz (Table 4). Following the SW of the sMg-N2a /P3a /SW sequence, there often appeared an- other positivity (labeled "sMg-P3b"), about equal in am- plitude to the sMg-P3a (Fig. 10-P50, U'54, $54; Fig. 13-Q54, Q50). This sMg-P3b could occur after, during, or even before the CPz-P3 recorded simultaneously in the same patient. In some leads, the two positive peaks (sMg- P3a and sMg-P3b) formed a single broader positivity due to a decrease in the intervening sMg-SW (Fig. 10-$62; Fig. 13-Q50). These records tended to resemble those made in more superior and posterior parietal sites (see below). Often, a further negative peak followed the sMg- P3b.
According to limited observations, the sMg-N2a/P3a / SW were not attenuated when the patient ignored the presented stimuli (Fig. 12-Pll). Rather, the sMg response increased in amplitude and came to resemble an evoked synchronized alpha rhythm. A similar phenomenon has been observed in the lingual (Halgren et al. 1995).
Steep local voltage gradients for the sMg-N2a/P3a /SW, as and following components. In
gyrus to visual stimuli
were commonly observed well as for the preceding some cases this voltage
gradient was strong enough to suggest an inversion, but lacked a clear correspondence of components in the "in- verted" site (Fig. 10-$62). Usually, the different compo- nents tended to change together in amplitude across sites, although exceptions could be noted (Figs. 10 and 13). Most sMg electrodes passed posterior to the ascending limb of the Sylvian fissure. However, a similar pattern was
208 E. Halgren et al. / Electroencephalography and clinical Neurophysiology 94 (1995) 191-220
recorded anterior to that fissure (in area 40?), where the negative peak preceding the N2a/P3a/SW was especially prominent (Fig. 7-H51; Fig. 8-B53).
Posterior cingulate gyrus (pCg). A typical N2a/P3a/ SW sequence was also observed in the pCg (Fig. 10-P6, U'4; Fig. 11-L12, H17; Fig. 13-Q12, Q8). Similar, but less
P s ,
e4~
r3s ~# .
P2S
i ' 14
P6 ; ~
P3
V,'~
\
e 4 0 0 o e e
r
Pz
, 1
( =. k ~4 '
- l ~ / ~',- ~ ,----distract ~ ~ _ - '/ • --frequent
i
u .~s4
u ,47
u ,37
o.==.~%
P3
i'q
v
,: ,,,"
4ee see
Pz
ss2 ~ * :7
,,, e/ ;J ' , /
~', V J ',¢ i
;^ ' , ,' ~ , ~ . , ~ ,
S '41
S '31 m
s ,s l l
S ' 12
s , s ~ .
~ ram. to midline
P3
i
L
..... ~ ' ; ~ ~'V
4 1 m
'~t \s
2,.v.o.,pl 60JJV depth I
Fig. 10. Typical N2a /P3a /SW sequences recorded in the supramarginal and posterior cingulate gyri during AD. Electrodes penetrating the posterior bank of the sMg (larger numbers, indicating a greater distance to midline), 4 patients (from left-to-right: nos. 9, 11, 2 and 14) and extend to the pCg (smaller numbers) in all except pt. no. 2. Note that in all patients, both lateral and medial leads show a negativity at about 200 msec (O), a positivity at about 290 msec ( • ) , and another negativity at about 370 msec ( • ), to both rare targets (thick lines) and to rare non-target distractors (broken lines). In all cases, the depth P3a occurs at a shorter latency than that of the P3 recorded simultaneously near Pz. Furthermore, the latencies of the potentials evoked by targets and distractors is approximately equal in sMg and pCg, whereas they are much earlier to distractors at the scalp. This complex is also recorded in the intervening white matter, where it tends to be of smaller amplitude. In the sMg of patient 11, the N2 in sMg is particularly large and is preceded by a large negative potential at about 120 msec evoked by target and distractor rare stimuli (U'54). Most leads (especially P50 and P57 in the sMg of patient 9) recorded a second positive peak after the SW, with a latency comparable to that of the simultaneously recorded scalp P3b. In pt. no. 2, the SW between these positivities inverted in the most lateral lead ($62) resulting in a single broad positivity. Also in pt. no. 2, an inversion of the N200 evoked in more medial leads ($32, $35, $47 and $54) to positive polarity is observed in the most lateral lead ($62, 62 mm from the midline).
E. Halzren et al. / Electroencephalography and clinical Neurophysiology 94 (1995) 191-220
PZ.
H 4 9 " ~
SPL / I t
/ x
800 ms.
H Pz
H
PCG
o ~ ~ ram. to midline 0 400
' . " e o ~ v I
Fig. 11. Parietal N2a/P3a/SW in a patient with a temporo-parietal lesion. Records from 2 electrodes approaching the posterior cingulate gyrus (PCG) from the superior parietal lobule (SPL, electrode H) and the lateral surface (electrode L). The latter electrode passes through a surgical lesion centered on the angular gyrus (visible on the MRI tracing and as the cross-hatched area on the lateral and AP view schemas). A triphasic complex corresponding to N2 (O), P3a ( a ) and SW2 (n) is visible in the PCG and SPL, where steep voltage gradients suggest local generation. An N2a/P3a/SW2 complex was, also recorded in the lesion, but without voltage gradient, as would be expected of volume-conducted activity. Note also that the P3 to targets is. relatively attenuated and delayed at the scalp and depth, in comparison to the P3 to distractors. An attenuated scalp P3 to targets has been reported by Knight et al. (1989) after similar lesions. AD task, pt. no. 8.
prominent, peaks were evoked by rare visual stimuli (Fig. 13-Q12). Although no clear inversions were noted in this region, voltage gradients were typically steep in both the horizontal and vertical planes, strongly suggesting local generation. In contrast to sMg, peaks preceding and fol- lowing the N 2 a / P 3 a / S W were less common in pCg.
The amplitude of the pCg-P3a to targets versus distrac- tors was compared using a paired t test and found to be
209
significantly different (distractors > targets) at the P (2- tailed) < 0.02 level. This was the only site where this comparison demonstrated significant amplitude differ- ences.
Posterior and superior parietal lobe. Other more poste- rior and superior lateral parietal regions often showed moderately large (up to 90 /zV) P3-1ike positivities to both auditory and visual rare stimuli (Fig. 14-Q42). Unlike the P3a recorded in the sMg, the average latency of the P3 in superior-posterior parietal sites (381 msec to targets, 336 msec to distractors: Table 4) was later than that of the CPz-P3. In one subject the P3 was found to invert at an electrode passing just posterior to the post-central sulcus, probably through area 5 (Fig. 20-P'42 of Halgren et al. 1994a). This potential had a latency of 300 msec (clearly later than that of the P3a recorded at 260 msec in the sMg of the same patient) and was not related to the overt behavioral response, being equal to target and non-target rare stimuli.
4. Discussion
Multiple systems activated The current study found 3 broad anatomo-physiological
patterns of activity evoked by rare target and distractor stimuli. The first, localized to the superior temporal plane, began at a relatively short latency and was specific to the auditory modality. The second, prominent in the posterior cingulate and supramarginal gyri, resembled the scalp N 2 / P 3 a / S W sequence. The third, rarely but convincingly observed in the posterior parietal cortex, resembled the scalp and hippocampal P3b.
Early auditory-specific endogenous activity in the superior temporal plane
Exogenous STP-IO0/200. Auditory but not visual stimuli evoked an exogenous positive-negative sequence with peak latencies of about 100-200 msec in most pSTP sites. These peaks, termed the STP-100 and STP-200, were evoked equally by frequent and rare tones and were not affected by attention, but were enhanced by an apparently frequency-specific dishabituation. In these characteristics, as well as in their wave form and latency, the STP-100 and STP-200 correspond well to those of the scalp N1 and scalp P2, respectively (Butler 1968). At least 6 negativities have been identified at the scalp to be active during the 100-200 msec latency range (N~i~it~inen and Picton 1986b), including 3 associated with the N1 proper. The largest is the Nlb , maximal at Cz, and with scalp EEG (Vaughan and Ritter 1970), MEG (Hari et al. 1984; Arthur et al. 1987), and far-field depth (Richer et al. 1989) topographies consistent with a generator in the pSTP. Lesion studies have suggested that primary auditory cortex may not be involved (N~i~it~inen and Picton 1986b; Woods et al. 1987). Recent depth recording directly from the pSTP (Li6geois-
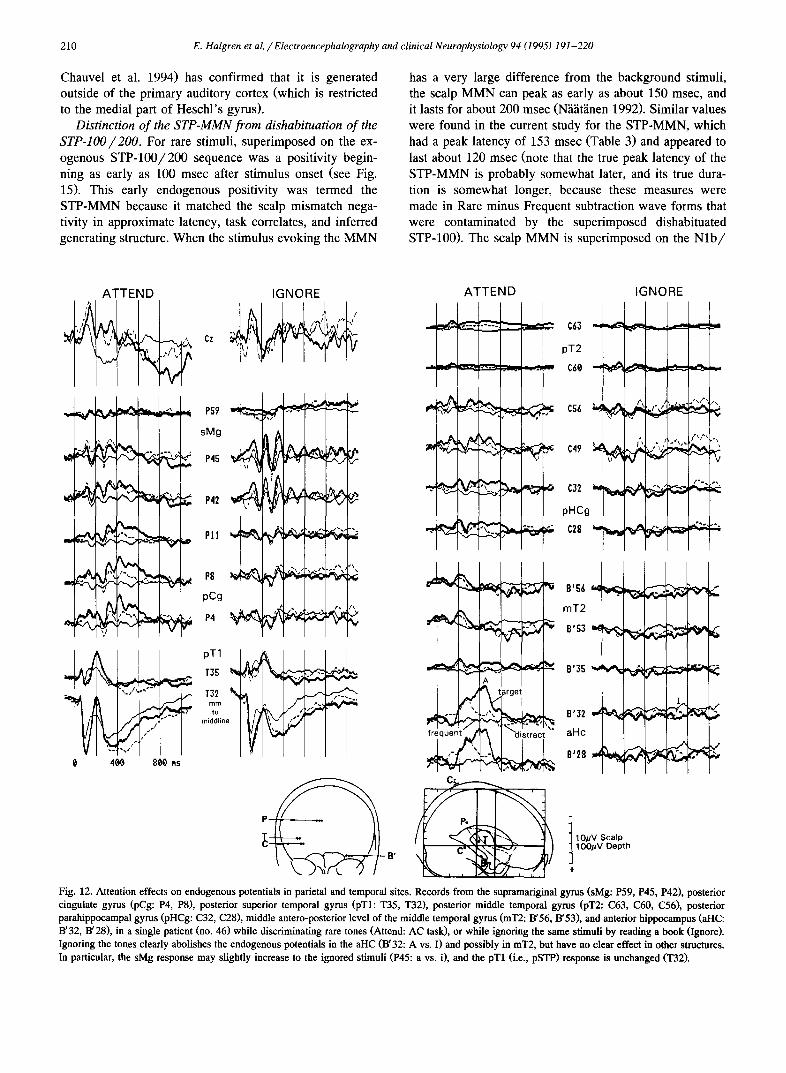
210 E. Halgren et al. / Electroencephalography and clinical Neurophysiology 94 (1995) 191-220
Chauvel et al. 1994) has confirmed that it is generated outside of the primary auditory cortex (which is restricted to the medial part of Heschl's gyrus).
Distinction of the STP-MMN from dishabituation of the STP-IO0/200. For rare stimuli, superimposed on the ex- ogenous STP-100/200 sequence was a positivity begin- ning as early as 100 msec after stimulus onset (see Fig. 15). This early endogenous positivity was termed the STP-MMN because it matched the scalp mismatch nega- tivity in approximate latency, task correlates, and inferred generating structure. When the stimulus evoking the MMN
has a very large difference from the background stimuli, the scalp MMN can peak as early as about 150 msec, and it lasts for about 200 msec (N~i~it~inen 1992). Similar values were found in the current study for the STP-MMN, which had a peak latency of 153 msec (Table 3) and appeared to last about 120 msec (note that the true peak latency of the STP-MMN is probably somewhat later, and its true dura- tion is somewhat longer, because these measures were made in Rare minus Frequent subtraction wave forms that were contaminated by the superimposed dishabituated STP-100). The scalp MMN is superimposed on the N l b /
ATTEND
a
-....
. I o ~
0 4ee 8~e .s
Cz
IGNORE
PS? ~ ~%~ ~ ~-~"
sMg
Pll
P8 ~ " . . . . .
pCg
P4 ~ a ' ~
pT1
f35
T32 rnm to
middline "i %
ATTEND
pT2
. . . . . . . . . . . . . . . . --- C&~)
pHCg
~ ~ f r e q u e r ~
B'S6
roT2
B'S3
B'35
aHc
B'28
IGNORE
-Z-2 /
I
I 10//V Scalp 100#V Depth
÷
Fig. 12. Attention effects on endogenous potentials in parietal and temporal sites. Records from the supramariginal gyrus (sMg: P59, P45, P42), posterior cingulate gyrus (pCg: P4, P8), posterior superior temporal gyrus (pTl: T35, T32), posterior middle temporal gyms (pT2: C63, C60, C56), posterior parahippocampal gyms (pHCg: C32, C28), middle antero-posterior level of the middle temporal gyrus (roT2: B'56, B'53), and anterior hippocampus (aHC: B'32, B'28), in a single patient (no. 46) while discriminating rare tones (Attend: AC task), or while ignoring the same stimuli by reading a book (Ignore). Ignoring the tones clearly abolishes the endogenous potentials in the aHC (B'32: A vs. I) and possibly in roT2, but have no clear effect in other structures. In particular, the sMg response may slightly increase to the ignored stimuli (P45: a vs. i), and the pT1 (i.e., pSTP) response is unchanged (T32).
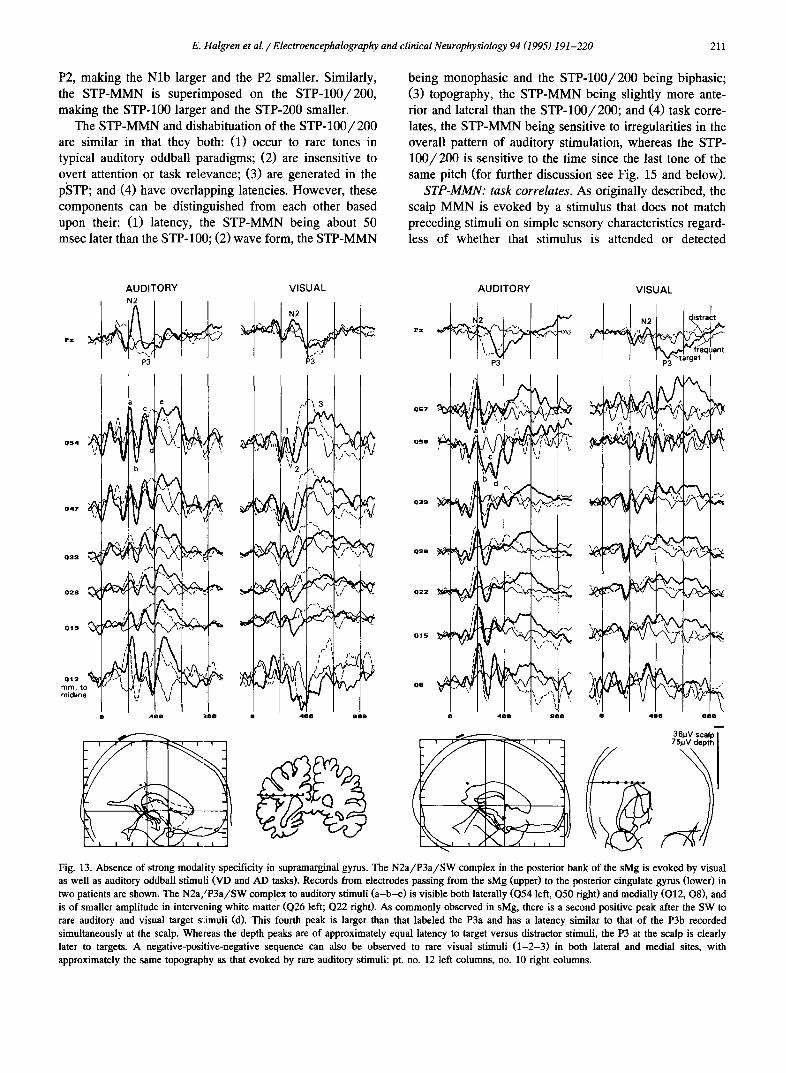
E. Halgren et aL / Electroencephalography and clinical Neurophysiology 94 (1995) 191-220 211
P2, making the Nlb larger and the P2 smaller. Similarly, the STP-MMN is superimposed on the STP-100/200, making the STP-100 larger and the STP-200 smaller.
The STP-MMN and dishabituation of the STP-100/200 are similar in that they both: (1) occur to rare tones in typical auditory oddball paradigms; (2) are insensitive to overt attention or task relevance; (3) are generated in the pSTP; and (4) have overlapping latencies. However, these components can be distinguished from each other based upon their: (1) latency, the STP-MMN being about 50 msec later than the STP-100; (2) wave form, the STP-MMN
being monophasic and the STP-100/200 being biphasic; (3) topography, the STP-MMN being slightly more ante- rior and lateral than the STP-100/200; and (4) task corre- lates, the STP-MMN being sensitive to irregularities in the overall pattern of auditory stimulation, whereas the STP- 100/200 is sensitive to the time since the last tone of the same pitch (for further discussion see Fig. 15 and below).
STP-MMN: task correlates. As originally described, the scalp MMN is evoked by a stimulus that does not match preceding stimuli on simple sensory characteristics regard- less of whether that stimulus is attended or detected
AUDITORY
P3
047
Q33
Q2G
4 ) t9
e
|1 d ~ - . , ,
b
0 1 2 ~
mm. to midline
• ~ee ~ee
VISUAL
I I
f ¢ 1 J \ l
-'~.
~ '>~ / /'v~
o s 7
050
o z s
o 2 .
AUDITORY
P3
/
/
i
W
4~0 oee
VISUAL
I J N21 J ~istra!t
I I ~ ~ * trequent I I I ~3~-target I
I I
4 m o 8 B B
• : 4 ~ ' ~ - - . . . .
Fig. 13. Absence of strong modality specificity in supramarginal gyms. The N2a /P3a /SW complex in the posterior bank of the sMg is evoked by visual as well as auditory oddball stimuli (VD and AD tasks). Records from electrodes passing from the sMg (upper) to the posterior cingulate gyrus (lower) in two patients are shown. The N2a /P3a /SW complex to auditory stimuli ( a -b -c ) is visible both laterally (Q54 left, Q50 fight) and medially (Q12, Q8), and is of smaller amplitude in intervening white matter (Q26 left; Q22 right). As commonly observed in sMg, there is a second positive peak after the SW to rare auditory and visual target stimuli (d). This fourth peak is larger than that labeled the P3a and has a latency similar to that of the P3b recorded simultaneously at the scalp. Whereas the depth peaks are of approximately equal latency to target versus distractor stimuli, the P3 at the scalp is deafly later to targets. A negative-positive-negative sequence can also be observed to rare visual stimuli (1 -2-3) in both lateral and medial sites, with approximately the same topography as that evoked by rare auditory stimuli: pt. no. 12 left columns, no. 10 right columns.
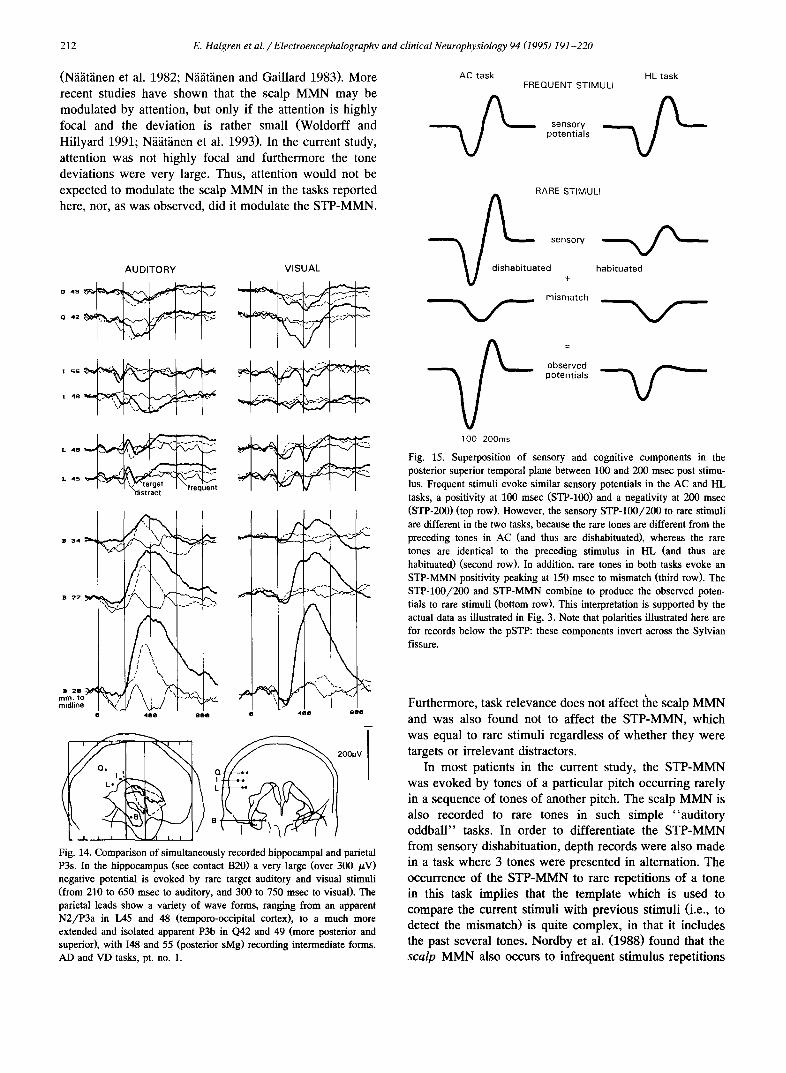
212 E. Halgren et al. / Electroencephalography and clinical Neurophysiology 94 (1995) 191-220
(N~i~it~inen et al. 1982; N5~itSnen and Gaillard 1983). More recent studies have shown that the scalp MMN may be modulated by attention, but only if the attention is highly focal and the deviation is rather small (Woldorff and Hillyard 1991; N~i~it~inen et al. 1993). In the current study, attention was not highly focal and furthermore the tone deviations were very large. Thus, attention would not be expected to modulate the scalp MMN in the tasks reported here, nor, as was observed, did it modulate the STP-MMN.
AUDITORY O 4 9 ~ Q 42
,55 I 4 8
VISUAL
I I 3 4 ~B'hql
B 2 7 ~ ' *
rnidline
/ ; I",,
\ / ," \ # t
J r
4 O O 8 0 0
I i J l I I
g
o 4 0 0 8 0 0
E I ~ 2 00,u v
Fig. 14. Comparison of simultaneously recorded hippocampal and parietal P3s. In the hippocampus (see contact B20) a very large (over 300 /zV) negative potential is evoked by rare target auditory and visual stimuli (from 210 to 650 msee to auditory, and 300 to 750 msec to visual). The parietal leads show a variety of wave forms, ranging from an apparent N2/P3a in IA5 and 48 (temporo-occipital cortex), to a much more extended and isolated apparent P3b in Q42 and 49 (more posterior and superior), with 148 and 55 (posterior sMg) recording intermediate forms. AD and VD tasks, pt. no. 1.
AC task HL task FREQUENT STIMULI
sens°r potentials
RA R E STIMULI
sensory ~ ' ~
ted + habituated
mismatch
" V
V - - ' - observed potentials
100 2OOms Fig. 15. Superposition of sensory and cognitive components in the posterior superior temporal plane between 100 and 200 msec post stimu- lus. Frequent stimuli evoke similar sensory potentials in the AC and HL tasks, a positivity at 100 msec (STP-100) and a negativity at 200 msec (STP-200) (top row). However, the sensory STP-100/200 to rare stimuli are different in the two tasks, because the rare tones are different from the preceding tones in AC (and thus are dishabituated), whereas the rare tones are identical to the preceding stimulus in HL (and thus are habituated) (second row). In addition, rare tones in both tasks evoke an STP-MMN positivity peaking at 150 msec to mismatch (third row). The STP-100/200 and STP-MMN combine to produce the observed poten- tials to rare stimuli (bottom row). This interpretation is supported by the actual data as illustrated in Fig. 3. Note that polarities illustrated here are for records below the pSTP: these components invert across the Sylvian fissure.
Furthermore, task relevance does not affect the scalp MMN and was also found not to affect the STP-MMN, which was equal to rare stimuli regardless of whether they were targets or irrelevant distractors.
In most patients in the current study, the STP-MMN was evoked by tones of a particular pitch occurring rarely in a sequence of tones of another pitch. The scalp MMN is also recorded to rare tones in such simple "auditory oddball" tasks. In order to differentiate the STP-MMN from sensory dishabituation, depth records were also made in a task where 3 tones were presented in alternation. The occurrence of the STP-MMN to rare repetitions of a tone in this task implies that the template which is used to compare the current stimuli with previous stimuli (i.e., to detect the mismatch) is quite complex, in that it includes the past several tones. Nordby et al. (1988) found that the scalp MMN also occurs to infrequent stimulus repetitions
E. Halgren et al. /Electroencephalography and clinical Neurophysiology 94 (1995) 191-220 213
in regular sequence of alternating tones. However, unlike our depth results, their effect did not begin until after 150 msec and was not significant until after 200 msec. In contrast to Nordby et al. (1988), Ritter et al. (1992) found no scalp MMN to repeating stimuli in a regularly alternat- ing series, regardless of whether they were attended or not. In Ritter et al.'s task, stimulus repetitions occurred on 20% of trials, and tones differed in pitch by only 50 Hz; whereas in Nordby et al.'s task, repetitions occurred on 10% of trials, and tones differing by 500 Hz in pitch. The HL task used in the current study resembled Nordby et al.'s task in that repetitions occurred on 10% of trials, and tones differing by 680 or 1500 Hz in pitch. Thus, the divergent results cited above could be explained if large pitch differences and low probability of repetition were to encourage the automatic formation of complex sensory templates that include at least the previous two tones. In any case, the current records strongly suggest that at an early latency the auditory cortex detects a mismatch be- tween the current stimulu:~ and a fairly complex sensory template that includes more than just the previous stimu- lus. This conclusion is consistent with recent studies demonstrating that the scalp MMN can reflect a mismatch much more complex than a simple change in pitch (Alho et al. 1993; Tervaniemi et al. 1994).
STP-MMN: generators. It has been calculated that an equivalent current dipole in the pSTP could account for the extracranial electrical (Scherg et al. 1989) and magnetic (Hari 1989) fields of the MMN. This equivalent dipole is just anterior to the equivalent dipole calculated for the scalp Nlb. However, the observed extracranial field is equally consistent with generation distributed over an STP cortical surface of a few cm 2 (Ary et al. 1981; Pelizzone and Hari 1986). Polarity inversion across the Sylvian fissure in the records reported here clearly supports local generation of the STP-MMN in the pSTP. The distribution of the STP-MMN further suggests generation in a fairly extended region that probably does not include the primary auditory cortex in medial HG, but appears to include areas immediately anterior, posl:erior and lateral to it, without including either the lateral surface of the superior temporal gyrus or most of the aSTP. In addition, a possible MMN was recorded in the fundus of the superior temporal sulcus, inferior to the records reported here (see Fig. 4 of Halgren et al. 1995). Such extra-STP generators need to be more rigorously characterized aad, in any case, were far more rarely recorded than the STP-MMN.
In conclusion, the current direct recordings from the pSTP confirm the hypotheses derived from scalp EEG and MEG records that the MMN is indeed generated in the pSTP, in a location that is not identical to that of the Nlb (Lirgeois-Chauvel et al. 1994). However, the current records suggest that the STP-MMN may be generated over a fairly extensive cortical surface that is incompletely characterized as a single dipole, and that this surface overlaps with that which generates the Nlb.
Late auditory-specific endogenous activity in the superior temporal plane
STP-N2. Large (up to 200 /xV) modality-specific en- dogenous potentials continued for over 1 sec after the stimulus in the STP, including components at the latencies of the scalp N2 and P3. When observed in subtraction wave forms, these late endogenous components attenuated or inverted at more medial sites without any apparent correspondence to the sites where earlier components ap- peared to invert. More anteriorly in the STP, the later components could occur in relative isolation.
The component in the STP following the STP-MMN has a latency that corresponds to that of the scalp N2b. Like the scalp MMN, the scalp N2b is evoked by stimuli that do not match the preceding series. The scalp N2b is distinguished from the scalp MMN in that it usually requires attention, has longer latency, and has a more posterior scalp distribution (Ritter et al. 1984; Pritchard et al. 1988). Fitzgerald and Picton (1983) interpret the scalp MMN as identifying possible targets, and the N2b as the subsequent allocation of attention to their evaluation.
The existence of a modality-specific depth-N2b is con- sistent with the modality specificity of the scalp N2b (Vaughan et al. 1980). Modality-specific depth-N2s to auditory stimuli were also observed in this study in the sMg. Conversely, modality-specific depth-N2s to visual stimuli have been observed in the occipito-temporal cortex in a companion study (Halgren et al. 1995). However, unlike the scalp N2b, the STP-N2 and sMg-N2 appeared to be unaffected by attention in the current study.
STP-P3. In contrast to the scalp N2b, most authors have found that the P3 has a modality non-specific scalp topog- raphy (Vaughan et al. 1980). In addition, most previous depth recordings have failed to find a modality-specificity of the depth-P3, especially as recorded in the medial temporal lobe (Halgren et al. 1980; Stapleton and Halgren 1987; McCarthy et al. 1989; but see Squires et al. 1983 for possible exceptions). Although brain lesions have differen- tial effects on P3s evoked by visual versus auditory stimuli (Barbas and Mesulam 1985; Johnson 1989), such results could represent antecedent processes preceding P3 genera- tion. In addition, differences in scalp P3 topography across modalities could result from different amounts of P3a versus P3b evoked by the two tasks, rather than represent- ing true modality differences. Similarly, although P3m generators have been localized to sensory association cor- tex based on MEG (Richer et al. 1983; Rogers et al. 1991), other authors using the same technique have found genera- tors elsewhere (Okada et al. 1983; Lewine et al. 1989). Thus, the current study appears to be the first to clearly demonstrate modality-specific generators active during the P3, using depth recording.
In summary, these results suggest that the STP-MMN, STP-N2, and STP-P3 are all generated mainly within the pSTP, and that their generating area may even include the lateral portion of Heschl's gyms. Thus, the fields immedi-
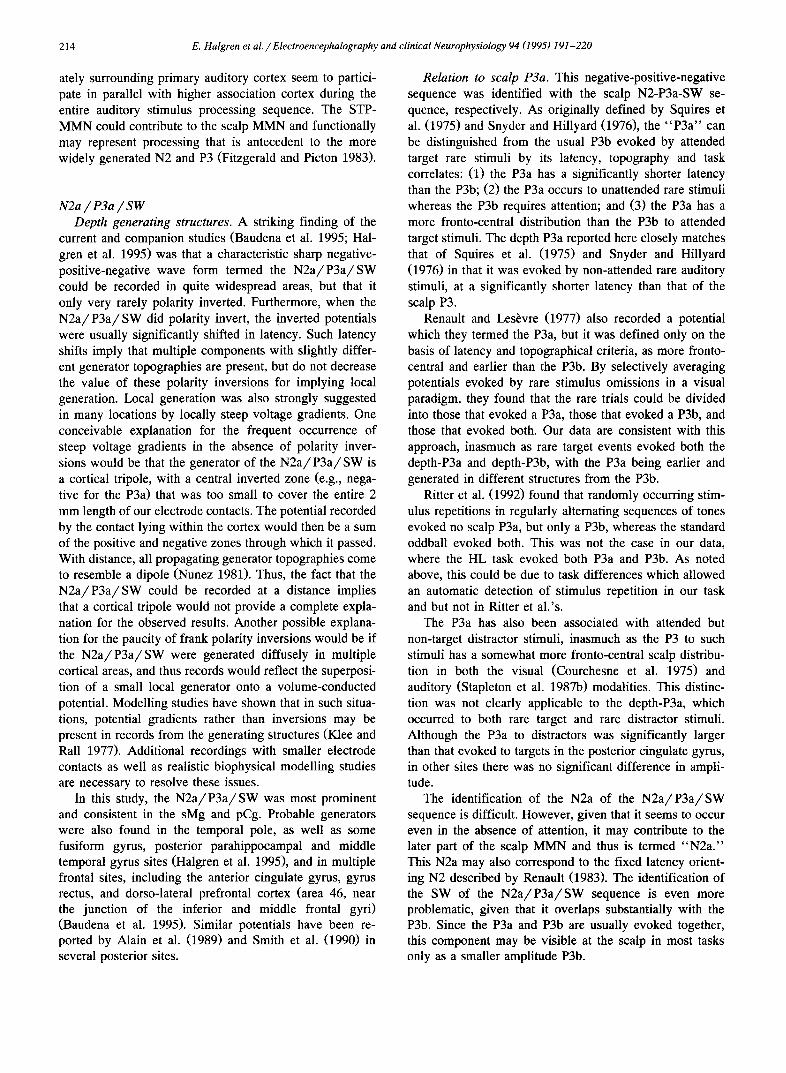
214 E. Halgren et al. / Electroencephalography and clinical Neurophysiology 94 (1995) 191-220
ately surrounding primary auditory cortex seem to partici- pate in parallel with higher association cortex during the entire auditory stimulus processing sequence. The STP- MMN could contribute to the scalp MMN and functionally may represent processing that is antecedent to the more widely generated N2 and P3 (Fitzgerald and Picton 1983).
N2a / P3a / SW Depth generating structures. A striking finding of the
current and companion studies (Baudena et al. 1995; Hal- gren et al. 1995) was that a characteristic sharp negative- positive-negative wave form termed the N 2 a / P 3 a / S W could be recorded in quite widespread areas, but that it only very rarely polarity inverted. Furthermore, when the N 2 a / P 3 a / S W did polarity invert, the inverted potentials were usually significantly shifted in latency. Such latency shifts imply that multiple components with slightly differ- ent generator topographies are present, but do not decrease the value of these polarity inversions for implying local generation. Local generation was also strongly suggested in many locations by locally steep voltage gradients. One conceivable explanation for the frequent occurrence of steep voltage gradients in the absence of polarity inver- sions would be that the generator of the N 2 a / P 3 a / S W is a cortical tripole, with a central inverted zone (e.g., nega- tive for the P3a) that was too small to cover the entire 2 mm length of our electrode contacts. The potential recorded by the contact lying within the cortex would then be a sum of the positive and negative zones through which it passed. With distance, all propagating generator topographies come to resemble a dipole (Nunez 1981). Thus, the fact that the N 2 a / P 3 a / S W could be recorded at a distance implies that a cortical tripole would not provide a complete expla- nation for the observed results. Another possible explana- tion for the paucity of frank polarity inversions would be if the N 2 a / P 3 a / S W were generated diffusely in multiple cortical areas, and thus records would reflect the superposi- tion of a small local generator onto a volume-conducted potential. Modelling studies have shown that in such situa- tions, potential gradients rather than inversions may be present in records from the generating structures (Klee and Rail 1977). Additional recordings with smaller electrode contacts as well as realistic biophysical modelling studies are necessary to resolve these issues.
In this study, the N 2 a / P 3 a / S W was most prominent and consistent in the sMg and pCg. Probable generators were also found in the temporal pole, as well as some fusiform gyrus, posterior parahippocampal and middle temporal gyrus sites (Halgren et al. 1995), and in multiple frontal sites, including the anterior cingulate gyrus, gyrus rectus, and dorso-lateral prefrontal cortex (area 46, near the junction of the inferior and middle frontal gyri) (Baudena et al. 1995). Similar potentials have been re- ported by Alain et al. (1989) and Smith et al. (1990) in several posterior sites.
Relation to scalp P3a. This negative-positive-negative sequence was identified with the scalp N2-P3a-SW se- quence, respectively. As originally defined by Squires et al. (1975) and Snyder and Hillyard (1976), the " P 3 a " can be distinguished from the usual P3b evoked by attended target rare stimuli by its latency, topography and task correlates: (1) the P3a has a significantly shorter latency than the P3b; (2) the P3a occurs to unattended rare stimuli whereas the P3b requires attention; and (3) the P3a has a more fronto-central distribution than the P3b to attended target stimuli. The depth P3a reported here closely matches that of Squires et al. (1975) and Snyder and Hillyard (1976) in that it was evoked by non-attended rare auditory stimuli, at a significantly shorter latency than that of the scalp P3.
Renault and Les~vre (1977) also recorded a potential which they termed the P3a, but it was defined only on the basis of latency and topographical criteria, as more fronto- central and earlier than the P3b. By selectively averaging potentials evoked by rare stimulus omissions in a visual paradigm, they found that the rare trials could be divided into those that evoked a P3a, those that evoked a P3b, and those that evoked both. Our data are consistent with this approach, inasmuch as rare target events evoked both the depth-P3a and depth-P3b, with the P3a being earlier and generated in different structures from the P3b.
Ritter et al. (1992) found that randomly occurring stim- ulus repetitions in regularly alternating sequences of tones evoked no scalp P3a, but only a P3b, whereas the standard oddball evoked both. This was not the case in our data, where the HL task evoked both P3a and P3b. As noted above, this could be due to task differences which allowed an automatic detection of stimulus repetition in our task and but not in Ritter et al.'s.
The P3a has also been associated with attended but non-target distractor stimuli, inasmuch as the P3 to such stimuli has a somewhat more fronto-central scalp distribu- tion in both the visual (Courchesne et al. 1975) and auditory (Stapleton et al. 1987b) modalities. This distinc- tion was not clearly applicable to the depth-P3a, which occurred to both rare target and rare distractor stimuli. Although the P3a to distractors was significantly larger than that evoked to targets in the posterior cingulate gyrus, in other sites there was no significant difference in ampli- tude.
The identification of the N2a of the N 2 a / P 3 a / S W sequence is difficult. However, given that it seems to occur even in the absence of attention, it may contribute to the later part of the scalp MMN and thus is termed "N2a ." This N2a may also correspond to the fixed latency orient- ing N2 described by Renault (1983). The identification of the SW of the N 2 a / P 3 a / S W sequence is even more problematic, given that it overlaps substantially with the P3b. Since the P3a and P3b are usually evoked together, this component may be visible at the scalp in most tasks only as a smaller amplitude P3b.
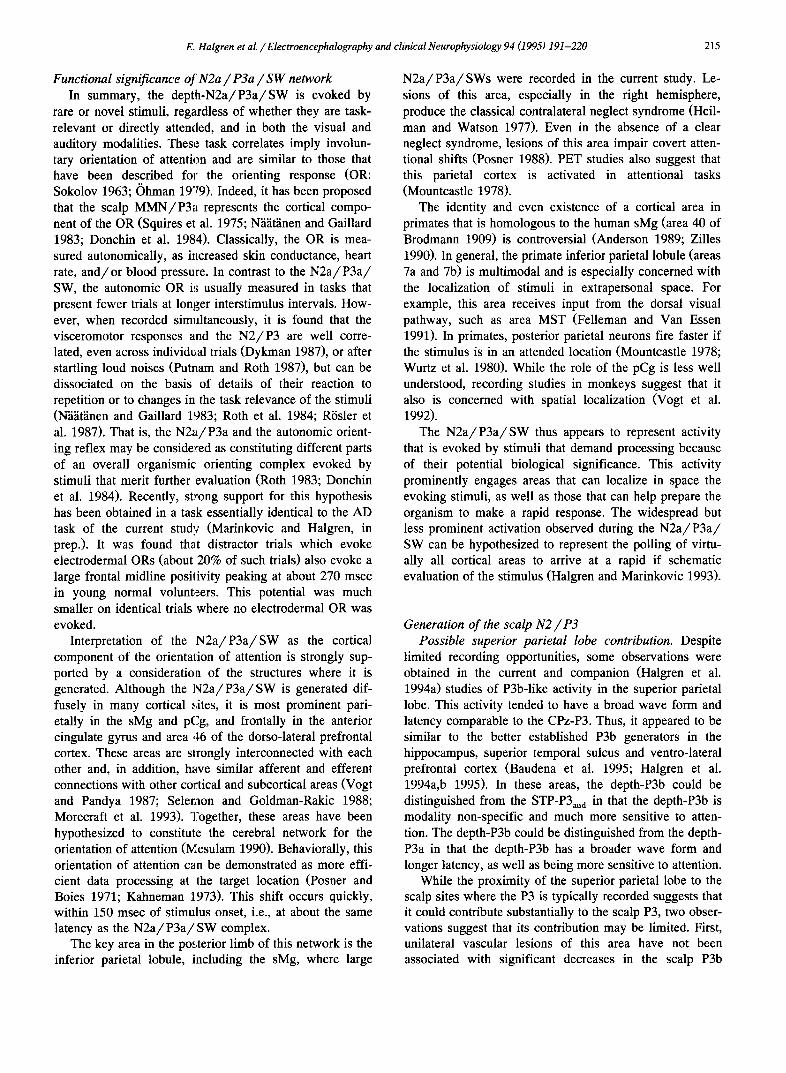
E. Halgren et al. / Electroencephalography and clinical Neurophysiology 94 (1995) 191-220 215
Functional significance of N2a / P3a / SW network In summary, the depth-N2a/P3a /SW is evoked by
rare or novel stimuli, regardless of whether they are task- relevant or directly attended, and in both the visual and auditory modalities. These task correlates imply involun- tary orientation of attention and are similar to those that have been described for the orienting response (OR: Sokolov 1963; t)hman 19"79). Indeed, it has been proposed that the scalp MMN/P3a represents the cortical compo- nent of the OR (Squires et al. 1975; N~i~it~inen and Gaillard 1983; Donchin et al. 1984). Classically, the OR is mea- sured autonomically, as increased skin conductance, heart rate, and /o r blood pressure. In contrast to the N 2 a / P 3 a / SW, the autonomic OR is usually measured in tasks that present fewer trials at longer interstimulus intervals. How- ever, when recorded simultaneously, it is found that the visceromotor responses and the N 2 / P 3 are well corre- lated, even across individual trials (Dykman 1987), or after startling loud noises (Putnam and Roth 1987), but can be dissociated on the basis of details of their reaction to repetition or to changes in the task relevance of the stimuli (N~i~it~inen and Gaillard 1!983; Roth et al. 1984; R/Ssler et al. 1987). That is, the N2a/P3a and the autonomic orient- ing reflex may be conside:red as constituting different parts of an overall organismic orienting complex evoked by stimuli that merit further evaluation (Roth 1983; Donchin et al. 1984). Recently, strong support for this hypothesis has been obtained in a task essentially identical to the AD task of the current study (Marinkovic and Halgren, in prep.). It was found that distractor trials which evoke electrodermal ORs (about 20% of such trials) also evoke a large frontal midline positivity peaking at about 270 msec in young normal volunteers. This potential was much smaller on identical trials where no electrodermal OR was evoked.
Interpretation of the N 2 a / P 3 a / S W as the cortical component of the orientation of attention is strongly sup- ported by a consideration of the structures where it is generated. Although the N 2 a / P 3 a / S W is generated dif- fusely in many cortical sites, it is most prominent pari- etally in the sMg and pCg, and frontally in the anterior cingulate gyrus and area 46 of the dorso-lateral prefrontal cortex. These areas are strongly interconnected with each other and, in addition, have similar afferent and efferent connections with other cortical and subcortical areas (Vogt and Pandya 1987; Seleraon and Goldman-Rakic 1988; Morecraft et al. 1993). Together, these areas have been hypothesized to constitute the cerebral network for the orientation of attention (Mesulam 1990). Behaviorally, this orientation of attention can be demonstrated as more effi- cient data processing at the target location (Posner and Boies 1971; Kahneman 1973). This shift occurs quickly, within 150 msec of stimulus onset, i.e., at about the same latency as the N 2 a / P 3 a / S W complex.
The key area in the posterior limb of this network is the inferior parietal lobule, including the sMg, where large
N 2 a / P 3 a / S W s were recorded in the current study. Le- sions of this area, especially in the right hemisphere, produce the classical contralateral neglect syndrome (Heil- man and Watson 1977). Even in the absence of a clear neglect syndrome, lesions of this area impair covert atten- tional shifts (Posner 1988). PET studies also suggest that this parietal cortex is activated in attentional tasks (Mountcastle 1978).
The identity and even existence of a cortical area in primates that is homologous to the human sMg (area 40 of Brodmann 1909) is controversial (Anderson 1989; Zilles 1990). In general, the primate inferior parietal lobule (areas 7a and 7b) is multimodal and is especially concerned with the localization of stimuli in extrapersonal space. For example, this area receives input from the dorsal visual pathway, such as area MST (Felleman and Van Essen 1991). In primates, posterior parietal neurons fire faster if the stimulus is in an attended location (Mountcastle 1978; Wurtz et al. 1980). While the role of the pCg is less well understood, recording studies in monkeys suggest that it also is concerned with spatial localization (Vogt et al. 1992).
The N 2 a / P 3 a / S W thus appears to represent activity that is evoked by stimuli that demand processing because of their potential biological significance. This activity prominently engages areas that can localize in space the evoking stimuli, as well as those that can help prepare the organism to make a rapid response. The widespread but less prominent activation observed during the N 2 a / P 3 a / SW can be hypothesized to represent the polling of virtu- ally all cortical areas to arrive at a rapid if schematic evaluation of the stimulus (Halgren and Marinkovic 1993).
Generation of the scalp N 2 / P 3 Possible superior parietal lobe contribution. Despite
limited recording opportunities, some observations were obtained in the current and companion (Halgren et al. 1994a) studies of P3b-like activity in the superior parietal lobe. This activity tended to have a broad wave form and latency comparable to the CPz-P3. Thus, it appeared to be similar to the better established P3b generators in the hippocampus, superior temporal sulcus and ventro-lateral prefrontal cortex (Baudena et al. 1995; Halgren et al. 1994a,b 1995). In these areas, the depth-P3b could be distinguished from the STP-P3au o in that the depth-P3b is modality non-specific and much more sensitive to atten- tion. The depth-P3b could be distinguished from the depth- P3a in that the depth-P3b has a broader wave form and longer latency, as well as being more sensitive to attention.
While the proximity of the superior parietal lobe to the scalp sites where the P3 is typically recorded suggests that it could contribute substantially to the scalp P3, two obser- vations suggest that its contribution may be limited. First, unilateral vascular lesions of this area have not been associated with significant decreases in the scalp P3b
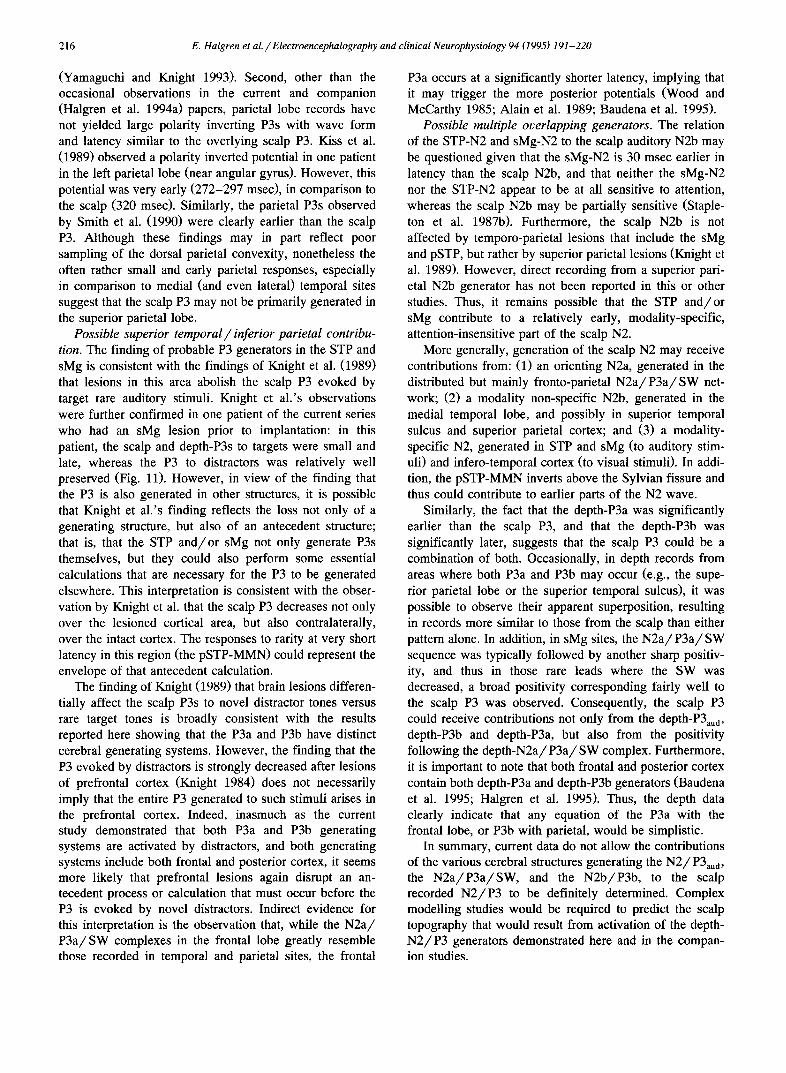
216 E. Halgren et al. / Electroencephalography and clinical Neurophysiology 94 (1995) 191-220
(Yamaguchi and Knight 1993). Second, other than the occasional observations in the current and companion (Halgren et al. 1994a) papers, parietal lobe records have not yielded large polarity inverting P3s with wave form and latency similar to the overlying scalp P3. Kiss et al. (1989) observed a polarity inverted potential in one patient in the left parietal lobe (near angular gyrus). However, this potential was very early (272-297 msec), in comparison to the scalp (320 msec). Similarly, the parietal P3s observed by Smith et al. (1990) were clearly earlier than the scalp P3. Although these findings may in part reflect poor sampling of the dorsal parietal convexity, nonetheless the often rather small and early parietal responses, especially in comparison to medial (and even lateral) temporal sites suggest that the scalp P3 may not be primarily generated in the superior parietal lobe.
Possible superior temporal/inferior parietal contribu- tion. The finding of probable P3 generators in the STP and sMg is consistent with the findings of Knight et al. (1989) that lesions in this area abolish the scalp P3 evoked by target rare auditory stimuli. Knight et al.'s observations were further confirmed in one patient of the current series who had an sMg lesion prior to implantation: in this patient, the scalp and depth-P3s to targets were small and late, whereas the P3 to distractors was relatively well preserved (Fig. 11). However, in view of the finding that the P3 is also generated in other structures, it is possible that Knight et al.'s finding reflects the loss not only of a generating structure, but also of an antecedent structure; that is, that the STP and/or sMg not only generate P3s themselves, but they could also perform some essential calculations that are necessary for the P3 to be generated elsewhere. This interpretation is consistent with the obser- vation by Knight et al. that the scalp P3 decreases not only over the lesioned cortical area, but also contralaterally, over the intact cortex. The responses to rarity at very short latency in this region (the pSTP-MMN) could represent the envelope of that antecedent calculation.
The finding of Knight (1989) that brain lesions differen- tially affect the scalp P3s to novel distractor tones versus rare target tones is broadly consistent with the results reported here showing that the P3a and P3b have distinct cerebral generating systems. However, the finding that the P3 evoked by distractors is strongly decreased after lesions of prefrontal cortex (Knight 1984) does not necessarily imply that the entire P3 generated to such stimuli arises in the prefrontal cortex. Indeed, inasmuch as the current study demonstrated that both P3a and P3b generating systems are activated by distractors, and both generating systems include both frontal and posterior cortex, it seems more likely that prefrontal lesions again disrupt an an- tecedent process or calculation that must occur before the P3 is evoked by novel distractors. Indirect evidence for this interpretation is the observation that, while the N2a/ P3a /SW complexes in the frontal lobe greatly resemble those recorded in temporal and parietal sites, the frontal
P3a occurs at a significantly shorter latency, implying that it may trigger the more posterior potentials (Wood and McCarthy 1985; Alain et al. 1989; Baudena et al. 1995).
Possible multiple overlapping generators. The relation of the STP-N2 and sMg-N2 to the scalp auditory N2b may be questioned given that the sMg-N2 is 30 msec earlier in latency than the scalp N2b, and that neither the sMg-N2 nor the STP-N2 appear to be at all sensitive to attention, whereas the scalp N2b may be partially sensitive (Staple- ton et al. 1987b). Furthermore, the scalp N2b is not affected by temporo-parietal lesions that include the sMg and pSTP, but rather by superior parietal lesions (Knight et al. 1989). However, direct recording from a superior pari- etal N2b generator has not been reported in this or other studies. Thus, it remains possible that the STP and/or sMg contribute to a relatively early, modality-specific, attention-insensitive part of the scalp N2.
More generally, generation of the scalp N2 may receive contributions from: (1) an orienting N2a, generated in the distributed but mainly fronto-parietal N 2 a / P 3 a / S W net- work; (2) a modality non-specific N2b, generated in the medial temporal lobe, and possibly in superior temporal sulcus and superior parietal cortex; and (3) a modality- specific N2, generated in STP and sMg (to auditory stim- uli) and infero-temporal cortex (to visual stimuli). In addi- tion, the pSTP-MMN inverts above the Sylvian fissure and thus could contribute to earlier parts of the N2 wave.
Similarly, the fact that the depth-P3a was significantly earlier than the scalp P3, and that the depth-P3b was significantly later, suggests that the scalp P3 could be a combination of both. Occasionally, in depth records from areas where both P3a and P3b may occur (e.g., the supe- rior parietal lobe or the superior temporal sulcus), it was possible to observe their apparent superposition, resulting in records more similar to those from the scalp than either pattern alone. In addition, in sMg sites, the N 2 a / P 3 a / S W sequence was typically followed by another sharp positiv- ity, and thus in those rare leads where the SW was decreased, a broad positivity corresponding fairly well to the scalp P3 was observed. Consequently, the scalp P3 could receive contributions not only from the depth-P3au d, depth-P3b and depth-P3a, but also from the positivity following the depth-N2a/P3a/SW complex. Furthermore, it is important to note that both frontal and posterior cortex contain both depth-P3a and depth-P3b generators (Baudena et al. 1995; Halgren et al. 1995). Thus, the depth data clearly indicate that any equation of the P3a with the frontal lobe, or P3b with parietal, would be simplistic.
In summary, current data do not allow the contributions of the various cerebral structures generating the N2/P3aua, the N2a /P3a /SW, and the N2b/P3b, to the scalp recorded N2/P3 to be definitely determined. Complex modelling studies would be required to predict the scalp topography that would result from activation of the depth- N2/P3 generators demonstrated here and in the compan- ion studies.
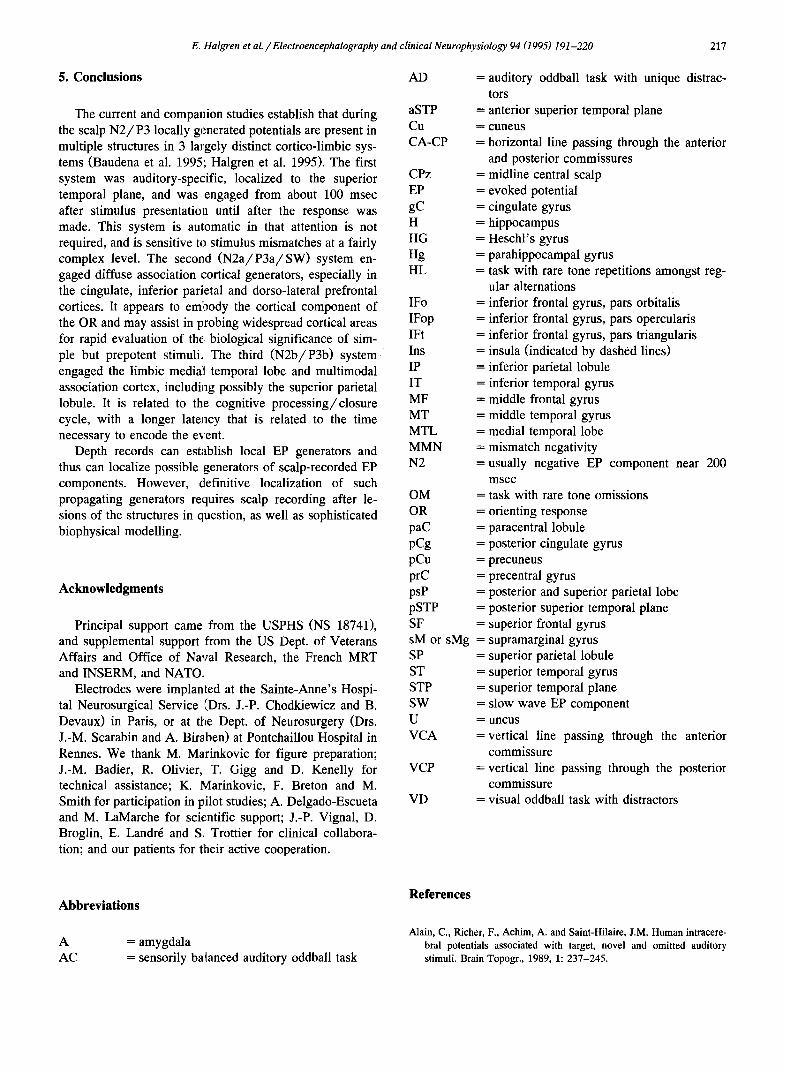
E. Halgren et al. / Electroencephalography and clinical Neurophysiology 94 (1995) 191-220 217
5. Conclus ions
The current and companion studies establish that during the scalp N 2 / P 3 locally generated potentials are present in multiple structures in 3 largely distinct cortico-limbic sys- tems (Baudena et al. 1995; Halgren et al. 1995). The first system was auditory-specific, localized to the superior temporal plane, and was engaged from about 100 msec after stimulus presentation until after the response was made. This system is automatic in that attention is not required, and is sensitive to stimulus mismatches at a fairly complex level. The second ( N 2 a / P 3 a / S W ) system en- gaged diffuse association cortical generators, especially in the cingulate, inferior parietal and dorso-lateral prefrontal cortices. It appears to embody the cortical component of the OR and may assist in probing widespread cortical areas for rapid evaluation of the, biological significance of sim- ple but prepotent stimuli. The third (N2b/P3b) system engaged the limbic medial temporal lobe and multimodal association cortex, including possibly the superior parietal lobule. It is related to the cognitive processing/closure cycle, with a longer latency that is related to the time necessary to encode the event.
Depth records can establish local EP generators and thus can localize possible generators of scalp-recorded EP components. However, definitive localization of such propagating generators requires scalp recording after le- sions of the structures in question, as well as sophisticated biophysical modelling.
A c k n o w l e d g m e n t s
Principal support came from the USPHS (NS 18741), and supplemental support from the US Dept. of Veterans Affairs and Office of Naval Research, the French MRT and INSERM, and NATO.
Electrodes were implanted at the Sainte-Anne's Hospi- tal Neurosurgical Service (Drs. J.-P. Chodkiewicz and B. Devaux) in Paris, or at the Dept. of Neurosurgery (Drs. J.-M. Scarabin and A. Biraben) at Pontchaillou Hospital in Rennes. We thank M. Marinkovic for figure preparation; J.-M. Badier, R. Olivier, T. Gigg and D. Kenelly for technical assistance; K. Marinkovic, F. Breton and M. Smith for participation in pilot studies; A. Delgado-Escueta and M. LaMarche for scientific support; J.-P. Vignal, D. Broglin, E. Landr6 and S. Trottier for clinical collabora- tion; and our patients for their active cooperation.
AD
aSTP = Cu = CA-CP =
CPz EP gC H HG Hg HL
IFo = IFop = IFt = Ins = IP = IT = MF = MT = MTL = MMN = N2 =
OM = OR = paC = pCg = pCu = prC = psP = pSTP = SF = sM or sMg = SP = ST = STP = SW = U = VCA =
VCP =
VD =
auditory oddball task with unique distrac- tors anterior superior temporal plane cuneus horizontal line passing through the anterior and posterior commissures midline central scalp evoked potential cingulate gyrus hippocampus Heschl's gyrus parahippocampal gyrus task with rare tone repetitions amongst reg- ular alternations inferior frontal gyms, pars orbitalis inferior frontal gyms, pars opercularis inferior frontal gyrus, pars triangularis insula (indicated by dashed lines) inferior parietal lobule inferior temporal gyrus middle frontal gyrus middle temporal gyrus medial temporal lobe mismatch negativity usually negative EP component near 200 msec task with rare tone omissions orienting response paracentral lobule posterior cingulate gyrus precuneus precentral gyrus posterior and superior parietal lobe posterior superior temporal plane superior frontal gyrus supramarginal gyrus superior parietal lobule superior temporal gyrus superior temporal plane slow wave EP component uncus vertical line passing through the anterior commissure vertical line passing through the posterior commissure visual oddball task with distractors
Abbreviat ions
A = amygdala AC = sensorily balanced auditory oddball task
References
Alain, C., Richer, F., Achim, A. and Saint-Hilaire, J.M. Human intracere- bral potentials associated with target, novel and omitted auditory stimuli. Brain Topogr., 1989, 1: 237-245.
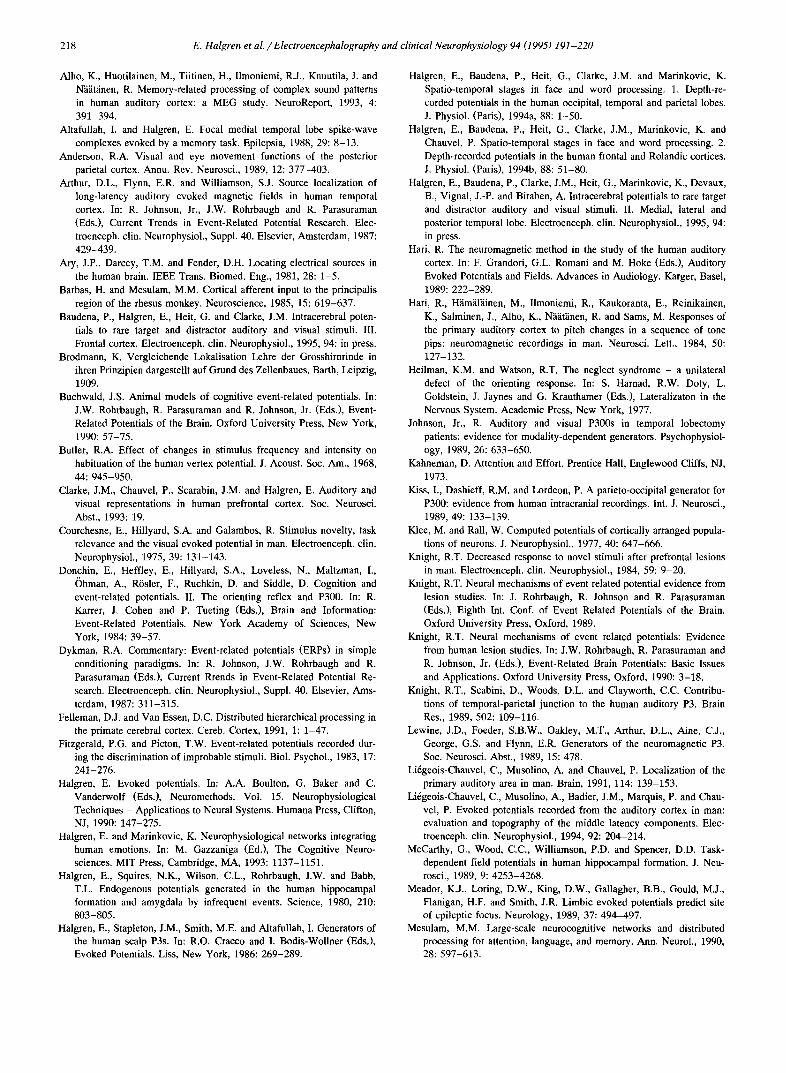
218 E. Halgren et al. / Electroencephalography and clinical Neurophysiology 94 (1995) 191-220
Alho, K., Huotilainen, M., Tiitinen, H., Ilmoniemi, R.J., Knuutila, J. and N~i~it~inen, R. Memory-related processing of complex sound patterns in human auditory cortex: a MEG study. NeuroReport, 1993, 4: 391-394.
Altafullah, I. and Halgren, E. Focal medial temporal lobe spike-wave complexes evoked by a memory task. Epilepsia, 1988, 29: 8-13.
Anderson, R.A. Visual and eye movement functions of the posterior parietal cortex. Annu. Rev. Neurosci., 1989, 12: 377-403.
Arthur, D.L., Flynn, E.R. and Williamson, S.J. Source localization of long-latency auditory evoked magnetic fields in human temporal cortex. In: R. Johnson, Jr., J.W. Rohrbaugh and R. Parasuraman (Eds.), Current Trends in Event-Related Potential Research. Elec- troenceph, clin. Neurophysiol., Suppl. 40. Elsevier, Amsterdam, 1987: 429-439.
Ary, J.P., Darcey, T.M. and Fender, D.H. Locating electrical sources in the human brain. IEEE Trans. Biomed. Eng., 1981, 28: 1-5.
Barbas, H. and Mesulam, M.M. Cortical afferent input to the principalis region of the rhesus monkey. Neuroscience, 1985, 15: 619-637.
Baudena, P., Halgren, E., Heit, G. and Clarke, J.M. Intracerebral poten- tials to rare target and distractor auditory and visual stimuli. III. Frontal cortex. Electroenceph. clin. Neurophysiol., 1995, 94: in press.
Brodmann, K. Vergleichende Lokalisation Lehre der Grosshirnrinde in ihren Prinzipien dargestellt auf Grand des Zellenbaues. Barth, Leipzig, 1909.
Buchwald, J.S. Animal models of cognitive event-related potentials. In: J.W. Rohrbaugh, R. Parasuraman and R. Johnson, Jr. (Eds.), Event- Related Potentials of the Brain. Oxford University Press, New York, 1990: 57-75.
Butler, R.A. Effect of changes in stimulus frequency and intensity on habituation of the human vertex potential. J. Acoust. Soc. Am., 1968, 44: 945-950.
Clarke, J.M., Chauvel, P., Scarabin, J.M. and Halgren, E. Auditory and visual representations in human prefrontal cortex. Soc. Neurosci. Abst., 1993: 19.
Courchesne, E., Hillyard, S.A. and Galambos, R. Stimulus novelty, task relevance and the visual evoked potential in man. Electroenceph. clin. Neurophysiol., 1975, 39: 131-143.
Donchin, E., Heffley, E., Hillyard, S.A., Loveless, N., Maltzman, I., Ohman, A., R~sler, F., Ruchkin, D. and Siddle, D. Cognition and event-related potentials. II. The orienting reflex and P300. In: R. Karrer, J. Cohen and P. Tueting (Eds.), Brain and Information: Event-Related Potentials. New York Academy of Sciences, New York, 1984: 39-57.
Dykman, R.A. Commentary: Event-related potentials (ERPs) in simple conditioning paradigms. In: R. Johnson, J.W. Rohrbaugh and R. Parasuraman (Eds.), Current Rrends in Event-Related Potential Re- search. Electroenceph. clin. Neurophysiol., Suppl. 40. Elsevier, Ams- terdam, 1987: 311-315.
Felleman, D.J. and Van Essen, D.C. Distributed hierarchical processing in the primate cerebral cortex. Cereb. Cortex, 1991, 1: 1-47.
Fitzgerald, P.G. and Picton, T.W. Event-related potentials recorded dur- ing the discrimination of improbable stimuli. Biol. Psychol., 1983, 17: 241-276.
Halgren, E. Evoked potentials. In: A.A. Boulton, G. Baker and C. Vanderwolf (Eds.), Neuromethods. Vol. 15. Neurophysiological Techniques - Applications to Neural Systems. Humana Press, Clifton, NJ, 1990: 147-275.
Halgren, E. and Marinkovic, K. Neurophysiological networks integrating human emotions. In: M. Gazzaniga (Ed.), The Cognitive Neuro- sciences. MIT Press, Cambridge, MA, 1993: 1137-1151.
Halgren, E., Squires, N.K., Wilson, C.L., Rohrbaugh, J.W. and Babb, T.L. Endogenous potentials generated in the human hippocampal formation and amygdala by infrequent events. Science, 1980, 210: 803-805.
Halgren, E., Stapleton, J.M., Smith, M.E. and Altafullah, I. Generators of the human scalp P3s. In: R.Q. Cracco and I. Bodis-Wollner (Eds.), Evoked Potentials. Liss, New York, 1986: 269-289.
Halgren, E., Baudena, P., Heit, G., Clarke, J.M. and Marinkovic, K. Spatio-temporal stages in face and word processing. 1. Depth-re- corded potentials in the human occipital, temporal and parietal lobes. J. Physiol. (Paris), 1994a, 88: 1-50.
Halgren, E., Baudena, P., Heit, G., Clarke, J.M., Marinkovic, K. and Chauvel, P. Spatio-temporal stages in face and word processing. 2. Depth-recorded potentials in the human frontal and Rolandic cortices. J. Physiol. (Paris), 1994b, 88: 51-80.
Halgren, E., Baudena, P., Clarke, J.M., Heit, G., Marinkovic, K., Devaux, B., Vignal, J.-P. and Biraben, A. Intracerebral potentials to rare target and distractor auditory and visual stimuli. II. Medial, lateral and posterior temporal lobe. Electroenceph. clin. Neurophysiol., 1995, 94: in press.
Hari, R. The neuromagnetic method in the study of the human auditory cortex. In: F. Grandori, G.L. Romani and M. Hoke (Eds.), Auditory Evoked Potentials and Fields. Advances in Audiology. Karger, Basel, 1989: 222-289.
Hari, R., H~im~il~iinen, M., llmoniemi, R., Kaukoranta, E., Reinikainen, K., Salminen, J., Alho, K., N~i~ifiinen, R. and Sams, M. Responses of the primary auditory cortex to pitch changes in a sequence of tone pips: neuromagnetic recordings in man. Neurosci. Lett., 1984, 50: 127-132.
Heilman, K.M. and Watson, R.T. The neglect syndrome - a unilateral defect of the orienting response. In: S. Harnad, R.W. Doty, L. Goldstein, J. Jaynes and G. Krauthamer (Eds.), Lateralizaton in the Nervous System. Academic Press, New York, 1977.
Johnson, Jr., R. Auditory and visual P300s in temporal lobectomy patients: evidence for modality-dependent generators. Psychophysiol- ogy, 1989, 26: 633-650.
Kahneman, D. Attention and Effort. Prentice Hall, Englewood Cliffs, NJ, 1973.
Kiss, I., Dashieff, R.M. and Lordeon, P. A parieto-occipital generator for P300: evidence from human intracranial recordings. Int. J. Neurosci., 1989, 49: 133-139.
Kiee, M. and Rail, W. Computed potentials of cortically arranged popula- tions of neurons. J. Neurophysiol., 1977, 40: 647-666.
Knight, R.T. Decreased response to novel stimuli after prefrontal lesions in man. Electroenceph. clin. Neurophysiol., 1984, 59: 9-20.
Knight, R.T. Neural mechanisms of event related potential evidence from lesion studies. In: J. Rohrbaugh, R. Johnson and R. Parasuraman (Eds.), Eighth Int. Conf. of Event Related Potentials of the Brain. Oxford University Press, Oxford, 1989.
Knight, R.T. Neural mechanisms of event related potentials: Evidence from human lesion studies. In: J.W. Rohrbaugh, R. Parasuraman and R. Johnson, Jr. (Eds.), Event-Related Brain Potentials: Basic Issues and Applications. Oxford University Press, Oxford, 1990: 3-18.
Knight, R.T., Scabini, D., Woods, D.L. and Clayworth, C.C. Contribu- tions of temporal-parietal junction to the human auditory P3. Brain Res., 1989, 502: 109-116.
Lewine, J.D., Foeder, S.B.W., Oakley, M.T., Arthur, D.L., Aine, C.J., George, G.S. and Flynn, E.R. Generators of the neuromagnetic P3. Soc. Neurosci. Abst., 1989, 15: 478.
Li6geois-Chauvel, C., Musolino, A. and Chauvel, P. Localization of the primary auditory area in man. Brain, 1991, 114: 139-153.
Li6geois-Chauvel, C., Musolino, A., Badier, J.M., Marquis, P. and Chau- vel, P. Evoked potentials recorded from the auditory cortex in man: evaluation and topography of the middle latency components. Elec- troenceph, clin. Neurophysiol., 1994, 92: 204-214.
McCarthy, G., Wood, C.C., Williamson, P.D. and Spencer, D.D. Task- dependent field potentials in human hippocampal formation. J. Neu- rosci., 1989, 9: 4253-4268.
Meador, K.J., Loring, D.W., King, D.W., Gallagher, B.B., Gould, M.J., Flanigan, H.F. and Smith, J.R. Limbic evoked potentials predict site of epileptic focus. Neurology, 1989, 37: 494-497.
Mesulam, M.M. Large-scale neurocognitive networks and distributed processing for attention, language, and memory. Ann. Neurol., 1990, 28: 597-613.
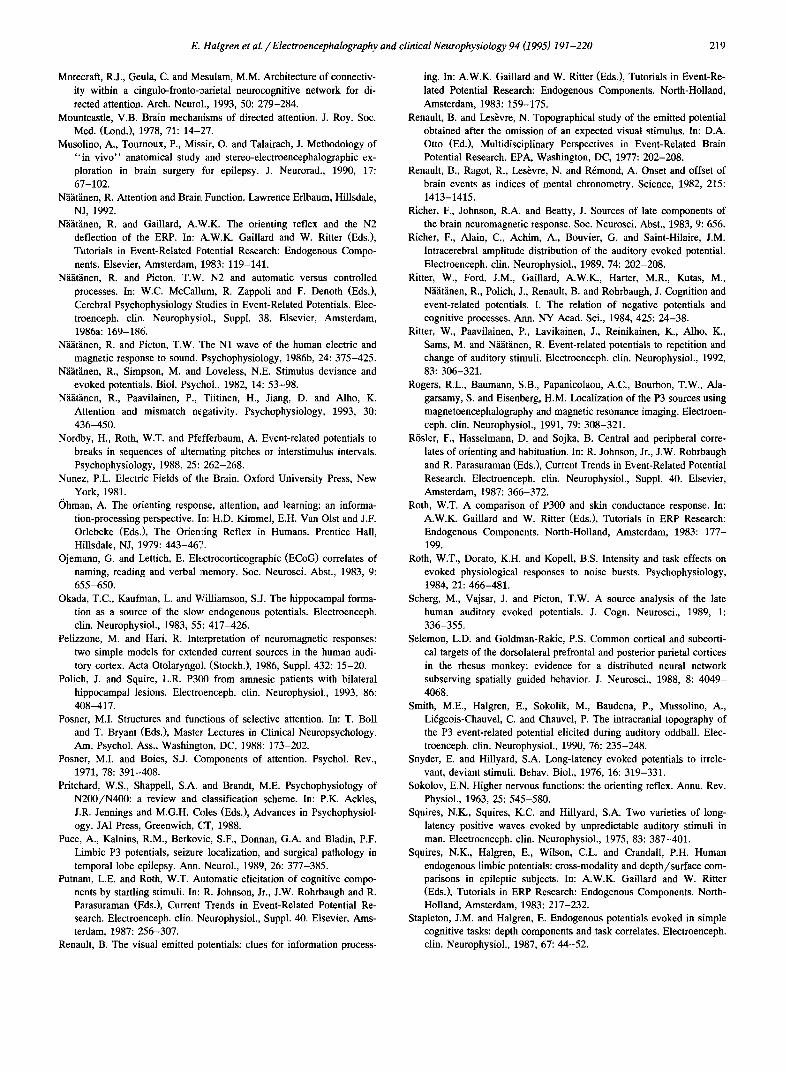
E. Halgren et al. / Electroencephalography and clinical Neurophysiology 94 (1995) 191-220 219
Morecrafi, R.J., Geula, C. and Mesulam, M.M. Architecture of connectiv- ity within a cingulo-fronto-parietal neurocognitive network for di- rected attention. Arch. Neurol., 1993, 50: 279-284.
Mountcastle, V.B. Brain mechaxlisms of directed attention. J. Roy. Soc. Med. (Lond.), 1978, 71: 14-27.
Musolino, A., Tournoux, P., Missir, O. and Talairach, J. Methodology of "in vivo" anatomical study and stereo-electroencephalographic ex- ploration in brain surgery for epilepsy. J. Neurorad., 1990, 17: 67-102.
N~i~it~inen, R. Attention and Brai~ Function. Lawrence Erlbaum, Hillsdale, NJ, 1992.
N~i~it~inen, R. and Galliard, A.W.K. The orienting reflex and the N2 deflection of the ERP. In: A.W.K. Galliard and W. Ritter (Eds.), Tutorials in Event-Related Potential Research: Endogenous Compo- nents. Elsevier, Amsterdam, 1983: 119-141.
N~i~it~inen, R. and Picton, T.W. N2 and automatic versus controlled processes. In: W.C. McCallum, R. Zappoli and F. Denoth (Eds.), Cerebral Psychophysiology Studies in Event-Related Potentials. Elec- troenceph, clin. NeurophysJiol., Suppl. 38. Elsevier, Amsterdam, 1986a: 169-186.
N~i~it~inen, R. and Picton, T.W. "['he N1 wave of the human electric and magnetic response to sound. Psychophysiology, 1986b, 24: 375-425.
N~i~it~inen, R., Simpson, M. and Loveless, N.E. Stimulus deviance and evoked potentials. Biol. Psychol., 1982, 14: 53-98.
N[i~it~inen, R., Paavilainen, P., Tiitinen, H., Jiang, D. and Alho, K. Attention and mismatch negativity. Psychophysiology, 1993, 30: 436-450.
Nordby, H., Roth, W.T. and Pfefferbaum, A. Event-related potentials to breaks in sequences of alteruating pitches or interstimulus intervals. Psychophysiology, 1988, 25: 262-268.
Nunez, P.L. Electric Fields of the Brain. Oxford University Press, New York, 1981.
()hman, A. The orienting response, attention, and learning: an informa- tion-processing perspective. In: H.D. Kimmel, E.H. Van Olst and J.F. Orlebeke (Eds.), The Orienting Reflex in Humans. Prentice Hall, Hillsdale, NJ, 1979: 443-46,'.
Ojemann, G. and Lettich, E. Electrocorticographic (ECoG) correlates of naming, reading and verbal memory. Soc. Neurosci. Abst., 1983, 9: 655-650.
Okada, T.C., Kaufman, L. and Williamson, S.J. The hippocampal forma- tion as a source of the slow endogenous potentials. Electroenceph. clin. Neurophysiol., 1983, 55: 417-426.
Pelizzone, M. and Hari, R. Int~:rpretation of neuromagnetic responses: two simple models for extended current sources in the human audi- tory cortex. Acta Otolaryngo]. (Stockh.), 1986, Suppl. 432: 15-20.
Polich, J. and Squire, L.R. P3(O from amnesic patients with bilateral hippocampal lesions. Electroenceph. clin. Neurophysiol., 1993, 86: 408-417.
Posner, M.I. Structures and functions of selective attention. In: T. Boll and T. Bryant (Eds.), Master Lectures in Clinical Neuropsychology. Am. Psychol. Ass., Washington, DC, 1988: 173-202.
Posner, M.I. and Boies, S.J. Components of attention. Psychol. Rev., 1971, 78: 391-408.
Pritchard, W.S., Shappell, S.A. and Brandt, M.E. Psychophysiology of N200/N400: a review and classification scheme. In: P.K. AcMes, J.R. Jennings and M.G.H. Coles (Eds.), Advances in Psychophysiol- ogy. JAI Press, Greenwich, CT, 1988.
Puce, A., Kalnins, R.M., Berkovic, S.F., Donnan, G.A. and Bladin, P.F. Limbic P3 potentials, seizure localization, and surgical pathology in temporal lobe epilepsy. Ann. Neurol., 1989, 26: 377-385.
Putnam, L.E. and Roth, W.T. Automatic elicitation of cognitive compo- nents by startling stimuli. In: R. Johnson, Jr., J.W. Rohrbaugh and R. Parasuraman (Eds.), Current Trends in Event-Related Potential Re- search. Electroenceph. clin. Neurophysiol., Suppl. 40. Elsevier, Ams- terdam, 1987: 256-307.
Renault, B. The visual emitted potentials: clues for information process-
ing. In: A.W.K. Galliard and W. Ritter (Eds.), Tutorials in Event-Re- lated Potential Research: Endogenous Components. North-Holland, Amsterdam, 1983: 159-175.
Renault, B. and Les~vre, N. Topographical study of the emitted potential obtained after the omission of an expected visual stimulus. In: D.A. Otto (Ed.), Multidisciplinary Perspectives in Event-Related Brain Potential Research. EPA, Washington, DC, 1977: 202-208.
Renault, B., Ragot, R., Les~vre, N. and R6mond, A. Onset and offset of brain events as indices of mental chronometry. Science, 1982, 215: 1413-1415.
Richer, F., Johnson, R.A. and Beatty, J. Sources of late components of the brain neuromagnetic response. Soc. Neurosci. Abst., 1983, 9: 656.
Richer, F., Alain, C., Achim, A., Bouvier, G. and Saint-Hilaire, J.M. Intracerebral amplitude distribution of the auditory evoked potential. Electroenceph. clin. Neurophysiol., 1989, 74: 202-208.
Ritter, W., Ford, J.M., Gaillard, A.W.K., Harter, M.R., Kutas, M., N~i~it~inen, R., Polich, J., Renault, B. and Rohrbaugh, J. Cognition and event-related potentials. I. The relation of negative potentials and cognitive processes. Ann. NY Acad. Sci., 1984, 425: 24-38.
Ritter, W., Paavilainen, P., Lavikainen, J., Reinikainen, K., Alho, K., Sams, M. and N~i~it~inen, R. Event-related potentials to repetition and change of auditory stimuli. Electroenceph. elin. Neurophysiol., 1992, 83: 306-321.
Rogers, R.L., Baumann, S.B., Papanicolaou, A.C., Bourbon, T.W., Ala- garsamy, S. and Eisenberg, H.M. Localization of the P3 sources using magnetoencephalography and magnetic resonance imaging. Electroen- ceph. clin. Neurophysiol., 1991, 79: 308-321.
Rfsler, F., Hasselmann, D. and Sojka, B. Central and peripheral corre- lates of orienting and habituation. In: R. Johnson, Jr., J.W. Rohrbaugh and R. Parasuraman (Eds.), Current Trends in Event-Related Potential Research. Electroenceph. clin. Neurophysiol., Suppl. 40. Elsevier, Amsterdam, 1987: 366-372.
Roth, W.T. A comparison of P300 and skin conductance response. In: A.W.K. Gaillard and W. Ritter (Eds.), Tutorials in ERP Research: Endogenous Components. North-Holland, Amsterdam, 1983: 177- 199.
Roth, W.T., Dorato, K.H. and Kopell, B.S. Intensity and task effects on evoked physiological responses to noise bursts. Psychophysiology, 1984, 21: 466-481.
Scherg, M., Vajsar, J. and Picton, T.W. A source analysis of the late human auditory evoked potentials. J. Cogn. Neurosci., 1989, 1: 336-355.
Selemon, L.D. and Goldman-Rakic, P.S. Common cortical and subcorti- cal targets of the dorsolateral prefrontal and posterior parietal cortices in the rhesus monkey: evidence for a distributed neural network subserving spatially guided behavior. J. Neurosci., 1988, 8: 4049- 4068.
Smith, M.E., Halgren, E., Sokolik, M., Baudena, P., Mussolino, A., Li6geois-Chauvel, C. and Chauvel, P. The intracranial topography of the P3 event-related potential elicited during auditory oddball. Elec- troenceph, clin. Neurophysiol., 1990, 76: 235-248.
Snyder, E. and Hillyard, S.A. Long-latency evoked potentials to irrele- vant, deviant stimuli. Behav. Biol., 1976, 16: 319-331.
Sokolov, E.N. Higher nervous functions: the orienting reflex. Annu. Rev. Physiol., 1963, 25: 545-580.
Squires, N.K., Squires, K.C. and Hillyard, S.A. Two varieties of long- latency positive waves evoked by unpredictable auditory stimuli in man. Electroenceph. clin. Neurophysiol., 1975, 83: 387-401.
Squires, N.K., Halgren, E., Wilson, C.L. and Crandall, P.H, Human endogenous limbic potentials: cross-modality and depth/surface com- parisons in epileptic subjects. In: A.W.K. Gaillard and W. Ritter (Eds.), Tutorials in ERP Research: Endogenous Components. North- Holland, Amsterdam, 1983: 217-232.
Stapleton, J.M. and Halgren, E. Endogenous potentials evoked in simple cognitive tasks: depth components and task correlates. Electroenceph. clin. Neurophysiol., 1987, 67: 44-52.
220 E. Halgren et al. / Electroencephalography and clinical Neurophysiology 94 (1995) 191-220
Stapleton, J.M., Halgren, E. and Moreno, K.A. Endogenous potentials after anterior temporal lobectomy. Neuropsychologia, 1987a, 25: 549-557.
Stapleton, J.M., O'Reilly, T. and Halgren, E. Endogenous potentials in simple cognitive tasks: scalp topography. Int. J. Neurosci., 1987b, 36: 75-88.
Swartz, B.E., Halgren, E., Delgado-Escueta, A.V., Mandelkern, M., Domalski, P., Maldonado, H., Ropchan, J., Blahd, W., Walsh, G.O., Quinones, N. and Gee, M. Multidisciplinary analysis of patients with extratemporal complex partial seizures. Part I. Intertest agreement. Epilepsy Res., 1990, 5: 61-73.
Szikla, G., Bouvier, G., Hori, T. and Petron, V. Angiography of the Human Brain Cortex. Springer, New York, 1977.
Talairach, J. and Tournoux, P. Co-Planar Stereotaxic Atlas of the Human Brain. Thieme Medical Publishers, New York, 1988.
Talairach, J., Szikla, G., Tournoux, P., Prossalentis, A., Bordas-Ferrer, M., Covello, L., Jaco, M. and Mempel, E. Atlas d'Anatomie St~r6otaxique du T~lenc~phale. Masson, Paris, 1967.
Tervaniemi, M., Maury, S. and N~i~it~inen, R. Neural representations of abstract stimulus features in the human brain as reflected by the mismatch negativity. NeuroReport, 1994, 5: 844-846.
Vaughan, H.G. and Ritter, W. The sources of auditory evoked responses recorded from the scalp. Electroenceph. clin. Neurophysiol., 1970, 28: 360-367.
Vaughan, Jr., H.G., Ritter, W. and Simson, R. Topographic analysis of auditory event-related potentials. In: H.H. Kornhuber and L. Deecke (Eds.), Progress in Brain Research. Vol. 54. Motivation, Motor and Sensory Processes of the Brain: Electrical Potentials, Behaviour and Clinical Use. Elsevier, Amsterdam, 1980: 279-290.
Vogt, B.A. and Pandya, D.N. Cingulate cortex in rhesus monkey. II. Cortical afferents. J. Comp. Neurol., 1987, 262: 271-289.
Vogt, B.A., Finch, D.M. and Olson, C.R. Functional heterogeneity in cingulate cortex: the anterior executive and posterior evaluative re- gions. Cereb. Cortex, 1992, 2: 435-443.
Woldorff, M.G. and Hillyard, S.A. Modulation of early auditory process- ing during selective listening to rapidly presented tones. Electroen- ceph. clin. Neurophysiol., 1991, 79: 170-191.
Wood, C.C. and McCarthy, G. A possible frontal lobe contribution to scalp P300. Soc. Neurosci. Abst., 1985, 11: 879-880.
Wood, C.C., McCarthy, G., Kim, J.H., Spencer, D.D. and Williamson, P.D. Abnormalities in temporal lobe event-related potentials predict hippocampal cell loss in temporal lobe epilepsy. Soc. Neurosci. Abst., 1988, 14: 5.
Woods, D.L., Clayworth, C.C., Knight, R.T., Simpson, G.V. and Naeser, M.A. Generators of middle- and long-latency auditory evoked poten- tials: implications from studies of patients with bitemporal lesions. Electroenceph. clin. Neurophysiol., 1987, 68: 132-148.
Wurtz, R.H., Goldberg, M.E. and Robinson, D.L. Behavioral modulation of visual responses in monkeys. Prog. Psychobiol. Physiol. Psychol., 1980, 9: 42-83.
Yamaguchi, S. and Knight, R.T. Association cortex contributions to the human P3. In: W. Haschke, A.I. Roitbak and E.J. Speckman (Eds.), Slow Potential Changes in the Brain. Birkhauser, Boston, MA, 1993: 71-84.
Zilles, K. Cortex. In: G. Paxinos (Ed.), The Human Nervous System. Academic Press, San Diego, CA, 1990: 757-802.
Related Documents