Louisiana State University LSU Digital Commons LSU Master's eses Graduate School 2009 Intracellular ice formation in adult stem cells in the presence of polyvinyl pyrrolidone Avishek Guha Louisiana State University and Agricultural and Mechanical College, [email protected] Follow this and additional works at: hps://digitalcommons.lsu.edu/gradschool_theses Part of the Mechanical Engineering Commons is esis is brought to you for free and open access by the Graduate School at LSU Digital Commons. It has been accepted for inclusion in LSU Master's eses by an authorized graduate school editor of LSU Digital Commons. For more information, please contact [email protected]. Recommended Citation Guha, Avishek, "Intracellular ice formation in adult stem cells in the presence of polyvinyl pyrrolidone" (2009). LSU Master's eses. 797. hps://digitalcommons.lsu.edu/gradschool_theses/797

Welcome message from author
This document is posted to help you gain knowledge. Please leave a comment to let me know what you think about it! Share it to your friends and learn new things together.
Transcript

Louisiana State UniversityLSU Digital Commons
LSU Master's Theses Graduate School
2009
Intracellular ice formation in adult stem cells in thepresence of polyvinyl pyrrolidoneAvishek GuhaLouisiana State University and Agricultural and Mechanical College, [email protected]
Follow this and additional works at: https://digitalcommons.lsu.edu/gradschool_theses
Part of the Mechanical Engineering Commons
This Thesis is brought to you for free and open access by the Graduate School at LSU Digital Commons. It has been accepted for inclusion in LSUMaster's Theses by an authorized graduate school editor of LSU Digital Commons. For more information, please contact [email protected].
Recommended CitationGuha, Avishek, "Intracellular ice formation in adult stem cells in the presence of polyvinyl pyrrolidone" (2009). LSU Master's Theses.797.https://digitalcommons.lsu.edu/gradschool_theses/797

INTRACELLULAR ICE FORMATION IN ADULT STEM CELLS IN THE
PRESENCE OF POLYVINYL PYRROLIDONE
A Thesis
Submitted to the Graduate Faculty of the
Louisiana State University and
Agricultural and Mechanical College
in partial fulfillment of the
requirements for the degree of
Master of Science in Mechanical Engineering
in
The Department of Mechanical Engineering
by
Avishek Guha
B.E., Jadavpur University, India-2003
December 2009

ii
Dedicated to
the loving memory of my beloved father –
Subhash Guha (1939-1992)

iii
ACKNOWLEDGEMENTS
I would like to take this opportunity to thank and express my sincere gratitude and
respect to my advisor, Dr. Ram Devireddy, for supporting me and providing his valuable
thoughts, ideas and help along the way. I would like to thank Dr. Sunggook Park and Dr.
William Todd Monroe for taking time out to serve in the examination committee and evaluating
my thesis.
A special note of thanks is also due to Dr. Sreedhar Thirumala, who guided helped me
closely in the initial stages of my work. I also thank Dr. Jeffry Gimble, from the Pennington
Biomedical Research Institute for providing access to adult stem cells.
I thank all my colleagues at the Bioengineering laboratory at LSU – Dinesh, Raghava,
Ajay and Tat for all the help, support and for creating a lively fun-filled atmosphere to work in. I
should also not forget to thank our graduate secretary, Ms. Diane Morgan, who took the pain to
retrieve my application package for admission to LSU, way back in 2007, after the postal carrier
had delivered it to some other university by mistake. Without her help I might not have even
ended up at LSU in the first place.
My final note of thanks is due to all my family members – my „Dadi‟, „Kuikaka‟, „Dada‟,
„Boudi‟ and „Gutu‟ and particularly to my soon-to-be-wife, Moumita, who livened up my days
even from half way across the globe. Lastly, but perhaps most importantly, I want to
acknowledge the contributions of my mother, Smt. Ratna Guha, who built my life block by block
and made me the person who I am. I thank her for being a pillar of strength, inspiration and for
being the extra-ordinary woman that she is.

iv
TABLE OF CONTENTS
ACKNOWLEDGEMENTS ........................................................................................................... iii
LIST OF TABLES ......................................................................................................................... vi
LIST OF FIGURES ...................................................................................................................... vii
ABSTRACT ................................................................................................................................. viii
1. INTRODUCTION ...................................................................................................................... 1
1.1 Cryobiology ........................................................................................................................... 1
1.2 Cryopreservation: A Brief History and Theory..................................................................... 1
1.3 Cryomicroscopy and Differential Scanning Calorimetry...................................................... 4
1.4 Overview of the Thesis ......................................................................................................... 6
2. LITERATURE SURVEY ........................................................................................................... 8
2.1 Polyvinylpyrrolidone (PVP) as a Cryoprotective Agent ....................................................... 8
2.2 Previous Work with Adult Stem Cell Cryopreservation ..................................................... 11
3. MATERIALS AND METHODS .............................................................................................. 14
3.1 Measuring Cellular Response to Freezing Stress ................................................................ 14
3.2 The Optimal Cooling Rate .................................................................................................. 16
3.3 Cryomicroscopy .................................................................................................................. 18
3.4 The Experimental Setup ...................................................................................................... 20
3.4.1. Temperature Control - The Cryostage ......................................................................... 22
3.4.2. Temperature Control Software .................................................................................... 23
3.4.3. Image Control and Event Correlation .......................................................................... 23
3.4.4. Recording Optical Information and Using the Condenser Lens.................................. 24
3.4.5. Image Analysis for IIF and Water Transport............................................................... 26
4. FREEZING RESPONSE OF ADIPOSE TISSUE DERIVED ADULT STEM CELLS ......... 28
4.1 Background ......................................................................................................................... 28
4.2 Sample Preparation and Experiments with ASCs .............................................................. 28
4.2.1. Isolation, Collection and Culture of Cells ................................................................... 28
4.2.2. Cryomicroscopy Experiments ..................................................................................... 29

v
4.2.3 The Cooling Protocols and Visualization of Intracellular Ice Formation .................... 30
4.3 Results and Discussion ........................................................................................................ 31
4.3.1 Extra- and Intra-cellular Ice Formation (with and without PVP) ................................. 31
4.3.2 Cooling Protocol 1 (with and without PVP) ................................................................. 35
4.3.3 Cooling Protocol 2 (in 1x PBS and without PVP)........................................................ 38
4.3.4 Cooling Protocol 2 (with 10% PVP in 1x PBS) ........................................................... 38
4.3.5 Fluorescent Dye Exclusion Tests ................................................................................. 41
5. CONCLUSION AND FUTURE WORK ................................................................................. 44
REFERENCES ............................................................................................................................. 46
VITA ............................................................................................................................................. 52

vi
LIST OF TABLES
Table 4.1 Table of Cooling Protocols …………………………………………………………31

vii
LIST OF FIGURES
Figure 3.1 Optimal Cooling Velocity Curve …...……………………………………………….17
Figure 3.2 The Cryomicroscope ………………………………………………………………...21
Figure 3.3 The Cryostage………………………………………………………………………...22
Figure 3.4 The Lens System …………………………………………………………………….25
Figure 4.1 Intra- and Extra-cellular Ice Formation in the Common Ramp (without PVP) ……..32
Figure 4.2 (A-D) IIF in Protocol 1 (without PVP) ……................................................................33
Figure 4.2 (E-H) IIF in Protocol 1 (with PVP) ………………………………………………….34
Figure 4.3 Freezing with Protocol 2 (without PVP) …………………………………………….36
Figure 4.4 Freezing with Protocol 2 (with PVP) ………………………………………………..37
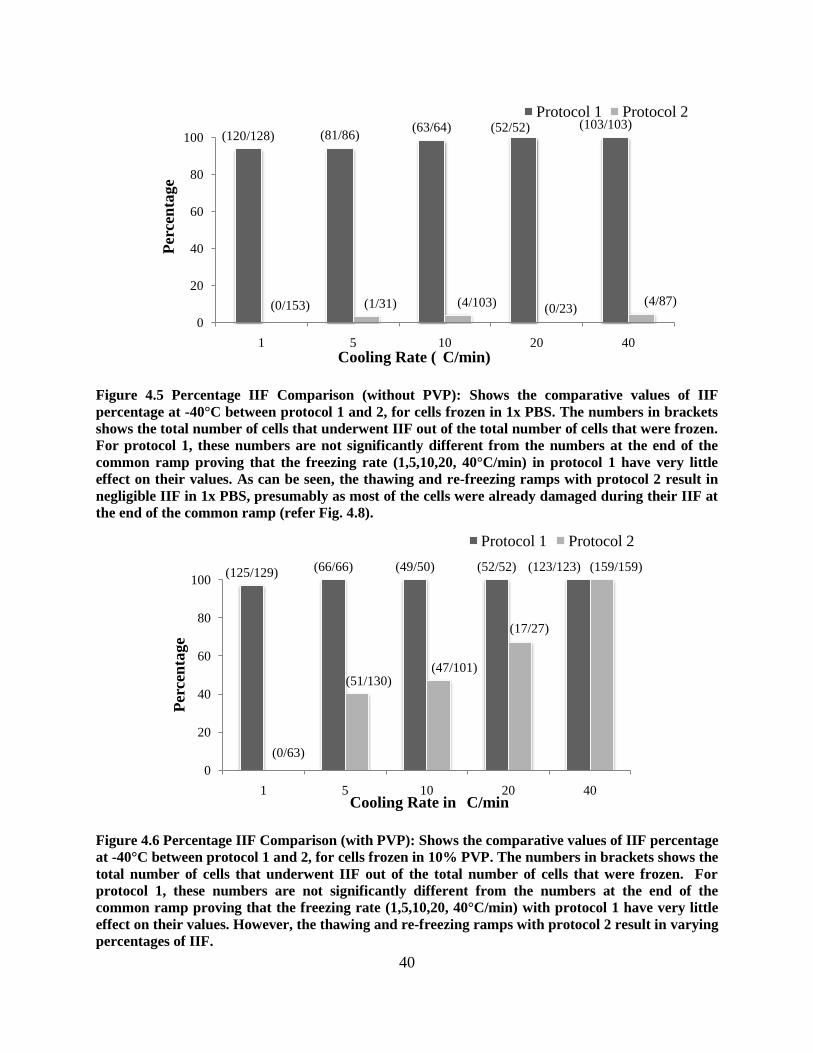
Figure 4.5 Percentage IIF Comparison (without PVP) ………………………………………….40
Figure 4.6 Percentage IIF Comparison (with PVP) ……………………………………………..40
Figure 4.7 Variation of Percent IIF with Cooling Velocity ……………………………………..41
Figure 4.8 Propidium Iodide Exclusion Tests……………………………………………………43

viii
ABSTRACT
The main objective of this work was to assess the effect of 10% (w/v)
polyvinylpyrrolidone (PVP) on the pattern of intracellular ice formation (IIF) in human adipose
tissue derived adult stem cells (ASCs) in the absence of serum and other cryoprotective agents
(CPAs). Passage 1 (P1) ASCs were cultured, washed and suspended in either 1x PBS (Phosphate
Buffered Saline) or 10% w/v solution of PVP in 1x PBS. The freezing experiments were carried
out using a fluorescence microscope equipped with a Linkam™ cooling stage using two different
temperature/time cooling protocols. Both the cooling protocols had a common cooling ramp:
cells were cooled from 20 ˚C to –8 ˚C at 20 ˚C/min and then further cooled to –13 ˚C at 1 ˚C/min
(during which the extra-cellular medium froze very rapidly and was accompanied by the
formation of intracellular ice in ~96% of the cells, as noted by visible “flashing/darkening”). At
this point we employed either, cooling protocol 1: the cells were cooled from –13 ˚C to – 40 ˚C
at a pre-determined cooling rate of 1, 5, 10, 20 or 40 ˚C/min and then thawed back to 20 ˚C at 20
˚C/min; or cooling protocol 2: the cells were re-warmed from –13 ˚C to –5 ˚C at 20 ˚C/min and
then re-cooled at a pre-determined rate of 1, 5, 10, 20 or 40 ˚C/min to –40 ˚C. Almost all (>96%)
of the ASCs frozen in 1x PBS and protocol 1 exhibited IIF whereas almost none (<5%) of the
ASCs frozen in 1x PBS and protocol 2 exhibited IIF. The lack of IIF in cells cooled in 1x PBS
and protocol 2 was due to the initial loss of cell viability (confirmed through an additional
membrane dye exclusion study) that was associated with the formation of IIF in the common
cooling ramp, described earlier. Similarly, almost all (>95%) of the ASCs frozen in 10% PVP in
PBS and protocol 1 exhibited IIF where as ~0, ~40, ~47, ~67 and ~100% of the ASCs frozen in
10% PVP in PBS and protocol 2 exhibited IIF at a cooling rate of 1, 5, 10, 20 or 40 ˚C/min,
respectively. The observed increase in the % of ASCs exhibiting IIF when frozen in 10% PVP

ix
and protocol 2, is presumably due to PVP mitigating the damaging effects of IIF during the
common cooling ramp.

1
1. INTRODUCTION
1.1 Cryobiology
The word „cryobiology‟ comes from the Greek words „cryos‟ or cold, „bios‟ or life and
„logos‟ or science. Hence, cryobiology is a branch of science that investigates the effects of
freezing on biological systems like individual cells, tissues, organs or even whole organisms.
There are various fields of study within cryobiology itself. The major few of these are a)
cryopreservation – where biological materials like tissues, cells, gametes or embryos are frozen
for long term storage to be used later for reproduction or continuation, b) organ preservation at
hypothermic conditions, c) cryosurgery – the killing of unhealthy tissues using cryogenic fluids,
d) lyophilization or freeze drying of pharmaceuticals and e) study of cold-adaptation of different
organisms.
1.2 Cryopreservation: A Brief History and Theory
At a microscopic level, life depends on the movement of molecules – movements that carry
out various bio-chemical reactions required to sustain processes that support a living organism or
any biological system. Freezing a biological system arrests these molecular movements and
hence „pauses‟ the reactions thereby pausing „biological time‟. If the processes of freezing and
thawing back can be carried out without causing injury to the system then they can be frozen and
preserved for prolonged periods of time. Cryopreservation precisely aims at doing that. The
technique of storing food and other perishable commodities by freezing and drying them has
been in use since historical periods. Some pioneering work in cryopreservation was done by
Italian scientist Lazzaro Spallanzani in 1776 [1]. He had frozen stallion sperms in snow and
noted the recovery of sperm motility on re-warming. By the late 20th
century, cryopreservation
had come a long way. As already reviewed by Mazur [2] and McGrath et al [3] many biological

2
systems and cell types have been successfully cryopreserved by that time. These include cell
types like lymphocytes, red blood cells, hepatocytes, gametes, bone marrow, heart, kidney and
even skin. Other than these, major works were also done by Bernard and Fuller [4] in human and
non human mammalian oocyte preservation, cryopreservation of plants like algae by Walsh [5],
rat and human liver slices by Day et al [6] and also spermatozoa of horses and lymphocytes of
human beings by Devireddy et al [7,8].
While freezing samples of cells taken in suspension of an isotonic solution, at finite cooling
rates instead of infinitesimal cooling rates, the temperature of the extracellular solution drops
below the equilibrium freezing point of the solution and hence super-cools. Using a seeding
agent like a chilled needle or sometimes some commercially available bacteria like pseudomonas
syringae can help ice nucleation in the extracellular medium at this point. Even without a seeding
agent ice typically forms in the extracellular medium first albeit at a lower temperature [56]. The
precipitation of pure ice from the extracellular medium increases the concentration of the
unfrozen fraction of the medium and sets up a chemical potential difference between the
supercooled unfrozen cellular cytosol (which remains at a higher chemical potential) and the
extracellular medium. This leads to beginning of water efflux from the cell through the cell
membrane into the extracellular space. From here onwards one of two things may happen - i) if
the cooling rate is too fast, the cells may not have enough time to undergo dehydration and due
to the continously dropping temperature and the availability of freezable water inside the cell, the
cell may freeze internally (also known as intracellular ice formation or IIF) or ii) if the cooling
rate is slow enough, the cells get enough time to lose enough water (also known as water
transport) thereby maintaining a chemical potential equilibrium with the solution outside the
membrane and avoid IIF. Both these phenomena – IIF and water transport, have important

3
implications on post-thaw cell viability. IIF is commonly known to be one of the chief causes of
cell death and has also been shown to be intimately and negatively correlated to cell survival [9-
12], whereas an excessive dehydration of cells too has been shown to be lethal due to „toxicity
effects‟ of intracellular solutes and electrolytes [13]. However, the best survival rate has been
found in general when the cell retains ~ 5% of its water volume and avoids freezing [49]. The
rate at which water effluxes from the cell is not only dependant on the concentration gradients of
solutes across the cell membrane but also on the permeability of the cell membrane to water at
any point of time. The membrane is assumed to be a semi-permeable that prevents the migration
of solutes across it but lets water to flow across it. The value of permeability (Lp) varies from cell
to cell and it is hence important to measure the value of Lp to understand and construct a freezing
protocol that is neither too slow to induce „toxicity effects‟ nor too fast to create IIF. The optimal
cooling rate required for any type of cell to produce the maximum post-thaw viability is hence
dependant on the composition of the extracellular medium as well as the type of cell being used.
The general shape of cooling rate (x-axis) against cell viability (y-axis) is a inverted U-shaped
curve [14] with the exact geometry of the curve being dictated by the factors stated above.
In 1949 it was discovered that addition of glycerol to the extracellular space provide
significant protection to sperm cells during cryopreservation [15]. Since then most
cryopreservation protocols use the protective properties of such additives during freezing by
introducing them in the freezing medium as a cryoprotective agent (CPA). Broadly speaking,
CPAs can be divided into 2 major categories – permeating and non-permeating. Permeating
CPAs such as ethylene glycol (EG), dimethyl sulfoxide (DMSO), propylene glycol (PG) and
glycerol diffuse into the cells when added to the freezing medium. Non permeating CPAs are
mostly polymers like polyvinyl pyrrolidone (PVP), hydroxyl ethyl starch or sometimes sugars

4
which cannot diffuse into the cells. The exact mechanism as to how the cells are protected by the
additives are yet to be ascertained. However, it is postulated that [16] permeating CPAs reduce
the concentration of the harmful electrolytes during slow freezing dehydration and thereby
protects the cell from its effects. It has also been thought to preferentially exclude cell proteins
from their hydration shell and entropically stabilizing them [17,18]. IIF is reduced due to the
colligative properties of the CPAs. When used in high concentrations, they can increase the
viscosity of the solution thereby impeding the growth of ice crystals into the cells and reduce
chances of ice nucleation. However, exposure to cryoprotectants for a long period of time can be
harmful for cells because of their toxicity, particularly if CPAs are used in high concentrations.
Also cryoprotectants need to be removed before the cells are used [16]. But the addition and
removal of cryoprotectants can exert significant stress on the cells. When a cell preserved in
cryoprotectants is thawed and placed in an isotonic solution, the cell initially swells as water
enters the cell at a rate faster than the CPA can flow out of it. This may lead to the cell
membrane being stretched beyond damage. Hence the CPAs are removed in a stepwise manner
so that the cells are not damaged. However, this stepwise removal of CPAs means a longer time
of exposure to the toxicity of cryoprotectants. Hence these 2 factors (long exposure time to CPAs
and washing off the CPAs in isotonic solution) need to be balanced to ensure survival of cells.
1.3 Cryomicroscopy and Differential Scanning Calorimetry
The methods of studying the behavior of biological systems during cryopreservation are
“differential scanning calorimetry” and “cryomicroscopy”. In differential scanning calorimetry
the amount of heat required to be supplied or withdrawn to or from a sample, so that the sample
temperature approaches a “reference temperature”, is measured as a function of temperature. The
DSC technique is primarily used to measure quantities like enthalpies of phase change, reaction

5
kinetics, heat capacities, glass transition temperatures, thermal history, decomposition effects,
and purity of solid samples. The two main types of DSC are the power compensated DSC and
heat flux DSC. Both measure heat applied, but the power compensated type holds the
temperature to a preset value while the heat flux type holds the heat applied constant. The DSC
technique has been used elsewhere previously to measure cellular dehydration or water transport
[8, 19-21].
In cryomicroscopy, samples are loaded on a „cryostage‟ mounted under a light microscope.
The „cryostage‟ is fitted with a liquid nitrogen tank and pump and the setup is used to cool the
samples. The changes occurring during the freezing process can be observed under the
microscope and images of the changes can be recorded. The availability of computerized image
enhancement technique helps in overcoming the low resolution of video recordings. This has
been used to study freezing responses of various cells like those of plants and mammals. One
major assumption in cryomicroscopy is that visible area of the cells, though two dimensional in
nature can be thought of as a projection of a three dimensional volume of the cells. Hence
volumetric changes of only spherical cells can be studied under cryomicroscopes. If cells are not
spherical, the visible / projected dimension of the cell cannot be used to calculate the volume of
the cells during the analysis. Under this assumption the technique is very useful to study cellular
dehydration by visible volume shrinkage. It is also useful for studying IIF occurring in cells.
During IIF, the light cannot pass through the cells as the many surfaces of the crystals of ice
formed inside the cells reflect light away and the cells becomes effectively opaque and darkened.
Hence, the occurrence of IIF is evident by sudden darkening of cells which is also sometimes
called „flashing‟.

6
1.4 Overview of the Thesis
This work evaluates freezing response of adipose tissue derived passage 1 (P1) adult stem
cells (ASCs) when suspended in either of 10% (w/v) polyvinyl pyrrolidone (PVP) with 1x
phosphate buffered saline (PBS) or only 1x PBS. Adult stem cells are undifferentiated cells that
can be found throughout the body. These cells multiply by cell division and have the capability
of replacing dying cells and rejuvenating damaged tissues. They can be found in juvenile as well
as adult humans and animals. A lot of scientific interest has been generated around these cells as
they have the capacity to produce all the cells of the organ from which they arise. Adipose tissue
derived adult stem cells are stem cells which come from fat. Liposuction fat wastes from
hospitals are digested in stem cell labs. After processing the tissue, initially stromal vascular
fraction (SVF) cells are obtained which contain not only stem cells but also other kind of cells
like blood cells, fibroblasts and endothelial cells. However, successive passaging for several
generations yields homogenous adipose stem cells [25, 44, 58-61].
The cryopreservation protocols of ASCs in general contain the use of fetal bovine serum
(FBS) and DMSO ( a very commonly used cryoprotective agent). In simple terms, FBS is the
plasma that remains after coagulation of blood drawn from an unborn bovine fetus. However, the
use of FBS is plagued with problems like batch-to-batch inconsistency [22-25] in serum quality,
its susceptibility to bacterial contamination and sensitivity to degradation and adsorption. FBS is
also relatively costly. Apart from these practical difficulties there are moral and ethical concerns
regarding the collection of serum from living animal. On the other hand, DMSO, though a
commonly used CPA, is also not free from controversy regarding in vivo applications in humans.
As of now the FDA approves the use of DMSO only in the treatment of intersticial cystitis.
Hence in this work was primarily aimed to devise a cryoprotective protocol that avoids the use of

7
FBS as well as DMSO during the cryopreservation of ASCs. A recent study by Thirumala et al
[26] has shown that 10% PVP offered some level of cryoprotection during the freezing of ASCs.
However, the post-thaw survival was only measured to be around ~65%. The present work
investigates the occurrence of IIF in ASCs with and without the use PVP and sheds light on the
effectiveness of PVP as a CPA for ASCs as well as provides an optimized protocol that produces
the minimum degree of IIF during cryopreservation.

8
2. LITERATURE SURVEY
2.1 Polyvinylpyrrolidone (PVP) as a Cryoprotective Agent
Since the discovery of glycerol‟s cryoprotective properties in 1949, most
cryopreservation protocols have used different additives that lend similar cryoprotective
properties to the extracellular medium during freezing of cells. The use of polyvinyl pyrrolidone
as a cryoprotectant was being studied as early as the 1960s. Most of these were in relation to
freezing of blood. Meryman pointed out in 1968 [27] that when rapid freezing of blood with
glucose as a CPA was reported [28] it was then hoped that the use of the CPA in small
concentration would mean that the thawed blood can be directly infused thereby eliminating the
step that requires washing off the CPA as this particular step had been plagued with problems
when it was already being used with glycerol. The washing of the cells from the CPA induces a
lot of osmotic stress on cells which can damage them. However, glucose was found to enter the
cells thereby rendering the cells hypertonic leading to intravascular hemolysis on infusion. Once
glucose failed to serve the purpose, pure lactose was tried out as a CPA. However, the
concentrations required to avoid freezing hemolysis was found to be too much which caused
osmotic damages in the cells.
In 1961, Doebbler et al [29] published a study where they reported the effective use of
PVP in the cryopreservation of rabbit blood. In the study, rabbit blood was collected acid-citrate
glucose and PVP of molecular weight 40000 mixed with saline was used to make a 7% solution.
The mixture were taken in capped aluminum tubes and frozen rapidly by shaking in liquid
nitrogen. They were stored at -170°C for several days before thawing rapidly in water bath at
45°C. It was shown that the process achieved recoveries of greater than 90%. Even when the red
blood cells were infused directly, with the polymer, 93% of the cells exhibited 24-hr survival.

9
In another study in 1963, Persidsky et al [30] compared the effectiveness of DMSO and
PVP in the survival of bone marrow cells. Bone marrow cells were obtained from femurs of rats
of an inbred Long-Evans strain 6-8 month olds. The cells were frozen using different
concentrations of DMSO or PVP in Hank‟s solution. The samples were either frozen directly or
kept for various length of time before freezing. The cooling rate used was 1°C/min with ice
being seeded at -5°C. As soon as -25°C was reached, the samples were transferred to an alcohol
bath at -79°C and kept for 30 minutes. During thawing, they were rapidly thawed by immersing
them into a water bath at 37°C. After that the samples were washed in Hank‟s solution and
centrifuged at 900 r.p.m for 5 minutes. The cells were then resuspended in Hank‟s culturing
medium containing 10% PVP and 33% rat serum. Assessment of cell viability was carried out
using phase microscopy. The study showed that as a preservative, DMSO provided maximum
survival of 50% at 10% concentration. The viability declined sharply if the concentrations were a
little bit higher or lower (12.5% or 7.5%). Also, the cells that were equilibrated for 10 min as
opposed to 30 or 60 minutes, showed maximum survival. Longer exposure times yielded lower
viabilities. Also, the increasing toxicity of DMSO with concentration was ascertained by the
increasing viability rates with decreasing concentrations of DMSO used (3, 1,0.5 and 0.1%).
When PVP was compared, it was found that PVP has no significant change in viability
percentages even when the concentration was increased from 10 to 20%. The broader optimal
range was attributed to the non-toxicity of PVP. In addition, equilibration period was not
required with PVP as it does not penetrate the cells. Since PVP was non toxic, there was no need
of removing it from the samples after thawing. The highest survival rates found with PVP was
around 30% which was lower than the numbers found with DMSO. The authors concluded that
although DMSO provided better survival percentages, the variability was too much and required

10
a lot of precaution while handling the CPA. In that context they preferred PVP to DMSO as it
produced much more predictable results and was simpler to handle.
In 1975, Zdebska et al [31] made a comparative study of glycerol and PVP by assessing
the phagocytic ability of granulocytes, ability of blastic transformation of lymphocytes and the
viability of the number of these cells before freezing and after thawing. There were no significant
differences found in the quality of granulocytes stored in 13% glycerol and 15% PVP. However,
the results obtained were much worse off when compared to similar studies with DMSO.
In a work by Richards et al published in 1961 [32], it was showed that PVP of 30000
molecular weight provided about 30% protection against injuries during freezing and thawing
which was better than that provided by glycerol. In 1962 [33], the team of Richards and
Persidsky used bone marrow cells to study the mechanism by which PVP offers protection
during freezing and thawing. It was clear by then that diffusion was not a method by which PVP
may enter the cells just because of the large size of its molecules. To test whether pinocytosis
was a method in which PVP was being carried, if at all, into the cells, they used iodine-131
labelled PVP with phosphate salts to carry out experiments on rabbit bone marrow cells. They
established that the presence of phosphate ions did actually help in pinocytosis. In the second
part of their work they also established that the maximum survival of cells against freezing injury
was when they were frozen without phosphate salts or when pinocytosis did not occur. So,
evidently, the protection offered by PVP during the freeze-thaw process was overwhelmingly
extracellular. The possible ways in which PVP acted as protective additive was thought to be by
adsorption and dilution of electrolytes, by occlusion of pores that prevent intracellular ice-
seeding and enhances supercooling, reduce excessive intracellular dehydration and by restoration
of cell permeability after thawing.

11
In a study [34] in 1970, Mazur et al showed that using 15% PVP offered about 35%
survival values in mouse bone marrow cells, when frozen to -196°C at a velocity of 10°C/min. In
tissue culture, Chinese hamster cells when frozen with 15% PVP produced 60% of the survival
values of controlled unfrozen cells.
In a very recent study in 2009, Kim et al [35] equilibriated mouse 2-celled embryos were
with 4% (v/v) EG at 37°C for 15 min and then exposed them to vitrification solutions containing
varying concentrations of PVP (5,6 & 7.5%) and 0.4M sucrose for 5 min at 37°C. For recovery,
embryos were transferred one after another into 300 µl of 0.5 M & 0.3 M sucrose at room
temperature for 5 min and then into M2 medium at 37°C for 10 min. Embryos were washed three
times and then cultured in KSOM medium under mineral oil at 37 °C for 96-120 hr in 5% CO2
and 95% air at maximal humidity. It was found that the survival rate of the 7.5% PVP
concentration group was significantly higher than the 5% and 6% PVP groups. Also, the survival
rates of the 7.5% group was similar to that of the control group.
In the present study we have used the advantage of the non-toxic and the cryoprotective property
of PVP in conjunction with an unorthodox freezing protocol to create a DMSO-free, serum-free
cryopreservation protocol for adipose tissue derived adult stem cells.
2.2 Previous Work with Adult Stem Cell Cryopreservation
Most multi-cellular organisms contain stem cells. They are some of the main building
blocks of the organism. Stem cells can renew themselves by mitotic cell division and
differentiate into different cell types. Hence it provides a wonderful avenue to study cellular and
developmental processes. Understanding the processes involved in differentiation of stem cells
into multi-lineage pathways can help develop novel strategies for organ regeneration and
transplantation [36-40]. Thirumala et al [41] carried out a study to find out the effect of different

12
freezing parameters on the immediate post-thaw membrane integrity of adipose derived adult
stem cells. The parameters studied were cooling rate, end temperature, hold time and thawing
rate for 2 different levels for each parameter – high and low. The high and low values for each
parameter were as follows : cooling rate - 1 and 40°C/min, end temperature - -80 and -20°C, hold
time – 1 and 15 minutes, and thawing rate 10 and 200°C/min. The authors concluded that for
99% confidence level only cooling rate and end temperature had a significant effect on cell
membrane integrity for all passages of the cells. The increase in cooling rate had an adverse
effect while increase in end temperature had a beneficial effect on post thaw cell membrane
integrity for passage 0 (P0) cells. Although small as compared to cooling rate and end
temperature, hold temperature and thawing rate has a significant effect on P3 cells.
In a study by Fuller et al [42], passage 0 (P0), passage 1 (P1), and passage 2 (P2) were
cooled at 1, 5, 20 or 40°C/min to -80°C either with or without a CPA (DMSO) using a directional
solidification stage (DSS). The cells were then thawed back and exclusion tests were carried out
with fluorescent dyes. It was found that cells frozen without DMSO had a lower post-thaw
viability than cells frozen with 10% (v/v) DMSO. Not only that, it was also found that cells
frozen in a commercially available control rate freezer had a better post thaw viability as
compared to cells frozen in a DSS. The reason for that was thought to be differences in nature
and damaging effects of ice-crystals formed in a DSS as compared to a control rate freezer.
With an aim to improve cryopreservation protocols so as to reproducibly maintain ASC
viability and multipotentiality, Goh et al [43] studied the efficiency of conventional DMSO
cryopreservation protocol by measuring differentiation potential after one freeze cycle. It was
found that cryopreservation had „little to no effect‟ on the efficiency of the cells to adhere to the
flasks and to form a fibroblast population, or to differentiate into mature adipocytes after

13
induction. However, they also found that post thaw viability was a function of storage
concentration and the optimal concentration was 0.5 x 10⁶ cells per ml of cryopreservation
medium.
In order to ascertain the values of reference cell membrane permeability and activation
energy, Thirumala et al [44] used the DSC technique to study water transport in SVF (stromal
vascular fraction) cells and ADAS (adipose tissue derived adult stem) cells for passages 0 and 2.
Volumetric shrinkage of the ASCs were carried out in the presence of extracellular ice at
20°C/min with either of 10% DMSO or 10% glycerol. Modeling ASCs as spheres of diameter 50
µm and with and osmotically inactive cell volume of 60% of the isotonic cell volume a model of
water transport was fitted to the experimentally obtained data. In the presence and absence of
CPA, the values of Lpg (membrane permeability) ranged from 23.1 - 111.5 x 10⁻¹⁵
m3/Ns and the
values of Elp (activation energy) ranged from 43.1 – 168.7 kJ/mol.

14
3. MATERIALS AND METHODS
3.1 Measuring Cellular Response to Freezing Stress
In 1963 Peter Mazur successfully came up with a model [9] that could describe and
quantify the cellular response to general freezing stress i.e. the change of volume of cells due to
loss of cytoplasmic water to the extracellular medium containing ice. However, in his model,
Mazur assumed that the cell membrane‟s permeability is temperature-independent. This
assumption was later modified by Levin et al in 1976 [45] where the permeability of the
membrane was assumed to be temperature dependant. The major assumptions of Mazur‟s model
are as follows :
1) The extracellular space is considered infinite.
2) The cells are assumed to be spherical. So, a volume of a cell is V= 4πr3/3.
3) The surface area of the cell is considered constant and equal to the original cell
membrane area = 4πr02. Where r0 is the initial cell radius. [47,49].
4) Intracellular medium is acts as a dilute ideal solution and follows Raoult‟s law of
solutions.
5) The latent heat of vaporization of water is constant in the temperature range of interest.
6) The hydrostatic pressure across the cell membrane is zero (this holds good for
mammalian cells).
Summarily the water transport equation is :
Here V is the cell volume, T is the absolute temperature, Lp is the permeability of cell membrane
to water, R is the gas constant, B is the cooling rate, Ac cell membrane surface area that takes

15
part in water transport, vw is the partial molar volume of cell water, µow and µi
w are the chemical
potential of extracellular liquid and intracellular liquid respectively. The extracellular solution is
assumed to be composed of water and solutes like sodium chloride. Also, the solution is in
equilibrium with the extracellular ice that forms. Hence this mixture of ice and salt-water
solution is modeled using the equilibrium properties for a solid-liquid solution. Using the Gibss-
Helmholtz equation that relates the activity of a solution to the function of temperature, we can
write :
If we integrate equation 2 within the temperature limits of 0°C (or 273.15 K) and any
temperature T in our range of interest, we get,
where TR is the reference or the phase change temperature for pure water (273.15 K). Since by
assumption 4 the intracellular solution is modeled as an ideal solution the chemical activity of
the solution can be replaced by the mole fraction of water, or,
Since cells contain some amount of water that do not partake in osmosis, an inactive cell volume
of Vb can be imagined. In such a case the mole fraction of water is given by,
In equation 5, the value of is 2 which is the dissociation constant for sodium chloride, ns is the
number of moles of solutes in the cell. In the numerator, (V-Vb) represents the total osmotically
active cell volume at any point of time, Vb being the osmotically inactive cell volume. So, using

16
equation 3 and 5 and substituting them in equation 1 Mazur‟s equation of water transport can be
derived as :
In 1976, however, Levin et al came up with a temperature dependant expression for membrane
permeability (Lp). It was expressed as an Arrhenius relationship as follows:
In this expression, the Lpg is the permeability of the membrane to water at a reference
temperature (Tr = 273.15 K) and Elp is the activation energy for the permeability process to start.
3.2 The Optimal Cooling Rate
As mentioned in the previous sections, cooling rates categorized as “too high” or “too
low” depends on the cell type. The damages to cells in such cases are either by IIF or by
“solution effects” respectively. So, the cooling rate required for the maximum cell survival is
somewhere between the “high” and “low” rates. For various cell types, these rates have been
experimentally found out and plotted and the curves take an inverted U shape. Figure 3.1 shows
the representative survival curve for any cell type in general. It can be seen that increasing the
cooling velocity increases the survival percentage till it reaches a maximum and after that the
increase in cooling velocity results in a drop of survival percentage. It had already been found
that the value of the optimal cooling rate for a cell type depends on various parameters like Lpg ,
(reference membrane permeability), Elp (activation energy), Vb (inactive cell volume), Vo (initial
cell volume) and Ac (surface area of the cell). Since these values change from cell to cell, the
optimal cooling rates too vary immensely from cell to cell – e.g. the optimal cooling rate for cells

17
like bone marrow is ~ 1°C/min where as that for red blood cells is ~ 1000°C/min [13,48]. In
Figure 3.1 Optimal Cooling Velocity Curve: A inverse “U”-shaped curve showing that
effects of too “slow” cooling as well as too fast cooling being deleterious for cells.
2005, Thirumala and Devireddy [49] came up with a much simpler way to ascertain the optimal
cooling rate for a given type of cell when cell level parameters such as Lpg, Elp,and Ac/WV is
known a priori. Here the parameter Ac/WV combines two other cell level parameters into one
single parameter – this parameter is nothing but the ratio of the initial cell surface area to the
initial osmotic water volume (WV = Vo- Vb) inside the cell. In the work, „optimal cooling rate‟
was defined as the cooling rate that trapped 5% of the initial water volume inside the cell at a
temperature of -15°C. Then equations 6 and 7 (water transport equations) were numerically
solved using a fourth order Runge-Kutta method to calculate the values of optimum cooling rate
over a range of different key cell level parameters namely Lpg, Elp, Vb, Tend(end temperature), D
(diameter of cell) and the ratio of available surface area to initial volume of intracellular water

18
(Ac/WV). Following the investigations of the variation of optimal cooling rate (Bopt) with these
parameters it was found that the Bopt varies exactly linearly with Lpg and Ac/WV values. A graph
representing the variation of Bopt (along Y-axis) with Ac/WV (along X-axis) was plotted with Lpg
value kept constant at 1µm/min-atm. A family of such curves were obtained for different Elp
values. These curves were then collapsed into a single plot of Bopt vs. Elp with the Ac/WV ratio
kept constant at 1.0 which produced the Generic Optimal Cooling Rate Chart (GOCRC).
GOCRC predicts the „optimal cooling rate‟ of a biological system which will have Lpg =
1µm/min-atm and Ac/WV =1.0, provided Elp is known before-hand. Since the variation of the
„optimal cooling rate‟ with the cell membrane permeability (Lpg) and surface area to volume of
initial intracellular water (Ac/WV) was already known to be linear, a new equation that produces
the „optimal cooling rate‟ (Bopt) for any such biological system with Lpg, Elp and Ac/WV known a
priori, could be written down as :
Bopt = BGOCRC*(Lpg)a*(Ac/WV)a…………(8)
where BGOCRC is the cooling rate as read from the GOCRC chart for the measured Elp and (Lpg)a
and (Ac/WV)a are the measured values of reference cell membrane permeability and ratio of
surface area of cell to initial osmotic intracellular water volume. The „optimal cooling rate‟
values obtained from the equation was compared with experimentally determined values
published in literature. There was a reasonably good agreement between the two with the
exception of only AT-1 cells (a tumor cell line).
3.3 Cryomicroscopy
The experimental technique used here was cryomicroscopy. As touched upon in the
previous sections, this method employs the use of light microscopy to visualize cells loaded on to
a sample holder called the “cryostage” which can be cooled or heated by the use of a liquid

19
nitrogen pump or heater used in conjunction respectively. In his book “Through the microscope :
science probes an unseen world” in 1965 [50] author M. D Anderson, writes about the history of
microscopy. In the 1600‟s, Anton van Leeuwenhoek of Holland used tiny lenses of great
curvature to make significant discoveries in the field of biology. With his lenses Leeuwenhoek
saw and described bacteria, yeast plant and even the abundance of tiny life that can be seen in a
mere drop of water. Later Robert Hooke of England developed on the Leeuwenhoek‟s crude
lenses and confirmed many of his findings.
In the 1800s, premier botanist Julius Sachs, who was interested to learn about the fate of plant
tissues when subjected to freezing stresses, came up with probably the first notable application of
cryomicroscopy [51]. Sachs‟ Phd. student Herman Muller-Thurgau also worked on similar lines
researching cellular response to freezing stress and super-cooling.
However, one of the most significant advancement in the field of cryomicroscopy came
from Dr. Hans Molish who built his very own cryomicroscope from a wooden box. In 1897, he
Both the cavity and the walls were closed by a lid which had openings to allow adjustments of
the microscope. The lid was in contact with a thermometer which recorded the temperature.
Once the microscope and the freezing mixture was placed inside, and the lid closed, other visual
aid operations like focusing or adjusting were done with the fine adjustment provisions provided,
as described above. It has to be noted here that this apparatus did not have thermal control. But
the significant improvement at this point was the fact that it saved the observer from inflicting
himself/herself to severely low temperature for such work. Before this, most of the work done
was where the sample, stage assembly, microscope and the observer were in cold environment.
Cohn (1871), Kunisch (1880), Weigand (1906) and even Julius Sachs (1892) used naturally cold

20
environments (being outdoors or holding their microscope in the window) to study freezing
processes [53].
The works of Diller and Cravalho [54] in the late 1960‟s heralded the modern generation
of cryomicroscopy. They used a closed loop feedback control system capable of
preprogramming and independent regulation of the specimen cooling rate and instantaneous
temperature. It was designed to have a small thermal mass in conjunction with an analog
electronic control circuit to facilitate a rapid response time constant. Cold and dry nitrogen gas
which passed below a thin glass plate on which the specimen was mounted, was used to cool the
unit. Heating was achieved by applying electric voltage across a thick film coated applied to the
bottom side of the plate. Although the cooling load was approximately steady state the heating
could be modulated quickly by varying the electrical voltage from the controller. The
temperature of the sample was monitored by a thermocouple inserted inside the cell suspension.
A simple proportional control logic was applied via the hardwired circuitry of the analog system
to the thermocouple input signal in comparison with a preprogrammed electrical representation
of the desired specimen thermal history. Simultaneous heating and cooling could achieve thermal
transients to 7000 °C/min. This enabled a comprehensive study of the ice nucleation in human
erythrocytes [54, 55].
3.4 The Experimental Setup
The experimental setup (Fig 3.2) that was used was very similar to that described
elsewhere [56]. Briefly, the functions of sample temperature control, event correlation, image
storage and analysis were integrated. The volumetric shrinkage of cells was detected by noting
the reducing diameter of cells due to flow of cellular water into extra-cellular space under

21
growing osmotic stresses, while IIF was evidenced by sudden “blackening” or “flashing” of the
cells.
Figure 3.2 The Cryomicroscope: Shows the experimental setup of cryomicroscope. The
different parts are labeled – A: The temperature controller, B : the liquid nitrogen pump,
C: the liquid nitrogen tank, D: the cryostage, E : the microscope, F : camera.
A B C D
E
F

22
3.4.1. Temperature Control - The Cryostage
Fig. 3.3 The Cryostage: Shows the close-up view of the cryostage. A : the window for
viewing through the microscope, B : x and y manipulators for centering and adjusting the
sample in the field of view.
This (Fig 3.3) is the part of the cryomicroscope that houses the sample and the sample
carrier. This “cryostage” manufactured by Linkam Scientific™ (Surrey, UK, Model: BCS 196) is
capable of controlled cooling and heating between –125 ˚C and +160 ˚C at cooling/heating rates
ranging from 0.1 to 130 ˚C/min. The cryostage contains a silver block over which the sample can
be placed after being confined in a high thermal conductivity quartz crucible. The temperature is
measured by a platinum resistance thermocouple placed inside the silver block which also
housed an electrical heater. The temperature controller powers the heater inside the stage which
A
B

23
is cooled by a stream of liquid nitrogen vapor that is pumped through the “liquid nitrogen pump”
attached to the cryostage. The action of the heater and the liquid nitrogen pump (which is also
connected to the temperature controller) forms a closed loop feedback control system that keeps
the sample at the desired temperature or setpoint.
3.4.2. Temperature Control Software
We used Linksys 32 as the temperature control and data acquiring software system. The
temperature controller, which is linked to a desktop computer with Linksys 32 installed in it, can
be used to preprogram the thermal history of the sample. The preprogramming can also be done
via the software installed in the connected personal computer. Once the desired cooling protocol
is fed to the temperature controller via the software or through the controller itself, it imposes the
preprogrammed thermal history (or the cooling protocol) on the sample held in the crucible by
using the liquid nitrogen pump and heater as required. The software is capable of recording
protocols with up to 100 different ramps. Any cooling protocol or “temperature profile”
typically consists of several ramps constructed based on the discretion of the user. Each ramp can
be described in terms of different cooling/heating rates, limits and hold times which can be
individually fed to the controller by the software. The controller executes each ramp between the
specified limits as per the cooling/heating rates and at the end of each hold time, it moves on to
the next ramp till the whole protocol is completed. The Linksys software provides the flexibility
to change the values of a temperature profile even while running the profile. It also provides the
option to save a profile for quick setup of a similar experiment running similar protocol.
3.4.3. Image Control and Event Correlation
During cryomicroscopy, the changes that occur in a cell with respect to changing
temperature or applied freezing stress is viewed through a microscope. The microscopes are

24
generally fitted with a camera which can continually capture images from the start till the end of
the preprogrammed temperature profile. Most of the cameras have the ability to update the image
very rapidly (25-30 frames/second) and record them simultaneously and can be used to make a
movie stacking the images one after another in proper sequence. The image capturing softwares
also provide the flexibility to slow down or speed up the movies if required. For subsequent
analysis, these recorded images needs to be annotated with the corresponding time and
temperature from the beginning of the cooling protocol. The cryostage in this case was attached
to a microscope (Nikon Eclipse E600, Nikon Instruments, NY) which is also fitted with a
Photometrics Coolsnap cf camera (Hamamatsu, Photonics, Bridgewater, NJ). During the
experiments a live video signal is sent from the camera to the attached DELL personal computer
and the images recorded with the help of commercially available Metacam software (Universal
Imaging Corp., Buckinghamshire, UK).
3.4.4. Recording Optical Information and Using the Condenser Lens
Viewing the two important bio-physical phenomenon namely „water transport‟ evidenced by
shrinkage of cells and „IIF‟ evidenced by sudden “flashing” depends on the proper passing of
light from the source through the cells suspension contained in a transparent crucible. Hence,
setting up the microscope properly for viewing and recording optical information is extremely
important. Once set up, the lens system of the microscope can be used, as it is, any number of
times unless somehow (like when the bulb is to be replaced) the arrangement is disturbed. A
simple schematic diagram, reproduced from the Linkam Scientific Instruments Ltd. Manual (Fig.
3.4) shows the schematic of the lenses and other optical equipment inside the microscope. The
details of how to work with the equipment is present in the „work instruction‟ or manual
provided by the manufacturer [57]. Briefly, these are the following steps that need to be followed

25
Figure 3.4 The Lens System: Shows the schematic diagram of the lens system of the
cryomicroscope. (Linkam Scientific Instruments Ltd.)
to get the microscope ready for use:
1. The field diaphragm at the base of the microscope has to be opened to the largest aperture
and a flat, thin piece of paper has to be placed over it.
2. The light source has to be turned on to the maximum output.

26
3. The lamp housing has to be slid backwards and forwards until an image of the filament
appears on the paper just placed above.
4. With the help of vertical centering ring and lateral centering screw the lamp has to be
adjusted to the center the filament.
5. The lamp housing has to be pulled slightly forward until the filament image is diffused,
or alternatively a diffusing filter can be fitted.
As mentioned before, since the microscope was fitted with a camera, the images seen under the
microscope was being continually recorded by the camera and stored in the computer attached to
the system. These images were eventually used to analyze the data.
3.4.5. Image Analysis for IIF and Water Transport
Basically, 3 different methods of image analysis exist [56] namely a) the mechanical
planimetry of still images, b) electronic area analysis and c) fully automatic computerized area
analysis. In the first case cross-sectional area of different cells are measured manually by
measuring the diameter of the cells from the images against a given scale. Paper tracing of video
images is also considered to be mechanical planimetry. In the second method, a computer
generated circle, the radius of which can be varied by a joystick is used by the user to match the
cell diameters and thus the required radius can be read off and areas calculated. In the third
method, images of cells can be converted to digital form and analyzed by a computer
programmed to recognize cell boundaries and calculate the area as well. In this work we used the
first method to calculate the cell diameters.
To study water transport i.e. cellular dehydration during freezing, diameters of cells at
different points of time during the cooling protocol was measured. Assuming that the cells are
spherical in shape, their volume was calculated to be V= (π/6)*D3. Using this formula the

27
volume of the cells at different temperatures was evaluated and then the normalized volume
(ratio of volume of a cell at any particular sub-zero temperature to its original volume) was
plotted against the corresponding temperature.
Similarly for IIF, images recorded by the camera were analyzed for the number of cells
undergoing “flashing” or “blackening”. These numbers, as a ratio of the total number of cells
present in the specimen, denoted the probability of intracellular ice formation (PIIF) which was
then plotted against the corresponding sub-zero temperature for different cooling velocities.

28
4. FREEZING RESPONSE OF ADIPOSE TISSUE DERIVED ADULT STEM CELLS
4.1 Background
Adult stem cells can differentiate into several other cell types of the body and studying
them could provide valuable insights about early embryonic development, organ regeneration
and transplantation [36-40]. Fortunately, adipose tissue is an easy and abundant source for such
adult stem cells and long-term storage (cryopreservation) procedures for these cells are currently
being actively explored [26,44,58-61]. The use of high molecular weight polymers such as
Polyvinylpyrrolidone (PVP) as the CPA of choice for ASCs has also been recently investigated
[26,60,61]. PVP is known to be non-toxic and has earlier been used as a CPA during freezing of
erythrocytes [62,27], mouse bone marrow cells [30,32], mouse lymphocytes [63] and Chinese
hamster cells [34]. Intriguingly, Thirumala et al. [26] found that 10% (w/v) PVP provides the
highest survival rates (~ 65%) for ASCs frozen over-night in an ethanol-jacketed container in a –
80˚C freezer. The aim of this study was to further assess the effect of PVP on the formation of
intracellular ice in ASCs and its ability to possibly mitigate the associated freezing injury.
4.2 Sample Preparation and Experiments with ASCs
4.2.1. Isolation, Collection and Culture of Cells
All human protocols were reviewed and approved by the Pennington Biomedical
Research Centre Institutional Review Board. Unless otherwise stated, all reagents were obtained
from Sigma Chemicals (St. Louis, MO). The method of culturing and harvesting adult stem cells
has been described elsewhere [26,44,58-61]. Briefly, subcutaneous adipose tissue liposuction
aspirates from three patients were provided by plastic surgeons in Baton Rouge, LA. These,
tissue samples (100 to 200 ml) were washed 3-4 times in phosphate buffered saline (PBS) pre-
warmed to 37 ˚C, suspended in PBS supplemented with 1% bovine serum albumin and 0.1%

29
collagenase (Type I, Worthington Biochemicals, Lakewood, NJ), and digested with gentle
rocking for 45-60 min at 37˚C. The digests were centrifuged for 5 min at 1200 rpm (300xg) at
room temperature, re-suspended, and the centrifugation step repeated. The supernatant was
aspirated and the pellet re-suspended in stromal medium (DMEM high glucose, 10% fetal bovine
serum, 100 units penicillin/ml, 100µg streptomycin/ml, and 25µg amphotericin/ml). The cell
suspension was plated at a density equivalent to 0.125 ml of liposuction tissue per sq cm of
surface area, using a 35 ml volume of stromal medium per T225 flask. Cells were cultured for
48 hrs in a 5% CO2, humidified, 37˚C incubator. The adherent cells were rinsed once with pre-
warmed PBS and the cells fed with fresh Stromal Medium. The cells were fed with fresh stromal
medium every 2 days until they reached approximately 75-80% confluence. The medium was
then aspirated; the cells were rinsed with pre-warmed PBS, and harvested by digestion with
0.05% trypsin solution (5-8 ml per T225 flask) for 3 to 5 min at 37˚C. The cells were suspended
in Stromal Medium, centrifuged for 5 min at 1200 rpm (300xg), the pellet re-suspended in a
volume of 10 ml of stromal medium, and the viable cell count determined by trypan blue
exclusion. These cells were identified as Passage 0 (P0). The remaining cells were seeded in
T225 flasks at a density of 5 x 10³ cells per sq cm. The cells were maintained in culture and
passaged as described above to obtain Passage 1 (P1) ASCs, and are the cells used in this study.
4.2.2. Cryomicroscopy Experiments
The cryomicroscopy experimental procedures are similar to those described extensively
in the literature [3,47,55,61,64-71]. Briefly, P1 ASCs were detached using trypsin (ATCC,
Manassa, VA) and transferred to a 1.5 ml centrifuge tube, spun down for 5 minutes at 1200 rpm
and re-suspended in 50µl of either 1x phosphate buffered saline (PBS) or 10% PVP (w/v) in 1x
PBS solution. (It must be noted here that both the solutions contained about 1 mg/liter

30
concentration of a commercially available ice nucleating bacteria – pseudomonas syringae
(Snomax, NY), due to the presence of which both the solutions froze spontaneously at ~ - 10 °C
and without which, they froze at ~ -18 °C). Approximately 2.5µl of the sample was then
transferred to the high thermal conductivity quartz crucible on the BCS-196 cryostage (Linkam
Scientific™, Surrey, UK). A coverslip was then placed on top of the cell suspension within the
quartz crucible to prevent leakage. During the experiments a live video signal was sent from the
camera to the attached DELL personal computer and the images recorded with the help of
commercially available Metacam software (Universal Imaging Corp., Buckinghamshire, UK).
4.2.3 The Cooling Protocols and Visualization of Intracellular Ice Formation
ASCs were cooled on the Linkam™ cryostage using two different temperature/time
cooling protocols. Both the cooling protocols had a common cooling ramp: cells were cooled
from 20 ˚C to –8 ˚C at 20 ˚C/min and then further cooled to –13 ˚C at 1 ˚C/min. No external
seeding agents (e.g. chilled needle and/or ice nucleating agents) were used to initiate extra-
cellular ice nucleation. At this point we employed either, cooling protocol 1: the cells were
cooled from –13 ˚C to –40 ˚C at a pre-determined cooling rate of 1, 5, 10, 20 or 40 ˚C/min and
then thawed back to 20 ˚C at 20 ˚C/min; or cooling protocol 2: the cells were re-warmed from –
13 ˚C to –5 ˚C at 20 ˚C/min and then re-cooled at a pre-determined rate of 1, 5, 10, 20 or 40
˚C/min to –40 ˚C. The cells were then thawed back to 20 ˚C at a heating rate of 20 ˚C/min.
During cooling the formation of extra- and intra-cellular ice was visually observed by the
associated changes in crystalline structure and the darkening/flashing of cells, respectively [67–
71]. The following table (table 4.1) comprehensively describes the cooling protocols used and
the purposes for the various ramps. The first step of the common ramp was the cooling to - 8°C.
This was done at a rather rapid rate of 20 °C/min so as to minimize time for the protocol.

31
Table 4.1. Table of Cooling Protocols : Shows the description of the steps involved in the
different cooling protocols used and their purposes.
Protocol Temperature
range (°C)
Cooling rate
(°C/min) Purpose
Common Ramp
20°C to -8°C 20 for cooling specimen below freezing
point
-8°C to -13°C 1 For visualizing phase change and
growth of ice front and IIF of cells
Protocol 1
-13°C to -40°C 1, 5, 10, 20, 40 For observing effects of cooling rate
on IIF percentage
-40°C to 20°C 20 For thawing back cells to room
temperature
Protocol 2
-13°C to -5°C 20 For thawing intracellular ice and
partial thawing of extra-cellular ice
-5°C to -40°C 1, 5, 10, 20, 40
For observing effects of cooling rate
on IIF percentage on cells that are re-
cooled
-40°C to 20°C 20 For thawing back cells to room
temperature
In the next ramp, the cooling velocity was slowed down to 1 °C/min so as to properly visualize
and capture images during the formation of external ice. After reaching -13 °C, any one of the
two protocols – cooling protocol 1 or cooling protocol 2 was employed.
4.3 Results and Discussion
4.3.1 Extra- and Intra-cellular Ice Formation (with and without PVP)
The extra-cellular solution remained unfrozen and super-cooled when cooled from +20˚C to –8
˚C at a cooling rate of 20 ˚C/min, i.e. no extra-cellular ice formed during the initial part of the
common cooling ramp. However, the extra-cellular ice was formed during the second part of the
common cooling ramp between –10 °C and –11 ˚C, as shown in Fig. 4.1. The extra- cellular ice

32
Figure 4.1 Intra- and Extra-cellular Ice Formation in the Common Ramp: These are
images taken during the common ramp showing extra-cellular IIF (between -10 and -
11°C). A & B are samples with 1x PBS whereas C & D contains 10% PVP. As can be seen
from the images, as soon as extra-cellular ice starts to form, some of the cells start to
undergo IIF along with it and by -13°C (refer to Fig. 4 A, B, E and F) nearly all cells are
frozen.
Extracellular Solution : 1x PBS only
Extracellular Solution : 10% PVP in 1x PBS

33
being cooled @ 1°C/min being cooled @ 40°C/min
Figure 4.2 (A-D) IIF in Protocol 1 (without PVP): These are representative images taken
during protocol 1 (-13 to -40°C) in 1x PBS only. They show the cells undergoing IIF in this
range when cooled at different cooling rates. The cooling rates used for A and C is
1°C/min while that for B and D is 40°C/min. Comparing the corresponding figures at -13
and -40°C it can be seen there is no significant difference in IIF percentage. This is due to
the fact that most cells were already frozen at -13°C (the end of the common ramp and the
beginning of protocol 1 or 2).
Tem
per
atu
re :
-1
3°C
T
emper
ature
: -
40°C

34
being cooled @ 1°C/min being cooled @ 40°C/min
Figure 4.2 (E-H) IIF in Protocol 1 (with PVP): These are representative images taken
during protocol 1 (-13 to -40°C) with 10% PVP in 1x PBS. They show the cells undergoing
IIF in this range when cooled at different cooling rates. The cooling rates used for E and G
is 1°C/min while that for F and H is 40°C/min. Comparing the corresponding figures at -13
and -40°C it can be seen there is no significant difference in IIF percentage. This is due to
the fact that most cells were already frozen at -13°C (the end of the common ramp and the
beginning of protocol 1 or 2).
Tem
per
atu
re :
-1
3°C
T
emper
ature
: -
40°C

35
nucleation was rapid and was accompanied by formation of intracellular ice in almost all (96%)
of the cells between –10 and –13 ˚C as observed by “darkening/flashing”. Thus, at the end of the
common cooling ramp, the extra-cellular medium was completely frozen and nearly all the cells
had undergone IIF.
4.3.2 Cooling Protocol 1 (with and without PVP)
To reiterate, this protocol consisted of cooling the cells from –13 ˚C to –40 ˚C at a pre-
determined cooling rate of 1, 5, 10, 20 or 40 ˚C/min (Figure 4.2). Since, the extra- and intra-
cellular ice formation had already occurred, as described above in the common cooling ramp, no
further changes in the extra- or intra- cellular space were observed at any of the cooling rates
investigated (comparing the two rows in Fig. 4.2, A - D and E - H). Consequently, the percentage
of cells exhibiting IIF remained independent of the imposed cooling rate, i.e. no statistically
significant changes in the percentage of cells exhibiting IIF was noted between the various
cooling rates. Thus, at the end of the experiments with cooling protocol 1, the percentage of
cells exhibiting IIF was > 96% (i.e., same as that observed at the end of the common cooling
ramp). Specifically, the percentage of cells exhibiting IIF at various cooling rates in PBS alone
and frozen using cooling protocol 1, are 93.75%, 94.2%, 98.4%, 100%, and 100% (fig.11) for
cells cooled at 1, 5, 10, 20 and 40 ˚C/min, from –13 ˚C to –40 ˚C, respectively. Similarly, the
corresponding percentages for ASCs frozen in the presence of 10% PVP in PBS and frozen using
cooling protocol 1, (fig. 12) are 96.9%, 100%, 98%, 100%, and 100% for cells cooled at 1, 5,
10, 20 and 40 ˚C/min, from –13 ˚C to –40 ˚C, respectively.

36
Figure 4.3 Freezing with Protocol 2 (without PVP): These are representative images taken
during protocol 2 (-13 to -5 to -40°C) with 1x PBS as extracellular solution. They show the
number of cells undergoing IIF in this range when thawed to -5°C and then cooled at
different cooling rates. The cooling rates used in the cooling ramp for A through D is
1°C/min while that for E through H is 40°C/min. It can be seen that there is negligible IIF
even at 40°C/min cooling rate presumably because nearly all the cells which experienced
IIF at -13°C also experienced membrane damage (refer to Figure 4.8).
-40°C
-13°C
-5 °C
- 20°C
thaw
ing
@ 2
0°C
/min
co
oli
ng @
1°C
/min
co
oli
ng @
1°C
/min
cooli
ng @
40 °
C/m
in
cooli
ng @
40 °
C/m
in
thaw
ing
@ 2
0°C
/min
Temperature

37
Figure 4.4 Freezing with Protocol 2 (with PVP): These are representative images taken
during protocol 2 (-13 to -5 to -40°C) with 10% PVP as extracellular solution. They show
the number of cells undergoing IIF in this range when thawed to -5°C and then cooled at
different cooling rates. The cooling rates used in the cooling ramp for A through D is
1°C/min while that for E through H is 40°C/min. With 10% PVP in 1x PBS, it can be seen
that once the cells are thawed and re-frozen, they do not experience IIF with 1°C/min but
do so again with 40°C/min.
-40°C
-13°C
-5 °C
- 20°C
thaw
ing
@ 2
0°C
/min
co
oli
ng @
1°C
/min
co
oli
ng @
1°C
/min
cooli
ng @
40 °
C/m
in
cooli
ng @
40 °
C/m
in
thaw
ing
@ 2
0°C
/min
Temperature

38
4.3.3 Cooling Protocol 2 (in 1x PBS and without PVP)
To reiterate, this protocol consisted of re-warming the cells from –13 ˚C to –5 ˚C at 20
˚C/min and then the cells were re-cooled at a pre-determined rate of 1, 5, 10, 20 or 40 ˚C/min to
– 40 °C (Figure 4.3). During the re-warming of the samples from –13 ˚C to –5 ˚C, the extra- and
intra-cellular space was partially thawed and the ice formed within the cells was transformed into
an transparent phase (as opposed to the opaque/dark phase), i.e., most probably due to the fact
that the ice within the cells melted. It is to be noted that the phase change temperature of 1x
PBS, based on the well established formula for melting point of solutions, Tm (melting point) =
273.15 – 1.858*Osm, K, where Osm is the osmolality of the solution, was found to be 272.62 K
or - 0.5 °C (the osmolality of the 1x PBS solution as measured by a Wescor™ vapor pressure
osmometer was 287 + 4 mOsm). However, further cooling of these cells from –5 ˚C to –40 ˚C at
various cooling rates (1, 5, 10, 20 and 40 ˚C/min) did not result in re-nucleation or
“darkening/flashing” in any of the cells, i.e. none of the frozen-thawed cells exhibited IIF.
Specifically, the percentage of cells exhibiting IIF at various cooling rates in PBS alone and
frozen using cooling protocol 2, are 4.6%, 3.2%, 3.9%, 0%, and 4.6% for cells cooled at 1, 5,
10, 20 and 40 ˚C/min, from –5 ˚C to –40 ˚C, respectively (fig. 4.5).
4.3.4 Cooling Protocol 2 (with 10% PVP in 1x PBS)
To reiterate, this protocol consisted of re-warming the cells from –13 ˚C to –5 ˚C at 20
˚C/min and then the cells were re-cooled at a pre-determined rate of 1, 5, 10, 20 or 40 ˚C/min to
–40 ˚C (Fig. 4.4). As before, during the re-warming of the cells/solution from –13 ˚C to –5 ˚C,
the extra- and intra-cellular space was partially thawed and the ice formed within the cells was
transformed into an transparent phase (as opposed to the opaque/dark phase). Note that the
phase change temperature of the extra-cellular solution based on the osmolality is nearly -1˚C

39
[72]. During further cooling, i.e. cooling from –5 ˚C to –40 ˚C, several phenomena were
observed, namely: i) trace amount of ice crystals present in the extra-cellular medium, acted as
nucleating agents; ii) consequently, the ice crystals formed were much larger compared to those
obtained during extra-cellular ice nucleation in the common cooling ramp and/or cooling
protocol 1. This is illustrated by a comparison of the images shown in fig. 10. This result is not
surprising as it is well known that the size of ice crystals formed during nucleation is inversely
correlated with the amount of super-cooling [3,47,55,56,64-71,73]. Most importantly, further
cooling of these cells from –5 ˚C to –40 ˚C at various cooling rates (1, 5, 10, 20 and 40 ˚C/min)
did result in re-nucleation or “darkening/flashing” in most of the cells, i.e. most of the frozen-
thawed cells exhibited IIF. Specifically, 0%, ~40%, ~47%, ~67% and ~100% (fig. 4.6) of the
ASCs frozen in 10% PVP in PBS exhibited re-nucleation or “darkening/flashing” when cooled at
1, 5, 10, 20 and 40 ˚C/min, from –5 ˚C to –40 ˚C, respectively. The observed difference in the
percentage of cells exhibiting IIF at different cooling rates can be attributed to the intrinsic
statistical dependence of the formation of intracellular ice on the imposed cooling rate
[3,47,55,56,64-71]. Basically, the imposed cooling rate of 1˚C/min was sufficiently “slow” to
avoid IIF and hence, the all of the cells experienced water transport or cellular dehydration at this
cooling rate. As the cooling rate is increased the fraction of cells experiencing IIF increases and
correspondingly, the fraction of cells experiencing water transport decreases. And at the “fast”
rate of 40 ˚C/min all the cells exhibit IIF. And finally, the fraction of cells undergoing IIF as a
function of sub-zero temperature and the imposed cooling rate, in the presence of PVP and
cooled using protocol 2, is shown in Figure 4.7.
40
Figure 4.5 Percentage IIF Comparison (without PVP): Shows the comparative values of IIF
percentage at -40°C between protocol 1 and 2, for cells frozen in 1x PBS. The numbers in brackets
shows the total number of cells that underwent IIF out of the total number of cells that were frozen.
For protocol 1, these numbers are not significantly different from the numbers at the end of the
common ramp proving that the freezing rate (1,5,10,20, 40°C/min) in protocol 1 have very little
effect on their values. As can be seen, the thawing and re-freezing ramps with protocol 2 result in
negligible IIF in 1x PBS, presumably as most of the cells were already damaged during their IIF at
the end of the common ramp (refer Fig. 4.8).
Figure 4.6 Percentage IIF Comparison (with PVP): Shows the comparative values of IIF percentage
at -40°C between protocol 1 and 2, for cells frozen in 10% PVP. The numbers in brackets shows the
total number of cells that underwent IIF out of the total number of cells that were frozen. For
protocol 1, these numbers are not significantly different from the numbers at the end of the
common ramp proving that the freezing rate (1,5,10,20, 40°C/min) with protocol 1 have very little
effect on their values. However, the thawing and re-freezing ramps with protocol 2 result in varying
percentages of IIF.
(120/128) (81/86)(63/64) (52/52) (103/103)
(0/153) (1/31) (4/103)(0/23)
(4/87)
0
20
40
60
80
100
1 5 10 20 40
Per
cen
tage
Cooling Rate ( C/min)
Protocol 1 Protocol 2
(125/129) (66/66) (49/50) (52/52) (123/123)
(0/63)
(51/130)(47/101)
(17/27)
(159/159)
0
20
40
60
80
100
1 5 10 20 40
Per
cen
tage
Cooling Rate in C/min
Protocol 1 Protocol 2

41
Figure 4.7 Variation of Percent IIF with Cooling Velocity: Percentage cells undergoing IIF as a
function of sub-zero temperature with 10% PVP in 1x PBS and cooled with protocol 2.
4.3.5 Fluorescent Dye Exclusion Tests
As mentioned in section 4.4.2., when the cells were frozen according to cooling porotocol
1 in 1x PBS (without PVP), no significant re-nucleation of intracellular ice was observed with
any of the 5 pre-determined cooling rates. To further investigate this phenomena, i.e., lack of IIF
in the frozen-thawed cells, we measured the ability of these cells to exclude a fluorescent dye.
Briefly, the cells at the end of the initial cooling step in cooling protocol 2, i.e., the cells thawed
from –13 ˚C to –5 ˚C were further thawed to 20 ˚C at 20 ˚C/min. The viability of these cells
was assessed using propidium iodide (PI) dye exclusion, as previously described [42]. Briefly,
the P1 ASCs were suspended in 1x PBS as described in section 4.2.2. However, this time the 1x
PBS solution also contained 1.5 µg/ml of propidium iodide. Approximately all of the cells
(>90%) were unable to exclude the dye and hence, had compromised membrane integrity (fig.
4.8). This suggests that the formation of intracellular ice during the common cooling ramp,
between –10 and –13 ˚C, was extremely deleterious and damaging. Hence, these cells with

42
compromised membranes did not and could not exhibit IIF on further re-cooling and further,
exhibited morphological distortions consistent with compromised membrane integrity (Figs. 9C,
9D, 9G and 9H). Similar tests were also carried out with cells suspended in 10% PVP in 1x PBS.
Based on our earlier observations of these cells to re-nucleate and exhibit IIF, we fully expected
that these viability numbers will be significantly higher than that obtained for cells frozen in the
absence of PVP. Indeed, this was found to be the case (data not shown). This led us to the
inference that the presence of PVP has a significant role in protecting the cells during the
appearance of intracellular ice that accompanies extra-cellular ice nucleation in the common
ramp.
The equilibrium melting point of 1x PBS is ~ –0.6 ˚C and that of 10% PVP in 1x PBS is
~ –1˚C [72]. However, the use of a finite cooling rate instead of infinitesimally small cooling rate
coupled with the lack of external seeding e.g. with a chilled needle, the solutions exhibit super-
cooling to temperatures as low as –10 ˚C. Obviously, once nucleation occurs in such a highly
unstable and super-cooled medium, the process of ice formation is very rapid and ice freeze-front
covers the field of view almost instantaneously [48,66,67,70-72]. It has been postulated that the
probability of ice formation is significantly increased if the extra-cellular medium freezes after a
high degree of super-cooling or at a low sub-zero temperature, mainly because of two reasons: i)
the high degree of cooling rates experienced by the sample due to the thermal fluctuations caused
by the release of latent heat of the extra-cellular medium and ii) due to the high amount of
intracellular super-cooled water retained within the cells due to the lack of cellular dehydration
[3,47,64-66,69-71]. Thus, during the common cooling ramp, a significant % of the cells exhibit
IIF; specifically 1015 cells exhibited IIF out of a total 1060 cells investigated as part of this study
(or ~96%).

43
Figure 4.8 Propidium Iodide Exclusion Tests: Shows the results of the propidium iodide
exclusion tests with 1x PBS and 1.5 µg/ml propidium iodide (A & B). Cells were made to
cool through the common ramp till -13°C (where they experienced IIF as before) and then
thawed back to room temperature. Figure A shows the number of dead cells (~2) out of
~187 cells at start and B shows the number of dead cells at the end of the experiment
(~170).

44
5. CONCLUSION AND FUTURE WORK
The main objective of this work was to assess the effect of 10% (w/v) PVP on the pattern
of IIF in ASCs in the absence of serum and other cryoprotective agents (CPAs). All of the cells
were cooled in a common cooling ramp from 20 ˚C to –8 ˚C at 20 ˚C/min and then further cooled
to –13 ˚C at 1 ˚C/min (during which the extra-cellular medium froze very rapidly and was
accompanied by the formation of intra-cellular ice in ~90% of the cells). Almost none (<5%) of
the ASCs frozen in 1x PBS and protocol 2 (re-warmed from –13 ˚C to –5 ˚C at 20 ˚C/min and
then re-cooled at a pre-determined rate of 1, 5, 10, 20 or 40 ˚C/min to –40 ˚C) exhibited IIF. The
lack of IIF in cells cooled in 1x PBS and protocol 2 was due to the initial loss of cell viability
that was associated with the formation of extra-cellular ice and associated IIF in the common
cooling ramp. Intriguingly, ~0, ~40, ~47, ~67 and ~100% of the ASCs frozen in 10% PVP in
PBS and protocol 2 exhibited IIF at a cooling rate of 1, 5, 10, 20 or 40 ˚C/min, respectively. The
observed increase in the percentage of ASCs exhibiting IIF when frozen in 10% PVP and
protocol 2, is presumably due to PVP mitigating the damaging effects of IIF during the initial
common cooling ramp. The results of this study can be hence used to construct cryopreservation
protocols for ASCs without the use of serum and DMSO.
The optimal cooling rate that is required for the cryopreservation of ASCs without serum
and DMSO to produce the maximum post thaw viability still remains to be ascertained. Future
researchers may want to look into this data and use cooling protocol 2 and 10% PVP and use
“flow-cytometry analysis” as used in the work by Thirumala et al [26] to find out more accurate
viability numbers for this process. It is probable that the cooling method used in the work by
Thirumala et al [26] (freezing ASCs over-night in an ethanol-jacketed container in a –80˚C
freezer) suffers from the drawback that the intracellular ice formed in the cells during nucleation

45
of the extracellular medium is not melted (as in the thawing ramp of protocol 2) and hence
cannot lose enough water to avoid IIF injuries at further lower temperatures. The fact that 0% IIF
with 1 °C/min and ~ 40% IIF with 5 °C/min cooling rate was observed in the re-freezing step of
protocol 2 with an extracellular medium of 10% PVP, hints to the existence of a optimum
cooling rate within a narrow window which can be found out with further freezing studies. It
should also be noted that the standard equations of water transport (equations 6 and 7) do not
apply to this particular system containing PVP in the extracellular medium. This is because of
the fact that the Mazur‟s equations of water transport have been derived on the basis of the
assumption that both the intra- and the extra-cellular solutions are ideal solutions following
Raoult‟s Law. However, in this case, the extra-cellular solution containing PVP deviates
significantly from ideal behavior of solutions and does not follow Raoult‟s law of ideal solutions.
The non-ideal behavior of PVP has been shown elsewhere [74] and the water transport equations
of such a system with the extra-cellular medium containing a polymer (PVP), salts and water
needs to be suitably modified by using volume fractions instead of mole fractions and the
interaction parameter (χ) of PVP-water.

46
REFERENCES
1. Tucker, M.J., and Liebermann, J., “Vitrification in assisted reproduction: A user‟s manual
and trouble-shooting guide”, Informa Healthcare, London, UK, 2007.
2. Mazur, P., “Freezing of living systems: mechanisms and implications,” American Journal
of Cell Physiology, 1984, 247(3), p. C125-C142.
3. McGrath, J. J., Cravalho, E. G., Huggins, C. E., “An experimental comparison of
intracellular ice formation and freeze-thaw survival of HeLa S-3 cells,”
Cryobiology,1975, 12, p. 540-550.
4. Bernard, A., and Fuller, B. J., “Cryopreservation of human oocytes: a review of current
problems and perspectives,” Human Reproduction Update, 1996, 2(3), p. 193-207.
5. Walsh, J.R., “Modeling and design of algal cryopreservation protocols,” Ph.D.
Dissertation, 2003, The University of Texas at Austin, Austin Texas.
6. Day, S. H., Nicoll-Griffith, D. A., Silva, J. M., “Cryopreservation of rat and human liver
slices by rapid freezing,” Cryobiology, 1999, 38, p. 154-159.
7. Devireddy, R. V., Olin, T., Vincente, W.,Troedsson, M. H. T., Bischof, J. C., Roberts, K.
P., “Cryopreservation of equine spermatozoa: Optimal cooling rates in the presence and
absence of cryoprotective agents,” Biology of Reproduction, 2002, 66, p. 222-231.
8. Devireddy, R.V., Raha, D. and Bischof, J. C., “Measurement of water transport during
freezing in cell suspensions using a differential scanning calorimeter,” Cryobiology,
1998, 36, p. 124-155.
9. Mazur, P., “Kinetics of water loss from cells at subzero temperatures and the likelihood
of intracellular freezing,” Journal of General Physiology, 1963, 47, p. 347-369.
10. Mazur, P., “The role of intracellular freezing in the death of cells cooled at supraoptimal
rates,” Cryobiology, 1977, 14, p. 251-272.
11. Toner, M., Cravalho, E.G., and Karel, M., “Thermodynamics and kinetics of intracellular
ice formation during freezing of biological cells,” Journal of Applied Physics, 1990. 67,
p. 1582-1593.
12. Toner, M., “Nucleation of ice crystals inside biological cells,” Advances in low
temperature biology, 1993, 2, p. 1-51.
13. Mazur, P., Leibo, S. P., Chu, E. H. Y., “A two-factor hypothesis of freezing injury,”
Experimental Cell Research, 1972, 71, p. 345-355.

47
14. McGrath, J. J., “Preservation of biological material by freezing and thawing,” Heat
transfer in medicine and biology, A. Shitzer and R.C Eberhart (eds.), Plenum Press., New
York, 1985.
15. Polge, C., Smith, A. U., and Parkes, A. S., “Revival of spermatozoa after vitrification and
dehydration at low temperatures”, Nature, 1949, 164, p. 666.
16. Jens, K.O.M., and Toner, M., “Long-term storage of tissues by cryopreservation : critical
issues, Biomaterials”, 1996. 17 (3), p. 243-256.
17. Timasheff, S.N., “Preferential interactions in protein-water-cosolvent system”,
Biophysics of Water. 1982, Wiley, New York.
18. Arakawa, T., Carpenter, J. F., Kita, W. A., and Crowe, J. H., “The basis for toxicity of
certain cryoprotectants: a hypothesis”, Cryobiology, 1990, 27, p. 401-415.
19. Devireddy, R. V., and Bischof, J. C., “Measurement of water transport during freezing in
mammalian liver tissue-part II: The use of differential scanning calorimetry,” ASME
Journal of Biomechanical Engineering, 1998, 120, p. 559-569.
20. Devireddy, R. V., Smith, D. J., Bischof, J. C., “Mass transfer during freezing in rat
prostate tumor tissue,” American Institute of Chemical Engineers Journal, 1999, 45(3), p.
639-654.
21. Devireddy, R. V., Swanlund, D. J., Roberts, K. P., Bischof, J. C., “Sub-zero water
permeability parameters of mouse spermatozoa in the presence of extracellular ice and
cryoprotective agents,” Biology of Reproduction, 1999, 61(3), p. 764-775.
22. Chu, F.C., Johnson, J.B., Orr, H.C., Probst, P.G., and Petricciani, and J.C., “Bacterial
virus contamination of fetal bovine sera”, In vitro cellular and developmental biology –
plant, 1973, 9, p. 31-34.
23. Erickson, G.A., Bolin, S.R., and Landgraf, J.G., “Viral contamination of fetal bovine
serum used for tissue culture : risks and concerns”, Developments in biological
standardization, 1991, 75, p. 173-175.
24. Boone, C.W., Mantel, N., Caruso Jr., T.D., Kazam, E., and Stevenson, R.E., “Quality
control studies on fetal bovine serum used in tissue culture”, In vitro cellular and
developmental biology – plant, 1971, 7, p. 174-189.
25. Yanagi, M., Bukh, J., Emerson, S.U., and Purcell, R.H., “Contamination of
Commercially Available Fetal Bovine Sera with Bovine Viral Diarrhea Virus Genomes:
Implications for the Study of Hepatitis C Virus in Cell Cultures” The Journal of
Infectious Diseases, 1996, 174 (6), p. 1324-1327.

48
26. Thirumala, S., Gimble, J. M., and Devireddy, R.V., “Evaluation of polyvinylpyrrolidone
(PVP) as a cryoprotectant for adipose tissue derived adult stem cells (ASCs)”, Tissue
Engineering Part C., 2009, accepted and pending revisions.
27. Meryman, H.T., “Observations on the present state of blood preservation by freezing”,
Cryobiology, 1968, 5, p. 144-146.
28. Meryman, H. T., and Kafig, E., “Rapid freezing and thawing of whole blood”, In
Proceedings of the Society for Experimental Biology and Medicine, 1955, p. 587-589.
29. Doebbler, G. F., Buchheit, R. G., and Riofret, A. P., “Recovery and in vivo survival of
rabbit erythrocytes”, Nature, 1961, 191, p. 1405.
30. Persidsky, M., and Richards, V., “Optimal conditions and comparative effectiveness of
dimethyl sulfoxide and polyvinylpyrrolidone in preservation of bone marrow”, Nature,
1963, 197, p. 1010-1012.
31. Zdebska, E., Traczyk, Z., Arczynska, E., and Serafinska, D., “ comparative evaluation of
the quality of leukocytes stored at -196 centigrades C in glycerol and
polyvinylpyrrolidone (PVP)”, Acta Haematologica Polonica, 1975, 6, p. 283-291.
32. Richards, V., and Persidsky, M., “Studies in preservation of bone marrow”, Surgery,
1961, 50, p. 288-298.
33. Persidsky, M., and Richards, V., “Mode of protection with polyvinylpyrrolidone in
freezing of bone marrow”, Nature, 1962, 196, p. 585-586.
34. Mazur, P., Leibo, S. P, Farrant, J., Chu, E. H. Y., Hanna, M.G., and Smith, L. H.,
“Interactions cooling rate, warming rate, and protective additive on the survival of frozen
mammalian cells”, In: Ciba Foundation Symposium on the frozen Cell, 1970, London, p.
69-88.
35. Kim, C. K., Yong, H., Lee, G., and Cho, J., “The reducing toxicity action of
polyvinylpyrrolidone (PVP) in vitrification solutions and its effect on subsequent
development of mouse embryos”, Tissue Engineering and Regenerative Medicine, 2009,
6, p. 95-99.
36. Thomson, J. A., Odorico, J. S., “Human embryonic stem cell and germ cell lines”, Trends
in Biotechnology, 2000, 18, p. 59-63.
37. Thomson, J. A., Joseph, I. E., Sander, S. S., Michelle, A. W., Jennifer, J. S., Vivienne, S.
M., and Jeffery, M. J., “Embryonic stem cell lines derived from human blastocysts‟,
Science, 1998, 282, p. 1145-1147.

49
38. Michael, J. S., Joyce, A., Shunping, W., Elizabeth, M. B., John, W. L., Peter, J. D., Paul,
D. B., George, R. H., and John, D. G., “Derivation of pluripotent stem cells from cultured
human primordial germ cells”, Developmental Biology, 1998, 95, p. 13726-13731.
39. Wakitani, S., Takaoka, K., Hattori, T., Miyazawa, N., Iwanaga, T., Takeda, S., Watanabe,
T. K., and Tanigami, A., “Embryonic stem cells injected into the mouse knee joint form
teratomas and subsequently destroy the joint”, Rheumatology, 2003, 42, p. 162-165.
40. Brickman, J, M., and Thomas, G. B., “Pluripotency and tumorigenicity”, Nature
Gemetics, 2002, 32, p. 557-558.
41. Thirumala, S., Zvonic, S., Flyod, E., Gimble, J., and Devireddy, R. V., “Effect of various
freezing parameters on the immediate post-thaw membrane integrity of adipose tissue
derived adult stem cells”, Biotechnology Progress, 2005, 21, p. 1511-1524.
42. Fuller, R., and Devireddy, R. V., “The effect of two different freezing methods on the
immediate post-thaw membrane integrity of adipose tissue derived adult stem cells”,
International Journal of Heat and Mass Transfer, 2008, 51, p. 5650-5654.
43. Goh, B. C., Thirumala, S., Kilroy, G., Devireddy, R. V., and Gimble, J. M.,
“Cryopreservation characteristics of adipose tissue derived adult stem cells: maintenance
of differentiation potential and viability”, Journal of Tissue Engineering and
Regenerative Medicine, 2007, 1, p. 322-324.
44. Thirumala, S., Gimble, J. M., and Devireddy, R. V., “Transport phenomena during
freezing of adipose tissue derived adult stem cells”, Biotechnology and Bioengineering,
2005, 92, p. 372-383.
45. Levin, R. L., Cravalho, E. G., and Huggins, C. G., “A membrane model describing the
effect of temperature on water conductivity of erythrocyte membranes at subzero
temparatures”, Cryobiology, 1976, p. 415-429.
46. Leibo, S. P., “Water permeability and its activation energy of fertilized and unfertilized
mouse ova”, Journal of Membrane Biology, 53, 1980, p. 179-188.
47. Toner, M., Tompkins, R. G., Cravalho, E. G., and Yarmush, M. L., “Trasnport
phenomena during freezing of isolated hepatocytes”, AIChE Journal, 38, 1992, p. 1512-
1522.
48. Mazur, P., “Cryobiology : The freezing of biological systems”, Science, 1970, 168, p.
939-949.
49. Thiruamla, S., and Devireddy, R. V., “A simplified procedure to determine the optimal
rate of freezing biological systems”, Journal of Biomechanical Engineering, 2005, 127, p.
295-300.

50
50. Anderson, M. D., “Through the microscope : science probes an unseen world”, The
Natural History Press, Garden City, New York, 1965.
51. Pringsheim, E. G., “Julius Sachs : Founder of modern plant physiology, 1832-1897”,
Verlag Von Gustav Fischer, Jena, 1932.
52. Molish, H., “Untersuchen uber das erfieren der pflanzen”, Fischer, Jena, 1897, Reprinted
in English in Cryo-Letters, 1982, 3, p. 332-390.
53. Echlin, P., “Low temperature microscopy and analysis”, Springer-Verlag, New York,
2008.
54. Diller, K. R., “Bioheat and mass transfer as viewed through a microscope”, Journal of
Biomechanical Engineering, 2005, 127, p. 67-84.
55. Diller, K. R., and Cravalho, E. G., “A cryomicroscope for the study of freezing and
thawing processes in biological cells”, Cryobiology, 1970, 7, p. 191-199.
56. Cosman, M. D., Toner, M., Kandel, J., and Cravalho, E. G., “An integrated
cryomicroscopy system”, Cryo-Letters, 1989, 10, p. 17-38.
57. Linkam Scientific Instruments Ltd., L. S. I., “BCS 196 stage manual”, 2005, p. 4-18.
58. Devireddy, R. V., Thirumala, S., and Gimble, J.S., “Cellular Response of Adipose
Derived Passage-4 Adult Stem Cells to Freezing Stress”, ASME Journal of
Biomechanical Engineering, 2005, 127, p. 1081-1086.
59. Mittal, S., and Devireddy, R. V., “Dessication Tolerance of Adult Stem Cells in the
Presence of Trehalose and Glycerol”, The Open Biotechnology Journal, 2008, 2, p. 211-
218.
60. Thirumala, S., Gimble, J., and Devireddy, R. V., “Evaluation of methylcellulose and
dimethylsulfoxide as the cryoprotectants in a serum free freezing media for
cryopreservation of adipose derived adult stem cells”, Stem Cells and Development,
2009, In press.
61. Thirumala, S., Gimble, J. M., and Devireddy, R. V., “Cryopreservation of Stromal
Vascular Fraction of Adipose Tissue in a Serum Free Freezing Media”, Journal of Tissue
Engineering and Regenerative Medicine, 2009, Accepted Pending Revisions.
62. Meryman, H.T., “Preservation of blood by freezing: A review”, Cryobiology, 1964, 1, p.
52-56.
63. Ashwood-Smith, M.J., “Low Temperature Preservation of Mouse Lymphocytes with
Dimethyl Sulfoxide”, Blood, 1964, 23, p. 494-501.
51
64. Steponkus, P. L., Dowgert, M. F., Ferguson, J. R., and Levin, R. L., “Cryomicroscopy of
isolated plant protoplasts”, Cryobiology, 1983, 20, p. 1138-1162.
65. Scheiwe, M. W., and Körber, C., “Thermally defined cryomicroscopy and
thermodynamic analysis in lymphocyte freezing”, Cryobiology, 1984, 21, p. 93-105.
66. Shabana, M., and McGrath, J. J., “Cryomicroscopic investigation and thermodynamic
modeling of the freezing of unfertilized hamster ova”, Cryobiology, 1988, 25, p. 338-352.
67. Franks, F., Mathias, S. F., Galfre, P., Webster, S. D., and Brown, D., “Ice nucleation and
freezing in undercooled cells”, Cryobiology, 1983, 20, p. 298-309.
68. Franks, F., and Bray, M., “Mechanism of ice nucleation in undercooled plant cells”,
Cryo-Letters, 1980, 1, p. 221-226.
69. Körber, C. H., Englich, S., and Rau, G., “Intracellular ice formation: cryomicroscopical
observation and calorimetric measurement”, Journal of Microscopy, 1991, 161, p. 313-
325.
70. Toner, M., Cravalho, E. G., and Armant, D. R., “Water transport and estimated
transmembrane potential during freezing of mouse oocytes”, Journal of Membrane
Biology, 1990, 115, p. 261-272.
71. Toner, M., Cravalho, E.G., and Karel, M., “Thermodynamics and kinetics of intracellular
ice formation during freezing of biological cells”, Journal of Applied Physics, 1990, 67,
p. 1582-1593.
72. Kimizuka, N., Viriyarattanasak, C., and Suzuki, T., “Ice nucleation and supercooling
behavior of polymer aqueous solutions”, Cyobiology, 2008, 56, p. 80-87.
73. Fennema, O., Powrie, W., and Marth, E., “Low temperature preservation of foods and living
matter”, Marcel Dekker, 1973. New York, USA.
74. Farrant, J., “Is there a common mechanism of protection of living cells by
polyvinylpyrrolidone and glycerol during freezing?”, Nature, 1969, 222, p. 1175-1176.

52
VITA
Avishek Guha was born in Calcutta, West Bengal in India in June, 1980. He received his
primary and secondary education from South Point High School, Calcutta. After graduating from
high school in 1999, he pursued Bachelor of Engineering degree in Jadavpur University,
Calcutta. In 2003, he graduated from Jadavpur University and joined TVS Motor Company in
Hosur, India as a graduate engineering trainee where he worked for one year in fabrication
division. He then shifted to HV Transmissions Ltd. (Tata Motors) in Jamshedpur, India and
worked there for three years till July, 2007 in Ancillary Development Department. In the fall of
2007 he went to graduate school in Louisiana State University. He is a candidate for the degree
of Master of Science in Mechanical Engineering to be awarded at the commencement of
December, 2009. After completion of the degree, he intends to join the doctoral program in
mechanical engineering at Louisiana State University from spring of 2010.
Related Documents