i Intra-Organizational Stressors in Power Wing of Water and Power Development Authority: An Empirical Study A Test of the Demands-Control-Support Model By Saif-ur-Rehman Khan M.COM. (Goldmedallist) University of Peshawar (1994) MBA Institute of Business Administration Lahore (2000) A THESIS SUBMITTED IN PARTIAL FULFILMENT OF THE REQUIREMENTS FOR THE DEGREE OF DOCTOR OF PHILOSOPHY IN MANAGEMENT SCIENCES TO FACULTY OF ADVANCED INTEGRATED STUDIES AND RESEARCH NATIONAL UNIVERSITY OF MODERN LANGUAGES (NUML) ISLAMABAD July, 2008

Welcome message from author
This document is posted to help you gain knowledge. Please leave a comment to let me know what you think about it! Share it to your friends and learn new things together.
Transcript

i
Intra-Organizational Stressors in Power Wing of Water and Power Development Authority: An Empirical Study
A Test of the Demands-Control-Support Model
By
Saif-ur-Rehman Khan M.COM. (Goldmedallist) University of Peshawar (1994) MBA Institute of Business Administration Lahore (2000)
A THESIS SUBMITTED IN PARTIAL FULFILMENT OF THE REQUIREMENTS FOR THE DEGREE OF
DOCTOR OF PHILOSOPHY
IN MANAGEMENT SCIENCES
TO
FACULTY OF ADVANCED INTEGRATED STUDIES AND RESEARCH
NATIONAL UNIVERSITY OF MODERN LANGUAGES (NUML) ISLAMABAD
July, 2008

ii
DISSERTATION AND DEFENSE APPROVAL FORM The undersigned certify that they have read the following thesis, examined the defense, are satisfied with the overall examination performance, and recommend the thesis to the Faculty of Advanced Integrated Studies & Research for acceptance:
Dissertation Title: Intra-Organizational Stressors in Power Wing of Water and Power Development Authority: An Empirical Study
A Test of the Demands-Control-Support Model Submitted by: Saif-ur-Rehman Khan Registration # 216-Ph.D/M.S/2004 (Jan) Doctor of Philosophy in Human Resource Development Degree Name Management Sciences (HRD) Name of Discipline Prof. Dr. Kashif-ur-Rehman Name of Research Supervisor Signature of Research Supervisor Prof. Dr. Shazra Munnawer Name of Dean (FAISR) Signature of Dean (FAISR) Prof. Dr. Aziz Ahmed Khan Name of Rector Signature of Rector Dated---------------------------------------

iii
CANDIDATE DECLARATION FORM I Mr. Saif-ur-Rehman Khan --------------------------------------------------------------------------------------- Son of Mr. Niamat Khan --------------------------------------------------------------------------------------- Registration No 216-Ph.D/M.S/2004 (Jan) --------------------------------------------------------------------------------------- Discipline Management Sciences --------------------------------------------------------------------------------------- Candidate of Doctor of Philosophy at the National University of Modern Languages do hereby declare that the thesis “Intra-Organizational Stressors in Power Wing of Water and Power Development Authority: An Empirical Study-A Test of the Demands-Control-Support Model” submitted by me in partial fulfillment of Ph.D. degree in discipline of “Management Sciences “is my original work, and has not been submitted or published earlier. I also solemnly declare that it shall not, in future, be submitted by me for obtaining any other degree from this or any other university or institution. I also understand that if evidence of plagiarism is found in my thesis/dissertation at any stage, even after the award of a degree, the work may be cancelled and the degree revoked. ------------------------------------ Signature Saif-ur-Rehman Khan Name of Scholar Dated -----------------------------

iv
ABSTRACT
KEY WORDS: (STRESSORS, JOB STRESS & STRAIN, DEMANDS-CONTROL- SUPPORT MODEL)
Most of the stress theories were developed to describe reactions to “inevitable” acute
stress in a work environment threatening the individual organic survival. However, the
demand-control-support model (DCSM) was constructed for work environments where
“stressors” are persistent, not initially life threatening, and are the products of
complicated human organizational decision making process. Here, the controllability of
these stressors is very important, and becomes more important as we develop ever more
complex and integrated organizational system, with ever more complex personality
traits of individual behavior. The DCSM (Karasek 1976 & 1979; Karasek and Theorell
1990) is based on psychosocial and physical characteristics of work environment: the
psychological and physical demands of work and a combined measure of task control
through personal skills (decision latitude) and social support. Job control includes the
worker’s abilities and skills for coping with demands and the latitude to decide how a
specific task should be accomplished. Job stress depends on the level of demands, on
the worker’s decision- making latitude, and on the quality of social support available
from management and co-workers.
The models predict, first, stress-related strain indices, and, secondly, active/passive
behavioral correlates of jobs. These models propose that worker strain and active
learning are determined by particular combinations of job demands, job control and
social support at workplace. Specifically, incumbents of jobs that are high in
demands, low in control, and low in support are expected to show high levels of
strain, whilst incumbents of jobs that are high in all three job factors are expected to
display high levels of activity, learning and participation, both on and off the job. The
models also propose that prolonged exposure to combinations of these job conditions
influence workers' immediate indices (job anxiety, job dissatisfaction and somatic
symptoms) and remote indices (mastery, neuroticism, and employee’s turnover
intention and activity participation) of job strain. This thesis reports an attempt to
clarify, critically evaluate, extend and test Karasek & Theorell’s models.

v
Self-report data, as well as information obtained from Distribution Companies
(DISCOs) of power wing of Water and Power Development Authority (WAPDA) are
used to assess the independent linear, quadratic, additive and interactive effects of job
factors. Study 1 is being conducted a cross-sectional design, and self-report
measures of job demands, job control and job stressors to predict several indices of
worker strain and performance. Study 2 was designed to ensure the authenticity of
study 1 and thus to provide a more valid and logical proof of test of Karasek’s
hypothesis and models. Personality variables of employees (neuroticism, mastery)
were also determined to predict the relationship with job factors and indices of job
strain. In general, the results from this research confirm past findings regarding the
effects of job demands, control and social support on strain. The research makes
several important contributions to practical implications to job development and jobs
re-design. More practically, the research reinforces the importance of providing
"control-enhancing" opportunities for employees who are facing problems to highly
demanding jobs. Because the cost of stress and strain is very high for individuals
(poor health, accidents, job dissatisfaction, health care expenditures), for companies
or organizations (poor performance, lack of productivity, effects the quality of work,
spoilage and defective work, absenteeism, medical costs, turnover, even labor
conflicts and strikes), and for society (health care costs, loss of intellectual capital,
low-level performance and economic competitiveness). Recommendations for future
research include the need to test an expanded model using multi-wave cross-sectional
designs and magnitude of multi-stressors of work environment.

vi
CONTENTS
Serial No. Titles Page No.
CHAPTER # 1…………………………………………… 01-31 1.0 Introduction………………………………………………. 01 1.1 Background of study………………………………………. 01 1.2 Problem Identifications……………………………………. 04 1.3 Rationale of Study………………………………………… 07 1.4 Objective of Study………………………………………… 08 1.5 Theoretical Framework of study…………………………. 09
1.5.1 A General Model…………………………………………………… 10 1.5.2 Review of the first model………………………………………….. 11 1.5.3 Review of second model…………………………………………… 14
1.6 Hypotheses………………………………………………… 16 1.7 Scope of study……………………………………………... 17 1.8 Definition of Terms……………………………………….. 19
1.8.1 The concept of stress………………………………………………. 19 1.8.2 Stress and its related constructs…………………………………. 20 1.8.3 Antecedent of job stress and strain………………………………. 21 1.8.4 Description of DCSM……………………………………………… 23 1.8.5 Job demand and job stress………………………………………... 24 1.8.6 Job demand and employees………………………………………. 25 1.8.7 Job control and job stress………………………………………… 25 1.8.8 Job control and employees……………………………………….. 27 1.8.9 Job support and stress…………………………………………….. 27
1.8.10 Job support and employees……………………………………….. 28 1.9 Brief introduction of WAPDA……………………………. 28
1.9.1 Organization chart………………………………………………… 29 1.9.2 Water wing authority……………………………………………… 29 1.9.3 Power wing authority……………………………………………... 30 1.9.4 Finance wing authority…………………………………………… 31
CHAPTER # 2……………………………………………. 32-92 2.0 LITERATURE REVIEW……………………………….. 32 2.1 Model description…………………………………………. 32
2.1.1 Concept of active job in DC model……………………………… 35 2.1.2 Concept of Passive job in DC model……………………………. 35 2.1.3 Concept of low strain job in DC model…………………………. 36 2.1.4 Concept of high strain job in DC model………………………… 36
2.2 Current status of Robert Karasek DCSM ………………… 37 2.3 The JDC model and social support………………………... 40 2.4 The JDC model and locus of control……………………… 41 2.5 The JDC model & social support & locus of control …….. 42 2.6 Independent effects of job factors on strain……………… 43

vii
CONTENTS (Cont’d) Serial No. Titles Page
No. 2.6.1 Independent effects of job demands on strain…………………. 43 2.6.2 Independent effects of job control on strain…………………….. 44 2.6.3 Independent effects of job social supports on strain………….. 46 2.6.4 Quadratic effects of job demand, job control
and social support on strain ……………………………………… 48 2.6.5 Addictive effects on job factors on strain……………………….. 50
2.7 Two-Ways interaction of job factors- demand control on strain………………………………………………………… 57
2.8 Three-Ways interaction of job factors-demand control-support on strain…………………………………………..... 66
2.9 Effects of the personality variable………………………….. 67 2.10 Work motivation theory and active learning through DC
model ………………………………………………………. 68 2.11 Rule of negative affectivity on strain……………………….. 69 2.12 Locus of control and mastery……………………………….. 73 2.13 The person-environmental model…………………………. 75
2.13.1 Conceptualizing person-environment…………………………… 75 2.14 Karasek dynamic effort reward imbalance model………… 77
2.14.1 Conceptualization of job demand in DC model and ERI Model………………………………………………………………… 78
2.14.2 DC model and ERI model-similarity and difference…………… 81 2.15 Criticism on JDCSM………………………………………... 84 CHAPTER # 3……………………………………………... 93-1123.0 Research Methodology……………………………………. 93 3.1 Methods……………………………………………………. 93
3.1.1 Study 1- Sample…………………………………………………… 93 3.1.2 Comparison with population of DISCOS employees …………. 93
3.2 Study 2- Sample……………………………………………. 94 3.2.1 Comparison with population of WAPDA………………………. 95 3.3 Measures…………………………………………………… 96
3.3.1 Development of scales to measure job factors………………… 96 3.4 Study 1- Testing of hypotheses and models………………... 100 3.4 Measurement of job factors………………………………. 100
3.4.1 Job demands………………………………………………………. 100 3.4.2 Job control………………………………………………………… 100 3.4.3 Social support……………………………………………………… 101
3.5 Measurement of strain…………………………………….. 102 3.5.1 Job stress…………………………………………………………… 103

viii
CONTENTS (Cont’d) Serial No. Titles Page
No. 3.5.2 Job anxiety……………………………………………………… 103 3.5.3 Job dissatisfaction……………………………………………. 104 3.5.4 Somatic symptoms……………………………………………. 104 3.5.5 Neuroticism…………………………………………………… 105 3.5.6 Mastery……………………………………………………….. 105 3.5.7 Activity participation……………………………………….. 106
3.6 Structure of final questionnaire……………………… 107 3.6.1 Study 1&2 questionnaire……………………………………… 107 3.6.2 Procedure……………………………………………………….. 108
3.6.2.1 Study 1 survey procedure………………………………………….. 108 3.6.2.2 Study 2 survey procedure………………………………………….. 108
3.7 Data Analysis………………………………………….. 109 3.7.1 Approaches to data analysis………………………………….. 109 3.7.2 Overview of data analytic steps……………………………… 111
CHAPTER # 4………………………………………… 113-127 4.0 Study 1 Testing of hypotheses………………………… 113 4.1 Overview……………………………………………….. 113 4.2 Correlation analysis…………………………………….. 113 4.3 Main effects of job factors on stressors and strain……… 114 4.4 Addictive effects of stressors on strain…………………. 114 4.5 Main effects on stressors and strain……………………... 115 4.6 Quadratic effects on stressors and strain………………… 116 4.7 Interactive effects on stressors and strain……………….. 116 4.8 Multiple regression analysis…………………………… 117
4.8.1 Quadrate effects………………………………………………. 117 4.8.2 Interactive effects……………………………………………. 118
4.9 Analysis involving the total job factors scale…………. 118 4.9.1 Analysis involving five specific job factors scale………….. 119 4.9.2 Analysis involving job factors in a single domain………….. 119
4.10 Mediator of the job factors- strain- relationship…………. 120 4.11 Summary of study 1 results and findings………………... 121 4.12 Discussions and conclusions from study 1 ……………… 124 CHAPTER # 5………………………………………….. 128-197 5.0 Study 2, Testing of hypotheses and models…………… 128 5.1 Overview………………………………………………… 128 5.2 Additional predictions of hypotheses……………………. 128 5.3 Correlation analysis…………………………………….. 130 5.4 Testing of stress hypotheses……………………………. 132
5.4.1 Main interactive effect on job stress………………………….. 132 5.4.2 Regression analysis…………………………………………….. 133 5.4.3 Evaluation of Karasek Original Model……………………… 134

ix
CONTENTS (Cont’d) Serial No. Titles Page
No. 5.5 Summary of finding from stressors and job stress………… 138 5.6 Discussion and conclusion regarding stressors hypotheses.. 140 5.7 Study 2, testing of strain hypotheses…………………….. 141
5.7.1 Correlation analysis of stain indices………………………….. 141 5.7.2 Multiple regression analysis…………………………………… 142
5.7.2.1 Main and addictive effects of job factors on job anxiety (a & b)…………………………………………………. 142
5.7.2.2 Main and addictive effects of job factors on job dissatisfaction ………………………………………………… 145
5.7.2.3 Main and addictive effects of job factors on job somatic symptoms………………………………………………… 145
5.8 Summary of findings………………………………………. 146 5.9 Discussion regarding immediate strain hypotheses ………. 148 5.10 Study 2, Test of personality variables…………………… 152 5.11 Multiple regression analysis……………………………… 154
5.11.1 Main and addictive of job factors on neuroticism……………. 154 5.11.2 Main and addictive of job factors on mastery scale…………. 156 5.11.3 Summary of findings of personality variables…………….. 157
5.12 Discussion regarding personality variables……………….. 162 5.13 Modeling analyses……………………………………….. 166
5.13.1 Model-1………………………………………………………… 166 5.13.2 Model-2………………………………………………………… 168 5.13.3 Model-3…………………………………………………………. 173 5.13.4 Model-4…………………………………………………………. 175 5.13.5 Model-5………………………………………………………….. 178 5.13.6 Model-6………………………………………………………….. 180 5.13.7 Model-7…………………………………………………………. 181
5.14 Summary of findings of modeling………………………… 183 5.15 Study 2, Test of activity participation hypotheses……….. 185
5.15.1 Correlation analysis……………………………………. 186 5.15.2 Regression analysis …………………………………… 187 5.15..2.1 Main and addictive effects of job factors
on job performance…………………………………………….. 187 5.15..2.2 Main and addictive effects of job factors
on job participation……………………………………………. 188 5.15..2.3 Main and addictive effects of job factors
on job consideration……………………………………………. 190 5.16 Summary of findings………………………………………. 192

x
CONTENTS (Cont’d) Serial No. Titles Page
No. 5.15 Discussion on activity participation hypotheses…............ 195 CHAPTER # 6…………………………………………. 198-213 6.0 Overall Conclusion and Recommendations………….. 198 6.1 Evaluation of research…………………………………… 198 6.2 Review of main findings………………………………… 202 6.3 Theoretical implicati0on of current study……………….. 203 6.4 Practical implication of current study…………………… 206 6.5 Recommendations for WAPDA’s Management………… 210 6.6 Recommendation for future researches…………………. 211 References ……………………………………………… 214-241 Appendices belonging to chapter # 4 (T1) (Regression
Analyses)…………………………………………………. 242-269 Appendices belonging to chapter # 5 (T2) (Regression
Analyses)………………………………………………… 270-296 Appendices belonging to chapter # 4 & 5 (T1 + T2)
(Regression Analyses)…………………………………… 297-344 Appendices belonging to chapter # 4 & 5 (T1 + T2)
(Correlation Analyses)…………………………………… 345-348 Appendices belonging to Questionnaires………………… 349-357

xi
LIST OF TABLES
Serial No. Titles Page No. T1 A1 Linear Regression Analyses of Qualitative Demands Scale (of
Total Demands) on various Predictors of Model and their Interactions 242
T1 A2 Linear Regression Analyses of Employees Demands Scale (of Total Demands) on various Predictors of Model and their Interactions 243
T1 A3 Linear Regression Analyses of Workload Demands Scale (of Total Demands) on various Predictors of Model and their Interactions 244
T1 A4 Linear Regression Analyses of Conflicts Demands Scale (of Total Demands) on various Predictors of Model and their Interactions 245
T1 B1 Linear Regression Analyses of Qualitative Control Scale (of Total Control) on various Predictors of Model and their Interactions 246
T1 B2 Linear Regression Analyses of Employees Control Scale (of Total Control) on various Predictors of Model and their Interactions 247
T1 B3 Linear Regression Analyses of Workload Control Scale (of Total Control) on various Predictors of Model and their Interactions 248
T1 B4 Linear Regression Analyses of Conflicts Control Scale (of Total Control) on various Predictors of Model and their Interactions 249
T1 C1 Linear Regression Analyses of Qualitative Stressors Scale (of Total Stressors) on various Predictors of Model and their Interactions 250
T1 C2 Linear Regression Analyses of Employees Stressors Scale (of Total Stressors) on various Predictors of Model and their Interactions 251
T1 C3 Linear Regression Analyses of Workload Stressors Scale (of Total Stressors) on various Predictors of Model and their Interactions 252
T1 C4 Linear Regression Analyses of Conflicts Stressors Scale (of Total Stressors) on various Predictors of Model and their Interactions 253
T1 D1 Linear Regression Analyses of Sub-Set of Demands Scale on various Predictors of Model and their Interactions with Sub-Set Control and Stressors 254
T1 D2 Hierarchical Regression Analyses of Sub-Set of Total Demands and Total Control Factors on various Predictors of Model and their Interactions 255
T1 D3 Linear Regression Analyses of Job Demands Scales upon a Single Job Factor and Predictor of Model and their Interactions 257
T1 D4 Linear Regression Analyses of Job Control Scales upon a Single Job Factor and Predictor of Model and their interactions 258
T1 D5 Linear Regression Analyses of Job Supervisory Supports Scales upon A Single Job Factor and Predictor of Model and their Interactions 259
T1 D6 Linear Regression Analyses of Job Colleagues Scales upon A Single Job Factor and Predictor of Model and their Interactions 260

xii
LIST OF TABLES (Cont’d)
Serial No. Titles Page No. T1 D7 Linear Regression Analyses of Job Social Supports Scales
upon A Single Job Factor and Predictor of Model and their Interactions 261
T1 D8 Hierarchical Regression Analyses of Job Demands and Job Control Scales upon A Single Job Factor and Predictors of Model and their Interactions 262
T1 D9 Hierarchical Regression Analyses of Job Demands and Job Social Supports Scales upon A Single Job Factor and Predictors of Model and their Interactions 263
T1 D10 Hierarchical Regression Analyses of Job Control and Social Supports Scales upon A Single Job Factor and Predictors of Model and their Interactions 264
T1 D11 Hierarchical Regression Analyses of Job Demands, Job Control and Job Social Supports Scales upon A Single Job Factor and Predictor of Model and their Interactions 265
T1 D12 Linear Regression Analyses of Job Stressors Scales upon A Single Job Factor of Job Strain and Predictor of Model and their Interactions 267
T1 D13 Linear Regression Analyses of Job Strain Scales upon A Single Job Factor and Predictor of Model and their Interactions 268
T1 D14 Hierarchical Regression Analyses of Job Stressors and Job Strain Scales upon A Single Job Factor and Predictor of Model and their Interactions 269
T2 A1 Linear Regression Analyses of Qualitative Demands Scale (of Total Demands) on various Predictors of Model and their Interactions 270
T2 A2 Linear Regression Analyses of Employees Demands Scale (of Total Demands) on various Predictors of Model and their Interactions 271
T2 A3 Linear Regression Analyses of Workload Demands Scale (of Total Demands) on various Predictors of Model and their Interactions 272
T2 A4 Linear Regression Analyses of Conflicts Demands Scale (of Total Demands) on various Predictors of Model and their Interactions 273
T2 B1 Linear Regression Analyses of Qualitative Control Scale (of Total Control) on various Predictors of Model and their Interactions 274
T2 B2 Linear Regression Analyses of Employees Control Scale (of Total Control) on various Predictors of Model and their Interactions 275
T2 B3 Linear Regression Analyses of Workload Control Scale (of Total Control) on various Predictors of Model and their Interactions 276
T2 B4 Linear Regression Analyses of Conflicts Control Scale (of Total Control) on various Predictors of Model and their Interactions 277

xiii
LIST OF TABLES (Cont’d)
Serial No. Titles Page No.
T2 C1 Linear Regression Analyses of Qualitative Stressors Scale (of Total Stressors) on various Predictors of Model and their Interactions 278
T2 C2 Linear Regression Analyses of Employees Stressors Scale (of Total Stressors) on various Predictors of Model and their Interactions 279
T2 C3 Linear Regression Analyses of Workload Stressors Scale (of Total Stressors) on various Predictors of Model and their Interactions 280
T2 C4 Linear Regression Analyses of Conflicts Stressors Scale (of Total Stressors) on various Predictors of Model and their Interactions 281
T2 D1 Linear Regression Analyses of Sub-Set of Demands Scale on various Predictors of Model and their Interactions with Sub-Set Control and Stressors 282
T2 D2 Hierarchical Regression Analyses of Sub-Set of Total Demands and Total Control Factors on various Predictors of Model and their Interactions 283
T2 D3 Linear Regression Analyses of Job Demands Scales upon a Single Job Factor and Predictor of Model and their Interactions 285
T2 D4 Linear Regression Analyses of Job Control Scales upon a Single Job Factor and Predictor of Model and their interactions 286
T2 D5 Linear Regression Analyses of Job Supervisory Supports Scales upon A Single Job Factor and Predictor of Model and their Interactions 287
T2 D6 Linear Regression Analyses of Job Colleagues Scales upon A Single Job Factor and Predictor of Model and their Interactions 288
T2 D7 Linear Regression Analyses of Job Social Supports Scales upon A Single Job Factor and Predictor of Model and their Interactions 289
T2 D8 Hierarchical Regression Analyses of Job Demands and Job Control Scales upon A Single Job Factor and Predictors of Model and their Interactions 290
T2 D9 Hierarchical Regression Analyses of Job Demands and Job Social Supports Scales upon A Single Job Factor and Predictors of Model and their Interactions 291
T2 D10 Hierarchical Regression Analyses of Job Control and Social Supports Scales upon A Single Job Factor and Predictors of Model and their Interactions 292
T2 D11 Hierarchical Regression Analyses of Job Demands, Job Control and Job Social Supports Scales upon A Single Job Factor and Predictor of Model and their Interactions 293
T2 D12 Linear Regression Analyses of Job Stressors Scales upon A Single Job Factor of Job Strain and Predictor of Model and their Interactions 294
T2 D13 Linear Regression Analyses of Job Strain Scales upon A Single Job Factor and Predictor of Model and their Interactions 295

xiv
LIST OF TABLES (Cont’d)
Serial No. Titles Page No.
T2 D14 Hierarchical Regression Analyses of Job Stressors and Job Strain Scales upon A Single Job Factor and Predictor of Model and their Interactions 296
T1 & T2 (A1) Linear Regression Analyses of Qualitative Demands Scale (of Total Demands) on various Predictors of Model and their Interactions 297
T1 & T2 (A2) Linear Regression Analyses of Employees Demands Scale (of Total Demands) on various Predictors of Model and their Interactions 298
T1 & T2 (A3) Linear Regression Analyses of Workload Demands Scale (of Total Demands) on various Predictors of Model and their Interactions 299
T1 & T2 (A4) Linear Regression Analyses of Conflicts Demands Scale (of Total Demands) on various Predictors of Model and their Interactions 300
T1 & T2 (B1) Linear Regression Analyses of Qualitative Control Scale (of Total Control) on various Predictors of Model and their Interactions 301
T1 & T2 (B2) Linear Regression Analyses of Employees Control Scale (of Total Control) on various Predictors of Model and their Interactions 302
T1 & T2 (B3) Linear Regression Analyses of Workload Control Scale (of Total Control) on various Predictors of Model and their Interactions 303
T1 & T2 (B4) Linear Regression Analyses of Conflicts Control Scale (of Total Control) on various Predictors of Model and their Interactions 304
T1 & T2 (C1) Linear Regression Analyses of Qualitative Stressors Scale (of Total Stressors) on various Predictors of Model and their Interactions 305
T1 & T2 (C2) Linear Regression Analyses of Employees Stressors Scale (of Total Stressors) on various Predictors of Model and their Interactions 306
T1 & T2 (C3) Linear Regression Analyses of Workload Stressors Scale (of Total Stressors) on various Predictors of Model and their Interactions 307
T1 & T2 (C4) Linear Regression Analyses of Conflicts Stressors Scale (of Total Stressors) on various Predictors of Model and their Interactions 308
T1 & T2 (D1) Linear Regression Analyses of Sub-Set of Demands Scale on various Predictors of Model and their Interactions with Sub-Set Control and Stressors 309
T1 & T2 (D2) Hierarchical Regression Analyses of Sub-Set of Total Demands and Total Control Factors on various Predictors of Model and their Interactions 310
T1 & T2 (D3) Linear Regression Analyses of Job Demands Scales upon a Single Job Factor and Predictor of Model and their Interactions 312
T1 & T2 (D4) Linear Regression Analyses of Job Control Scales upon a Single Job Factor and Predictor of Model and their interactions 313

xv
LIST OF TABLES (Cont’d)
Serial No. Titles Page No. T1 & T2 (D5) Linear Regression Analyses of Job Supervisory Supports
Scales upon A Single Job Factor and Predictor of Model and their Interactions 314
T1 & T2 (D6) Linear Regression Analyses of Job Colleagues Scales upon A Single Job Factor and Predictor of Model and their Interactions 315
T1 & T2 (D7) Linear Regression Analyses of Job Social Supports Scales upon A Single Job Factor and Predictor of Model and their Interactions 316
T1 & T2 (D8) Hierarchical Regression Analyses of Job Demands and Job Control Scales upon A Single Job Factor and Predictors of Model and their Interactions 317
T1 & T2 (D9) Hierarchical Regression Analyses of Job Demands and Job Social Supports Scales upon A Single Job Factor and Predictors of Model and their Interactions 318
T1 & T2 (D10)
Hierarchical Regression Analyses of Job Control and Social Supports Scales upon A Single Job Factor and Predictors of Model and their Interactions 319
T1 & T2 (D11)
Hierarchical Regression Analyses of Job Demands, Job Control and Job Social Supports Scales upon A Single Job Factor and Predictor of Model and their Interactions 320
T1 & T2 (D12)
Linear Regression Analyses of Job Stressors Scales upon A Single Job Factor of Job Strain and Predictor of Model and their Interactions 322
T1 & T2 (D13)
Linear Regression Analyses of Job Strain Scales upon A Single Job Factor and Predictor of Model and their Interactions 323
T1 & T2 (D14)
Hierarchical Regression Analyses of Job Stressors and Job Strain Scales upon A Single Job Factor and Predictor of Model and their Interactions 324
T1 & T2 (D15)
Linear Regression Analyses of Specific Job Factors Scale (of Total Demands) on various outcomes of Job Strain and their Interactions 325
T1 & T2 (D16)
Linear Regression Analyses of Specific Job Factors Scale (of Total Demands) on various outcomes of Job Strain and their Interactions 326
T1 & T2 (D17)
Linear Regression Analyses of Specific Job Factors Scale (of Total Demands) on various outcomes of Job Strain and their Interactions 327
T1 & T2 (D18)
Linear Regression Analyses of Specific Job Factors Scale (of Total Demands) on various outcomes of Job Strain and their Interactions 328
T1 & T2 (D19)
Linear Regression Analyses of Specific Job Factors Scale (of Total Control) on various outcomes of Job Strain and their Interactions 329
T1 & T2 (D20)
Linear Regression Analyses of Specific Job Factors Scale (of Total Control) on various outcomes of Job Strain and their Interactions 330
T1 & T2 (D21)
Linear Regression Analyses of Specific Job Factors Scale (of Total Control) on various outcomes of Job Strain and their Interactions 331

xvi
LIST OF TABLES (Cont’d)
Serial No. Titles Page No. T1 & T2
(D22) Linear Regression Analyses of Specific Job Factors Scale (of Total Control) on various outcomes of Job Strain and their Interactions 332
T1 & T2 (D23)
Hierarchical Regression Analyses of Job Demands and Job Control Scales upon A Single Job Factor and Predictors of Model and their Interactions 333
T1 & T2 (D24)
Hierarchical Regression Analyses of Job Demands and Job Control Scales upon A Single Job Factor and Predictors of Model and their Interactions 334
T1 & T2 (D25)
Hierarchical Regression Analyses of Job Demands and Job Control Scales upon A Single Job Factor and Predictors of Model and their Interactions 335
T1 & T2 (D26)
Hierarchical Regression Analyses of Job Demands and Job Control Scales upon A Single Job Factor and Predictors of Model and their Interactions 336
T1 & T2 (D27)
Hierarchical Regression Analyses of Specific Job Factor (Qualitative Control) upon Supervisory Support and Predictors of Model and their Interactions 337
T1 & T2 (D28)
Hierarchical Regression Analyses of Specific Job Factor (Employees Control) upon Supervisory Support and Predictors of Model and their Interactions 338
T1 & T2 (D29)
Hierarchical Regression Analyses of Specific Job Factor (Workload Control) upon Supervisory Support and Predictors of Model and their Interactions 339
T1 & T2 (D30)
Hierarchical Regression Analyses of Specific Job Factor (Conflicts Control) upon Supervisory Support and Predictors of Model and their Interactions 340
T1 & T2 (D31)
Hierarchical Regression Analyses of Specific Job Factor (Qualitative Control) upon Colleagues Support and Predictors of Model and their Interactions 341
T1 & T2 (D32)
Hierarchical Regression Analyses of Specific Job Factor (Employees Control) upon Colleagues Support and Predictors of Model and their Interactions 342
T1 & T2 (D33)
Hierarchical Regression Analyses of Specific Job Factor (Workload Control) upon Colleagues Support and Predictors of Model and their Interactions 343
T1 & T2 (D34)
Hierarchical Regression Analyses of Specific Job Factor (Qualitative Control) upon Colleagues Support and Predictors of Model and their Interactions 344
T1 E1 Correlation Matrix (N=402) 345 T2 E2 Correlation Matrix (N=389) 347
T1 & T2 (E3) A Comprehensive Questionnaires 349

xvii
ACKNOWLEDGEMENTS I am really happy to complete successfully to this research process. Because of the qualitative methodological scales, I have been encouraged – and have had the privilege – to get highly involved with the research data. There are a lot of persons who have supported and encouraged me during this time. I would like to thank Doctor Kashif-ur-Rehman, Associate Professor Iqra University Islamabad Campus for supervising and guiding my work throughout the research process. I also like to acknowledge my colleagues Hasan Afsal and Asmat-ullah for collaboration, discussions about methodological issues and relaxing coffee breaks at his office. I am thankful for the valuable efforts of my course work teachers in National University of Modern Languages Islamabad, who have been a privilege to have such experts reading during my research work. I would especially like to express my gratitude to Chief Executive Officer IESCO Ltd, who has permitted me through office letter No. 56896-99/CE/IESCO/TMP dated 8th
November, 2006, to conduct the research work in all offices of this company. I would especially like to thank Administration of WAPDA Staff College H 8/4 Islamabad, who has been there for me throughout this entire process. Thank you for your friendship and co-operation. In preparing this comprehensive research work, I want to give special acknowledgment to Sardar Abdul Majeed, Principal Indus Group of Colleges Rawalpindi-Islamabad and Sajid Manzoor, Assistant Professor, Federal Government College H-9 Islamabad, one of my major thought colleagues who has taught me and developed my ideas to have such desirable objective. Most prominently, I am grateful for the support of my own family, brothers and friends; this dissertation would have not been finished or even started without their encouragement. Your continuous faith in me has carried me through the hard and demanding period. At this time I want to share the joy and excitement with you. I thank the Almighty Allah for all blessings, including this.
Saif-ur-Rehman Khan

1
Chapter No. 1
1.0 INTRODUCTION
1.1-Background of Study Job stress has been documented as one of the most important workplace health hazards
for employees in developed and developing countries (Paul Spector, 2002; Danna &
Griffin, 2002). Cartwright and Cooper (1997) further pointed out that in the short term
stress can lead the employees to stomach disorder, headaches, sleeplessness, emotional
distress and loss of energy/motivation, and in the long term it can give to serious illness
and even early death, most likely due to cardiovascular disease (heart diseases).
Furthermore, job stress creates to be endemic to the current workplace, as American
national surveys have shown that a large number of employees report feeling highly
stressed at work (see Sauter et al., 1999). There are a number of workplace factors,
called job stressors that make jobs stressful and difficult for number of employees in
services as well as manufacturing industries. Additional stressors concern interpersonal
relationships at work, such as conflicts with the behavior of supervisors, conflicts with
colleagues, conflicts with subordinates and conflicts with management policies (Paul
Spector, 2002). Kahn and Byosiere, (1992), Taylor, (1999) and Paul (2002) further
pointed out that there are some other stressors in the organizational context, such as
having insufficient resources to do the job (e.g., defective equipment or inadequate
supplies), or low salaries structure. Research has clearly demonstrated that all of these
job stressors are connected with employees’ health and well-being. As is
characteristically found in various studies, higher levels of stressors (e.g., heavy
workload and uncertainty about supervisors’ expectations) were associated with
physical symptoms, such as headaches, and poor job attitudes.
In spite of the evidence accumulated over forty years of research work, Kasl (1996) has
demonstrated that “nearly all the significant issues surrounding the concept of stress
remain unsettled and/or controversial” (p. 13-14). Several stress theories have been
proposed to developed sense of the diverse research findings (Cooper, 1998). These
theories differ in their views of the major determinants of stress. Some (e.g., Friedman
& Rosenman, 1974; Kobasa, 1979) put emphasis on personal characteristics of human

2
being; others ( Theorell et al., 1998) highlight that stress is the cause of work
environment (e.g., Siegrist, 1996; Edwards, Caplan, & Van Harrison, 1998; Demerouti,
Bakker, & Schaufeli, 2001) and some view stress as a function of an interaction
between person (worker) and environment (workplace). Certainly, the theoretical and
practical background that has most influenced thinking and research about job stress
over the last three decades is the interactive and transactional, framework proposed by
Lazarus and his colleagues (Lazarus, 1966; Lazarus & Folkman, 1984; De Jonge,
Janssen, and Van Breukelen, 1996). As Parkes (1991) described that contradictory
results of the Job Demands Control (JDC) model is that individuals have different styles
of adaptation and perception to the job environment within an organization.
Furthermore, she suggested that locus of control interacts with job demands and job
control to predict job strain. This is the reason that some studies have expanded the JDC
model by including locus of control as an additional variable (Parkes, 1991; Daniels,
and Guppy, 1994).
A comprehensible and understandable idea with empirical study of the approach that
emphasizes work environmental causes of stress is Karasek’s (1979) Job Demands
Control Model of job stress and strain. Karasek stated that stress occurs most often
when job characterized by high levels of demands and low levels of control
(interactions of demands of job and control over job). At the same time he pointed out
and measured the additive effects and interactive effects of two job factors (job
demands and job control) upon worker strain and provided the framework how to
balance the two forces in form of simple model
Therefore, Karasek’s models become fruitful tools to measure job demands, job control
and job stress and to develop a productive job description. Later on, Karasek and
Theorell (1990) extended this model, adding social support as a predictor of strain, and
developed several linkages/pathways between job factors, personality characteristic and
worker strain.
Therefore, the most extensively studied theoretical approaches of job stress is the self-
styled Job- Demands-Control (JDC) model (Karasek, 1979; Karasek, and Theorell,
1990), because Karasek’s ideas have been a fertile source of empirical research work
over the past two and half decades. However, clear and scientific approaches to
empirical support for his hypotheses have been limited. To some extent, less support the

3
model with greater consistency is due to a range of conceptual and methodological
problems associated with Karasek’s ideas. The theory has been criticized extensively
for being oversimplified and unclear (Baker, 1985; Johnson, 1989; Parkes, 1991).
Critics (e.g., de Jonge & Kompier, 1997; Jones, Bright, Searle, & Cooper, 1998;
Kristensen, 1995) have pointed out that the core constructs in Karasek’s work and the
relationships between these constructs are inadequately articulated, and that there is no
possibility to integrated various models into a single framework to clarify the core
concept of his idea.
In spite of these positive and negative arguments the job demands-control model
(Karasek, 1979) has become a dominant model of the relationship between work, strain
and performance (De Jonge & Kompier, 1997). Karasek’s model also indicates that job
control buffers the effects of job demands on job strain and well-being of employees.
To strengthen the job control, this model has been expanded to include social support
(Johnson; 1989, Theorell & Karasek, 1996). In the job demands-control-support model,
social support is predicted to buffer the effects of job demands on strain. Therefore, the
confirmation for buffering effects is consistent for job control (e.g., Fletcher & Jones,
1993) and social support (e.g., Cohen & Wills, 1985).
Some research studies examining three-way interactions among job demands, job
control, and social support have also produced contradictory results (e.g., de Jonge et
al., 1996). To date, empirical tests of the Job Demands-Control-Support (JDCS) models
have neglected the comprehensive role of control and locus of control i.e. personality
variables.
Past researches on JDCS model have identified many antecedents and correlates of
stress, and have confirmed that the experience of stress over prolonged periods of time
is associated with a range of adverse consequences, including physical upsets,
psychological pressure, interpersonal conflicts, performance deficits, absenteeism and
turnover of employees (Kahn & Byosiere, 1992; Travers, 2001). Study of job factors
(job demands, job control, social support at work place) with association of immediate
outcomes (job anxiety, job dissatisfaction, somatic symptoms) and remote outcomes
(mastery scale, job consideration, job participation, job performance, and vigor activity)
of strain gives the workers sound knowledge to understand their own work environment
within assigned job description and enables them to promote the quality of work and to

4
maximize the output of organization. With such significance, it is decided to conduct
this study in one of the largest commercial organization of Pakistan with the clear
identification of problems as given in section 1.2. 1.2-Problems Identification
Agriculture and industry are the life blood of growing economy and backbone of
national economy. Hence, a significant part of Pakistan's economy depends on
agriculture so Water and Power Development Authority (WAPDA) has been a very
important institution. WAPDA is one of the largest commercial organization
performing multifarious tasks to keep the economy of country (Pakistan) on the track
and provides vital energy to fulfill the basic needs of agricultural, manufacturing and
service industrials sector as well as domestic consumers of entire country (Pakistan). It
is the largest commercial organization of Pakistan and has sole authority of power
distribution handling 146625 employees i.e. power wing 134632 employees, water wing
9207 employees and common services wing 2786 employees (source: Manpower
Statistics, 2006-7). WAPDA has three power sources: firstly, hydro- power with
production capacity 6500 MW; secondly, WAPDA's own thermal power generation
with production capacity 5000 MW; and thirdly, Independent Power Producers (IPP)
with production capacity 6000 MW working as private sector. So WAPDA's hydel
energy comes from three major projects which are Mangla, Terbela, and Ghazi Brotha
projects. The power wing, a core area of our study, comprises of 92% of total
manpower of WAPDA, is formed fourteen (14) Corporate Entities as following:
• Four (4) Thermal Power Generation Companies (GENCOs)
• One (1) National Transmission & Power Dispatch Company (NTDC)
• Nine (9) Distribution Companies (DISCOs)
The management of WAPDA is facing three broad areas of problems:
• The shortage of electric power ranging 5 to 7 hours in a day badly affecting the
manufacturing and services industries as well as domestic consumers of Pakistan which
in return contribute a significant amount of stress over the higher and lower
administration of WAPDA;

5
• The power losses “as of today are averaging between 24% and 25% of DISCOs,
particularly the Peshawar Electrical Supply Company PESCO. They have losses in
excess of 30%. This is too high and we naturally saw that it was necessary to undertake
a comprehensive re-structuring program and split WAPDA into smaller companies and
corporatize them” (Official speech Tariq Hamid, Chairman of Wapda, 2007, October
14; Retrieved from http // search. wapda. com). Restructuring program will definite
leads to retrenchment which generates stressors of job insecurity. Therefore, job
demands and job control of employees must be evaluated through empirical study to
improve the work environment and job redesigned.
• There is lack of motivation, loyalty, and satisfaction of employees due to low
salaries, slow promotion policy, managerial policies and low fringe benefits (as
compare to other energy sectors like Oil and Gas Development Company and Atomic
Energy Commission of Pakistan) which strongly predict the significant amount of
stressors.
The re-structuring and other necessary reforms at WAPDA must be designed to boost
efficiency, foster good corporate governance, cut costs, and make these entities truly
commercially viable enterprises. Because the way the country is growing now, power
demand is rising rapidly i.e. 7.55% and WAPDA's average growth during the last
decade was about 4.6% (WAPDA Annual Report 2006-7 p. 92). Today, it has now
jumped to 8%, and these large hydro-power projects take time (Official speech Tariq
Hamid, Chairman of WAPDA, 2007, October 14; Retrieved from http // search. wapda.
com). WAPDA has already electrified by providing energy to more than 15.9 million
customers in all social-economic sectors. The facility has already been extended to
103,253 villages across Pakistan along with all industrial and commercial areas
(excluding Karachi) which will further increase power demands in near future ( Wapda
Annual Report 2006-7; p.69).
In consideration of later two areas of problems in WAPDA, DCS Models formulated
the theory:
1-To find out the root causes and magnitude of intra-organizational stressors;
2-To reduce the level of job strain among employees; and
3-To enhance the control level without reducing job demands to promote the
positive productivity of workers.

6
Furthermore, job demands may be manipulated by re-distributing the workload across
available labor resources, classifying the work role, streamline the work system, and
reconfiguring the work schedule.
1.2.1-Problems statement As discussed earlier, the power wing is the largest part of WAPDA comprises 92% of
total manpower, performing multifarious tasks to satisfy the energy requirements of
commercial sectors as well as domestic needs of entire population of Pakistan. After
preliminary investigation, literature review, and pilot study we conclude the main
internal problems of power wing of WAPDA which contribute the significant amount of
stress:
1. Line losses of electric energy average ranging from 24% to 25% of DISCOs due to
low control over work environment and lack of motivation among employees;
2. Work environment, work control, job description, salaries structure, promotion
policies, routine managerial policies and customers relationships; and
3. No advanced level necessary computer courses have been conducted in WAPDA
Staff College Islamabad and WAPDA Engineering Academy Faisalabad to meet the
requirements of advanced technology and re-engineering the work environment (source:
Standing Operating Procedure, 2005). It is necessary to investigate job demands and job
control of employees to find out the root causes of stressors i.e. which specific demands
and which specific control contribute more to job stress.
Furthermore, most of the WAPDA employees have experience to use old manual
system and equipments to handle the maximum working activities. Therefore, it is
problematic position for higher management to acquire and implement advanced
technology to promote WAPDA at developed tracks. After exploring the above
mentioned problems through interviews, literature review of WAPDA and pilot study
the following problems statement has been developed as:
To investigate the root causes and magnitude of various possible intra-
organizational stressors at workplace and their associations with immediate and
remote outcomes job strain and performance of workers within power wing of
WAPDA. This is possible to test the Karasek’s ideas of Demands-Control-Support
Model which incorporate insights gained from contemporary transactional theories of
stress and construct upon empirical research findings that point out the dynamic

7
interplay between work environments and the workers who inhabit/perceived them in
current environment of WAPDA (Pakistan). 1.3-Rationale of study
Most of the researchers of stress management are of the opinions that Karasek’s models
have some validity and have been a fertile source of research ideas. Therefore, these
models were remained a useful area of current research activity and such models
formulate theory how to utilize man power effectively by (1) clearer conceptualisation
and more valid operationalisations of key variables, (2) more precise specification of
the relationships between these variables and the models in which they are exist, (3)
closer links to contemporary developments in transactional theories of stress and
occupational stress research, (4) increase reliance upon self-report cross-sectional
studies, (5) provide a productive job description and job specification and (6) greater
use of appropriate multivariate statistical techniques to test the validity of models.
Furthermore, a broad set of outcomes including learning, growth of
capacity/regeneration, competence, participation, as well as levels of job activity,
satisfaction, motivation and productivity are promoted the following rationale of study:
Firstly, the focus of study is remained on those points, which are of great significance
and help the researchers in developing the strategies to be applied in best use of
manpower.
Secondly, the greatest sources of employee job stress does not know – not knowing
about stressors taking place in the company and not knowing even if he/she is doing a
good job. Our study communicates clearly in these areas not only reduces employee
stress, but also helps them in understanding the magnitude of stressors.
Thirdly, the findings from this research is of greater importance for the policy makers
involved in stress management as it is based on facts and figures regarding the past
policies of the organizations and at the same time focus on the future strategies for
planning and control.
Fourth, this research study is focused on individual employees in understanding the
factors/stressors that influence whether someone working very hard is feeling stressed
out, or whether they are feeling motivated, excited and committed or free of any
organizational job stress.

8
Fifth, minimizing job stress, through the study of variety of intra- organizational
stressors, giving employees control and power to make job-related decisions, the
flexibility to organize their work in the way they find optimal and the authority to make
improvements on how their job is done effectively.
Sixth, this study enables managers to understand the sources of job stress and make
decisions how to improve the employee morale, performance and managerial policies.
Seventh, supervisors understand how to provide guidance; support and encouragement
by minimizing employee job stress. Managers with poor management skills or little
knowledge of job stressors are a tremendous source of stress and can’t help employees
in dealing with stressful times.
Eighth, the knowledge gap bridged through the above-mentioned findings and also
through recommendations and suggestions to be offered in the end.
Ninth, this study gives the recommendations to organizations if the time and financial
resources you invest in selecting and training workers and managers will pay huge
dividends in reducing employee job stress, increasing productivity and minimizing the
cost of employee’s turnover. 1.4-Objectives of Study This thesis has its main objective to study the possible associations between work
environment, job factors, and job strain and activity participation. The outcome
measures are immediate outcomes of strain (job anxiety, job dissatisfaction, and
psychosomatic complaints), and remote outcomes of strain such as job
performances, job consideration, job participation, mastery and vigor activity.
Below are the main objectives for study I & II of the thesis:
1. To investigate the clear and ideal associations between job factors at
workplace with immediate and remote outcomes of strain.
2. To clarify, test and extend the Karasek’s ideas of Demands-Control-Support Model,
there is need of a more precise, accurate, understandable and ideal model which
incorporate insights gained from contemporary transactional theories of stress and
construct upon empirical research findings that points out the dynamic interplay
between work environments and the workers who inhabit/perceived them in current

9
environment of WAPDA (Pakistan) as reported by Spector, (1994) & Chen, Frese,
(2000).
3. To investigate the root causes and magnitude of various possible stressors at
workplace and their associations with job strain and performance of workers.
4. The study aims at describing and understanding how the job factors change with
work environment are experienced in terms of job strain and performance of employees.
More specifically, it examines which ways of experiencing job factors change with job
environment can be identified in terms of job strain and activity participation (study II). 5. The study also aims is to consider carefully the theoretically rationale for such
models which attempt to integrate the DC Models into a single framework, building on
principles with respect to job demands, job control and various outcomes of strain
(study II). It has a sound theory-building goal: it aims at contributing new theoretical elements and
insights to the scientific discussion of the quality of work environment, well-being and
job strain and the relationship of these to activity participation. Also, the results of this
study are examined within existing theoretical frameworks and the theoretical models
are evaluated in the light of this study. Thus, even though the study is inductive, it also
incorporates some qualitative theory-testing aspects.
The study also aims at contributing new guidelines and models for practitioners and
employees. By describing the quality of work environment and various outcomes of
strain, it aims at assisting for example managers, trainers, human resource professionals,
technological designers, as well as workers themselves, to introduce new technologies
and job descriptions in ways that take into account, increase and promote the outcomes
of manpower. It also has an emancipating goal of providing workers themselves with
the conceptual tools with which they can understand their own work environment
within assigned job description to promote the quality of work and to maximize the
output of organization.
1.5-Theoretical Framework & Research Model of Study Theoretical framework explains the relationship of different job stressors of
organization with job stress and immediate and remote outcomes of strain. The
following models explain a portfolio of strategies, which have been studied so clearly
by different researchers and used by organization during organizational stress

10
management process. Job has never been studied as stressors, stress, and demands-
control-support model.
The primary interest is to study of Karasek’s (1979) and Karasek & Theorell, (1990)
Job Demands - Control - Support Models. Karasek’s job strain results from high
psychological demands and low levels of decision latitude or job control. Work
demands place the individual in a motivated state of stress and, if nothing can be done
about this state because of a lack of job control, the unreleased stress has adverse effects
upon the individual’s health and outcomes.
1.5.1 A General Model At this stage, it is necessary to provide some integration of the job factors that form the
core of current thesis. Kahn and Byosiere (1992) pointed out that beneath the vigorous
dispute over terminology, definitions and scope of job factors, the literature is
characterized by “an underlying agreement on the variables of interest and their
fundamental relationships with job factors” (p. 570). These authors (e.g.Ganster, 1989
Muntaner & O’Campo, 1993; Kristensen, 1995; de Jonge & Kompier, 1997; Jones,
Bright, Searle, & Cooper, 1998; Bradley, 2004) describe several models of stress that
take almost similar approaches to the nature of the stress system.
Time
Figure 1.1 A general model of the antecedents, correlates and consequences of stress
and strain (Bradley, 2004 p11)
These models include a sequence of events that begins with organizational antecedents
to stress and then identifies the stressors they generate at work environment, the
Organizational Antecedents of Stressors
Potential Stressors
Actual Stressors
Outcomes of Stress & strain
Outcomes of Exposure
S
Job Control As moderator
Job Supports
Personal Capabilities
Personality Variables

11
perceptions and appraisals of these stressors, the short- term responses evoked, and the
consequences of long-term exposure to a range of stressors as a job strain.In addition to
these, these models acknowledge the role played by work environmental and personal
factors in moderating the relationships between job demands and outcomes within the
sequence
Figure 1.1 presents a general model of study that is consistent both with those found in
the literature and with the terminology adopted in this current thesis over WAPDA’s
employees. Like other two models this one simplifies the research process, and requires
the addition of feedback loops to represent more accurately the dynamic nature of the
stress research process (Spector, 1995). Potiential and actual work determinants and
consequences of all components within the work environment could also be added in
this model.The linkage/pathways of job factors in this general model may require some
clarification. As previously stated in terminology used, job strain refers to a broad range
of aversive responses to actual stressors, and stress is one (specific, immediate,
affective) type of strain. Job demands are that subset of
potential stressors that relate particularly to the task and psychosocial requirements of
work environment. Job control refers to perceptions of the extent to which one can
influence, change or manage these job demands. It is critical to the processes of
appraisal, and thus to the processes by which potential stressors become actual stressors.
Negative affectivity and mastery (personality variables) are two examples of internal
moderators of several of the relationships job factors depicted in this model, whereas
social support (colleagues + supervisors) is one external moderator of these same
relationships. Karasek and Tores Theorell were constructed two models to develop the
relationship between job factors and outcomes of strain. These two models are as under:
1.5.2 Review of First Model The Job Demands-Control model dates back to the late 1970’s, when Karasek a North
America scholar with a background in industrial sociology (1979), presented a job
strain model according to which mental stress and strain result from the interaction of
job demands and job control. This model predicts that mental strain and job
dissatisfaction are the combination of high job demands with low job control.
Therefore, four types of jobs predicts through this model which might result from
different combinations of job demands and job control: passive jobs (low demands and

12
low job control), low strain jobs (low demands and high job control), high strain jobs
(high job demands and low job control), and active jobs (both high demands and high
job control).
The following model illustrates the core concept of Karasek’s Job Strain Model.
Figure 1.2 Karasek’s Original Model (1979)
The above four diagonals in the figure within one model represent two interactions
situations in which job demands and job control deviate: low-high combination, low-
low combination, and some situations in which they are matched high-high
combination. According to Karasek (1979), the first condition, when job demands are
relatively higher than job control results high strain job, is of primary importance in
conducting research study. Furthermore, passive jobs are dissatisfying job, whilst active
jobs are associated with more satisfaction and reduced depression of employees, even if
they are more challenging (Karasek & Theorell, 1990). Similarly, an active job is
associated with outcomes such as job motivation, job involvement, learning, personal
growth and job innovation (Karasek & Theorell, 1990).
The given model encompasses a succeeding theoretical prediction concerning the
diagonal running from passive to active jobs and stepping down from low strain to high
strain. Therefore, self-styled active jobs, which have high levels of both job demands
and job control, challenge their stakeholders, and give confidence to these individuals to
develop competencies, locus of control, acquire supports and exercise talents that may

13
otherwise remain dormant. Those employees who have these positions find that the
challenges (demands) attached with their jobs are corresponding by equivalent levels of
control, and consequently these employees become more actively involved in a range of
steady growing professionally and individually, and providing quality output to their
organization. On the other hand, those employees who have passive jobs come across
few challenges (job demands) and so become gradually less involved in job and in other
activities of organization. Eventually, Karasek predicted that low levels of job control
have two sets of potential consequences - psychological strain, if demands are high and
passive withdrawal, if demands are low. Karasek tested his model through secondary
analyses of data collected from two samples of male employees. Data analysis included
self-report procedures of job demands (stressors), job control (decision latitude), and
job strain (exhaustion, depression, dissatisfaction, behavioral outcomes, etc.). Job
demands placed depend upon work pace and meeting deadlines, while the job control
(decision latitude) classified into three mechanisms: personal capabilities, personality
variables, and decision latitude at workplace. In this model, Karasek pointed out that job
strain was the outcomes of the combined effect of a relative excess of job demands over
job control. These research findings as a result support Karasek’s hypothesis that the
relationship between job demands and job control contributes to the prediction of level
of job strain.
Karasek’s results have significant role in practical implications of stress management
and development of accurate job description. The additive relationship between these
two job factors (job demands and job control) suggests that maximum reductions in job
strain require reasonable job demands and increasing job control. At the same time it
may also improve productivity levels. On the other hand, if the relationship is
interactive, and demands only increase job strain under conditions of low decision
latitude, this suggests a practicable approach to improving job-related well-being
without sacrificing worker performance (Bradley, 2004). Karasek stated that the
performance of employees (individually and collectively) and the organization as a
whole can be improved by the re-design of jobs description to incorporate greater
worker control (decision latitude, skill discretion, autonomy, etc) with reasonable job
demands. Before healthy criticism, Karasek acknowledged that many of the detailed
processes suggested by his model were yet to be determined and tested. In fact, Karasek

14
invited attention of new researcher on several limitations of his model. Firstly, the
additive or interactive effects of social support at both the group and organizational
levels were not considered. Secondly, the potential stressors of specific types of job
demands and decision latitude were not assessed. Thirdly, the role played by
demographic and personal factors in (locus of control and personality variables) of job
demands were not explored. Finally, he acknowledged that the theory was not
adequately precise to determine the exact mathematical relationship between job
demands and job control. 1.5.3 Review of Second Model The mechanism of social support and participatory work (by superiors, by colleagues
and by subordinates) are more clearly incorporated in the form of a 2 x 2 (control and
support) additive model. This useful extension to the original model builds upon the
work of Johnson (1986; Johnson & Hall, 1988). Karasek and Theorell (1990) pointed
out that social support at workplace be operationalised as an equally weighted
combination of both job demands and job control upon the strain outcomes of
employees. Hence, non-work (family and community) sources of support are excluded
altogether. Support is measured to reduce the level of job strain. Karasek, & Theorell
also argue that support facilitates active learning and productive behaviour because its
role in building a positive sense of identity and improve locus of control. However, the
mathematical interaction between the three factors has not been identified. Furthermore,
Karasek and Theorell presented a more dynamic version of their core model called joint
personality-environment model, which develop the association between two job factors,
demands and control, and the two potential outcomes of these factors, strain and active-
learning, to key personality attributes. They stated that job strain is the outcomes of this
2 x 2 x 2, because these outcomes are mutually reinforcing: over time, strain inhibits
learning, and learning inhibits job strain. As a result, workers in high strain jobs
occurrence an accumulated strain or anxiety, which reduce their active performance in
the work environment and their ability to bring innovation or creativity and vice versa
(Bradley, 2004). The authors further suggested that personality dimensions such as
Rotter’s (1966) locus of control can be incorporated into their model to represent this
idea of personal mastery, and to predict consequent levels of job strain.

15
The extended model of the interaction of job demands, job control and personal
variables is presented in Figure 1.3 below. The two personality attributes (feelings of
mastery and accumulated strain) are hypothesized to be both an outcome of one of the
diagonals and a moderator of job strain. Therefore, work environmental factors
(stressors) are moderate to personality variables, and then these moderated personality
variables effects the outcomes of worker. This extended model does not clearly include
social support, but as the Karasek said that social support and personality variables are
the attribute of job control. In fact, as Kompier (1996) and others have observed, the
Karasek & Theorell were more interested in personality variables as an outcome of
independent variable, in that they proposed ways in which personality can be enhanced
by well-made jobs description. Therefore the addition of these personality variables, all
of Karasek’s models maintain an emphasis upon environmental factors of job strain and
active learning process. Bradley (2004) stated in his research work that the Karasek’s
ideas is upon a recognition that the problems of work are socially structured, and their
solutions must therefore entail “broader social, economic, and political processes” (p.
15), rather than other narrow, individualistic solutions to bring the worker at proper line
of productivity.
Figure1.3 Karasek and Theorell’s (1990) dynamic personality-environment model.

16
Karasek and Theorell’s (1990), presented this model as a participatory stress
prevention/work reorganizations that emphasized worker participation in the process of
improving the workplace. Bradley (2004) stated that Karasek made it clear his
preference for re-designing the work environment, and modifying the extent of worker
exposure to job demands, job control and social support opportunities, rather than
“after-the-fact individual counseling or treatment of troubled employees” (p. 31).
Karasek and Theorell’s (1990) predicted that long exposure of inequality between job
demands, job control, and social support at workplace evident indicating cardiovascular
disease. Bradley (2004) reported that “16 of 22 studies have confirmed a job strain
association (with cardiovascular illness), including 7 of 11 cohort studies, and 2 of 3
cross-sectional studies, 4 of 4 case-control studies, and 3 of 3 studies using coronary
heart disease symptom indicators”. Furthermore, Karasek highlighted the similarities
between his ideas and those of other writers, including Frankenhauser’s work on stress-
related hormonal activity and Bandura’s (1977) notion of self-effectiveness or personal
capabilities. Karasek also pointed out some suggestions to guide future research into his
models i.e. research should involve “simultaneous testing of the dynamic version of the
model, including the active/passive hypothesis” (p. 33-34).
Finally, Karasek (1997) presented a broad vision for job reorganization through his
demands-control-support model, and pointed out clearly that his approach has distinct
advantages to social and economic decision-making and development of important state
policies. According to Karasek, his ideas can useful to reduce job strain, improve
performance, encouraging participation both on and off the job, economic growth and
international competitiveness and overall improving the standard of nation on equality
basis. In particular, Karasek argued that these changes will strengthen the platform for
diversified labor force policies at national and international levels. 1.6 Hypotheses
Study 1& II was a cross-sectional, self-report questionnaire of random samples of 402
and 389 WAPDA (Pakistan) employees. The following hypotheses were tested:
H1. Job demands are positively related to respondent ratings of job stress.
H2. Job control is negatively related to job stress.
H3. The combination of job demands and job control predicts levels of job
stress better than does either main effect alone.

17
H4. The combination of job demands, job control and job social supports
predicts levels of job stress better than does either main effect alone.
H5. Job control and social supports buffer the demands-stress relationship.
H6. Job demands are positively related to strain.
H7. Job control is negatively related to strain
H8. The combination of demands and control predicts levels of strain better
than does either main effect alone.
H9. The combination of job demands, job control and job social supports
predicts levels of strain better than does either main effect alone
H10. Job control and social supports buffer the demands-strain relationship. 1.7 Scope of Study The scope of study is to find out the root causes of stressors, role of control and social
supports in moderating the relationships, and effects on performance of WAPDA
employees provided what may well be the most comprehensive test of Karasek’s ideas
to date. This study has improved the ideas of past researches by using larger and more
appropriate samples, better measures of the job factors, more careful articulation and
investigation of possible relationships between these predictor variables of Karasek’s
demands, control supports model (DCSM).
Furthermore, the current research was to test Karasek’s (1979; Karasek & Theorell,
1990) models of job strain and work performance of employees and to compare the fit
of his models with a range of plausible alternatives and current environment of
WAPDA (Pakistan). The current alternative models tended to be more complex, more
“cognitively-mediated”, and more dynamic than those originally proposed Karasek’s
(1979; Karasek & Theorell, 1990
They extended Karasek’s models in four major ways: first, by adding organizational
variables, especially activity participation, as antecedents to the job factors; second, by
drawing sharper distinctions between different job factor domains; third, by including
measures of job stressfulness as mediators of the relationship between the job factors
and strain; and fourth, by distinguishing immediate and remote outcomes of job stress,
strain and performance. Two cross-sectional studies based on comprehensive self
reported questionnaire, that preceded it, were on the development of multi- item self-
report measures of demands, control and stressors, that were relevant to the

18
occupational context. Respondents were required to rate the demands of their jobs
using neutral descriptors devoid of subjective evaluations or various kind of reactions.
Respondents also rated the extent to which they were able to control these job demands,
and the extent to which they experienced strain as a result. Physiological outcomes of
strain were not measured due their dubious reliability and validity, and their cost-
ineffectiveness in large- scale survey of geographically-dispersed employees of
WAPDA (Pakistan).
The fundamental purpose of study is to test the proposition that Karasek’s concepts of
demands, control and their interaction predict actual stressors and strain. The
independent and additive effects of both general, and several specific, measures of the
job factors were investigated through various statistical techniques. Measures were
taken to find out four outcome variables:
three of these (job stress, anxiety and satisfaction/dissatisfaction) are immediate
outcomes of strain and were expected to be predictable from participants’ job factors
ratings, whereas the next one (somatic complaints/symptoms) is more remote outcomes
of employees that were hypothesized to be less adequately predicted from job
characteristics measures. In case of the immediate strain outcomes, the job factors were
expected to account for only a moderate proportion of the variance in strain, on the
assumption that other factors (personality traits, social support, and other coping
resources) moderate the strength of the stressor-strain relationships.
Negative affectivity scale as developed by Spector et al. (2000) was not statistically
controlled in this study, because the conceptual and measurement overlap between these
traits and strain would have resulted in the removal of considerable amounts of true
variance as outcomes.
Karasek (1997) offered a broad policy for work (re-) engineering based upon the
demands-control-support model, and argued that this approach provided foundation to
social and economic decision-making has distinct advantages for managerial
development and welfare state policies. Therefore, this study can help in improving the
quality of (low status) work, and reduce the problems of “illnesses and disabilities, job
insecurity, marginalization, inadequate skills, poor skill use opportunities and
managerial skills. Improving work quality, distributing work and its benefits more
equitably, development of job description, enhancing skill of employees, and

19
encouraging participation both on and off the job, productivity, economic growth and
international competitiveness will be bolstered to a great extent. Particularly, Karasek
stated clearly that these internal as well as external changes will strengthen the platform
for civil democracy as citizens become more equal, more active, more competent, and
more productive. 1.8 Definition of Terms 1.8.1 The concept of stress According to Kahn and Byosiere (1992), the term “stress” derives from a Latin word
meaning to injure, molest or constrain. In modern times, the term has acquired multiple
meanings and usages (Kahn & Byosiere, 1992; Cooper et al., 2001). The concept of
stress is almost associated with job/workplace (Hallberg, & Goldfarb, 1996), has been
defined as "... bodily or mental tension resulting from factors that tend to alter an
existent equilibrium" of worker (Merriam Webster's Collegiate Dictionary, 1995). As
the evidence accumulated over the last fifty years, stress is a tool to increase work
productivity, by altering of a person's psychological state (Seyle, 1975). By increasing
an individual's level of stimulation it is possible to increase work productivity, thus
maximizing efficiency of both the individual and the employees. However, increasing
stress beyond the individual's ability to cope causes, the experience of distress, and
consequently, a decrease in performance (Seyle, 1975).
Distress, which has been conceptualized as the overload of stressful events or
stimuli, is "pain or suffering disturbing the body, a bodily part, or the mentality"
(Merriam Webster's Collegiate Dictionary, 1995). Distress can be viewed as the
overcapacity of a person's capabilities to handle his/her current stress level. The
experience of distress has been associated to job dissatisfaction and perceptions of
limited social support (Kaplan, 1990). Furthermore, the occurrence of distress has been
connected to lower productivity and poor work performance (Seyle, 1975). Lazarus and
Folkman (1984), characterize stress as “a particular relationship between the person and
the environment that is appraised by the person as demanding or exceeding his or her
resources and endangering his or her well-being”. The importance in these definitions is
upon the subjective, cognitively- mediated nature of stress and strain. An advance set of
definitions proposes that stress is a state of the organism. Karasek (1979; Karasek,
Triantis, & Chaudhry, 1982), defines stress as a motivational state, a state of “potential

20
energy” within the individual organism that may be either released into action, or, if not
so released, “may lead to adverse psychological consequences” (Karasek et al., 1982).
In this thesis, a definition of stress refers to unpleasant emotional responses. Stress is a
specific psychological reaction, rather than a non-specific physiological reply (Selye,
1956). Stress is similar to anxiety, although compared to anxiety; stress is more likely to
have current environmental stressors (Pearlin & Schooler, 1978). This explanation is
adopted by a number of authorities (e.g. Parker & DeCotiis, 1993; King, Stanley, &
Burrows, 1987; Kyriacou, 1987; Kyriacou & Sutcliffe, 1979).
Unlike to the views of researcher within the transactional tradition, stress is not defined
as a person-environment relationship in a broader sense. Even as such a relational
definition has understandable appeal in developing a broad and systemic approach to
the study of stress, the use of a narrower definition does not rule out such a wider
empirical approach (Bradley, 2004). In fact, the theoretical foundation of our thesis is
closely aligned with the transactional viewpoint, particularly its emphasis on the job
incumbents’ dealings with potential stressors, and the dynamic interactions that take
place between employees and their work environments. Consequently, the current
definitions and within the broader transactional perspective alike, stress results from one
perception that may not be able to deal effectively or ineffectively with major
demands, opportunity or constraint on work place. Job stressors arise from a perception
of high (environmental) demands and low (perceived) control (Karasek, 1979; Bradley,
2004).
On the other hand, transactional construct of stress require the assessment of a range of
relationships between work environment, cognitive appraisal, emotional, and social and
trait factors. Kasl (1996) pointed out that treating stress as a interactional term
“represents an unwise departure from the scientific strategy that even complex
processes are best studied as interplays of ‘simple’ (one-dimensional) variables;
creating complex study variables is likely to represent premature closure on a problem
and will make it difficult isolate crucial processes...” (p. 18-19) 1.8.2 Stress and its related constructs
The constructs of stress is distinguished from the associated term, strain and burnout,
and such terms as “job strain” (Spector & O’Connell, 1994), “mental strain” (e.g.,
Karasek, 1979 & 1990), and “psychological strain” (Newton & Keenan, 1990). Job

21
strain refers to the universal set of interdependent factors that arise continuously over
long time period from the same adverse circumstances on work place that cause stress.
The factors of strain assessed in past research over the period of fifty years, fall into
three categories: emotional/psychological (e.g., tension, frustration, anger, hostility,
anxiety, job dissatisfaction, reductions in morale and general well-being, burnout,
emotional exhaustion, disturbed cognitive functioning and lack of motivation),
behavioral (e.g., absenteeism, sleep disturbances, smoking, alcohol consumption,
medication consumption, other substance abuse, reductions in work performance,
accidents, medical visits, and turnover), and somatic symptoms (e.g., immune
functioning, cardiovascular functions, illness symptoms, physical health risk factors,
and physical exhaustion)(Bradley, 2004).
These symptoms of job strain are exceedingly inter-connected, even if the exact
relationships between them are still debatable (Fogarty, Machin, Albion, Sutherland et.
al., 1999. Thus, stress at workplace may causally lead such reactions of workers as
concentration lapses, somatic symptoms, and absenteeism due to psychological and
physical problems. A huge amount of literature exists linking stress and strain with
physical diseases (e.g., respiratory, cardiovascular diseases), psychological factors (e.g.,
depression, life dissatisfaction), interpersonal conflicts (e.g., marital dissolution, job
resignation), job contribution (e.g., lack of commitment, early retirement), and
organizational effectiveness (e.g., profitability, high compensation claims) (see, Cohen
& Williamson, 1991; Kahn & Byosiere, 1992; Cooper et al., 2001). These long-term
consequences of stress have been investigated to a greater extent in the current research
thesis on JDCS model.
1.8.3 Antecedents of job Stress and Strain Empirical researches pointed out that job stress and strain are the cognitively-mediated
affective response of individuals. Therefore, the source of this unpleasant appraisal state
can be found in interactions between person and environment. Most authorities (Nelson
& Sutton, 1985), place the intervening causal priority upon environmental factors ( e.g.,
Gerhart, 1987; Karasek, 1979). The term stressors thus refers to the environmental
stimulus (things, events or circumstances/objects), rather than the personal
characteristic, that produces stress and/or other types of strain (Bradley, 2004). Buunk
et al.,(1998) and Cooper et al., (2001) have stated that some stressors relate to the

22
environment in which workers live and work, some of them(stressors) to the roles or
everyday jobs they perform, some relating to the life events that occur - either major
catastrophes or “daily conflicts - and still others to the relationships and
interactions(vertical or horizontal) that employees have with one another. Accumulated
evidences over the job stressors include physical, psychological and biological hazards;,
under/overload; dissatisfying social relationships; role conflict, role ambiguity, system
unreliability and inefficiency; inadequate recognition, effort reward imbalance,
promotional prospects; and job insecurity.
Other critical approaches pointed out that relationship between work stressors and strain
outcomes is mediated by appraisals of the workers and their own resources, needs and
values. As individuals differ greatly in their appraisal/perception and coping processes,
and in their resources, needs and values, there are wide individual differences in what
qualifies as a stressor(Bradley, 2004).There is no specific list of stressors, and no
authentic classificatory system or weighting method is universally applicable (Buunk et
al., 1998; Kahn & Byosiere, 1992). Therefore, it is important to make difference
between potential and actual stressors (Schuler, 1980). The former denotes those causes
of threats/risks that result in harm to particular individuals whereas the later denotes
possible outcomes of harm to which all stakeholders are exposed. Potential stressors
become actual stressors when three conditions are met, firstly how an individual
appraises the expected situation for damage, harm or loss, secondly an individual
perceives insecurity/uncertainty as to how the situation will be resolved, and lastly,
attaches importance to the outcomes. So the presence of potential stressors do not
necessarily involve that the individual will actually experience stress (Dewe et al.,
1993). In some research studies, stressors are treated as independent variables.
However, as Kahn and Byosiere (1992) stated, it is “important to regard these specific
stressors as dependent variables, that is to ask, what antecedent properties of the
organizational environment, technology, structure, or policy have the consequences of
creating stressors at the level of specific jobs”. Most of the researchers noted that the
antecedents of job stressors are originate in an organization’s internal culture, size or
shape of workplace, size or shape or climate of premises, managerial policies, division
of labour, communications systems, and external interfaces (Parker & DeCotiis, 1983;
Kahn & Byosiere, 1992). Other researchers (Parker & DeCotiis, 1983; Milstein,

23
Golaszewski & Suny, 1985; Karasek & Theorell, 1990) have stated that interventions
aimed at stress deterrence should target these organizational antecedents of stressors to
improve overall efficiency. The current research emphasizes on several of these
antecedent factors, and focuses predominantly on JDCS model, variables that have the
potential impact significantly upon exposure to stressors (Schuler, 1980). A personality
construct is closely connected to locus of control and mastery, or self- mastery. Pearlin
and Schooler (1978) has noted the mastery as “the extent to which one regards one’s
life chances as being under one’s own control in contrast to being fatalistically ruled”.
Personality attributes that potentially moderate the stressor-stress relationship may be
divided into three categories: demographic (including gender, age, education,
occupation, work experience, socio-economic status), physical and psychological states
(including arousal levels, physical health and fitness, social needs, and values), and
more stable personality traits (including locus of control, Type A Behavior Pattern,
hardiness, self-esteem, extraversion, neuroticism ).
Past researches have clearly marked that two personality variables (negative affectivity
and locus of control) have particularly profound influences upon stress appraisal
processes and its outcomes (Bradley, 2004). Negative affectivity refers to an enduring
tendency to experience considerable levels of distress and dissatisfaction at all times
and in any situation at work, still in the absence of obvious stressors (Watson &
Pennebaker, 1989). According to Watson and Pennebaker (1989), negative affectivity
workers more often report physical symptoms, even in the absence of objective
indicators of ill health. Past researches have exposed that negative affectivity is
correlated with such factors as perceptions of stressors, ways of coping, satisfaction
with social supports, and psychological well-being (McCrae, 1990). 1.8.4 Description of Demands-Control-Support Model The JDCS model (Karasek & Theorell, 1990) is a multidimensional model that
examines the inter-relationship between person and environment at workplace. The
JDCS model utilizes three dimensions or constructs that focus on explaining the
development of stress for the individual at workplace. The appraisal process, locus of
control, and overall environmental structure are the core figure of this model. The three
factors or variables, also collectively referred to as the model for the psychosocial work
environment, are: (a) job demands (b) job control, and (c) support (Karasek & Theorell,

24
1990). Some discussion of following key terms, leading to a JDCS model to be used in
this thesis, is essential. This discussion also serves to specify the scope of the model.
1.8.5 Job Demands and Job Stress The core concept of job demands gained importance in the work stress literature during
the 1970s (Caplan, et al., 1975; Karasek, 1979; Payne, 1979). Karasek, notified job
demands as a division of all potential work stressors, particularly “psychological
stressors involved in accomplishing the work load, stressors related to unexpected tasks
and stressors of job-related personal conflict”. Furthermore, job demands refer to the
amount of workload or responsibilities or perquisites placed on an individual to work
under these. The authors of stress management (Frain, Michael et al., 2004) focus only
on those tasks assigned to individuals within a work setting, not the demands
individuals place on themselves. The job demands placed on individuals have long been
thought of as one of the main reasons for the movement of distress (Karasek &
Theorell, 1990). As demands increase beyond the control limit, stress also increases. If
the level of stress increases beyond an individual's ability to cope, the person will likely
build up strain. Similarly, having too little work demands can also develop distress,
reliance on an individual's need for motivation and responsibility. Sometime, too few
job demands lead to boredom, which in turn can lead the worker to feel overqualified or
under-appreciated or disinterested in their current job (Karasek & Theorell., 1990).
Karasek (1997) pointed out that “the demands of modern workplaces such as the
intensity of output per hour, time pressure, concentration, and social pressures”. As a
result, Karasek’s core conceptualization is closely related to workplace i.e. time per unit
or speed of work, and his operationalisation is heavily weighted towards quantitative
work (over)load. Later on similar concepts of job demands are given by Barnett and
Brennan, (1995), Parkes (1996), Payne (1979), and Demerouti et al. (2001). In
consideration of past definitions and empirical studies, demands are defined here as a
subset of all potential work stressors, predominantly those relating to the volume, pace,
complexity, method and/or context of one's work and environment. Furthermore,
demands include all general and specific events that occur at workplace, as well as the
psychosocial conditions of this job, both as at present experienced and as accumulated
over past time periods. Some potential and actual stressors that fall outside this scope
are efforts – rewards balance, adequate recognition and promotional policies, as well as

25
physical stressors and hazards encountered at workplace. Later on most of the stress
researchers helped to refine the job demands by extending the boundries of stressors.
O’Campo, Warg, and Ohlson (1996) pointed out that, when research is conducted in
human services organizations, possible difference can be made between workload
demands, psychological demands, role ambiguity demands and role conflicts demands.
Dwyer and Ganster (1991) made difference between psychological demands of job
(e.g., vigilance and precision requirements) and physical demands of job (e.g., muscular
exertion, exposure to job hazards), in the areas of manufacturing organizations. Jackson,
and Davids (1993) further classify as monitoring demands, problem-solving demands,
and production responsibilities of workers. Hence, the multiplicity and complexities of
demands faced by WAPDA (Pakistan) employees are explored in the current research
study.
1.8.6 Job Demands and Employees The job demands that can place on an individual can overpower the psychological
defenses of the employees (Turner & McLean, 1989). The coping process or locus of
control over demands can cover the strain (Matheson, 1988), or moderate to the strength
of stress that the person have to overcome (Feuerstein, Carosella, Burrell, Marshall, &
DeCaro, 1997). Management may construct a standard scale of measurement in
consideration of an individual's current job demands and obtaining an understanding of
what type of demands the employee is looking for at a workplace, may help the human
resource department guide the individual toward matching occupations and developing
accurate job description.
1.8.7 Job Control and Stress Basically, job control refers to the extent to which an individual has a capability to
exercise authority over one or all potential and actual stressors of job. Job control and
how individual or group of workers are completing are another factors closely
associated to the development of stress (Kompier & Levi, 1993). The concept of job
control equates with autonomy or independence (Beehr, 1995), empowers an individual
to exercise control what events to perform first and what to next and how to proceed in
completing them within specific time period. These factors mostly depending upon a
person's work objectives, locus of control and self-esteem (Steil & Hay, 1997;
Koslowsky, 1998; Cox, 1988), Therefore, an individual who perceive that he/she has

26
insufficient control on his work environment may feel high level of stress. Conversely,
an individual who perceives considerable amount of control over one or all events of
job may not experience of stress (Karasek & Theorell, 1990). Perceptions of employee
in exercising control over job and whether those perceptions meet the employee
requirements of job for a certain degrees of autonomy has an immediate affect(increase
or decrease) on the level of stress (Lazarus, 1999). But the perception of amount of
control differs greatly with individual objectives, expectations, personal status that
becomes viewed as significant stressful factors (Gruen et al., 1988). When these major
stressful events or factors are beyond an individual's coping ability, thus resulting in a
loss in performance and the experience of stress. The comprehensive construct of
control process in psychology literature vary on a number of dimensions: retrospective
(past) versus prospective (future), stable versus unstable, objective (actual) versus
subjective (perceived), internal (personal) versus external (situational), individual
versus collective, broad versus narrow and so on (Skinner, 1996). Objective control
refers variety of forms such as autonomous work groups, participative management
styles and flexible work schedules (Pearson, 1992). However, the presence of objective
control does not have assurance that the individuals involved will feel job factors are in
control. Because accumulated evidences of most of the stress researchers that perceived
control is a more powerful indicator of human responses than that of objective control
(Averill, 1973; Skinner, 1996). Consequently, it has been stated, objectively losing or
gaining control will only have psychological impact if the person recognizes the loss or
gain (Langer, 1996) Most of the stress researchers pointed out the difference between
objective control which workers may have, or lack, control. Ganster (1989), for
example, categorized the control process within job description, as control over (a)
work tasks, (b) work pacing, (c) work scheduling, (d) the physical environment, (e)
decision making, (f) social interactions, and (g) freedom of work. Likewise, objective
control is divided into four domains of control, namely, control over tasks, decisions,
environment and resources (McLaney and Hurrell, 1988; and Carayon and Zijlstra,
1999). This classification of domains in which control may be exercised is critical to the
approach adopted in the current research study.

27
1.8.8 Job Control and Employees
The helplessness can also cause a loss in the sense of control an individual has over
his/her job (Ericksson & Carlsson, 1991). Considering the control issues at workplace
can complex to the feelings of loss of control in one's life, ultimately leading to
lowering a person's sense of control and self-concept. As a result, gathering information
from persons with disabilities as to the level of autonomy or control they require in
work settings can facilitate the replacement or redesign of job description. For example,
for individual who wish to have a high level of control of their work environment,
placement in a vocational setting in which there is very little control may create
adjustments difficulties for the individual. Similarly, even if positions are available that
allow for more autonomy or control than others, such as those that allow a person to
work from home, the concern with the amount of support these positions afford may
create difficulties as well (Rodnguez et al., 2001, p. 97)
1.8.9 Job Support and Stress
Job support, the last measurement of the Karasek’s (1979) model, looks at the level and
nature of backing given by the management or the supervisors or colleagues or
subordinates to the employee. Job support and job control are, "almost inseparable
strategies (Karasek & Theorell, 1990)," in that changes in level of both, are almost
always accompanied by inverse affects on stress or strain. On the workplace, perceived
support by an individual can often leads to increase or decrease the development of job
stress (Lawrence et. al., 1998). Those employees who feel support by their supervisors
in respect of valued and important given to them, have increased self-concept, and
develop an internal perception of being part of a larger group (Storey & Certo, 1996).
On the other hand, an individual who feels a lack of support from stakeholders and
associates often perceived less valued or importance, may have lower levels of
performance than those individuals who feel more supported (Karasek & Theorell,
1990). Unfortunately, as the level of support increases, the amount of control a person
has usually increases, generating concerns of whether the individual's current position
provided him or her with enough autonomy at workplace (Rodnguez et al., 2001, p. 97).
Considering employment opportunities for trade-offs between various dimensions and

28
finding the position that best matches the individual's needs is essential for developing a
accurate job description (Karasek & Theorell, 1990).
1.8.10 Job Support and the Employees
An idea, as stated, "It's lonely at the top," reflects the support issues inherent in some
occupations that are required high level of control (Rodnguez et al., 2001, p. 97).
Support is a mechanism that provides ground in facilitating open communication in any
work setting (Koslowsky, 1998), is particularly significant to persons with disabilities,
who are responsible for their accommodation needs. Lack of support at workplace may
reduce a person's ability or desire to express those accommodation needs, especially if
the supervisor is not being very supportive (Bahniuk, Dobos, & Hill, 1990).
1.9 Brief Introduction of WAPDA (Pakistan)
The Water & Power Development Authority (WAPDA) was established through a
parliamentary enactment in February 1958 for integrated and rapid development and
maintenance of water and power resources of the country. As per the charter, amended
in March, 1959 to transfer the existing electricity department from federating units to it,
WAPDA has assigned the duties of investigation, planning and execution of projects
and schemes for:
• Generation, transmission and distribution of power,
• Irrigation, water supply and drainage,
• Prevention of water logging and reclamation of saline land,
• Food control, and
• Inland navigation.
WAPDA is functioning as autonomous body headed by Chairman and three Members
& Managing Directors of three different authorities which are as under:

29
1.9.1 Organization Chart
Chairman
Member (Water) Member (Power) Member (Finance) G.M. (NDP/Central) G.M. (WPPO) G.M. (M & S) G.M. (C & M) G.M. (HV & SC) G.M. (CCC) G.M. (GBHP/Tarbela) Chief Executive of 9 DISCOs D.G. Finance (B & C) G.M. (Finance) G.M. (Customer Services) Director Public Relations G.M. (Planning & Design) G.M. (Finance) G.M. (Hydro Planning) Chief Executive (NTDC) G.M. (Technical Services) G.M. (GSC) G.M. (South Water) G.M. (GSO) G.M. (North Water) G.M. (Thermal) G.M. (Northern Areas) G.M. (Hydel) G.M. (Monitoring) C.E. (Telecommunication) D.G. (Information System) C.E. (Admin) Figure 1.4; Hierarchical Management of WAPDA from: WAPDA Annual Report 2005-06, WAPDA House Lahore- Pakistan
1.9.2 Water Wing Authority WAPDA water administration controls the following organizations:
Indus Basin Settlement Plan (Mangla Dam, Chashma Barrage, Tarbela Dam)
Ghazi Brotha Hydro Power Project
Technical Services
Planning and Design
National Drainage Program (NDP)
Water (North)
Water (South)
Water (Northern Areas)

30
Summary of Manpower of Water Wing
Sanctioned Working Vacant Category
June 2006 June 2005 June 2006 June 2006 June 2006 June 2005
Officers 1408 1394 1182 1171 226 223
Staff 8767 8817 7943 8036 824 781
Total 10175 10211 9125 9207 1050 1004
Source: Manpower Statistics Ready Reckoner, 2005-6 1.9.3 Power Wing Authority Member (Power), heading the wing, supervises the functions of Chief Executive,
National Transmission and Dispatch Company (NTDC), 12 General Managers, Director
Generals and Chief Engineers. Each of Planning, Finance, Grid System Operation
(GSO), Grid System Construction (GSC), Thermal Operation, Hydro-Electric Power,
Coordination and WAPDA power privatization organization departments are headed by
General Managers. A Director General heads the Customer Services and Chief
Engineer, Power Operation Department.
Each of eight corporate distribution companies is headed by a Chief Executive who has
a host of technical and non-technical, skilled and un-skilled paraphernalia under him.
The total installed hydro electric power capacity of WAPDA system from 14 stations is
6463.16 MW. These power stations (Tarbela, Ghazi Barotha, Mangla, Warsak I & II,
Chashma, and Nine small Hydro Stations) produced 30374.335 million units (MkWhs)
of electrical energy during the year 2005-06. The Thermal Power Stations operating
under the WAPDA generation companies, having 4779 MW installed capacity and 3932
MW rated capacity, produced 22.507 million kWh of the energy during the report year.
The WAPDA Thermal Power Generation facilities have been re-structured in to limited
companies, called GENCOs, as per the Government of Pakistan policy. These
companies are Jamshoro Power Company (GENCO I), Central Power Generation
Company (GENCO II), Northern Power Generation Company (GENCO III) and Lakhra
Power Generation Company (GENCO IV) under the Companies Ordinance 1984.
Installed capacity of GENCOs is 4779 MW, with present capacity of 3932 MW.
Installed capacity of GENCO I, II, III & IV is 1024, 1690, 1915 & 150 MW and present
capacity is 830, 1357, 1710 & 35 MW respectively.

31
WAPDA is supplying electricity to over 15.90 million consumers in industrial,
agricultural, commercial and domestic sectors to the entire country except Karachi
through 9 distribution companies (DISCOs). The LESCO, GEPCO, FESCO, IECSO &
MEPCO companies covering the province of Punjab and PESCO/TESCO, HESCO &
QESCO companies are operating in NWFP, Sind and Balochistan Province
respectively. In FY 2005-06, WAPDA sold about 62405 million units of electricity. The
pattern of consumption in the domestic sector figured 43% of the total electric energy
available. Consumption in Industrial, Agriculture, Commercial and other sectors
including KESC & IPPs stood at 27%, 13%, 6% and 11% respectively.
Summary of Manpower of Power Wing
Sanctioned Working Vacant Category
June 2006 June 2005 June 2006 June 2006 June 2006 June 2005
Officers 5568 5488 4971 4849 597 639
Staff 153835 154769 130816 129783 23019 24986
Total 159403 160257 135787 134632 23616 25625
Source: Manpower Statistics Ready Reckoner, 2005-6
1.9.4 Finance Wing Authority Member (Finance) has under him the department of finance, Internal Audit and
Budgeting and Accounts headed by General Manager (Internal Audit) and Director
General Finance. He also exercises administrative control over chief engineer, Director
General (Taxes), Secretary WAPDA and Director Public Relations.
Summary of Manpower of Finance Wing
& Others
Sanctioned Working Vacant Category
June 2006 June 2005 June 2006 June 2006 June 2006 June 2005
Officers 366 360 331 329 35 31
Staff 2964 2654 2742 2457 222 197
Total 3330 3014 3073 2786 257 228
Source: Manpower Statistics Ready Reckoner, 2005-6

32
Chapter # 2
2.0 LITERATURE REVIEW
2.1 Model Description The Job Demand-Control (JDC) Model was introduced by the sociologist Karasek
(1979), who drew upon two research way of life, namely the occupational stress
directions (e.g., Caplan, Cobb, French, van Harrison, & Pineau, 1976; Kahn, 1981) and
the job redesign convention (e.g., Hackman & Oldham, 1980). In both research studies,
attempts were made to relate psychosocial job characteristics to employee health. The
occupational stress tradition focused on “stressors” at work, such as high workload,
work pace, role conflict, and role ambiguity (e.g., French & Kahn, 1962). The job
redesign tradition focused mainly on job control, as it’s primarily aim was to inform the
(re)design of jobs in order to increase the effectiveness, motivation, satisfaction, and
performance at workplace. According to Karasek (1979), the relations between job
demands placed on the discretion available to the employee to decide how to meet these
demands (i.e., job control) contributes importantly to the prediction of strain and active
learning.
In this model, psychological job demands refer to a task’s mental workload and the
mental alertness or arousal needed to carry job under the given circumstances (Karasek
& Theorell, 1990). Job control or decision latitude is a compound of the employee’s
autonomy to make decisions on the job (decision authority) and the extent of skills used
by the employee on the job (skill discretion: Karasek, 1989). Theoretically, in the JDC
model an interaction effect has been described as a joint effect of job demands and
decision latitude (Karasek, 1989). Two perspectives, also known as the “strain” and
“buffer” theory (van der Doef & Maes, 1998, 1999), can be distinguished. According to
the first perspective, the most adverse health effects are expected in a high demands –
low control work situation. The second perspective proclaims that (high) control can act
as a buffer and thus minimize the potentially negative impact of high demands on
employee’s performance. While these perspectives are not mutually exclusive, they

33
have different statistical implications. But the first perspective implies that the nature of
the interaction is additive, the second perspective assumes an interaction over and
above the main effects. Originally, Karasek (1979) found an interactive effect between
job demand and job control. However, a decade later Karasek (1989) stated that: “for
the Demand-Control Model, the existence of a multiplications interaction term is not
the primary issue” (p. 143). Opinions differ on this matter, as can be seen in the
diversity of operationalizations of demand-control interactions in empirical research
(e.g., Landsbergis & Theorell, 2000).
Figure 2.1 offers a graphical representation of the DC Model. The various combinations
of high and low levels of demands and decision latitude result in four types of work
situations: (1) high strain, (2) low strain, (3) active, and (4) passive jobs.
Figure 2.1 Karasek’s Original Model (1979)
The model has two hypotheses, represented by the strain area (A) and the active
learning area (B). The first (strain) hypothesis maintains that a combination of high job
demands and low decision latitude leads to job strain (such as exhaustion and health
complaints), represented in Figure 2.1. High demands initiate a state of arousal, evident
in for instance increased heart rate and adrenaline levels. If there is at the same time an
environmental constraint (i.e., low decision latitude), the arousal cannot be converted
into an effective coping response. Therefore, the stimulation is transformed into
damaging, unused residual strain (Karasek & Theorell, 1990). Conversely, low

34
demands and high decision latitude, is represented in Figure 2.1. In this state, Karasek
and Theorell (1990) have predicted lower than average levels of residual psychological
strain and lower risk of illness, because decision latitude allows the individual to
respond to each challenge optimally, and because there are relatively few challenges to
face at workplace. The active learning theory predicts that a combination of both high
job demands and high decision latitude will increase work motivation, performance,
learning, and personal growth. Therefore, such situations are intensively demanding,
employees feel a large measure of control, and are able to use all available skills,
enabling a conversion of aroused energy into action through effective problem solving
technique. On the other hand, low job demands and low decision latitude, a gradual
atrophying of skills and abilities may occur. This situation is similar to “learned
helplessness” ( Seligman, 1992, see Karasek & Theorell, 1990). In other words, the
strain area (A) and the active learning area (B) yield a model that unites the mechanistic
stress tradition with the insights of social learning theory (Landsbergis, 1988). Several
types of outcomes may result from the situations represented by the two diagonals, for
example exhaustion, and psychosomatic complaints in the case of the strain area, and
work motivation, learning, and job satisfaction in the case of the active learning area of
above diagram (de Jonge, 1995).
Job demands and decision latitude are usually measured by means of two methods,
namely attribution of job characteristics/descriptions and self-report questionnaires. In
the attribution method, a score on job demands and decision latitude is assigned to
employees on the basis of their job name or number of work. Normally, these (average)
scores for particular job name are derived from large national studies (Karasek &
Theorell, 1990).
The original questionnaire used to operationalize the JDC model is the Job Content
Questionnaire (JCQ) (Karasek, 1985). The core questions in the JCQ were taken from
the research studies of Bradley, (2004) which were administered to three
comprehensive representative samples to find out the work load job strain of
employees. The JCQ has been widely used in North America, Europe, and Japan
(Landsbergis & Theorell, 2000). In reaction to criticism regarding the simplicity of the
JDC model, the model was extended to include several job characteristics, for instance
job insecurity, physical exertion, hazardous exposure, and social support (Karasek &

35
Theorell, 1990). The most well-known of these variables is workplace social support,
yielding the Job Demand-Control-Support (JDCS) model (Johnson & Hall, 1988). The
JDCS model distinguishes collective and isolated work conditions, such that eight work
situations can be defined, namely the four work situations identified in the DC model
(see Figure 2.1) in combination with high support, and these four work situations in
combination with social support. The most adverse health effects were predicted for a
work situation with high demands, low decision latitude, and low social support, also
termed iso-strain (Johnson & Hall, 1988).
2.1.1 Concept of Active Jobs in DC Model The first prediction in the model is that active jobs, with high job control and high
psychological job demands, also have a high degree of learning and growth, which are
helpful to high performance. Active jobs are found in the upper right-hand corner of the
figure, and although these jobs are high in demands but they don’t cause negative
psychological strain (Karasek & Theorell 1990).
Active jobs situations are intensely demanding, and engage activities in which the
worker’s feels a large measure of control. Together with a high level of control, the
workers have the freedom to use all available capabilities. Karasek and Theorell
describe these kind of jobs active jobs because research in both Swedish and American
populations has shown this group of workers, in spite of heavy work demands, to be the
most active in leisure and popular activity outside of work (Karasek & Theorell 1990).
Karasek and Theorell argue that these jobs result in positive psychological outcomes
such as learning and growth, which both are favorable to high performance. The force
aroused by the active job is translated into action through, for instance, effective
problem-solving. When the workers have the freedom to decide the most effective
course of action in response to stressors, they can test the efficiency of the chosen
course of action, and then reinforce it if they have worked or modify it if they have
failed (Karasek & Theorell 1990: p.36).
2.1.2 Concept of Passive Jobs in DC Model The downward reverse portion in the figure represents situations which are low on
demands and low on control, which are called passive jobs in a work context.
According to Karasek and Theorell, the passive jobs setting are the second major
psychosocial work problem which is described in the model. As compared to high

36
strain jobs, passive jobs can result in different injuries on health and involve different
strategies for eliminating injuries (Karasek & Theorell 1990:p.43).
Importantly, Karasek and Theorell claim that passive jobs which lack of job challenges,
can lead to negative learning or gradual loss of previously acquired skills. A passive
work situation can manipulate workers leisure activities outside the job in a negative
way. Environmentally rigid restrictions preventing workers from testing their own ideas
for improving the work process can only mean an extremely unmotivating job setting
and result in long-term loss of work performance (Karasek & Theorell 1990).
For passive jobs, like for active jobs, Karasek and Theorell hypothesise only a normal
level of psychological strain and illness problems. Although, each stressor exposure
would result in substantial residual psychological strain, the low demands of this work
situation mean that fewer stressors are confronted (Karasek & Theorell 1990). 2.1.3 Concept of Low Strain Jobs in DC Model Low strain jobs are found in the upper left-hand quadrant of the model, and represent
the third prediction in Karasek and Theorell’s model. This third prediction is that high
degree of job control combined with few psychological job demands and challenges,
creates a lower than average levels of residual psychological strain. This low-strain job
grouping represents the other end of the residual psychological strain. Low
psychological strain workers have a work situation with a low stress level, and are
happier and healthier than average at work (Karasek & Theorell 1990). 2.1.4 Concept of High Strain Jobs in DC Model High strain jobs are found in the lower right-hand quadrant of the model, and represent
the fourth prediction in Karasek and Theorell’s model. This fourth prediction is that
low level of decision latitude combined high degree of job demands and challenges,
creates a higher than average levels of psychological strain. High strain workers have a
work situation with a high stress level, and are unhappy, poor health and low
performance than average at work (Karasek & Theorell 1990). Finally, Karasek &
Theorell, (1990) pointed out clearly that the changes in job demands can be perceived
as both negative and positive outcomes for an employee, since job demands can be a
clear contributor to psychological strains, but, on the other hand, is necessary for
effective learning/improve activity level. Job demands can be interpreted as burdens to

37
some employees, but also represent challenges and opportunities for growth and
learning for others. 2.2 Current Status of Karasek’s Demands-Control-Support Model
(JDCS) The job demands control support (JDCS) model (Karasek 1979; Karasek & Theorell,
1990) is a three-dimensional model that focuses on three job characteristics: job
demands (stressors), job control (autonomy) and social support at workplace. De Jonge
& Kompier, (1997) pointed out the theory of JDCS model is based on two central
assumptions: the first one is psychological strains which results particularly in work
characterized by high job demands in combination with low job control and low social
support, the second one standard work performance will occur in work characterized by
high job demands, high job control and high social support.
A number of studies have experienced the JDCS model in nursing (Landsbergis 1988,
de Jonge & Landeweerd 1993, de Jonge 1995). The outcomes of these research studies
normally point out that job control or autonomy seems predominantly to be associated
to job satisfaction and productivity, whereas job demands and social support seem
particularly to be associated with health complaints and absenteeism (Ab Landeweerd,
2004).Therefore, Karasek’s (1979) job demands–job control model has been an
powerful theoretical base for various studies of job stress (e.g. Cooper, 2000; Van
Yperen and Hagedoorn, 2003). The hypothetical argument necessary in this model is
that individual physiological strain results from the interactive effects of one’s job
demands and the amount of job control available at workplace. Particularly, Karasek’s
theory posits that in order to minimize physiological strain, job demands should be
coordinate to job control so that where ever job demands are high, job control should
match the requirement. High job control enables participants to handle the job demands
by developing appropriate behavioral response patterns to improve the job
performance.
Accumulated evidences indicate that a large amount of research on the job demands–
job control model has focused on the job of nurses (Fox et al., 1993; Schaubboeck and
Merritt, 2003) and production workers in manufacturing industry (e.g. Wall et al.,
1996). Some research studies have supported the proposed interaction effect of three

38
variables (e.g. Fox et al., 1993), and others have demonstrated no such effect on job
strain (e.g. Landsbergis, 1988).
Similarly, some researchers in this area have developed a contingency approach by
investigating the extent to which the job demands–job control connection is moderated
by individual-level characteristics such as locus of job control and social support. In
addition, research on Karasek’s model has largely focused on job demands such as
workload and work pace (Fox et al., 1993; Van Yperen and Hagedoorn, 2003).
Moreover, there have been a few studies, to the best of our knowledge, that have
applied the job demands–job control model to the social nature of work job demands,
that is, job challenges arising from managing interdependencies with other people in the
workplace(S. S. Wong et al., 2007).
Karasek and Theorell (1990) stated that their three models take up important position
between two large bodies of literature, which associated with job stress and to job
description. The significant determinants of job strain and active learning are the
amount of decision latitude structured into job description. Karasek’s highlighting
leading to objective job characteristics as determinants of job strain stands in
predominantly sharp contrast to Lazarus and Folkman’s (1984) whose point of view on
the worker’s judgment and locus of job control, and Caplan et al. (1975), and other
members of the Michigan school’s approaches on the fit between the job and the
worker’s capabilities or values of job. Siegrist (2000) noted that Karasek’s models have
not been accurately adjusted in providing a necessary corrective to these earlier ideas.
In doing so, he advocated a clear picture for achieving the high levels of worker
productivity, on the one hand, and high levels of worker independence, support and
personal development, on the other side.
Nelson & Simmons, (2003) stated that Karasek’s ideas have concerned with interest
relates to their fundamental positive human values or standards. In this way his ideas
are well-matched with, and may even have contributed to the current popularity of, the
constructive psychology movement of working force. In spite of these constructive
ideas, the theory is normally documented as being over or under simplified. Karasek’s
theory highlighted a few variance in job strain by variables (Schreurs & Taris, 1998),
mostly as it includes few predictors or mediators and moderators, at the same time as
trying to clarify many outcomes associated factors. Karasek and Theorell (1990)

39
protected the simplicity of the theory by suggesting that this is “essential for practical
interdisciplinary applications and for the first stages of scientific research” (p. 56-57)
(for a new researcher). They admitted that the effects of job demands and job control
upon strain can be reduced to minimum level by adding a large number of other
predictor variables to the equation job strain.
Bradley, (2004) pointed out that before attempting to draw conclusions concerning the
extent to which the models have been supported empirically, there is need to an
agreement as to what constitutes a appropriate and acceptable test of the main
hypotheses. Because of that there is lack of precision and consistency in Karasek’s
written work. Operationalised job demands broadly to include such stressors as role
ambiguity or responsibility for others are facd into an overall evaluation of empirical
status of Karasek’s model. There should be studies of use separate outcomes such as
job performance and life satisfaction be considered genuine tests of the theory. Model
should be statistical job controls enough the negative affectivity and duration of work
experience. Furthermore, model is basically tested by evidence of additive (e.g., job
demands + job control + support) effects, but is it necessary also to test for and find
interactive (job demands x job control x support) effects (Bradley, 2004)?
After reviewing accumulated research evidence, Van der Doef and Maes (1999) drew
conclusions that “the literature gives considerable support for the strain and iso-strain
hypotheses, but support for the moderating influence of job control and social support
is less consistent with each other” (p. 86)
Bradley, (2004) further stated that if insufficient tests of the hypotheses are excluded,
and those studies that meet at least minimum criteria are weighted in proportion to the
quality of the methods used, it may be included on the ground that: (a) firstly, empirical
support for the independent effects of job demands, job control and social support
upon strain is strong, (b) secondly, support for the additive effects of these three
variables on strain is mixed at various different combinations, (c) thirdly, support for
the two-way interactions on strain is relatively weak, (d) fourthly, support for the three-
way interaction (job demands x job control x support) on strain is, at best, marginal, but
most promising in relation to the prediction of somatic complaints, (e) fifthly, support
for the active-learning hypothesis is quite strong in respect of the role played by job
control, but the evidence is weak and indirect concerning further contributions made to

40
active learning by job demands and the job demands x job control interaction, and (f)
finally, support for the extended personality-environmental model is limited.
Therefore, it is cleared to greater extend that Karasek’s fundamental theory is based on
sound footing and supportive of empirical studies. On the other hand, a critic (Sauter,
1989) has claimed that the practical implications of what are often quite small effects;
Frese (1985) has noted that the effects may be considerable for the extreme in the
inhabitants. According to the above views of authors, authentication of Karasek’s
hypothesis mostly came from studies of large blue-collar samples that used cross-
sectional designs of specific descriptive jobs. Social support for Karasek’s models also
vary with the type of statistical analyses performed with other variables
2.3 The JDC Model and Social Support Accumulated evidences on this model testing suggests that social support at work may
either have a direct effect on the level of job strains independent of the level of job
stressors (Payne, and Jones, 1987;Loscocco, and Spitze, 1990; Parasuraman,
Greenhaus, and Granrose, 1992; Roxburgh, 1996 ; Andries et al., 1996;) or a buffering
effect by moderating the stressor-strain relationship (LaRocco, House, and French,
1980;ohen, and Wills, 1985; Beehr, King, and King, 1990; Terry, Nielsen, and
Perchard, 1993; Viswesvaran, Sanches, and Fisher, 1999). The job strain buffering
hypothesis assumes social support (by all sides) are effectively mobilized to counteract
job stress so that negative consequences of job stress are reduced (Gore, 1985). Based
on this analysis and in accordance with the JDCS model of Johnson and Hall (1988), it
is anticipated that low support combined with high job strain conditions (i.e. high job
demands and low job control) will have negative effects on mental health, as compare
to either low support and low strain environment or high support and high strain
environment. Unfortunately, cross-sectional as well as longitudinal studies on the JDCS
model have not been unanimous in their results. Researches on the Karasek’s original
JDC model, predicted results are obtained particularly with cardiovascular disease
(Johnson, 1986; Astrand, Hanson, and Isacson, 1989; Johnson, and Hall, 1988; Johnson
et al., 1989), whereas for somatic complaints and psychological strain, results are
contradictory. Andries et al. (1996) claimed to support the JDCS model, they merely
compared different combinations of the three variables and did not specifically test the
3-way multiplicative interaction relationship. Nevertheless, the stress moderating role

41
of social support at workplace was not found in other studies (Melamed et al, 1991;
Fahtera et al., 1996). On the other side of picture the results of the study by Parkes et
al. (1994) were mixed; the models `worked’ for somatic symptoms but not for job
satisfaction or improve productivity.
Landsbergis et al. (1992) established a important interaction between job demands, job
control and social support but did not reproduce the expected stress moderating effect
of social support. The results of their study showed that in active jobs that are
characterized by high job demands and high job control, poor social support was related
to job dissatisfaction. Similar results were found by Schaubroeck, and Fink (1998),
who suggested that workers facing high demanding job situations coupled with high job
control and low support, or low job control and high support will tend to experience
difficulties in coping because one key ingredient for successful coping is required the
equality of job control and social support. 2.4 The JDC Model and Locus of Job Control Locus of job control is the generally belief that behavioural outcomes are under one’s
personal job control rather than depending largely on outside forces, or powerful
persons in performing his/her job (Rotter, 1966). Kahn and Byosiere (1992) have stated
that it is important to include the concept of locus of job control in job stress research
because it predicts that those who have strong internal locus of job control are more
likely to cope actively with job stress, whereas those with weak locus of job control are
more likely to refrain from action since they believe that altering the condition is
beyond their job control.
Therefore, those who have strong internal locus in contrast to low level locus of job
control are expected to show higher levels of health, comfort and performance when
they are confronted with job stress. Furthermore, it has been argued that job control is
likely to have a beneficial effect for individuals with an internal locus of job control
(Frese, 1989; Kahn, and Byosiere, 1992). Similarly, Parkes (1989) has pointed out that
job control is more likely to be perceived when objective job control is high and the
employee’ s locus of job control is internal. Consequently, it is expected that the
moderated effect of job control will be exclusively observed in employees with strong
internal locus of job control. Whilst in those studies on the JDC model where locus of
job control has significant connections with job demands, job control and locus, results

42
are not conclusive and moderated effects. Most of the researchers found that the
moderator effect of job control on strain was exclusively found in those with an internal
locus of job control he/she has (Daniels, and Guppy, 1994; Vahtera et al.1996). Indeed,
Daniels, and Guppy (1994) have pointed out that the JDC model only works as
experience by Karasek for those with an internal locus of job control, whereas for those
with a poor locus of job control at workplace, the results showed an inverse moderating
effect of job control. In addition, Vahtera et al. (1996) expanded the JDC model by
including sense of coherence (a concept similar to locus of job control) in predicting
sickness absence spells However, Parkes (1991), the JDC model only `works’ for an
external locus of job control, and because of this the researcher points out the need for
taking into account locus of job control in the JDCS model as stress study. 2.5 The JDC Model, Social Support and Locus of Job Control In consideration of the effect of job control, Kasl (1989) suggested that future studies
must be explore the interaction of job control with other new dimensions, such as social
support or locus of job control as a moderator of job strain. It is cocluded that Job
control, social support and intrapersonal job control beliefs such as locus of job control
are among those variables; they are resources that may interact to promote or inhibit
resistance to stress as moderator (Holahan, and Moos, 1990, Vahtera et al., 1996
Parkes (1991) states that advance research is needed to clarify and measure the extent
to which social support and locus of job control go beyond as moderators of stress-
outcome relations in general, and as moderators of demand-discretion effects. Even
though a number of studies have analyzed second-order interactions, to date no study
has simultaneously considered higher order interactions individually between job
demands, job control, social support, and locus of job control. For instance, significant
interaction effects have been found of locus of job control, social support and stressors
on job performance.
It is evident that the moderating effects of social suppor occur, basically, for those with
an internal locus of job control or characteristic (Lakey, 1982; Fusilier, Ganster, Mayes,
and Bronston, 1987; Cummins, 1989).
Nonetheless, neither of them has explicitly tested the 4-way interaction between job
demands, job control, locus of job control, and social support at workplace. After a 3-
ways longitudinal research by Daniels, and Guppy (1994), it is stated that those with

43
internal locus of job control with high social support were less likely to have decreased
their psychological well-being when experiencing the effects of higher levels of job
demands (Jose M. Peiro, Wilmar Schaufeli, 2001).
The another study tested a modified JDC model in which social support and sense of
coherence were anticipated to modify the interaction between job demands and job
control on strain (Vahtera et al., 1996). Walter et al. (2000) found that those employees
who work in active jobs and who have a strong sense of internal locus of job control,
experience a high level of support have less sickness spells than those in active jobs
with a weak sense of locus of job control and low level of support. Actually, these three
ways results are based on cross-sectional data and higher-order interactions (a
longitudinal data) were not tested. One side JDCS model predicts a stress-moderating
effect of social support and, on the other side, an internal locus of job control seems to
make a more effective use of both the received support (Sandler, and Lakey, 1982;
Fusilier et al., 1987; Cummins, 1989) and job control (Daniels, 1992; Phares, 1976).
Therefore, it is concluded that the JDC model will operationalised with high social
support and internal locus; that is to say, job control will have a more beneficial effect
when social support is high and when the employee has an internal locus of job control. 2.6 Independent Effects of the Job Factors on Strain 2.6.1 Independent Effects of Job Demands on Strain Excessive job demands have been effects negatively on job strain including
catecholamine and/or cortisol levels (Tattersall & Farmer, 1995), heart disease
(Siegrist, Peter, Junge, Cremer, & Siedel, 1990) and high blood pressure (Hutt &
Weidner, 1993; Curtis, James, Raghunathan, & Alcser, 1997). Some other studies
(Johnson, Stewart, Hall, Fredlund, & Theorell, 1996; Landsbergis et al., 1992;
Morrison et al., 1992; Moyle & Parkes, 1999; Cheng et al., 2000), the main effect of
job demands have been demonstrated after statistically job controlling for other
variables or factors. Job demands have been studied independently on strain (McLaney
& Hurrell, 1988; de Jonge, Janssen, & van Breukelen, 1996) with multiple-occupation
samples (Karasek, 1979; Landsbergis, Schnall, Deitz, Friedman, & Pickering, 1992;
van Veldhoven et al. 2002) to measure of job demands. A large body of research
evidence provides support for this proposition that most of the theories of occupational
stress or job strain (Caplan et al., 1975; Edwards et al., 1998; Karasek, 1979; Payne,

44
1979; Siegrist, 1996; Demerouti et al., 2001; Paul E. Spector1, 2002, p.133) suggest
that high demanding jobs are those which have extremes of work complexity, pace,
variety and load - are linked with higher levels of strain than are less demanding jobs.
The independent effects of job demands has been verified using a wide range of strain
measures including job stress/anxiety/dissatisfaction (Kalimo & Vuori, 1991;
Landsbergis et al. 1992; Parker & Sprigg, 1998; Tattersall & Farmer, 1995; Wall et al.,
1996; Williams & Alliger, 1994 ; Vermeulen & Mustard, 2000), emotional exhaustion
and/or burnout (de Rijk, Le Blanc, & Schaufeli, 1998; Karasek, 1979; Pomaki &
Anagnostopoulou, 2001; Rafferty, Friend, & Landsbergis, 2001), general psychological
health (Tyler & Cushway, 1998; Beehr et al., 2001; Morrison, Payne, & Wall, 2001),
and somatic complaints/ physical illnesses (Wall et al., 1996; de Croon, Van Der Beek,
Blonk, & Frings- Dresen, 2000).
Bradley, (2004) stated that majority of past studies used several dependent measures,
with job demands predicting only a subset of outcomes. Furthermore, Broadbent
(1985), has pointed out that workplace (a central feature of job demands) generally has
a stronger effect upon stress levels than it does upon levels of depression or job
dissatisfaction (see also, Hesketh & Shouksmith, 1986). Similary, other researchers
(e.g., Moyle, 1996; Beehr et al., 2001) suggest that, simultaneously, job demands may
be positively associated with job satisfaction and negatively associated with mental
health and performance. Finally, it is concluded that job demands (stressors) are
positively correlated with job strain, but the strength of this association varies between
specific strain outcomes, and with other factors (see, e.g., Bradley, 2004; Morrison &
Payne, 2003; Hurrell & Lindstrom, 1992) 2.6.2 Independent Effects of Job control on Job Strain Basically, job control refers to the extent to which an individual has a capability to
exercise authority over one or all potential and actual stressors of job. Job control refers
how an individual or group of workers is completing job demands closely associated to
the development of stress (Kompier & Levi, 1993). The concept of job control equates
with autonomy or independence (Beehr, 1995), empowers an individual to exercise job
control what events to perform first and what to next and how to proceed in completing
them within specific time period.

45
At work environment, job control may take several forms, including self-paced of
work, participation in goal-setting and decision making, flexible work scheduling, and
other types of job autonomy given by organization (Bradley, 2004). Most of the
researchers suggest that the availability of job control can have moderated effects upon
levels of job satisfaction and morale, as well as somewhat weaker effects upon work
withdrawal behaviours, self-reported somatic health and psychological well- being of
employees (Hart, Wearing, & Conn, 1995; Spector, 1986; Kasl, 1989; Parkes, 1989;
Clegg, & Jackson, 1990; Landy, 1992; and Pearson, 1992). Empirical researches have
measured job control subjectively (perceived) that workers who report high levels of
job control over their work also report low levels of stress and other strain outcomes.
The job control-stress relationship has been established in a variety of samples, using
various measures of perceived job control, and after partialling out the effects of
annoyance variables (Bradley, 2004). The direct effects have been measured on job
strain (Kushnir & Melamed, 1991; Carayon, 1992; Landsbergis et al. 1992;Elsass &
Veiga, 1997; Steen et al., 1998), on job satisfaction ( Beehr & Drexler, 1986; Beehr et
al., 2001; Calnan, Wainwright, & Almond, 2000; Elovainio, Kivimaki, Steen, &
Kaliomaki-Levanto, 2000; Fletcher & Jones, 1993; Jimmieson, 2000; Karasek, 1979;
Karasek and Theorell, 1990; Karasek et al., 1982;Landsbergis, 1988; Landsbergis et al.
1992; Morrison et al., 2001; Moyle, 1995, 1998; Sargent & Terry, 2000; Tyler &
Cushway, 1998; Wall et al., 1996*,and on general mental health ( Calnan et al., 2000;
Chay, 1993; Johnson et al., 1995; Landsbergis et al., 1992; Moyle, 1992).
Beehr et al., (2001) have stated that job control predicts job satisfaction, but not
psychological strain. A subjective (perceived) lack of control at the job has been shown
to associate with objective outcomes of health status, including catecholamine levels
(e.g., Johansson et al., 1978; Steptoe et al., 1993), immune system functioning
(Kawakami, Tanigawa, Araki, Nakata, Sakurai, Yokoyama, & Morita, 1997),
cardiovascular functioning (Rau, Georgiades, Fredrikson, Lemne, & de Faire, 2001;),
heart disease risk factors (Pieper et al., 1989), heart disease (e.g., Bosma et al., 1998;
Karasek et al., 1988; Steenland et al., 1997), and mortality results (e.g., Amick et al.,
2002).
Some researches found that some types of job control have a clearer and substantial
effect upon well-being on the workers, especially task job control predicted job

46
satisfaction better than did either decision power or scheduling job control (Sargen and
Terry, 1998). Likewise, Barnett and Brennan (1997) found that skill capabilities, but
not decision authority or schedule job control, predicted psychological well-being.
Furthermore, different workers working at different places/job need different type of
job control: some workers may prefer to follow others rather than assume authority, and
may find job control a source of strain, rather than satisfaction (Frese, 1989; Parkes,
1989; Smith, Wallston, Wallston, Forsberg, & King, 1984). The effects of job control
may also vary with a range of personality variables: for example, Hurrell and
Lindstrom (1992) found that job control predicted somatic complaints differentially
according to participants’ age and locus of job control.
2.6.3 Independent Effects of Social Support on Strain Social supports strengthen the effects of job control on job demands and strain.
Bradley, (2004) pointed out that the relationship between social support and other
factors within the stress machanism is potentially more complex than those between the
other two job factors on strain.Both the size and density of the literature and evidence
in this field are vast. Johnson and Hall, (1988) pointed out, with the comprehensive
study of social support at workplace, that social support has emerged as one of the
central research areas in social epidemiology of chronic disease because support in the
workplace has been identified as a major psychosocial resource that serves to modify
potentially stressful job demands and pressures of modern production process. It
became evident that a third component was needed in the demand-job control model -
social support. Furthermore, as in research on social support in general, there are
several different aspects and components of social support that may be relevant to
work. At work the source of support is important, supervisor's and coworker's support
being the main sources for most employees (Johnson, Ellen Hall, and John Hopkins,
1988). At work, the source of support is important, supervisor's and coworker's support
being the main sources stress for most employees.Two of the most important
components of support are –instrumental (having needed help available in solving the
problems and tasks related to work) and –emotional support (someone to share inner
feelings with about job problems) (Jeff Johnson, Ellen Hall & Hopkins, 1988). For the
health of workers, the worst hypothesized situation is iso strain i.e., job strain and lack
of social support -both instrumental and emotional. Johnson et al, (1989) social support
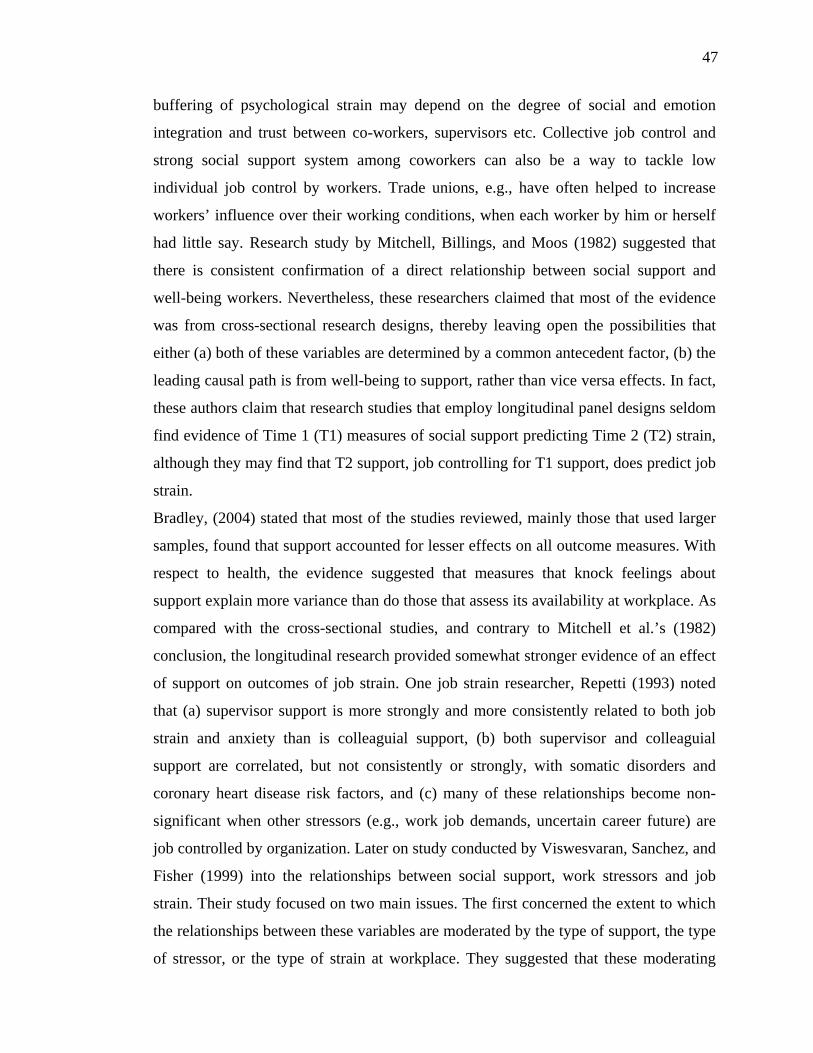
47
buffering of psychological strain may depend on the degree of social and emotion
integration and trust between co-workers, supervisors etc. Collective job control and
strong social support system among coworkers can also be a way to tackle low
individual job control by workers. Trade unions, e.g., have often helped to increase
workers’ influence over their working conditions, when each worker by him or herself
had little say. Research study by Mitchell, Billings, and Moos (1982) suggested that
there is consistent confirmation of a direct relationship between social support and
well-being workers. Nevertheless, these researchers claimed that most of the evidence
was from cross-sectional research designs, thereby leaving open the possibilities that
either (a) both of these variables are determined by a common antecedent factor, (b) the
leading causal path is from well-being to support, rather than vice versa effects. In fact,
these authors claim that research studies that employ longitudinal panel designs seldom
find evidence of Time 1 (T1) measures of social support predicting Time 2 (T2) strain,
although they may find that T2 support, job controlling for T1 support, does predict job
strain.
Bradley, (2004) stated that most of the studies reviewed, mainly those that used larger
samples, found that support accounted for lesser effects on all outcome measures. With
respect to health, the evidence suggested that measures that knock feelings about
support explain more variance than do those that assess its availability at workplace. As
compared with the cross-sectional studies, and contrary to Mitchell et al.’s (1982)
conclusion, the longitudinal research provided somewhat stronger evidence of an effect
of support on outcomes of job strain. One job strain researcher, Repetti (1993) noted
that (a) supervisor support is more strongly and more consistently related to both job
strain and anxiety than is colleaguial support, (b) both supervisor and colleaguial
support are correlated, but not consistently or strongly, with somatic disorders and
coronary heart disease risk factors, and (c) many of these relationships become non-
significant when other stressors (e.g., work job demands, uncertain career future) are
job controlled by organization. Later on study conducted by Viswesvaran, Sanchez, and
Fisher (1999) into the relationships between social support, work stressors and job
strain. Their study focused on two main issues. The first concerned the extent to which
the relationships between these variables are moderated by the type of support, the type
of stressor, or the type of strain at workplace. They suggested that these moderating

48
influences were weak; symptomatic of that support, stressors and strain can be validly
treated as general constructs of workers. The second issue relating to the nature and
strength of the relationships between these general constructs. Analysis results
indicated that social support has two independent linear effects on work stressor-strain
relations: a direct effect upon stressors, moderating the level of stressors, and a direct
effect upon strain, reducing the strain.
Bradley, (2004), on the basis of vast study conducted at School of Applied Psychology,
Griffith University, noted that:
1. In general, social support is negatively associated with job strain.
2. Social support is also connected to the level of stressor, although the effects are not
as strong as the support-strain effects (Dignam & West, 1988). Burke and Greenglass
(1994) suggested that social support may impact more strongly upon acute stressor
events than upon chronic stressor environment.
3. Sources of support at workplace (e.g., from supervisors and colleagues) have a
stronger effect upon work stressors and strain levels.
4. Personal and related variables moderate the effects of support on stressors and
strain.
5. Social support and strain may be reciprocally associated. Immediately as the
availability of support reduces levels of strain, the existence of strain reduces the
possibility of receiving support (e.g., because stressed workers fail to maintain their
support networks).
6. There are facts (Carayon, 1995) that the ill-effects of a lack of social support may
change over an extended period, rather than being immediately evident. 2.6.4 Quadratic Effects of Job demands, Job control and Social
Support on strain A large amount of evidence suggests that the relationships between the job factors (job
demands, job control and social support) and strain are linear effects. Similarly, Warr
(1990) classified his samples of 1686 workers into six different groups based on their
level of job demands and their level of job control. He has tested both linear and
quadratic effects of job factors: job dissatisfaction, anxiety and depression were all
highest at moderate levels of job demands. On the same way, Fletcher and Jones (1993)
tested the quadratic effects of job demands and job control and found significant effects

49
of job factors. De Jonge, Reuvers, et al. (2000) found significant quadratic effects for
job demands on emotional exhaustion, but no other such effects for job demands or
job control on any other dependent variables used in his study. On the other hand,
Johnson et al. (1996) noted that, high levels of job control have a defensive effect upon
worker‘s health and wel-being, while low and moderate levels of job control do not
have significantly different effects on dependent factors. The father of JDCS model,
Karasek (1979) onward, did not find any detail of the possibility that social support
might be associated in a non-linear way to performance of workers. Furthermore,
several other researchers have recommended that support beyond optimum levels may
be apparent as a burden or as interference (Taylor, 1999). When the workers see the
support available to them as excessive, non-linear relationships involving support may
be predicted on dependent factors. Some researchers, (Hellemans & Karnes, 1999;
Morrison et al., 2001; Pomaki & Anagnostopolou, 2001) found quadratic effects in a
small number of studies on job factors. Bradley, (2004) suggested that most of the
studies could not find the nature and extent of non-linear effects associated with all
three job factors. Karasek (1979) pointed out the possibility that job demands and job
control may be related to strain in non-linear ways. Afterward, Karasek & Theorell,
(1990), hypothesized that strain varies in a non-linear way with the combination of job
demands and job control: specifically, strain was predicted to increase with the size of
the difference, in either direction, between job demands and job control.
In spite of these interesting findings, Karasek has not subsequently reported additional
data nor conducted more formal tests of non-linear relations between the job factors and
job strain of workers. Bradley, (2004) noted that the idea of these job factors and strain
are related in a non-linear way has intuitive appeal, because employees may feel stress
from being either under- or over-loaded at workplace. Furthermore, upto certain extent,
job demands may be perceived as challenging and non-threatening, but beyond that
level, increasing job demands could overwhelm resource capabilities of worker and
lead to high levels of strain. Some researchers (Morrison, Payne, and Wall, 2001) could
not confirm the existence of any non-linear relationships. They suggested that in a large
sample of hospital employees, found no evidence of quadratic effects of job demands or
job control on either job satisfaction or general mental health. Likewise, Parkes (1991)
found no evidence of such effects in a sample of 590 male civil employees.

50
2.6.5 Additive Effects of the Job Factors on Strain This part of literature review investigates the effects of linear combinations of job
demands, job control and social support at workplace. This combination carry the
additive effects of job factors on job strain, put differently, that how much one job
factor (job control) adds to the variance of second one (job demands) on strain.
Accumulated evidences of large body of researchers investigating the additive effects
of job demands and job control are logically reliable. Van der Doef and Maes (1999)
used the job strain hypothesis to verify the job demands-job control additive model.
Their research predicting four outcome categories: psychological well-being, job
satisfaction, burnout, and job-related well-being of employees. They concluded that a
majority of studies supported the hypothesis of job factors of four outcomes. Some
researchers found additive effects of job demands and job control in epidemiological
studies (e.g., Karasek et al. 1988; Crum, Muntaner, Eaton, & Anthony, 1995),
experimental studies (Searle et al., 1999), cross- sectional self-report studies (Andries et
al., 1996; Elsass & Veiga, 1997; Fletcher & Jones, 1993; Landsbergis, 1988; Melamed
et al.,1991; Wall, Jackson, & Mullarkey, 1995; Wall et al., 1996) and longitudinal
studies (Cheng, et al., 2000; Crum et al., 1995; Johnson et al., 1995).
Much of the researches have been conducted without clear reference to Karasek’s
models that predict that job demands and perceived job control each have quite strong
relationships with outcomes of job strain. The condition is rather different, when tests
of the combined effects of job demands and job control are considered. Certainly,
Kristensen in 1995 noted that, more than 100 studies had investigated on the outcomes
of Karasek’s models, and most of these studies had included a test of the combined
influence of job demands and job control and have explored the additive effects of job
demands and job control on strain. Payne and Fletcher (1983) pointed out five measures
of job strain (depression, anxiety, obsession, somatic complaints and cognitive failures)
and found a main effect for job demands on anxiety, and main effects for job control
on all four factors of the other strain outcomes. The independent effects of job demands
and job control, not all researches have found job demands + job control additive
effects. Interestingly, Steptoe et al. (1998) found that a proportion measure of the job
demands and job control relationship predicted job satisfaction, but not psychological
well being or smoking and drinking behaviors and its effect on salivary cortisol was in

51
the direction opposite to that predictable at workplace. Another view, Parkes et al.
(1994) suggested that job demands predicted physical symptoms but not job
satisfaction, whereas job control predicted job satisfaction but not physical symptoms.
Another studies (e.g., Bromet et al., 1988; Morrison et al., 1992; Rau et al., 2001), job
demands and job control both have opposite, independent effects, rather than additive
effects on job strain. On the other hand, some researchers (Bosma et al., 1997; Riese et
al., 2000) have found a significant effect associated with only one of the two job
factors, but no significant additive effects of job factors. Furthermore, in those studies
where a joint measure of strain is in use, the additive effect is typically demonstrated in
respect of a minority of these outcomes. Finally, it is concluded that additive effects of
job demands and job control are frequently found, but their happening are dependent
entirely on methodological and the type of study.
Job demands and social support is an important resource that has been associated with
positive individual and organisational outcomes, especially in regards to the
occupational stressor-strain relationship (Beehr & McGrath, 1992). Social support is
typically derived from a variety of sources (i.e. work colleagues, supervisor, family and
friends). However, the different sources of job demands support have only recently
been specifically tested (Brough & Kelling, 2002; Voydanoff, 2002). For example,
Eisenberger, Stinglahamber, Vandenberghe, Sucharski, and Rhoades (2002) pointed out
that supervisor support is negatively associated with job strain. Direct relationships
have also been identified between social support and job satisfaction, absenteeism, and
turnover (Perrewe & Carlson, 2002; Viswesvaran, Sanchez, & Fisher, 1999). The
influence of supervisor support in this regard has received some particular recent
attention, especially in relation to reducing the consequences of job strain (Brough &
O'Driscoll; Voydanoff, 2002). Contrary to that Sargent and Terry (2000) noted that job
demands outcomes deprive of individuality and colleague support predicted job
satisfaction, but there was no additive effect. Likewise, Parkes et al. (1994) found that
job demands and support predicted different strain outcomes in a sample of health-care
workers. Other research studies found no additive effects on job strain (Astrand et al.
1989; Bosma et al. 1997; Chay 1993; Riese et al. 2000). Karasek often expressed his
view that job demands and support have additive effects, with each contributing
something unique to the level of strain. Some researchers have found proof of a job

52
demands-support additive effect. For example, in a path analytic study of 249 health
workers, de Jonge et al. (1996) suggested significant paths from both job demands and
support to emotional tiredness. Similarly, Moyle and Parkes (1999) reported effects on
general mental health. Morrison et al. (2001) reported job demands-support additive
effects upon job satisfaction and general mental health of workers. Melamed et al.
(1991) pointed out that job demands and job control each contributed individually to
the prediction of burnout and job satisfaction. Conversely, some researchers have
produced mixed results of job factors. Amick and Celentano (1991) found that the job
demands-supervisor support additive effect predicted job satisfaction, while the job
demands-colleaguial support effect did not produce such effects. Similarly, Fletcher
and Jones (1993) establish job demands- support additive effects on anxiety and
depression for both males and females, but, when job satisfaction was the criterion, the
additive effect was obtained for females only. Likewise, Landsbergis et al. (1992) set
up that job demands and support jointly predicted anxiety, depressive symptoms and
job dissatisfaction, but only support predicted psychological outcomes.
Some researchers have found support of a job control and support additive effect on
outcomes. Likewise, Johnson et al. (1995) found the correlation of strain in a sample of
medical practitioners, and in regression analyses, both job control and support were
significant predictors of job dissatisfaction and general well-being. Lateron, Johnson et
al. (1996) reported the cardiovascular disease mortality rates in research study on
Swedish workers using imputed measures of job demands, job control and social
support. Karasek and Theorell (1990) projected an additive model of the effects of
social support and job control on job strain. Some other stress researchers (e.g.,
Johnson, 1989; Melamed et al., 1991; Johnson et al., 1995; Demerouti et al., 2001) have
conceived of job control and support as resources that may be used in a complementary
way to contest strain. Johnson (1989) pointed out to the joint availability of these two
resources as collective job control, and suggested that both were necessary to moderate
the impact of job demands and other pressures of job performance.
Bradley, (2004) noted that no research that clearly tested Karasek and Theorell’s (1990)
2 (support) x 2 (job control) model that could be located. Likewise, some researches
have investigated the additive effects of these two job factors. The evidence is reported
as. They found that workers perceived to both low job control and low support had a

53
relative risk of 2.62 times those exposed to high job control and high support work
environments. Rodriguez et al. (2001) also found that support adds to the variance in
job satisfaction explained by perceived job control. Astrand et al. (1989) found the
combined impact of job demands, job control and social support using a single score to
stand for a composite of the three job factors. Even though they found no effect of this
composite upon mortality in their sample of blue collar workers, but they did find a
significant effect for an additive combination of job control and social support. Some
researchers have produced mixed results. For example, in a study of strain amongst
nurses, McIntosh (1990) entered both job control (autonomy) and supervisor support in
standard regression analyses, and found that both job factors predicted job satisfaction,
but only level job control predicted anxiety. On the other hand, Landsbergis et al.
(1992) suggested that job control and support contributed jointly to the prediction of job
satisfaction, but only support predicted level of anxiety and only job control predicted
job involvement. Conversely, Rau et al. (2001) stated that both self-reported job control
and imputed colleague support predicted several measures of heart rate both at work
and after work, but did not, in combination, consistently predict corresponding
measures of systolic or diastolic blood pressure. Parkes et al. (1994) pointed out of an
additive effect on job satisfaction, but not on somatic symptoms, in a sample of health-
care workers. Whereas, Moyle (1998) reported, in a longitudinal study, that support
predicted job satisfaction contemporaneously and prospectively, whereas job control
predicted this outcome contemporaneously. Sargent and Terry (2000) used job control
and three measures of support (from supervisors, colleagues and non-work people) to
predict two measures of strain. Only one of them possible additive effects was
significant: job control and co-worker support combined to predict job satisfaction. In
an another view, Sauter et al. (1983) suggested that both job control and support
contributed significantly to the prediction of job dissatisfaction, at the same time as
only support predicted ill-health symptoms and somatic complaints. Karasek &
Theorell, (1990) noted that three job factors, job demands, job control and social
support, jointly establish worker strain. But they did not fully articulate the nature of
the relationship between the three job factors. Bradley, (2004) stated that Karasek &
Theorell, (1990) could not clear whether they were proposing an additive, an
interactive, or some other three-way model. Karasek et al. (1982) hypothesised that the

54
relationship between job strain and various health-related outcomes would be
significantly different in sub-groups of their sample broken down by levels of social
support. Karasek & Theorell, (1990) data broadly supported this hypothesis,
particularly when the predictors included socio-emotional support from colleagues.
Fletcher and Jones (1993) studied the social support at a third step (after job demands
and job control) in hierarchical regression analyses predicting depression, anxiety, job
satisfaction and life satisfaction, and found that support was consistently associated
with significant level of all four outcomes. Conversely, Morrison, Dunne, Fitzgerald, &
Cloghan (1992) found in stepwise regression analyses that three main job factors (job
demands, constraints and support) remain as major predictors of strain. Some of the
earliest and most influential work into this hypothesis was conducted by Johnson and
Hall, (1986). They predicted the combined effects of job demands, job control and
colleagues support in a large prospective study of Swedish workers. They highlighting
the machanism of support were upon social interaction opportunities, rather than the
quality of emotional, instrumental and other forms of assistance. These three job factors
were found to be independently linked with self-reported symptoms of heart disease,
back pain and gastrointestinal disease. Johnson and Hall computed a single predictor
variable by obtaining standard scores for each of the three job factors, adding a constant
to eliminate negative values, and multiplying the three transformed scores together.
They referred to the outcome of this calculation as the iso-strain factor, which was
intended to reflect the extent to which individuals performed socially-isolated, high-
strain work. Johnson and Hall, (1986) then divided his sample into three parts on the
basis of these iso-strain scores. Low iso-strain employees were found to have lower
death rates from cardiovascular disease compared with middle and high iso-strain
scorers. Mortality rates for these two groups did not differ significantly from each
other. They said that the effect was stronger for blue than for white-collar workers.
Johnson and Hall (1988) confirmed the independent effects of the job factors on
cardiovascular disease risk, and showed that additive composites of these factors
contributed to the prediction above that expected on the basis of the individual job
factors. They categorized the employees as performing high job demands-low job
control- low support jobs had an age-adjusted disease prevalence ratio that was
significantly higher than that of workers in low job demands-high job control-high

55
support jobs. Karasek (1979) initially proposed the job demands-control model. This
specifies additive effects of job demands and job control that predicts wellbeing. Jobs
characterized simultaneously by high job demands and low job control are
hypothesized to threaten well-being. Jobs characterized by high job demands and high
job control are hypothesized to maintain well-being, because of the active coping
opportunities afforded by high job control. Jobs characterized by low demands are not
considered to threaten well-being, regardless of the levels of job control. Some research
studies have documented evidence for the job demands-control model (e.g., Fox et al.,
1993; Karasek, 1979). Conversely, other studies have found no evidence or only slight
evidence for the model, instead finding direct linear or curvilinear effects for job
demands and job control (e.g., Fletcher & Jones, 1993; Marshall et al., 1997; Payne &
Fletcher, 1983).
Johnson & Hall, (1989) suggested clarifying the nature of the model further by
introducing social support. Cohen and Wills (1985) noted that job support buffers the
impact of stressors on well-being because support provides resources for adaptive
coping. Johnson (1989) stated that a significant additive effects of three-way interaction
among demands, control, and support predicted health outcomes. Johnson found that
job control and social support operate jointly to additive effects of job demands on
well-being. Two studies have provided some support for this three-way interaction in
the expanded model (Landsbergis et al., 1992; Parkes et al., 1994). Other research
studies have suggested no support for three-way interactions among job demands,
control, and support (Andries et al., 1996, de Jonge et al, 1996; Melamed et al, 1991).
The diverse evidence for the job demands-control-support model may come from a
number of methodological artifacts (e.g. Ganster, 1989) or misspecification of
regression equations testing the model (Jaccard et al., 1990). Therefore, job control and
social support are expected to buffer the effects of job demands on well-being as they
both may be conceptualized as resources that enable effective coping. One of the most
widely cited classifications of job control divides personal efforts into problem-focused
and emotion-focused coping (Lazarus & Folkman, 1984). Job control through coping,
as this form of support is specifically directed toward interpersonal expressions of
emotion (Cobb, 1976). The condition of information may help change expectations
regarding job demands, promoting effective appraisal focused coping. Social support

56
may also help individuals worker’s cognitively to remove themselves from stressful
events, facilitating cognitive-escape-focused coping. Most of the researchers tested the
additive effects of job demands, job control and support implied in Johnson’s
“isostrain” hypothesis.
Landsbergis et al. (1994) tested the additive effects of job demands, job control and
social support using a variety of analyses based on both subgroup comparisons and
continuous iso-strain measures. Barnett and Brennan (1995) used structural equation
modelling to test a JDCS model in which seven job conditions variables were
hypothesized to predict psychological distress. They found that job demands and skill
discretion, but not supervisor support significantly predicted the outcomes.
Bosma et al. (1997) pointed out on the basis of research analysis that job control was
prospectively related to four outcomes of coronary heart disease, but neither job
demands nor social support predicted any of the outcomes like these.
Bradley provided a summary of the 17 studies reviewed, eight provided evidence
consistent with the job demands + job control + support additive hypothesis, three
produced mixed evidence, and six were not supportive. Van der Doef and Maes (1999)
likewise concluded that approximately half of the studies they reviewed supported the
(additive) ‘iso-strain’ hypothesis. Results of these studies appear to vary by method of
analysis and outcome variable: for example, supportive studies more often used sub-
group than regression analyses, and more often used job dissatisfaction than
absenteeism as the criterion. Furthermore, Amick et al. (1998) divided a sample of over
33,000 nurses into eight groups based upon median splits on the three job factors, and
found evidence that six outcomes of physical and mental health varied as predicted
between these eight iso-strain groups. Conversely, Bourbonnais et al. (1996) also
measured and dichotomised the three job factors in a study of almost 3000 white collar
workers. They suggested that there is main effect of job support on job factors, but not
on job strain. Similarly, Dollard (1996) analyse individually the job factor variables in
her study of Australian correctional officers, and in contrast to Bourbonnais et al.,
found iso-strain effects on general mental strain, job satisfaction, physical health
symptoms, and work-home conflict (but not on turnover intentions, stress leave, or
visits to the doctor). These effects were stronger when the predictor set involved co-
worker, rather than supervisory support. In a comprehensive four years study, Cheng et

57
al. (2000) divided a sample of nurses into eight variables (three job demands, three job
controls, and two supports) groups. After work controlling for ten potentially
confounding behavioural and natural variables, they found that participants reporting
high job demands, low job control and low support had the greatest declines in health
status. They accomplished that the “declines in health functioning associated with job
strain were as large as those associated with smoking and sedentary lifestyles” (p.
1437). 2.7 Two-way Interaction of Job Factors: Demands-Control of Strain Karasek’s original work, (1979) focused on physiological strain, his JDC model has
since been extended to mental or psychological stress (e.g. De Croon et al., 2004; Fox
et al., 1993). A body of research on the job demands–control model has focused on
nurses (e.g. Fox et al., 1993; Schaubboeck and Merritt, 2003; Van Yperen and
Hagedoorn, 2003) and on production workers (e.g. Parke, 1999; Wall et al., 1996).
Some research studies have supported the proposed interaction effect of JDC model
(e.g. Fox et al., 1993), and others have demonstrated no such effect (e.g. Landsbergis,
1988).
As a result, some stress researchers in this area have adopted a contingency approach
by investigating the extent to which the job demands–control interaction relationship is
moderated by individual-level characteristics such as self-effectiveness (Schaubboeck
and Merritt, 2003) and proactivity (Parker and Sprigg, 1999). However, it may be early
to abandon the job demands–control model for a model with more individual-level
variables. So, it is plausible that in nursing and production workers where incumbents
are used to relatively high levels of formalization in management of their tasks, greater
job control could be perceived as a burden rather than as a stress-reducing mechanism
(S. S. Wong et al., 2007).
Some theories such as Holland’s theory of vocational choice (Holland, 1973, 1985) and
Schneider’s theory of attraction–selection–attribution (Schneider, 1987) have pointed
out that individual differences are associated with occupations. For example, managers
have been found to prefer job autonomy while subordinates prefer shorter working
hours and higher job security (e.g. Savery, 1988). To the extent that there are
differences in job demands and individual preferences among occupations, individuals
in different occupations (e.g. managers vs. non-managers) may respond differently to

58
greater job control. Senior managers who are accustomed to greater job decision
latitude may respond to greater job control in a way consistent with Karasek’s model.
Furthermore, research on Karasek’s model has largely focused on job demands such as
workload and work pace (e.g. de Rijk et al., 1998; Fox et al., 1993; Van Yperen and
Hagedoorn, 2003). Interestingly, there have been no studies, to the best of our
knowledge, that have interactive effects of the job demands–control model to the social
nature of work demands, that is, job challenges arising from managing
interdependencies with other people in the workplace (S. S. Wong et al., 2007).
Karasek’s (1979) demand-control model (also known as the decision latitude model)
has been highly influential in occupational stress research, and has provided the
interaction effects of job factors on strain. The model is based upon a two-by-two
matrix of Demand and Control. Within this matrix, high levels of negative strain are
expected to occur when job control is low and work demands are high. In cases where
demand is low and or where control is high, the model predicts either low levels of
negative strain or varying degrees of motivation. Therefore, it is the interactive
combination of high work demands and low job control that leads to detriments in well-
being (Carl Andrew et al., 2000). Moreover, the demands-control model has been
highly influential, but it has also been criticized for being too simplistic. That is, it
potentially fails to include so many other factors that are presumably related to strain
(Baker, 1985; Schaubroeck, and Merritt, 1997). One factor that is not considered in the
demands-control model but which has repeatedly been shown to be related to strain is
social support (Cohen, and Wills, 1985; George, Reed, Ballard, Colin, and Feilding,
1993; and LaRocco, House, and French, 1980). Thus, it is not surprising that the
demands-control model has been modified to include social support. This adapted
model is typically referred to as the demands-control-support model (Johnson, 1989;
Johnson, and Hall, 1988; Johnson & Hall, Stewart, Fredlund, and Thoerell, 1991). The
moderated demands-control-support model is essentially a three-way interactive model.
It proposes that the two-way interaction hypothesized by the demands-control model is
further bounded by social support at workplace. Particularly, the model proposed the
moderating effects of control on the demand-strain relationship will be found only
when support is high. Tests of the demand-control-support model have found evidence
that the inclusion of support is an important extension of the demand-control model

59
(Johnson, and Hall, 1988; Winnubst, and Schabracq, 1996). Johnson and Hall (1988)
found, for example, that the predicted interactive relationship between work control and
job demands was evident only when social support from co-workers was present in
work environment. Wong et al., (2007) pointed out that whenever job demands are high
and role clarity is high negative strain should be minimal-employees may have
considerable work to do, but they know what to do, and so negative strain is low.
Conversely, in cases where demands are high and role clarity is low, one would expect
high strain because not only do employees have a high work load, but also they are
unclear about what they should be doing. One can think of the expected relationship
between role clarity and demands as a situation where role clarity moderates the
demand-strain relationship. The second way in which Karasek’s model extends the
demand-control literature is by modelling the effects of supervisory support as a shared
group-level property. On the other hand, supervisory support is to be a contextual or
environmental variable shared among group members; Jex, and Bliese (1999) give
contextual analyses of collective efficacy. Most studies of social support have focused
on modeling how an individual’s support influences his or her well-being. However,
most researchers focus on how the levels of support within a group affect individual
level of well-being. In this study, social support interactive effect is to be considering,
particularly, the supervisory support which is important in terms of detrimental strain in
occupational stress settings (Leather, Lawrence, and Dickson, 1998; Winnubst, and
Schabracq, 1996). Although Carl Andrew et al. (2000) conceptual and methodological
approach differs substantially from that of Johnson, and Hall (1988), we nevertheless
expect to replicate the form of their results. That is, we expect to job demands that high
role clarity will restructure the effects of high job demands on strain only in cases
where individuals are members of groups with supportive leaders. Why might this
interactive effect occur? We suggest that it occurs because in relative terms the main
effect linked with support is more significant than the interactive effect of role clarity
(or control). If Johnson and Hall (1988) had found that high control buffered job
demands on strain regardless of levels of support, it would have implied that the
interactive effects of control were ‘stronger’ than the main effects of support. However,
Johnson, and Hall (1988) in fact found that the buffering effects of control were
‘trumped’ by low support—the buffering effects of control were lost when support was

60
absent. This implies that a lack of social support can overcome the buffering effects of
job control. Based on this logic, it is expected to find that the buffering effects of role
clarity on work demands will be present only when supervisory support is high. In other
words, we do not think that high role clarity will be ‘strong’ enough to buffer high job
demands if supervisory support is missing altogether. The distinctive aspect of
Karasek’s model is to find out the interactive effect of job demands and job control
upon strain (and activity-participation). Bradley, (2004) did a comprehensive search of
the literature published between 1979 and 2003 identified many dozens of studies
claiming to test the hypothesis that job control buffers the job demands-strain
relationship. He attempted to produce findings from those studies that provided a valid
test of the hypothesis. Some studies were excluded from this combination on several
grounds. Highest among these criteria was evidence of the use of purely additive
techniques (e.g., a job demands plus job control composite, main effects of job
demands and job control in an ANOVA). Some other studies (e.g., Johnson et al., 1989;
Vahtera et al., 2000) appear to have used a multiplicative term as the sole predictor of
strain without first job controlling for the effects of the component variables within this
mixture term. These studies tested the main effects of the two job factors, rather than
first partialling out these effects, and thus do not provide a true test of the interaction
effect of job factors (Schaubroek & Fink, 1998).
Overall, a sizable minority of the confirmation is consistent with the view that the
interaction of job demands and job control predicts physiological, affective and
behavioural outcomes of strain.Van der Doef and Maes (1999) concluded that research
findings were mixed in relation to what they called the “job control buffering”
hypothesis. By their analysis, the hypothesis received at least partial support in
approximately half the studies in which the outcome variable was general psychological
well-being, job satisfaction, or job-related well-being. No specific psychological
outcome showed consistent support across studies, and support for the hypothesis
varied within single studies with either the type of job control measured, or type of
employee studied or the type of environment.
Social support for the interaction hypothesis did not vary substantially by sample
characteristics across studies (de Jonge, Dollard, Dormann, & Houtman, 2000).

61
Vermeulen and Mustard (2000) suggested the main effects upon strain for each of the
job factors from interviews with thousands of workers. Sub-group analyses produce
results consistent with the job demands + job control + support additive hypothesis.
Outcomes results were stronger for males than for females.
Both Warr (1990) and Wall et al. (1996) found the impact of job demands and job
control upon levels of anxiety, depression and job satisfaction in separate samples of
over 1000 British workers. Warr recommended that the interaction effects relating to all
three of these outcomes of strain were non- significant, whereas Wall et al.,(1996)
found all three interactions to be significant! Morrison et al. (2001) suggested that the
job demands x job control interaction predicted job satisfaction when individual self-
report data were analysed, but not when responses were aggregated at the level of the
work environment. The interaction effects did not predict general health scores using
either level of data analysis.
De Jonge, Reuvers, et al. (2000) found that the combination of job demands, social
support and either decision authority or skill discretion predicted job satisfaction,
emotional exhaustion, depression, and psychosomatic complaints, but not absenteeism
in a heterogeneous sample of 1739 employees. In a more recent longitudinal study, de
Jonge, Dormann, Janssen, Dollard, Landeweerd, & Nijhuis (2001) pointed out that both
job demands and support (but not job control) measured at Time 1 predicted job
satisfaction measured at Time 2, after job controlling for Time 1 satisfaction and other
factors. On the other hand, a minority of studies has found no evidence of an additive
effect. For instance, in Pomaki and Anagnostopoulou’s (2001) research study of Greek
teachers, no additive effects were obtained, with job control predicting job satisfaction
only, and support predicting none of the five strain outcomes measured. De Jonge et al.
(1996) noted that support, but not job control, predicted emotional exhaustion. Chay
(1993) found that, after job controlling for job demands and several demographic
variables, job control, but not support, predicted general mental health, whereas
support, but not job control, predicted job satisfaction. In other words, when one of the
two job factors was present, the other was unneeded. Reviewing the first ten years of
research study into the strain hypothesis, Sauter and Hurrell (1989) concluded that
"there seems to be little evidence that the job control-job demands effect is interactive
as originally proposed". Tetrick and La Rocco (1989) suggested that the relationship

62
between role stressors and job satisfaction was moderated by job control, but job
control did not moderate the relationship between stressors and psychological state of
happiness. Bromet et al. (1988), using longitudinal data obtained from medical
interviews, found that job demands and decision latitude interacted to predict alcohol
problems and physical symptoms - although this second relationship was in the
direction opposite to that hypothesized.
A vast amount of researches have investigated the interactive effects of job demands
and social support on strain and well-being of employees. According to early reviews
by Payne and Jones (1987), Alloway and Bebbington (1987), and Kahn and Byosiere
(1992), the finding in relation to moderating effects of social support is less consistent
than is that for main effects. Payne and Jones (1987) found mixed support for the
buffering hypothesis from a selection of 1970s and 1980s cross-sectional and
longitudinal research studies. Mitchell and others concluded that the mixed pattern of
results from both cross-sectional and longitudinal research indicated that the stressor x
support interaction may hold only for particular combinations of stressors, types of
support and strain outcomes. Alloway and Bebbington’s review also concluded that the
results are inconsistent, due to a combination of methodological differences and
shortcomings, and to the likelihood that, in reality, “buffering effects are not of
dramatic proportions” (p. 91).Repetti (1993) concluded that the evidence for a buffering
effects of social support on both affective and somatic outcomes of strain were weak
and unconvincing. Buunk and Peeters (1994) suggested that buffering effects are
seldom found at a rate greater than expected by chance. They also point out that any
theory of the effects of social support must also explain reverse buffering effects (where
support enhances strain), and even “come back” effects (where support reduces stress in
low stressor environments and increases it in high stressor environments). To some
degree, Kinicki, McKee, and Wade’s (1996) review of research reported in the years
1991-1995 included several studies relevant to a moderating effect of social support,
some of which offered evidence consistent with the model. In some studies, supervisor,
but not co-worker’s support was consistently associated with a significant buffering
effect, whereas, in other studies, co-workers provided a more effective stress-buffer
effects. Kahn and Byosiere concluded that social support only sometimes has buffering
effects, with the direction and extent of these effects varying with the type and source

63
of social support under research study. Conversely to above views, Dollard and
Winefield (1995) found that social support did not have a moderating effect upon
general mental health status in a sample of correctional officers, whereas Greller et al.
(1992) reported that this effect was significant in predicting psychosomatic complaints
in police officers. The reason is that Dollard and Winefield job controlled for negative
affectivity, whereas Greller at al. did not do so. Several researchers observed that the
strength of the moderating effect of support varies with the types of stressor, support
and strain under investigation. For example, Frese (1999) found that social support
moderated several interpersonal, but no impersonal, stressors. Beehr (1985) found a
conclusive result that different types of support have differential effects. Exclusively,
instrumental support was thought to have a moderating effect upon strain by reducing
the harmful effects of job stressors, whereas emotional support was thought to have two
effects - it directly reduces strain as well as moderating the stressor-strain relationship
at workplace. Conversely, LaRocco et al. (1980) suggested that the buffering role of
social support varies with the type of outcome: social support buffers the relationship
between stressors and such indicators of strain as stress, depression, somatic
complaints, but it does not have a significant buffering effect on stressor-job
satisfaction relationships. On the other hand, inconsistencies may be partially resolved
by positioning to differences in the designs used in past researches. For instance, a
smaller proportion of longitudinal studies have demonstrated moderating effects of job
factors (Dormann & Zapf, 1999). These inconsistent findings may also be due to the
operation of higher-order interaction effects. For example, several researchers (e.g.,
Daniels & Guppy, 1994; Fusilier, Ganster, & Mayes, 1987; Lefcourt et al., 1984;
Rodriguez et al., 2001) have found that the statistical significance of the moderating
effect of social support varied with scores on a measure of internal locus of control.
Significantly, for the purposes of the current research, the impact of social support has
been shown to vary with levels of personal capabilities of job control (Schaubroek &
Fink, 1998). It may be noted that other variables influence an individual’s capability to
draw out social support and to use it effectively once it is available. To resolve some of
these discrepancies, Cohen and Wills (1985) argued that social support, when
operationalised as the extent to which a person is integrated within a large social
network, has a main effect upon psychological health. On the other hand, when social,

64
support is defined in more specific functional terms, serves a moderating role. These
moderating effects are most pronounced when the type of support offered is targeted to
meet the particular needs of the workers who is experiencing stress (Beehr et al., 2003,
and Winnubst & Schabracq, 1996). Beehr et al. (2003) have argued that, in spite of the
common belief, intuitive appeal, and promise of social support as a treatment for
occupational stress, its success and the specific ways in which it might work have
remained a mystery. Clearly, the moderating effects of social support on strain are not
straightforward. According to this stress-matching theory, well-targeted and specific
types of support are of much more use to those experiencing stress than to those who
are not, and hence the beneficial effects of such support varies with worker’s needs and
circumstances. Furthermore, they predict that, because most people who are
experiencing stress would benefit from esteem and informational support, measures of
these two types of functional support are more likely to produce buffering effects than
are measures of instrumental and companionship support. In an attempt to resolve this
complex mechanism, Bradley, (2004) drawn a conclusion from the vast body of
research:
1. Social supports have been found to moderate the stressor- strain relationship in a
minority of research studies. Moderating effects for social support are found less
consistently than are main effects.
2. The nature and strength of the moderating effects depend upon the type of stressor,
the type of strain, and the investigative method selected.
3. Demographic (e.g., gender, locus of job control, age and negative affectivity)
factors, and contextual (e.g., organisational type, occupational level), variables may act
as higher-order moderators, affecting the direction and strength of the stressor-support
interaction effects.
4. At the same time as most of the researches reporting a moderating effect indicates
that support acts to weaken the stressor-strain relationship (that is, it acts as a buffer),
opposite effects are occasionally found (that is, an enhancing or reverse buffering
effect).
5. Complex past results may derive from different operationalisations of social support.
For example, the moderating effect is more likely to be demonstrated using functional,
rather than structural measures of support. Evidence indicates that buffering effects do

65
not vary greatly by source: support from superiors, colleagues, and family/friends may
all be associated with moderating effects (Frese, 1999; Buunk & Peeters, 1994).
6. The concept that type of support interacts with source of support, as well as with the
type of stressor, in a manner consistent with Cohen and Wills’s (1985) “matching”
theory. No study has investigated the strain outcomes resulting from the full range of
possible combinations of stressors, support type and support source (but see, e.g., Beehr
et al., 2003; Winnubst & Schabracq, 1996). Karasek (1979; Karasek & Theorell, 1990)
claimed that job demands and job control combine additively or interactively influence
levels of active learning and participation both at work and off-the-job. Karasek and
Theorell (1990) argued that job control and social support jointly influence strain. Even
if this prediction was expressed as an additive relationship, it is also possible that the
two job factors combine interactively, such that strain increases exponentially as both
job control and support dissolve.
The job control x support interaction hypothesis has been tested in a limited number of
past studies, and most of the evidence that is available is not consistent with the
survival of such an effect on strain. Bromet et al. (1988) pointed out that none of the
interactions between job control and co-worker support, or between job control and
friendship support, significantly predicted symptoms of affective disorders, or somatic
complaints. In another longitudinal study, Rodriguez et al. (2001) found that the
interaction term did not predict job satisfaction after controlling for baseline satisfaction
and other variables. Johnson et al. (1995) found the effects of job demands, job control
and support cross-sectionally on job satisfaction, and longitudinally on general
psychological well being, in a sample of medical practitioners. All possible two-way
interaction effects were tested after job controlling for age and gender, and none was
found significant. Similarly, Pomaki and Anagnostopolou (2001) also found non-
significant interactions between job control and support, this time on job satisfaction,
somatic symptoms and three components of burnout. Some of the studies cite evidence
of more consistent job control x support interactive effects. Johnson and Hall (1988)
examined cardiovascular disease incidence rates in a large sample of Swedish workers.
By controlling for worker’s age and job demands, they found that the interactive effect
of job control and social support was greater than the additive effect of these two job
factors. Compared with these findings, evidence for the interactive effect is limited.

66
Some research studies have, however, reported mixed results. For example, Chay
(1993) noted that the job control x support interaction predicted general mental health,
but not job satisfaction in a sample of Singaporean small business owners and
employees. Sargent and Terry (2000) found that, after job controlling for negative
affectivity, the job control x co-worker support interaction term predicted
depersonalisation in a sample of Australian 80 clerical employees. However, this was
the only significant interaction of job factors in this study. Rau et al. (2001) found that
the interaction of job control and colleague support predicted several measures of heart
rate, but not of blood pressure. McIntosh (1990) entered in standard regression
analyses, both job control (autonomy) and supervisor support, and found that both job
factors were significant predictors of job satisfaction, but only job control predicted
anxiety. In addition, subgroup analyses provided some support for an interactive effect
on anxiety.
2.8 Three-way Interactions of the Job Factors: The Job demands-Job
control-Support of Strain Bradley, (2004) recently pointed out that Karasek did not clearly propose a true three-
way interactive model of strain, that is, one in which job demands, job control and
social support contribute multiplicatively to predict strain beyond that explained by the
main effects of, and two-way interactions between, these job factors. However, some
researchers have interpreted his work as proposing such an interactive model, and
several studies have tested this model. Similarly, Johnson’s original (1986) study did
not fully test the three-way interaction hypothesis, because the independent
contributions of job demands, job control and support were not assessed prior to testing
their joint interactive effect of job factors. In reviewing research pertaining to this
effect, it should be noted that Karasek et al.’s (1982) study used an additive term and
sub-group analyses to capture the relationship between job demands, job control and
support. Therefore, this research and several more recent studies adopting a similar
approach (see, e.g., Carrere et al., 1991; Kawakami et al., 1997; Unden, 1996) do not
adequately test the interaction model. Strong support comes from just two studies
(Landsbergis et al., 1992; Parkes et al., 1994), with diverse findings in two others.
There are some facts in this literature to suggest that the theory might more consistently
hold true when somatic complaints, rather than other outcomes of strain, is the

67
criterion. Overall, the job demands x job control x support interaction effect have
received modest levels of empirical confirmation. From their review, Van der Doef and
Maes (1999) reported that facts for this interaction theory come from approximately
one third of the studies. Bradley (2004), reported that non-supportive studies more
often used (1) a longitudinal design, (2) samples comprising mainly female workers, (3)
samples of white-collar workers, (4) non-self-report measures of the job characteristics,
(5) measures of job demands and outcomes that conceptually overlapped, and (6)
additional ‘strong’ predictors that explained much of the variance in the outcome
variables.
2.9 Effects of the Personality Variables Psychological Fallacy P. Thompson and D. McHugh (2002) explain the “psychological fallacy” in their book
Work Organizations. This fallacy implies individual’s personality variables to alter
conditions for both himself/herself and for organization (Thompson & McHugh 2002).
The idea is that since the organization is made up of individuals, the organization could
be changed by changing its members (Katz & Kahn 1978).
Since 1950s, there was a great theoretical development in the field of job stress and job
redesign. Two important models from this period came from the United States;
Herzberg’s Motivation-hygiene Theory and Hackman and Oldhams (1976) Job
Characteristics Model. They were both concerned with the redesign of individual jobs,
but Hackman and Oldhams Job Characteristics Model from 1976 proved to be the most
stable one (Parker & Wall 1998). Hackman and Oldhams model focus on job
characteristics and decision lattitude. They recognized five “core job characteristics”
which transmit to the motivation and satisfaction of employees, namely, task identity,
skill variety, task significance, autonomy and feedback from the workplace (Parker &
Wall 1998). According to this model the changes in job design results in an increased
autonomy, motivation, job satisfaction and commitment. The model has, however, no
focus on workers health. One model of stress which goes beyond the individual level
approaches and account for perceived levels of control, is Karasek and Theorell’s
Demand/Control Model. This model links occupational health variables to dimensions
of demand from the situation, and the level of control; autonomy available to the
individual at the workplace (Karasek & Theorell 1990).

68
2.10 Work Motivation Theories and Active Learning through DC
Model Karasek and Töres Theorell’s define learning through their Demand-Control Model as
something that “occurs in situations that require both job demands or challenges and the
exercise of decision-making capability” (Karasek & Theorell 1990). When the workers cope
with a new stressor and the results are effective, this will be incorporated into their range of
coping strategies, and learning have occurred. With a growing range of coping strategies the
worker can assume more risk and therefore, increase performance level. Karasek and Theorell
define motivation as an “environmentally facilitated, active approach toward learning new
behaviour patterns or solving new problems” (Karasek & Theorell 1990: p.93).
Figure 2.3 The relation between demands, coping, learning, and motivation and job strain Therefore, the mechanism is positively accumulating as new coping strategies raise the
individual’s self-esteem, which raises the motivation to meet challenges, which again
leads to new coping strategies, learning, reducing the strain level
Karasek and Theorell (1990) develop the active learning theory from their Demand-
Control Model. According to them an increase in learning will occur when the
challenges in the situation are matched by the individual’s control over alternatives or
skills in dealing with challenges or job demands. This represents the second assumption
in the Demand-Control Model, where high demands are matched with high level of
control are (upper right corner in DC model). But learning will only take place in
situations that are challenging enough to be interesting, but not so demanding that
capabilities are besieged (Karasek & Theorell 1990: 171). The Demand-Control Model
Job Strain

69
predicts both learning and stress consequences from two different combinations of
demand and control, or two principles of disequilibrium, as illustrated below:
Figure 2.4 Two principles for strain and learning
The first principle is that increased capabilities allow the system to face its job demands
with less effort. In this way learning inhibits strain. The second principle is that worker
in a state of strain have little capacity to learn, so strain inhibits learning. Too high
levels of stress may inhibit learning, but on the other hand, job induced learning might
reduce the stress response through development of confidence and self-esteem (Karasek
& Theorell 1990).
Having high level of job control over the job demands will reduce an employee’s stress
level, but increase learning, while psychological demands will both increase learning
and strain. In this way the Demand-Control Model holds an asymmetrical relationship.
Workers’ passive situations can appear in many jobs and are a combination of low level
of both job demands and job control. When the acceptable range of demands is so
narrow, stressor-free periods can also lead to uneasiness and anxiety. Situations where
demands and control are low are according to Karasek and Theorell associated with
unlearning and loss of capabilities (Karasek & Theorell 1990). 2.11 The role of negative affectivity on Strain Watson & Clark, (1984) argued that negative affectivity (NA) is a disposition reflecting
pervasive individual differences in the experience of negative moods and self-concept.
Watson and Clark further concluded that high-NA individuals, as contrasted with low-
NA individuals, are more likely to experience distress and dissatisfaction, and tend to
focus on the negative side of the organization in general. Negative affectivity entails a
generalized cognitive set such that individuals with high levels of NA have a propensity
to view the organization and themselves through a negative affectivity (Clark &

70
Watson, 1991). Such individuals tend to think and act in ways that encourage negative
affective experiences across time and situations (George, 1992), and they interpret
ambiguous stimuli more negatively than do low-NA individuals (Brief et al., 1988). In
brief, NA is associated with a type of cognitive bias that includes both an affective
tendency and a cognitive style through which individuals interpret their experiences
(Levin & Stokes, 1989). Because job satisfaction contains some combination of
positive and negative affect and cognitions (Brief & Roberson, 1989), the negative
cognitive bias of high-NA individuals may explain why many studies (e.g., Brief et al.,
1988; Brief, Butcher, & Roberson, 1995; Levin & Stokes, 1989) have found that high
levels of NA are associated with lower levels of job satisfaction and high level of strain.
Bradley, (2004) argued that Karasek did not predict that negative affectivity (NA) in his
research study would impact upon job strain or activity/participation. He further stated
that negative affectivity is not given a central role as an antecedent of job strain in the
analyses performed in the current research. But, however, Karasek proposed that
accumulated anxiety, as being similar to negative affectivity, was a potential outcome
of work environment. Payne (1988) conducted cross-sectional and longitudinal study
and found a correlations in excess of .50 between NA and strain, and suggested that
“many of the people indicating signs of stress symptoms are doing so, not because they
are suffering increases in their stress levels, but because of the disposition to experience
the world as a threatening place” (p. 21). Payne also found the relationship between NA
and perceptions of job demands, and noted that this relationship was nonetheless
substantial as that between NA and strain.
Many research studies together with supporting evidence suggesting that NA has a
direct effect on real stressors: that is people with high levels of NA encounter more
stressful work environments. Spector, Zapf, Chen, and Frese (2000) distinguish
between two versions of this explanation: (a) the tendency for NA to influence self-
selection into more stressful jobs and (b) its effects on the creation or performance of
adverse circumstances within these jobs; a direct effect on perceived stressors: people
with high NA perceive their work environments as more stressful (Bolger & Schilling,
1991; Bolger & Zuckerman, 1995; Dollard & Winefield, 1995; Fontana & Abouserie,
1993; Gunthert, Cohen, & Armeli, 1998; Iverson et al., 1998); a direct effect on
objective strain: regardless of real stressor levels, high NA people actually experience

71
more strain (Booth-Kewley, 1987). Iverson et al., (1998) argued that a mediating effect
between stressors and objective or subjective strain: at any given level of real stressors,
high NA people perceive the environment as more stressful, and consequently
experience more strain. Parkes’ (1990) suggested that the interaction between job
demands and NA as a determinant of job stress is consistent with the concept of NA as
an index of vulnerability to environmental cues, an idea originally presented by
Spielberger, Gorsuch, and Lushene (1970). Moyle (1995) examined alternative models
of NA in the stressor-strain relationship. One of the models tested was the interactive
effect of NA and environmental stressors on well-being. Moyle found interactive
effects of workload and control opportunities with NA on well-being. Consistent with
the temperamental view of personality discussed earlier, she concluded that NA was
vulnerability factor because high fluctuations in workload and few control opportunities
were associated with higher reports of health symptoms for those high in NA. Burke,
George, Robinson, and Webster (1988) argued that partialling out the effects of NA
substantially reduces stressor-strain correlations. Some other researchers (e.g., Burke,
Brief, & George, 1993; Heinisch & Jex, 1998) has provided additional evidence of the
role of NA as an antecedent variable that affects subjective measures of predictors and
criterion variables alike. They claims that NA primarily has a confusing, rather than a
substantive, influence upon the stress system have, however, been challenged to
researchers.
Spector et al. (2000) refer to this as the “hyper-responsivity mechanism”; a moderating
effect on stressor-subjective strain relationships claiming that NA changes people’s
perceptions of the extent to which stressors produce strain.
Watson and Pennebaker (1989) argued that correlations between NA and health
complaints are at least partly explained in terms of a set of perceptual and reporting
biases that characterize high NA people. These people tend to dwell on the negative
side of life, they are “introspective, apprehensive, negativistic and vigilant” (p. 234),
and are thus more likely to report exposure to stressors, high levels of stress
experiences and high levels of ill-health. Bradley, (2004) reported that NA may be
studied as a dependent variable, or outcome of real stressors or strain. Therefore, levels
of NA may increase over time because workers encounter stressful conditions and they
experience considerable strain. Mutual influences may also exist, with NA both

72
affecting, and being affected by, stressors and strain. Friedman and Booth-Kewley
(1987) reported comprehensive analysis results showing levels of characteristic anxiety
to be more consistently associated with several stress-related diseases (including
headaches, asthma, and ulcers) than were positive personality variables. Williams,
Gavin, and Williams (1996) argued that the reduced correlations between substantive
variables resulting from partialling out NA were due to high job control, rather than to a
biasing effect. This is because partial correlations effectively job control for variance
shared not only by NA and the substantive variables of interest, but also that shared by
other factors. Watson and Pennebaker’s (1989) claimed that correlations between
stressors and criterion variables (e.g., somatic complaints) are overstated because NA
acts as an (antecedent) influence on both sets of variables. To overcome this annoyance
factor, researchers were urged either to measure stressors or strain (or both) through
objective means, or to job control for the impact of NA upon strain. Most studies that
consider the effects of NA present a somewhat dim outlook for individuals possessing
high NA, including the likelihood of experiencing more frequent episodes of stress and
frustration thereby moderating the relationship between stressor and strain, lower
organizational commitment levels (Cropanzano, James, & Konovsky, 1993), and lower
levels of job satisfaction (Brief, George, Robinson, & Webster, 1988; Levin & Stokes,
1989). Attitudes sum up people’s feelings and beliefs about the nature of their jobs
(George & Jones, 1996), but are high-NA individuals destined to experience low levels
of job satisfaction in every job, simply because of their predispositions? More recently,
George (1992) proposed that “it may be that personality and situational factors, in
addition to having main effects, also interact to determine levels of job satisfaction” (p.
189). Specifically, the study reported here examines the interaction of NA with job
characteristics in determining employee job satisfaction. Bradley, (2004) demonstrated
four effects of NA on worker’s stress level. First, high levels of NA tend to influence
workers to experience stress and to be ill-health. Second, NA develops a typical
perceptions and reports of the negative state including stressor exposure, stress levels
and somatic complaints. This bias influences effect the measurement of both the
predictor (stressor) and criterion (strain) variables, it contributes to high correlations
between these variables. Third, NA moderates the relationships between elements in the
stress chain, causing employees to differ in their appraisals and coping choices, and in

73
the effectiveness of their level of locus of control. Fourth, it has an indirect effect,
influencing strain outcomes through job choice, stressor exposure, perceived job
control, and other variables. 2.12 Locus of Job control and Mastery Originally developed within the framework of Rotter's (1954) social learning theory,
the locus of control construct refers to the degree to which an individual believes the
occurrence of reinforcements is contingent on his or her own behavior. The factors
involved with reinforcement expectancy are labeled "external" and "internal" control.
In short, internal locus of control refers to the perception of positive or negative events
as being a consequence of one's own actions and thereby under one's own personal
control. In contrast, external locus of control refers to the perception of positive or
negative events as being unrelated to one's own behavior in certain situations and
thereby beyond personal control. As a general principle, the locus of control variable
may be thought of as affecting behavior as a function of expectancy and reinforcement
within a specific situation (Carlise-Frank, 1991). One basic question yet to be answered
by the job strain model "relates to the issue of objective versus subjective control.
Clearly, the job strain model considers control as an objective characteristic of the work
situation. However, cognitive and affective responses of the workers to these
characteristics vary considerably according to their individual patterns of appraisal and
coping (Lazarus and Folkman, 1984). Generalized control beliefs have been found to
moderate the effects of objective job conditions on well-being (Spector, 1987).
Furthermore, through regression analysis, Hendrix (1989) found locus of control to be a
statistically significant predictor of job stress (Beta=.39; p<.001). These findings call
for a conceptual clarification of the relationship between control-limiting job conditions
and those personal characteristics (locus of control) which influence the perception of
control (Siegrist et al., 1990). One possible relationship is interaction between job
conditions and personality characteristics. Parkes (1991) found a significant three-way
interaction between job demands, job decision latitude, and Paulhus' locus of control
scale, in predicting affective distress and anxiety. For externals, demands and decision
latitude combined intractively to predict outcome (consistent with Karasek's model),
whereas for internals, additive findings (main effects for demands and latitude) were
obtained (Rahim, 1997 p. 160). The present study collected data from a random sample

74
of managers. The moderating effects of locus of control and social support were tested
with stepwise hierarchical multiple regression analyses with interaction terms (Cohen
& Cohen, 1983). The following figure shows main effects investigated were of stress to
strain; of locus of control and social support to stress and strain; and of stress, locus of
control, social support, and strain to propensity to leave a job. The study also tested the
moderating or interaction effects of locus of control and social support on the
correlation between stress and strain (M. Afzalur-Rahim, 1997, p. 160). A Model of
Stress, Strain, Locus of Control, Social Support, and propensity to leave a Job
Two variables that have been empirically identified as potentially important moderators
of the stress-strain relationship are personality characteristics and social support. Locus
of control personality refers to the extent to which individuals believe that they can
control events affecting them (Rotter, 1966). Individuals who have a high internal locus
of control believe that the events in their lives are generally the result of their own
behavior and actions. Individuals who have a high external locus of control, on the
other hand, believe that events in their lives are generally determined by chance, fate, or
other people. Cummins (1988), Kobasa (1979), and Kobasa, Maddi, and Kahn (1982)
found support for the hypothesis that locus of control personality disposition moderates
the stress-strain relationship. In other words, locus of control is hypothesized to interact
with stress such that the correlation between stress and strain is significantly higher for
an externalizer than an internalizer. However, an extensive review of stress literature by
Cohen and Edwards (1989) suggested little convincing evidence for personality factors
operating as stress buffers. "Only in the case of generalized internal locus of control
they felt which has sufficient evidence to make even a tentative conclusion consistent
with stress buffering" (p. 236-237). Evidence also indicates that locus of control

75
personality may also have a main effect on stress (Kobasa, Maddi, & Courington, 1981;
Kobasa et al., 1982). This indicates that internals perceive less stress than externals.
Although this relationship is generally accepted in psychological research, it should be
recognized that there are other studies which suggest that stress tends to erode feelings
of control (e.g., Pearlin, Menaghan, Lieberman, & Mullin, 1981). 2.13 The Person-Environmental Model Person-Environment fit (PE) theory offers a framework for assessing and predicting
how characteristics of the employee and the work environment jointly determine
worker well-being and, in the light of this knowledge, how this model identifies the
level of psychological strain and physical illness. Several PE fit formulations have been
proposed, the most widely known ones being those of Dawis and Lofquist (1984);
French, Rodgers and Cobb (1974); Levi (1972); McGrath (1976); and Pervin (1967).
Robert D. Caplan, (1974) demonstrated that the perspectives of the employee's needs
(needs-supplies fit) as well as the job-environment's demands (demands-abilities fit).
The term needs-supplies fit refer to the degree to which employee needs, such as the
need to use skills and abilities, are met by the work environment's supplies and
opportunities to satisfy those needs. Demands-abilities fit refer to the degree to which
the job's demands are met by the employee's skills and abilities. These two types of fit
can overlap. For example, work overload may leave the employer's demands unmet as
well as threaten the employee's need to satisfy others.
2.13.1 Conceptualizing Person (P) and Environment (E) Characteristics of the person (P) include needs as well as abilities to meet job demands.
Characteristics of the environment (E) include supplies and opportunities for meeting
the employee's needs as well as demands which are made on the employee's abilities. In
order to assess the degree to which P equals (or fits), exceeds, or is less than E, the
theory requires that P and E be measured along commensurate dimensions. Ideally, P
and E should be measured on equal interval scales with true zero points. For example,
one could assess PE fit on workload for a data-entry operator in terms of both the
number of data-entry keystrokes per minute demanded by the job (E) and the
employee's keystroke speed (P). As a less ideal alternative, investigators often use
Likert type scales. For example, one could assess how much the employee wants to
control the work pace (P) and how much control is provided by the job's technology (E)

76
by using a rating scale, where a value of 1 corresponds to no control, or almost no
control and a value of 5 corresponds to complete control. Robert D. Caplan, (1974)
suggested that subjective fit refers to the employee's perceptions of P and E, whereas
objective fit refers to assessments, free of subjective bias and error. In practice, there is
always measurement error, so that it is impossible to construct truly objective measures.
Given the challenges of objective measurement, most tests of PE fit theory have used
only subjective measures of P and E (for an exception, see Chatman, 1991). Accuracy of perception
s
Accuracy of perception = Main effect = Potential job edditive and interactive (contribution by P& E)
Source: French Rogers Cobb 1974 adopted from 1973
The above diagram depicts objective fit influencing subjective fit which, in turn, has
direct effects on well-being. Well-being is broken down into responses called strains,
which serve as risk factors for subsequent illness. These strains can involve emotional
(e.g., depression, anxiety), physiological (e.g., serum cholesterol, blood pressure),
cognitive (e.g., low self-evaluation, attributions of blame to self or others), as well as
behavioural responses (e.g., aggression, changes in lifestyle, drug and alcohol use).
Taylor (1991) search out that those inaccurate employee perceptions can arise from two
sources. One source is the organization, which, unintentionally or by design (Schlenker
1980), may provide the employee with inadequate information regarding the
environment and the employee. The other source is the employee. The employee might
fail to access available information or might defensively distort objective information
about what the job requires or about his or her abilities and needs. French, Rodgers and
Cobb (1974) use the concept of defenses to refer to employee processes for distorting
the components of subjective fit, without changing the commensurate components of
Objective environment
Objective PE fit
Objective person
Strain
Emotional Psychological Cognitive Behavioral
Subjective person
Subjective PE fit
Subjective environment
Coping by -person -org
Defense by -person -org
Illness Mental Physical

77
objective fit, . By extension, the organization can also engage in defensive processes -
for example, cover-ups, denial or exaggeration - aimed at modifying employee
perceptions of subjective fit without concomitantly modifying objective fit. A variety of
different approaches to the measurement of PE fit demonstrate the model's potential for
predicting well-being and performance. For example, careful statistical modelling
found that PE fit explained about 6% more variance in job satisfaction than was
explained by measures of P or E alone (Edwards & Harrison 1993). In a series of seven
studies of accountants measuring PE fit using a card-sort method, high-performers had
higher correlations between P and E (average r = 0.47) than low performers (average r
= 0.26; Caldwell and O'Reilly 1990). P was assessed as the employee's knowledge,
skills and abilities (KSAs), and E was assessed as the commensurate KSAs required by
the job. Poor PE fit between the accountant's values and the firm's also served to predict
employee turnover (Chatman 1991).
2.14 Karasek & Theorell, (1990) dynamic person-environment model-
The Effort-Reward Imbalance (ERI) Model
Model description The ERI Model has its origins in medical sociology and emphasizes both the effort and
the reward structure of work (Marmot, Siegrist, Theorell, & Feeney, 1999). The model
is based on the premise that work-related benefits depend on a reciprocal relationship
between efforts and rewards at work. Siegrist (1996) defines efforts as job demands
and/or obligations that are imposed on the employee. Occupational rewards distributed
by the employer include money, esteem, and job security or career opportunities
(Siegrist, 1996). In addition, it is assumed that this process will be intensified by
overcommitment (a personality characteristic), such that highly overcommitted
employees will respond with more strain reactions to an effort-reward imbalance, in
comparison with less overcommitted employees. Because the ERI Model has evolved
considerably over time, a more detailed historical overview of the most relevant
developments leading to the model in its current form will be provided. According to
Siegrist et al. (1986) this imbalance may lead to a state of “active distress” by evoking
strong negative emotions, which in turn activate two psychological stress axes, namely
the sympathetic-adrenomedullary and the pituitary-adrenal-cortical systems (Henry &
Stephens, 1977). In the long run, sustained activation of the autonomic nervous system

78
may contribute to the development of physical (e.g., cardiovascular) diseases as well as
mental diseases (e.g., depression, see also Weiner, 1992). In its early years, the ERI
Model was primarily used to investigate cardiovascular outcomes. It was not until 1998
that the model was applied to other psychological and behavioral outcomes as well.
Appels’ work (1991) can be viewed as a pioneer in linking ERI (i.e., high effort and
low reward) to psychological outcomes such as vital exhaustion (Appels, Siegrist, & de
Vos, 1997). Implicitly, the ERI Model can also be considered as an account of
psychological well-being, as ERI evokes strong negative emotions, which are related to
impaired well-being ( Gaillard & Wientjes, 1994). Furthermore, it has been argued that
the model can be applied to addictive behavior as well. Blum and colleagues (1996)
stated that prolonged stress leads to dysfunction or disruption of the mesolimbic
dopamine system, which in turn stimulates addictive behavior. Natasja van Vegchel,
(2005) stated that it is widely assumed that workers will not passively remain in a high
effort – low reward imbalance situation, but that they will instead try cognitively and
behaviorally to reduce their efforts and/or maximize their rewards (as for example in
the cognitive theory of emotion (Lazarus, 1991) and the expectancy theory of
motivation (Schönpflug & Batman, 1989)). These suggest that effort-reward imbalance
might not influence health over a longer period. 2.14.1 Conceptualization of job demands in DC model and ERI model Broadly speaking, job demands refer to the degree to which the work environment
contains stimuli that require effort (Jones & Fletcher, 1996). This mean, job demands
can be seen as the requirements that are placed on the employee by the job. Natasja van
Vegchel, (2005) stated that balance models such as the DC model and the ERI model
assumed that job demands are not harmful in themselves. Depending on the level and
type of job resources, job demands can be experienced as either positive (i.e.,
stimulating or challenging or eustress) or negative (i.e., stress). Natasja van Vegchel,
(2005) further suggested the conceptualization of job demands and effort; as “demands”
as denoted in the DC Model, or as “effort” as denoted in the ERI Model. In the present
study, it is acknowledged that perceived effort that is put into a job can be seen as a
characteristic of the job (i.e., a job demands) and as a characteristic of the employee
(i.e., his or her intrinsic effort). This is consistent with the ERI Model, which divides
effort into an extrinsic (i.e., situational) and an intrinsic (i.e., personal) component

79
(Siegrist, 1996). Initially, extrinsic effort referred to the obligations, requirements, and
duties of the job, whereas intrinsic effort referred to a personality characteristic, like
locus of control which resembles the Type A behavioral pattern. Over the past decades,
the nature of job demands has changed considerably as a consequence of the changing
nature of work. There has been a shift from “hand to head”, or from physical demands
to psychological demands (e.g., Howard, 1995). One can also note that there has been a
similar shift from “hand to heart”, or from physical demands to psychological demands
(e.g., Dormann & Zapf, 2004). Job demands are divided into three categories i. e.,
physical (affect the musculo-skeletal system), mental (information processing, such as
memory and planning) and emotional (related to interpersonal relationships) as they
influence different aspects of human functioning (Hockey, 2000). Physical demands are
more essential for construction workers (Janssen, Bakker, & de Jong, 2001), whereas
emotional demands are more prevalent in human service work (de Jonge, Dollard,
Dormann, Le Blanc, & Houtman, 2000; de Jonge, Mulder, & Nijhuis, 1999; Söderfeldt
et al., 1997). Particularly in human service organizations, there are mental, physical,
and emotional demands due to the nature of particular jobs (e.g., de Jonge, Mulder et
al., 1999). For instance, nurses work under time pressure (mental demands), have to lift
clients (physical demands), and have to handle unfriendly clients (emotional demands).
As the DC model only examines mental demands, the model appears to oversimplify
demands in particular job categories such as human service work (Söderfeldt et al.,
1997). Moreover, various authors have argued that the demands measure in the Job
Content Questionnaire (Karasek, 1985) does not specifically reflect mental demands, as
it also includes other types of job characteristics such as job complexity and lack of
control (e.g., de Jonge & Kompier, 1997; Ganster, 1995). As such, the scale seems to
encompass more than the construct. For this reason it might be fruitful to amend the DC
Model by creating a more specific mental demands measure, and by adding measures
of emotional and physical demands. The first studies that operationalized the DC model
with different types of demands showed promising results. For instance, De Jonge and
colleagues (2000; 1999) found significant interaction effects when different types of
demands (e.g., mental, emotional, and physical demands) were incorporated into the
DC model. In a similar vein, Söderfeldt and associates (1997) as well as Van Vegchel
and colleagues (2004) demonstrated the importance of including quantitative as well as

80
emotional demands in the DC model for explaining outcomes in human service
workers.
Both ERI model and DC model use one broad demand measure, encompassing mental
demands and one optional item tapping physical demands (Natasja van Vegchel, 2005).
Empirical studies comparing different types of job demands have shown that an ERI
including mental demands accounted for elevated risks in the domains of exhaustion
and psychosomatic symptoms, whereas an ERI with physical demands accounted for
elevated risk of low job satisfaction (van Vegchel, de Jonge, Meijer, & Hamers, 2001;
de Jonge, Bosma, Peter, & Siegrist, 2000;). Empirical evidence suggests that it is useful
to distinguish between mental and physical demands (; van Vegchel et al., 2001; de
Jonge, Bosma et al., 2000), and that extending the model to include emotional demands
may be important in the case of particular occupational groups like human service
employees (van Vegchel et al., 2001; de Jonge & Hamers, 2000). Natasja van Vegchel,
(2005) stated that both the DC model and the ERI model use a general demands
measure, encompassing several aspects. If demands-resource interactions are to be
detected, a certain amount of specificity may be required (e.g., van der Doef & Maes,
1999; Cohen & Wills, 1985). For instance, depending on the particular occupation
under study, some types of job demands may be important, whereas others are not
(Terry & Jimmieson, 1999). On the other hand, job control is also essential for
employee well-being (Sauter, 1989). The idea that job control affects health and
productivity is closely linked to job strain outcomes. Almost a half a century ago,
White (1959) stated in his article that workers have a basic intrinsic need to control
their environment to do job effectively. In a similar vein, it has been argued that the
effort for control results from the belief that control ensures positive outcomes (Rodin,
Rennert, & Solomon, 1980), or at least minimizes the maximum danger (Miller, 1979).
In this machanism, control can be broadly defined as the ability or capability to cope
over one’s work environment so that the work environment becomes more rewarding or
less threatening (Ganster, 1989, p. 3). Moreover, control can be regarded both as a
characteristic of the work environment and as a personal characteristic (Jones &
Fletcher, 2003). Interestingly, in models of work stress – like the DC model – control is
usually treated as a characteristic of the work environment. The main theory of the DC
model, that job control moderates the potentially negative effects of high job demands,

81
is consistent with the literature on control in two ways (e.g., Terry & Jimmieson, 1999;
Wall et al., 1996). Firstly, control has been identified as a factor which moderates the
effects of a wide range of stressors such as a demanding job (e.g., Steptoe & Appels,
1989), similar to the stress-buffering theory (Cohen & Wills, 1985). And secondly,
similar to Miller’s (1979) minimax hypothesis, control is seen as a mechanism through
which the potentially detrimental effects of increased demands can be reduced, because
control enables the person to adjust demands to his or her current needs and
circumstances (e.g., Karasek & Theorell, 1990; Terry & Jimmieson, 1999). Job
decision latitude in the DC model has been defined as “the working individual’s
potential control over his tasks and his conduct during the working day” (Karasek,
1979, p. 289-299). This statement becomes mirrors the construct of job control as
commonly used in the job redesign literature, as it is very similar to job autonomy
(Ganster & Fusilier, 1989). While the theoretical literature on the DC model equates job
decision latitude with job control, the operationalization of decision latitude makes
clear differences (e.g., Wall et al., 1996). The measure of decision latitude includes not
only items referring to job control, but also items tapping skill level, variety, creativity,
and learning new things (e.g., “My job requires me to be creative”; “My job requires a
high level of skill”). So it seems that the decision latitude measure taps both job control
and job complexity/skill utilization (e.g., Ganster & Fusilier, 1989). Karasek (1989)
acknowledged this difference by stating that decision latitude is composed of two more
specific i. e., decision authority and skill discretion. Whereas decision authority directly
influences the employee’s sense of control, skill discretion is preceded by the
acquisition, over the long term, of skills needed to cope over the work process.
Although from a broader perspective both decision authority and skill discretion gives
the employees the opportunity to cope their job (i.e., decision latitude). 2.14.2 DC Model and ERI Model: Similarities and Differences In the literature, differences as well as similarities between the DC Model and the ERI
Model have been noted (e.g., Karasek, Siegrist, & Theorell, 1998; Siegrist, 2001). The
most important differences will be briefly enumerated. Firstly, the DC model puts its
explicit focus on situational characteristics of the psychosocial work environment; the
ERI model includes both situational characteristics and personal characteristics.
Secondly, the DC model provides a broader approach to health outcomes, as the model

82
includes a strain dimension related to health and a learning dimension related to
personal growth and development. In this regard, the ERI model is more narrowly
focused on the determinants of health and well-being (e.g., cardiovascular disease).
Thirdly, the DC model’s major focus is on task characteristics of the workplace,
whereas some components of the ERI model (such as salary, job security, and career
opportunities) link stressful experiences at workplace. Finally, in stress-theoretical
terms the DC model is rooted in the stress-theoretical paradigm of personal control;
namely, the range of control over one’s work situation is the core dimension. The ERI
model fits in better with a stress-theoretical paradigm of social reward that emphasizes
threats to or violations of legitimate reward based on social reciprocity. The main
characteristics of the DC Model and the ERI Model are summarized below:
Table 2.4 Summary of main characteristics of DC model and ERI
model
Note: From “Job demands, decision latitude and mental strain: comparison of DC model and ERI model,” by Graham Bradley (2004).

83
Figure 2.5 Karasek job demand-control model. Note: From “Job demands, decision latitude and mental strain: implications for job redesign,” by R. Karasek (1979).
Administrative Science Quarterly, 24, p. 288. Copyright 1979 by Administrative Science Quarterly.Siegrist (1996)
define efforts as job demands and/or obligations that are imposed on the employee. Occupational rewards distributed
by the employer include money, esteem, and job security or career opportunities (Siegrist, 1996).
Therefore, this does not alter the fact that the DC Model and the ERI Model share some
common features as well. Actually, some recent studies focus on similarities of these
two models (e.g., Calnan, Wainwright, & Almond, 2000; Peter et al., 2002). In a wider
work stress perspective, it could be argued that the foundation of both models is an
interaction between job demands that are placed upon the employee (e.g., psychological
job demands in Karasek’s terms and job-related effort in Siegrist’s terms), and on the
other hand, job-related resources (such as job control and occupational rewards) to cope
with such requirements (Natasja van Vegchel, 2005). In brief, both models can be seen
as balance or compensation models, in which job demands are generally defined as
those aspects of the job which require additional/sustained physical, mental, or
emotional effort (de Jonge & Dormann, 2003). They can be positive in the right
circumstances, but can also draw out negative emotional reactions (Warr, 1987). Job
resources can be described as those factors of the job which can lead to (a) buffering of
job demands, (b) achievement of personal and/or work goals, and (c) stimulation of
personal growth and development (Demerouti, Bakker, Nachreiner, & Schaufeli, 2001;
Job Demands Unresolved Low High Strain A Job Decision B Activity
Level
Passive Job
Active Job Low Strain Job
High Strain Job
Low
High

84
Karasek, 1979). In the prediction of strain, the role of job resources in the buffering of
job demands is of special importance (Natasja van Vegchel, 2005).
2.15 Criticism on Demands Control Support Model (DCSM) The description and methodology of the DCS Model have been commented on in the
last few years (Jones & Fletcher, 1996; Kasl, 1996; De Jonge, 1995; Warr, 1994). In
fact, the designers of the model have considered several of these issues as well
(Theorell & Karasek, 1996; Karasek & Theorell, 1990; Karasek, 1989). The following
were the most important criticisms from a work psychological point of view concern:
1-Conceptualization and Operationalization of Job Demands & Job
Control Karasek (1979, 1985) has tried to derive both concepts from existing questionnaires
(JCQ) and subsequently to select the final items by means of factor and reliability
analyses. Karasek conceptualization and operationalization of the psychological
demands as well as the decision latitude was much criticized (Ganster, 1989; De Jonge,
Janssen, & Van Breukelen, 1996; Kasl, 1989, Perrewe & Ganster, 1989; Southwood,
1978). Some authors are of the opinion that the respective scales do not specifically
reflect the psychological demands or decision latitude involved in the constructs
(Ganster, 1989, 1995; Frese, 1989).The operationalization of the decision latitude not
only reflects job autonomy but also the complexity of the task or work activity.
Actually, decision latitude can also be a source of stress, which is not in line with the
assumptions of the model. An item such as "Is your work hectic?" can be interpreted by
assembly line workers as referring to the pace set by the machines but also to the
impossibility to take a break (Kasl, 1996). This conceptual and operational
interrelationship of the two job characteristics makes it difficult to distinguish clearly
which of the two job characteristics contributes to differences in the health and
performance of the employees.
On the other hand, point of attention is the possible multifaceted and hierarchical nature
of both job decision latitude and job demands (Jones & Fletcher, 1996; De Jonge et al.,
1996; Soderfeldt et al., 1996; De Jonge, 1995). These possibilities of decision latitude
are not profoundly investigated so far in previous researches. The specific facets of
decision latitude (like work method, work scheduling, or work goals) or different

85
hierarchical levels (individual, group, department, organization) should be identified
clearly. In addition, there are also special emotional demands due to the nature of
particular jobs like personality traits. Finally, it is quite remarkable that, despite a
number of competent initiatives in this direction based on factor and reliability analysis
and criterion validity (Karasek & Theorell, 1990), thorough psychometric research into
the internal validity of the scales is lacking so far.
2- Concept of the Active-Passive Hypothesis The second hypothesis, also called the active-passive hypothesis, has received little
attention in the DCS literature and has hardly been examined due to complex
personality traits. To our knowledge, only four published studies provide some
evidence for the active-passive dimension of the DCS Model (Karasek, 1981;
Landsbergis, Friedman, & Pickering, 1992; Meijman, Lumens, & Herber, 1996;
Bradley, 2004). One study of Swedish workers whose jobs became more "active" (high
demand-high latitude) over 6 years reported more participation in political and leisure
activities as compared to "passive" (low demand-low latitude) workers (Karasek, 1981).
A study by Landsbergis et al. (1992) reported that active workers showed the highest
level of job involvement and positive attributional style. The authors explained these
results by differences in hygienic behavior at work (e.g., use of protective equipment).
One possible reason for the lack of attention for the active-passive hypothesis may be
that most of the interest for the model originated in the epidemiological field, with
CVDs as the main strains (Kristensen, 1995).
3-Interactive Effects of Job Factors The interaction between the various job characteristics is central in the model (Karasek
& Theorell, 1990). With respect to this two questions may be asked: (1) what is the
nature of this interaction? and (2) what is the empirical evidence for this interaction?
Peculiarly enough, the nature of the interaction has never been worked out completely.
Karasek (1979) acknowledges that it is difficult to specify the exact mathematical
relationship between these variables, and at several points (Karasek and Theorell, 1989,
p. 144), they assert that the existence or otherwise of a multiplicative interactive
relationship is not the primary issue. However, their attempt to combine demands and
control appear confused and contradictory. Their core models, as illustrated in the four-
quadrant diagram, indicates that strain is maximized when demands are high and

86
control is low. Strain is predicted to be minimal under conditions of low demands/high
control, and to be intermediate when levels of demands and control are equivalent.
According to Kasl (1996), the interactive effect in the DCS approach can, however, be
explained in two ways: (a) decision latitude and social support function as moderator
variables in the sense that much decision latitude or much social support reduces the
negative effect that the psychological demands have on the health of the workers
concerned; (b) it is a matter of synergism: little decision latitude and little support as
well as high psychological demands have a negative result on health, but their mutual
combination results in a heightened effect (which is larger than the sum of the
individual effects). Their presupposed interactive effects of psychological demands,
decision latitude and social support are not found very often (Bradley, 2004;
Kristensen, 1995; Schnall et al., 1994). When they are found, they have often proved to
be statistically weak or not of the predicted form, and usually do not go in the direction
presupposed by the model. That is, job strain increases with the surplus of job demands
over job decision latitude. An alternative, more traditional, procedure has been to
compute a multiplicative interaction term (demands X latitude) controlling for main
effects of demands and latitude were not found satisfactory (Aiken & West, 1991).
They (Karasek and Theorell, 1989, p. 144) concluded that the demand-control
interaction is consistent and robust across mathematical formulations of this risk factor,
at least on systolic blood pressure. Additionally, research has shown so far that the
relative excess term and the multiplicative interaction term lead to nearly the same
results (De Jonge & Landeweerd, 1993; Payne & Fletcher, 1983; Sauter, 1989; Schnall
et al., 1994). The second aspect concerns the possible existence of nonlinear
relationships. A few authors suggest that the non-existence of interactive effects might
be caused by the existence of curvilinear effects for one of the job characteristics or
personality traits (Lubinski & Humphreys, 1990; Warr, 1990). For example, Warr
(1990) did find curvilinear effects of psychological demands and decision latitude with
respect to various outcome variables, but no interactive effects. The third and last
aspect regarding inconsistent interactive effects is the existence of moderator variables
that can obscure the interactive relationships between psychosocial job characteristics
and health (for some evidence, see "personality characteristics" above). Taken together,
the phenomenon of "interaction" is not clearly defined in the model. Additionally,

87
research has provided very little evidence for an interaction effect of demands, latitude,
and support on physical and mental health. Furthermore, it has become clear that
several methodological aspects can have an influence on whether or not interactive
effects are found. In another place, Karasek (1997) suggested that the use of a
multiplicative formula is “too restrictive a test for most sample sizes” (p. 34.7). Finally,
in other papers (e.g., Karasek et al., 1987), he examined the independent predictive
power of demands and control, without attempting to combine the job factors at all. In
addition, the relationship between demands and control has been inadequately
specified, resulting in a diverse range of operationalisations and an inconsistent set of
empirical findings. 4-Personality Characteristics of Workers The theory is criticized for failing to incorporate a range of broader, structural
personality variables. According to Bradley (2004), Karasek’s theory has its
assumption equal personality traits social psychology, such that it focuses only upon
“the interaction between the individual worker and his/her immediate environment and
is unable to explain how locus of control and self mastery buffer the individual
relationship. One of the assumptions of the JDCS Model is that certain job
characteristics determine health and well-being of the larger part of the task performers.
Individual differences between people, such as personality characteristics, are not
considered very important for the effect of the job characteristics. Whether this
assumption is correct, however, remains to be seen (Schnall et al., 1994; Siegrist,
1996). More and more empirical studies reveal that whether interactive effects between
psychological demands and decision latitude are found or not, may actually depend on
the lack or existence of certain personality characteristics in the task performers, such
as coping behavior, locus of control, and type A/B behavior (for an overview, see Jones
& Fletcher, 1996). For example, the interactive effect of psychological demands and
decision latitude on the burnout component "emotional exhaustion" proved only to exist
if workers dealt with their problems actively. For workers who are high in active
coping, high levels of decision latitude seem to attenuate the increase in emotional
exhaustion due to job demands. Parkes (1991) showed that the relationship between the
"high demands-low latitude" combination and health complaints only existed if workers
had the idea that they had no influence on what happened to them (i.e., external locus of

88
control). In a longitudinal study by Daniels and Guppy (1994), a similar effect of locus
of control was found with regard to affective wellbeing. The negative effect of
psychological demands on well-being was especially reduced by the decision latitude if
the workers had an internal locus of control. Landsbergis et al. (1992) found differences
in personality traits in the four quadrants of the JDC Model. For example, type ‘A’
persons were found particularly in active work situations, while employees with an
extreme locus of control had predominantly passive jobs. Finally, Weidner (1993)
discovered that the interactive effect of psychological demands and decision latitude on
diastolic blood pressure was solely present in type B persons. For type ‘A’ persons, no
differences were found between various combinations of psychological demands and
decision latitude. The results of these studies seem to indicate that high psychological
demands and little decision latitude have negative effects on the health of all workers,
although these may be more severe for some and less severe for others, depending on
the personality characteristics of the task performers in question. Essentially, Karasek
has proposed not one, but at least three models, and there has been little attempt to
integrate these (Johnson & Hall, 1988). None of Karasek’s models link social support
to the two broad personality dimensions of accumulated anxiety and sense of mastery,
and even the link between job demands and social support is poorly articulated. 5-Curvilinearity of Job Factors Warr (1990, 1994) brought the assumption of linear relationships in the JDCS Model
up for discussion by postulating curvilinear relationships between job characteristics
and employee health, with optimal levels at the middle of the range. In addition, the
presence or absence of curvilinear relationships may also be a good (statistical) reason
whether or not fake interactive effects were found in JDCS studies (Lubinski &
Humphreys, 1990). To explain such a curvilinear pattern, Warr postulates that not only
too little decision latitude, but also too much of it can lead to strain. Too much control
is after all disadvantageous, because it can involve complex decision-making and much
responsibility. Various studies have provided evidence for these types of relationships
(De Jonge & Schaufeli, Warr, 1990; Van Veldhoven, 1996). Most particularly Warr's
own study among nearly 1800 employees confirmed the postulated curvilinear
relationships (Warr, 1990). Warr (1990) found significant curvilinear relationships
between job demands on the one hand, and job satisfaction, job-related anxiety, and

89
job-related depression on the other. Regarding decision latitude, a curvilinear
association was shown with job dissatisfaction.
6- Lack of an Integrative Framework The overly simplistic nature of the theory was partially rebutted by Karasek and
Theorell’s presentation in 1990 of additional models that more fully dealt with the
contributions to job strain played by social support, personality variables, mediating
physiological processes, and other stressors such as job insecurity and physical job
demands. Development of these additional dimensions to the theory provided grounds
for a third major area of concern, namely, the lack of an overarching framework that
includes all of Karasek’s smaller models and theoretical statements (Bradley, 2004).
7-Simplicity of JDCSM The model is not sufficiently wide-ranging; it contains too few predictor, moderating
and mediating variables. The model in its original form proposes that a wide range of
personal (and organisational) outcomes are attributable to just two psychosocial
dimensions of the work environment. Despite the more recent addition of a third
dimension, social support, the theory is still subjected to criticism on the grounds.
Furthermore, the strength of the Model, that is the presupposed (interactive) effect of
three characteristics of the work situation, is at the same time also its weakness. In
addition to these three job characteristics, other individuality also seems to be important
predictors of differences in work environment. At a later stage, for example, the
variables "physical exertion," "job insecurity “and” physical risk factors" (noise,
climate, hazardous substances) were added to the model as potential stressors (see
Karasek & Theorell, 1990). For instance, research has revealed that high physical
exertion also involves more physical and/or mental health complaints and more
dissatisfaction with the job (Bongers et al., 1993; Landsbergis, 1988). As Karasek
(1979) recognized, demands are a subset of all stressors. A large range of additional
work variables, including aspects of the physical work environment (e.g., hazard
exposure, poor ergonomic design, ambient stressors), the social environment (e.g.,
discrimination, harassment), and temporal dimensions of the job (e.g., work hours, shift
patterns, work-rest cycles) have been shown to influence job stress and strain (Andries
et al., 1996; Parkes, 1996; Pomaki & Anagnostopoulou, 2001). Karasek’s
conceptualisation of demands is thus too narrow; it excludes many factors that are

90
important sources of stress in contemporary work settings. Just as psychological
demands are but a fraction of all possible stressors, so too do control and support
represent only some of the resources upon which workers may call to combat stress.
Theoretically, the model not only aims to reduce the stress responses in question, but
also to activate work motivation, active learning behavior and personal growth. To put
it differently, stress and motivation are two sides of the same coin. From this
perspective, a second problem is that it is not very clear how these two psychosocial
mechanisms simultaneously operate in practice. A third flaw of the DCS Model is in its
elementary principles for stress prevention and job redesign. Although simplicity is in
most cases essential for practical applications, the instruments that measure latitude,
demands, and support provide only a general and basic risk profile. Usually, in
organizations, more detailed risk assessments are desirable in order to give perfect
judgments for stress prevention and job redesign (Kompier et al., 1996). Finally,
questions remain as to the more dynamic pathways of the two basic mechanisms
(Siegrist, 1996). The question is how does long-term exposure to a high-strain job elicit
chronic strain and, subsequently, inhibits learning behavior? Conversely, one may ask
how continuous learning in active jobs is related to the inhibition of long-term strain.
Thus the answer is still ambiguous. 8-Objective vs. Subjective Assessment of Job Factors The JDCS Model focuses on the characteristics of the work environment, but these are
usually determined with the use of questionnaires that have been completed by the
respondents themselves (Karasek & Theorell, 1990). It is not entirely clear to what
extent these self-assessments correspond with the objective work environment. Here the
term objective is used in the sense of independent of the workers' individual
observations and feelings (Frese & Zapf, 1994). On the one hand, questionnaires are
extremely useful for recording employyee's observations about their job environment
and the way they experience stress and strain. But on the other hand, questionnaires
also possess a number of potential flaws such as the danger of method variance, social
desirability, information bias, cognitive processes, and contamination by third factors
(Frese & Zapf, 1989). There have temporarily been created number of (more objective)
alternatives for the above-mentioned self-assessments of employees such as the use of
mean group scores and statistical observations based on checklists and physiological

91
measurements. These methods have also been criticized severely because they are not
as objective as they seem to be (Frese & Zapf, 1989, Zapf, & Greif, 1996).
Additionally, there is a lack of association between subjective and these "objective"
assessments (Schnall et al., 1994). The most common technique for more objective
assessment (many studies) is the imputation of national average scores for a job title
and, subsequently, assigns that average to individuals having that job title (Schnall et
al., 1994). It is true that this kind of group scores are more "objective" in the sense that
the influence of all kinds of individual bias is reduced, but the method is rather crude
because it does not take into account the variation within groups and the similarities
between employees in groups (e.g., by self-selection). Karasek (1988) reported that
large within-occupation variance is present in both decision latitude (42.9%) and
demands (59.1%). Schwartz and colleagues (in their research work) computed a
summary statistic of how well the mean score of an occupation estimates individuals'
actual latitude or demands. According to this summary measure, they captured 44.7%
of the reliable variance of latitude and only 7.1% of demands. So, a disadvantage seems
that the real differences between individuals within a group are ignored, which may
lead to an underestimation of the actual associations. The relationship between
alternative objective indicators of job characteristics (like number of errors, machine
defect rates, short cycle-time or production figures, quality of work produced) and
outcome variables in the JDCS approach has been examined in at least four studies (see
De Jonge, 1995). Two of these studies were able to prove a number of the presupposed
interactions. Dwyer and Ganster (1991), found that the combination of high objective
psychological demands and little decision latitude was related with low job satisfaction
and high absenteeism. Kristensen (1995) reported, however, that the relative risks with
respect to CVD were considerably lower in studies based on objective measurements
than in studies for which subjective measuring instruments were used. This indicates
that the objective method might underestimate the actual associations.
Therefore, the issue of objective vs. subjective assessment of job characteristics has
been theoretically neglected in the JDCS Model thus far. Questions remain as to what
extent self-assessments correspond with more objective assessments. Workers'
assessments and (more objective) alternative assessments seem to converge satisfactory
as far as the empirical evidence of the JDCS Model is concerned.

92
9-Research Population of Study Kristensen, (1995) reported that much research outcomes involving the model is based
on large-scale, representative research population. A representative random survey and
a high response rate are often highlighted as positive research characteristics.
Representativeness is of course important in descriptive research, but to analytical
research other standards apply. The use of representative research groups often has
following negative effects (Kristensen, 1995):
Many respondents have an average exposure, which results in little statistical
power;
There is too much diversity of psychosocial job characteristics because of the
large diversity of individual occupations within the occupational fields need to
be studied;
The differences in socio-economic status and health-related behaviors in large-
scale representative groups are too large, as a result of which these confounders
can hardly be distinguished from job-related risks;
The lack of specific knowledge about the individual jobs within the roughly
defined occupational fields makes it impossible to study the particular
personality characteristics of those workers in a valid way;
Superficial knowledge about the individual occupations within the occupational
fields does not make it easy to come up with specific practical recommendations
that may improve the work environment.
Other notable points have been reported by Zapf (1989) and Theorell and Karasek
(1996). Occupational groups may differ with respect to (1) denial of their work
environment, or (2) verbal insight into their situation. In other words, they may differ in
their frame of reference. For example, assembly line workers may have become used to
their work environment in such a way that they deny some of the hazards, probably
leading to negative findings in terms of job strain. On the other hand, health care
professionals and service industry employees are more familiar with psychosocial
problems, which may lead to positive findings.

93
Chapter # 3
3.0 RESEARCH METHODOLOGY 3.1 Methods
3.1.1 Study 1 Sample Participants in Study 1 were employees employed by power wing of Water & Power
Development Authority (WAPDA), the state government department functioning as
autonomous body responsible generation and distribution of electric supply. WAPDA
Manpower Statistics Ready Reckoner as on 30th June, 2006 personnel records were used
to select a simple random sample of 1000 working as regular employees in Distribution
Companies (DISCOS) throughout the four provinces of country. The target population
was all those working on BPS-9 to BPS-17 under the various positions. All other
positions were excluded. The 1000 selected employees were delivered personally a
copy of the research materials. Questionnaires were returned by 480 of these
employees, although not all of these were usable. Seventy eight responses were found to
be not usable for the reasons identified in Table 3.1. Therefore, the number of usable
returns was 402. The response rate of approximately 40% compares less than
unfavorably with most prior studies of stress (see, e.g., Griffith et al., 1999: 53%;
Brouwers & Tomic, 2000: 48%; Bradley, 2004: 70%). Responses to the demographic
and employment questions on the survey instruments were used construct a respondent
profile. For a review, see Appendix E-3. The sample comprised a majority of male
(97%), married (82%) and full-time (97%) employees. Respondents differed greatly in
their level of experience, nature of work, level of qualifications, salary structure and
basic pay scale.
3.1.2 Comparison with the Population of DISCOS Employees To establish that the sample was representative of the population of DISCOS
employees, data was obtained from IESCO, PESCO, and LESCO regarding specific
characteristics of the employees it employs: gender, gross income, age, educational
level and name of company. Comparisons on these dimensions were made between the
population of WAPDA employees (N = approximately 36438), the sample of

94
employees initially deliver a questionnaire (n = 1000), and the subset of this sample
who responded appropriately (n = 480).
Table 3.1 Study 1 Response Rates --------------------------------------------------------------------------------------------------- Status of Questionnaires Number of Employees --------------------------------------------------------------------------------------------------- Number returned completed & included in the data analyses 402 Number returned completed, but too late (not included in analysis) 10 Number returned incomplete 68 Number who did not respond 520 --------------------------------------------------------------------------------------------------- Total Number Sent 1000 Employee’s Response Rates: Included in analyses as a percentage of those sent (402 /1000) 40.2% Returned received, even if late, as a % of those received (480 /1000) 48.0%
3.2 Study 2 Sample In Study 2, a random sampling procedure was adopted. The positions of BPS-9 to BPS-
17(inclusive) were included and all other scales were excluded from the sampling
frame. The names of 1000 employees irrespective of experience were selected from
IESCO, PESCO and LESCO. This random sampling procedure ensured that selected
employees were represented in the sample in sufficient numbers to permit hypotheses to
be tested separately for this population.
The 1000 selected employees were delivered personally a copy of the research materials
along with necessary explanation. Questionnaires were returned by 458 of these
employees, although not all of these were usable for analysis. Seventy responses were
found to be not usable for the reasons identified in Table 3.2. Therefore, the number of
usable returns was 388. The response rate of approximately 38.8% compares
unfavorably with most prior studies of stress (see, e.g., Griffith et al., 1999: 53%;
Brouwers & Tomic, 2000: 48%; Bradley, 2004: 70%). Once again responses to the
demographic and employment questions on the survey instruments were used construct

95
a respondent profile. For a review, see Appendix E-3. The sample comprised a majority
of male (95%), married (78%) and full-time (98%) employees. Respondents differed
greatly in their level of experience, nature of work, level of qualifications, salary
structure and basic pay scale. Questionnaire was change significantly in light of
prevailing system of WAPDA and to improve its reliability. Table 3.2 Study 2 Response Rates ------------------------------------------------------------------------------------------------ Status of Questionnaires Number of Employees ------------------------------------------------------------------------------------------------ Number returned completed & included in the data analyses 388
Number returned completed, but too late 10
Number returned completed, but pattern of responses
was found to be incongruous, extreme and under observation 25
Number returned but incomplete 35
Number who refused 74
Number who did not respond 468
-------------------------------------------------------------------------------------------- Total Number Sent 1000 -------------------------------------------------------------------------------------------- -------------------------------------------------------------------------------------------- Response Rates: Included in analyses as a % of those sent 388/1000 38.8% Returned completed (even if late) as a % of those received / eligible 423/1000 42.3% ------------------------------------------------------------------------------------------- 3.2.1 Comparison with the Population of WAPDA To find out authenticity of results obtained in first sample data analysis, the second data
was collected through questionnaires from three distribution companies (DISCOS) of
WAPDA. To establish that the sample was representative of the population of DISCOS
employees, data was obtained from IESCO, PESCO, and LESCO regarding Demands-
Control Support model and specific characteristics of the employees it employs:
gender, gross income, age, educational level and name of company. Comparisons on
these dimensions were made between the population of WAPDA employees (N =

96
approximately 36438), the second sample of employees deliver a questionnaire (n =
1000), and the subset of this sample who responded appropriately (n = 458).
3.3 Measures 3.3.1 Development of the Scales to Measure Job Factors Self-report questionnaires administered to employees have been the most common
method of gathering data on psychosocial characteristics of work since they are simple
to administer and can be easily designed to tap core concepts in work redesign efforts
also (Hackman and Oldham's JDS 1975), Job Content Questionnaire (Karasek 1985),
the Swedish Statshalsan questionnaire. While designed to measure the objective job,
such questionnaire instruments inevitably measure job characteristics as perceived by
the employees. Self-report bias of findings can occur with self-reported dependent
variables such as depression, exhaustion and dissatisfaction. One remedy is to aggregate
self-report responses by work groups with similar work situations - diluting individual
biases (Kristensen 1995). This is the basis of extensively used systems linking
psychosocial job characteristics to occupations (Johnson et al. 1996). Bradley, (2004)
stated in his research study that Karasek’s Job Content Questionnaire (JCQ) - either in
its original (1979) short form or its later (1985) 49-item form - was not used to measure
the key job stressors. Reasons for this (a) its limited reliability (e.g., alpha coefficients
of between .50 and .70 for the demands scale: see, e.g., Kawamaki et al., 2000), (b) the
uncertain validity and unidimensionality of the decision latitude scale (see, e.g., Smith
et al., 1997), and (c) the scale’s focus upon job dimensions characteristic of
manufacturing industrial jobs, rather than of the service industry. Alternative published
scales of various researchers of Demands Control Model suffer from weaknesses
similar to those identified above, particularly a failure to tap specific dimensions of
work relevant to service industry. For example, Dwyer and Ganster’s (1991) highly
regarded measure of job control (adopted a scale of Caplan et al., 1975) includes several
items relating to control over the timing of rest breaks and vacations, which are unlikely
to be discriminating in a sample comprised exclusively of service industry. Their
measure of psychological demands assesses the extent to which a job involves
“vigilance, close tolerances for machined parts, or a great cost of errors and defects” (p.
599). Similarly, de Jonge et al. (1996 and 1999) assessed control over the amount of
work, the work goals and the pace of work in the field of health care workers, and

97
Dollard and Winefield (1995) and Dollard, 1996, limited their operationalisation of
demands to a measure of work pressures on correctional officers. Fox et al. (1993)
included several items relating to quantitative work loads and control scale which are
not similar to service industry. These research studies demonstrate that whole scales
constructed for use in other sectors of the workforce were not suitable for present
purposes to test the Karasek’s model. Existing scales including research study of
Bradley, (2004) measuring stress-related phenomena specific to service industrial
contexts are also problematic. Most such measures of stressors include factors that fall
outside the definition of demands (e.g., lack of professional recognition, inadequate
salary). In addition, several service industrial-focused instruments (e.g., Jimmieson and
Terry, 1993; Schreurs & Taris, 1998, Barnett & Brennan, 1997) require respondents to
indicate the extent to which they experience stress as a consequence of each of a list of
potential stressors. Such measures are used to assess specific stress levels, and confound
the measurement of particular stressors (demands) and strain. Instead of using
established scales, existing self-report instruments and one pilot study was conducted to
construct new scales to measure the overall demands, control and stressors. The aim
was to ensure that the scales would have greater environmental validity, and greater
construct validity as measures of Karasek’s job factors (1985) and Bradley, (2004). The
practice of using occupation-specific scales to measure job factors is well established in
the literature (see, e.g., Beehr et al., 2000; Daniels & Guppy, 1994; Jackson et al.,
1993), and is also recommended by der Doef and Maes (1999). The first step in the
development of these scales involved consulting prior research into service industry
stress and satisfaction (e.g., Bradley, 2004; Jackson et al., 1993; Karasek’s Job Content
Questionnaire, 1979 and 1985). These sources were used to construct a list of 42
stressors that had been investigated in at least one previous pilot study. From the list of
stressors, 10 items were deleted because their content overlapped that of other stressors.
Also deleted were 2 items pertaining to lack of job security associated with the job.
Finally, five other items were omitted because they were deemed to be largely irrelevant
to the target sample because their contents were not relevant to WAPDA employees.
The second phase of scale development involved a qualitative pilot study in WAPDA
Staff College H-8/4 Islamabad. The aim was threefold: first, to check on the content and
wording of the remaining 25 stressor items; second, to uncover additional possible

98
sources of stress; and third, to become better acquainted with issues confronting the
target population of WAPDA employees, the attitudes and values they hold, and the
language they use to communicate about issues of relevance. A purposive sample
comprising 10 practicing full time employees of IESCO staff participated in one-to-one
interviews. The interviews were semi-structured using questions adapted from past
studies. The main questions were:
Q1. What stressors are the main issues in your organizational job?
Q2. What are the main root causes of stressors?
Q3. At what time and under what circumstances stressors affect most on
workers?
Q4. Does control over stressors affect on the magnitude of stressors?
Q5. Does social supports affect on the magnitude of stressors?
Q6. What are the prominent stressors in your organization?
Interviewees were also shown a list of the 25 stressors items and were asked if all the
items tapped issues of relevance to employees. Interviews lasted between 20 and 30
minutes; written notes were taken throughout the interview. The data collected from this
small pilot study confirmed the relevance of the selected stressors, and generally
assisted in framing the draft questionnaire. No additional stressor items found in this
study, although several were modified (changed, re-worded, broadened, etc) in the light
of information received and in consideration of prior studies (Karasek’s JCQ, 1985;
Bradley, 2004). Total stressors were divided into five main portions: (a) quantitative
work overload (too much work to do in the time available), (b) qualitative role overload
(stressors pertaining to the complexity and diversity of the job), (c) interpersonal
demands and conflicts (including difficulties dealing with supervisors, colleagues and
parents), (d) employees problems (including rewards, recognition, promotional policies,
etc), and (e) issues associated with the physical work environment, equipment, and
resources. These stressor categories are similar to those used in prior studies (e.g.,
O’Connor & Clarke, 1990; Innes & Kitto, 1989; Punch & Tuetteman, 1990; Travers,
2001; Karasek & Theorall, 1985; G. Bradley, 2004). Therefore, with the exception of
stressor categories relating to lack of recognition, rewards and promotional policies
(categories that fall outside Karasek’s concept of demands), the stressors used in the
current research studies were considered to be comprehensive and relevant to the target
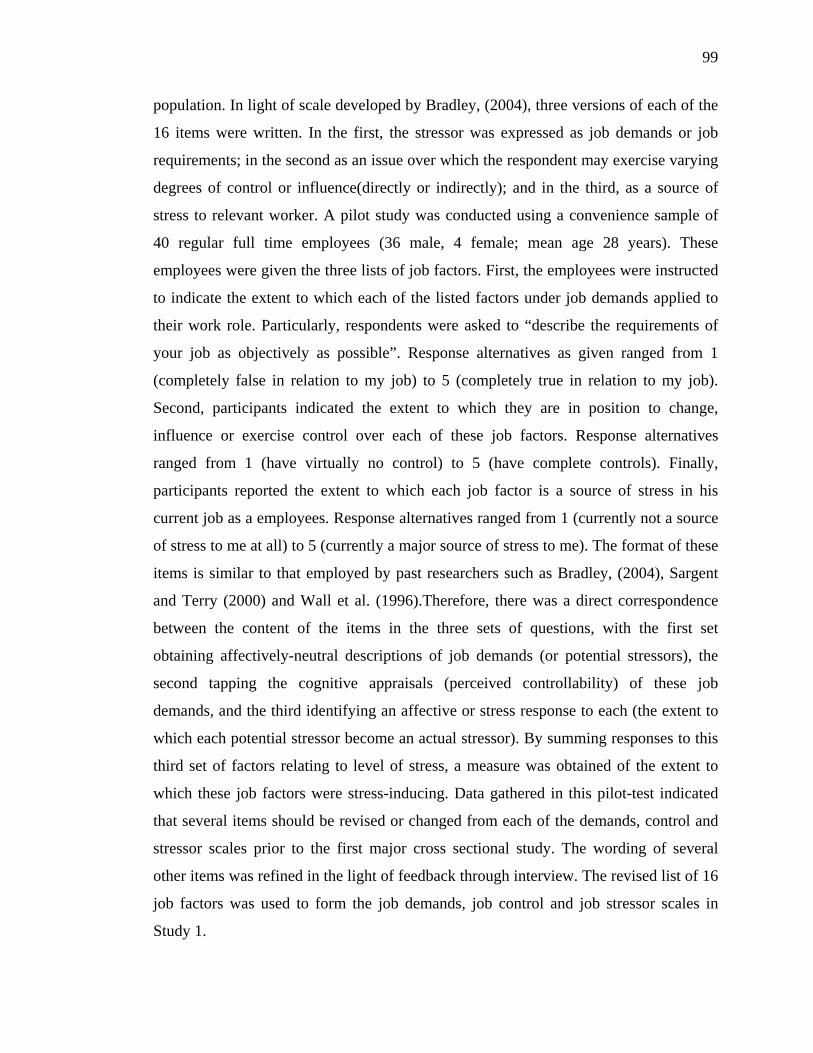
99
population. In light of scale developed by Bradley, (2004), three versions of each of the
16 items were written. In the first, the stressor was expressed as job demands or job
requirements; in the second as an issue over which the respondent may exercise varying
degrees of control or influence(directly or indirectly); and in the third, as a source of
stress to relevant worker. A pilot study was conducted using a convenience sample of
40 regular full time employees (36 male, 4 female; mean age 28 years). These
employees were given the three lists of job factors. First, the employees were instructed
to indicate the extent to which each of the listed factors under job demands applied to
their work role. Particularly, respondents were asked to “describe the requirements of
your job as objectively as possible”. Response alternatives as given ranged from 1
(completely false in relation to my job) to 5 (completely true in relation to my job).
Second, participants indicated the extent to which they are in position to change,
influence or exercise control over each of these job factors. Response alternatives
ranged from 1 (have virtually no control) to 5 (have complete controls). Finally,
participants reported the extent to which each job factor is a source of stress in his
current job as a employees. Response alternatives ranged from 1 (currently not a source
of stress to me at all) to 5 (currently a major source of stress to me). The format of these
items is similar to that employed by past researchers such as Bradley, (2004), Sargent
and Terry (2000) and Wall et al. (1996).Therefore, there was a direct correspondence
between the content of the items in the three sets of questions, with the first set
obtaining affectively-neutral descriptions of job demands (or potential stressors), the
second tapping the cognitive appraisals (perceived controllability) of these job
demands, and the third identifying an affective or stress response to each (the extent to
which each potential stressor become an actual stressor). By summing responses to this
third set of factors relating to level of stress, a measure was obtained of the extent to
which these job factors were stress-inducing. Data gathered in this pilot-test indicated
that several items should be revised or changed from each of the demands, control and
stressor scales prior to the first major cross sectional study. The wording of several
other items was refined in the light of feedback through interview. The revised list of 16
job factors was used to form the job demands, job control and job stressor scales in
Study 1.

100
3.4 Independent Measures in Study 1 & 2 were: Measurement Job Factors The items measuring demands, control and stressors developed for use in Study 1 and
study 2 were subjected to correlation and regression analyses. On the basis of these
analyses, 16 of the original total demands, total control and total stressor items,
measuring four different job factor domains were selected for use in Study 1 and 2.
3.4.1 Job Demands Job demands were measured by using a sub-dimension of Karasek et al.’s (1985) Job
Content Survey and Bradley (2004). This dimension consists of 16 items scored on a 5-
point Likert scale. Job demands were further divided into sub-set of four main groups
[Qualitative Demands (Questionnaires A1, A7, A11, A13), Employees Demands
(Questionnaires A4, A14, A15, A16), Workload Demands (Questionnaires A2, A3, A6,
A12) and Conflicts Demands (Questionnaires A5, A8, A9, A10); see Appendix E-3].
Respondents are asked to rate their present job on a 5-point Likert scale ranging from
1= completely false to 5= completely true. The reliability and validity of the measure
are available elsewhere (Karasek et al., 1985). Internal reliability for this scale with the
current sample was a =0.81 (Daryl B. O’Connor et al. 2000). Cammann et al., (1983)
reported the coeffieient of reliability of 0.65, and Bradley (2004) reported a reliability
of 0.746 and weighted reliability of 0.939. The reliability coefficients produced by this
research for total job demands subscales consisted of [alpha] T1 =0.94 and T2= 0.90.
3.4.2 Job Control We used Ganster’s (1989) validated measure of job control. Ganster’s original scale
had 22 items, each asking the subject how much control they possessed over the various
facets of their work. We trimmed the scale to 16 items, removing those items that were
not applicable to the employees in our sample; these included questions about control
over job demands. The control-scale consisted of two dimensions; skills discretion and
decision authority. Skills discretion was measured by four items (“keep learning new
things”, “job requires skill”, “job requires creativity”, “repetitive work”, control over
the physical conditions of one’s work station, or control over the ability to decorate or
personalize the work area. Decision authority was measured by some items (“have

101
freedom to make decisions”, “can choose how to perform work”), with Cronbach’s
alpha of .70. Scores on the items were averaged to provide an aggregate index of the
amount of control perceived they had over their job, a high score indicates greater
perceived control. All the items were scaled on a five-point Likert scale, ranging from 1
= have virtually no control to 5 = have complete control. Job control were further
divided into sub-set of four main groups [Qualitative control (Questionnaires B1, B7,
B11, B13), Employees control (Questionnaires B4, B14, B15, B16), Workload control
(Questionnaires B2, B3, B6, B12) and Conflicts control (Questionnaires B5, B8, B9,
B10); [see Appendix E-3]. Ganster (1989) reported internal reliability for this scale of
also 0.85 and Bradley (2004) reported a reliability of 0.824 and weighted reliability of
0.947. The reliability coefficients produced by this research for total job control
subscales consisted of [alpha] T1 =0.95 and T2= 0.94.
3.4.3 Social Support Social Support was measured using Bradley, (2004), Caplan, Cobb, French, Van
Harrison, and Pinneau's (1975) Social Support Scale and revised social support scale.
This measure includes two subscales: social support from supervisor (Questionnaire J1
to J4) and social support (K1 to K4) from work colleagues (see Appendix E-3). The
measure asks the respondents to identify the extent to which four items of support are
received from each of these two sources. Example items include: How much do your
department administration staffs go out of their way to make life easier for you? And
how much do your colleagues go out of their way to make easier for you? The
participants responded on a five-point Likert scale where 1 = not at all to 5 = very
much. High scores indicate high levels of social support. The measures' internal
consistency was tested with Cronbach's alpha statistic. The reliability coefficients
produced by this research for the two social support subscales consisted of [alpha] = T1
0.89 and T2 0.88 (supervisor) and [alpha] = T1 0.93 and T2 0.92 (colleagues). The
Cronbach a estimate of reliability for the non commissioned officers support scale was
0.87 whereas Bradley, (2004) reported reliability of 0.887 (supervisor) and 0.903
(colleague). Caplan et al. report reliability coefficients of 0.83 for the supervisor support
and 0.73 for the colleague support scales. Internal consistency reported by subsequent
researchers is typically in excess of 0.70, and often approximates 0.90.

102
3.5 Dependent measures in Study 1 & 2 were: 3.5 Measurement of Strain The dependent measure of strain was derived from well-established scale of Bradley,
(2004) and used in Study 1 and similar in Study 2, except Spielberger et al.’s (1983)
State Anxiety Scale. This was replaced by the Tension- Anxiety scale from the Profile
of Mood States. The Profile of Mood States (POMS) is a 65-item; self-report measure
designed to assess affect and mood (McNair, Lorr, & Droppleman, 1992). A total mood
disturbance score can be derived (POMS-TD). Additionally, six subscales assess further
components of mood: tension-anxiety (POMS-T), depression-dejection (POMS-D),
anger-hostility (POMS-A), vigor-activity (POMS-V), fatigue-inertia (POMS-F), and
confusion-bewilderment (POMS-C) (McNair et al.). All subscales assess for the
presence of negative emotionality and mood except for the vigor-activity subscale. The
vigor-activity subscale has been identified as a measure of positive affect (McNair et
al.). Homogeneity reliability was demonstrated through Kuder-Richardson 20 scores of
between .84 and .95 for the six factors (McNair et al.). For this study, Cronbach’s alpha
subscale scores ranged from .69 to .96 (Herbert L. Mathews, 1998). The POMS
Tension-Anxiety Scale is designed to measure somatic tension, and includes items that
assess diffuse anxiety states. The scale comprises a set of eight adjectives out of ten
(e.g., “tense”, “restless”, “anxious”) describing possible feelings and states of tension.
In the current study, respondents indicated the extent to which they have felt these ways
at work during the past week, using a five-point scale, ranging from 1 = not at all to 5 =
extremely. The scale has been successfully used in a number of previous studies (see,
e.g., Carayon, 1993b; Jimmieson & Terry, 1998; Sauter et al., 1983). Reliability
coefficients as high as .90 are typically reported. Daryl B. O’Connor et al. (2000, p 9,
6, 637-654) has given another concept to measure job strain and stated that over the last
15 years, research into the effects of job strain have adopted various different methods
of operationalising the independent variable, job strain. Karasek (1979) originally
employed regression analysis inputting the interaction between job demands and job
decision latitude last in the analysis. Various researchers (e.g. Ganster & Fusilier, 1989;
Hellerstedt & Jeffery, 1997; Kasl, 1989) have questioned the statistical appropriateness
of the proposed interaction effect. Ganster & Fusilier (1989) noted that his analysis
rejected the traditional tests for interactions based on partialled product terms in

103
regression analyses (as suggested by Cohen & Cohen, 1983). Theorellet al. (1988)
utilised job strain as a continuous variable, computed as the ratio between psychological
job demands and job control (by means of dividing job demands scores by job control
scores) where a high strain score indicates simultaneously high psychological demands
and low job control. Others have employed a multiplicative interaction term and found
moderate support for the demands-control model. Some have utilised cut-off points
above and below the median for demands and control to classify employees as ‘high
strain’, ‘low strain’, ‘active’ and ‘passive’ and carried out one-way analysis of
covariance (ANOVA) to test the effect of job strain on various measures of
psychological distress and predictors of cardiovascular disease (Blumenthal et al., 1995;
Schnall et al., 1992; Schnall et al., 1990; Van Egeren, 1992).
This present study uses a method which is similar to that described above and by others
(Blumenthal et al., 1995; Schnall et al., 1992) where the job strain variable is
categorized into high strain (high demands & low control), active (high demands & high
control), passive (low demands & low control) and low strain (low demands & high
control) groups. To create this variable, high and low latitude and demands were
defined by median cut-off points on the job control and job demands scales. 3.5.1 Job Stress Subjective stress was measured by a four-item scale developed by Motowidlo, Packard,
and Manning (1986) as adopted by Bradley (2004). An illustrative item is “I feel a great
deal of stress because of my job”. Responses were on a five-point scale from 1 (strongly
disagree) to 5 (strongly agree). Job Stressors were further divided into sub-set of four
main groups [Qualitative Stressors (Questionnaires C1, C7, C11, C13), Employees
Stressors (Questionnaires C4, C14, C15, C16), Workload Stressors (Questionnaires C2,
C3, C6, C12) and Conflicts Stressors (Questionnaires C5, C8, C9, C10); see Appendix E-
3]. Motowidlo et al. reported a coefficient alpha of 0.83 for this scale. Bradley reported
a coefficient alpha of 0.898 for this scale. The reliability coefficients produced by this
research for job stress subscales consisted of [alpha] T1 =0.92 and T2= 0.91.
3.5.2 Job Anxiety Job anxiety was measured using Spielberger, Gurush, Lusterne, Vagg and Jacobs's
(1983) Cox, Russell, and Robb (1998, 1999) State Anxiety Scale. Instructions were
modified as suggested by Spector (1987) to focus respondents’ attention on the work

104
environment. To minimize respondent burden, and in line with several previous studies
(e.g., Bradley, 2004; Beehr et al., 2000; Dollard & Winefield, 1995; Spector &
O’Connell, 1994), a 10-item version of the scale was used (see Appendix E-3 e.g. F1 to
F10). Responses were on a five-point scale from 1 = not at all to 5 = extremely. Use of
the scale is supported by extensive reliability and validity data reported in the test
manual (Spielberger et al., 1983). Past researchers who have used the scale (e.g.,
Bradley, 2004; Elsass & Veiga, 1997; Jex & Spector, 1996; Jimmieson & Terry, 1993;
Landsbergis et al., 1992; McIntosh, 1990; Spector, 1987a; Spector et al., 1988; Steptoe
et al., 1993) report reliability coefficients ranging from approximately 0.80 to in excess
of 0.90 . Beehr et al., Dollard and Winefield, and Spector and O’Connell all reported an
alpha coefficient of 0.89 for shortened versions of the scale. Bradley (2004) reported an
alpha coefficient of 0.965 for this scale. The reliability coefficients produced by this
research for total tension anxiety scales consisted of [alpha] T1 =0.72 and T2= 0.58.
3.5.3 Job Dissatisfaction Employee’s job satisfaction was measured by a four-item scale from Caplan et al.
(1975), as adapted by McLaney & Hurrell (1988) and Bradley (2004). Items deemed
inappropriate were excluded (Cooper et al., 1989). Each item is scored on a 5-point
scale from 1 (strongly disagree) to 5 (strongly agree). Items included statements about
the satisfaction with hours of work, rate of pay, opportunities to use one’s abilities. The
items on this scale (see Appendix E-3 from D1 to D11) are similar to those measuring
the same construct within Karasek’s (1985) Job Content Questionnaire. Chay (1993),
Sargent and Terry (1998), Sauter et al. (1983) and others have used this scale or
modifications of it. Caplan et al. reported a reliability coefficient for their version of
0.85, McLaney and Hurrell reported a coefficient of 0.83, and Bradley (2004) reported a
reliability coefficient of 0.899. Reliability and validity data is reported by Warr et al.
(1979) of 0.83. The reliability coefficients produced by this research for total job
dissatisfaction scale consisted of [alpha] T1 =0.84 and T2= 0.83.
3.5.4 Somatic Symptoms A physical health checklist (see Appendix E-3 from E1 to E10) was developed based
on similar scales used by Motowidlo et al. (1986), Pierce and Molloy (1990), Spector
(1987), University of Melbourne (1990), Daryl B. O’Connor et al. (2000), Checklist 90-
R (SCL-90-R, Derogatis et al., 1973), and Bradley (2004). In selecting scale,

105
distributions of participants’ responses in past research were examined to identify items
that have strong floor effects. To limit the length of the current scale, the ten items were
selected. These ten-item versions of the scale were included in the quantitative pilot
study at the beginning of first research study. Employees reported the frequency with
which they experienced each symptom using a five-point scale, ranging from 1 (not at
all) to 5 (once a week). Some of the items were shown to be non- discriminating and
were deleted from the list. Reliability and validity data is reported by Derogatis et al.
(1973). Internal reliability for this scale with this sample was a =0.88. Bradley (2004)
reported a reliability coefficient of .886. The reliability coefficients produced by this
research for somatic symptoms scales consisted of [alpha] T1 =0.92 and T2= 0.86.
3.5.5 Neuroticism Neuroticism (negative affectivity) was measured using the 12-item short form of the
Neuroticism Scale from the Eysenck Personality Questionnaire-Revised (EPQ-R:
Eysenck, Eysenck, & Barrett, 1985) as adopted and modified by Bradley, (2004) as (see
Appendix E-3: Questionnaire No. L2, L3, L6, L7, L10, L12, L14, L17, L18, L20, L22,
and L23) . This is well-established scale used by various researcher for which extensive
reliability and validity data are available (see e.g., Parkes, 1990, 1992; Fontana &
Abouserie, 1993; Parkes et al, 1994; Bolger & immerman, 1995; Walsh et al., 1997;
Judge et al.,1998 and Moyle, 1998) (see Appendix E-3). Reliability scale of coefficient
alphas in the range 0.80 to 0.95 is typically reported. Bradley, (2004) reported reliability
of 0.875 and 0.958 for weighted reliability. The reliability coefficients produced by this
research for neuroticism scales consisted of [alpha] T1 =0.80 and T2= 0.79.
3.5.6 Mastery Scale The Sense of Mastery Scale, which has been developed by Pearlin et al. (1981), was
employed in the study of Rosenfield (1992). This seven-item scale was designed to
measure “the extent to which one regards one’s life- chances as being under one’s
control in contrast to being fatalistically ruled” (Pearlin & Schooler, The stress process
Journal of Health and Social Behabiour 22:337-356. Karasek and Theorell(1990) refer
to the related work of Kohn and Schooler (1982) when arguing for the inclusion of
mastery as a key variable within their theoretical framework. The scale requires
respondents to indicate their level of agreement or disagreement to each item on a four-
point scale ranging from 1 (strongly disagree) to 4 (strongly agree) (see Appendix E-3:
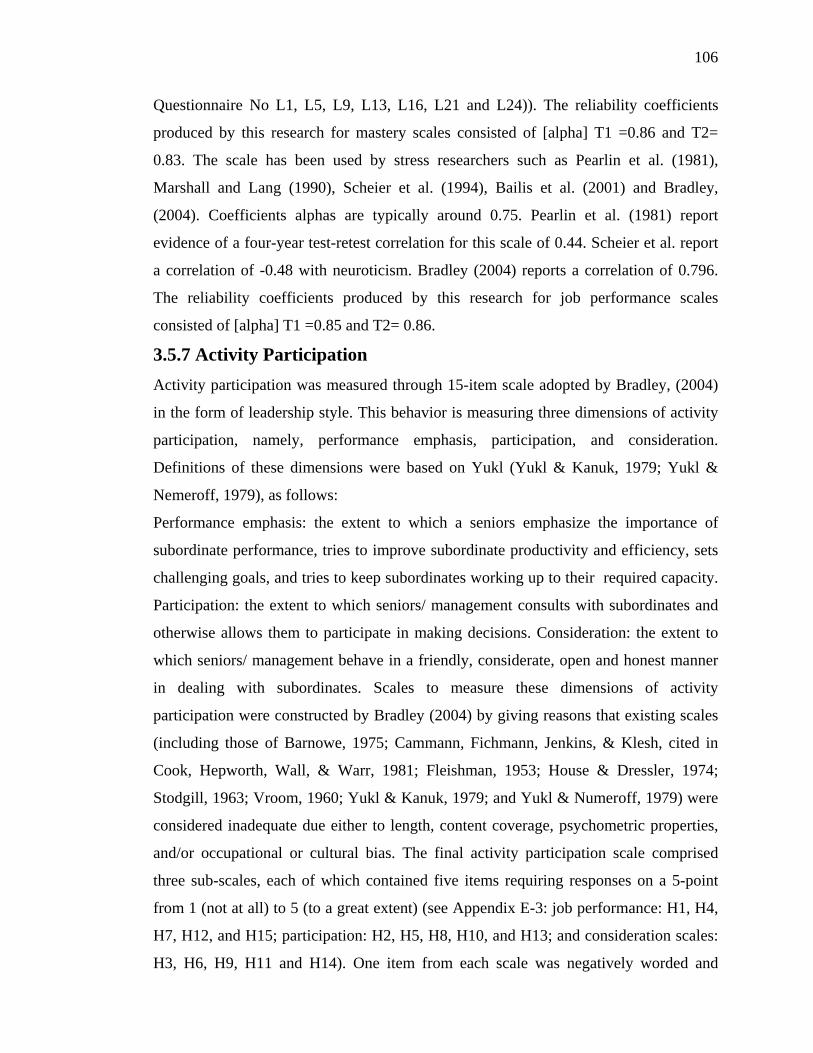
106
Questionnaire No L1, L5, L9, L13, L16, L21 and L24)). The reliability coefficients
produced by this research for mastery scales consisted of [alpha] T1 =0.86 and T2=
0.83. The scale has been used by stress researchers such as Pearlin et al. (1981),
Marshall and Lang (1990), Scheier et al. (1994), Bailis et al. (2001) and Bradley,
(2004). Coefficients alphas are typically around 0.75. Pearlin et al. (1981) report
evidence of a four-year test-retest correlation for this scale of 0.44. Scheier et al. report
a correlation of -0.48 with neuroticism. Bradley (2004) reports a correlation of 0.796.
The reliability coefficients produced by this research for job performance scales
consisted of [alpha] T1 =0.85 and T2= 0.86. 3.5.7 Activity Participation
Activity participation was measured through 15-item scale adopted by Bradley, (2004)
in the form of leadership style. This behavior is measuring three dimensions of activity
participation, namely, performance emphasis, participation, and consideration.
Definitions of these dimensions were based on Yukl (Yukl & Kanuk, 1979; Yukl &
Nemeroff, 1979), as follows:
Performance emphasis: the extent to which a seniors emphasize the importance of
subordinate performance, tries to improve subordinate productivity and efficiency, sets
challenging goals, and tries to keep subordinates working up to their required capacity.
Participation: the extent to which seniors/ management consults with subordinates and
otherwise allows them to participate in making decisions. Consideration: the extent to
which seniors/ management behave in a friendly, considerate, open and honest manner
in dealing with subordinates. Scales to measure these dimensions of activity
participation were constructed by Bradley (2004) by giving reasons that existing scales
(including those of Barnowe, 1975; Cammann, Fichmann, Jenkins, & Klesh, cited in
Cook, Hepworth, Wall, & Warr, 1981; Fleishman, 1953; House & Dressler, 1974;
Stodgill, 1963; Vroom, 1960; Yukl & Kanuk, 1979; and Yukl & Numeroff, 1979) were
considered inadequate due either to length, content coverage, psychometric properties,
and/or occupational or cultural bias. The final activity participation scale comprised
three sub-scales, each of which contained five items requiring responses on a 5-point
from 1 (not at all) to 5 (to a great extent) (see Appendix E-3: job performance: H1, H4,
H7, H12, and H15; participation: H2, H5, H8, H10, and H13; and consideration scales:
H3, H6, H9, H11 and H14). One item from each scale was negatively worded and

107
required reverse-scoring. Sample items were [My supervisor...] maintains “high
standards of staff performance” (performance emphasis), allows “staff to participate in
important decisions” (participation), and “is really interested in whether staffs are
satisfied in their work” (consideration). The reliability coefficients produced by this
research for subscales consisted of alpha T1 =0.66 and T2= 0.68 for job performance,
T1 = 0.59 and T2 = 0.56 for job participation, T1 =0.61 and T2= 0.74 for job
consideration. Bradley, (2004) reported coefficient alphas in study for the set of items
comprising the job performance emphasis, participation and consideration scales were
.816, .882 and .887, respectively. 3.6 Structure of the Final Questionnaire 3.6.1 Study 1 & 2 Questionnaire The 10-page questionnaire constructed for use in Study 1 & 2 is given in Appendix E 3.
The questionnaire takes approximately 30 minutes to complete. It was divided into four
sections:
1. Your Job (16 items each for job demands, job control and Job stress);
2. Your levels of stress, satisfaction and well-being (11 items);
3. Your organization and your role in it; and
4. About personality disposition.
Section one contained the questions pertaining to the predictor variables, job demands,
job control and job stress.
Section Two contained five of the dependent measures: stress, job dissatisfaction,
employee’s turnover intention, tension-anxiety, and somatic symptoms. The items
measuring stress, satisfaction and dissatisfaction were interspersed.
Section Three included 15 items for activity participation, 4 items for superior’s
support, and 4 items for colleagues support.
Section Four included 24 items regarding your self and your general attitudes,
measures of neuroticism and mastery.
Finally, ten items were asked for the respondent’s years with current firm and total job
experience, number of firm worked for , size of firm, educational level, age, gross
income, gender, name of company and basic pay scale.

108
3.6.2 Procedure 3.6.2.1 Study 1 Survey Procedures Before questionnaires were distributed, an application giving details of the planned
survey was sent to WAPDA House Lahore and Chief Executive Officers of IESCO and
LESCO. The application included a detail of survey that gave permission to conduct the
study and briefly outlined the study's aims and conditions. A copy of this
correspondence is given in Appendix E 3. Within couple of weeks we got permission
from concern authority. Two weeks later, a copy of the questionnaire was delivered
personally to all 1000 employees of the Study 1 sample at their work places and training
centers and a pre- addressed to the author/concern officers, for use when returning the
questionnaire. All employees were informed that their responses would remain
confidential so that they could encourage giving an honest assessment of their concerns
and stresses, rather than exaggerating them or pretending that they did not exist. All
questionnaires were numbered to assist with follow-up procedures and respondents
were informed of this. As part of the inducement to participate, and in the interests of
freedom of information, all participants were invited to indicate whether they wished to
receive a summary of the survey findings when available. Alternative, employees who
had not returned their questionnaire was sent a reminder through telephonic message.
Completed questionnaires were accepted for eight weeks after their original
distribution. The returned questionnaires (40%) were received within two months
period. A letter thanking the employees for their participation was mailed to all concern
head of departments.
3.6.2.2 Study 2 Survey Procedures The procedures followed for Study 2 were similar to Study 1. The Head of all the
departments that employed a member of the sample was obtained permission through
the reference of Study 1. Two weeks later, a 10-pages copy of the same questionnaire
was delivered to all 1000 employees of the sample at their offices and training centers
along with the departmental memorandum giving permission to conduct the study, and
pre-addressed to the researcher or suggested to deliver concern person. Four weeks
later, all employees who had not responded were sent a reminder through concern
persons and a second copy of the questionnaire. Responses were accepted until the end
of three months period because of low response rate. In selecting an appropriate interval

109
between data collection points, it was important to ensure that the time lag was long
enough (9 months) to permit an effect to occur without being so long as to lose touch
with a large proportion of Time 1 respondents. Several factors were considered in
selecting an appropriate time lag. First the intervals used in previous cross-sectional
research were identified. The patterns of change observed and attrition rates reported in
this past research were examined. There was also a need to ensure that the second wave
also coincide with events because less number of employees have been transferred or
resign or retired from organization. On the basis of the information received, the
decision was taken to dispatch the Time 2 questionnaires in any time, and thus use an
interval of approximately nine months between the two phases of data collection. This
time lag provided ample opportunity for the respondents’ job conditions to have an
impact, it ensured that both questionnaires were completed in months of the two years
that were similar environment, and avoided the large attrition problems likely to be
associated with a change of seasonal climate of Pakistan particularly June to August. It
also follows the practice employed in several past occupational stress studies (e.g.,
Dormann & Zapf, 1999; Schonfeld, 1992, 2000; Bradley, 2004). In Study 2
approximately 30% of the responses were received within 4 weeks of their delivery, and
approximately 10% within 9 weeks of delivery. A letter thanking the concerns for their
participation was mailed to all Study 2 respondents. 3.7 Data Analyses 3.7.1 Approaches to Data Analysis Various statistical techniques have been used, including analysis of variance (and
related sub-group comparative techniques), multiple regression, t-test, and F distribution
test to examine the issues under investigation. These statistical approaches have their
own disadvantages: in particular, there is a loss of information and statistical power
with sub-group techniques, unreliability and excessive conservatism when testing
interaction effects with multiple regression, and many competing options and difficult-
to-meet assumptions (Ping, 1997). Despite these disadvantages, there are sound reasons
for using these techniques.
Karasek (1979) and later Karasek & Theorell(1990) presented these models in the form
of propositions regarding between two forces, and thus the models are straightforwardly
tested using (multivariate) ANOVA. With these techniques, the findings of this current

110
research can be directly compared with those obtained by Karasek and his followers
particularly Bradley (2004). So many empirical tests of Karasek’s ideas have, however,
used multiple regression analysis, and thus the use of this approach is favored to
maintain consistency, and enable comparisons, with this extensive body of past work.
Whilst it is appropriate to repeatedly analyses a data set in search of significant
findings, there is merit in assessing the extent to which observed relationships hold up
across analytic techniques. To test the previous findings and to extend the models for
their possible significant effects, the analytic strategy adopted in the current research
involved testing tightly-prescribed hypotheses using a series of increasingly demanding
statistical techniques. Findings from these similar techniques were straight-forwardly
compared with previous researches and their effects. Significance was attached to our
findings that were statistically significant across multiple dimensions of the studies.
This approach is consistent with that adopted in several past studies (e.g., Cohen,1988;
Kalimo & Vuori, 1991; Greenlund et al., 1995; Tabachnick & Fidell, 1996; Bosma et
al., 1997; 1998; Holman & Wall, 2002; and Bradley, 2004). Tabachnick & Fidell,
(1996) stated that with the large sample sizes used in this research, relatively small
effects are likely to be statistically significant. Consequently, as a further safeguard
against over-interpretation, both statistical significance and effect sizes are reported
systematically, where necessary. Cohen (1988) reported the possible range of statistical
effects as small if r < .1; medium if r lies between .1 and .3, medium-large if r is
between .3 and .5, and large if r > .5. Therefore, such standardized paths within
correlation and multiple regression analyses were based on the same benchmarks.
Few studies have tested Karasek’s hypotheses (particularly his interaction hypotheses)
using multi-regression analysis, despite clear advantages associated with this approach.
These techniques were used extensively to analyze the current data sets in Time 1 and
Time 2 study. To perform these analyses, the software package, Statistical Package for
Social Sciences (SPSS) version 15, ANOVA and Partial Least Square (PLS) were used.
Some possible reasons for the extensively past use of these techniques are the large
number of alternative procedures available within these soft wares, and the consequent
need to decide between these alternatives prior to data analysis.

111
3.7.2 Overview of Data Analytic Steps This section presents the steps taken to analyze the Study 1 and 2 data. Where
appropriate, the rationale underlying each step is presented. These steps are summarized
as under
1. Correlation Analysis to find out mutual relationship.
2. Linear and multiple regression analysis (through SPSS)
3. Analysis of variances (ANOVA)
4. T-values and F-values of data (through SPSS)
5. Calculation of interaction terms
6. Partial least square (PLS)
7. Adjusted R square value.
Figure 3.1 Summary of data analytic steps.
In line with the discussion in Chapter 2, the following six structural models were tested
in each Study 1 and Study 2:
Model 1: Karasek’s (1979) core job strain model, in which the exogenous variables.
Demands, Control and the Social support (supervisor’s support + colleague’s supports)
interaction predict the strain outcomes.
Model 2: A “stressor-mediator” version of Karasek’s model, in which the job factors
predict Strain indices (the mediator variable).
Model 3: A “strain mediator” version of the core Karasek model in which the
exogenous variables predict proximate indices of strain (Job Stress, Job Dissatisfaction
and Job Anxiety), which act as mediators in predicting more remote strain indices (e.g.,
Somatic Symptoms). If the effects of demands and control upon the remote strain
indices are completely mediated by the proximate strain indicators, then the direct paths
from the exogenous variables to the remote indicators may be non-significant. This
variation was also tested.
Model 4: A “stressor-mediator” version of Karasek’s 2 models, in which the job factors
predict stressors (the mediator variable) which then predicts three strain variables.
Model 5: A “stressor-mediator” version of Karasek’s model, in which the job factors
predict stressors (the mediator variable) which then predicts seven strain variables.
Model 6: A two-level (“stressor-strain”) mediator model in which the job factors predict

112
stressors, which predicts the immediate indices of strain which, in turn, predict the more
remote strain indices.
These six models were tested for further examination using the Study 1 & 2 data. Model
testing procedures were used through PLS. In these studies, however, a larger number
of variables was measured, and any model containing few of these variables would have
proved unwieldy. Several writers (e.g., Hoyle, 1995; Hu & Bentler, 1995; Baumgartner
& Homburg, 1996;) urge against attempts to fit overly-complex models on the grounds
that they tend to be not very disconfirmable. Highly over-parameterised models have
been shown to be liable to Type I errors in that the goodness-of-fit statistics will
indicate an adequate fit regardless of whether there is a match between the specified
model and the sample covariance matrix. Attempts to fit models containing very few
parameters may also be unsuccessful, with MacCallum (1995) reported that the
structure of the covariance matrix for a large set of variables is commonly too complex
to be fitted well by any parsimonious model. To overcome these problems, some
researchers (e.g., Bijleveld & van der Kamp, 1998; see also Bradley, 2004) have broken
complex models into meaningful parts and tested these abridged versions separately.
This approach was followed in Study 1 & 2. Model testing in Study 1 & 2 thus involved
separate analyses examining relationships between demands, control, support and
stressors, relationships between the job factors and strain, relationships between the job
factors and activity-participation, the extended person-environment model, and
hypotheses pertaining to activity participation.

113
Chapter # 4
4.0 STUDY 1 TESTING OF HYPOTHESES
4.1 Overview Study 1 conducted through use of self-reported measures and a cross-sectional design
to test the main, additive, quadratic, and interaction effects of three job factors
(demands, perceived control, social support and stressors) on various immediate and
remote outcomes of strain. Study 1 develop on previous researches (particularly,
Bradley, 2004) by using an extended set of independent and dependent variables and a
number of additional effects. Study 1 included measures stressors- strain relationship of
various types of strain outcomes, three types of activity-participation, and a range of
personality variables and work-environment variables. Most variables were measured
through self-reports obtained from the survey. The 10 hypotheses investigated in Study
1 were tested to provide the validity of data. 4.2 Correlation Analyses Appendix E1 shows zero-order correlations between the composite scales. Correlations
involving demographic and job-related variables are not included. Consistent with
underlying theory and previous research, the measures of job demands tended to be
negatively correlated with control, and positively correlated with both stressors and
strain. Conversely, control was negatively correlated with stressors and strain. The
correlation between total demands and total control was -.77 in Time 1 and -.74 in Time
2 Study. This correlation, although higher than expected, is similar to that reported in
some past studies (e.g., Warr, 1990; Rau et al., 2001; and Bradley, 2004). Demands and
control tended to be more highly correlated with stressors than either was with
outcomes of strain, and the stressor variables were more closely associated with strain
than were demands and control. These findings are consistent with hypothesis 8, which
predicted that stressor plays a role in mediating the job factors - strain relationships.
The three composite outcomes of strain were moderately inter-correlated in the
expected (positive) direction. Correlations of immediate outcomes of strain are positive
(anxiety, dissatisfaction, and somatic symptoms), thereby providing evidence of
acceptable levels of convergent /divergent validity for these variables. However, vigor
activity was poorly correlated with all other variables. To test the extent to which these

114
weak relations were an artifact of the highly skewed distribution of the vigor activity
data. Contrary to expectations, however, this vigor activity variable was also not
significantly related to any of the other study variables. A set of standard regression
analyses (not reported) confirmed the failure of the sets of demands and control
variables to explain significant amounts of variance in vigor activity. Therefore, vigor
activity was not included in subsequent tests of the hypotheses in study 2
4.3 Main Effects of Job Factors on Stressors and Strain The significant correlations between total demands and total stressors, and between
total control and total stressors, are evidence for the main effects of both these job
factors on stressors, as predicted in hypotheses 1 and 2. Similarly, the significant
correlations between total demands and strain, and between total control and strain,
provide evidence in support of the main effects predicted in hypotheses 5 and 6.
Comparisons with the median correlations obtained in past research, reveal that the
present measures of total demands and total control were correlated with all measures
of strain in the same direction, but somewhat more highly, than has typically been
reported in the past particularly Bradley, (2004). As in past studies, the current
measures of total demands were better predictors of strain than were the current
measures of control. Also consistent with past findings, the total demands variables
predicted stress slightly better than they predicted job dissatisfaction .84, whereas this
was not the case for control -.74. These consistencies between the current and average
past findings provide evidence as to the validity of the measures developed for these
studies (Time 1 and Time 2).
4.4 Additive Effects of Stressors and Strain As an initial test of the additive effects of these job factors on stressors (hypothesis 3)
and strain (hypothesis 7), a new “subtractive” job factors variable was computed (see
Appendix D8) using the formula: Standardized Total Demands plus Standardized Total
Control. This variable operationalises Karasek’s (1979) notion of strain as a function of
the “relative deficit” of Job control in relation to job demands. Social Support for the
additive hypothesis was obtained but the main effects were more highly correlated with
stressors or strain than was either of individual effects. Analyses using this composite
job factor variable confirmed the hypotheses 5 and 10. Testing to hypothesis 3, the
correlation between demands and the total stressor variable was r = -.83, which was not

115
significantly different from the correlation between total control and total stressors, r =
.76. In testing hypothesis 1 to 5, the composite index was found to be significantly
correlated with stressors and outcomes of strain (see Appendix E1). These correlations
closely parallel the corresponding correlations between demands and the four strain
outcomes reported in Appendix E-2 (Time 2).
Thus, the combined influence of demands and control as just as effectively (and more
parsimoniously) predicted of strain rather than a variable representing using measures
of demands only, Karasek’s (1979) original presentation of the job strain model was in
the form of comparisons between groups of workers broken down by levels of job
demands and/or job control and later on through social supports. Subsequent
researchers have divided their samples into between two and four groups to test for
linear, quadratic, and interactive effects, and up to seven groups (e.g., Warr, 1990) to
test for curvilinear effects. Similar analyses were reported on the current data set. Given
the number of analyses to be reported and the previously-described limitations of the
sub-group approach (see chapter 2), analyses using the total job factor scales only are
reported. Findings from independent groups t-tests, Analyses of Variance (ANOVAs)
and Regression Analysis, and F distribution test as appropriate, are reported in this
analysis and subsequent chapters. These tests are quite robust to minor violations of
assumptions (similar to Karasek’s, 1979: and Karasek & Theorell, 1990), and adequate
power was ensured with the number of cases per cell greatly exceeding recommended
minimum numbers (Tabachnick & Fidell, 1996). 4.5 Main Effects on Stressors and Strain To replicate procedures adopted in many past studies (particularly Karasek’s, 1979: and
Karasek & Theorell, 1990; Bradley, 2004), sub-group analyses were initially performed
using a single and composite outcome measures. To test for independent linear effects
of total demands and total control on stressors and strain, the study was divided into
Time 1 and Time 2 approximately equal-sized groups based on scores on the relevant
job factor scale. Independent group t-tests, one-way ANOVAs, regression and F values
tested the effects of each job factor on ratings of total stressors, and on the three
immediate measures of strain. In all cases, further test of regression and variance was
computed and the inferential statistic interpreted accordingly in study 1 and study 2.
Regardless of whether the study was divided into Time 1 and Time 2 sub-groups, the

116
effect of demands on stressors and strain was highly significant (all p < .001).
Accordingly, the groups with higher job demands reported greater levels of stressors,
stress, anxiety, job dissatisfaction, and somatic symptoms. Effect sizes on stressors
were large enough as compare to Bradley (2004); effect sizes on the strain outcomes
ranged from moderate to large (partial ranged from .50 to .92). These findings provide
strong support for hypotheses 1 (demands on stressors), 5 (demands on strain). Identical
analyses were performed using sub-groups determined by levels of total control. The
effect of control on total stressors was highly significant (slightly lower than total
demands on stressors and strain) when either studies 1 and study 2 of control were used
to form sub-groups. However, there were no significant differences between these
groups in levels of strain outcomes. These findings generally support hypotheses 2
(control on stressors) and 7 (control on strain) in study 1 and study 2.
4.6 Quadratic Effects on Stressors and Strain To test for curvilinear univariate effects, studies were formed based upon data on the
total demand and total control scales, and trend analyses were performed by partial
least square (PLS). Due to the differing distributions of these two scales, four groups of
each total demands and total control groups were formed. Regression analysis, t test
and F-values test was interpreted (see appendix A1 to C4 of Time 1 and Time 2).
Separate analyses were conducted for demands and control, for each of the three
outcomes of strain (twelve in total). In all analyses, the stressors relationships were
significant (p < .001), except vigor activity which was significant (all ps > .20). These
findings provide significant evidence of curvilinear relationships between demands and
control on the one hand, and the strain measures on the other. Possible curvilinear
effects of job demands and job control on total stressors scores were investigated using
identical procedures. These sub-groups associated with both demands and control were
highly significant (p < .001).
4.7 Interactive Effects on Stressors and Strain Hypothesis 3 predicted that the demands and control interaction have a significant
effect upon the most proximate outcome in the stress chain, that is, upon participants’
ratings of the stressfulness of their work environment. A combination of total demands
and total control for ANOVA test on the total stressors as the dependent variable
revealed significant effects. For demands, Beta values = .61, t-values = 14.95, and for

117
control, Beta values = -.28, t-values = -7.04, R2 = .73 and F-values =53.99 (see
Appendix D8, Time 1). Similar analyses using three variables of demands, control and
social supports yielded significant main effect for all outcomes of strain (see Appendix
D11). In all data analysis, the combine effects of demands, control and social supports
have significant predictor of strain outcomes than independent effects (see Appendix
D3, D4, D7).
4.8 Multiple Regression Analyses. Analyses were performed to assess main, quadratic and interaction effects of demands
and control. The criteria in different analyses were the stressor variables and the three
outcomes of strain (anxiety, dissatisfaction and somatic symptoms). Despite the
moderately high correlation between pairs of demands, control and social supports
variables, maximum values for these predictors were in excess of .60, whilst values for
some variables interaction terms exceeded .90, indicating that there were no non-
significant trends. In all analyses, F values for the regression equation were highly
significant (p < .001), indicating the null hypothesis that multiple R2 equals zero
should be rejected.
Some writers (e.g., Krause, 1985; Lubinski & Humphreys, 1990; Cortina,1993;
Morrison & Payne, 2001; Morrison et al., 2001; Bradley, 2004) have recommended that
researchers test for quadratic effects prior to testing for interaction effects. According to
these writers, identifying quadratic effects is important not only for the substantive
interest of these findings, but also because of the need to control for significant
quadratic effects in subsequent analyses so that variance can contribute to the test of
model. Given the significant correlations between corresponding pairs of demands,
control and social support variables, these recommendations were followed in the
present analyses.
4.8.1 Quadratic Effects Hierarchical multiple regression analyses were used to examine the extent to which
each of the job factors was related in a nonlinear manner to the stressors and strain
outcomes. The single job factor was entered at step 1 of the analysis (see Appendix D1
to D7), and the group values of this job factor (see Appendix, D8 to D10) were entered
at a second step to test the various factors of models. In all cases, the quadratic main
effects of the job factors were highly significant than the independent effects of

118
variables. Thus, quadratic term explained significant amounts of additional variance of
criterion. Regression analyses were also performed using as predictors the demands
plus supervisory supports, demands plus colleagues supports, demands plus social
supports, demands plus control through various steps (see Appendix D8 to D10). When
entered in quadratic effects, the three terms added significantly to the prediction of any
of all outcomes. Beta values were significant (p < .001) for three of the combine terms.
Overall, these regression analyses showed that the combine effects of demands and
control, and demands, control and social supports add significantly to the prediction of
most stressors and strain outcomes, after accounting for the independent effect of these
job factors. As Karasek did emphasize linear relationships, and most of the past
researchers have obtained such effects, few attempts were made to test for quadratic
effects in such research study of model testing.
4.8.2 Interaction Effects In the regression analyses designed to test main and interaction effects, the predictors
were entered hierarchically in three steps: demands was entered first, followed by
control at step two, and a term representing the interaction of social supports at the third
step. Analyses were conducted two times, using progressively more specific levels of
the predictors. 4.9 Analyses Involving the Total Job Factors Scales Results of the regression analyses at the most global level - using as predictors the total
demands and total control scales - are summarized in Appendix D11 (Time 1). The
three predictors combined explained over .20 to .10 of the variance in stressors, and up
to .12 of the variance in the strain outcomes except vigor activity which explained the
non-significant predictor. Demands were consistently associated with highly significant
(p < .001) beta and R2 change and adjusted values (see appendix D3 and D7). Control
predicted all variables significantly (slightly lower than job demands and social
supports) to the prediction of the other strain outcomes after variance accounted by
demands had been removed. Thus, the additive social supports model was supported in
relation to all of the strain outcomes except vigor activity.
The interaction term did account for significant amounts of the explained variance in
any of the strain outcomes. In fact, the beta values associated with the prediction of
some of the strain outcomes (stress) were positive - suggesting a enhancing, rather than

119
a buffering effect of control on this measure of strain. The interaction of demands and
control did, however, explain additional variance in total stressor levels.
4.9.1 Analyses Involving Five Specific Job Factor Scales Appendix D2 (Time 1) summarizes results of the regression analyses that used the two
sets of specific demands and control factors as predictors. As can be seen, when entered
as a set at step 1, the four demands factors significantly predicted total stressor levels
and all five measures of strain; the set of control factors explained also a significant
proportion of the variance in relation to all five of these outcome variables and add
significantly to the prediction of any of the outcomes. Qualitative and conflicts
demands of employees were a significant predictor of all outcomes; workload demands
were remained second significant predictor of strain outcomes; and employees demands
predicts last significant factor. Similarly, qualitative, workload, and conflicts control
were stronger predictors of strain outcomes and have buffering effect between demands
and strain relationship. Employee’s demands and control predictors explained more
than half of the variance in stressor levels, between one quarter and one third of the
variance in stress and anxiety levels, and less than one-fourth of the variance in job
dissatisfaction and somatic symptoms (see Appendix T1-D2).
To further test the relative contribution of the specific demands and specific control
factors, a series of stepwise regression analyses was performed (see Appendix D3 to
D6). In these analyses, the total stressor variable and each of the strain variables were,
in turn, regressed on either the full set of specific demands factors, or the full set of
specific control factors or the full set of specific social supports factors. These analyses
enabled selection of a parsimonious set of specific factors that maximize the prediction
of stressors and strain. Three specific demands factors contributed significantly to the
prediction of the five outcome variables. Overall, the qualitative and conflicts demands
factor were the strongest predictor. In contrast, only three of the four specific control
factors contributed significant amounts of unique variance to the predictions, with the
employees’ factor failing to meet the criterion for entry into any of the analysis.
4.9.2 Analyses Involving Job Factors in a Single Domain Analyses were performed to test whether the demands and control interaction term,
which was a significant predictor of the total stressor and total strain scale, was also
significant using the specific stressor and strain scales. These analyses entailed

120
regressing each of the four specific stressor variables in turn on the corresponding
demands, control, and social supports interaction variables. In all cases, demands,
control and social supports supervisory supports and colleagues supports scales
predicted their respective stressor scale (p < .001 in all cases), but only in the case of
the employees scales was the interaction term also significant (p < .02 and .01,
respectively). Linear and quadratic regression analyses were also conducted separately
for each of the specific demands and control factors (and their interaction) to predict the
four outcomes of strain (see Appendix A, B, C, stepwise). Results were broadly similar
or someone higher than to those involving the total job factor scales, with all of the
specific demands scales, and a majority of the specific control scales, significantly
predicting the outcomes. Only one of the 16 demands and control interaction terms are
added significantly to the prediction of the outcomes, after prior entry of the relevant
demands and control main effects (and, where relevant, the significant quadratic
effects). The single less significant effect was for the employee’s demands and control
interaction term on job anxiety. Overall, these regression analyses provided evidence of
the main and additive effects associated with job demands and control. The analyses
partially supported the hypothesis 3 and 8 that the demands and control interaction
contributes significant to the prediction of stressors than independent effects alone.
4.10 Mediator of the Job Factor-Strain Relationships Hypothesis 5 & 10 predicted that job control and job social supports mediate the
relationships between demands and stress, and between outcomes of strain. Kenny’s
(1986) three-step regression approach was used to test this hypothesis. First, in separate
equations, total demands (adj. R2 = 0.43, β = 0.66, p < .001) and total control (adj. R2 =
0.20, β = - 0.45, p < .001) were shown to predict total stressors. Second, consistent with
findings reported above, in separate equations, demands predicted all strain outcomes
(stress: R2 = 0.18, β = 0.43; anxiety: adj. R2 = 0.18, β = 0.43; job dissatisfaction: adj. R2
= 0.12, β = 0.34; somatic symptoms: R2 = 0.10, β = -0.31), as did control (stress: R2 =
0.06, β = -0.24; anxiety: R2 = 0.05, β = -0.25; dissatisfaction: adj. R2 = 0.08, β = -0.28;
symptoms; adj. R2 = .02, β = -0.12). All beta weights were significant at p< .001 and
.01. Consistent with the hypothesis, the beta value for stressors was significant in all
analyses (p< .001). Bradley (2004) reported that both demands and control were
remained a significant predictor of stress (demands: β = .83; control: β = .76,) or of

121
symptoms (demands: β = .70; control: β = -.63). However, the additive effects of
demands, control and social support on job strain were more significant than that of
main effect alone. Consistent with two precedent researchers, our findings are more
significant as three-step regression approach were used to test this hypothesis. First, in
separate equations, total demands (adj. R2 = .83, β = .69, p < .001) and total control
(adj. R2 = .57, β = - .76, p < .001) were shown to predict total stressors. Second,
consistent with findings reported above, in separate equations, demands predicted all
strain outcomes (stress: R2 = .83, β = .69; anxiety: adj. R2 = .56, β = .46; job
dissatisfaction: adj. R2 = .73, β = .86; somatic symptoms: R2 = .48, β = .70), as did
control (stress: R2 = .57, β = -.76; anxiety: R2 = .42, β = -.65; dissatisfaction: adj. R2 =
.58, β = -.76; symptoms; adj. R2 = .40, β = -.63). All beta weights were significant at p<
.001(see Appendix D3, D4 and D7). Third, in independent analyses, one of the
antecedent variables (demands) and the mediator (control or social support) were
entered at a single step in equations predicting each of the strain outcomes. The
mediation hypothesis would be supported if stressors, but not the other job factor, were
a significant predictor of strain in these third equations. Consistent with the hypothesis,
the beta value for stressors was significant in all analyses (p< .001). 4.11 Summary of Study 1 Results & Findings This study summarizes the results and findings relevant to each hypothesis are briefly
given below:
Hypothesis 1 (Independent effects of job demands on stressors)
Job demands (including four sub-sets, as qualitative, employees, workload and
conflicts) were predicted to be positively related to stressors. Findings confirmed this
prediction of hypothesis. In fact, all analyses, demands - either the total scale or one of
the specific scales (as a sub-set) - predicted stressors at the p < .001 level.
Hypothesis 2 (Independent effects of control on stressors)
Whilst not as strong as for the demands-stressor and social support-stressors
relationships, the findings generally supported the prediction of a negative effect of
control on stressors. This effect varied somewhat between analyses and across job
domains, being more consistent for qualitative, workload and interpersonal conflict
control than for the employees’ control.

122
Hypothesis 3 (additive effects of job demands and job control on stressors)
The hypothesized additive effects of demands and control on stressors was also
significantly supported. In Appendix D8, the regression analyses, control explained
significant amounts of effects in job stressfulness than individual or independent effect
alone. Furthermore, both demands and control were significant predictors of stressors in
the qualitative and qualitative, workload and conflict domains as well as for the total
scales (see Appendix D2).
Hypothesis 4 (additive effects of demands, control and social support on stressors)
The hypothesized additive effect of demands, control and social support on stressors
was supported better than it predicted independent and additive effects of demands and
control (see Appendix D11). In all cases where the interaction was significant, there
was a buffering and enhancing effects.
This hypothesis received considerable support from the correlational analyses, from
one-way ANOVAs, t-tests and multiple regression analyses. Social support was also
obtained from evidence that entry of all three job factors as predictors in the cross-
sectional regression equations yielded significant increases in predicting at each step in
several of the strain outcomes.
Hypothesis 5 (additive effects of control and social support on stressors)
The some control and social support interaction effects were significant and were
scattered widely into sub-sets. In our analysis, qualitative control predicts a significant
effect on all variables except somatic symptoms (see Appendix B1), employees control
predicts marginally significant effects on outcomes of strain and their outcomes (see
Appendix B2), workload control associated significantly with all variables except
somatic symptoms and vigor activity (see Appendix B3), and conflicts control was
associated similarly with variables of strain (see Appendix B4). Total control and social
support, individually, displayed a significant effect on different factors of model and
remained significant but not on vigor activity (sees Appendix D4 and D7). Control and
social support predicted stronger relationship than the independent effects alone to
justify the hypothesis (see Appendix 10). However, these consistent significant findings
provided sufficient grounds for accepting the hypothesis.
Hypothesis 6 (Independent effects of demands on strain)
Sub-sets of total demands (qualitative, employees, workload and conflicts) were

123
positively correlated with outcomes of strain (see Appendix D2). All of the demands
variables (collectively) were positively correlated with the four principal measures of
strain. Demands were more strongly related to job stress and job dissatisfaction than to
job somatic symptoms and job anxiety (see Appendix D3).
Hypothesis 7 (Independent effects of control on strain)
Total control was negatively related to the four measures of strain, although it predicted
dissatisfaction and stress, better than it predicted somatic symptoms and job anxiety
(see Appendix D3). Direct effects of four sub-sets of control on strain were strongest in
the job dissatisfaction and job stress than to job anxiety and somatic symptoms (see
Appendix B1, B2, B3 & B4).
Hypothesis 8 (additive effects of demands and control on strain)
Karasek’s (1979) and Karasek & Theorell (1990) reported additive job strain
hypothesis - that the combination of demands and control predict strain - received
mixed support. Sub-group analyses of Bradley (2004) revealed that employees in the
high demands and low control group reported the highest levels of all strain outcomes
except somatic symptoms. Our hierarchical regression analyses revealed that demands
predicted all four measures of strain, and that the addition of control at a subsequent
step in the analysis explained significant effects on all four outcomes of strain better
than the main effect alone (see Appendix D8).
Hypothesis 9 (interactive effects of demands, control and social support on strain)
The three-way interaction was significant in our multiple regression analyses (see
Appendix D11). The interaction involving the total job factor scales and social support
(supervisor support + colleague’s support) significantly predicted various immediate
outcomes and remote outcomes of strain except vigor activity scales. The interactions
involving the total job factor scales and social support were associated with several
significant effects, particularly supervisory support. However, the interactive effects of
these three factors were remained highly significant than the main effect of alone.
These significant findings provided the strong prediction of hypothesis 9.
Hypothesis 10 (interactive effects of job control and social support on strain)
The prediction that job control and social support buffers the stressor-strain
relationship. In both cross-sectional regression analyses, a majority of control-support
interactions was significant on immediate and remote outcomes of strain. Our cross-

124
sectional study (see Appendix D10), there were trends for interaction effects to be
significant more often with all factors except vigor activity.
4.12 Review of Main Findings from Study 1 In this chapter we reported findings from a cross-sectional, self-report study of 402
WAPDA (Pakistan) employees. Measures of demands, control, social support and
stressors (job stressfulness) were developed through pilot studies and multiple
regression analysis. Questionnaire items were factored into a common set of four
specific job content domains relevant to the work of a WAPDA’s employees:
qualitative, employees, workload, and interpersonal and management conflicts. The
development of parallel demands, control, social support and stressor scales in each of
these specific domains enabled the additive and interaction hypotheses to be tested by
congruent (rather than unrelated) pairs of variables. For the most part, the job factor
measures were shown to be reliable and to display satisfactory levels of independent
and collective interactional effects of validity. Effects of the job factors were
investigated using three complementary statistical techniques. Consistent with
Karasek’s (1979; Karasek & Theorell, 1990) model, demands, and (to a lesser extent)
control were shown to predict the various outcomes of job strain. The effects of
demands and social support were linear, and were robust across strain outcomes and
modes of statistical analysis. The effects of control were also linear, and, consistent
with past research (e.g. Bradley 2004, Pomaki & Anagnostopoulou, 2001; Sauter et al.,
1983), were strongest on all immediate and remote outcomes of strain and weakest on
vigor activity. The slightly weaker than expected effects of control (in some analyses)
may be partly attributed to its unexpectedly high correlation with demands and social
support. Similarly to Karasek’s buffering hypothesis and contrary to Bradley (2004),
there was significant evidence of a demands + control interactive effect on strain. The
major exception was an effect on job vigor activity in some outcomes of study. Several
researchers have argued that progress in the field of stress research requires
distinguishing between specific types of demands (see, e.g., de Jonge, Dollard et al.,
2000; Bradley, 2004) and/or control outcomes (see, e.g., Parkes, 1989; Troup & Dewe,
2002). They argued that different organizational culture and dimensions or nature of the
work environment have different effects upon immediate and remote outcomes of
strain.

125
The current analyses that included the measures of all four content domains resulted in
only a sub-group of these factors explaining significant amounts of effects on outcome
variables. Shared variance between these factors is not considerable except vigor
activity. Analyses that predicted strain on the basis of job factors from within a single
domain demonstrated that the specific demands and specific control scales predicted
stressors and strain with slightly differing effects.
Furthermore, four sub-group demands predicted outcomes of strain better than somatic
symptoms. Of the different control domains, qualitative control and workload issues
was the best predictor of strain. Control in the employees and conflicts domains
impacted little upon reported strain. Similarly, all congruent pairs of job factors were
almost equally predictive of strain: the combination of sub group of demands and
control generally explained significant effect on strain than did the main effect alone,
This last finding (see Appendix D2) may be interpreted as providing support for
Karasek’s theorizing in that the time/load domain more closely approximates his
conceptualisation of demands than do any of the other three content areas (see, e.g.,
Karasek & Theorell, 1990). Evidences were also obtained to indicate that different
strain outcomes were predicted best by different pairs of job factors. Thus, compared to
other domains, demands and control in the workload, qualitative and conflicts domain
were the best predictor of immediate and remote outcomes of strain, demands and
control in the employees domain explained some variance in job dissatisfaction.
Similarly, of all the interaction terms, that between conflict demands and conflict
control was the best predictor of stressors and strain, whilst (only) the interaction of
employees demands and control predicted strain at considerable low level. If replicated
in future studies, these relationships between specific job factors and specific strain
outcomes offer some targeting of work re-design the employees’ demands, vigor
activity and other organizational interventions that buffer the effects between stressors
and strain.
Karasek (1979) and Karasek & Theorell (1990) did not draw any distinctions between
the types of strain outcomes to be influenced by the job environment or organizational
culture. In Chapter 2 (in criticism), it was argued that they provided insufficient
justification for his (implicit) claim that all strain outcomes are impacted in broadly
similar ways by job demands and control. Later a proposed extension of Karasek’s &

126
Theorell (1990) models elaborated in the same chapter involved differentiating between
immediate (directly affected) and remote (indirectly affected) strain outcomes (also see
in model 6). The former groups were predicted to be more strongly influenced by the
work environment than was the latter. Exactly, the pattern of simple correlations matrix
in Study 1 was consistent with this distinction. Most correlations between the job
factors and symptoms were comparatively stronger compared to those of Karasek
(1979) and Bradley (2004) between the job factors and various immediate and remote
outcomes of strain. Regression analyses demonstrated that the job factors explained the
minimum proportion of the variance in stressors, then anxiety, job dissatisfaction, and
somatic symptoms. Multiple regression analyses showed that low level of the variance
in symptoms was explained when it was treated as an outcome of immediate strain (see
Appendix D1 to D8). Furthermore, the combine effects of stressors were strongly
predicted the immediate and remote outcomes of strain than the main effects alone.
These findings strongly predicted the hypothesis 3, 4, 8, and 9. The remote outcomes
of strain – absenteeism role were not studied with other variables due to weak
correlation. This relatively weak correlations between demands and absenteeism is
consistent with most past research findings (see, e.g., Bradley, 2004; De Jonge, Reuvers
et al., 2000; Dwyer & Ganster, 1991; Parkes, 1982, 1991; North et al., 1993; Terry &
Jimmieson, 1999). Building upon Karasek’s and Karasek & Theorell model, an
argument were presented in this study that stressors should be treated as a mediating
variable between the job factors and strain outcomes. Demands, control, and social
support interaction term were all found to significantly predict stressors, thereby
confirming hypotheses 1 to 5. These effects were obtained across several analyses and
job domains, although the effects of control and the interaction were most prominent
using the total, qualitative and conflict scales. Consistent with the mediated model
proposed in hypothesis 6 to 10, stressors reliably predicted all strain outcomes, and
were more highly correlated with job factor variables than were these outcomes.
Regression analyses demonstrated that stressors mediated the relationships between
demands and strain, on the one hand, and each of stress and somatic symptoms on the
other. Stressors were also shown to mediate the control-anxiety relationship. Multiple
regression analysis demonstrated that combine effects of stressors as a mediator, on
balance, provided a slightly better fit than did models (see model 2) that excluded these

127
relationships. Finally, Karasek (1979) presented numerous ideas regarding the influence
of three job factors on a range of strain, activity-participation, and personality
outcomes. Past researchers have typically investigated sufficient amount of subset of
these ideas. Strength of the current research was that it helped in extending broader in
scope and authenticity of most previous research. Further research thus appears
warranted in order to gain insights into the particular job factor-strain in developing the
relationships that are mediated by stressors.
In sum, Study 1 provided strong support for combine linear effects of demands and
control on job stressors and strain as well as main effect alone. The study provided
evidence of the superiority over Karasek’s model of alternative models that (a) include
mediating variables and (b) make temporal distinctions between strain outcomes. More
generally, the study provided support for the argument that advances in our
understanding of occupational stress processes require drawing final distinctions
between facets of job demands and control and between types of strain.
Findings were interpreted within these boundaries:
(i) Cross-sectional design: all data were collected on a single
occasion process continued for nine months;
(ii) Wider scope: most variables included in Karasek’s original
(1979), Karasek& Theorell (1990) and Bradley (2004) job strain
model were measured;
(iii) Modest sample size: the sample of 402 was adequate to perform
the analyses; and
(iv) Self-report measures: all measures were based on self-reports,
with consequent risks that findings could be systematically
unclear by response biases and lack of interest.
Study 2 was designed to proof the authenticity of study 1 and thus to provide a more
valid and logical proof of test of Karasek’s hypothesis and models.

128
Chapter # 5
5.0 STUDY 2 TESTING OF HYPOTHESES AND MODELS 5.1 Overview Study 1 conducted through use of self-reported measures and a cross-sectional design
to test the main, additive, quadratic, and interaction effects of three job factors
(demands, perceived control, social support and stressors) on various immediate and
remote outcomes of strain. Study 2 develop on previous research (study 1) by using an
extended set of independent and dependent variables to assess the validity of study 1
and a number of additional effects. Study 2 included measures stressors- strain
relationship of various types of strain outcomes, three types of activity participation,
and a range of personality variables and work-environment variables. Most variables
were measured through self-reports obtained on two occasions approximately nine
months of the gap.
The 10 hypotheses investigated in Study 1 were also tested in Study 2 to provide the
validity of data.
5.2 Additional predictions of Hypotheses Hypotheses involving Demands, Control, Social Support and Stress & Strain
11-14. Hypotheses 11 (independent effects of social support on stress), 12 (additive
effects of job demands and social supports on stress), 13 (independent effects of social
support on strain) and 14 (additive effects of job demands and social supports on strain)
were developed from Study 1, and above hypotheses, also hold true when the stress &
strain outcomes are the outcome variables, except that demands, control and support
are all positively related to these outcomes, and their interaction effects are always
consistent or more often enhancing.
Hypotheses involving Demands, Control, Social Support and Neuroticism
15-19. Hypotheses 11-14 above also hold true when there is change in levels of
neuroticism as a outcome variable, except that demands are positively related, and
control and support negatively related, to this outcome. Control and social support
buffer the relationship between demands and changes in neuroticism.

129
Hypotheses involving Demands, Control, Social Support and Mastery
22-28. Hypotheses 15-19 above also hold true when change in levels of mastery is the
outcome variable. All three predictors are positively related to this outcome, and their
interaction effects are always consistent and enhancing. The remaining hypotheses
were tested using three time-frames: (a) cross-sectionally at T1, and (b) cross-
sectionally at T2. The reasons for also performing analyses on the cross-sectional data
require some explanation. Firstly, Study 1 used a cross-sectional design, separate
analyses of the T1 and T2 data in Study 2, permitted the Study 1 findings to be
compared with Study 1 to provide the authenticity. Similarly, conducting the cross-
sectional analyses two times enables relationships identified at T1 to be validated at T2.
Secondly, cross-sectional analyses test the possibility that the same job factors have an
immediate or very rapid, two time effects upon the outcome variable. These effects
may go undetected if only longitudinal analyses are performed by changing certain
circumstances, and the effects dissipate over the period by taking some measures.
Thirdly, the relationships are significant in cross-sectional analyses, but not
longitudinally, suggest that the job factors have a rapid onset, short duration effects on
the outcomes.
In Study 1, linear and multiple regression analyses used the 16 items measuring each of
demands, control and social support to predict the immediate and remote outcomes of
strain. These items tapped four correlated aspects of the work of WAPDA (Pakistan),
namely (a) qualitative factors, (b) employees issues, (c) workload factors, and (d)
interpersonal conflict. The Study 2 questionnaire included these three sets of 16 items.
The first stage of the Study 2 data analysis sought to confirm the factor structure of (a)
these job factor variables, and (b) the measures of strain used in Study 1. Subsequent
analyses tested these scales’ divergent validity, reliability, and change over time
through short study. The remainder of this chapter details these analyses step by step.
Descriptive statistics pertaining to the scales, and bivariate correlations between them
and the personal and work factors, are also studied. Multivariate statistical analyses
testing the Study 2 hypotheses are reported in subsequent analysis.
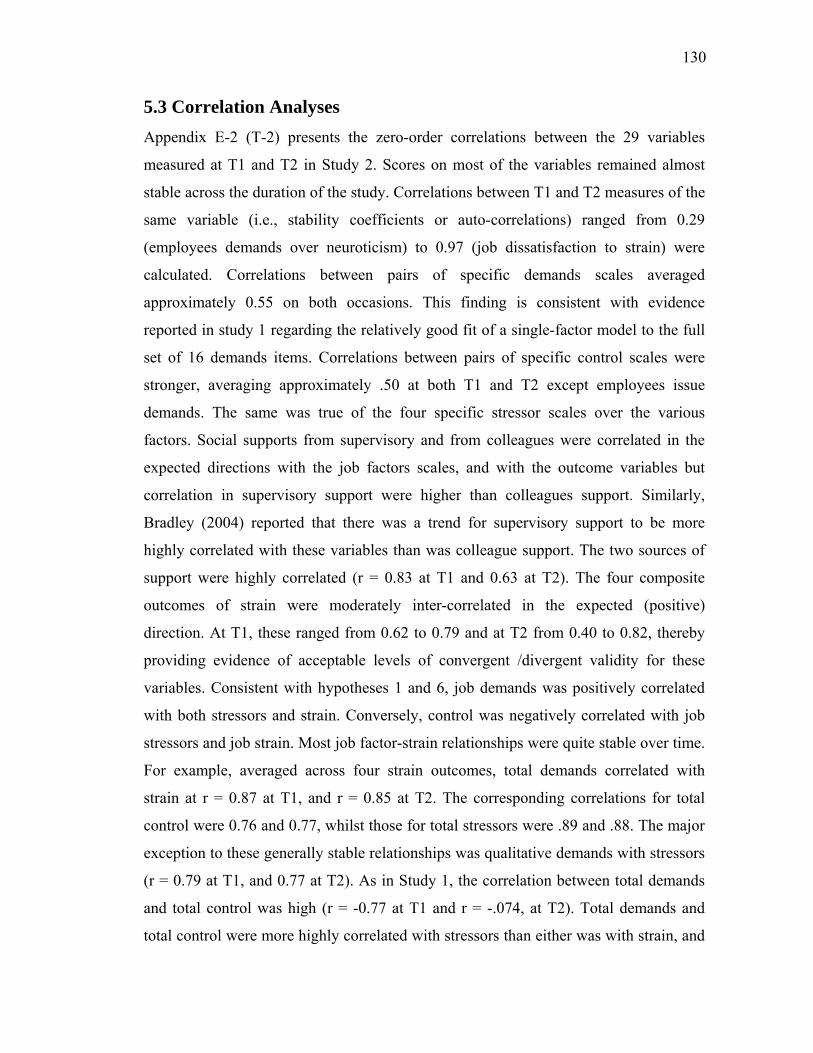
130
5.3 Correlation Analyses Appendix E-2 (T-2) presents the zero-order correlations between the 29 variables
measured at T1 and T2 in Study 2. Scores on most of the variables remained almost
stable across the duration of the study. Correlations between T1 and T2 measures of the
same variable (i.e., stability coefficients or auto-correlations) ranged from 0.29
(employees demands over neuroticism) to 0.97 (job dissatisfaction to strain) were
calculated. Correlations between pairs of specific demands scales averaged
approximately 0.55 on both occasions. This finding is consistent with evidence
reported in study 1 regarding the relatively good fit of a single-factor model to the full
set of 16 demands items. Correlations between pairs of specific control scales were
stronger, averaging approximately .50 at both T1 and T2 except employees issue
demands. The same was true of the four specific stressor scales over the various
factors. Social supports from supervisory and from colleagues were correlated in the
expected directions with the job factors scales, and with the outcome variables but
correlation in supervisory support were higher than colleagues support. Similarly,
Bradley (2004) reported that there was a trend for supervisory support to be more
highly correlated with these variables than was colleague support. The two sources of
support were highly correlated (r = 0.83 at T1 and 0.63 at T2). The four composite
outcomes of strain were moderately inter-correlated in the expected (positive)
direction. At T1, these ranged from 0.62 to 0.79 and at T2 from 0.40 to 0.82, thereby
providing evidence of acceptable levels of convergent /divergent validity for these
variables. Consistent with hypotheses 1 and 6, job demands was positively correlated
with both stressors and strain. Conversely, control was negatively correlated with job
stressors and job strain. Most job factor-strain relationships were quite stable over time.
For example, averaged across four strain outcomes, total demands correlated with
strain at r = 0.87 at T1, and r = 0.85 at T2. The corresponding correlations for total
control were 0.76 and 0.77, whilst those for total stressors were .89 and .88. The major
exception to these generally stable relationships was qualitative demands with stressors
(r = 0.79 at T1, and 0.77 at T2). As in Study 1, the correlation between total demands
and total control was high (r = -0.77 at T1 and r = -.074, at T2). Total demands and
total control were more highly correlated with stressors than either was with strain, and

131
stressors were more closely associated with strain than were demands and control.
These findings are consistent with hypothesis 11, predicting stressors to mediate the job
factors-strain relationships. The expected positive correlations between the job factors
and vigor activity measures were not found consistently due to scale construction.
Indeed, the correlations (in vigor activity) were generally weak: were less than 0.20
except with job anxiety. On both occasions of T-1 and T-2, almost all of the
correlations involving demands were negative, rather than positive. However, some
findings were in accord with expectations: for example, the job anxiety scales were
consistently and positively correlated with vigor-activity. Bradley, (2004) reported the
similar results through cross-sectional and longitudinal studies.
The two personality dimensions - neuroticism and mastery - were highly correlated
with all factors of model (mean r = .72 at T1 and r = .60 at T2). Both variables were
also strongly correlated with the job stressors and strain outcomes. Mastery was more
closely related to job stress, neuroticism, somatic complaints, and job anxiety. The two
activity-participation variable (job participation and job consideration) significantly
correlated with all stressors, remote and immediate outcomes of strain (see Appendix E
1 & E 2). In sum, all other variables (social support, employee’s turnover intention, and
job performance) were highly correlated with (a) total of stressors and sub-groups (b)
immediate and remote outcomes of strain (c) activity participation, (d) personality
variables.
Comparisons with correlations reported in past research (see Appendix E 1-2), reveal
that the Study 2 measures of demands and control were correlated in the same direction
with all measures of strain, but somewhat slightly lower than typically reported in the
study 1. Study 2 correlations involving social support were similar to those previously
reported (see Appendix E-2). As in past research and in Study 1, Study 2 demands (also
sub-groups) measures were better predictors of strain than were the measures of
control. These consistencies between the current and typical past findings are evidence
of the validity of the measures used in this study 2. Respondents need not to be same in
both studies because data collection scale was associated with nature of work, work
environment, organizational policies and practices, which were remained same
throughout the periods. Finally, it is concluded that study 2 designed to develop and

132
test multi-item scales to measure the Study 1 predictor, moderator and criterion
variables and to extend the model of Karasek and Theorell (1990). Interestingly, the
scales developed in study 1 were reliable and factorially-consistent across both job
factors and times of measurement. Zero-order correlations between all pairs of
variables were also reported. With the major exception of correlations between
demands and the vigor activity, these correlations were found to be in the direction, and
of the authenticity, expected on the basis of past researches (particularly Bradley, 2004)
and Study 1 measurements. 5.4 Study 2 Tests of Stress Hypotheses This section reports the Study 2 results pertaining to the relationships between the job
factors (demands, control, and social support) and stress. This chapter reports Study 2
findings related to the prediction of job stressors (hypotheses 1-5). It seeks answers to
the question: to what extent, and in what ways, do the job factors predict WAPDA’s
employees of the stressfulness of their jobs? Findings from three data analytic
techniques are reported: correlations, “sub-group” analyses (ANOVA), linear &
multiple regressions. Evidence relating to quadratic and interactive effects of the job
factors on stressors is also reported.
5.4.1 Main Interactive Effects on Job Stress This study reported the correlations between the job factors (demands, control, and
social support) and stressors. All measures of demands were shown to be positively
correlated with job stress, whilst measures of control and social support were
negatively related to job stress. The cross-sectional study reported that the four
demands scales (total demands plus each of the four sub-group demands scales) were
highly correlated with corresponding five stress scales (see Appendix E 1 & E 2). The
correlation between the control and stressors scales was also highly significant but
slightly less than demands and stress interaction. Compared with other stressor
domains, supervisor support was more highly correlated with job stress (including four
sub-groups) than colleagues support in both study 1 & 2. These correlations provided
strong evidence for main or independent effects of demands (hypothesis 1) and control
(hypothesis 2), and more modest evidence for the effects of social support (hypothesis
5). In sum, Bradley (2004) reported that the composite outcomes were not better at

133
predicting total stressor levels than was the better (best) relevant single job factor
measure. Therefore, additive effects were used only in regression analysis.
Furthermore, several sets of analyses were performed to compare the magnitude of a
single stressors across sub-groups of the sample defined by the demands, control and
job stress as job factors. These analyses followed procedures adopted in past
researches, and, in Study 1. All sub-groups of total demands, total control and total
stressors were highly correlated with all job factors and strain outcomes (see Appendix
E 1 & E 2). 5.4.2 Regression Analyses Tests for possible main, additive and quadratic effects between the job factors and
stressors yielded significant finding. Hierarchical regression models were computed
using the total demands, control and stressor scales. Hypothesis 3 predicted an additive
effect of demands and control on job stress, hypothesis 4 predicted a similar demands +
control + social support effect, and hypothesis 12 predicted a control + support additive
effect. As an initial test of these hypotheses, the job factor measures were standardized,
and the following variables computed using these standardized variables:
Total Demands plus Total Control (see Appendix D 8, T-1 & T-2)
Total Demands plus Social Support (see Appendix D 9, T-1 & T-2)
Total Control plus Social Support (see Appendix D 10, T-1 & T-2)
Total Demands plus Total Control plus Social Support (see Appendix D 11, T-1 & T-2)
These variables were computed for T1 and T2 data separately. Since gender and age
were not significantly correlated with total stressors, these were excluded as control
variables. Significant predictors of T1 and T2 were demands (T1, β = .83, and T2, β =
.82, p < .001), control (β = -.76 and -.74, p < .001), supervisor support (β = -.85 and -
.84, p < .001) and colleagues support (T1, β = -.85, and T2, β = -.69, p < .001).
Additive interaction term was highly significant than that of main effect alone
(although the demands plus control interaction approached significance, p = .001).
Overall, the findings that T1 measures of total demands, total control, and supervisor
support predict T1 stressors in the first model, and that these same factors measured at
T2 predict T2 stressors, controlling for pre-existing levels of predictors and criterion in
the third model, provide strong support for hypotheses 1, 2 and 12, respectively. In

134
contrast, the analyses strongly support hypothesis 12 (colleague support), or any of the
interaction effects. Findings were similar to the above. Under the basic model,
significant predictors T1 and T2 were demands (R2 = .68 and .69, p < .001), control (R2
= .75 and .55, p < .001), supervisor support (R2 = .77 and .44, p < .001), and the
demands plus control interaction (R2 = .73 and .72, p < .001), demands plus control
plus social support (R2 = .80 and .71, p < .001). These analyses strongly support the
hypotheses 1, 2, 3, and 4. As shown, the T2 specific stressor scale scores were
predicted by the corresponding demands variable in all four domains (sub-group) and
by the corresponding control variables. Most of these effects were significant in all four
regression Tables. Supervisor support predicted qualitative stressors at all levels, but
Colleague support did not predict so significantly to specific stressor variables. All of
the interaction terms predicted stressor scores consistently across the all sub-group
analysis (see Appendix A, B, C, and D). However, the demands plus control
interaction, and the control plus colleague support interaction, were each significant
predictor of all domain four stressors. In sum, these analyses of the specific job factor
data provide quite strong support for the main and additive effects of demands and
control (hypotheses 1-3), moderate support for main and additive effects involving
social support (Hypotheses 5). 5.4.3 Evaluation of Karasek Original Model Karasek (1979) presented a job strain model according to which various outcomes of
strain are result from the interaction of job demands and job control. This original model
predicts that mental strain and job dissatisfaction are the combination of high job
demands with low job control. Therefore, four types of jobs predicts through this model
which might result from different combinations of job demands and job control: passive
jobs (low demands and low job control), low strain jobs (low demands and high job
control), high strain jobs (high job demands and low job control), and active jobs (both
high demands and high job control). According to Karasek (1979), the first condition,
when job demands are relatively higher than job control results high strain job, is of
primary importance in conducting research study. Furthermore, passive jobs are
dissatisfying job, whilst active jobs are associated with more satisfaction and reduced
depression of employees, even if they are more challenging (Karasek & Theorell, 1990).

135
Similarly, an active job is associated with outcomes such as job motivation, job
involvement, learning, personal growth and job innovation (Karasek & Theorell, 1990).
Table 5.1 Comparison of Various Levels of Strain Across Four Types of Job
Time-1
Outcomes Variables Measures
Low Strain Job (low demands-
high control)
High Strain Job (high demands-
low control)
Active Job (high
demands-high
control)
Passive Job (low
demands-low
control) N 48 229 50 74
Mean 2.16 3.17 2.87 2.71 Total Stressors SD 0.44 0.45 0.43 0.45 N 48 229 50 74
Mean 2.02 3.95 2.82 3.09 Strain SD 0.36 0.49 0.35 0.60 N 48 229 50 74
Mean 2.19 3.04 2.89 2.75 Job Anxiety SD 0.41 0.31 0.45 0.53 N 48 229 50 74
Mean 2.22 3.77 2.14 2.88 Job Dissatisfaction SD 0.31 0.41 0.34 0.41
N 48 229 50 74 Mean 1.89 3.12 2.94 2.83 Somatic
Complaints SD 0.60 0.53 0.38 0.61 N 48 229 50 74
Mean 3.33 2.22 2.77 2.00 Job Performance SD 0.27 0.38 0.41 0.51
N 48 229 50 74 Mean 1.85 3.08 3.00 1.95 Mastery Scale SD 0.61 0.46 0.45 0.65 N 48 229 50 74
Mean 1.81 2.92 2.65 2.75 Negative Personality SD 0.45 0.39 0.47 0.44
N 48 229 50 74 Mean 1.85 3.85 2.02 2.68 E. Turnover
Intention SD 0.45 0.63 0.52 0.50 N 48 229 50 74
Mean 1.75 2.65 2.61 2.75 Neuroticism SD 0.40 0.35 0.31 0.46 N 48 229 50 74
Mean 3.31 2.33 3.10 2.07 Job Participation SD 0.34 0.40 0.47 0.49
N 48 229 50 74 Mean 3.96 2.88 2.96 1.48 Job
Consideration SD 0.42 0.52 0.41 0.54 Note: N = Number of participants; SD = Standard Deviation The given model encompasses a succeeding theoretical prediction concerning the
diagonal running from passive to active jobs and stepping down from low strain to high

136
strain. This study is critically evaluated Karasek’s (1979) original presentation of the job
strain model in the form of comparisons between groups of workers broken down by
levels of job demands and/or job control. Similar analyses are performed on the current
data set. Current analyses using the total job factor scales only are reported.
Table 5.2 Comparison of Various Levels of Strain Across Four Types of Job
Time-2
Outcomes Variables Measures
Low Strain Job (low demands-
high control)
High Strain Job (high demands-
low control)
Active Job (high
demands-high
control)
Passive Job (low
demands-low
control) N 30 129 48 81
Mean 2.24 3.65 3.61 2.64 Stressors SD 0.62 0.49 0.54 0.51 N 30 129 48 81
Mean 2.30 3.74 3.41 2.95 Strain SD 0.55 0.48 0.55 0.49 N 30 129 48 81
Mean 2.19 3.00 2.99 2.51 Job Anxiety SD 0.40 0.46 0.48 0.31 N 30 129 48 81
Mean 2.56 4.50 4.01 3.82 Job Dissatisfaction SD 0.81 0.73 0.76 0.79
N 30 129 48 81 Mean 1.94 3.18 3.00 2.55 Somatic
Complaints SD 0.69 0.57 0.62 0.57 N 30 129 48 81
Mean 3.48 1.88 3.58 1.64 Job Performance SD 0.61 0.56 0.62 0.58
N 30 129 48 81 Mean 1.93 3.14 2.98 2.11 Mastery Scale SD 0.67 0.52 0.71 0.57 N 30 129 48 81
Mean 1.86 2.98 2.03 2.55 Negative Personality SD 0.55 0.44 0.49 0.71
N 30 129 48 81 Mean 1.96 3.96 1.99 2.88 E. Turnover
Intention SD 0.77 0.67 0.75 0.64 N 30 129 48 81
Mean 1.82 2.70 2.44 2.64 Neuroticism SD 0.47 0.41 0.61 0.58 N 30 129 48 81
Mean 3.32 2.19 3.67 2.04 Job Participation SD 0.50 0.42 0.66 0.45
N 30 129 48 81 Mean 3.16 2.23 3.05 2.11 Job
Consideration SD 0.47 0.39 0.74 0.38 Note: N = Number of participants; SD = Standard Deviation

137
Groups with higher demands and low control reported greater levels of stress on
immediate and remote outcomes of strain (see Table 5.1 & 5.2). These findings provide
strong support for hypotheses 1 (total demands on total stressors) and 5 (total demands
on strain). Similar analyses are performed using sub-groups determined by levels of
total control on various outcomes. The effect of low demands and greater control on 10
outcomes of strain are highly significant when two, three, or four levels of control are
used to form sub-groups. These analyses in Table 5.1 and Table 5.2 (T1 & T2) are
significantly correlates with original finding of Karasek. These findings generally
support hypotheses 4 (control on stressors) and 8 (control on strain).
Furthermore, Table 5.1 & Table 5.2 (T1 & T2) show total demands and total control
scales used to assign participants to “high” and “low” groups on each job factor, and
these are combined to form four groups representing all possible combinations of high
and low demands and control levels. Validity tests for possible additive effects are
conducted (by SPSS) by comparing mean levels of 10 immediate and remote outcomes
of total stressors and strain across these groups. Analyses that examined the effects on
outcomes of strain provided a direct test of Karasek’s (1979) original four-quadrant
model of job factors.
As can be seen from the sub-group means and standard deviation tests given in Table
5.1 & 5.2, there are clear trends in the expected direction, that is, participants employed
in high demands/low control(“high strain”) jobs reported the highest levels of job
stress, strain outcomes, whilst those in low demands/high control jobs reported fewest
stressors and least strain. Table 5.1 & 5.2 show that the pattern of group means from
lowest levels of strain outcomes in low demands/high control jobs, to highest levels of
strain in high demands/low control jobs, are consistent with Karasek’s (1979) four-
quadrant model of job strain. Table 5.1 & 5.2 also show that a pattern of group means
broadly consistent with the demands + control + support hypothesis is also evident.
Multivariate effects for the “isostrain” job type variable on all 10 strain outcomes are
highly significant: at T1and T2.
In each case (T1 & T2), jobs that are high in demands and low in both control and
support have the highest levels of strain; those that are low in demands and high in
control and support have the lowest strain levels.

138
In these cases, means values varied in the predicted order (highest strain in the high
demands-low control and lowest strain outcomes in the low demands –high control),
and the amount of differences between means values of all job factors are as expected.
Similarly, high strain values of means are expected in low demands-low control group
as compare to high demands-high control group. Therefore, high and low mean values
are strongly associated with the role of immediate and remote of strain. In all these
cases significant interactions are consistent with expectations-thereby providing strong
support for relevant hypothesis.
5.5 Summary of Findings from Stressors and Job Stress
Hypotheses 1 and 2 (Independent effects of job demands and job control on job
stress)
These hypotheses were strongly supported. Reliable effects of demands and control on
stressors were shown both in study 1 and 2, but demands were slightly better predictor
of stress than control. Therefore, in all analyses, stressors was more closely related to
demands plus four sub-groups than to control, but not control, predicting changes over
time in stressors.
Hypothesis 11 (main effects of social support on job stress)
Both correlation and sub-group analyses provided evidence for the predicted main
effects of social support (supervisory support and colleagues support) on stressors. The
effect was significant for both types of support in study 1 and 2 sub-group analyses.
The contribution of supervisor support to the explanation of total stressors held in both
studies was remained highly significant. However, the effect of colleague support was
not so significant in most linear and multiple regression analysis. On balance,
hypothesis 5 and 10 (main effects of social support) was further confirmed.
Hypothesis 3 (additive effects of demands and control on job stress)
The (total) demands plus control composite variable was more highly correlated with
total stressors than was demands and control alone. However, ANOVAs using
composite job factor variables provided strong support for the demands plus control
additive effect. Furthermore, both study 1 and study 2 different regression analyses
indicated that demands and control explained significant amount in variance in
stressors. Therefore, the hypothesis was confirmed.

139
Hypothesis 12 (additive effects of demands and support on job stress)
The demands plus social support hypothesis was significantly supported by the
regression analysis, and also received strong support from the various sub-group
analyses (see Appendix D9 combine). In both the study 1 and study 2 analyses,
demands and social support (but not individually) were significant predictors of total
stressors. Similarly, findings from the regression analyses were consistent with
demands plus supervisor support and demands plus colleague support, significant effect
on stressors. Hypothesis 12 total demands and social support was confirmed.
Hypothesis 4 (additive effects of demands, control and support on job stress)
This hypothesis was strongly supported by the multiple regression analysis (see
Appendix D11), and also received clear support from the various sub-group analyses.
Multiple regressions provided full support to combine effects better than main effect
alone. Furthermore, such analyses provided strong support for additive relationships
involving supervisory, but slightly less convincing for colleagues social support.
Hypothesis 4 total demands total control and social support interaction was confirmed.
Hypothesis 5 (additive effects of control and social support on job stress)
Regression analyses showed that control plus supervisor social support was the only
additive variable that predicted stressors better than either of its component factors (see
Appendix D15). Both study 1 and study 2 one-way ANOVAs involving the composite
control plus social support variables yielded significant effects and a pattern of group
means consistent with the hypothesis. In most regression analyses, control plus
supervisor support was more consistently associated with significant effects than was
control plus colleague support. Therefore, hypothesis 5 (control plus supervisory
support) was strongly supported, whereas the evidence was less convincing in respect
of control plus colleagues support.

140
5.6 Discussion on Main Findings Regarding Stressors
Hypotheses Karasek (1979), and Karasek & Theorell (1990), consistently argued that job demands
and job control have direct effects on job stress. Their fundamental theory and original
models do not include anything corresponding to the current stressor variables. But
current research concluded that perceived job stressfulness is an important mediator of
the job factors - strain relationship. Both demands and control are likely to have strong
additive effects upon these more proximate outcomes than main and interaction effects.
The findings from Study 1 and study 2 strongly supported this theory. At this stage we
made it clear that Karasek’s (1979, and subsequent) writing, appraisals of job
stressfulness appear to be a joint function of environmental and personal factors but
latter they extended to role of supervisor, management policies, colleagues support and
nature of work. Results of this study reported further evidence of the independent linear
and additive effects of demands and control on stressors, and provide moderately
strong support for a similar role played by supervisor social support among the
employees. The results were also generally consistent with the additive effects of
demands, control and supervisor support on stressors, and provide significant support
for demands plus control interaction effect on job stress and job strain. In past few
researchers put attention on additive effects on job stressfulness, despite the potential
theoretical and practical implications of the existence of such effects. The current
results are reasonably consistent in suggesting that significant amount of power are
obtained through the inclusion of multiple job factors to account for variance in job
stress. It is concluded that current findings demonstrated that the two job resources of
control and (particularly, supervisor) social support act in a supplemental, rather than
substitutive manner, in reducing perceptions of job stress and strain. A significant
buffering role of control on the demands-stressor relationship in study 1 was obtained
through main and sub-group regression analyses (see Appendix T1 of A, B, and C).
These significant effects were obtained in through cross-sectional design and a limited
number of (competing) predictors. Findings from Study 2 are broadly consistent with
these earlier results. Significant demands and control outcomes were obtained in both
the study 1 and study 2 data analyses. Furthermore, there was evidence, as there was in

141
Study 1, that the results were slightly strong and consistent in predicting stressors in the
main and sub-group analysis. The interaction was also significant in predicting
qualitative, workload and interpersonal conflicts, but was never so in predicting
employees issues stressors. Our results were consistent and developed significant
relationships between demands, control and (supervisor) support, but also less
consistent with additive and interactive effects associated with these variables, must be
placed systematically within the context of this study. A cross design was used to help
clarify the direction of effects and helped to control for common occasion biases and to
provide the valid proof of two time study. 5.7 Study 2 Tests of Job Strain Hypotheses This current study 2 reports the results pertaining to the relationships between the
various job factors (demands, control, social support, and stressors) and outcomes of
strain.
5.7.1 Correlation Analyses of Strain Outcomes 5.7.1.1 Independent Effects of Job Factors on Job Strain
Zero-order correlations (see Appendix E 1 and E 2) show that the measures of demands
were positively correlated with all outcomes of strain, and the measures of control and
social support (supervisory support and colleagues supports) were negatively correlated
with the strain outcomes. At the same time all of these correlations matrix were highly
significant (usually at p < .001), they were not modest in size, indicating that the less
proportions of variance in single job factors. The total demands and supervisory
support variables tended to be more highly correlated with job strain than were the
control and employees support factors. Employees’ demands in study 2 and colleague
support in both the studies were on average, less closely related to job strain than were
other job factors. On average (and ignoring signs), the job factors were most highly
correlated with the measure of strain than stress. The additive effects of the job factors
upon strain, correlations were computed between the job strain variables and each of
the composite variables (e.g., demands - control, and social support). The size of each
of these correlations was compared with the corresponding correlation between the
strain outcome and the single component job factor that had the highest correlation
with the outcomes (see Appendix E1). For the additive hypotheses to be confirmed,

142
these composite outcomes should be more highly predicted with the outcomes than was
the (better or best predicting) job factors than that of independent effects. In particular,
job dissatisfaction was consistently more highly correlated with the all variables except
with employees’ demands than with the best single job factor, although differences
were not large enough. In short, all factors were strongly correlated with each other
except two: firstly, vigor activity and colleagues support in study 1, secondly,
employees demands in study 2. Overall, these findings provide quite strong support for
the additive effects predicted in hypotheses 6 to 10. 5.7.2 Multiple Regression Analyses Hierarchical multiple regression analyses were used to assess possible independent,
additive and quadratic effects of the job factors on strain. Specific procedures followed
were as previously described in study 1 and stressors analyses. Hierarchical regression
analysis and models computed for each strain variable used the same set and sequence
of predictors as in the prediction of stressors (see Appendix D 8-11). Separate analyses
were performed on the T1 and the T2 data to find out the validity of study 1 and to
discuss the variance of outcomes.
5.7.2.1 (a) Main and Additive Effects of Job Factors on Job Anxiety Appendix D1 to D11 (Time 1 & 2) shows that the job factors are explained significant
of variances in immediate and remote outcomes of strain. The summary of job factors
explained the variance in job anxiety is as: 1-Total demands explained 56% at T1 and 54% at T2 (see Appendix D3),
2-Total control explained 42% at T1, and 38% at T2 (see Appendix D4 of T1 & T2),
3-Supervisory support explained 63% at T1, and 60% at T2 (see Appendix D5 of T1 & T2),
4-Colleagues support explained 53% at T1, and 29% at T2 (see Appendix D6 of T1 & T2),
5-TD + TC explained 57% at T1 and 54% at T2 (see Appendix D8 of T1 & T2),
6-TD + SS explained 63% at T1 and 56% at T2 (see Appendix D9 of T1 & T2),
7-TC + SS explained 61% at T1, and 51% at T2 (see Appendix D10 of T1 & T2), and
8-TD + TC + SS explained 63% at T1, and 57% at T2 (see Appendix D4 of T1 & T2).
Note: TD = Total Demands, TC = Total Control and SS= Social Support.
At both times, R2 change for job factors were remained significant at p < .001, but non
of the factor measures, added non-significant to the variance explained. However,
Supervisory support and combine effect of demands + control + social support were
highly significant predictor of strain outcomes than others.
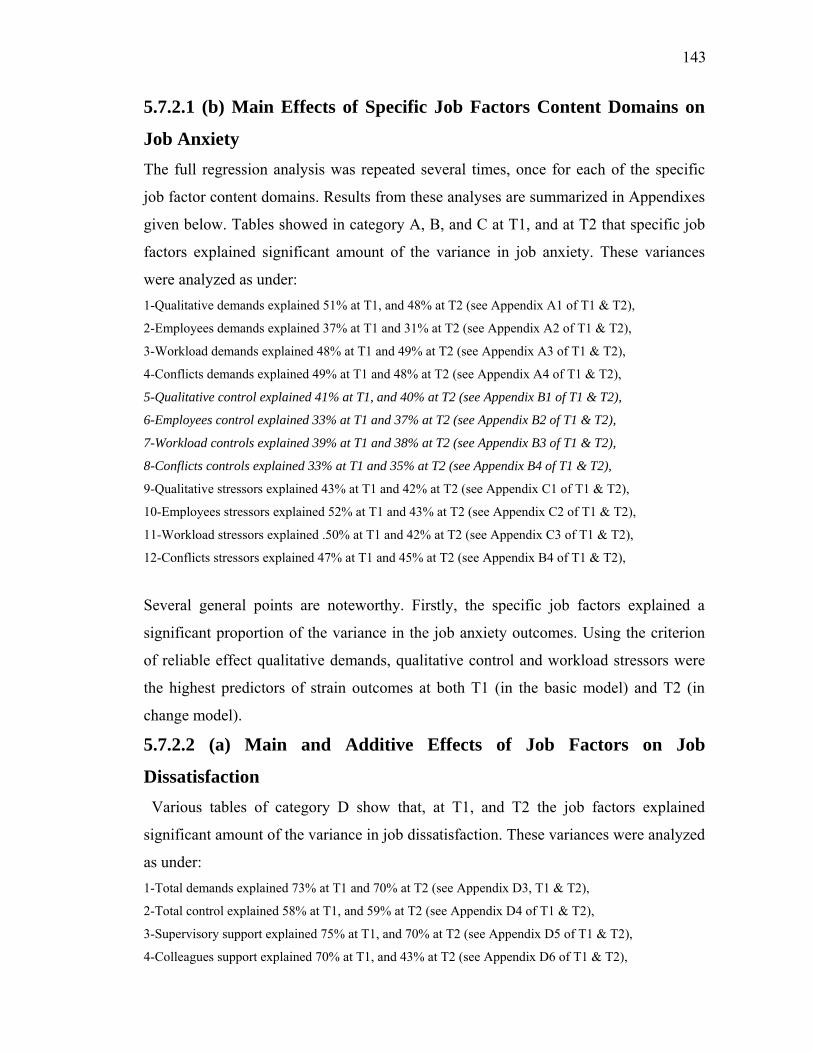
143
5.7.2.1 (b) Main Effects of Specific Job Factors Content Domains on
Job Anxiety The full regression analysis was repeated several times, once for each of the specific
job factor content domains. Results from these analyses are summarized in Appendixes
given below. Tables showed in category A, B, and C at T1, and at T2 that specific job
factors explained significant amount of the variance in job anxiety. These variances
were analyzed as under: 1-Qualitative demands explained 51% at T1, and 48% at T2 (see Appendix A1 of T1 & T2),
2-Employees demands explained 37% at T1 and 31% at T2 (see Appendix A2 of T1 & T2),
3-Workload demands explained 48% at T1 and 49% at T2 (see Appendix A3 of T1 & T2),
4-Conflicts demands explained 49% at T1 and 48% at T2 (see Appendix A4 of T1 & T2),
5-Qualitative control explained 41% at T1, and 40% at T2 (see Appendix B1 of T1 & T2),
6-Employees control explained 33% at T1 and 37% at T2 (see Appendix B2 of T1 & T2),
7-Workload controls explained 39% at T1 and 38% at T2 (see Appendix B3 of T1 & T2),
8-Conflicts controls explained 33% at T1 and 35% at T2 (see Appendix B4 of T1 & T2),
9-Qualitative stressors explained 43% at T1 and 42% at T2 (see Appendix C1 of T1 & T2),
10-Employees stressors explained 52% at T1 and 43% at T2 (see Appendix C2 of T1 & T2),
11-Workload stressors explained .50% at T1 and 42% at T2 (see Appendix C3 of T1 & T2),
12-Conflicts stressors explained 47% at T1 and 45% at T2 (see Appendix B4 of T1 & T2),
Several general points are noteworthy. Firstly, the specific job factors explained a
significant proportion of the variance in the job anxiety outcomes. Using the criterion
of reliable effect qualitative demands, qualitative control and workload stressors were
the highest predictors of strain outcomes at both T1 (in the basic model) and T2 (in
change model). 5.7.2.2 (a) Main and Additive Effects of Job Factors on Job
Dissatisfaction Various tables of category D show that, at T1, and T2 the job factors explained
significant amount of the variance in job dissatisfaction. These variances were analyzed
as under: 1-Total demands explained 73% at T1 and 70% at T2 (see Appendix D3, T1 & T2),
2-Total control explained 58% at T1, and 59% at T2 (see Appendix D4 of T1 & T2),
3-Supervisory support explained 75% at T1, and 70% at T2 (see Appendix D5 of T1 & T2),
4-Colleagues support explained 70% at T1, and 43% at T2 (see Appendix D6 of T1 & T2),

144
5-TD + TC explained 76% at T1 and 74% at T2 (see Appendix D8 of T1 & T2),
6-TD + SS explained 81% at T1 and 71% at T2 (see Appendix D9 of T1 & T2),
7-TC + SS explained 79% at T1, and 70% at T2 (see Appendix D10 of T1 & T2), and
8-TD + TC + SS explained 82% at T1, and 76% at T2 (see Appendix D4 of T1 & T2).
Note: TD = Total Demands, TC = Total Control and SS= Social Support.
At both times, R2 changes for job factors were remained significant at p < .001. Several
points are noteworthy. Firstly, none of the main, additive and quadratic effects for
various job factors were non-significant, Secondly, additive effects were highly
significant than that of main effect alone, and thirdly, all findings were consistent
except colleagues support which was decline considerably. 5.7.2.2 (b) Main Effects Specific Job Factors Content Domains on Job
Dissatisfaction The linear regression analysis was repeated this time, once for each of the specific job
factor content domains. Results from these analyses are summarized in Appendixes
given below. Tables showed in category A, B, and C at T1, and at T2 that specific job
factors explained significant amount of the variance in job dissatisfaction. These
variances were analyzed as under: 1-Qualitative demands explained 65% at T1, and 63% at T2 (see Appendix A1 of T1 & T2),
2-Employees demands explained 68% at T1, and 46% at T2 (see Appendix A2 of T1 & T2),
3-Workload demands explained 66% at T1, and 67% at T2 (see Appendix A3 of T1 & T2),
4-Conflicts demands explained 64% at T1, and 62% at T2 (see Appendix A4 of T1 & T2),
5-Qualitative control explained 54% at T1, and 57% at T2 (see Appendix B1 of T1 & T2),
6-Employees control explained 47% at T1, and 47% at T2 (see Appendix B2 of T1 & T2),
7-Workload controls explained 53% at T1, and 53% at T2 (see Appendix B3 of T1 & T2),
8-Conflicts controls explained 48% at T1, and 48% at T2 (see Appendix B4 of T1 & T2),
9-Qualitative stressors explained 59% at T1, and 63% at T2 (see Appendix C1 of T1 & T2),
10-Employees stressors explained 42% at T1, and 56% at T2 (see Appendix C2 of T1 & T2),
11-Workload stressors explained .69% at T1, and 63% at T2 (see Appendix C3 of T1 & T2),
12-Conflicts stressors explained 61% at T1, and 63% at T2 (see Appendix B4 of T1 & T2),
Several general points are noteworthy. Firstly, the specific job factors explained a
significant proportion of the variance in the job dissatisfaction outcomes better than job
anxiety and somatic complaints.. Furthermore, the criterion of a reliable effect of
employees’ demands, qualitative control and workload stressors were the highest
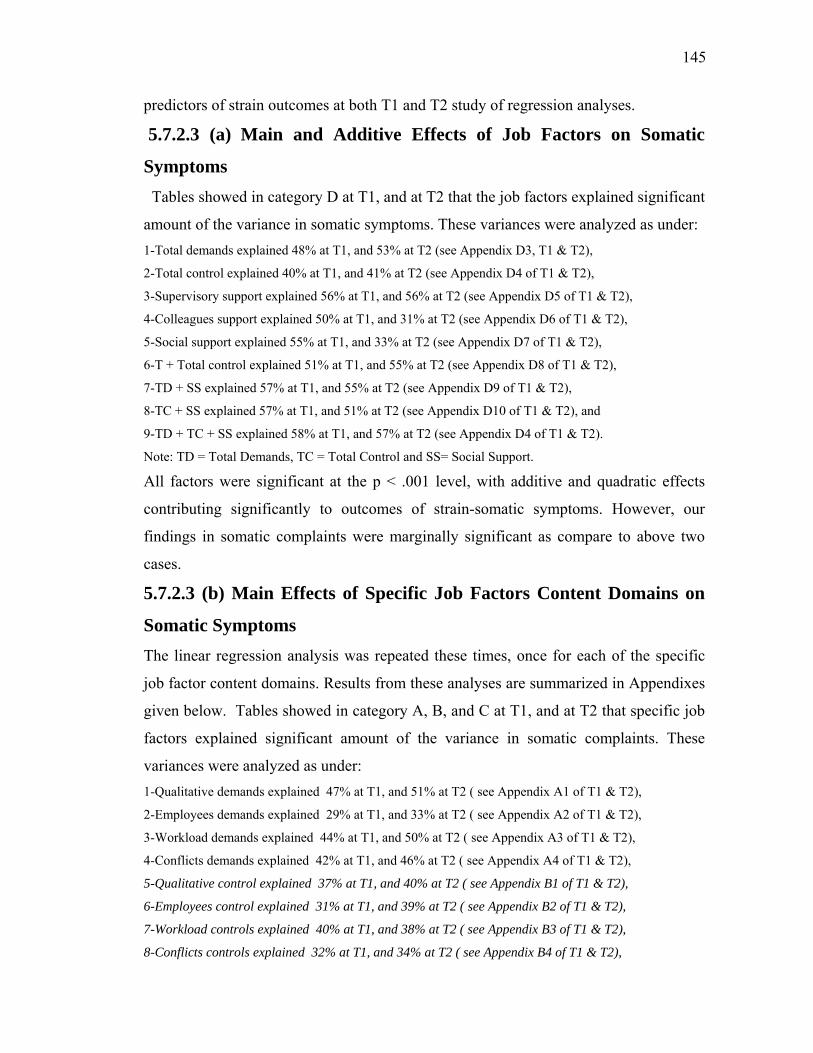
145
predictors of strain outcomes at both T1 and T2 study of regression analyses. 5.7.2.3 (a) Main and Additive Effects of Job Factors on Somatic
Symptoms Tables showed in category D at T1, and at T2 that the job factors explained significant
amount of the variance in somatic symptoms. These variances were analyzed as under: 1-Total demands explained 48% at T1, and 53% at T2 (see Appendix D3, T1 & T2),
2-Total control explained 40% at T1, and 41% at T2 (see Appendix D4 of T1 & T2),
3-Supervisory support explained 56% at T1, and 56% at T2 (see Appendix D5 of T1 & T2),
4-Colleagues support explained 50% at T1, and 31% at T2 (see Appendix D6 of T1 & T2),
5-Social support explained 55% at T1, and 33% at T2 (see Appendix D7 of T1 & T2),
6-T + Total control explained 51% at T1, and 55% at T2 (see Appendix D8 of T1 & T2),
7-TD + SS explained 57% at T1, and 55% at T2 (see Appendix D9 of T1 & T2),
8-TC + SS explained 57% at T1, and 51% at T2 (see Appendix D10 of T1 & T2), and
9-TD + TC + SS explained 58% at T1, and 57% at T2 (see Appendix D4 of T1 & T2).
Note: TD = Total Demands, TC = Total Control and SS= Social Support.
All factors were significant at the p < .001 level, with additive and quadratic effects
contributing significantly to outcomes of strain-somatic symptoms. However, our
findings in somatic complaints were marginally significant as compare to above two
cases. 5.7.2.3 (b) Main Effects of Specific Job Factors Content Domains on
Somatic Symptoms The linear regression analysis was repeated these times, once for each of the specific
job factor content domains. Results from these analyses are summarized in Appendixes
given below. Tables showed in category A, B, and C at T1, and at T2 that specific job
factors explained significant amount of the variance in somatic complaints. These
variances were analyzed as under: 1-Qualitative demands explained 47% at T1, and 51% at T2 ( see Appendix A1 of T1 & T2),
2-Employees demands explained 29% at T1, and 33% at T2 ( see Appendix A2 of T1 & T2),
3-Workload demands explained 44% at T1, and 50% at T2 ( see Appendix A3 of T1 & T2),
4-Conflicts demands explained 42% at T1, and 46% at T2 ( see Appendix A4 of T1 & T2),
5-Qualitative control explained 37% at T1, and 40% at T2 ( see Appendix B1 of T1 & T2),
6-Employees control explained 31% at T1, and 39% at T2 ( see Appendix B2 of T1 & T2),
7-Workload controls explained 40% at T1, and 38% at T2 ( see Appendix B3 of T1 & T2),
8-Conflicts controls explained 32% at T1, and 34% at T2 ( see Appendix B4 of T1 & T2),

146
9-Qualitative stressors explained 52% at T1, and 54% at T2 ( see Appendix C1 of T1 & T2),
10-Employees stressors explained 54% at T1, and 38% at T2 ( see Appendix C2 of T1 & T2),
11-Workload stressors explained .51% at T1, and 48% at T2 ( see Appendix C3 of T1 & T2),
12-Conflicts stressors explained 53% at T1, and 49% at T2 ( see Appendix B4 of T1 & T2), Several general points are noteworthy. Firstly, the specific job factors explained
marginally significant proportion of the variance in the job somatic complaint
outcomes lower than job anxiety and job dissatisfaction. In addition, magnitude of
specific job factor, the qualitative demands, workload control and employees’ stressors
were the highest predictors of strain outcomes at both T1 and T2 study of regression
analyses. Whereas, workload demands, employees control and employees stressors
were explained significant change over the time.
5.8 Summary of Main Findings This section summarizes findings relevant to the immediate outcomes of strain
hypotheses.
Hypothesis 6 Main Effects of Demands on Job Strain
Findings from total demands and specific factors domains provide impressive support
for the predicted effect of job demands on strain. The effects were consistent across job
domains, strain outcomes, and temporal frameworks of modeling. Mostly strong effects
were found for (a) all demands scales on job anxiety, (b) all but employees’ demands
on job dissatisfaction, and (c) total and workload demands on somatic complaints.
Hypothesis 7 Main Effects of Job Control on Job Strain
Most findings were supported the predicted effects of control on job strain. The
strongest relationships as compare to others were (a) total, and qualitative control on
job dissatisfaction, (b) qualitative control on job anxiety, and (c) workload control on
somatic symptoms. Regression analyses indicated that control over issues in the
conflicts domain was a more reliable predictor of strain than was control in other job
domains.
Hypothesis 13 Main effects of Social Support on Job Strain
There was significant support for this hypothesis from the ANOVAs and linear
regression analyses. However, the ANOVAs and the regression analyses both indicated
that supervisor support explains significant amounts of unique variance in job anxiety,
job dissatisfaction, and somatic symptoms. On the other hand, colleagues support was
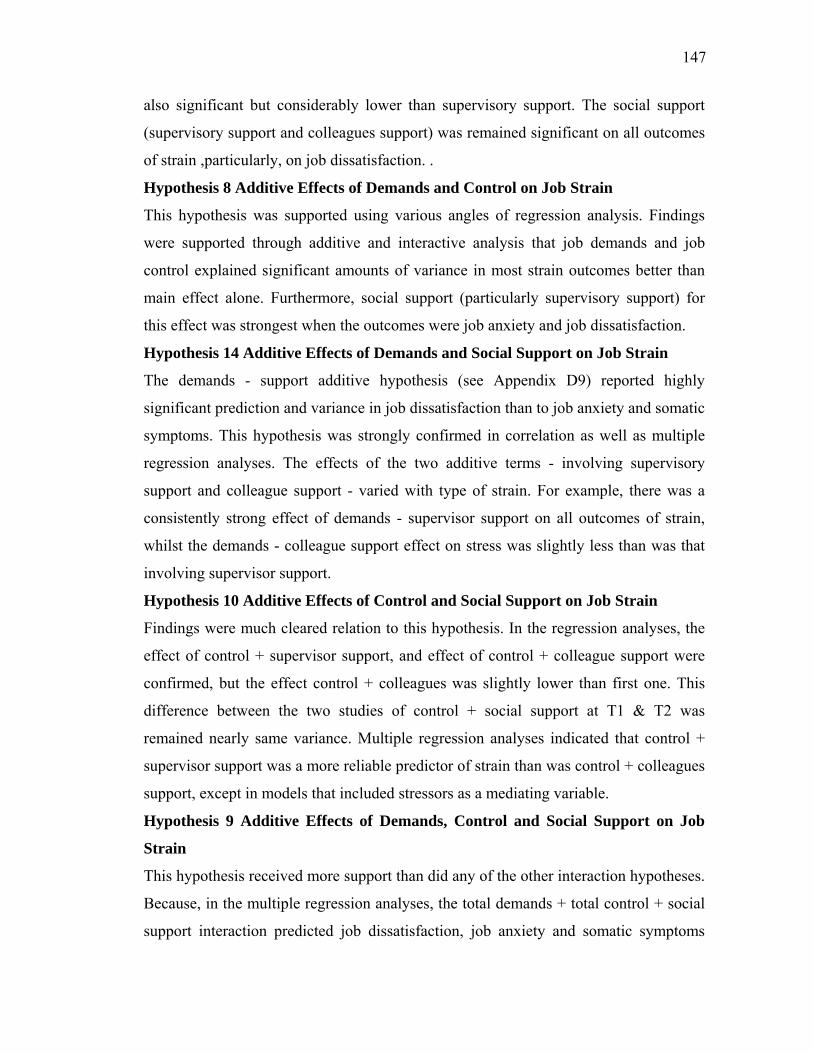
147
also significant but considerably lower than supervisory support. The social support
(supervisory support and colleagues support) was remained significant on all outcomes
of strain ,particularly, on job dissatisfaction. .
Hypothesis 8 Additive Effects of Demands and Control on Job Strain
This hypothesis was supported using various angles of regression analysis. Findings
were supported through additive and interactive analysis that job demands and job
control explained significant amounts of variance in most strain outcomes better than
main effect alone. Furthermore, social support (particularly supervisory support) for
this effect was strongest when the outcomes were job anxiety and job dissatisfaction.
Hypothesis 14 Additive Effects of Demands and Social Support on Job Strain
The demands - support additive hypothesis (see Appendix D9) reported highly
significant prediction and variance in job dissatisfaction than to job anxiety and somatic
symptoms. This hypothesis was strongly confirmed in correlation as well as multiple
regression analyses. The effects of the two additive terms - involving supervisory
support and colleague support - varied with type of strain. For example, there was a
consistently strong effect of demands - supervisor support on all outcomes of strain,
whilst the demands - colleague support effect on stress was slightly less than was that
involving supervisor support.
Hypothesis 10 Additive Effects of Control and Social Support on Job Strain
Findings were much cleared relation to this hypothesis. In the regression analyses, the
effect of control + supervisor support, and effect of control + colleague support were
confirmed, but the effect control + colleagues was slightly lower than first one. This
difference between the two studies of control + social support at T1 & T2 was
remained nearly same variance. Multiple regression analyses indicated that control +
supervisor support was a more reliable predictor of strain than was control + colleagues
support, except in models that included stressors as a mediating variable.
Hypothesis 9 Additive Effects of Demands, Control and Social Support on Job
Strain
This hypothesis received more support than did any of the other interaction hypotheses.
Because, in the multiple regression analyses, the total demands + total control + social
support interaction predicted job dissatisfaction, job anxiety and somatic symptoms

148
significantly at T1, at T2, particularly job dissatisfaction. This hypothesis received
some special support from the regression analyses, and from the cross-sectional one-
way ANOVAs. Support was also obtained from evidence that entry of all three job
factors as predictors in study 1 & 2 multiple regression analyses yielded significant
increases in explained variance at each step in several of the strain outcomes,
particularly job dissatisfaction. Evidence of this kind was stronger for hypothesis
(demands + control + supervisory support) than for hypothesis carried dual or main
effect alone. 5.9 Discussion on Main Findings Regarding Immediate Strain
Hypotheses
Consistent with the prior researches and our Study 1 findings, demands, Control and
social support had significant effects on immediate outcomes of strain. The effects
were consistent across time frames, independent and dependent variables, and modes of
analysis except in few cases. Significant effects were typically associated with job
demands and social support than with job control. The T1 job factors on T2 strain have
not been reported due to the greater instability and non-significance results. Significant
findings were obtained for the hypothesized additive effect of demands and control,
thus confirming Karasek’s (1979, p. 287) outcomes that “strain results not from a
single aspect of the work environment, but from the joint effects” of demands and
control. Whilst similar additive effects have been reported in past researches and T1,
the current findings were noteworthy for their consistency, especially given the
relatively high correlations between corresponding measures of demands and control
(see Appendix E-1 & E2). The total proportion of variance in strain explained by these
two job factors was high enough (typically 60-80%). Furthermore, high or low level of
correlation may be contributed through many variables potentially associated to strain
outcomes; it may be unrealistic to expect proportions of explained variance to be much
higher than this (Semner et al., 1996 & Bradley, 2004). Karasek’s original model is
commonly interpreted as predicting a demands + control interaction upon strain
outcomes. Most of the past researchers reported their findings in (a) male or mixed sex,
blue-collar samples, (b) cross-sectional designs, and (c) congruent and occupation-
specific self-report measures of the job characteristics. In the current study,

149
considerable support for the interaction hypothesis was obtained. Somewhat
interestingly, in the light of T1 & T2 findings, evidence of the buffering effects of
control was stronger in the study 2 than in the T1 analyses. The extent to which control
buffered the effects of demands was shown too consistent across job domains and
strain outcomes. The workload demands and workload control interaction term were
particularly successful in predicting job dissatisfaction in those models that included
stressors as a mediating variable, suggesting that interaction effects on strain stronger
than other two outcomes. Several researchers (e.g., Burke & Greenglass, 1995; Pomaki,
2001; Sheffield et al., 1994; Bradley, 2004) have found that social support does not
correlate highly with strain in samples of white collar employees. On the other hand,
researchers such as Alloway and Bebbington (1987), Payne and Jones (1987) and
Buunk and Peeters (1994), have concluded that significant findings occur significantly
but not frequently than would be expected. Both studies (T1 & T2) included separate
measures of supervisor and colleague support (scales of Caplan et al., 1975), both used
cross-sectional designs with an nine-month time lag and both tested the buffering
hypothesis using continuous interaction terms within six models and reported
significant of interaction of social support. Bradley, (2004) reported in his cross-
sectional correlations between social support and strain in the region of -.20. Despite
this modest mean, their bivariate correlation, several main effects for social support
were significant in the multivariate analyses. In their analysis, support from supervisors
was a strong (negative) predictor of turnover intentions, whilst support from colleagues
was highly predictive of job dissatisfaction. Similar analyses were found in our study I
& II support from supervisors was a strong (negative) predictor of all three outcomes of
job strain, whilst support from colleagues was lower in study 1 highly predictive of job
outcomes in study 2. Thus, Kahn and Byosiere (1992), Mitchell et al. (1982), and some
others have indicated that the stressor x support interaction may hold only for particular
combinations of stressors not all types of support and specific outcomes of job strain.
The demands + support, and control + support, hypotheses were strongly supported by
the current findings. The mean R2 adjusted associated with the control + social support
prediction was .81 at T1, and .71 at T2. Indeed, the findings are more consistent with
an additive than with main or independent effects with the model of the effects of
150
demands and support upon strain. Two possible exceptions to this general pattern of
non-significant effects were the interactions between (a) colleagues support and
employees’ demands at T1, and (b) colleague support and all stressors at T2. These
significant effects provided support to hypothesis but buffering effects are most
pronounced when the type of support offered to meet the particular needs of the person
who is experiencing stress. According to this “stress- matching concept” hypothesis,
well-targeted and specific types of support are of much more use to those experiencing
stress than to those who are not, and hence the beneficial effects of such support varies
between employees depending on their requirements and circumstances available at
work environment. In the current context, it makes sense that qualitative demands,
employees issues and workload were rendered less stressful by the provision of
supervisor support (since supervisors generally have responsibility over such matters
and have power to bring certain changes), whilst the impact of colleagues support may
not alleviated or minimized the pressure of stress (due to lack of decision latitude), who
may be more likely than supervisors to provide empathy, opportunities for emotional
release, and practical assistance in this domain. Consistent with past research, the
present findings suggested that control + colleague support impacted more strongly on
dissatisfaction than on any other strain outcomes, whilst control + supervisor support
had strong effects on both dissatisfaction and other outcomes of strain. Therefore,
evidence is accumulating in support of the views that the two job factors of control and
social support operate in supplementary, rather than substitutive, ways to counteract all
or at least some kinds of strain. Whilst some studies were made for the additive effects
of control and social support, the current research provides sufficient grounds to
support a claim of an interactive effect of these two job factors on strain. The most
consistent evidence of the hypothesized synergistic relationship was in relation to the
control + supervisory support effect on job dissatisfaction and ultimately leads to
turnover intentions of employees. Given the current findings, there may be value in
future researchers examining the impact of the control + social support interaction on
this criterion. If replicated, the finding may have implications for reducing levels of
staff turnover in an organization. This chapter reported findings from multiple
regression analyses of several versions of four principal models and two additional

151
models of the relationships between job factors and strain. Findings from these
analyses suggested that model choice depended upon the relative importance attached
to goodness-of-fit and parsimony and also in consideration of work environment.
Model 1, (both T1 & T2) which specified direct effects from all job factors to all strain
outcomes yielded the best set of fit statistics, although greater parsimony was achieved
by models that included mediating variables such as stressors and/or immediate strain
outcomes. All models explained similar amounts of variance in the strain outcomes.
The direct effects version of models 2, 3 and 4 (see 5.16)tended to provide a better fit
than did the corresponding hypothesized versions, a finding that is consistent with the
evidence that the best compilation fit was provided by model 1 than complex model 5
& 6 (see 5.16). However, model 1, and the direct versions of the other models, were
highly saturated and typically contained a few number of non-significant paths. In
comparison, the hypothesized versions of models 2, 3 and 4 provided satisfactory fit,
with greater parsimony, while model 5 & 6 provided further clarification to researchers.
Models (3 and 4) that included the stressor variable more consistently yielded
significant parameter estimates associated with social support and with the demands
and control interaction. In contrast, the latter models more consistently yielded
significant estimates associated with supervisory support. Regression analyses
significantly confirmed the hypothesized role of stressors in mediating the relationships
between the job factors and strain. Mediation paths were particularly strong when
supervisor support was the job factor and/or when job-anxiety or somatic symptoms
was the strain outcome (see model 5 & 6). Effects on job dissatisfaction were typically
direct, rather than mediated through stressors (see model 1, 2 and 3 content 5.16). The
findings indicated that the optimum model was one specifying that strain is predicted
by (a) demands and control, both directly and indirectly through stressors, (b) colleague
support through a direct path only, (c) supervisor support and the demands + control,
and (d) demands + control + social support interaction indirectly through stressors only
(see model 5 & 6 at T1 & T2). Analyses involving models 6 suggested the importance
of three distinctive pathways between immediate and remote strain outcomes, one path
from demands to job stress, job stress to job dissatisfaction, and job dissatisfaction to
employees’ turnover intention. Consequently, the data were consistent with a model

152
that represents a compromise between the four models originally proposed. In this
preferred, hybrid model, selected job factor-to-strain paths are direct (e.g., control to
turnover intentions, Colleague support to all strain outcomes), others are mediated
through stressors (e.g., supervisor support to stress and somatic symptoms), whilst still
other possible paths were need to be analyzed. This model requires testing in an
independent sample for at least two time data. Finally, it was concluded that the
findings from this study provide quite strong evidence of the additive effects of
demands, control and social support upon self-reports of strain, and more modest
evidence of main effects of these three job factors. The evidence for such independent
and additive effects is weaker when vigor activities at T1 and employees demands at
T2 were used as outcomes of strain. Terms representing the interactions between the
job factors accounted for considerable variance in all seven measures of strain. Given
the number of tests conducted and the significant effects generally obtained, it seems
reasonable to conclude that Study 2 provides qualified support to some level for
Karasek’s (1979; Karasek & Theorell, 1990) main and additive effects models of job
strain.
5.10 Study 2 Tests of Personality Variables- Mastery Scale
and Neuroticism Hypotheses In their research work, Karasek & Theorell (1990) reported that high strain job (high
demands/low control) lead over specific time, to increasing levels of “accumulated
anxiety”, whilst active job (high demands/high control) have direct effects on mastery.
They further contend that these outcomes are mutually reinforcing: over the time,
accumulated anxiety accelerates the future active learning and participation, whilst
feelings of mastery inhibit the (perceived) accumulation of strain. These hypotheses
were tested using neuroticism to operationalise Karasek and Theorell’s view of
accumulated anxiety, in a series of correlation and regression analyses. Findings of job
factors evident that demands are positively related, and control negatively related to
changes in neuroticism. Similarly, demands are positively related to changes in
mastery, and control negatively related to change in mastery. In the current study (in a
manner consistent with, Karasek and Theorell), interactive effects were also
hypothesized, with control having a buffering effect on the demands-changes in both

153
neuroticism and mastery relationship. Furthermore, Karasek and Theorell (1990) did
not make predictions in respect of the effects of social support on changes in these
personality variables, because, in their words, “the literature to be integrated is almost
limitless”. However, it is consistent with other aspects of their work to hypothesize
main, additive and interactive effects associated with supervisor and to certain extend
with colleague social support.
Correlation Matrix (N = 402 & 388)
Personality Variables
Neuroticism Mastery Scale S. No. Job Factor Analysis
T1 T2 T1 T2
1 Qualitative Demands .68 .69 .72 .71
2 Employees Demands .55 .29 .60 .29
3 Workload Demands .67 .72 .71 .70
4 Conflicts Demands .67 .69 .71 .69
5 Qualitative Control -.65 -.63 -.65 -.64
6 Employees Control -.60 -.60 -.60 -.56
7 Workload Control -.66 -.63 -.67 -.63
8 Conflicts Control -.59 -.57 -.60 -.58
9 Qualitative Stressors .68 .70 .72 .69
10 Employees Stressors .62 .63 .66 .64
11 Workload Stressors .71 .67 .75 .67
12 Conflicts Stressors .67 .67 .69 .67
13 Total Demands .71 .73 .75 .73
14 Total Control -.67 -.66 -.68 -.65
15 Supervisory Support -.75 -.72 -.79 -.74
16 Colleagues Support -.27 -.58 -.27 -.56
Note: All job factors were significant at p > .001.
Such effects would operate in the same directions as those of control. In this chapter,
the term “core predictor set” refers to analyses that use only demands, control, and their

154
interaction as predictors, whereas the term “expanded predictor set” refers to analyses
that also include social support (as a additive terms). To test hypotheses relating to
main and interaction effects, scores on the job factor scales were provided through
zero-order correlations reported in Appendix E1 at T1 & E2 at T2, show that, with to
expectations, all measures of demands were positively correlated with the outcomes of
personality variables whereas job control associated negatively with both of these.
Given this general pattern of results, positive and negative statistically significant
correlations were found for the relationships between various outcomes of strain except
employees’ demands at T1, and T2. The control and social support measures displayed
a clear pattern of correlations with personality variables, with some negative, some
positive, and some moderately positive correlations. The following Table summarizes
these correlations averaged across two outcomes of personality variables
Karasek and Theorell (1990) limited their personality variables model to two job
factors (demands and control), with no reference to social support. To test the effects of
this core predictor set, total demands and total control scales were used to allocate
respondents to one of the four job types specified in Karasek’s (1979) core model.
From the table given above, supervisory support was highly correlated with two
outcomes of personality variables, but only colleagues’ support was remained lower
with both outcomes at T1.
5.11 Multiple Regression Analyses Hierarchical multiple regression analyses were performed to assess the effects of the
job factors on changes in the measures of personality variables (neuroticism +
mastery). To maintain consistency with prior analyses, the model 6 described
previously were tested even though the basic model does not provide an adequate test
of the change-in-personality hypotheses. 5.11.1 (a) Main and Additive Effects of Specific Job Factors Content
Domains on Neuroticism The linear regression analysis was repeated this times, once for each of the specific job
factor content domains. Results from these analyses are summarized in Appendixes as
given below. Tables showed in category D15-26 at T1, and at T2 that specific job
factors explained significant amount of the variance in personality variables-

155
neuroticism. These variance were analyzed as under: 1-Qualitative demands explained 45% at T1, and 48% at T2 ( see Appendix D15 of T1 & T2),
2-Employees demands explained 30% at T1, and 08% at T2 ( see Appendix D16 of T1 & T2),
3-Workload demands explained 45% at T1, and 53% at T2 ( see Appendix D17 of T1 & T2),
4-Conflicts demands explained 45% at T1, and 49% at T2 ( see Appendix D18 of T1 & T2),
5-Qualitative control explained 42% at T1, and 40% at T2 ( see Appendix D19 of T1 & T2),
6-Employees control explained 36% at T1, and 36% at T2 ( see Appendix D20 of T1 & T2),
7-Workload controls explained 44% at T1, and 40% at T2 ( see Appendix D21 of T1 & T2),
8-Conflicts controls explained 35% at T1, and 33% at T2 ( see Appendix D22 of T1 & T2),
9-QD + QC explained 53% at T1, and 52% at T2 ( see Appendix D23 of T1 & T2),
10-ED + EC explained 42% at T1, and 37% at T2 ( see Appendix D24 of T1 & T2),
11-WD + WC explained 51% at T1, and 54% at T2 ( see Appendix D25 of T1 & T2),
12-CD + CC explained 50% at T1, and 52% at T2 ( see Appendix D26 of T1 & T2),
Note: QD + QC (Qualitative Demands + Qualitative Control)
ED + EC (Employees Demands + Employees Control)
WD + WC (Workload Demands + Workload Control)
CD + CC (Conflicts Demands + Conflicts Control)
Several points are noteworthy for understanding the model. Firstly, the main effect of
specific job factors explained marginally significant proportion of the variance in the
personality variables-neuroticism outcomes slightly lower additive effect. In addition,
magnitude of specific job factor, the qualitative, workload and conflicts were the
significant predictors of neuroticism at both T1 and T2 study of regression analyses.
Whereas, employees demands, employees control and employees stressors were
explained marginally significant and were change over the time.
5.11.1 (b) Main and Additive Effects of Job Factors on Neuroticism Various Appendixes of category D show that, at T1, and T2 the job factors explained
significant amount of the variance in Neuroticism- a personality variables. These
variances were analyzed as under: 1-Total demands explained 51% at T1, and 54% at T2 (see Appendix D3, T1 & T2),
2-Total control explained 45% at T1, and 44% at T2 (see Appendix D4 of T1 & T2),
3-Supervisory support explained 56% at T1, and 52% at T2 (see Appendix D5 of T1 & T2),
4-Colleagues support explained 55% at T1, and 31% at T2 (see Appendix D6 of T1 & T2),
5-TD + TC explained 54% at T1, and 56% at T2 (see Appendix D8 of T1 & T2),
6-TD + SS explained 61% at T1, and 57% at T2 (see Appendix D9 of T1 & T2),

156
7-TC + SS explained 61% at T1, and 54% at T2 (see Appendix D10 of T1 & T2), and
8-TC + TC + SS explained 61% at T1, and 60% at T2 (see Appendix D4 of T1 & T2).
Note: TD = Total Demands, TC = Total Control and SS= Social Support.
At both times, R2 changes for job factors were remained significant at p < .001. Several
points are noteworthy. Firstly, none of the main, additive and quadratic effects for
various job factors were non-significant, Secondly, additive effects were highly
significant than that of main effect alone, and thirdly, all findings were consistent
except colleagues support which was decline considerably.
5.11.2 (a) Main and Additive Effects of Specific Job Factors Content
Domains on Mastery Scale The linear regression analysis was repeated this time, once for each of the specific job
factor content domains. Results from these analyses are summarized in Appendixes
given below. Tables showed in category D15-26 at T1, and at T2 that specific job
factors explained significant amount of the variance in personality variables-mastery
scale. These variance were analyzed as under: 1-Qualitative demands explained 52% at T1, and 50% at T2 ( see Appendix D15 of T1 & T2),
2-Employees demands explained 36% at T1, and 08% at T2 ( see Appendix D16 of T1 & T2),
3-Workload demands explained 50% at T1, and 49% at T2 ( see Appendix D17 of T1 & T2),
4-Conflicts demands explained 50% at T1, and 48% at T2 ( see Appendix D18 of T1 & T2),
5-Qualitative control explained 42% at T1, and 41% at T2 ( see Appendix D19 of T1 & T2),
6-Employees control explained 36% at T1, and 31% at T2 ( see Appendix D20 of T1 & T2),
7-Workload controls explained 44% at T1, and 40% at T2 ( see Appendix D21 of T1 & T2),
8-Conflicts controls explained 36% at T1, and 34% at T2 ( see Appendix D22 of T1 & T2),
9-QD + QC explained 56% at T1, and 55% at T2 ( see Appendix D23 of T1 & T2),
10-ED + EC explained 45% at T1, and 33% at T2 ( see Appendix D24 of T1 & T2),
11-WD + WC explained 54% at T1, and 52% at T2 ( see Appendix D25 of T1 & T2),
12-CD + CC explained 64% at T1, and 59% at T2 ( see Appendix D26 of T1 & T2),
Note: QD + QC (Qualitative Demands + Qualitative Control)
ED + EC (Employees Demands + Employees Control)
WD + WC (Workload Demands + Workload Control)
CD + CC (Conflicts Demands + Conflicts Control)
Results were substantially unchanged over two factors of personality variables.
Qualitative demands, qualitative control and CD + CC were remained highest
predictors of mastery scale, whereas, employees demands, employees control and ED +

157
EC were lower predictors of personality variables-mastery scale at both T1 and T2
study of regression analyses.
5.11.2 (b) Main and Additive Effects of Job Factors on Mastery Scale Appendix of category D at T1, and at T2 showed that the job factors explained
significant amount of the variance in mastery scale-a personality variables. These
variances were analyzed as under: 1-Total demands explained 56% at T1, and 53% at T2 (see Appendix D3, T1 & T2),
2-Total control explained 46% at T1, and 43% at T2 (see Appendix D4 of T1 & T2),
3-Supervisory support explained 63% at T1, and 56% at T2 (see Appendix D5 of T1 & T2),
4-Colleagues support explained 62% at T1, and 32% at T2 (see Appendix D6 of T1 & T2),
5-Social support explained 65% at T1, and 35% at T2 (see Appendix D7 of T1 & T2),
6-TD + TC explained 58% at T1, and 56% at T2 (see Appendix D8 of T1 & T2),
7-TD + SS explained 67% at T1, and 56% at T2 (see Appendix D9 of T1 & T2),
8-TC + SS explained 66% at T1, and 53% at T2 (see Appendix D10 of T1 & T2), and
9-TD + TC + SS explained 68% at T1, and 58% at T2 (see Appendix D4 of T1 & T2).
Note: TD = Total Demands, TC = Total Control and SS= Social Support.
All factors were significant at the p < .001 level, with additive and quadratic effects
contributing significantly to outcomes of strain-somatic symptoms. However, our
findings in mastery scale were strongly significant and consistent as compare to other
two cases of strain outcomes. Specifically, there was a significant enhancing effect for
the Demands + control + social support interaction in the basic model (p < .001), than
main and quadratic effects alone. 5.11.3 Summary of Findings of Personality Variables
Hypothesis 15 Main Effects of Job Demands on Neuroticism
Findings of the effects of demands on changes in neuroticism yielded clear support for
the hypothesis. Whilst all measures of demands (specific and main factors) T1 were
positively correlated with T1 neuroticism, the correlations analyses provided strong
support for the predicted effect upon changes in neuroticism. However, evidence from
the multiple regression model, using both the core and expanded predictor sets,
supported the hypothesized effect in all analyses revealed significant lagged effects for
total demands, but not employees demands.
Hypothesis 16 Main Effects of Job Control on Neuroticism
All of findings supported the hypothesized effect of control on changes in neuroticism.

158
For example, linear and multiple regression analysis provided strong evidence for this
effect but only in the employees demands and control job domain was remained
slightly low predictor of personality variables. Control with demands and social support
were strong predictor better than other two effects (main effects of control and control
+ social support).
Hypothesis 17 Main Effects of Social Support on Neuroticism)
Findings in relation to the main effects for social support were better than those for
control, that is, the cross-lagged correlations were significant. Results were cleared that
social support, particularly supervisory support, were the strong predictor of personality
variables than job demands and job control. Overall, therefore, hypothesis 17 both
colleague support and supervisor support were confirmed.
Hypothesis 18 Additive Effects of Demands and Control on Neuroticism)
Correlational and sub-group analyses yielded stronger support of the demands + control
additive hypothesis. One supportive finding was obtained in the regression analyses in
which T1 and T2 total demands and total control explained significant variance in
neuroticism. Similar evidence was obtained in sub-group regression analyses of the
demand and control data. These results were, however, replicated in the sub-group
analyses using the domain factors of demand over control job factors. In sum, there was
strong support to accept the hypothesis.
Hypothesis 19 Additive Effects of Demands and Social Support on Neuroticism
Correlational and sub-group analyses yielded stronger support of the demands + social
support additive effects on neuroticism. One supportive finding was obtained in the
regression analyses in which T1 and T2 total demands and social support explained
significant unique variance in neuroticism. Similar evidence was obtained in sub-group
regression analyses of the demand + colleagues support, demands + supervisory
support data. These results were, however, replicated in the sub-group analyses using
the domain factors of demand over social support job factors. In sum, there was
considerable support to accept the hypothesis.
Hypothesis 20 Additive Affects of Control and Social Support on Neuroticism
Most of the findings were also counter to this hypothesis. Evidence was obtained in
sub-group regression analyses of the 4 control factors + colleagues support, 4 control

159
factors + supervisory support data. These results were, however, predicted in the sub-
group analyses using the domain factors of demand over social support job factors. The
4 control factors + supervisory support were strong predictors of neuroticism better
than combination of control + colleagues support. Thus, there was some evidence to
support hypothesis: control + colleague support and control + supervisor support.
Hypothesis 21 Additive Effects of Demands, Control and Social Support on
Neuroticism
All of the findings were consistent with the hypothesized three-job factor additive
effect upon changes in neuroticism. In particular, the three job factor additive effects
were highly significant on neuroticism better than main and two additive effects.
Effects on Mastery Scale Hypothesis 22 Main Effects of Demands on Mastery
The most effects of job demands on changes in mastery that were significant indicated
that the relationship between these variables was positive and significant predictor. For
example, findings from the change/change regression model indicated that increases in
demands in the qualitative work, workload, employees’ issues, conflicts problems and
total domains predicted increases in mastery. The hypothesis of a simple, positive
effect for demands on changes in mastery was confirmed.
Hypothesis 23 Main Effects of Control on Mastery
The findings provided moderately marginally significant support for the hypothesis of a
main effect for control on changes in mastery. In particular, the change regression
model using the core predictor set indicated that increases in total control, workload
control and conflict control were each associated with decreases over time in mastery.
These effects were not replicated when the expanded set of predictors was used in this
regression model. Linear regression analyses were supportive of the hypothesis, with
T1 & T2 sub-group and total control predicting significantly mastery as a personality
scale.
Hypothesis 24 Main Effects of Social Support on Mastery
Both supervisor support and colleagues support variables were negatively correlated
with mastery and the relationships reduced to marginally significance once at T1 & at

160
T2 levels of mastery. Whereas, supervisor support was stronger predictor change in
mastery better than colleagues support. Further analyses provided that both supervisor
support and colleagues support with workload control was highly significant predictor,
but not with employees control (see Appendix D30-35). These similar findings, the
hypothesis were confirmed.
Hypothesis 25 Additive Effects of Demands and Control on Mastery
There was significant evidence to support the hypothesis of an additive effect of
demands + control upon changes in mastery better than main effects alone. Broadly
(2004) supportive findings were obtained from the two-ways ANOVA in which
respondents were assigned to one of the four core job types. Significant effects were
also associated with the total, and workload, demands and control scales, both using the
core predictor set in the change regression model. Evidence from regression indicated
that the additive composite stronger predict changes in mastery. Furthermore, additive
effects significantly and main effects marginally and more of the other findings from
the regression analyses supported this hypothesis. On balance, this hypothesis was
confirmed.
Hypothesis 26 Additive Effects of Demands and Social Support on Mastery
This hypothesis received significant support and was confirmed. The considerable
social support for this hypothesis (and others that included demands) can be associated
to the relationship between demands and mastery.
Hypothesis 27 Additive Effects of Control and Social Support on Mastery
Despite correlations in the expected negative direction between mastery and each of
control and social support, there was considerable evidence that these two job factors
had additive effects on changes in mastery better than main effects alone. Furthermore,
additive effects significantly and main effects marginally and more of the other
findings from the regression analyses supported this hypothesis. Overall, the hypothesis
was confirmed in a clear or consistent manner.
Hypothesis 28 Additive Effects of Demands, Control and Social Support on
Mastery Three ways job factors were tested with the hypothesized demands + control + social
support interaction on changes in mastery. The combination of these three factors

161
provided a strong proof of hypotheses that these effects were stronger and consistent on
mastery scale. Total demands and sub-group was strongly positive predictor whereas
job control and both sub-group of social support were negative predictor of mastery-
personality variables. Thus, there was strong evidence of an interaction involving
combination, but these outcomes suggest that demands and supervisory support have an
enhancing interactive effect on changes in mastery. Karasek and Theorell’s (1990)
dynamic model suggests that, under conditions of high job control, levels of mastery
increase with increasing job demands. Consistent with this hypothesis, regression
analyses revealed that the relationship between demands and adjusted mastery took
similar forms in sub-groups of the sample defined by total control. Specifically, the
hypothesized positive main effects of job demands, and the hypothesized positive
demands-related additive effects, were evident in the high control group. Regression
analyses revealed considerable evidence of a significant prediction when the total job
factors were used than that of single or main effects. Overall, the hypothesis received
strong support.

162
5.12 Discussion Regarding the Personality Variables
Hypotheses
Study at T1& T2 presented findings related to Karasek and Theorell’s (1990) dynamic
person-environment model. The hypothesized findings under investigation predicted
main, additive and interaction effects of the job factors on changes in two dimensions
of personality, and the moderating effects of each one of these personality variables on
the relationship between the job factors and two personality variable (neuroticism +
mastery). Some past researches have sought to test these propositions, and much
previously available data provides less significant effects or indirect evidence in
relation to the model (Kohn & Schooler, 1982; Parker & Sprigg, 1998; Bradley, 2004).
In addition to reporting findings pertaining to the role of the two core job factors -
demands and control – these studies presented results that extend Karasek and
Theorell’s theorizing to examine the effects of the third job factor, workplace social
support (supervisory + colleagues), as an antecedent to personality change. But our
findings were provided strong evidence of additive effects in change in mastery rather
than main effects. Most of the hypotheses were confirmed. Supportive findings were
occurred more often using dynamic rather than more static conditions (e.g., the basic,
rather than the change, regression model). In addition to this, the additive effects (the
demands + control interaction effect on mastery), were more often found than were
main and interaction effects. Demands and social support more often predicted
personality changes better than did control. As expected, the measures of neuroticism
taken at T1 and T2 were highly correlated, r = .75 & .72. Thus, changes in neuroticism
between these two occasions were considerable, rendering the prediction of change
convincing. Of the hypotheses relating to neuroticism, hypothesis 15 (main effects of
demands) received the most consistent support. This effect was explained in at least
some of the analyses using the total, and the more specific, demands scales. An
exception was in the workload and interpersonal conflict domain, where adjusted
neuroticism scores were higher in the high workload and conflict demands than in the
low demands group, but the reverse was the case for other two adjusted neuroticism.

163
With this proposition, however, the findings related to the effects of demands support
Karasek and Theorell’s (1990) demonstration that strain accumulates over the time
workers spend in highly demanding work environments within limited control. Under
highly demanding job conditions, it would seem that even stable personality traits such
as neuroticism and mastery undergo changes in an adverse direction. To the extent that
high neuroticism levels are detrimental to workers’ well-being and performance in a
long run period, the findings suggest the need to ensure that job demands are kept
within reasonable and manageable limits. Like neuroticism, the T1 and T2 measures of
mastery were strongly correlated, r = .75 & .73 with total demands, r = .68 & .65 with
total control and r = .50 & .59 with social support. Total demands were consistent and
reliably associated, in the expected (positive) direction, with changes over time in
mastery. By itself, this finding is not inconsistent with Karasek’s predictions, because
the positive effect of demands upon mastery was expected to be most evident when job
control was also high and significant. Some support for this proposition was obtained.
Evidence from several of the analyses indicated a significant effect for the demands +
control interaction term, with the form of this interaction generally approximating that
predicted. However, this significant prediction was believed to be unprecedented in the
literature, and provides at least moderate support for this aspect of the person-
environment model. Most of the remaining effects are predicted changes in mastery
with consistency particularly, demands, control and social support. A negative
relationship between control and mastery is consistent and similar with Karasek &
Theorell (1990), given that mastery is a relatively stable and global trait that may be
expected to produce beliefs in control within more specific job contexts. However, the
findings included more than just simple correlations between these two variables. For
example, a sense of control over conflicts job demands predicted considerably changes
over time in mastery. In addition, changes in total, qualitative and conflict control
predicted changes in mastery, in the expected direction and mostly at the .65% level, in
the third regression model. It is important to see that Karasek and Theorell (1990) did
not include social support in their person-environment model. Consequently, those
regression analyses that included as a core predictor set, and that yielded results
confirming the hypothesized relationship between control and changes in mastery, can

164
be interpreted as supportive of Karasek and Theorell’s (1990) model. Furthermore, job
control was a significant main predictor of mastery in the multiple regression analyses,
and these analyses did include the social support as added variables. This finding - that
control predicts changes in mastery - is consistent with past research by Kohn and
Schooler (1982), Parker and Sprigg (1998), Bradley (2004). Given the multiple models
of analysis currently used, the finding adds weight to suggestions that providing
enhanced levels of job control may have benefits to employees that extend beyond
proximate outcomes such as task performance and job satisfaction. Social support from
supervisors was a strong predictor of changes in the two personality variables. Effects
varied widely, and there was even some evidence that the availability of supervisor
support was associated with changes in neuroticism in the opposite direction to that
predicted. Overall, the findings are consistent with the view that support from
supervisors might have several potentially negative effects. The provision of support
may, as hypothesized, assist in the reduction of neuroticism and a sense of mastery
under some circumstances, but support may also be offered in increasing amounts to
those employees who display signs of accumulated anxiety over period of time and
uncertain over mastery. These similar direction effects may thus add weight to each
other, leading to a considerable net effect on the personality variables. Kohn and
Schooler (1982), reported that their investigation of work-related personality changes
over a ten-year period, a time-frame that was beyond current resources. But our data
collection design relates to the use of a time interval of only eight to twelve months for
cross-sectional study. This may have been too short to permit the full impact of the job
factors to be studied. Changes in neuroticism may, for example, occur very slowly, as a
consequence of the gradual exhaustion of workers’ coping resources and
comprehensive training program. Frese and Zapf, (1988) reported in their research
study that better understanding of the dynamic relationships between the job factors
and personality may be achieved through collecting multiple measures of all variables
over a longer period through two or more studies. Therefore, a long period for data
collection may be particularly important in providing a authentic test of the predictor’s
moderating effects of each personality variable on the relationship between job factors
and the different personality variable. This study has reported findings in relation to an

165
under-researched aspect of Karasek’s (1979; Karasek & Theorell, 1990) model and a
comprehensive cross-sectional and longitudinal study conducted by Bradley, (2004).
Within the two cross-sectional studies of a time interval of only twelve months,
indications were obtained that job demands predict changes in accumulated anxiety
(neuroticism) of employees, whilst job control predicts changes in personal mastery
over the job. Findings of a moderating effect of control on the relationship between job
demands and changes in mastery were also reported. Therefore, it is cleared from the
T1 & T2 studies that experienced employees may not show shifts in personality during
the study period because the environment has had its impact (on these employees) prior
to the commencement of the study. According to personnel management theory,
specific or typically personality traits employees are select into different jobs - is less
probable, given that (a) the criterion used in all analyses was changes in personality,
and (b) the idea that workers have systematically different predispositions to change in
these ways has not been suggested by past theory or research. And it not possible to
develop a single master scale to collect all requisites of employees and a system to
study such diversified data. Further empirical study of the person-environment model,
using longer study periods, alternate measures, and tighter controls, are, however,
required to confirm these hypotheses and make valid recommendation.

166
5.13 Modeling Analyses
Four principal models and three additional extended models were tested using PLS
(partial least square). All models assumed that job demands and control co-varied or
demands, control and social supports co-varied but that there was no such collinearity
between these (centered) linear predictors and the interaction term. The models also
included covariance paths between the residuals in all endogenous variables specified at
the same step in the hypothesized sequence.
5.13.1 Model 1: Modified Karasek’s (1979) Core Model
The first model tested Karasek’s (1979) prediction that total demands and total control
(and their interaction) directly determine levels of strain. In line with Karasek’s
theorizing, (a) no differentiation was made between outcomes of strain, and (b) no role
was given to respondents’ ratings of job stressors. As can be seen, R2 adjusted β values
were significant predictors of stressors and strain outcomes. All three pathways from
demands control and social supports to strain and job dissatisfaction was significant (p <
.001, two-tailed). However, remaining two pathways to job anxiety and somatic
symptoms were significant slightly lower than other strain constructs. Together, the
predictors explained a higher proportion of the variance in job dissatisfaction and strain
than in the other two latent strain constructs. Model 1: Karasek’s (1979) core model of
job strain tested in consideration of modification developed by Karasek and Theorell
(1990) including social supports as a moderator. The values of R2 for models produced
by the regression procedure (range from 0 to 1), indicates stronger relationships between
stressors and various outcomes of strain particularly job demands, job strain and job
dissatisfaction. R2 adjusted is the proportion of variation in the dependent variable
explained by the regression model. The sample R2 adjusted tends to optimistically
estimate how well the models fit the population. In the sense that the data are explained
equally well by specifying that the “causal” sequence is from strain outcomes to job
factors, as from job factors to strain. In sum, Model 1 fitted the data well using regression
analyses. Total demands and social supports were the significant predictor of all strain
outcomes. Bradley (2004) reported that the demands x control term did not explain

167
significant amounts of unique variance in any of the outcomes. Therefore, instead of
demands x control, a new variable social support has been included in current modeling
study. Thus, stress, anxiety, somatic complaints and job dissatisfaction were best
explained by a model that included the main effects of demands, control and social
supports, As a consequence, attempts were not made to improve model fit through
making data-driven modifications, because the aim of these PLS analyses was to test
theoretically-derived models with slight modification, rather than to “discover” the
entirely a new model that best fitted the current data set.
Time 1 and Time 2 models are as under:
Time-1

168
Time-2
Figure 5.1. Model 1: Karasek’s (1979) core model of job strain (one addition of social supports) See text
for an explanation of these models. Standardized coefficients are reported after the final step and adjusted
R2 in parentheses after R2. All beta values and R2are taken from analyses that included quadratic terms.
5.13.2 Model 2: Modified Karasek’s (1979) Core Model, with direct
effects between Immediate Outcomes of Strain.
The second model involved modifying model 1 such that no indirect link between the job
factors (demands, control and social supports) and somatic symptoms was specified. In
this mediated model, the job factors directly predicted levels of anxiety, stress and job
satisfaction (immediate outcomes of strain), but only indirectly (through other strain
variables) predicted somatic complaints. The fit for this mediated model was very good.
However, the path from job satisfaction and anxiety to somatic symptoms was also
significant but slightly lower than the pathway from stress to somatic symptoms. These
three significant pathways makes sense to the extent that model is good fit to the data and
predicts the theory developed by Karasek (1979). As such, levels of job satisfaction are

169
likely to impact additionally and significantly upon physical health. The model was thus
re-specified such that significant link between job satisfaction and somatic complaints
was included. This revised model, and a selection of goodness-of-fit statistics, is depicted
in Figure 5.2 (Model 2 a, b, and c). The fit of this version of the model was significantly
superior to the previous version. It was also more parsimonious than its predecessor
(Bradley, 2004), and had a greater chance of replication in an independent sample
subsequent study.
Total demands and social supports were significant direct predictor of the three
immediate strain outcomes, and a significant indirect predictor of somatic symptoms (all
ps < .001). Control predicted job three outcomes slightly lower than other two (p < .001).
All three paths associated with the interaction term was significant. Thus, adding the
direct paths to symptoms did significantly improve fit. Figure 5.2 Model 2 (a, b and c):
Karasek’s (1979) core model (with slight change version), with job factors predicted to
have only an indirect effect on somatic symptoms. In sum, the fit of this model was
similar to that of model 1 using B values and adjusted R2 values. Thus, a mediated model
(model 2) provided as good a fit as a direct effects model (model 1). Unlike model 1, the
hypothesized direction of effects (between strain outcomes) was confirmed in model 2,
and this model also explained a higher proportion of the variance in somatic symptoms.
In both model 1 and 2, however, did the interaction term make a significant unique
contribution to the explanation of the variance in strain.

170
Time-1
Time-2

171
Figure 5.2: Model 2 (a): A moderated Karasek’s (1979) core model (modification of social
supports), with job factors predicted to have only an indirect effect on somatic symptoms. See
text for an explanation of these models. Standardized coefficients are reported after the final step
and adjusted R2 in parentheses after R2.
Time-1
Time-2
Figure 5.2. Model 2 (b): A moderated Karasek’s (1979) core model (modification of social
supports), with job factors predicted to have only an indirect effect on somatic.

172
Time-1
Time-2
Figure 5.2. Model 2 (c): A moderated Karasek’s (1979) core model (modification of social
supports), with job factors predicted to have only an indirect effect on somatic symptoms See text
for an explanation of these models.

173
5.13.3 Model 3: Modified Karasek’s (1979) Core Model, with Social
Supports and Perceived Stressors added as a Mediating Variable.
Model 3 involved a modification of Model 1 such that indirect link between the job
factors and strain outcomes was developed. Rather, demands, control and social supports
and their interaction were specified to predict total stressors which, in turn predicted all
four measures of strain. Furthermore, several pathways of the model were assessed. This
model resulted in a significant improvement in fit over the original unconstrained model,
through stressors to three outcomes of strain. In short, model 3 provided an excellent fit.
Importantly, within the context of this model, demands, control and social supports
predicted stressors and the three strain outcomes, thereby confirming hypotheses 1, 2,
and 5. The demands and control interaction also predicted these outcomes indirectly,
although the fit of the model that included a path between the interaction term and
stressors was significantly better than the fit of the model that omitted these pathways.
The fit of the hypothesized model was similar to that of model 1, and model 3 had all
significant parameters and explained a lower proportion of the variance in all strain
outcomes. Whilst control was slightly redundant as a predictor of strain in models 1 and
2, model 3 suggested that social supports plays several significant roles in the stress chain
- a main effect on stressors, a buffer on the demands-stressor relationship, and an indirect
effect on strain.
Finally, a version of model 3 that included both indirect and direct paths to strain was
parsimonious and better-fitting than the original (fully mediated) version, suggesting that
the influence of the job factors on strain is only partially mediated through stressors
whereas model 3 (b) predicted a strong relationship between strain and its outcomes.

174
Time-1
Time-2
Figure 5.3. Model 3 (a): Karasek’s (1979) modified model, with Stressors included as a mediator
of the job factors-strain relationship. See text for an explanation of these models. Standardized
coefficients are reported after the final step and adjusted R2 in parentheses after R2. All beta
values and R2 are taken from analyses that included quadratic terms

175
5.13.4 Model 4: Proposed Alternative Model, with indirect effects b/w
Immediate Strain Outcomes Differentiated, and Stressors Mediating the
Job Factors-Strain Relationships.
A proposed Model 4 involved two modifications to model 1: (a) the outcomes of strain
were temporarily differentiated into immediate (anxiety, stress, job dissatisfaction) and
slightly less immediate (somatic complaints) outcomes, with effects upon the latter
mediated by the former, and (b) the stressors variable was included as a mediator
between the job factors and immediate outcomes of strain. Consequently, the model
included both of the changes added in models 2 and 3. The model is shown in Figure 5.5.
As can be seen, the fit of this model was excellent. As in model 3, demands, control and
social supports, and the interaction term (p < .001), were significant predictors of
stressors. Social supports and job demands are two significant predictors whereas job
control, marginally, significant predictor of job strain. Similarly, the indirect effects of
the three predictors on all four strain outcomes were significant, ps < .001. All other
structural paths were significant at p < .001, R2 adjusted values greater than .58. As with
the other models, demands and social supports had stronger total effects on all measures
of strain than did control. Model 4 fitted the data significantly, better than did model 3.
Figure 5.4. Model 4: Karasek’s (1979) core model, with stressors included as a mediator
and differentiated strain outcomes. The pathways from demands and social supports to
stressors, stressors to strain, strain to somatic symptoms, and job dissatisfaction to
somatic symptoms were high significant. The path ways from control to stressors, job
stressors to anxiety, and anxiety to somatic symptoms were marginally significant,
slightly lower than others. Third, a partially-mediated model, in which paths were added
to enable the exogenous variables to directly predict all three strain outcomes, fitted the
data very well, R2,adjusted values were higher than .60 , and p < .001.

176
Time-1
Time-2
Figure 5.4. Model 4 (a): Proposed Alternative Model, with Immediate and Remote
Strain Outcomes Differentiated, model, with stressors included as a mediator and
differentiated strain outcomes.

177
Time-1
Time-2
Figure 5.4. Model 4 (b): Proposed Alternative Model, with Immediate Strain Outcomes
Differentiated model, with stressors included as a mediator and differentiated strain
outcomes. See text for an explanation of these models. Standardized coefficients are
reported after the final step and adjusted R2 in parentheses after R2 All beta values and
R2 are taken from analyses that included quadratic terms.

178
5.13.5 Model 5: Modified Karasek’s (1979), Karasek and Theorell
(1990) Model, with Social Supports (SS + CS) and Activity
participations added as a Mediating Variable.
An extended Model 5 involved a modification of Model 3 such that indirect link between
the job factors and various strain outcomes was developed. Rather, demands, control and
social supports and their interaction were specified to predict total stressors which, in
turn predicted all four measures of strain. In such analysis, sub-set of social supports
(colleagues’ supports and supervisory supports) as a moderator and job performance and
personality variable as outcomes was introduced to check the fitness of model.
Furthermore, several pathways of the model were assessed. This model resulted in a
significant improvement in fit over the original unconstrained model, through stressors to
nine outcomes of strain. In short, model 5 provided a good fit. Importantly, within the
context of this model, demands, control and social supports (sub-set supervisory supports
and colleague’s supports) predicted strain and the five strain outcomes, thereby
confirming hypotheses 1, 2, 3,and 5. The demands and control interaction also predicted
these outcomes indirectly, although the fit of the model that included a path between the
interaction term and strain was significantly better than the fit of the model that omitted
these pathways. The fit of the hypothesized model was similar to that of model 3, and
model 5 had all significant parameters and explained a lower proportion of the variance
in all strain outcomes. Whilst control was slightly redundant as a predictor of strain in
models 1, 2 and 3, and model 3 suggested that social supports plays several significant
roles in the stress chain - a main effect on stressors, a buffer on the demands-stressor
relationship, and an indirect effect on strain. Finally, a version of model 5 that included
both indirect and direct paths to strain was parsimonious and better-fitting than the
original (fully mediated) version, suggesting that the influence of the job factors on strain
is only partially mediated through stressors whereas model 5 predicted a strong
relationship between strain and its five outcomes.

179
Time-1
Time-2
Figure 5.5. Model 5: Modified Karasek’s (1979), Karasek and Theorell (1990) Model, with Social
Supports (SS + CS) and Activity participations added as a Mediating Variable. See text for an explanation
of these models. Standardized coefficients are reported after the final step and Adjusted R2 in parentheses
after R2. All beta values and R2 are taken from analyses that included quadratic terms.

180
5.13.6 Model 6: Proposed Alternative Extended Model, with Immediate
and Remote Strain Outcomes Differentiated model, with stressors
included as a moderators and differentiated strain outcomes
A proposed alternative extended Model 6 involved two modifications to model 1 and 2:
(a) the factors of strain predicted the effects on stress and combine effects of stress were
predicted on various outcomes of strain which were differentiated into immediate
(anxiety, job dissatisfaction and somatic symptoms) outcomes, with effects upon the
latter mediated by the former, and (b) the stressors variable was included as a mediator
between the job factors and immediate and remote outcomes of strain.
Finally, a composite model was specified in which all specific factors and all specific
outcomes predicted the strain outcomes. Consequently, the model included both of the
changes added in models 2, 3 and 4. The model is shown in Figure 5.6. As can be seen,
the prediction of this model was excellent. As in model 6, demands, control and social
supports, and the interaction term (p < .001), were significant predictors of stressors. Job
control and job demands are two significant predictors whereas job social supports,
marginally, significant predictor of job stress. Similarly, the indirect effects of the three
predictors on all five strain outcomes were significant, p < .001. All other structural paths
were significant at p < .001, R2 adjusted values greater than .60. As with the other
models, demands and social supports had stronger total effects on all measures of strain
than did control but in model 6 demands and control are the strong predictors. Model 6
fitted the data significantly, slightly better than did other models. Figure 5.6. Model 6:
Karasek’s (1979) moderated model, with stressors included as a mediator and
differentiated strain outcomes. The pathways from stress to job dissatisfaction and job
dissatisfaction to employees’ turnover intention were high significant R2 values were
higher than .73. This complex and extended model predicts significant and non-
significant level of each factor used in study 1.

181
Time-1
Time-2
Figure 5.6. Model 6: Proposed Alternative Extended Model, with Immediate and Remote Strain Outcomes Differentiated model, with stressors included as a moderators and differentiated strain outcomes. See text for an explanation of these models. Standardized coefficients are reported after the final step and adjusted R2 in parentheses after R2. All beta values and R2 are taken from analyses that included quadratic terms. MS = Mastery Scale, ETI = Employees Turnover Intension, NP = Negative Personality, Neuro. = Neuroticism
5.13.7 Model 7: Modified Karasek’s (1979) Core Simple Model
Model 7 (Karasek’s core model) provided good interaction between job factors
(demands, control and social supports) with job stress using beta values and R2 values
which signified the strength of relationship. Model 7 fitted the data significantly, better
than did other models but could not specific the relationship with outcomes of strain.

182
Time-1
Time-2
Figure 5.7. Model 7: Modified Karasek’s (1979) Core Simple Model (a simple description). See text for an
explanation of these models. Standardized coefficients are reported after the final step and adjusted R2 in
parentheses after R2

183
5.14 Summary of seven Models used in Study involving the
Total Job Factor Scales.
These analyses suggested that:
(a) Model 1 (Karasek’s core moderated model) provided a very good fit to the data, but
control interaction variable, was slightly redundant to the prediction of strain. Direction
of effects was satisfactory;
(b) Model 2 provided a fit that was as good as (but significantly better than Bradley,
2004) that provided by Karasek’s original model. It explained a lower proportion of the
variance in somatic symptoms and other outcomes of strain, and had the greatest chance
of replication of any model tested. Control and the interaction contributed slightly lower
to the prediction of strain. A partially-mediated version of this model, which added direct
paths to symptoms, did improve model fit;
(c) Model 3 fitted the data well and indicated that social supports had main and buffering
effects on stressors, as well as indirect effects on strain. A partially mediated version of
this model, in which direct effects of job factors on strain were added, resulted in a
marginally improved fit;
(d) Model 4 provided a significantly better fit than did model 3. As with model 3, all
hypothesized paths were significant. A partially mediated version of the model did not
improve fit. On balance, this model provided the best fit of those tested.
(e) Model 5 provided significant effects four additional variables; colleague’s supports
and supervisory supports as moderator, job performance and personality variables as
outcomes. As with model 5, all hypothesized pathways were significant.
(f) Model 6 provided a comprehensive look over various job factors and their interaction
with each other by differentiating between immediate and remote strain outcomes. Model
shows the significant pathway at various level of R2.
(g) Model 7 depicts a brief prediction of demands, control and social supports were
specified to predict total stress which, in turn predicted all three measures of strain. In

184
such analysis, control and social supports as a moderator were introduced to check the
fitness of model. Furthermore, several pathways of the model were assessed. This model
resulted in a significant improvement in fit over the original unconstrained model,
through three perceived factor of strain.
These seven model’s result offer support for two of the central propositions of this thesis,
namely, that Karasek’s models can be improved and verified in current Pakistani
environment (a) by including perceived job stressfulness as a mediating variable, and (b)
by differentiating between immediate and remote strain outcomes. The seven models
described above in relation to the impact of the total demands, total control and social
supports (colleagues supports + supervisory supports) variables were tested two times,
once using each of the specific job factor scales. In sum, all model provided an excellent
fit. Importantly, within the context of this model, control predicted stressors and the four
strain outcomes, thereby confirming hypotheses 2, 3 and 7. The social support interaction
also predicted these outcomes, although the fit of the model that included paths between
the interaction term and stressors was highly significantly better fit of the model that
omitted this parameter. The fit of the hypothesized model was similar to that of model 1,
but model 3 (a & b) had significant parameters and explained a lower proportion of the
variance in all strain outcomes. Whilst control was slightly redundant as a predictor of
strain in models 1 and 2, model 3 suggested that control plays several significant roles in
the stress chain - a main effect on stressors, a buffer on the demands-stressor relationship,
and an indirect effect on strain.
Finally, a version of model 3 that included both indirect and direct paths to strain was
slightly less parsimonious but better-fitting than the original (fully mediated) version,
suggesting that the influence of the job factors on strain is only partially mediated
through stressors. Furthermore, three newly constructed models (nos., 5, 6 and 7), using
multiple regression, also provided the clear picture of job factors and their direct and
indirect effects on immediate and remote outcomes of strain.

185
5.15 Study 2 Tests of Activity Participation Hypotheses
In this study it was reported that activity participation might be an important predecessor
of the job factors. These issues were discussed in detail to test the validity of study-1 and
to develop new hypotheses. Nine hypotheses were tested as under:
29-Job demands are negatively associated with job performance;
30-Job control is positively associated with job performance;
31-Social support is positively related to job performance;
32-Job demands are negatively associated with job participation;
33-Job control is positively associated with job participation;
34-Social support is positively related to job participation;
35-Job demands are negatively associated with job consideration;
36Job control is positively associated with job consideration; and
37-Social support is positively related to job consideration.
These three outcomes were studied through various statistical techniques as a activity
participation variables. Also reported are findings from a series of more elaborate models
that investigate the role of the activity participation variables as predictors of strain, and
the role of the job factors as moderator of the activity participation-strain relationships.
Findings pertaining to these predictions are reported using three data analytic techniques:
simple correlations, linear, and multiple regressions. Sub-group analyses were performed
because significant results made good predictions regarding the effects of the dimensions
of activity participation. Activity participation measures were taken in study 1 and are
compared with study 2 to draw final recommendation.
5.15.1 Correlation Analyses Appendix E1 & E2 show correlations between the activity participation variables, total
job factors and strain outcomes. The three activity participation variables were highly
negatively correlated (between .60 and .85) with job demands and job stress. Job
performance and job participation were high positively and significantly related to the
expected job factor, whilst job performance emphasis was also negatively (and slightly
less significant) related to job demands and job stress. Furthermore, the relative

186
magnitude of these bi-variate correlations was consistent with original predictions.
Specifically, the activity participation dimension of job performance correlated most
highly with all three job factors (rather than each activity participation dimension
predicting a different job factor). High levels of all activity participation variables were
associated with low strain, although the correlation between job participation and job
consideration emphasis and strain was slightly less significant.
5.15.2 Multiple Regression Analyses Hierarchical multiple regression analyses were performed to assess the effects of the
activity participation variables on, in separate analyses, total demands, total control, and
supervisor support. Main, quadratic and interaction effects were explored separately each
for job performance, job participation and job consideration. This was done because each
variable of has separate entity and requisites, all these analyses used the T1 & T2 data to
develop the relationship between job factors and activity participation variables. The
followings tables summarize findings from the main and additive analyses. These
regression models explained significant and consistent of variances in various sub-group
domain analyses, but slightly smaller proportions of the variances in employees’ demands
and employees’ control. The three activity participation dimensions were associated with
significant (p < .001) R2 adjusted values when entered together as a block in predicting
each of the job factors. As shown in the table’s job consideration was a significant (p <
.001) predictor of all three job factors. Job participation predicted all job factors
particularly supervisor support (p < .01), but smaller prediction in employees demands
and employees control. Job performance also emphasis the entire job factors especially
additive effects of job factors. These findings are consistent with above developed
hypothesis main effect of job factors on job performance, job participation and job
consideration.
5.15.2.1 (a) Main and Additive Effects of Specific Job Factors Content
Domains on Job Performance The linear and multiple regression analysis were repeated this time, once for each of the
specific job factor content domains. Results from these analyses are summarized in
Appendixes given below. Tables showed in category D15-34 at T1, and at T2 that

187
specific job factors explained significant amount of the variance in Activity participation
variables-job performance. These variances were analyzed as under: 1-Qualitative demands explained 59% at T1, and 60% at T2 (see Appendix D15 of T1 & T2),
2-Employees demands explained 45% at T1, and 12% at T2 (see Appendix D16 of T1 & T2),
3-Workload demands explained 59% at T1, and 63% at T2 (see Appendix D17 of T1 & T2),
4-Conflicts demands explained 58% at T1, and 58% at T2 ( see Appendix D18 of T1 & T2),
5-Qualitative control explained 47% at T1, and 48% at T2 ( see Appendix D19 of T1 & T2),
6-Employees control explained 38% at T1, and 39% at T2 ( see Appendix D20 of T1 & T2),
7-Workload controls explained 47% at T1, and 43% at T2 ( see Appendix D21 of T1 & T2),
8-Conflicts controls explained 39% at T1, and 36% at T2 ( see Appendix D22 of T1 & T2),
9-QD + QC explained 64% at T1, and 65% at T2 ( see Appendix D23 of T1 & T2),
10-ED + EC explained 52% at T1, and 42% at T2 ( see Appendix D24 of T1 & T2),
11-WD + WC explained 62% at T1, and 65% at T2 ( see Appendix D25 of T1 & T2),
12-CD + CC explained 59% at T1, and 61% at T2 ( see Appendix D26 of T1 & T2),
13-QC + SS explained 64% at T1, and 63% at T2 ( see Appendix D27 of T1 & T2),
14-EC + SS explained 73% at T1, and 72% at T2 ( see Appendix D28 of T1 & T2),
15-WC + SS explained 74% at T1, and 73% at T2 ( see Appendix D29 of T1 & T2),
16-CC + SS explained 73% at T1, and 72% at T2 ( see Appendix D30 of T1 & T2),
17-QC + CS explained 68% at T1, and 58% at T2 ( see Appendix D31 of T1 & T2),
19-EC + CS explained 66% at T1, and 54% at T2 ( see Appendix D32 of T1 & T2),
20-WC + CS explained 68% at T1, and 55% at T2 ( see Appendix D33 of T1 & T2),
21-CC + CS explained 67% at T1, and 51% at T2 ( see Appendix D34 of T1 & T2),
Note: QD + QC (Qualitative Demands + Qualitative Control)
ED + EC (Employees Demands + Employees Control)
WD + WC (Workload Demands + Workload Control)
CD + CC (Conflicts Demands + Conflicts Control)
SS + CS (Supervisor Support + Colleagues Support)
Results were substantially consistent over three factors of activity participation variables.
Workload demands, qualitative control, QD + QC, EC + SS and WC + CS were
remained highest predictors of job performance, whereas, employees demands,
employees control and ED + EC were lower predictors of activity participation variables-
job performance at both T1 and T2 study of regression analyses. 5.15.2.1 (b) Main and Additive Effects of Job Factors on Job
Performance Appendix of category D at T1, and at T2 showed that the job factors explained

188
significant amount of the variances in job performance-a activity participation variables.
These variances were analyzed and summarized as under:
1-Total demands explained 65% at T1, and 66% at T2 ( see Appendix D3, T1 & T2),
2-Total control explained 49% at T1, and 48% at T2 (see Appendix D4 of T1 & T2),
3-Supervisory support explained 73% at T1, and 71% at T2 (see Appendix D5 of T1 & T2),
4-Colleagues support explained 65% at T1, and 39% at T2 (see Appendix D6 of T1 & T2),
5-Social support explained 72% at T1, and 47% at T2 (see Appendix D7 of T1 & T2),
6-TD + TC explained 67% at T1, and 68% at T2 (Appendix D8 of T1 & T2),
7-TD + SS explained 75% at T1, and 71% at T2 (Appendix D9 of T1 & T2),
8-TC + SS explained 73% at T1, and 65% at T2 (Appendix D10 of T1 & T2), and
9-TD + TC + SS explained 75% at T1, and 72% at T2 (see Appendix D4 of T1 & T2).
Note: TD = Total Demands, TC = Total Control and SS= Social Support.
All factors were significant at the p < .001 level, with additive and quadratic effects
contributing significantly to activity participation variables. However, our findings in job
performance were strongly significant and consistent as compare to other two cases of
activity participation variables (job participation and job consideration). Specifically,
there was a significant enhancing effect for the Demands + control + social support
interaction in the basic model (p < .001), than main and quadratic effects alone. 5.15.2.2 (a) Main and Additive Effects of Specific Job Factors Content
Domains on Job Participation The linear and multiple regression analysis were reported this time, once for each of the
specific job factor content domains. Results from these analyses are summarized in
Appendixes given below. Tables showed in category D15-34 at T1, and at T2 that
specific job factors explained significant amount of the variances in activity participation
variables-job participation. These variances were analyzed as under: 1-Qualitative demands explained 50% at T1, and 55% at T2 ( see Appendix D15 of T1 & T2),
2-Employees demands explained 38% at T1, and 13% at T2 ( see Appendix D16 of T1 & T2),
3-Workload demands explained 50% at T1, and 57% at T2 ( see Appendix D17 of T1 & T2),
4-Conflicts demands explained 46% at T1, and 53% at T2 ( see Appendix D18 of T1 & T2),
5-Qualitative control explained 43% at T1, and 48% at T2 ( see Appendix D19 of T1 & T2),
6-Employees control explained 33% at T1, and 40% at T2 ( see Appendix D20 of T1 & T2),
7-Workload controls explained 42% at T1, and 41% at T2 ( see Appendix D21 of T1 & T2),
8-Conflicts controls explained 34% at T1, and 35% at T2 ( see Appendix D22 of T1 & T2),

189
9-QD + QC explained 55% at T1, and 63% at T2 ( see Appendix D23 of T1 & T2),
10-ED + EC explained 45% at T1, and 43% at T2 ( see Appendix D24 of T1 & T2),
11-WD + WC explained 53% at T1, and 60% at T2 ( see Appendix D25 of T1 & T2),
12-CD + CC explained 50% at T1, and 57% at T2 ( see Appendix D26 of T1 & T2),
13-QC + SS explained 64% at T1, and 68% at T2 ( see Appendix D27 of T1 & T2),
14-EC + SS explained 63% at T1, and 68% at T2 ( see Appendix D28 of T1 & T2),
15-WC + SS explained 64% at T1, and 67% at T2 ( see Appendix D29 of T1 & T2),
16-CC + SS explained 63% at T1, and 66% at T2 ( see Appendix D30 of T1 & T2),
17-QC + CS explained 60% at T1, and 56% at T2 ( see Appendix D31 of T1 & T2),
18-EC + CS explained 58% at T1, and 52% at T2 ( see Appendix D32 of T1 & T2),
19-WC + CS explained 59% at T1, and 52% at T2 ( see Appendix D33 of T1 & T2), and
20-CC + CS explained 59% at T1, and 48% at T2 ( see Appendix D34 of T1 & T2).
Note: QD + QC (Qualitative Demands + Qualitative Control)
ED + EC (Employees Demands + Employees Control)
WD + WC (Workload Demands + Workload Control)
CD + CC (Conflicts Demands + Conflicts Control)
SS + CS (Supervisor Support + Colleagues Support)
Results were substantially unchanged over three factors of activity participation
variables. Qualitative demands, qualitative control, CD + CC and supervisory support
were remained highest predictors of job participation scale, whereas, employees
demands, employees control and ED + EC were lower predictors of activity participation
variables-job participation scale at both T1 and T2 study of regression analyses.
5.15.2.2 (b) Main and Additive Effects of Job Factors on Job
Participation Appendix of category D at T1, and at T2 showed that the job factors explained
significant amount of the variances in job participation-a activity participation variables.
These variances were analyzed & summarized as under:
1-Total demands explained 55% at T1, and 61% at T2 (see Appendix D3, T1 & T2),
2-Total control explained 43% at T1, and 49% at T2 (see Appendix D4 of T1 & T2),
3-Supervisory support explained 62% at T1, and 64% at T2 (see Appendix D5 of T1 & T2),
4-Colleagues support explained 48% at T1, and 28% at T2 (see Appendix D6 of T1 & T2),
5-Social support explained 53% at T1, and 34% at T2 (see Appendix D7 of T1 & T2),
6-TD + TC explained 57% at T1, and 64% at T2 (see Appendix D8 of T1 & T2),

190
7-TD + SS explained 64% at T1, and 65% at T2 (see Appendix D9 of T1 & T2),
8-TC + SS explained 63% at T1, and 62% at T2 (see Appendix D10 of T1 & T2), and
9-TD + TC + SS explained 64% at T1, and 68% at T2 (see Appendix D4 of T1 & T2).
Note: TD = Total Demands, TC = Total Control and SS= Social Support.
All factors were significant at the p < .001 level, with additive and quadratic effects
added significant amount to activity participation variables-job participation. However,
our findings in job participation scale were strongly significant and consistent, but
slightly lower than job performance as first predictor of activity participation variables.
Specifically, there was a significant enhancing effect for the Demands + control + social
support interaction in the basic model (p < .001), than main and quadratic effects alone. 5.15.2.3 (a) Main and Additive Effects of Specific Job Factors Content
Domains on Job Consideration The linear and multiple regression analysis were demonstrated through two times study,
once for each of the specific job factor content domains. Results from these analyses are
summarized in Appendixes given below. Tables showed in category D15-34 at T1, and
at T2 that specific job factors explained significant amount of the variance in Activity
participation variables-job consideration. These variances were reported as under: 1-Qualitative demands explained 44% at T1, and 43% at T2 ( see Appendix D15 of T1 & T2),
2-Employees demands explained 33% at T1, and 10% at T2 ( see Appendix D16 of T1 & T2),
3-Workload demands explained 45% at T1, and 47% at T2 ( see Appendix D17 of T1 & T2),
4-Conflicts demands explained 42% at T1, and 41% at T2 ( see Appendix D18 of T1 & T2),
5-Qualitative control explained 33% at T1, and 36% at T2 ( see Appendix D19 of T1 & T2),
6-Employees control explained 25% at T1, and 27% at T2 ( see Appendix D20 of T1 & T2),
7-Workload controls explained 32% at T1, and 29% at T2 ( see Appendix D21 of T1 & T2),
8-Conflicts controls explained 26% at T1, and 25% at T2 ( see Appendix D22 of T1 & T2),
9-QD + QC explained 47% at T1, and 48% at T2 ( see Appendix D23 of T1 & T2),
10-ED + EC explained 36% at T1, and 29% at T2 ( see Appendix D24 of T1 & T2),
11-WD + WC explained 46% at T1, and 48% at T2 ( see Appendix D25 of T1 & T2),
12-CD + CC explained 43% at T1, and 44% at T2 ( see Appendix D26 of T1 & T2),
13-QC + SS explained 54% at T1, and 53% at T2 ( see Appendix D27 of T1 & T2),
14-EC + SS explained 53% at T1, and 52% at T2 ( see Appendix D28 of T1 & T2),
15-WC + SS explained 54% at T1, and 52% at T2 ( see Appendix D29 of T1 & T2),
16-CC + SS explained 53% at T1, and 51% at T2 ( see Appendix D30 of T1 & T2),

191
17-QC + CS explained 49% at T1, and 43% at T2 ( see Appendix D31 of T1 & T2),
18-EC + CS explained 48% at T1, and 38% at T2 ( see Appendix D32 of T1 & T2),
19-WC + CS explained 49% at T1, and 38% at T2 ( see Appendix D33 of T1 & T2),
20-CC + CS explained 48% at T1, and 36% at T2 ( see Appendix D34 of T1 & T2)
Note: QD + QC (Qualitative Demands + Qualitative Control)
ED + EC (Employees Demands + Employees Control)
WD + WC (Workload Demands + Workload Control)
CD + CC (Conflicts Demands + Conflicts Control)
SS + CS (Supervisor Support + Colleagues Support)
Results were marginally significant over two period’s activity participation variables-a
job consideration. Workload demands, qualitative control, WD + WC and specific factors
of supervisory support were remained considerable predictors of job consideration scale,
whereas, employees demands, employees control and ED + EC were lower predictors of
activity participation variables-job consideration scale at both T1 and T2 study of
regression analyses.
5.15.2.3 (b) Main and Additive Effects of Job Factors on Job
Consideration Appendixes of category D at T1, and at T2 showed that the job factors explained
significant amount of the variances in job consideration-a activity participation variables.
These variances were analyzed & summarized as under:
1-Total demands explained 49% at T1, and 47% at T2 ( see Appendix D3, T1 & T2),
2- Total control explained 33% at T1, and 34% at T2 (see Appendix D4 of T1 & T2),
3-Supervisory support explained 53% at T1, and 51% at T2 (see Appendix D5 of T1 & T2),
4-Colleagues support explained 43% at T1, and 48% at T2 (see Appendix D6 of T1 & T2),
5-Social support explained 53% at T1, and 58% at T2 (see Appendix D7 of T1 & T2),
6-TD + TC explained 48% at T1, and 49% at T2 (see Appendix D8 of T1 & T2),
7-TD + SS explained 56% at T1, and 52% at T2 (see Appendix D9 of T1 & T2),
8-TC + SS explained 53% at T1, and 46% at T2 (see Appendix D10 of T1 & T2), and
9-TD + TC + SS explained 55% at T1, and 53% at T2 (see Appendix D4 of T1 & T2).
Note: TD = Total Demands, TC = Total Control and SS= Social Support.
All factors were significant at the p < .001 level, with additive and quadratic effects
contributing significantly to outcomes of activity participation variables. However, our

192
findings in job consideration scale were marginally significant and consistent as compare
to other two cases of activity participation outcomes. Specifically, there was a significant
enhancing effect for the Demands + control + social support interaction in the basic
model (p < .001), than main and quadratic effects alone.
5.16 Summary of Findings of Activity Participation Variables Findings reported in T1 & T2 demonstrate that the activity participation variables and job
factors highly associated. In fact, activity participation variables operate as antecedents to
the job factors in that the hypothesized versions of the different models of study
consistently provided a better fit than did the corresponding reversed-effects versions.
However, as detailed above, there was sufficient support for the predicted relationships
between three activity participation dimensions and particular job factors.
Hypothesis 29. Job Demands are negatively related to Job Performance
The findings considerably support the hypothesized negative relationship between
performance emphasis and job demands. In both correlation and regression analyses, the
relationship between these variables was negative and significantly predictor. The
hypothesized structural model yielded a significant estimate for the performance
emphasis-total demands parameter, and this model explained 65% at T1, and 66% at T2
of the variance in total demands. In the saturated model, the parameter was negative and
significant. In only one of the six best fitting models was the predicted significant,
negative relationship evident.
Hypothesis 30. Job Control is positively related to Job Performance
The findings provided strong evidence for the hypothesized effect of participation on job
control. The simple correlation between these variables was positive and high significant.
However, the full regression model indicated that job performance was highly significant
predictor of control. The hypothesized structural model included an estimate of the job
performance-control relationship that was positive and significant, and job performance
explained 49% at T1, and 48% at T2 of the variance in this job factor. The relationship
was significant in the saturated version. In only one of the six best fitting models were
the predicted significant, positive relationship evident (see Modeling analysis 5.16).
Hypothesis 31. Job Social Support is positively related to Job Performance
Like job control relationship, the hypothesized positive relationship between job

193
performance and job factors were confirmed in all analyses. The simple correlation
between these variables was very high as r = .79 at T1, and r = .62 at T2. Indeed, job
performance explained 65% at T1, and 39% T2 of the variance in social support in the
hypothesized structural model. Effects of social support were sufficient and considerable
with job factors in developing pathway in the saturated versions of the models. In all
analyses, supervisory support was remained high predictor of job performance better than
colleagues support.
Hypothesis 32 Job Demands are negatively related to Job Participation
The findings considerably support the hypothesized positive relationship between Job
participation emphasis and job demands. In both co relational and regression analyses,
the relationship between these variables was remained positive and significantly
predictor of job factors. The hypothesized structural model yielded a significant estimate
for the performance emphasis-total demands parameter, and this model explained 55% at
T1, and 61% at T2 of the variance in total demands. In the saturated model (see 5.16), the
parameter was positive and significant slightly lower than job performance. In only one
of the six best fitting models were the predicted significant, negative relationships
evident.
Hypothesis 33 Job Control is positively related to Job Participation
The findings provided strong evidence for the hypothesized effect of participation on job
control. The simple correlation between these variables was positive and high significant.
However, the full regression model indicated that job performance was highly significant
predictor of control. The hypothesized structural model included an estimate of the job
participation-control relationship that was positive and significant, and job participation
explained 49% at T1, and 48% at T2 of the variance in this job factor. The relationship
was significant in the saturated version. In only one of the six best fitting models was the
predicted significant, positive relationship evident.
Hypothesis 34 Job Social Support is positively related to Job Participation
Like job control relationship, the hypothesized strong positive relationship between job
participation and job factors were confirmed in all analyses. Indeed, job participation
explained 53% at T1, and 34% at T2 of the variance in social support in the hypothesized
structural model. Effects of social support were sufficient and considerable with job

194
factors in developing pathway in the saturated versions of the models.
Hypothesis 35 Job Demands are negatively related to Job Consideration
The findings considerably support the hypothesized positive relationship between Job
consideration emphasis and job demands. In both co relational and regression analyses,
the relationship between these variables was remained positive and significantly
predictor of job factors slightly lower than performance and participation. The
hypothesized structural model yielded a significant estimate for the job consideration
emphasis-total demands parameter, and this model explained 49% at T1, and 47% at T2
of the variance in total demands. In the saturated model, the parameter was positive and
significant slightly lower than job performance and job participation. In only one of the
six best fitting models were the predicted significant, negative relationships evident.
Hypothesis 36. Job Control is positively related to Job Consideration
The findings provided strong evidence for the hypothesized effect of consideration on job
control. The simple correlation between these variables was positive and high significant
(see Appendix E1 & E2). However, the full regression model indicated that job control
was marginally significant predictor of job consideration. The hypothesized structural
model included an estimate of the job control-job participation relationship that was
positive and significant, and job consideration explained 33% at T1, and 34% at T2 of the
variance in this job factor. The relationship was significant in the saturated version. In six
best fitting models were the predicted significant, positive relationships evident.
Hypothesis 37. Job Social Support is positively related to Job Consideration
Like job control relationship, the hypothesized marginally positive relationship between
job consideration and job factors were confirmed in all analyses. Indeed, job
consideration explained 53% at T1, and 58% at T2 of the variance in social support in the
hypothesized structural model. Effects of social support were sufficient and considerable
with job factors in developing pathway in the saturated versions of the models.

195
5.17 Discussion Regarding Activity Participation Hypotheses
The aim of the current study was to verify and extend Karasek’s (1979); Karasek &
Theorell, (1990) models by confirming the role played by activity participation variables
as organizational antecedents to the job factors. Each of the three dimensions (job
performance, job participation and job consideration) was expected to have particularly
strong and positive or negative effects upon a specific job factor: management’s
emphasis on achieving performance standards was hypothesized to influence job
demands; management’s encouragement of participation in decision-making was
hypothesized to influence perceived job control; and management’s consideration of the
well-being of their employees was hypothesized to influence perceptions of social
support. The effects of these activity participation variables upon the job factors were
further expected to have implications for levels of employee’s strain in a manner
consistent with Karasek & Theorell’s models. Whilst previous researches have reported
direct effects of activity participation on strain (Bass, 1990), no previous research was
located that tested the hypothesized (direct) effects of the selected activity participation
variables on Karasek’s job factors, or the hypothesized (indirect) effects of the activity
participation variables on strain (Morrison et al., 1996). Given measures of the activity
participation variables were considered to be insufficient for meeting the required
outcomes. Previous researchers like Yukl (Yukl & Kanuk, 1979; Yukl & Nemeroff,
1979) and Bradley (2004), were developed original scales of these variables through one
or two or three pilot studies. The developed scales were shown to have satisfactory levels
of reliability. Despite attempts to select items that minimized overlap between the three
measures, the observed inter-correlations were higher than expected. However,
regression analyses revealed that a three or more-factor model fitted the data significantly
better than did one- or two-factor models (see model 4.5,6), providing evidence of
differing validity of T1& T2. The measure of performance emphasis was moderately and
significantly related to job demands, but in the direction opposite to that of performance.
The measure of participation was related to perceived control in the predicted direction,
and was significant in the context of multivariate models and explained considerable of
the variance in this job factor in these models. The measure of consideration was so

196
highly correlated with supervisor support and additive effects of three job factor as to
suggest the existence of some conceptual and/or measurement between these variables.
Consideration also explained more of the variance in job demands and control slightly
lower than did performance emphasis and participation, respectively. In all analyses, the
proportion of the variance in the job factors explained by the activity participation
variables was substantial in the case of supervisor support and additive effect, but slightly
less in the case of main effect of demands and control. Findings were not only confirm
the expected pattern of relationships between the activity participation and job factors,
the findings were broadly consistent with a model that included the activity participation
variables as remote influences upon strain outcomes, and demands, control and
supervisor support as more immediate determinants of job strain. Thus, in different
models that explore for neuroticism (negative affectivity), significant total effects on at
least some measures of strain were obtained for all three activity participation variables.
These effects on strain were stronger for job performance than for the other two activity
participation dimensions (job participation and job consideration). Consistent with these
findings, the current study showed the activity participation dimensions to be more
highly correlated with job dissatisfaction, supervisory support, job stress, turnover
intentions and job participation, than with job demands and job control. However, more
sophisticated structural models (including the job factors as mediators) indicated that the
activity participation variables explained a greater proportion of the variance in the
former, than the latter, set of strain outcomes. The apparent contradiction may be
attributed to the job factors being more strongly related to strain outcomes and supervisor
support, than to other strain outcomes. The unexpectedly high correlations between the
job factors were of construction of activity participation scale. This high correlations
between self-report measures of activity participation has been previously reported (Teas,
1983) and low correlation reported by Bradley, (2004). In the current study, the high
correlations may have been partly due to consistency of the items used in questionnaire
from the three scales. One consequence of these high correlations was that the activity
participation dimensions of performance emphasis and participation were of core area of
interest that included multiple paths from each activity participation variable with most
significant effects associated with the other two dimensions.

197
In short, the attempt was made to test and expand Karasek & Theorell (1990) models by
including antecedent organizational variables in the form of three dimensions of activity
participation met with considerable success (Bradley, 2004). These three activity
participation variables predicted the job factors and outcomes of strain, and, to this
extent, the findings are at least consistent with the view that particular styles of activity
participation may contribute significantly to immediate outcomes of job strain. However,
further work on scale development is recommended in order to provide the standardized
scale for valid tests of specific activity participation-strain hypotheses. Given the design
and measurement psychological human problems noted above, the study has contributed
a significant and consistent amount to an understanding of the likely usefulness of
interventions aimed at alleviating accumulated strain through changes in activity
participation variables.

198
Chapter # 6
6.0 OVERALL CONCLUSIONS AND FUTURE
RECOMMENDATIONS
The findings of this study were in accordance with the original hypothesis of Karasek and
Theorell (1990) presented on work environment: stress, productivity and the reconstruction
of working life of employees. They hypothesized that psychological job demands may have
a negative effects on the performance of employees, but the negative effect of demands can
be buffered with job control and social support (supervisory support & colleagues support).
This last chapter has two main objectives: first, to evaluate the scope of research; second, to
review the main findings in T1 & T2 study with strengths and weaknesses; and third, to
consider theoretical and practical implications of the findings and contribution to WAPDA.
6.1 Evaluation of Research Most previous stress theories were developed to describe reactions to predictable acute
stress in situations threatening biological survival (Cannon 1935; Selye 1936). However,
the Demand/Control models was developed for work environments where stressors are
persistent, not initially life threatening, and are the product of sophisticated human
organizational decision making. Here, the controllability of the stressors is very important,
and becomes more important as we develop ever more complex and integrated
organizational culture, with ever more complex limitations on individual behavior or
depositions.
The demand/Control/Support model (Karasek 1976; Karasek 1979; Karasek and Theorell
1990), which is discussed in T1 & T2, is based on psychosocial characteristics of work: the
psychological demands of job and a combined measure of task control and skill use. The
model predicts, first, stress-related outcomes, and, secondly, active/passive behavioral
correlates of jobs. Karasek (1979) reported numerous ideas regarding the influence of three
job factors on a range of strain, work environment, and personality variables. Most of the
past researchers have typically investigated only a subset of these ideas, but
Demand/Control model has been usefully expanded by Johnson (1988) and latter by
Bradley, (2004) by the addition of social support as a third dimension. The primary
hypothesis, that jobs which are high in demands, low in control - and also low in social

199
support at work carry the highest risks of immediate and remote outcomes of strain. The
addition of social support clearly acknowledges the need of any theory of job stress to
assess social relations at the workplace (Karasek and Theorell 1990; Johnson and Hall
1988; Bradley, 2004). Social support buffering of psychological strain may depend on the
degree of social and emotion integration and trust between co-workers, supervisors (Israel
1987). Addition of social support also makes the Demand/Control perspective more useful
in job redesigning or job reconstructing. The strength of the current research was that it was
similar in scope than most previous research. Therefore, the current research tested versions
of Karasek’s models that were influenced by insights from these transactional perspectives,
as well as by research findings (Johnson and Hall 1988; Moyle, 1995, 1998; Spector &
O’Connell, 1994) that acknowledge the role played by individual difference factors. The
research included a consideration of job demands, perceived control, actual stressors, and
both proximate and remote outcomes of strain. Job demands were conceptualized as
potential stressors, with the probability of it being translated into an actual stressors
dependent upon control and social support-available on work place. Similarly, most
previous studies (Johnson 1986; Kristensen 1995) that were limited to tests of the direct
effects of demands and control and their interaction on strain, the current research also
tested the scheme that the relationship between demands and control has its most direct and
most powerful influence upon perceptions of actual stressors as additive effects.
Consequently, the current research makes a potentially important contribution in testing
Karasek’s model to align it more closely with other modern theories of stress. Two studies
were conducted at T1& T2 as a cross-sectional study. This permitted the similarity of
Karasek’s (1979) job strain model to be assessed both between samples (Study 1 vs. Study
2). Whilst the first study was limited in scope to those variables included in the core job
strain model, the second study included a test not only of the strain hypothesis, but also of
Karasek’s personality variables hypothesis. Dependent variables for this second hypothesis
were almost same as included measures of job factors, immediate and remote outcomes of
job strain, activity participation and personality variables. Past studies of Karasek’s models
have focused on negative strain outcomes, and have failed to include measures of positive
outcomes (Bradley, 2004). Both studies included measures of personal and organizational
variables, in order to permit the predictive power of these variables to be assessed. Study 2
also included measures of the two personality variables (neuroticism and mastery scale)
which were central to Karasek’s person-environment fit model. It also tested Karasek’s

200
prediction of changes in personality over two periods as a function of job conditions.
This hypothesis has already been tested by Bradley (2004) within the context of Karasek’s
theory, and evidence demonstrating that personality traits such as negative affectivity are
remarkably stable over time regardless of intervening life events. A next focus of the
second study was on the relationship between three dimensions of activity participation
style (job performance, job participation and job consideration), the job factors and strain
outcomes (immediate and remote). By including the activity participation variables, the
second study encompassed variables representing all components of the general model # 6
of the stress process. In particular, the study reported relationships between organizational
antecedents (activity participation), job factors, actual stressors, immediate outcomes (e.g.,
stress, satisfaction, anxiety, somatic symptoms), and more remote outcomes (e.g.,
employees turnover intentions, participation and consideration). Like most previous
studies, the current research could possibly have included a broader range of predictor,
moderator and/or outcome variables. A range of personality variables could also have been
added to the study as indirect predictors of the outcomes or as moderators of the effects of
the job factors. In short, there were several advantages associated with limiting the range of
variables studied in T1 & T2. Whilst some of the unexplained variance is no doubt due to
error or scale construction, it seems likely that variables such as those listed in two studies
account for a further portion of these variances.
The emphasis in Study 1 & 2 was upon developing multi-item variables, self-report
measures of demands, control and stressors that met several criteria, namely, these
measures were (a) directly and specifically relevant to office job, (b) not confounded with
each other or with the outcome measures, and (c) highly harmonious with each other. All
set of items in questionnaire asked the respondents to report upon the extent to which these
characteristics are strain-inducing in your work environment. This approach follows the
practice of Bradley, (2004), Borg and Kristensen (1999), and Wall et al. (1996), who
attributed their findings of significant effects to the use of self-report measures of the job
factors that were exposed of affective content. Scale development in the current research
was pursued through pilot-testing, and through factor analyses. Study 2 developed upon the
earlier work by using the job factor measures constructed for, and refined within, the first
study.
The use of these amended instruments (rather than new established scales) follows the
recommendation of Parker and Sprigg, (1999), Van der Doef (1999), Chan (1995), and

201
Evans and Coman (1993), who have argued that stress in homogenous populations is
best measured by specialized questionnaires. Using measures with high environmental and
construct validity is a marked improvement upon many past tests of Karasek’s theory that
have used ill-fitting secondary data sets in finding outcomes of strain. The current studies
also recognized the versatile nature of the key outcomes (strain, personality variables and
activity participation) by using not one, but ten different self-report scales to measure these
variables. This enabled the assessment of the extent to which the effects of job factors were
stable across alternative outcomes of the dependent constructs. On the other hand, self-
report measures do, however, have weaknesses or shortfalls, including the potential for
error variance associated with the instruments themselves, respondent personality and
motivational variables and response biases (social desirability)(Spector & Brannick, 1995;
Schaubboeck and Merritt, 2003). Furthermore, whilst there is evidence suggesting that
some of the measures used are not particularly susceptible to social desirability and other
response biases (McCrae, 1990; Parker and Sprigg, 1999), such evidence is not available
for most of the chosen measures such as self-efficacy. The current research was adopted the
pattern of Bradley, (2004) by the use of self-report measures to assess both predictor and
criterion variables but the results are similar to certain extent. Extensive use of self-report
measures of both predictor and criterion variables also raises concerns that the research
may have fallen into the insignificance trap (Kasl, 1978), that is, over-interpreting observed
relationships between constructs that overlap theoretically and empirically aspects of
research. Notwithstanding reservations over the reliability and validity of self-report study,
other sources of data were properly used, because of a conviction that only individual
employees can accurately assess their work environment, and their own feelings of control,
support and strain. Several steps were taken to minimize the weaknesses of the self-report
method through using (a) appropriately-worded instructions that emphasized the need for
honesty and the confidentiality of responses, (b) brief lectures in training centers, and (c)
teaching over clarity and understanding of questionnaires.

202
6.2 Review of Main Findings In consideration of aforementioned strengths and limitations of current study, the main
findings of research are reported summarized below.
(1) Total job demands and total control over these demands were found to be highly
predictive of WAPDA employees’ ratings of the stressfulness of their jobs. The
effects held across Studies 1 and 2, were shown to be strong cross-sectional to
predict job factors and outcomes of strain. The interaction of demands and control
on stressors was the most significant of the interaction effects investigated in both
studies. The significance of this interaction was, however, domain-specific, being
most evident in the workload and conflict domain. Both job demands and job
control predicted strain, thereby confirming Karasek’s major affirmation that strain
is jointly determined by these inequality of two job factors. . The effects of social
support were similar to, but stronger than, those associated with control.
(2) Significant support was obtained for the hypothesized job factors interactive effects
on strain. A major consideration to this was the apparently robust effect of the job
demands + control interaction in WAPDA’s employees
(3) Social support from supervisors also predicted strongly to job stressors, whilst
colleague support was slightly less reliably associated with this outcomes of strain.
Interestingly, all domains of demands and control were effectively associated with
outcomes except employees’ demands and employees’ control. Social support also
predicted strain, consistency throughout the two studies. The strength of several of
the main effects of the job factors varied slightly with the specific outcome of strain:
for example, control and supervisory support were highly predictive of job
satisfaction, whilst control and supervisory support was slightly less predictive of
job anxiety and somatic symptoms. .
(4) Findings were similar to expectations; demands and control were found to have
additive effects on the outcomes better than main effects. Total demands (including
sub-sets) was stronger and positively related to all of these outcomes of strain and
negatively related to controlling factors. Control was a stronger and more consistent
predictor (but slightly less than job demands) of strain outcomes.
(5) Personality variables and activity participation are two additive relationships –
demands and supervisor support on three outcomes of job strain, demands and

203
control on personality variables and activity participation -emerged with good
consistency.
(6) Karasek & Theorell (1990) maintained that exposure to job conditions of high
demands and low control lead, over time, to increases in accumulated anxiety,
whilst prolonged exposure to job environment of high demands and high control
lead to increases in personal mastery and neuroticism. A buffering effect of control
and social support on the relationship between demands and changes in mastery was
also observed. Three variables of activity participation –job performance, job
participation, and Job consideration – were related to similar measures of Karasek’s
job factors and to several outcomes of strain.
(7) Total demands (including sub-sets) was stronger and negatively related to all of
three outcomes of activity participation variables, whereas, control and social
support were highly positively related to these factors. Control was a stronger and
more consistent predictor (but slightly less than job demands and social support) of
activity participation outcomes.
However, the activity participation variables were highly inter-correlated, with most of the
variance in the criteria being explained i.e. (a) first, job performance, (b) second, job
participation, and (c) third, job consideration. Finally, it is concluded that additive effects
were stronger predictor of all outcomes than main effect alone.
6.3 Theoretical Implications of Current study Karasek’s (1979; Karasek and Theorell 1990) central idea - that employees strain is jointly
determined by the conditions of high job demands and low job control over work
environment – was supported by this study. All previous researches (particularly, Bradley,
2004) over job demands, job control and support model have drawn a similar
recommendation. In light of Study 1 and Study 2, the main implications are as follows:
(1) The confirmation of these main and additive job strain hypothesis in the
present context are noteworthy, because, given research included several
features which have been associated with relatively stronger job factor-related
effects.
(2) As de Jonge and Kompier (1997) reported interestingly, because of all the
discrepancies and criticisms, “the core structure of the model still holds”.
Therefore, the significant amount of outcomes were of the use of a sample

204
that (a) was drawn from a single occupation, (b) included all middle order
employees only, and (c) included a majority of males.
(3) The high correlation between corresponding pairs of demands and control
variables in the current research, and the use of relatively multivariate
statistical tests, are additional reasons for attaching importance to this major
finding. Also consistent with Karasek’s ideas, social support was shown to
have main and additive effects on immediate and remote outcomes strain.
These effects were, however, not only consistent but also as strong as those
associated with job demands or job control.
(4) Karasek’ did not make a distinguished differentiation between effects
associated with support from supervisors and those associated with support
from colleagues. Like Bradley, (2004) the current research suggests that these
two sources of support should be clearly distinguished in Karasek’s models.
Not only were these two variables empirically separate, but they also had
systematically different relationships with many of immediate and remote
strain outcomes. In contrast to Karasek and Bradley, the fact that a significant
proportion of the variance in the strain outcomes was explained by additive
effects of three job factors better than main effect.
(5) There is appropriate to suggest the expansion of the models to include only
essential predictor variables to finalize the research. Karasek and Theorell
(1990) have briefly discussed the potential strain-inducing role of physical
work environmental stressors and job insecurity. Thus the current research
was included two additional stressors as low reward structure and promotion
policies. Job insecurity has not been studied because of non-significant
outcomes and covariance.
(6) The models could usefully be extended to include these variables through
cross-sectional and longitudinal study. Given that a clear aim of Karasek’s
research work is to provide insights that can be used for job re-design or
appropriate job description and job specification.
(7) Modern theoretical propositions regarding the work environment under which
rewards such as increased recognition and remuneration buffer the adverse
impact of high strain jobs would be worthy of advanced research. This finding
makes sense in the light of the larger proportion of job strain outcomes than

205
stressors explained by the job factors, but the philosophy that (a) strain is
effected by a accumulated range of job factors than is stressors, (b) stressors is
a more immediate predictor of the job factors than is strain, and (c) many of
these other influences on strain may buffer the effects the relationship of
demands.
(8) The conclusion to be drawn is that Karasek’s models should be revised so as
to propose that the job factors have linear (main and additive) effects only, so
that model can be studied and concluded with least efforts.
(9) After T1 & T2 study, it is argued that Karasek’s models has been extended to
include organizational antecedents of demands, perceived control, social
support (supervisory support + colleagues support), rewards and recognition,
promotional policies and managerial policies. Classifications of such
antecedent job factors would have clear implications for the development in
relation to organizational influences upon the job factors seems valuable, as is
further testing of the current activity participation hypotheses using
instruments that have conditions for work environment and job performance.
(10) Finally, given the limitations in cross-sectional research, the current findings
stronger support for Karasek’s dynamic demands-control-support model and
person-environment model. Whilst reliable demands + control + social
support additive effects were found in both studies and there was significant
evidence of additive effects of three job factors on changes in neuroticism and
in mastery.
(11) This model has not been tested empirical in the past, but an attempt was made
to clarify and test Karasek’s (1979; Karasek & Theorell, 1990) models of job
strain and activity participation by all aspects, and to suggest ways
theoretically in which these models can be productively extended and can be
used as universal model.
• Actually, it is a simple model which can help to demonstrate clearly the
following several important issues relevant for work environment
(Bradley, 2004):
• that the social organizational characteristics of work, and not just
physical hazards, lead to strain outcomes;

206
• that stress-related consequences are related to the organization work
activity and not just its demands;
• that work environment affects stress-related risks, not just person-based
characteristics;
• that the possibility of both “positive stress” and “negative stress” can be
explained in terms of combinations of interaction of job demands and its
control; and
• that can provide the simple model - with basic reliability and validity - to
begin discussions on subjective stress response for a common worker,
clerical staff and other employees for whom this is a sensitive topic.
6.4 Practical Implications of Current Study
Most previous stress theories were developed to express reactions to “predictable” acute
work environment stressors in situations threatening biological continued existence
(Cannon 1935; Selye 1936). However, the Demand/Control model was developed for work
environments where “stressors” are chronic, and are the product of complicated human
organizational decision making. Here, the controllability of the stressors is essential, and
becomes more essential as we develop ever more complex and integrated organizations,
with ever more complex limitations on individual disposition (personality traits). The
Demand/Control model (Karasek 1976; Karasek 1979; Karasek and Theorell 1990), which
is discussed in T1 & T2 study, is based on psychosocial characteristics of work
environment of WAPDA, provided the following main practical implications:
(1) This study focused on more specific operationalizations (i.e., of job demands in
terms of perceived demands, and physical demands; of decision latitude in terms
of skill discretion and decision authority; and of occupational rewards in terms of
salary and esteem) provided insight into the specific types of demands and
resources that may be particularly important for significant outcomes of
WAPDA’s employees.
(2) More specifically, the present study demonstrated that emotional demands,
decision authority, and esteem are especially important predictors of job strain.
Changing these job characteristics through job redesign would seem to be an

207
effective tool for enhancing employees’ performance and reduce turnover
intention, dissatisfaction, and tension.
(3) Specific interventions are likely to involve combinations of changing job
demands, enhancing control, and developing social support, depending upon the
causal role identified for each of these factors. For jobs to possess optimum levels
of demands, control and support, special measures must be taken at top
managerial and supervisory levels to overcome the work problems.
(4) The role of activity participation (significant effects in Study I & II) have the
authority to allocate work environment clearly and equitably, ensure the jobs are
designed in accord with ergonomic principles, develop and maintain efficient
internal systems, encourage the two-way flow of information consistency, and
build effective team work.
(5) This empirical study provides considerable evidence that such organizational
interventions (to improve job demands) can have lasting positive effects on
worker strain, although such effects are by no means inevitable.
(6) The efficiency of employees is likely to depend upon the extent to which
management is genuinely supportive the organizational systems and culture is
matching with such interventions (Appels, 1990, and Bandura's, 1977)).
(7) Karasek & Theorell (1990) reported that organizational interventions that
programs most likely to be successful in which workers played key roles in work
restructuring and work reorganizations.
(8) Findings of additive effects for the job factors suggests that measures to reduce
strain and enhance active participation require attention be paid to all factors from
where an effect was obtained, whereas a finding that the demands-strain effects
are buffered by either control or supervisory support or colleagues support
suggests that interventions can target just the latter three factors, without
modifying job demands.
(9) In the current research, some reliable interaction effects on strain or activity-
participation were observed. Furthermore, control encompasses the effect of
social support and enables the worker to cope over work environment. In spite of
this general proposition, it could be argued that priority should be placed on
interventions that target enhanced worker control (through healthy training
programs based on need assessment), on the grounds that (a) the current research

208
demonstrated stronger and more consistent effects on activity-participation for
control (including the effects of social support) than for the other two job factors,
and (b) control-enhancement is less likely than demands-reduction to impact
negatively on performance of workers.
(10) Social support can be enhanced to job control by providing greater recognition of
achievements, increasing opportunities to reduce tensions at work, and building a
culture in which staff and supervisors are valued and co-operative. A power of
control can be enhanced by decentralizing authority and responsibility within
organizations to enrich jobs, providing information, and involving employees in
decision-making processes which are closely relevant to them.
(11) It is advisable for policy makers to develop specific strategies to create the
conditions for ergonomics work environment so that job demands may be
manipulated by re-distributing workload in consideration of labor’s skills,
clarifying work roles, redesigning the work schedule and streamlining working
systems.
(12) Findings from current research suggest control must be classified into (a) personal
skill and ability to manipulate, (b) colleagues support in work activity, and (c)
supervisory support to exercise power and assistance in carrying out work
activity. Most of the researchers suggest that constructive and career building
interventions in work environment involving different combinations of the three
job factors may be required to effect positive changes in accumulated strain and
activity outcomes.
(13) To the extent that both outcomes are required, the preferred strategy may be to
focus on salary structure and promotional policies (without risking changes, in
either direction, in job demands) because this job factor is likely to impact
favorably and highly on all outcomes.
(14) Research suggested that individual employee in similar work environment reports
widely different levels of strain outcomes. The personality variables of
neuroticism and mastery were shown to be highly correlated with self-reported
strain, but, in actual sense each individual has separate distinct characteristics or
traits. To overcome such critical issues, most of Karasek’s (1990) and Bradley
(2004) findings suggest that job strain is at least in part an outcome of the
dispositions, and cognitive or coping process, of individual workers but

209
significantly associated with work environment.
(15) The task of maintaining levels of job strain within manageable limits therefore
require attention is paid not only to work environment, but also decide the
essentials and non-essentials intervention associated with various jobs. Therefore,
essential stress management interventions are thus likely to include integrated
packages of all employees to achieve the desired objectives.
(16) Many researchers of DCSM distinguish two categories of interventions aimed at
introducing job stress, namely, those that are individual-oriented (personality
variables) and those that are organization-oriented. The former category includes
personal counseling, training need assessment, job training programs, healthy
training programs, cognitive-behavioral therapy, and physical health enhancement
through diet and exercise. Research indicated that such programs typically result
in lasting long time period gains in worker well-being (Burke, 1993; Giga et al.,
2003).
(17) The dynamic version of Karasek & Theorell (1990) model integrates person-
based and environmental job factors by building two combined hypotheses on the
original strain and learning mechanisms: (a) that stress inhibits learning process;
and (b) that learning, in the long term, can inhibit stress. These high-strain levels
may be the result of long-lasting psychological strain accumulated over time-and
reflected in person-based measures. The second hypothesis is that new learning
may lead to feelings of mastery or confidence-a person-based measure. These
feelings of mastery, in turn, can lead to reduced perceptions of events as stressful
and increased controlling process.
(18) The environmental job factors, over the long term period, partly determine
personality, and later, environmental effects are moderated by these previously
developed personality orientations. This broad model (1990) could incorporate
the following, more specific measures of personal response: feelings of mastery,
trait anxiety, and trait anger, vital exhaustion, burnout, cumulative life-stressor
implications, and possibly Type A behavior components.
(19) Moreover, it was shown that these job characteristics influenced the state of
employee’s stress. So work-related interventions aimed at decreasing job
demands and increasing job control and/or occupational rewards may indeed
improve employee well-being in long run period.

210
6.5 Recommendations for WAPDA Management Focus of this study is on the following points, which are of great significance and are
helpful to researchers and managers in future in energy sector (power wing of WAPDA) of
Pakistan.
1. One of the greatest sources of employee job stress does not know – not knowing
about stressors taking place in the commercial organization and not knowing if they
are doing a good job. Our study is communicating clearly (root causes and amount
of stressors) to managers of human resource department in these areas not only
reduces employee stress, but also helps them do a far better job.
2. The findings from this research i.e. employees issues, interpersonal conflicts and
conflicts with managerial policies, are of greater importance for the policy makers
of WAPDA involved in stress management as it is based on facts and figures
regarding the past policies of the organization and at the same time focus on present
and future performance of employees.
3. This research study remained focused on individual employees in understanding the
factors/stressors that influence whether someone working very hard feeling is
stressed out, or whether they are feeling motivated, excited and committed or free of
any organizational job stress. Our research outcomes (T1 and T2) reported clearly
that most of the employees are feeling significant amount of stress due to
promotional policies and low salaries structure, poor training programs, low fringe
benefits as compare to other commercial organizations of Pakistan like Oil & Gas
Development Company and Atomic Energy Commission of Pakistan.
4. Minimizing job stress, through the study of job redesign in light of variety of intra-
organizational stressors (qualitative demands, employees’ demands and conflicts
demands), giving employees control and power to make job-related decisions, the
flexibility to organize their work in the way they find optimal and the authority to
make improvements on how their job is done effectively.
5. This study enables managers (of WAPDA) to understand the sources of job
dissatisfaction (see six Model & Tables A to D) and make decisions how to improve
the employee morale, performance and job description in consideration of our
analysis of Demand Control Support Model.

211
6. These studies (T1 & T2) communicate clearly the significant effect of social
support on immediate and remote outcomes of strain in the work environment of
WAPDA. Supervisors can know how to provide guidance; support and to organize
the level of job demands, on the worker’s decision- making latitude, and on the
quality of social support available from management and co-workers.
7. Managers with poor management skills or little knowledge of job stressors or their
poor relationship with each other and subordinates are a tremendous source of stress
and can’t help employees deal with stressful times. Therefore our study
communicates clearly the relative amount of each stressor and its effects on
immediate and remote outcomes of strain.
8. This study’s reports (four subscales of each job demands, control and stress; two
subscale of social support) give recommendations to organization if the time and
financial resources you invest in restructuring the recruitment policies (development
of Human Resource Department), promotional policies, salaries structures, fringe
benefits (in consideration of real wages) and training employees will pay huge
dividends in reducing employees’ job stress, job dissatisfaction, increasing
productivity and minimizing turnover of competent and productive employees.
Study also reports that training programs most likely to be successful in which
workers played key roles in work restructuring and work reorganization.
9. The role of WAPDA’s activity participation have the authority to allocate work
environment clearly and equitably, ensure the jobs are designed in accord with
ergonomic principles, develop and maintain efficient internal systems, encourage
the two-way flow of information consistency, and build effective team work.
10. Finally, it is suggested that re-structuring and other necessary reforms at WAPDA
must be designed to boost efficiency, foster good corporate governance, cut off
costs, and make these entities truly commercially viable enterprises. Because the
operating costs and line losses of DISCOS are too high and it was necessary to
undertake a comprehensive re-structuring program and split DISCOS into smaller
companies and privatize them.

212
6.6 Recommendations for Future Researches The findings of the present study reveal several avenues for future empirical research.
Several suggestions have already been given in the discussion of theoretical and practical
implications. These suggestions included: more multiphase studies to determine the specific
causal lags over which particular job characteristics influence particular outcome variables,
research in other occupational groups to determine whether the results are generalizable to
other occupations, the inclusion of specific job control in work environment. An attempt
was made to clarify and test Karasek’s (1979; Karasek & Theorell, 1990) models of job
strain and work environment, and to suggest ways in which these models can be
productively extended and reform to achieve the general acceptability. Measures were
taken not only of Karasek’s core job strain variables, but also for personality, social support
and activity participation variables. Based on the findings of T1 & T2 study, some
additional recommendations can be made for future research.
First, in terms of research methods, future investigations should include multiple measures
-both subjective and objective - of the job factors and outcome variables. The current
research has demonstrated the value of using significant others’ reports of key variables,
and this under-used resource could be put to greater use in the future to make the job more
effective.
Second, future research should include studies investigating the combine impact of the job
factors on job strain over time, as well as studies assessing the immediate, or
contemporaneous, impact of the job environment (see, Amick et al., 2002).
Third, the area for future research involves the differential effects of specific domains of
demands and control on job outcomes: for example, a model that specify current effects of
workload control on stress, anxiety and somatic complaints, and the current effects of
employees control on job satisfaction, motivation and activity participation.
Fourth, emotional demands seem to be an important job characteristic for predicting
employee job strain, especially when combined with certain job resources (e.g., recognition,
authority). The increasing size of the human service sector implies that these kinds of job
demands should be of increasing importance in future research. As such, extending the DCS
Model to include emotional (psychological) demands may improve their applicability to a
growing segment of the working population, namely human service professionals. The

213
inclusion of emotional (psychological) demands in the new version of the JCQ (job content
questionnaires) and in comprehensive scale of Bradley (2004) show that the DC Model has
taken notice of these changes (Karasek, 2005). However, this version of the JCQ is still under
construction and waits testing in larger samples, including different types of work
environment. In this respect, it might also be worthwhile to further investigate the role of
emotional resources, such as emotion control (e.g., Zapf et al., 1999; Bradley, 2004).
Fifth, the demands-stress buffering effects of job resources other than control and social
support should also be investigated through a specific simple Tables and Model. Future
studies using blue-collar workers should include assessments of physical demands, and
demands associated with shift-work, remuneration, job insecurity and personality traits.
Therefore, the main, additive and buffering effects of job rewards, workload and job
insecurity are also worthy of investigation.
Sixth, organizational essential and non-essential variables that shape Karasek’s job factors
need to be identified clearly. Activity participation variables are such organizational
antecedent, and these variables are worthy of further study using instruments that are high
in construct and divergent validity. Future research should include models that are
expanded to organizational variables with activity participation as antecedents of the job
factors. Supervisory support could be included in one sub-domain of activity participation
variables. Such an expanded predictor set could include organizational sector (Soderfeldt et
al., 1996) and complexity (Tummers et al., 2001).
Finally, future research could test another integrated model for demand-control-reward
model including the possibility of splitting up demands, control, and rewards as job factors.
However, the theoretical rationale for such a model should be systematically constructed. A
notable example is the recently proposed the Demands-control Model and the Effort-
Reward-Imbalance Model (DCER) (de Jonge & Dormann, 2003), which attempts to
integrate DCER Models into a single framework, building on common principles with
respect to psychological compensation mechanisms and the balancing of challenging
demands. In short, the DCER Model proposes that the strongest interactive relationships
between job demands and job resources should be observed when all constructs are based
on qualitatively identical dimensions, and thus assumes specific relationships between
particular types of demands, resources and outcomes.

214
REFERENCES
Agho, A. O., Mueller, C. W. (1993). Determinants of employee’s job satisfaction:
Human Relations, 46, 1007-1027.
Alterman, Shekelle, R. B., Vernon, S. W., & Burau, (1994). Psychological demands,
decision latitude, job strain, and coronary heart disease in the Western Electric
Study. American Journal of Epidemiology, 140, 620-627.
Amick, B., & Celentano, D. (1991). Structural determinants of the psychosocial work
environment: Introducing technology in the work stress framework. Ergonomics
principles, 34, 625-646.
Anderson, J., & Gerbing, D. (1988). Structural equation modeling: A review and
recommended two-step approach. Psychological Bulletin, 103, 411-423.
Andries, Kompier, & Smulders, (1996). Topic-Do you think that your health or safety is at
risk because of your work? A European study on psychological and physical work
demands. Work and Stress, 10, 104-118.
Astrand, Hanson, & Isacsson, (1989). Job demands, job decision latitude, job supports, and
social network factors as predictors of mortality in a Swedish paper company.
British Journal of Industrial Medicine, 46, 334-340.
Averill R. (1973). Personal control over aversive stimuli and its relationship to stress.
Psychological Bulletin, 80, 286-303.
Bailis, Segall, A., Mahon, M. J., Chipperfield, J. G., & Dunn (2001). Perceived control in
relation to Socio-economic and behavioral resources for health. Social Sciences and
Medicine, 52, 1661-1676.
Baker, D. B. (1985). The study of stress at work environment. American Review of Public
Health, 6, 367-381.
Bandura, A. (1997). Self-efficacy: The exercise of personal control. New York: Freeman.
Barnett & Brennan, R. T. (1995). The relationship between job experiences and
psychological distress: Journal of Organizational Behavior, 16, 259-276.
Barnowe, J. T. (1975). Leadership and performance outcomes in an organization: The
supervisor of scientists as a source of assistance. Organizational Behavior and Human
Performance, 14, 264-280.

215
Beehr, T. A. (1985). The role of social support in coping with stress. Human stress and
cognition in organizations: An integrated perspective (p. 375-398). New York: Wiley.
Beehr, T. A., Glaser, Canali, K. G., & Wallwey (2001). Back to basics: Re-examination of
demand-Control Theory of occupational stress. Work and Stress, 15, 115-130.
Beehr, T. A., & McGrath (1992). Social supports, occupational stress and job anxiety. Job
anxiety, job stress and coping, 5, 7-19
Beehr, T. A., & Newman, (1978). Job stress and organizational effectiveness: A facet
analysis & Model. Personnel Psychology, 31, 665-699.
Beehr, T. A., & O’Hara (1987). Methodological designs for the evaluation of occupational
stress interventions. Research methods in stress and health psychology (pp. 79-112).
Chichester: Wiley.
Bensihek, L. A., & Lopez, (1997). Critical evaluation of hardiness theory: Perceptions of life
events, and neuroticism. Work and Stress, 11, 33-45.
Billings, A. G., & Moos (1982). Social support and functioning among community and
clinical groups: A model. Journal of Behavioral Medicine, 5, 295-311.
Bishop, G. D., Enkelman, Tong, E. M., Why, Y. P., Diong, S. M., Ang, J., & Khader, M.
(2003). Job demands, decisions control, and cardiovascular diseases. Journal of
Occupational Health Psychology, 8, 146-156.
Bohle, P. (1997). Topic-Does hardiness predict adaptation to shift-work? Work and Stress,
11, 369-376.
Bolger & Zuckerman (1995). A framework for studying personality in the stress process.
Journal of Personality and Social Psychology, 69, 890-902.
Borg, V., & Kristensen, T. S. (1999). Psychosocial work environment and mental health
among salespeople. Work and Job Stress, 13, 132-143.
Bosma, H., Marmot, Hemingway, H., Nicholson, Brunner & Stansfeld, S. A. (1997). Low
control and risk of coronary heart disease in Whitehall II (prospective cohort) study.
British Journal, 314, 558-565.
Bourbonnais, Brisson, C., Moisan & Vezina, M. (1996). Job strain and psychological
stress in white collar workers. Scandinavian Journal of Work Environmental Health,
22, 193-145.

216
Boumans, N., & Landeweerd. (1992). The role of social support and coping behaviour in
nursing work: main or buffering effect? Stress and Work, 6, 191-202.
Bradley, G. (2004). A Test of Demands-Control- Support Model. Job Strain and healthy
work. Journal of Applied Psychology: Griffith University, Australia.
Breaugh, J. A. (1985). The measurement of work autonomy. Human Relations, 38, 551-570.
Brenner, S-O., & Bartell, R. (1984). The Employees stress process: A cross-cultural analysis.
Journal of Occupational Behavior, 5, 183-195.
Brief, A., Burke, M. J., George, J. M., Robinson & Webster, J. (1988). Should negative
affectivity in the study of job stress? Journal of Applied Psychology, 73, 193-198.
Briner, R. (1997). Organizational risk factors for stress research and job stress interventions.
The Psychologist, 50-51.
Brissie, Hoover-Demsey, & Bassler (1988). Individual, situational contributors to employees
burnout. Journal of Educational Research, 82, 106-112.
Brisson, Blanchette, Guimont, Moisan & Vezina, M. (1998). Reliability and validity of the
French version of the 18-item Karasek Job Content Questionnaire. Work and Stress,
12, 322-336.
Broadbent, D. (1985). The clinical impact of job re-design. British Journal of Clinical
Psychology, 24, 33-44.
Brogmus, G. (1996). The rise and fall of stress in the USA. Work and Stress,10, 24-35.
Bromet, J., Dew, A., Parkinson, D. K., & Schulberg, (1988). Predictive effects of
occupational stress on the mental health of a male workforce. Journal of
Organizational Behavior, 9, 1-13.
Brouwers, A., Evers, W & Tomic, W. (2001). Self-efficacy in eliciting social support and
burnout among organizational employees. Journal of Applied Social Psychology,
31,1474-1491.
Bruce, & Cacioppe, R. (1989). A survey of why Employees resigned from government
organizations in Western Australia. Australian Journal, 33, 68-82.
Burger, J. (1989). A negative reaction to increases in perceived personal control. Journal of
Personality and Social Psychology, 56, 246-256.
Burke, R. J. (1993). Organizational-level interventions to reduce occupational stressors.
Work and Stress, 7, 77-87.
217
Burke, J., & Greenglass, E. (1995). A longitudinal study of psychological burnout in
employees. Human Relations, 48, 187-202.
Butcher, Sparks & O’Callaghan, F. (2001). Evaluative and relational influences on service
quality. Journal of Service Industry Management, 12, 310-327.
Buunk, de Jonge, J., Ybema, & de Wolff, (1998). Psychosocial aspects of occupational
stress. Handbook of work and organizational psychology. Volume 2 Work
Psychology (pp. 145-182).
Buunk & Peeters, (1994). Stress at work, social support and companionship: Towards an
event-contingent recording approach. Work and Stress, 8, 177-190.
Byrne, B. M. (1993). Burnout Inventory: Testing for factorial validity and invariance across
the employees. Journal of Occupational and Organizational Psychology, 66, 197-212.
Caldwell, Pearson & Chin, (1987). Stress-moderating effects: Social support in the context
of gender and locus of control. Personality and Social Psychology, 13, 5-17.
Callan, V. (1993). Individual and organizational strategies for coping with organizational
change. Work and Stress, 7, 63-75.
Calnan, M., Wainwright, D., & Almond, S. (2000). Job strain, effort-reward imbalance and
mental stress: A Study of Work and Stress, 14, 297-311.
Capel, S. (1991). A longitudinal study of burnout in employees. British Journal of
Psychology, 61, 36-45.
Caplan, R., Cobb, S., & French, J., Van Harrison, R., & Pinneau, S., (1975). Job demands
and worker health. Washington D. C.: Institute for Social Research,
University of Michigan/ National Institute of Occupational Safety and Health.
Carayon, P. (1992). A longitudinal study of job re-design and worker strain: Stress and well-
being at work: Assessments and interventions for occupational mental health (pp.19-
32). Washington, DC: American Psychological Association.
Carayon, P. (1995). Chronic effects of job control, supervisor social support, and work
pressure on office worker stress. Washington, DC: American Psychological
Association.
Carayon, P., & Zijlstra, F. (1999). Relationship between job control, work pressure and job
strain: Studies in the USA and in Netherlands. Work and Stress, 13, 32-48.

218
Carrere, S., Evans, G. Palsane, & Rivas, M. (1991). Job strain and occupational stress among
urban public transit operators. Journal of Occupational Psychology, 64, 305-316.
Cassar & Tattersall, . (1998). Occupational stress and negative affectivity in Maltese nurses:
Testing moderating effects. Work environment and Stress, 12, 85-94.
Center, D. B., & Callaway, J. M. (1999). Self-reported job stress and personality in
Employees with emotional. Behavioral Disorders, 25, 41-51.
Chapman, Mandryk, Frommer, Edye & Ferguson, D. (1990) Chronic perceived work stress
and blood pressure among Australian government employees. Scandinavian Journal
of Work Environmental Health, 16, 258-269.
Chay, Y. (1993). Social support, individual differences and well-being: A study of small
business entrepreneurs and employees. Journal of Occupational and Organizational
Psychology, 66, 285-302.
Chen & Spector, P. E. (1991). Negative affectivity as the underlying cause of correlations
between stressors and strains. Journal of Applied Psychology, 76, 398-407.
Chen, Spector, & Jex, S. (1995). Effects of manipulated job stressors and job attitudes on
perceived job condition: A simulation. Washington, DC: American Psychological
Association.
Cheng, Y., Kawachi, Coakley, Schwartz & Colditz, (2000). Association between
psychosocial work characteristics and health functioning in American women: British
Medical Journal, 320, 1432-1436.
Chwalisz, Altmaier & Russell D.W. (1992). Causal attributions, self-efficacy cognitions, and
coping with stress. Journal of Social and Clinical Psychology, 11, 377- 400.
Cohen, S., Schwartz, J. E., Bromet, E. J., & Parkinson, D. K. (1991). Mental health, stress,
And poor health behaviors in two community samples. Preventitive Medicine, 20,
306-315.
Cohen, S., & Wills, T. A. (1985). Stress, social support, and the buffering hypothesis.
Psychological Bulletin, 98, 310-357.
Cole, M. (1989). The politics of stress. In M. Cole, & S. Walker (Eds.), Employees
and stress (pp.161-170). Milton Keynes: Open University Press.
Cook, J. D., Hepworth, S. J., Warr, T. D., & Warr, P. B. (1981). The experience of work:
London Academic Press.

219
Cooper, C. L. (1998). Theories of organizational stress. Oxford: Oxford University Press.
Cooper, C. L., & Bramwell, R. S. (1992). A comparative analysis of occupational stress in
managerial and shopfloor workers in the brewing industry: Mental health, job
satisfaction and sickness. Work and Stress, 6, 127-138.
Cooper, C. L., Dewe, P. J., & O’Driscoll, M. P. (2001). Organizational stress: A review and
critique of theory, research, and applications. Thousand Oaks, CA: Sage publications.
Cooper, C. L., Watts, J., Baglioni, A. J., & Kelly, M. (1988). Occupational stress amongst
general practice dentists. Journal of Occupational Psychology, 61, 163-174.
Cortina, J. M. (1993). Interaction, nonlinearity, and multicollinearity: Implications for
Multiple regression. Journal of Management, 19, 915-922.
Cox, T. (1983). Stress (2nd edit.). London: MacMillan.
Cox, T., Boot, N., Cox, S., & Harrison, S. (1988). Stress in organizations: An organizational
perspective. Work and Stress, 2, 353-362.
Coyne, J. C., & Downey, G. (1991). Social factors and psychopathology: Stress, social
support, and coping processes. Annual Review of Psychology, 42, 401-425.
Cronbach, L. J. (1951). Coefficient alpha and the internal structure of tests. Psychometrika,
16, 297-334.
Cropley, M., & Purvis, L. J. M. (2003). Job strain and rumination about work issues during
leisure time: A diary study. European Journal of Work and Organizational
Psychology, 12, 195-207.
Crum, R. M., Muntaner, C., Eaton, W. W., & Anthony, J. C. (1995). Occupational stress and
The risk of alcohol abuse and dependence. Alcoholism: Clinical and Experimental
Research, 19, 647-655.
Cummins, R. (1989). Locus of control and social support: Clarifiers of the relationship
between sjob stress and job satisfaction, Journal of Applied Social Psychology, 19,
772-788.
Daniel, J., & Sarmany-Schuller, I. (2000). Burnout in Employees’s profession: Age, years of
practice and some disorders. Studia Psychologica, 42, 33-42..
Daniels, K., & Guppy, A. (1997). Stressors, locus of control, and social support as
consequences of affective psychological well-being. Journal of Occupational Health
Psychology, 2, 156-174.

220
Danna, K., & Griffin, R. W. (1999). Health and well-being in the workplace: A review and
synthesis of the literature. Journal of Management, 25, 357-384.
de Croon, M., Van Der Beek, A. J., Blonk, R. W. B., & Frings-Dresen, M. H. W. (2000). Job
stress and psychosomatic health complaints among truck drivers: A re-evaluation of
Karasek’s interactive job demands-control model. Stress Medicine, 16, 101-107.
de Jonge, J., Bosma, H., Peter, R., & Siegrist, J. (2000). Job strain, effort-reward imbalance
and employee well-being: A large-scale cross-sectional study. Social Sciences and
Medicine, 50, 1317-1327.
de Jonge, J., Dollard, M. F., Dormann, C., Le Blanc, P. M., & Houtman, I. L. D. (2000). The
demand-control model: Specific demands, specific control, and well-defined groups.
International Journal of Stress Management, 7, 269-287.
de Jonge, J., & Kompier, M. A. J. (1997). A critical examination of the demand-control-
support model from a work psychological perspective. International Journal of Stress
Management, 4, 235-258.
de Jonge, J., Mulder, M. J. G. P., & Nijhuis, F. J. N. (1999). The incorporation of different
demand concepts in the job demand-control model: Effects on health care
professionals. Social Science and Medicine, 48, 1149-1160.
de Jonge, J., Reuvers, M. M. E., Houtman, I. L. D., Bongers, P. M., & Kompier, M. A. J.
(2000). Linear and nonlinear relations between psychosocial job characteristics,
subjective outcomes, and sickness absence: Baseline results from SMASH. Journal of
Occupational Health Psychology, 5, 256-268.
de Jonge, J., & Schaufeli, W. (1998). Job characteristics and employee well-being: A test
of Warr’s Vitamin Model in health care workers using structural equation modeling.
Journal of Organizational Behavior, 19, 387-407.
Demerouti, E., Bakker, A., Nachreiner, F., & Schaufeli, W. B. (2001). The job demands-
resources model of burnout. Journal of Applied Psychology, 86, 499-512.
de Rijk, Le Blanc, P. M., Schaufeli, W., & de Jonge, J. (1998). Active coping and
need for control as moderators of the job demand-control model: Effects on burnout.
Journal of Occupational and Organizational Psychology, 71, 1-18.
Derogatis, L. R. (1977). Administration, scoring and procedures. Baltimore: John
Hopkins University Medical Organization.

221
Derogatis, L. R., & Coons, H. L. (1993). Self-report measures of stress. In L. Goldberger, &
S. Breznitz, Handbook of stress. New York: Free Press.
Dewe, P., Cox, T., & Ferguson, E. (1993). Individual strategies for coping with stress at
work: A review. Work and Stress, 7, 5-15.
Dignam, J., & West, S. (1988). Social support in the workplace: Tests of six theoretical
models. American Journal of Community Psychology, 16, 701-724.
Dollard, M.., & Winefield, A. (1995). Job anxiety, work demands, social support and
psychological stress in correctional officers. Anxiety, Stress and Coping, 8, 25-35.
Dollard, M., & Winefield, A. (1996). Managing occupational stress: A national and
international perspective. International Journal of Stress Management, 3, 69-83.
Dormann, Fay, D., Zapf., & Frese, M. (2002, July). Core self-evaluations and the
dispositional core of job satisfaction. International Congress of Applied Psychology,
Singapore.
Dreary, & Matthews, (1993). Personality traits are alive and well. The Psychologist, 6,
299-311.
Dunlap, W. P., & Kemery, E. R. (1988). Effects of predictor inter-correlations and
reliabilities on moderated multiple regression. Organizational Behavior, 41, 248-258.
Dwyer, D. J., & Ganster, D. C. (1991). The effects of job demands and control on employee
attendance and satisfaction. Journal of Organizational Behavior, 12, 595-608.
Edwards, J., Caplan, & van Harrison, R. (1998). Person-environment fit theory:
Conceptual foundations, empirical evidence, and directions for future research.:
Oxford University Press.
Edwards, J, & Cooper (1990). The person-environment fit model to stress: Recurring
problems and some suggested solutions. Journal of Org. Behavior, 11, 293-307.
Elovainio, M., Kivimaki, M., Steen, N., & Kaliomaki-Levanto, T. (2000). Organizational and
individual factors affecting job satisfaction. Journal of Occupational Health
Psychology, 5, 269-277.
Elsass, P., & Veiga, J. (1997). Job control and job strain: A test of three models. Journal
of Occupational Health Psychology, 2, 195-211.
Etzion, D. (1984). Effects of social support on the stress-burnout relationship.
Journal of Applied Psychology, 69, 615-622.

222
Evans, B., & Fischer, D. (1992). A hierarchical model of participatory decision-making,
Job autonomy and perceived job control. Human Relations, 45, 1169-1189.
Evans, M. (1985). A Monte Carlo study of the effects of correlated method variance in
moderated multiple regression analysis. Organizational Behavior and Human
Decision Processes, 36, 305-323.
Evans, & Johnson, D. (1980). The relationship of principals’ behavior and job
satisfaction and job-related stress. Journal of Instructional Psychology, 17, 11-18.
Eysenck, S. B. G., Eysenck, H. J., & Barrett, P. (1985). A revised version of the psychoticism
scale. Personality and Individual Differences, 6, 21-29.
Fenwick, & Tausig, M. (1994). The macro-economic context of job stress. Journal of Health
and Social Behavior, 35, 266-282.
Finney, J, Mitchell, R., Cronkite, R, & Moos, R. (1984). Methodological issues in estimating
main and interactive effects. Journal of Health and Social Behavior, 25, 85-98.
Fisher, S. (1996). Life stress, personal control, and the risk of disease. Handbook of stress,
medicine and health (pp.121-136). CRC Press: Boca Raton.
Fletcher,. (1988). The epidemiology of occupational stress. Causes, coping and consequences
of stress at work (p. 3-50). Chichester :Wiley.
Fletcher, B., & Jones, F. (1993). A refutation of Karasek’s demand model of occupational
stress with a range of dependent measures. Journal of Organizational Behavior, 14,
319-330.
Folkman, (1984). Personal control and stress and coping processes. Journal of Personality
and Social Psychology, 46, 839-852.
Fontana, D., & Abouserie (1993). Stress levels, gender and personality factors in employees.
British Journal of Human Psychology, 63, 261-270.
Fox, Dwyer, D., & Ganster (1993). Effects of stressful job demands and control
of physiological and attitudinal outcomes in a hospital setting. Academy of
Management Journal, 36, 289-318.
French, J., Caplan, R., & Harrison, V. (1982). The mechanisms of job stress and strain.
Chichester: Wiley.
Frese, M. (1989). Theoretical models of control and health. Job control and worker health:
Job control and health (pp. 107-128). Chichester: Wiley.

223
Frese & Zapf, D. (1988). Methodological issues in the study of work stress: Coping and
consequences of stress at work (pp. 375-411). Objective versus subjective
measurement of work stress and the question of longitudinal studies. Chichester:
Wiley.
Friedman, M., & Rosenman, R. H. (1974). Type A behavior pattern and your health.
American Journal of Political Science, 26, 797-833.New York.
Fried, Y. (1988). The future of physiological assessments in work situations. Causes, coping
and consequences of stress at work (pp. 343-373). Chichester : Wiley.
Friedrich, R. J. (1982). In defense of multiplicative terms in multiple regression equations.
American Journal of Political Science, 26, 797-833.
Furnham, A. (1992). Personality at work: The role of individual differences in the workplace.
London: Routledge.
Fusilier, M. R., Ganster, D, & Mayes, B. (1987). Effects of social support, role stress
and locus of control on health. Journal of Management, 13, 517-528.
Ganellen, R. J., & Blaney, P. H. (1984). Hardiness and social support as moderators of the
effects of life stress. Journal of Personality and Social Psychology, 47, 156-163.
Ganster, D., & Fusilier, M. (1989). Control in the workplace. International review of
industrial and organizational psychology Volume 5 (pp. 235-280). Chichester: Wiley.
Gerhart, B. (1987). How important are dispositional factors as determinants of job
satisfaction? Implications for job re-design. Journal of Applied Psychology, 72, 366-
373.
Giga, S. I., Noblet, Faragher, B., & Cooper, C. (2003). A review of research on
organizational stress management interventions. Australian Psychologist,
38, 158-164.
Glass, D., & Singer, E. (1972). Noise and social stressors. New York: Academic Press.
Goddard, Patton, W., & Creed. P. (2002). Predicting burnout in employment service
case managers: The importance and place of neuroticism. Stress and Anxiety
Research Conference, Melbourne.
Greenberger, D., Strasser, S., Cummings, & Dunham, R. (1989). The impact of personal
control on performance and satisfaction. Organizational Behavior, 43, 29-51.

224
Greenglass, E., Burke, R., & Konarski, R. (1997). The impact of social support on the
development of burnout in employees: Work and job Stress, 11, 267-278.
Greenlund, Liu, K., & Knox, S. (1995). Psychosocial work characteristics and
cardiovascular disease risk factors in young adults: The Cardia study. Social Science
and Medicine, 41, 717-723.
Greller, M., & Parsons, C. K (1992). Additive effects and beyond: Occupational stressors and
social buffers in a police organization. Stress and well-being at work: Interventions
for occupational mental health (pp. 33-47). Washington, DC: American
Psychological Association.
Griffith, J., & Cropley, M. (1999). An investigation of coping strategies associated
with job stress in employees. British Journal of Psychology, 69, 517-531.
Guglielmi, R.., & Tatrow, K. (1998). Occupational stress, burnout, and health in employees:
A theoretical analysis. Review of Educational Research, 68, 61-99.
Gunthert, K. C., & Armeli, S. (1998). The role of neuroticism in daily stress and coping.
Journal of Personality and Social Psychology, 77, 1087-1100.
Hair, J. F., Anderson, R. E., & Tatham (1995). Multivariate data analysis. Englewood Cliffs,
New Jersey: Prentice-Hall.
Hakanen, J., & Bakker, A. (2002). Testing a model of engagement and burnout among
employees. Paper presented at the Twenty-Fifth International Congress of Applied
Psychology, Singapore.
Halpin, G. (1985). Employees stress as related to locus of control. Journal of Experimental
Education, 53, 136-140.
Harris, C. A. (1999). The relationship between leadership styles and employees stress
in low socio-economic urban organizations as perceived by employees. Dissertation
Abstracts international, 60, 1911-A.
Hart, P. M. (1994). Employee’s quality of work life: Integrating work experiences,
Psychological distress and morale. Journal of Occupational and Organizational
Psychology, 67, 109-132
Hart, P. M., Wearing (1995). Police stress and well-being: Integrating personality, coping
and daily work experiences. Journal of Occupational and Organizational
Psychology, 68, 133-156.

225
Hasselhorn, H. M., Theorell, T., & Hammar, N. (2000). Expert rating of demand and
decision latitude shows a cardiovascular risk profile for white collar men.
International Journal of Behavioral Medicine.
Haynes, S. G., LaCroix, A., & Lippin, T. (1987). The effect of high demands and low control
on the health of employed women. Work stress: Health care systems in the workplace
(pp. 93-111). New York: Praeger.
Heinisch, D., & Jex, S. (1997). Negative affectivity and gender as moderators of the
relationship between work-related stressors and depressed mood at work. Work and
Stress, 11, 46-57.
Johnson, J. V., Ford, & D. E., Mead (1995). The psychosocial work environment of
physicians. Journal of Occupational and Environmental Medicine, 37, 1151-1159.
Johnson, J., & Stewart, W. (1993). Measuring work environment exposure over the life
course with a job-exposure. Scandinavian. Journal of Work Environment and
Health, 19, 21-28.
Jones, F., Bright, J. E. & Cooper, L. (1998). Modeling occupational stress and health: The
impact of the demand-control model on academic research and on workplace. Stress
Medicine, 14, 231-236.
Joreskog, K. G. (1998). Interaction and nonlinear modeling: Issues and approaches.
Interaction and nonlinear effects in structural equation modeling (pp.239-250). New
Jersey: Lawrence Erlbaum Associates.
Judge, T. A., Erez, A. (2000). Why negative affectivity (and self-deception) should be
included in job stress research: Journal of Organizational Behavior, 21, 100-111.
Judge, T. A., Durham, C. C., & Kluger, A. N. (1998). Dispositional effects on job and life
satisfaction: The role of core evaluations. Journal of Applied Psychology, 83, 17-34.
Kahn, R., Wolfe & Rosenthal, R. (1964). Studies in role conflict and role ambiguity. New
York: Wiley.
Kalimo, R., & Vuori, J. (1991). Work factors and health: The predictive role of pre-
employment experiences. Journal of Occupational Psychology, 64, 97-115
Karasek, R. (1979). Job demands, job decision latitude, and mental strain: Implications for
job re-design. Administrative Science Quarterly, 24, 285-308.

226
Karasek, R. (1981). Job socialization and job strain: The implications of two related
psychosocial mechanisms for job re-design. In B. Gardell, & G. Johansson,
Working life (pp. 75-94). Chichester: Wiley.
Karasek, R., Triantis, K., & Chaudhry, S. S. (1982). Co-worker and supervisor support as
moderators of associations between task characteristics and mental strain. Journal of
Organizational Behavior, 3, 181-200
Karasek, R. (1985). Job Content Questionnaire. Department of Industrial and Systems
Engineering, University of Los Angeles, California.
Karasek, R. (1989b). Control in the workplace and its health-related aspects. Job control and
worker health (pp.129-159). Chichester: Wiley.
Karasek, R. (1990). Lower health risk with increased job control among white collar
workers. Journal of Organizational Behavior, 11, 171-185.
Karasek, R. (1992). Stress prevention through work organization: A summary of 19
international case studies. Conditions of work digest: Preventing stress at work,
Volume 11(2). Geneva: Author.
Karasek, R. (1997). Demand & control model: A social, emotional, and physiological
approach to stress risk and active behavior development. Encyclopedia of
Occupational Health and Safety Volume II (4th Ed.). Geneva: International Labor
Office.
Karasek, R. Baker & Theorell, T. (1981). Job decision latitude, job demands, and
cardiovascular disease: A prospective study of Swedish men. American Journal of
Public Health, 71, 694-705.
Karasek, R. & Theorell T. (1990). Healthy work: Stress, productivity, and the reconstruction
Of working life. New York: Basic Books.
Karasek, R. (2000). Future suggestions for the development of the Job Content questionnaire.
International Journal of Behavioral Medicine, 7(Supplement 1), 4.
Kasl, S. (1978). Stress at work: Epidemiological contributions to the study of work stress.
New York: Wiley.
Kasl, S.. (1989). An epidemiological perspective on the role of control in health. In S. L.
Sauter, J. Hurrell, & C. Cooper (Eds.), Job control and worker health (pp.161-
189). Chichester: Wiley.

227
Koeske, G., & Kirk, S. (1995). Direct and buffering effects of internal locus of control
among health professionals. Journal of Social Service Research, 20, 1-28.
Kohn, M. & Organizationer, C. (1982). Job conditions and personality: A longitudinal
assessment of their reciprocal effects. Journal of Sociology, 87, 1257-1286.
Kompier, M. & Kristensen, T. (2001). Organizational work stress interventions in a
theoretical, methodological and practical context. Past, present and future (pp. 164-
190). London: Whurr Publishers.
Krause, N. (1985). Stress and psychological distress: The problem of response bias. Journal
of Human Stress, 10, 11-19.
Kristensen, T. (1995). The demand-control-support model: Methodological challenges for
future research. Stress Medicine, 11, 17-26.
Kushnir, T., & Melamed, S. (1991). Work-load, perceived control and psychological distress
Journal of Organizational Behavior, 12, 155-168.
Kyriacou, C., & Sutcliffe, J. (1979). A note on employees stress and locus of control. Journal
of Occupational Psychology, 52, 227-228.
Landsbergis, P. (1988). Occupational stress among health care employees: A test of the job
demands - control model. Journal of Organizational Behavior, 9, 217-239.
Landsbergis, P. A., & Schnall, P. (1992). The patterning of psychological attributes and
distress by job strain and social support in a sample of working men. Journal of
Behavioral Medicine, 15, 379-405.
Landy, F., & Guion, R. (1970). Development of scales for the measurement of job
motivation. Organizational Behavior and Human Performance, 5, 93-103.
Langer, E., & Rodin, J. (1976). The effects of choice and enhanced personal responsibility: A
field experiment in an institutional setting. Journal of Personality and Social
Psychology, 34, 191-198.
LaRocco, J., House, & French, J.R.P. (1980). Social support, occupational stress, and health.
Journal of Health and Social Behavior, 21, 202-218.
Lazarus, R. (1966). Psychological stress and coping processes. New York: McGraw-Hill.
Lazarus, R. (2000). Towards better research on stress and health. American Psychologist, 55,
665- 673.

228
Lefcourt, H., Martin, R., & Saleh, W. (1984). Locus of control and social support:
Interactive moderators of stress. Journal of Social Psychology, 47, 378-389.
Light, K., Turner, J., & Hinderliter, A. (1992). Job strain and blood pressure in healthy young
men and women. Hypertension, 20, 214-218.
Likert, R. (1967). The human organization. New York: McGraw-Hill.
Lim, V. (1997). Moderating effects of work-based support on the relationship between job
insecurity and its consequences. Work and Stress, 11, 251-266.
Loscocco, K., & Spitze, G. (1990). Working conditions, social support, and the well-being of
factory employees: Journal of Health and Social Behavior, 31, 313-327.
Lubinski, D., & Humphreys, L. (1990). Assessing spurious "Moderator Effects": Illustrated
substantively with the hypothesized relation between spatial and mathematical ability.
Psychological Bulletin, 107, 385-393.
Lucas, R., Diener, E., & Suh, E. (1996). Discriminant validity of well-being measures.
Journal of Personality and Social Psychology, 71, 616-628.
Mackay, C. & Cooper, C. (1987). Occupational stress and health: Some current issues. In
C. L. Cooper, & I. T. Robertson, International review of industrial and organizational
psychology (pp. 167-199). New York: Wiley.
Marcelissen, F., Winnubst, J., & De Wolff, C. (1988). Social support and occupational stress.
Social Science and Medicine, 26, 365-373.
Marino, K., & White, S. (1985). Departmental structure, locus of control, and job stress:
The effect of a moderator. Journal of Applied Psychology, 70, 782-784.
Marshall, N, Barnett, R., & Sayer, A. (1997). The changing workforce, job stress, and
psychological distress. Journal of Occupational Health Psychology, 2, 99-107.
Maslach, C. (1982). Burnout: The cost of caring. New Jersey: Prentice-Hall.
Maassen, G., & Bakker, A (2001). Stressor variables in path models. Sociological Methods
and Research, 30, 241-270.
Matteson, M., Ivancevich, J., & Smith, S. (1984). Relations of Type A behavior to
performance and satisfaction among sales personnel. Journal of Vocational Behavior,
25, 203-214.
McCrae, R. (1990). Controlling neuroticism in the measurement of stress. Stress Medicine,
6, 237-241.

229
McIntosh, N. (1990). Identification and investigation of indices of social support. Journal
of Organizational Behavior, 12, 201-217.
McLaney, M., & Hurrell, J. (1988). Control, stress and job satisfaction in Canadian nurses.
Work and Stress, 2, 217-224.
McNair, D., Lorr, & Droppleman, L. (1992). Edits manual for the Profile of Mood States.
San Diego: Educational and Industrial Testing Service.
Medsker, G., Williams, L, & Holahan, P. (1994). A review of current practices for evaluating
causal models in organizational behavior and human resource management. Journal
of Management, 20, 439-464.
Meijman, T., Ulenbelt, P., Lumens, M., & Herber, R. (1996). Behavioral determinants of
occupational exposure. Journal of Occupational Health Psychology, 1, 85-91.
Melamed, S., Kushnir, T., & Meir, E. (1991). Attenuating the impact of job demands:
Additive and interactive effects of perceived control and social support. Journal of
Vocational Behavior, 39, 40-53.
Mendelson, G. (1990). Occupational stress. Parts 1-3. Journal of Occupational Health and
Safety - Australia and New Zealand, 6, 175-197.
Michela, J., Lukaszewski, M., & Allegrante, J. (1995). Organizational climate and work
stress: A general framework applied to inner-city organization employees. Washington,
DC: American Psychological Association.
Milstein, M., Golaszewski, T., & Suny. (1985). Effects of organizationally based and
individually based stress management efforts in organization settings. 19, 389- 409.
Mitchell, R.., Billings, A., & Moos, R. (1982). Social support and well-being: Implications
for prevention programs. Journal of Primary Prevention, 3, 77-98.
Morrison, D., & Payne, R. (2001). Test of the demands, support-constraints framework in
predicting psychological stress amongst employees. Work and Stress, 15, 314-327.
Morrison, D., Payne, R., & Wall. T. (2001, June). A multi-level analysis of the Demands –
control and the demands-control-support models of stress in the workplace. Paper
presented at the Australian Industrial and Organizational Psychology Conference,
Sydney.
Motowidlo, S., Packard, J., & Manning, M. (1986). Its causes and consequences for job
performance. Journal of Applied Psychology, 71, 616-629.

230
Moyle, P., & Parkes, K. (1999). The effects of transition stress: A relocation study. Journal
Of Organizational Behavior, 20, 625-646.
Muntaner, C., & O’Campo, P. (1993). A critical appraisal of the demands/control model of
the psychosocial work environment. Social Science and Medicine, 36, 1509-1517.
Muntaner, C., & Schoenbach, C. (1994). Psychosocial work environments and health in U.S.
metropolitan areas: A test of the demand-control and demand-control-support models.
International Journal of Health Services, 24, 337-353.
Murphy, L. (1996). Stress management in work environment. American Journal of Health
Promotion, 11, 112-135.
Murphy, L., Hurrell, J., & Quick, J. (1992). Work and well-being: Where do we go
from here? In J. C. Quick, L. R. Murphy, & J. Hurrell, Stress and well-being
at work: Assessments and interventions for occupational mental health (pp.331-347).
Washington, DC: American Psychological Association.
Nelson, D., & Sutton, C. (1990). Chronic work stress and coping: A longitudinal study and
suggested new directions. Academy of Management Journal, 33, 859-869.
Netterstrom, B., Kristensen, T., Moller, L., Jensen, G., & Schnohr, P. (1998). Job strain, and
social status: A cross-sectional study of employed urban citizens. International Journal
of Behavioral Medicine, 5, 312-322.
Newton, T., & Keenan, A. (1990). The moderating effect of the type A behavior pattern and
locus of control upon the relationship between change in job demands and change in
psychological strain. Human Relations, 43, 1229-1255.
Niedhammer, I., Goldberg, M., Bugel, I, & Landre, M. (1998). Psychosocial work
environment and cardiovascular risk factors in an occupational cohort in France.
Journal of Epidemiological Community Health, 52, 93-100.
Nunnally, J. (1978). Psychometric theory. New York: McGraw-Hill.
Numerof, R., & Abrams, M. (1984). Sources of stress among nurses: An empirical
investigation. Journal of Human Stress, 10, 88-100.
O'Connor, P., & Clarke, V. (1990). Determinants of employees stress. Australian Journal,
34, 41-51.
Ormel, J., & Schaufeli, W. B. (1991). Stability and change in psychological distress and their relationship with self-esteem and locus of control: A dynamic equilibrium model. Journal of Personality and Social Psychology, 60, 288-299.

231
Orpen, C. (1982). Type A personality as a moderator of the effects of role conflict, role
ambiguity and role overload on individual strain. Journal of Human Stress, 8, 8-14.
Parker, D., & DeCotiis, T. (1983). Organizational determinants of stress. Organizational
Behavior and Human Performance, 32, 160-177.
Parker, S., & Sprigg, C. (1998). Minimizing strain and maximizing learning: The role of
job demands, job control and pro-active learning. Journal of Applied Psychology, 84,
925-939.
Parkes, K. (1989). Personal control in an occupational context. In A. Steptoe, & A. Appels,
Stress, personal control and health (pp. 21-47). Chichester: Wiley.
Parkes, K. (1991). Locus of control as a moderator: An explanation for additive versus
interactive findings in the demand-discretion model of work stress. British Journal of
Psychology, 82, 291-312.
Parkes, K, Mendham, C., & von Rabenau, C. (1994). Social support and the demand-
discretion model of job stress: Tests of additive and interactive effects in two samples.
Journal of Vocational Behavior, 44, 91-113.
Payne, R., & Fletcher, B. (1983). Job demands, support and constraints as predictors of
psychological strain among organizational employees. Journal of Vocational Behavior,
10, 213-229.
Pearlin, L., Menaghan, E., Lieberman, M., & Mullan, J. (1981). The stress process. Journal
of Health and Social Behavior, 22, 337-356.
Pearson, C. (1992). A workgroups: An evaluation at an industrial site. Human Relations, 45,
905-936.
Perrewe, P., & Anthony, W. (1990). Stress in a Steel Pipe Mills: The impact of job demands,
personal control, and employee age on somatic complaints. Journal of Social Behavior
and Personality, 5, 77-90.
Perrewe, P., & Ganster, D. (1989). The impact of job demands and behavioral control on
experienced job stress. Journal of Organizational Behavior, 10, 213-229.
Peter, R., Alfredsson, L, Siegrist, J., Theorell, T., & Westerholm, P. (2000). Improved
prediction of coronary heart disease risk by combining information on job strain and on
effort-reward imbalance at work. International Journal of Behavioral Medicine,
7(Supplement 1), 17.

232
Peterson, C., Seligman, M., & Vaillant, G. (1988). Pessimistic explanatory style is a risk
factor for physical illness: A thirty-five-year longitudinal study. Journal of Personality
and Social Psychology, 55, 23-27.
Phelan, J., Schwartz, J., Bromet, E., Dew, M., Parkinson, D., Schulberg, H. et al. (1991).
Work stress, family stress, and depression in professional and managerial employees.
Psychological Medicine, 21, 999-1012.
Pierce, C., & Molloy, G. (1990). Relations between organization type, occupational stress,
role perceptions and social support. Australian Journal of Education, 34, 330-338.
Ping, R. (1994). Does satisfaction moderate the association between alternative
attractiveness? and exit intention in a marketing channel? Journal of the Academy of
Marketing Science, 22, 364-371.
Pithers, R. (1995). Employees stress research: Problems and progress. British Journal of
Educational Psychology, 65, 387-392.
Pithers, R.., & Fogarty, G. (1995). Occupational stress among organizational employees.
British Journal of Educational Psychology, 65, 3-14.
Plomin, R. (1990). Nature and Nurture. An introduction to human behavioral genetics.
Pacific Grove, CA: Brooks/Cole.
Podsakoff, P., Williams, L., & Todor, W. (1986). Effects of organizational formalization on
alienation among professionals and non-professionals. Academy of Management
Journal, 29, 820-831.
Pomaki, Y (2001). A test and extension of the demand/control/social support model:
Prediction of health and work-related outcomes in Greek employees. Prague, Czech Republic.
Pretorius, T. (1993). Commitment, participation decision-making and social support: Direct
and moderating effects on the stress-burnout relationship. South African Journal of
Psychology, 23, 10-14.
Punch, K, & Tuetteman, E. (1996). Reducing employees stress: The effects of support in the
work environment. Research in Educational Organizations, 56, 63-72.
Radmacher, S, & Sheridan, C. (1992). An investigation of the demand-control model of
job strain. In S. Sauter, & L. Murphy, Organizational risk factors for job stress
(pp.127- 138). Washington, DC.: American Psychological Association.
Rafferty, Y. & Landsbergis, P. (2001). The association between job skill discretion, decision

233
authority and burnout. Work and Stress, 15, 73-85.
Rau, R., & de Faire, U. (2001). Psychosocial work characteristics and perceived control in
relation to cardiovascular effects. Journal of Health Psychology, 6, 171-181.
Repetti, R. (1987). Individual and common components of the social environment at work
and well-being. Journal of Personality and Social Psychology, 52, 710-720.
Rahim M. A., Relationships of stress, locus of control, and social support to psychiatric
symptoms and propensity to leave a job: a field study with managers. Journal of
Business and Psychology. Volume 12, No. 2, Winter (1997). Western Kentucky
University.
Repetti R. (1993). The effects of workload and the social environment at work on health.
Handbook of stress: Theoretical and clinical aspects (pp. 368-385). New York: Free
Press.
Riese, H., van Doornen, L., Houtman, I., & de Geus, E. (2000). Job strain and risk indicators
for cardiovascular disease in young female nurses. Health Psychology, 19, 429-440.
Robbins, A., Spence, J., & Clark, H. (1991). Psychological determinants of health and
performance: The tangled web of desirable and undesirable characteristics. Journal of
Social Psychology, 61, 755-765.
Rodnguez, I., Bravo, M., Peiro, J, & Schaufeli, W. (2001). The Demands-Control-
Support model, locus of control and job satisfaction: A longitudinal study. Work and
Stress, 15, 97-114.
Rothman, S. (2000). Sense of coherence, locus of control, self-efficacy and job
Satisfaction. Sweden.
Rotter, J. (1966). Generalized expectancies for internal versus external locus of
reinforcement. Psychological Monographs, 80.
Rugulies, R., & Krause, N. (2000). The impact of job stress on musculoskeletal disorders,
psychosomatic symptoms and general health in hotel room cleaners. International
Journal of Behavioral Medicine.
Russell, D., Altmaier, E., & Van Velzen, D. (1987). Job-related stress, social support, and
burnout among organizational employees. Journal of Applied Psychology, 72, 269-274.
Sargent, L., & Terry, D. (2000). The moderating role of social support in Karasek’s job
strain model. Work and Stress, 14, 245-261.

234
Saris, W, & Stronkhorst, L. (1984). Causal modeling in non-experimental research.
Amsterdam: Sociometric Research Foundation.
Sarros, J., & Sarros, A. (1992). Social support and employee’s burnout. Journal of
Organizational Behavior, 30, 55-59.
Sauter, S. & Cooper, C. (1989). Job control and worker health. Chichester: Wiley.
Scandura, T., & Williams, E. (2000). Research methodology in management: Current
practices, trends, and implications for future research. Academy of Management
Journal, 43, 1248-1264.
Schaubroek, J. (1999). Should the subjective be the objective? On studying mental processes,
coping behavior, and actual exposures in organizational stress research. Journal of
Organizational Behavior, 20, 753-760.
Schaubroeck, J., & Fink, L. (1998). Facilitating and inhibiting effects of job control and
social support on stress outcomes and role behavior: Journal of Organizational
Behavior, 19, 167-198.
Schaubroeck, J., & Ganster, D. (1991). The role of negative affectivity in work-related stress.
Journal of Social Behavior and Personality, 6, 319-330.
Scheier, M., Carver, C., & Bridges, M. (1994). Distinguishing optimism from neuroticism
(and trait anxiety, self-mastery, and self-esteem). Journal of Personality and Social
Psychology, 67, 1063-1078.
Schmieder, R., & Smith, C. (1996). Moderating effects of social support in shift-working
and non-shift-working nurses. Work and Stress, 10, 128-140.
Schnall, P., & Landsbergis, P. (1994). Job strain and cardiovascular disease. Annual
Review of Public Health, 15, 381-411.
Schnall, P., Pieper, C., & Schwartz, J (1990). The relationship between job strain, workplace
diastolic blood pressure. Journal of the American Medical Association, 263, 1929-1935.
Schonfeld, I. (1992). Assessing stress in employees: Depressive symptoms scales and
Neutral self-reports of the work environment. Washington, DC: American
psychological Association.
Schonfeld, I. (1996). Relation of negative affectivity to self-reports of job stressors and
psychological outcomes. Journal of Occupational Health Psychology, 1, 397-412.

235
Schonfeld, I. (2000). An updated look at depressive symptoms and job satisfaction in first-
year employees. Journal of Occupational and Organizational Psychology, 73,
363-371.
Schreurs, P, & Taris, T. (1998). Construct validity of the demand-control model: Work
and Stress, 12, 66-84.
Schuler, R. (1980). Definition and conceptualization of stress in organizations.
Organizational Behavior and Human Performance, 25, 184-215.
Schwartz, J., Pieper, C., & Karasek, R. (1988). A procedure for linking psychosocial job
characteristics data to health surveys. Journal of Public Health, 78, 904-909.
Searle, B., Bright, J., & Bochner, S. (1999). Testing the 3-factor model of occupational
stress: The impact of demands, control and social support on a mail sorting task. Work
and Stress, 13, 268-279.
Selye, H. (1956). The stress of life. New York: McGraw-Hill.
Selye, H. (1993). History of the stress concept. Handbook of stress (pp. 7-17). New York:
Free Press.
Semner, N. (2003). Job stress interventions and organization of work. In J. C. Quick, & L.
E. Tetrick, Handbook of occupational health psychology (pp. 325-353).Washington,
DC: American Psychological Association.
Shadish, W, Cook, T., & Campbell, D. (2002). Experimental and quasi-experimental design
for generalized causal inference. Boston: Houghton Mifflin.
Sheffield, D., Dobbie, D., & Carroll, D. (1994). Stress, social support, and psychological and
physical wellbeing in organizational employees. Work and Stress, 8, 235-243.
Siegrist, J. (1996). Adverse health effects of high-effort/low-reward conditions. Journal of
Occupational Health Psychology, 1, 27-41.
Siegrist, J. (2001). A theory of occupational stress. In Dunham, J., Stress in the workplace:
Past, present and future (pp. 52-66). London: Whurr Publishers.
Singh, J. (1991). Understanding the structure of consumers’ satisfaction evaluations of
Service delivery. Journal of the Academy of Marketing Science, 19, 223-244.
Skinner, E.. (1996). A guide to constructs of control. Journal of Personality and Social
Psychology, 71, 549-570.
Smith, B. S., Wallston, B., Wallston, K., Forsberg, P., & King, J. (1984). Measuring

236
desire for control of health care processes. Journal of Personality and Social Psychology, 47, 415-426. Smith, C., Tisak, J., Hahn, S., & Schmeider, R. (1997). The measurement of job control.
Journal of Organizational Behavior, 18, 225-237.
Smith, M., & Bourke, (1991). Are employees stressed and satisfied? The analysis of complex
interaction effects using two-stage least squares regression analysis. Paper presented at
the Annual Conference of the Australian Association of Research in
Education, Gold Coast, Queensland.
Smith, T.., Pope, M., Rhodewalt, F., & Poulton, J. (1989). Optimism, neuroticism,
coping, and symptom reports: An alternative interpretation of the life orientation test.
Journal of Personality and Social Psychology, 56, 640-648.
Smulders, P., & Nijhuis, F. (1999). The job demands-job control model and absence
behavior: Work and Stress, 13, 115-131.
Soderfeldt, B., Soderfeldt, M., Muntaner, C., O’Campo, P., Warg, & Ohlson, (1996).
Psychosocial work environment in human service organizations. Social Science and
Medicine, 42, 1217- 1226.
Sparks, K., & Cooper, C. (1999). Occupational differences in the work-strain relationship:
Towards the use of situation specific models. Journal of Occupational and
Organizational Psychology, 72, 219-229.
Spector, P. (1987). Interactive effects of perceived control and job stressors on affective
reactions and health outcomes for clerical workers. Work and Stress, 1, 155-162.
Spector, P, (1988). Development of the work locus of control scale. Journal of Occupational
Psychology, 61, 335-340.
Spector, P., Dwyer, D., & Jex, S. (1988). Relation of job stressors to affective, health and
performance: A comparison of multiple data sources. Journal of Psychology, 73, 11-19.
Spector, P. E., Fox, S., & Van Katwyk, P. T. (1999). The role of negative affectivity in
employees reactions to job characteristics: Bias effect or substantive effect? Journal of
Occupational and Organisational Psychology, 72, 205-218.
Spielberger,, Gorush, R., Lushene, R., Vagg, P., & Jacobs, G. (1983). Manual for the State-
Trait Personality Inventory (STPI). Palo Alto: Consulting Psychologists Press.
Spillane, L., & Spillane, R. (1994). Job personality and illness reporting. Journal of
Occupational Health Safety: Australia and New Zealand, 10, 529-533.
237
Stansfeld, S., Fuhrer, R., & Shipley, M. (1998). Types of social support as predictors of psychiatric morbidity in British civil servants. Psychological Medicine, 28, 881-892. Stansfeld, S, Fuhrer, R., Shipley, & Marmot (1999). Work characteristics predict psychiatric
disorder. Occupational and Environmental Medicine, 56, 302-307.
Staw, B, Bell, N, & Clausen, J. (1986). The dispositional approach to job attitudes: A
lifetime longitudinal test. Administrative Science, 31, 56-77.
Steptoe, A., Fieldman, G., & Evans, O. (1993). An experimental study of the effects of
Control over work pace. Journal of Psychophysiology, 7, 290-300.
Steptoe, A., Wardle, J., & Kirschbaum, C. (1998). A longitudinal study of work load and
variations in psychological well-being, cortisol, smoking and alcohol consumption.
Annals of Behavioral Medicine, 20, 84-91.
Stodgill, R. (1963). Manual for the Leader Behavior Description Questionnaire. Ohio:
Bureau of Business Research, Ohio State University.
Stone, E, & Hollenbeck, J. (1989). Clarifying some controversial issues surrounding
statistical procedures for detecting moderating variables: Empirical evidence and
related matters. Journal of Applied Psychology, 74, 3-10.
Storms, G., van den Bergh, O., & Moens, G. (2001). A psychometric evaluation of a Dutch
version of the Job Content Questionnaire and of a short direct questioning procedure.
Work and Stress, 15, 131-143.
Strickland, B. (1978). Internal-external expectancies and health behaviors. Journal of
Clinical and Consulting Psychology, 46, 1192-1211.
Sutton, R., & Kahn, R. (1987). Prediction, understanding and control as antidotes to
organizational stress. New Jersey: Prentice-Hall.
Sweeney, J., Soutar, G., & Johnson, L. (1997). Retail service quality and perceived
value; A comparison of two models. Journal of Retailing and Consumer Services, 4,
39-48.
Tang, C., Schwarzer, R., & Schmitz, G. (2001). Mental health outcomes of job stress
among Chinese employees: Role of stress resource factors and burnout. Journal of
Organizational Behavior, 22, 887-901.
Taris, T., Kompier, M., de Lange, A, Schaufeli, W. & Schreurs, P. (2003). Learning new
behaviour patterns: A longitudinal test of Karasek’s active learning hypothesis among
Dutch employees. Work and Stress, 17, 1-20.

238
Taris, T, Peeters, M., Le Blanc, P, Schreurs, P., & Schaufeli, W. (2001). Inequity to burnout:
The role of job stress. Journal of Occupational Health Psychology, 6, 303-323.
Tattersall, A, & Farmer,. (1995). The regulation of work demands and strain. Organizational
risk factors for job stress (pp. 139-156). American Psychological Association.
Taylor, S. (1999). Health psychology. New York: Prentice-Hall.
Teas, R. (1981). An test of models of salespersons’ job expectancy and instrumentality
perceptions. Journal of Marketing Research, 18, 209-226.
Teas, R. (1983). Supervisory behavior, role stress, and the job satisfaction of industrial
Sales person. Journal of Marketing Research, 20, 84-91.
Terry, D., Nielsen, M., & Perchard, L. (1993). Effects of work stress on psychological well-
being and job satisfaction: The stress-buffering role of social support. Australian
Journal of Psychology, 45, 168-175.
Tetrick, L., & LaRocco, J. (1987). Understanding, prediction, and control as moderators of
the relationships between perceived stress, satisfaction and psychological well-being.
Journal of Applied Psychology, 72, 538-543.
Tharenou, P. (1993). A test of reciprocal causality for absenteeism. Journal of
Organizational Behavior, 14, 269-290
Theorell, T. (1989). Personal control at and health: A review of epidemiological studies in
Sweden. In A. Steptoe, & A. Appels, Stress, personal control and health. (pp. 49-64).
Chichester: Wiley.
Theorell, T., & Karasek, R. (1996). Current issues relating to psychosocial job strain and
cardiovascular disease research. Journal of Occupational Health Psychology, 1, 9-26.
Theorell, T., Unden, A-L., & Eriksson, I. (1995). Endocrine markers during a job
interventions. Work and Stress, 9, 67-76.
Thomson, L., Griffiths, A., Cox, T., & Pentii, J. (1997). Psychosocial factors predicting
employee sickness absence during economic decline. Journal of Applied Psychology,
82, 858-872.
Torp, S., Riise, T., & Moen, B. (1999). How the psychosocial work environment of motor
vehicle mechanics may influence coping with musculoskeletal symptoms. Work and
Stress, 13, 193-203.

239
Travers, C., & Cooper, C. (1993). Mental health, job satisfaction and occupational stress
among UK employees. Work and Stress, 7, 203-219.
Troup, C., & Dewe, P. (2002). Exploring the nature of control and its role in the appraisal of
workplace stress. Work and Stress, 16, 335-355.
Tucker, L., & Lewis, C. (1973). A reliability coefficient for maximum likelihood factor
analysis. Psychometrika, 38, 1-10.
Tuettemann, E., & Punch, K. (1992). Employees’ psychological stress: The effects of control
over the work environment. Educational Review, 44, 181-194.
Tummers, G., Landeweerd, J., & van Merode, G. (2001, May). The work environment, work
structure and effects on psychological outcomes in nursing. Paper presented at the Tenth
European Congress on Work and Organizational Psychology, Prague, Czech Republic.
Tyler, P., & Cushway, D. (1998). Stress and well-being in health-care staff: The role of
Negative affectivity, and perceptions of job demand and discretion. Stress Medicine, 14,
99-107.
Ulleberg, P., & Rundmo, T. (1997). Job stress, social support, job satisfaction and
Absenteeism among offshore oil personnel. Work and Stress, 11, 215-228.
Unden, (1996). Social support at work and its relationship to absenteeism. Work and
Stress, 10, 46-61.
Vahtera, J., Kivimak, & Theorell, T. (2000). Effect of change in the psychosocial work
environment on sickness absence: A seven year follow up of initially healthy
employees. Journal of Epidemiology and Community Health, 54, 484-493.
Van der Doef, M., & Maes, S. (1999). The job demand-control model and psychological
well-being:. Work and Stress, 13, 87-114.
VanderZee, K., Buunk, B., & Sanderman, R. (1997). Social support, locus of control, and
psychological well-being. Journal of Applied Social Psychology, 27, 1842-1859.
Van Egeren, L. (1992). The relationship between job strain and blood pressure at work, at
home, and during sleep. Psychosomatic Medicine, 54, 337-343.
Van Harrison, R., Moss, G., Dielman, T., Horvarth, W., & Harlan, W. (1987). Person-
environment fit, Type A behavior, and work strain: The complexity of the
process. Work stress:Health care systems in the work place. New York.
Van Yperen, N., & Sijders, T. (2000). A multilevel analysis of the demands-control

240
model: Is stress at work determined by factors at the group or individual level? Journal of Occupational Health Psychology, 5, 182-190. Vermeulen, M., & Mustard, C. (2000). Gender differences in job strain, social support at
work, and psychological stress. Journal of Occupational Health Psychology, 5, 428-440.
Viswesvaran, C., Sanchez, J. I., & Fisher, J. (1999). The role of social support in the process
of work stress: A meta-analysis. Journal of Vocational Behavior, 54, 314-334.
Vroom, V. H. (1960). Some personality determinants of the effects of participation.
Englewood Cliffs, New Jersey: Prentice-Hall.
Wagner, J., & Gooding, R. (1987). Shared influence and organizational behavior: A meta-
analysis of situational variables expected to moderate participation-outcome
relationships. Academy of Management Journal, 30, 524-541.
Wall, T., Jackson, P., Mullarkey, S., & Parker, S. (1996). The demands-control model
of job strain: A more specific test. Journal of Occupational and Organizational
Psychology, 69, 153-166.
Wallston, K. A. (1989). Assessment of control in health care settings. In A. Steptoe, & A.
Appels, Stress, personal control and health (pp.85-105). Chichester: Wiley.
Wallston, K & Dobbins, C. J. (1987). Perceived control and health. Current Psychological
Research and Reviews, 6, 5-25.
Walsh, J, Wilding, J., Eysenck, M., & Valentine, J. (1997). Neuroticism, locus of control,
and occupational stress. Work and Stress, 11, 148- 159.
Warr, P. (1990). Decision latitude, job demands and employee well-being. Work and Stress,
4, 285-294.
Warr, P. (1994). A conceptual framework for the study of work and mental health. Work and
Stress, 8, 84-97.
Watson, D., & Pennebaker, J. (1989). Health complaints, stress, and distress: Exploring the
central role of negative affectivity. Psychological Review, 96, 234-254.
Westman, M. (1992). Moderating effects of decision latitude on strain relationship: Does
organizational level matter? Journal of Organizational Behavior, 13, 713-722.
White, R. (1959). The concept of competence. Psychological Review, 66, 297-333.
Wilkinson, L. (1999). Statistical methods in psychology journals. American Psychologist, 54,
594-604.

241
Williams, L, Gavin, M., & Williams, M.(1996). Measurement and non-measurement
processes with negative affectivity and employee attitudes. Journal of Applied
Psychology, 81, 88-101.
Winefield, A., Gillepsie, N., & Stough, C., (2002). Occupational stress in Australian
universities: A national survey 2002. Melbourne: National Tertiary
Education Union.
Winnubst, J., & Schabracq, M. (1996). Social support, stress and organization: Towards
optimal matching. In M. J. Schabracq, J. A. M. Winnubst, & C. L. Cooper
Handbook of work and health psychology (pp. 87-102). Chichester: Wiley.
Wong, S. (2004). ‘Distal and local group learning: performance trade-offs and tension:
Organization Science, 15, 645–56.
Xie, J. (1996). Karasek’s model in the People’s Republic of China: Effects of job demands,
control, and individual differences. Academy of Management Journal, 39, 1594-1618.
Yukl, G. (1994). Leadership in organizations. Englewood Cliffs, New Jersey: Prentice Hall.
Yukl, G, & Nemeroff, W. (1979). Identification and measurement of specific categories
of leadership behavior: A progress report. In J. Hunt, & L. L. Larson, Crosscurrents in
leadership (pp. 164-200). Illinois: Southern Illinois Press.
Zapf, D., Dormann, & Frese, M. (1996). Longitudinal studies in organizational stress
research: A review of the literature with reference to methodological issues. Journal
of Occupational Health Psychology, 1, 145-169.
Zedeck, S. (1971). Problems with the use of moderator variables. Psychological Bulletin,
77,

242
Appendix A1 (Time-1) Linear Regression Analyses of Qualitative Demands Scale (of Total Demands) on various
Predictors of Model and their Interactions
Time 1
Independent
Dependent β SEβ Beta t-Values R2
(Adjusted) F-Values
Qualitative Demand
Total Demands .75 .015 .93*** 51.26 .87 2627.74***
Qualitative Demand
Total Control -.65 .033 -.70** -19.71 .50 388.116***
Qualitative Demand
Supervisor Supports -.68 .026 -.80** -26.15 .63 683.56***
Qualitative Demand
Colleagues Supports -.93 .04 -.76*** -23.34 .58 544.90***
Qualitative Demand
Total Stressors .63 .025 .79** 25.38 .62 649.26**
Qualitative Demand
Job Strain .78 .027 .82*** 28.53 .67 813.76***
Qualitative Demand Job Anxiety .36 .017 .72*** 20.48 .51 449.75*** Qualitative Demand
Job Dissatisfaction .85 .025 .81* 27.37 .65 749.00**
Qualitative Demand
Somatic Complaints .53 .027 .69** 19.05 .47 362.90**
β = Unstandardized Co-efficient of Regression, SE β = Standard Errors in Beta (unstandardised). Beta= Standardized coefficients, * p<.05 ** p<.01 ***p<.001

243
Appendix A2 (Time-1)
Linear Regression Analyses of Employees Demands Scale (of Total Demands) on various Predictors of Model and their Interactions
Time 1
Independent
Dependent β SEβ Beta t-Values R2
(Adjusted) F-Values
Employees Demand
Total Demands .95 .03 .86*** 33.34 .74 1111.67***
Employees Demand
Total Control -.90 .05 .66** -17.65 .44 311.76***
Employees Demand
Supervisor Supports -.87 .046 -.68*** -18.76 .47 351.85***
Employees Demand
Colleagues Supports -1.16 .06 -.65** -17.00 .42 289.29**
Employees Demand
Total Stressors .80 .043 .68* 18.48 .47 341.65**
Employees Demand
Job Strain .96 .051 .69*** 19.12 .48 365.71***
Employees Demand Job Anxiety .45 .029 .61** 15.31 .37 234.47** Employees Demand
Job Dissatisfaction 8.49 .45 .68* 18.53 .46 343.40**
Employees Demand
Somatic Complaints .60 .047 .54** 12.88 .29 165.97**
Note: β = Unstandardized Co-efficient of Regression, SE β = Standard Errors in Beta (unstandardised). Beta= Standardized coefficients, * p<.05 ** p<.01 ***p<.001

244
Appendix A3 (Time-1)
Linear Regression Analyses of Workload Demands Scale (of Total Demands) on various Predictors of Model and their Interactions
Time 1
Independent
Dependent β SEβ Beta t-Values R2
(Adjusted) F-Values
Workload Demand
Total Demands .87 .014 .95*** 63.37 .91 4015.76***
Workload Demand
Total Control -.78 .03 -.75*** -22.45 .56 504.17***
Workload Demand
Supervisor Supports -.77 .03 -.79** -26.02 .63 677.03***
Workload Demand
Colleagues Supports -1.06 .044 -.77** -24.20 .59 585.59**
Workload Demand
Total Stressors .72 .028 .79*** 25.87 .63 669.06***
Workload Demand
Job Strain .89 .03 .83** 29.25 .68 855.49***
Workload Demand Job Anxiety .39 .020 .69** 19.30 .48 372.33*** Workload Demand
Job Dissatisfaction 7.83 .28 .83** 28.13 .66 791.06**
Workload Demand
Somatic Complaints .56 .032 .66 17.60 .44 309.81***
Note: β = Unstandardized Co-efficient of Regression, SE β = Standard Errors in Beta (unstandardised). Beta= Standardized coefficients, * p<.05 ** p<.01 ***p<.001

245
Appendix A4 (Time-1) Linear Regression Analyses of Conflicts Demands Scale (of Total Demands) on various
Predictors of Model and their Interactions
Time 1
Independent
Dependent β SEβ Beta t-Values R2
(Adjusted) F-Values
Conflicts Demand
Total Demands .94 .019 .93*** 49.42 .86 2443.09***
Conflicts Demand
Total Control -.84 .041 -.71** -20.41 .51 416.37***
Conflicts Demand
Supervisor Supports -.83 .035 -.76** -23.45 .58 549.86***
Conflicts Demand
Colleagues Supports -1.153 .051 -.75** -22.39 .56 501.21***
Conflicts Demand
Total Stressors .80 .032 .78*** 25.12 .61 631.38***
Conflicts Demand
Job Strain .98 .035 .83*** 28.39 .67 805.83**
Conflicts Demand Job Anxiety .44 .023 .70** 19.51 .49 380.92** Conflicts Demand
Job Dissatisfaction 8.86 .31 .81* 27.53 .64 757.82**
Conflicts Demand
Somatic Complaints .62 .037 .64 16.81 .42 282.45
NOTE: β = Unstandardized Co-efficient of Regression, SE β = Standard Errors in Beta (unstandardised).
Beta= Standardized coefficients, * p<.05 ** p<.01 ***p<.001

246
Appendix B1 (Time-1)
Linear Regression Analyses of Qualitative Control Scale (of Total Control) on various Predictors of Model and their Interactions
Time 1
Independent
Dependent β SEβ Beta t-
Values R2
(Adjusted) F-Values
Qualitative Control
Total Demands -.54 .025 -.73*** -21.47 .53 461.02***
Qualitative Control
Total Control .78 .016 .93*** 48.57 .85 2357.77***
Qualitative Control
Supervisor Supports .56 .027 .72*** 20.43 .51 417.40***
Qualitative Control
Colleagues Supports .77 .04 .69** 19.07 .48 363.87**
Qualitative Control
Total Stressors -.53 .025 -.72*** -20.60 .51 424.54***
Qualitative Control
Job Strain -.65 .029 -.75*** -22.40 .56 501.85***
Qualitative Control Job Anxiety -.29 .017 -.64*** -16.82 .41 283.12*** Qualitative Control
Job Dissatisfaction -5.67 .26 -.74* -21.65 .54 468.74**
Qualitative Control
Somatic Complaints -.42 .027 -.61*** -15.36 .37 235.95**
NOTE: β = Unstandardized Co-efficient of Regression, SE β = Standard Errors in Beta (unstandardised).
Beta= Standardized coefficients, * p<.05 ** p<.01 ***p<.001

247
Appendix B2 (Time-1)
Linear Regression Analyses of Employees Control Scale (of Total Control) on various Predictors of Model and their Interactions
Time 1
Independent
Dependent β Seβ Beta t-
Values R2
(Adjusted) F-Values
Employees Control
Total Demands -.64 .033 -.70*** -19.52 .49 381.07***
Employees Control
Total Control .98 .02 .93*** 49.54 .86 2454.59***
Employees Control
Supervisor Supports .64 .037 .66** 17.37 .43 301.64***
Employees Control
Colleagues Supports .90 .05 .64* 16.81 .42 282.66**
Employees Control
Total Stressors -.63 .033 -.69** -19.10 .48 364.80***
Employees Control
Job Strain -.76 .039 -.70*** -19.34 .48 374.08***
Employees Control Job Anxiety -.33 .023 -.57** -14.03 .33 197.03*** Employees Control
Job Dissatisfaction -6.64 .35 -.69** -18.80 .47 353.12**
Employees Control
Somatic Complaints -.48 .036 -.55** -13.30 .31 176.94**
NOTE: β = Unstandardized Co-efficient of Regression, SE β = Standard Errors in Beta (unstandardised).
Beta= Standardized coefficients, * p<.05 ** p<.01 ***p<.001

248
Appendix B3 (Time-1) Linear Regression Analyses of Workload Control Scale (of Total Control) on various
Predictors of Model and their Interactions
Time 1
Independent
Dependent β Seβ Beta t-Values
R2
(Adjusted) F-Values
Workload Control
Total Demands -.54 .023 -.75*** -20.30 .57 538.61***
Workload Control
Total Control .79 .011 .96*** 73.20 .93 5358.59***
Workload Control
Supervisor Supports .54 .027 .71*** 20.32 .51 412.84***
Workload Control
Colleagues Supports .75 .039 .70** 19.38 .48 375.70**
Workload Control
Total Stressors -.53 .024 -.74*** -22.17 .55 491.52**
Workload Control
Job Strain -.63 .028 -.75*** -22.31 .55 497.86***
Workload Control Job Anxiety -.27 .017 -.63*** -16.00 .39 256.23** Workload Control
Job Dissatisfaction -5.50 .25 -.73*** -21.29 .53 459.20***
Workload Control
Somatic Complaints -.42 .026 -.63** -16.21 .40 262.63**
NOTE: β = Unstandardized Co-efficient of Regression, SE β = Standard Errors in Beta (unstandardised).
Beta= Standardized coefficients, * p<.05 ** p<.01 ***p<.001

249
Appendix B4 (Time-1)
Linear Regression Analyses of Conflicts Control Scale (of Total Control) on various Predictors of Model and their Interactions
Time 1
Independent
Dependent Β SEβ Beta t-Values R2
(Adjusted) F-Values
Conflicts Control
Total Demands -.65 .035 -.68** -18.42 .46 346.50***
Conflicts Control
Total Control 1.01 .022 .92*** 46.95 .85 2204.00***
Conflicts Control
Supervisor Supports .68 .039 .66*** 17.53 .43 307.41**
Conflicts Control
Colleagues Supports .95 .055 .65** 17.08 .42 291.84***
Conflicts Control
Total Stressors -.65 .035 -.68*** -18.43 .46 339.65***
Conflicts Control
Job Strain -.80 .04 -.71** -19.94 .50 397.53**
Conflicts Control Job Anxiety -.34 .024 -.58** -14.10 .33 198.92** Conflicts Control
Job Dissatisfaction -7.03 .36 -.70** -19.37 .48 375.25**
Conflicts Control
Somatic Complaints -.51 .037 -.67** -13.82 .32 190.90***
NOTE: β = Unstandardized Co-efficient of Regression, SE β = Standard Errors in Beta (unstandardised).
Beta= Standardized coefficients, * p<.05 ** p<.01 ***p<.001

250
Appendix C1 (Time-1)
Linear Regression Analyses of Qualitative Stressors Scale (of Total Stressors) on various Predictors of Model and their Interactions
Time 1
Independent
Dependent β SEβ Beta t-Values R2
(Adjusted) F-Values
Qualitative Stressors
Total Demands .51 .025 .71** 20.41 .51 416.72**
Qualitative Stressors
Total Control -.54 .033 -.66*** -17.63 .44 310.71***
Qualitative Stressors
Supervisor Supports -.57 .026 -.74*** -21.90 .54 479.80***
Qualitative Stressors
Colleagues Supports -.80 .037 -.73** -21.47 .53 460.91***
Qualitative Stressors
Total Stressors .63 .017 .88*** 36.90 .77 1361.96***
Qualitative Stressors
Job Strain .66 .027 .78*** 24.81 .61 615.38***
Qualitative Stressors Job Anxiety .29 .017 .66** 17.44 .43 304.05*** Qualitative Stressors
Job Dissatisfaction 5.82 .24 .78* 24.07 .59 579.30**
Qualitative Stressors
Somatic Complaints .48 .023 .72*** 20.68 .52 427.55**
NOTE: β = Unstandardized Co-efficient of Regression, SE β = Standard Errors in Beta (unstandardised).
Beta= Standardized coefficients, * p<.05 ** p<.01 ***p<.001

251
Appendix C2 (Time-1) Linear Regression Analyses of Employees Stressors Scale (of Total Stressors) on various
Predictors of Model and their Interactions
Time 1
Independent
Dependent β SEβ Beta t-Values R2
(Adjusted) F-Values
Employees Stressors
Total Demands .82 .039 .72*** 20.86 .52 435.29***
Employees Stressors
Total Control -.85 .05 -.65** -17.16 .42 294.70**
Employees Stressors
Supervisor Supports -.89 .04 -.73*** -21.65 .54 468.74***
Employees Stressors
Colleagues Supports -1.28 .057 -.75** -22.35 .55 499.53***
Employees Stressors
Total Stressors .98 .028 .87*** 34.70 .75 1203.98***
Employees Stressors
Job Strain 1.02 .043 .76** 23.61 .58 557.23***
Employees Stressors Job Anxiety .47 .026 .67*** 18.12 .45 328.53*** Employees Stressors
Job Dissatisfaction 8.99 .39 .75 22.83 .56 521.29**
Employees Stressors
Somatic Complaints .66 .042 .62 15.59 .37 243.33**
NOTE: β = Unstandardized Co-efficient of Regression, SE β = Standard Errors in Beta (unstandardised).
Beta= Standardized coefficients, * p<.05 ** p<.01 ***p<.001

252
Appendix C3 (Time-1) Linear Regression Analyses of Workload Stressors Scale (of Total Stressors) on various
Predictors of Model and their Interactions
Time 1
Independent
Dependent β SEβ Beta t-Values R2
(Adjusted) F-Values
Workload Stressors
Total Demands .69 .027 .78*** 25.37 .62 643.367***
Workload Stressors
Total Control -.73 .035 -.72** -21.02 .52 442.08***
Workload Stressors
Supervisor Supports -.74 .028 -.79*** -26.07 .63 679.82
Workload Stressors
Colleagues Supports -1.07 .039 -.81** -27.26 .65 743.12***
Workload Stressors
Total Stressors .83 .015 .94*** 56.42 .88 3186.68***
Workload Stressors
Job Strain .87 .028 .84*** 30.84 .71 951.41**
Workload Stressors Job Anxiety .38 .019 .71*** 20.12 .50 404.82*** Workload Stressors
Job Dissatisfaction 7.63 .25 .83*** 29.64 .69 878.69***
Workload Stressors
Somatic Complaints .59 .029 .72 20.56 .51 422.85***
NOTE: β = Unstandardized Co-efficient of Regression, SE β = Standard Errors in Beta (unstandardised).
Beta= Standardized coefficients, * p<.05 ** p<.01 ***p<.001

253
Appendix C4 (Time-1) Linear Regression Analyses of Conflicts Stressors Scale (of Total Stressors) on various
Predictors of Model and their Interactions
Time 1
Independent
Dependent Β SEβ Beta t-Values R2
(Adjusted) F-Values
Conflicts Stressors
Total Demands .72 .03 .79*** 23.99 .59 575.90***
Conflicts Stressors
Total Control -.73 .039 -.68*** -18.58 .46 345.26**
Conflicts Stressors
Supervisor Supports -.78 .031 -.78*** -24.64 .60 607.53***
Conflicts Stressors
Colleagues Supports -1.11 .044 -.78** 25.19 .61 634.84**
Conflicts Stressors
Total Stressors .84 .020 .90*** 41.27 .81 1703.56***
Conflicts Stressors
Job Strain .87 .034 .79** 25.94 .63 672.94***
Conflicts Stressors Job Anxiety .39 .021 .68*** 18.79 .47 354.00*** Conflicts Stressors
Job Dissatisfaction 7.66 .31 .79*** 24.84 .61 616.932***
Conflicts Stressors
Somatic Complaints .59 .031 .67** 18.25 .53 333.17***
NOTE: β = Unstandardized Co-efficient of Regression, SE β = Standard Errors in Beta (unstandardised).
Beta= Standardized coefficients, * p<.05 ** p<.01 ***p<.001

254
Appendix D1 (Time-1)
Linear Regression Analyses of Sub-Set of Demands Scale on various Predictors of Model and their Interactions with Sub-Set Control and Stressors.
Time 1
Independent
Dependent Β SEβ Beta t-Values R2
(Adjusted) F-Values
Qualitative Demands
Qualitative Control -.74 .041 -.67*** -18.34 .46 336.50***
Employees Demands
Employees Control -.76 .052 -.59** -14.68 .35 215.62**
Workload Demands
Workload Control -.94 .042 -.73** -21.64 .45 468.50**
Conflicts Demands
Conflicts Control -.67 .041 -.63*** -16.25 .40 264.10**
Qualitative Demands
Qualitative Stressors .76 .041 .68*** 18.38 .46 338.02***
Employees Demands
Employees Stressors .60 .043 .57*** 13.91 .32 193.52**
Workload Demands
Workload Stressors .78 .035 .75** 22.37 .56 500.45***
Conflicts Demands
Conflicts Stressors .78 .038 .71*** 20.38 .51 412.22**
Qualitative Control
Qualitative Stressors -.63 .040 -.62** -15.70 .38 246.51**
Employees Control
Employees Stressors -.47 .033 -.58*** -14.20 .33 201.68**
Workload Control
Workload Stressors -.58 .029 -.71** -20.24 .51 409.87***
Conflicts Control
Conflicts Stressors -.62 .041 -.61*** -15.18 .36 230.41**
NOTE: β = Unstandardized Co-efficient of Regression, SE β = Standard Errors in Beta (unstandardised).
Beta= Standardized coefficients, * p<.05 ** p<.01 ***p<.001

255
Appendix D2 (Time-1)
Hierarchical Regression Analyses of Sub-Set of Total Demands and Total Control Factors on various Predictors of Model and their Interactions
Time 1
Dependent
Independent Β SEβ Beta t-
Values R2
(Adjusted) F-
Values Qualitative .24 .04 .30 5.31 Employees .027 .05 .022 .47 Workload .25 .06 .27 4.14
1-Demands
Conflicts .29 .05 .28 5.08
.69 224.11
Qualitative -.18 .05 -.24 -3.61 Employees -.09 .06 -.11 -1.55 Workload -.27 .05 -.38 -4.80
Total Stressors
2-Control
Conflicts -.067 .06 -.07 -1.05
.57 137.52
Qualitative .31 .04 .32 6.32
Employees -.03 .06 -.027 -.64
Workload .33 .06 .31 5.25 1-Demands
Conflicts .37 .06 .31 6.19
.75 305.56
Qualitative -.30 .05 -.34 -5.2
Employees -.056 .07 -.05 -.78
Workload -.22 .06 -.26 -3.4
Job Strain
2-Control
Conflicts -.18 .07 -.16 -2.5
.60 152.85
Qualitative .17 .03 .35 5.15 Employees .02 .04 .035 .61
Job Anxiety 1-Demands

256
Independent Β SEβ Beta t-
Values R2
(Adjusted) F-
Values Workload .08 .04 .15 1.84 Conflicts .16 .04 .26 3.84 .55 124.65
Qualitative -.17 .03 -.39 -4.92 Employees .001 .04 .001 .019 Workload -.10 .04 -.23 -2.52 2-Control
Conflicts -.039
.04 -.066 -.85
.43 76.56
Qualitative 2.65 .44 .32 5.92 Employees -.43 .55 -.03 -.78 Workload 2.95 .58 .31 5.03
1-Demands
Conflicts 3.42 .56 .32 6.08
.73 277.44
Qualitative -2.66
.52 -.34 -5.05
Employees -.53 .66 -.05 -.83
Workload -1.87
.59 -.25 -3.16
Job Dissatisfaction
2-Control
Conflicts -1.66
.67 -.16 -2.49
.58 141.3
Qualitative .32 .05 .42 5.84 Employees -.08 .06 -.07 -1.20 Workload .19 .07 .22 2.63
1-Demands
Conflicts .16 .06 .16 2.28
.50 100.64
Qualitative -.18 .05 -.26 -3.21 Employees .039 .07 .045 .55 Workload -.25 .06 -.38 -4.12
Somatic Symptom
2-Control
Conflicts -.06 .07 -.07 -.88
.41 70.62
NOTE: β = Unstandardized Co-efficient of Regression, SE β = Standard Errors in Beta (unstandardised).
Beta= Standardized coefficients, * p<.05 ** p<.01 ***p<.001

257
Appendix D3 (Time-1)
Linear Regression Analyses of Job Demands Scales upon a Single Job Factor and Predictor of Model and their Interactions
Time 1
Independent
Dependent Β SEβ Beta t-
Values R2
(Adjusted) F-Values
Total Demands Total Stressors .83 .028 .83*** 30.15 .69 909.22***
Total Demands Job Strain 1.02 .029 .86* 34.90 .75 1218.52**
Total Demands Job Anxiety .46 .02 .75** 22.56 .56 509.08** Total Demands Job
Dissatisfaction 9.02 .27 .86** 33.22 .73 1104.09**
Total Demands Somatic Complaints .66 .034 .70*** 19.55 .48 382.17***
Total Demands Job Performance -.60 .022 -.81*** -27.53 .65 758.25***
Total Demands Mastery Scale 7.12 .31 .75** 22.70 .56 515.25***Total Demands Negative
Personality .59 .026 .75*** 22.70 .56 515.18**
Total Demands E. Turnover Intention 1.07 .037 .83*** 29.19 .68 842.09***
Total Demands Vigor Activity .072 .02 .17* 3.41 .026 11.53* Total Demands Neuroticism .47 .02 .71*** 20.23 .51 409.42***Total Demands Job
Participation -.56 .024 -.74** -22.09 .55 488.19***
Total Demands Job Consideration -.58 .03 -.70 -19.56 .49 482.66***
NOTE: β = Unstandardized Co-efficient of Regression, SE β = Standard Errors in Beta (unstandardised).
Beta= Standardized coefficients, * p<.05 ** p<.01 ***p<.001

258
Appendix D4 (Time-1) Linear Regression Analyses of Job Control Scales upon a Single Job Factor and Predictor
of Model and their Interactions.
Time 1
Independent
Dependent Β SEβ Beta t-Values R2
(Adjusted) F-Values
Total Control Total Stressors -.66 .028 -.76** -23.29 .57 542.41***
Total Control Job Strain -.79 .033 -.77*** -24.39 .60 594.91**
Total Control Job Anxiety -.35 .020 -.65** -16.97 .42 288.16***Total Control Job
Dissatisfaction -6.96 .29 -.76** -23.44 .58 549.61**
Total Control Somatic Complaints -.52 .032 -.63** -16.42 .40 268.57**
Total Control Job Performance .45 .023 .70*** 19.72 .49 388.87***
Total Control Mastery Scale -5.58 .30 -.67** -18.43 .46 339.68** Total Control Negative
Personality -.47 .025 -.68** -18.85 .47 355.35***
Total Control E. Turnover Intention -.83 .039 -.72*** -20.78 .52 431.78***
Total Control Vigor Activity -.044 .018 -.12* -2.41 .012 5.81* Total Control Neuroticism -.38 .012 -.67*** -18.25 .45 333.34***Total Control Job
Participation .41 .023 .66** 17.57 .43 308.74**
Total Control Job Consideration .42 .03 .58*** 14.25 .34 203.16**
NOTE: β = Unstandardized Co-efficient of Regression, SE β = Standard Errors in Beta (unstandardised). Beta= Standardized coefficients, * p<.05 ** p<.01 ***p<.001

259
Appendix D5 (Time-1)
Linear Regression Analyses of Job Supervisory Supports Scales upon A Single Job Factor and Predictor of Model and their Interactions
Time 1
Independent
Dependent Β SEβ Beta t-Values
R2
(Adjusted) F-Values
Supervisor Support
Total Stressors -.79 .025 -.85*** -31.94 .72 1020.42***
Supervisor Support
Job Strain -.97 .026 -.88*** -36.62 .77 1340.84***
Supervisor Support Job Anxiety -.46 .018 -.79** -26.11 .63 681.82** Supervisor Support
Job Dissatisfaction -8.57 .24 -.87*** -35.02 .75 1226.72***
Supervisor Support
Somatic Complaints -.66 .03 -.75** -22.51 .56 506.63***
Supervisor Support
Job Performance .59 .018 .85** 32.65 .73 1066.31**
Supervisor Support Mastery Scale -7.05 .27 -.79** -26.13 .63 682.71** Supervisor Support
Negative Personality -.59 .022 -.79** -26.02 .63 677.05***
Supervisor Support
E. Turnover Intention -1.03 .033 -.84*** -31.22 .71 974.97***
Supervisor Support Vigor Activity -.07 .02 -.19* -3.90 .034 15.23* Supervisor Support Neuroticism -.46 .021 -.75*** -22.62 .56 511.53** Supervisor Support
Job Participation .53 .020 .79** 25.77 .62 664.40***
Supervisor Support
Job Consideration .57 .027 .73*** 21.45 .53 460.29***
NOTE: β = Unstandardized Co-efficient of Regression, SE β = Standard Errors in Beta (unstandardised).
Beta= Standardized coefficients, * p<.05 ** p<.01 ***p<.001

260
Appendix D6 (Time-1)
Linear Regression Analyses of Job Colleagues Scales upon A Single Job Factor and Predictor of Model and their Interactions
Time 1
Independent
Dependent Β SEβ Beta t-Values
R2
(Adjusted) F-Values
Colleagues Supports
Total Stressors -.56 .017 -.85*** -32.92 .73 1083.20***
Colleagues Supports
Job Strain -.65 .021 -.84*** -31.80 .72 1011.45***
Colleagues Supports Job Anxiety -.29 .014 -.72** -21.11 .53 445.84** Colleagues Supports
Job Dissatisfaction -5.80 .19 -.84** -30.42 .70 925.08***
Colleagues Supports
Somatic Complaints -.44 .022 -.71*** -20.12 .50 405.04***
Colleagues Supports
Job Performance .39 .014 .81*** 27.29 .65 745.08***
Colleagues Supports Mastery Scale -4.89 .195 -.78** -25.15 .62 632.49** Colleagues Supports
Negative Personality -.41 .016 -.78** -25.33 .62 641.74***
Colleagues Supports
E. Turnover Intention -.69 .025 -.81*** -27.74 .66 770.00***
Colleagues Supports Vigor Activity -.014 .014 -.16* -3.22 .025 10.40* Colleagues Supports Neuroticism -.32 .015 -.74*** -22.22 .55 493.98*** Colleagues Supports
Job Participation .35 .015 .75** 22.80 .56 520.09***
Colleagues Supports
Job Consideration .38 .02 .69** 19.17 .48 367.51**
NOTE: β = Unstandardized Co-efficient of Regression, SE β = Standard Errors in Beta (unstandardised).
Beta= Standardized coefficients, * p<.05 ** p<.01 ***p<.001

261
Appendix D7 (Time-1) Linear Regression Analyses of Job Social Supports Scales upon A Single Job Factor and
Predictor of Model and their Interactions
Time 1
Independent
Dependent Β SEβ Beta t-Values
R2
(Adjusted) F-Values
Social Supports Total Stressors -.69 .019 -.87*** -36.35 .77 1321.75**
Social Supports Job Strain -.83 .022 -.88*** -37.83 .78 1431.20***
Social Supports Job Anxiety -.38 .016 -.78** -24.59 .60 604.36*** Social Supports Job
Dissatisfaction -7.32 .204 -.87*** -35.89 .76 1288.06**
Social Supports Somatic Complaints -.56 .025 -.74*** -22.41 .55 501.90**
Social Supports Job Performance .50 .016 .85*** 32.19 .72 1036.41***
Social Supports Mastery Scale -6.11 .22 -.81** -27.62 .65 763.25** Social Supports Negative
Personality -.51 .018 -.81*** -27.70 .66 767.66***
Social Supports E. Turnover Intention -.87 .027 -.85** -31.95 .72 1021.16**
Social Supports Vigor Activity -.068 .017 -.18** -3.61 .029 13.01** Social Supports Neuroticism -.41 .017 -.77*** -23.92 .58 572.16*** Social Supports Job
Participation .45 .017 .79** 25.74 .62 662.75**
Social Supports Job Consideration .49 .023 .73*** 21.27 .53 452.75***
NOTE: β = Unstandardized Co-efficient of Regression, SE β = Standard Errors in Beta (unstandardised).
Beta= Standardized coefficients Social Support = Supervisor Support + Colleague Support

262
Appendix D8 (Time-1) Hierarchical Regression Analyses of Job Demands and Job Control Scales upon a Single
Job Factor and Predictors of Model and their Interactions Time 1
Dependent
Independent Β SEβ Beta t-Values R2
(Adjusted) F-Values
Total Demands .61 .041 .61 14.95 Total Stressors Total Control -.25 .036 -.28 -7.04 .73 530.99
Total Demands .79 .042 .67 18.16 Job Strain Total Control -.26 .038 -.26 -7.01 .78 707.14
Total Demands .38 .032 .61 11.96 Job Anxiety Total Control -.09 .028 -.17 -3.38 .57 266.94
Total Demands 7.01 .40 .67 17.28 Job Dissatisfaction Total Control -2.27 .35 -.25 -6.43 .76 627.58
Total Demands .49 .05 .52 9.42 Somatic Complaints Total Control -.19 .04 -.23 -4.31 .51 208.74
Total Demands -.49 .03 -.66 -14.66 Job Performance Total Control .13 .02 .19 4.30 .67 404.97
Total Demands 5.32 .48 .56 11.13 Mastery Scale Total Control -2.02 .41 -.25 -4.86 .58 284.06
Total Demands .43 .03 .55 10.88 Negative Personality Total Control -.18 .03 -.26 -5.28 .59 289.16
Total Demands .85 .05 .66 15.25 E. Turnover Intention Total Control -.24 .04 -.21 -4.90 .69 457.35
Total Demands .08 .03 .18 2.41 Vigor Activity Total Control .009 .02 .02 .31 .024 5.85
Total Demands .31 .03 .47 8.91 Neuroticism Total Control -.18 .03 -.31 -5.89 .54 239.07
Total Demands -.41 .03 -.57 -11.11 Job Participation Total Control .13 .03 .22 4.25 .57 263.48
Total Demands -.52 .04 -.62 -11.09 Job Consideration Total Control .07 .04 .10 1.84 .49 194.16
NOTE: β = Unstandardized Co-efficient of Regression, SE β = Standard Errors in Beta (unstandardised) Beta= Standardized coefficients All Beta and F values are significance at ***p<.001 except Vigor
Activity which is p<.05.

263
Appendix D9 (Time-1)
Hierarchical Regression Analyses of Job Demands and Job Social Supports Scales upon A Single Job Factor and Predictors of Model and their Interactions
Time 1
Dependent
Independent Β SEβ Beta t-Values R2
(Adjusted) F-Values
Total Demands .33 .04 .33*** 8.09 Total Stressors Social Supports -.47 .03 -.60** -14.55 .80 800.08
Total Demands .50 .04 .42** 11.41 Job Strain Social Supports -.49 .03 -.52*** -14.10 .83 1011.89
Total Demands .20 .03 .33** 5.93 Job Anxiety Social Supports -.24 .02 -.49** -8.96 .63 3465.53
Total Demands 4.41 .41 .42*** 10.59 Job Dissatisfaction Social Supports -4.38 .33 -.52*** -13.21 .81 879.07
Total Demands .23 .05 .24** 4.13 Somatic Complaints Social Supports -.40 .04 -.53** -8.98 .57 269.48
Total Demands -.24 .03 -.34*** -7.14 Job Performance Social Supports .34 .02 .57** 12.61 .75 608.46
Total Demands 2.27 .50 .24* 4.55 Mastery Scale Social Supports -4.6 .39 -.61* -11.59 .67 410.82
Total Demands .18 .04 .23** 4.52 Negative Personality Social Supports -.38 .03 -.61*** -11.66 .67 412.74
Total Demands .49 .05 .38** 8.44 E. Turnover Intention Social Supports -.54 .04 -.53*** -11.79 .76 635.91
Total Demands .028 .03 .06* .72 Vigor Activity Social Supports -.04 .03 -.12* -1.36 .028 6.75
Total Demands .15 .03 .23** 3.95 Neuroticism Social Supports -.30 .03 -.57** -9.94 .61 304.35
Total Demands -.19 .04 -.26** -4.86 Job Participation Social Supports .32 .03 .56*** -10.33 .64 362.00
Total Demands -.25 .05 -.30*** -4.85 Job Consideration Social Supports .32 .04 .48*** 7.84 .56 250.96
NOTE: β = Unstandardized Co-efficient of Regression, SE β = Standard Errors in Beta (unstandardised) Beta= Standardized coefficients All Beta and F values are significance at ***p<.001 except Vigor

264
Appendix D10 (Time-1) Hierarchical Regression Analyses of Job Control and Social Supports Scales upon
A Single Job Factor and Predictors of Model and their Interactions Time 1
Dependent
Independent Β SEβ Beta t-Values R2
(Adjusted) F-Values
Total Control -.21 .03 -.24 -6.96 Total Stressors Social Supports -.55 .02 -.70 -20.39 .79 763.54***
Total Control -.26 .03 -.25 -7.89 Job Strain Social Supports -.65 .03 -.69 -21.21 .81 856.51**
Total Control -.08 .02 -.15 -3.32 Job Anxiety Social Supports -.32 .02 -.66 -14.12 .61 315.30***
Total Control -2.26 .31 -.25 -7.18 Job Dissatisfaction Social Supports -5.78 .28 -.68 -20.05 .79 751.37***
Total Control -.14 .04 -.17 -3.59 Somatic Complaints Social Supports -.46 .03 -.61 -12.48 .57 264.84**
Total Control .10 .02 .15 4.00 Job Performance Social Supports .43 .02 .73 18.88 .73 545.72**
Total Control -1.37 .35 -.16 -3.85 Mastery Scale Social Supports -5.17 .32 -.68 -15.87 .66 402.70**
Total Control -.13 .02 -.18 -4.27 Negative Personality Social Supports -.42 .02 -.67 -15.68 .67 409.56***
Total Control -.23 .04 -.20 -5.18 E. Turnover Intention Social Supports -.72 .04 -.70 -18.12 .73 557.37***
Total Control .01 .03 .028 .38 Vigor Activity Social Supports -.06 .02 -.20 -2.69 .027 6.56*
Total Control -.13 .02 -.23 -4.93 Neuroticism Social Supports -.31 .02 -.59 -12.73 .61 314.93***
Total Control .09 .02 .16 3.55 Job Participation Social Supports .37 .02 .67 14.77 .63 347.29**
Total Control .06 .03 .08 1.64 Job Consideration Social Supports .44 .03 .67 12.99 .53 228.68***
NOTE: β = Unstandardized Co-efficient of Regression, SE β = Standard Errors in Beta (unstandardised).
Beta= Standardized coefficients,

265
Appendix D11 (Time-1)
Hierarchical Regression Analyses of Job Demands, Job Control and Job Social Supports Scales upon A Single Job Factor and Predictor of Model and their Interactions.
Time 1
Dependent
Independent Β SEβ Beta t-Values
R2
(Adjusted) F-Values
Total Demands .26 .04 .26 5.85 Total Control -.13 .03 -.15 -4.30 Total
Stressors Social Supports -.43 .03 -.54 -13.02
.81 562.94***
Total Demands .42 .04 .35 8.95 Total Control -.15 .03 -.14 -4.33 Job
Strain Social Supports -.45 .03 -.48 -12.61
.84 710.98***
Total Demands .18 .03 .30 4.97 Total Control -.03 .02 -.05 -1.14 Job Anxiety
Scale Social Supports -.24 .02 -.48 -8.26
.63 4.98*
Total Demands 3.73 .45 .35 8.35 Total Control -1.20 .32 -.13 -3.79 Job
Dissatisfaction Social Supports -4.01 .34 -.48 -11.79
.82 610.46**
Total Demands .18 .06 .19 2.94 Total Control -.09 .04 -.11 -2.15 Somatic
Complaints Social Supports -.37 .04 -.50 -8.03
.58 182.83**
Total Demands -.22 .03 -.30 -5.97 Total Control .03 .02 .05 1.42 Job
Performance Social Supports .33 .02 .55 11.69
.75 407.40***
Total Demands .14 .04 .18 3.10 Total Control -.08 .03 -.13 -2.73 Mastery Scale Social Supports -.35 .03 -.57 -10.50
.68 282.07***
Total Demands 1.78 .54 .19 3.29 Total Control -.86 .38 -.10 -2.26 Negative
Personality Social Supports -4.33 .41 -.57 -10.52
.68 278.40**
Total Demands .43 .06 .33 8.86 Total Control -.10 .04 -.09 -2.27 E. Turnover
Intention Social Supports -.51 .04 -.49 -10.71
.76 430.07**

266
Dependent
Independent Β SEβ Beta t-
Values R2
(Adjusted) F-Values
Total Demands .04 .04 .09 .95 Total Control .02 .03 .06 .73 Vigor Activity
Scales Social Supports -.05 .03 -.14 -1.51
.027 4.67*
Total Demands .09 .04 ..14 2.22 Total Control -.11 .02 -.18 -3.66 Neuroticism
Scale Social Supports -.27 .03 -.51 -8.62
.61 213.06***
Total Demands -.16 .04 -.22 -3.75 Total Control .05 .03 .09 1.81 Job
Participation Social Supports .30 .03 .54 9.45
.64 243.49***
Total Demands -.26 .05 -.30 -4.56 Total Control -.01 .04 -.01 -.28 Job
Consideration Social Supports .32 .04 .485 7.58
.55 166.79**
NOTE: β = Unstandardized Co-efficient of Regression, SE β = Standard Errors in Beta (unstandardised).
Beta= Standardized coefficients Social Supports = (Supervisor Supports + Colleagues Supports) All Beta and F values are significance at ***p<.001 except Vigor Activity which is p<.05 or above. If the significance value of F is larger than say 0.05 then the independent variables do not explain
the variation in the dependent variable.

267
Appendix D12 (Time-1) Linear Regression Analyses of Job Stressors Scales upon A Single Job Factor of Job Strain
and Predictor of Model and their Interactions
Time 1
Independent
Dependent Β SEβ Beta t-Values R2
(Adjusted) F-Values
Job Stress Job Anxiety .47 .02 .76 23.21 .58 539.40*** Job Stress Job
Dissatisfaction 9.21 .25 .87 35.77 .76 1279.99***
Job Stress Somatic Complaints .72 .03 .76 23.47 .58 551.04**
Job Stress Job Performance -.60 .02 -.80 -26.72 .64 714.29**
Job Stress Mastery Scale 7.49 .29 .78 25.59 .62 654.84** Job Stress Negative
Personality .63 .02 .80 26.31 .63 692.37***
Job Stress E. Turnover Intention 1.07 .03 .82 29.13 .68 848.47***
Job Stress Vigor Activity .06 .02 .15 3.20 .02 10.28* Job Stress Neuroticism .50 .02 .75 22.69 .56 514.73** Job Stress Job
Participation -.53 .02 -.75 -22.57 .56 509.47**
Job Stress Job Consideration -.56 .03 -.67 -18.12 .45 328.48**
NOTE: β = Unstandardized Co-efficient of Regression, SE β = Standard Errors in Beta (unstandardised).
Beta= Standardized coefficients All Beta and F values are significance at ***p<.001 except Vigor Activity which is p<.05 or above. If the significance value of F is larger than say 0.05 then the independent variables do
not explain the variation in the dependent variable.

268
Appendix D13 (Time-1)
Linear Regression Analyses of Job Strain Scales upon A Single Job Factor and Predictor of Model and their Interactions
Time 1
Independent
Dependent Β SEβ Beta t-Values R2
(Adjusted) F-
Values Job Strain Job Anxiety .43 .01 .82 28.12 .66 790.93 Job Strain Job
Dissatisfaction 8.90 .03 .99 264.04 .99 69720
Job Strain Somatic Complaints .60 .02 .75 22.84 .56 521.93
Job Strain Job Performance -.54 .016 -.87 -35.10 .75 1232.23
Job Strain Mastery Scale 6.40 .24 .80 26.38 .63 685.83 Job Strain Negative
Personality .53 .02 .79 25.83 .62 667.22
Job Strain E. Turnover Intention 1.07 .01 .94 56.94 .89 3241.86
Job Strain Vigor Activity .06 .01 .17 3.57 .03 12.79 Job Strain Neuroticism .41 .01 .73 21.71 .54 471.44 Job Strain Job
Participation -.48 .01 -.80 -26.51 .64 702.76
Job Strain Job Consideration -.54 .02 -.75 -22.97 .57 527.74
β = Unstandardized Co-efficient of Regression, SE β = Standard Errors in Beta (unstandardised).
Beta= Standardized coefficients All Beta and F values are significance at ***p<.001 except Vigor Activity which is p<.05 or above. If the significance value of F is larger than say 0.05 then the independent variables do
not explain the variation in the dependent variable.

269
Appendix D14 (Time-1)
Hierarchical Regression Analyses of Job Stressors and Job Strain Scales upon A Single Job Factor and Predictor of Model and their Interactions
Time 1
Independent
Dependent Β SEβ Beta t-
Values R2
(Adjusted) F-Values
.10 .03 .16 2.73 Job Stress + Job Strain Job Anxiety .35 .03 .67 10.79 .67 405.57
-.46 .08 -.04 -5.55 Job Stress + Job Strain
Job Dissatisfaction 9.24 .07 1.03 132.43 .99 37472.38
.41 .06 .44 6.54 Job Stress + Job Strain
Somatic Complaints .29 .05 .36 5.40 .61 309.54
-.11 .03 -.15 -2.78 Job Stress + Job Strain
Job Performance -.46 .03 -.74 -14.02 .76 630.40
3.63 .59 .38 6.15 Job Stress + Job Strain Mastery Scale 3.69 .49 .46 7.40 .66 398.85
.35 .04 .44 7.18 Job Stress + Job Strain
Negative Personality .26 .04 .39 6.42 .67 401.58
-.06 .04 -.05 -1.35 Job Stress + Job Strain
E. Turnover Intention 1.08 .03 .98 27.75 .89 1625.21
.005 .05 .012 .11 Job Stress + Job Strain Vigor Activity .06 .03 .16 1.57 .026 6.38
.30 .04 .45 6.62 Job Stress + Job Strain Neuroticism .18 .03 .33 4.78 .58 282.90
-.14 .04 -.19 -3.03 Job Stress + Job Strain
Job Participation -.37 .03 -.62 -9.79 .64 363.17
-.02 .05 .02 -.27 Job Stress + Job Strain
Job Consideration -.52 .05 -.74 -10.45 .57 263.29
NOTE: β = Unstandardized Co-efficient of Regression, SE β = Standard Errors in Beta (unstandardised).
Beta= Standardized coefficients

270
Appendix A1 (Time-2) Linear Regression Analyses of Qualitative Demands Scale (of Total Demands) on various
Predictors of Model and their Interactions
Time 2
Independent
Dependent β SEβ Beta t-Values R2
(Adjusted) F-
Values Qualitative Demand
Total Demands .73 .02 .92 46.94 .85 2202.38
Qualitative Demand
Total Control -.70 .03 -.68 -18.50 .47 342.06
Qualitative Demand
Supervisor Supports -.76 .03 -.79 -25.32 .62 641.38
Qualitative Demand
Colleagues Supports -.52 .03 -.64 -16.30 .40 265.87
Qualitative Demand
Total Stressors .70 .02 .77 23.85 .60 569.13
Qualitative Demand
Job Strain .71 .02 .81 27.58 .66 760.98
Qualitative Demand Job Anxiety .42 .02 .70 18.87 .48 356.38 Qualitative Demand
Job Dissatisfaction 1.00 .03 .79 25.66 .63 658.60
Qualitative Demand
Somatic Complaints .64 .03 .71 19.91 .51 396.60
Note: β = Unstandardized Co-efficient of Regression, SE β = Standard Errors in Beta (unstandardised).
Beta= Standardized coefficients All Beta and F values are significance at p<.001.

271
Appendix A2 (Time-2) Linear Regression Analyses of Employees Demands Scale (of Total Demands) on various
Predictors of Model and their Interactions
Time 2
Independent
Dependent β SEβ Beta t-Values R2
(Adjusted) F-Values
Employees Demand
Total Demands ..81 .04 .71 20.15 .50 410.00
Employees Demand
Total Control -.73 .04 .54 -18.25 .39 333.06
Employees Demand
Supervisor Supports .96 .05 .69 19.12 .44 365.71
Employees Demand
Colleagues Supports -.54 .05 -.42 -10.80 .27 116.64
Employees Demand
Total Stressors .61 .02 .58 30.50 .61 930.25
Employees Demand
Job Strain .83 .02 .40 29.66 .55 765.44
Employees Demand Job Anxiety .71 .02 .46 23.66 .54 560.11 Employees Demand
Job Dissatisfaction .88 .03 .58 29.33 .58 860.00
Employees Demand
Somatic Complaints .75 .05 .68 14.87 .33 218.55
Note: β = Unstandardized Co-efficient of Regression, SE β = Standard Errors in Beta (unstandardised).
Beta= Standardized coefficients. All Beta and F values are significance at p<.001.

272
Appendix A3 (Time-2) Linear Regression Analyses of Workload Demands Scale (of Total Demands) on various
Predictors of Model and their Interactions
Time 2
Independent
Dependent β SEβ Beta t-Values R2
(Adjusted) F-
Values Workload Demand
Total Demands .65 .01 .94 54.91 .88 3015
Workload Demand
Total Control -.64 .03 -.72 -20.74 .53 430.28
Workload Demand
Supervisor Supports -.68 .02 -.81 -26.97 .65 727.96
Workload Demand
Colleagues Supports -.75 .05 -.64 -16.28 .44 304.15
Workload Demand
Total Stressors .65 .02 .81 27.44 .66 753.22
Workload Demand
Job Strain .64 .02 .84 30.40 .71 924.55
Workload Demand Job Anxiety .36 .01 .70 19.11 .49 365.54 Workload Demand
Job Dissatisfaction .91 .03 .82 28.27 .67 799.38
Workload Demand
Somatic Complaints .56 .02 .71 19.62 .50 384.96
Note: β = Unstandardized Co-efficient of Regression, SE β = Standard Errors in Beta (unstandardised). Beta= Standardized coefficients. All Beta and F values are significance at p<.001.

273
Appendix A4 (Time-2) Linear Regression Analyses of Conflicts Demands Scale (of Total Demands) on various Predictors
of Model and their Interactions
Time 2
Independent
Dependent β SEβ Beta t-Values R2
(Adjusted) F-
Values Conflicts Demand
Total Demands .81 .01 .92 46.40 .85 2153.34
Conflicts Demand
Total Control -.79 .04 -.71 -19.56 .50 382.81
Conflicts Demand
Supervisor Supports -.81 .03 -.76 -22.85 .57 522.16
Conflicts Demand
Colleagues Supports -.83 .06 -.60 -16.80 .39 264.15
Conflicts Demand
Total Stressors .79 .03 .78 24.87 .60 618.76
Conflicts Demand
Job Strain .78 .02 .81 27.18 .66 739.02
Conflicts Demand Job Anxiety .46 .02 .70 18.86 .48 355.95 Conflicts Demand
Job Dissatisfaction 1.10 .04 .78 25.01 .62 625.55
Conflicts Demand
Somatic Complaints .68 .03 .68 18.28 .46 334.20
NOTE: β = Unstandardized Co-efficient of Regression, SE β = Standard Errors in Beta (unstandardised). Beta= Standardized coefficients, All Beta and F values are significance at p<.001.

274
Appendix B1 (Time-2) Linear Regression Analyses of Qualitative Control Scale (of Total Control) on various
Predictors of Model and their Interactions
Time 2
Independent
Dependent β SEβ Beta t-Values
R2
(Adjusted) F-Values
Qualitative Control
Total Demands -.50 .02 -.73 -21.16 .54 448.14
Qualitative Control
Total Control .82 .01 .94 54.83 .88 3007.02
Qualitative Control
Supervisor Supports .58 .03 .70 19.23 .49 369.91
Qualitative Control
Colleagues Supports .59 .05 .56 15.31 .35 228.07
Qualitative Control
Total Stressors -.56 .02 -.72 -20.25 .51 410.13
Qualitative Control
Job Strain -.56 .02 -.76 -22.95 .58 526.90
Qualitative Control Job Anxiety -.35 .02 -.64 -15.46 .40 329.06 Qualitative Control
Job Dissatisfaction -.85 .03 -.75 -22.48 .57 505.38
Qualitative Control
Somatic Complaints -.48 .03 -.64 -16.15 .40 261.00
NOTE: β = Unstandardized Co-efficient of Regression, SE β = Standard Errors in Beta (unstandardised). Beta= Standardized coefficients, All Beta and F values are significance at p<.001.

275
Appendix B2 (Time-2) Linear Regression Analyses of Employees Control Scale (of Total Control) on various
Predictors of Model and their Interactions
Time 2
Independent
Dependent Β SEβ Beta t-Values R2
(Adjusted) F-Values
Employees Control
Total Demands -.51 .02 .67 -17.90 .45 320.27
Employees Control
Total Control .86 .02 .91 41.90 .82 1756.03
Employees Control
Supervisor Supports .55 .03 .61 15.09 .41 287.22
Employees Control
Colleagues Supports .51 .02 .53 13.08 .36 245.22
Employees Control
Total Stressors -.56 .03 -.67 -17.13 .43 293.68
Employees Control
Job Strain -.56 .03 -.68 -18.37 .46 337.58
Employees Control Job Anxiety -49 .05 -.50 -14.62 .37 248.55 Employees Control
Job Dissatisfaction -.82 .04 -.68 -18.54 .47 343.75
Employees Control
Somatic Complaints 1.03 .02 -.56 -14.32 .39 288.21
NOTE: β = Unstandardized Co-efficient of Regression, SE β = Standard Errors in Beta (unstandardised).
Beta= Standardized coefficients. All Beta and F values are significance at p<.001.

276
Appendix B3 (Time-2) Linear Regression Analyses of Workload Control Scale (of Total Control) on various
Predictors of Model and their Interactions
Time 2
Independent
Dependent β SEβ Beta t-Values
R2
(Adjusted) F-Values
Workload Control
Total Demands -.46 .02 -.71 -19.84 .51 393.85
Workload Control
Total Control .80 .01 .95 58.62 .90 3435.81
Workload Control
Supervisor Supports .53 .03 .67 17.59 .44 309.28
Workload Control
Colleagues Supports .55 .05 .48 10.93 .33 219.32
Workload Control
Total Stressors -.53 .02 -.71 -19.65 .50 386.35
Workload Control
Job Strain -.52 .02 -.72 -20.74 .53 430.20
Workload Control Job Anxiety -.28 .02 -.58 -13.98 .38 295.43 Workload Control
Job Dissatisfaction -.76 .03 -.73 -20.91 .53 437.22
Workload Control
Somatic Complaints -.45 .03 -.61 -15.00 .38 255.15
NOTE: β = Unstandardized Co-efficient of Regression, SE β = Standard Errors in Beta (unstandardised).
Beta= Standardized coefficients. All Beta and F values are significance at p<.001.

277
Appendix B4 (Time-2) Linear Regression Analyses of Conflicts Control Scale (of Total Control) on various
Predictors of Model and their Interactions
Time 2
Independent
Dependent Β SEβ Beta t-Values R2
(Adjusted) F-
Values Conflicts Control
Total Demands -.55 .03 -.65 -16.56 .41 274.41
Conflicts Control
Total Control .98 .02 .90 40.78 .81 1663.43
Conflicts Control
Supervisor Supports .64 .04 .62 15.46 .38 339.11
Conflicts Control
Colleagues Supports .38 .05 .51 13.45 .36 289.15
Conflicts Control
Total Stressors -.64 .03 -.68 -17.24 .43 297.24
Conflicts Control
Job Strain -.64 .03 -.68 -18.24 .46 332.74
Conflicts Control Job Anxiety -.35 .02 -.55 -13.19 .35 255.25 Conflicts Control
Job Dissatisfaction -.92 .05 -.67 -17.85 .45 318.74
Conflicts Control
Somatic Complaints -.56 .04 -.58 -14.09 .34 197.90
NOTE: β = Unstandardized Co-efficient of Regression, SE β = Standard Errors in Beta (unstandardised). Beta= Standardized coefficients. All Beta and F values are significance at p<.001.

278
Appendix C1 (Time-2) Linear Regression Analyses of Qualitative Stressors Scale (of Total Stressors) on various
Predictors of Model and their Interactions
Time 2
Independent
Dependent β SEβ Beta t-Values R2
(Adjusted) F-
Values Qualitative Stressors
Total Demands .49 .02 .73 20.81 .53 433.18
Qualitative Stressors
Total Control -.57 .03 -.67 -17.77 .45 315.98
Qualitative Stressors
Supervisor Supports -.62 .02 -.76 -22.99 .58 528.86
Qualitative Stressors
Colleagues Supports -.74 .04 -.63 -15.81 .39 250.04
Qualitative Stressors
Total Stressors .69 .01 .91 41.43 .82 1749.91
Qualitative Stressors
Job Strain .58 .02 .80 26.06 .64 679.25
Qualitative Stressors Job Anxiety .33 .01 .65 16.90 .42 285.59 Qualitative Stressors
Job Dissatisfaction .84 .03 .79 25.55 .63 653.02
Qualitative Stressors
Somatic Complaints .56 .02 .74 21.52 .54 463.17
NOTE: β = Unstandardized Co-efficient of Regression, SE β = Standard Errors in Beta (unstandardised).
Beta= Standardized coefficients. All Beta and F values are significance at ***p<.001.

279
Appendix C2 (Time-2) Linear Regression Analyses of Employees Stressors Scale (of Total Stressors) on various
Predictors of Model and their Interactions
Time 2
Independent
Dependent β SEβ Beta t-Values R2
(Adjusted) F-
Values Employees Stressors
Total Demands .66 .03 .71 19.71 .50 388.39
Employees Stressors
Total Control -.75 .04 -.65 -16.61 .42 275.71
Employees Stressors
Supervisor Supports -.83 .04 -.73 -20.87 .53 435.82
Employees Stressors
Colleagues Supports -.97 .06 -.60 -14.77 .35 218.17
Employees Stressors
Total Stressors .92 .02 .86 33.67 .75 1133.72
Employees Stressors
Job Strain .77 .03 .75 22.70 .57 518.51
Employees Stressors Job Anxiety .46 .02 .66 17.13 .43 293.49 Employees Stressors
Job Dissatisfaction 1.11 .05 .75 22.22 .56 493.82
Employees Stressors
Somatic Complaints .65 .04 .62 15.44 .38 239.51
NOTE: β = Unstandardized Co-efficient of Regression, SE β = Standard Errors in Beta (unstandardised).
Beta= Standardized coefficients. All Beta and F values are significance at ***p<.001.

280
Appendix C3 (Time-2) Linear Regression Analyses of Workload Stressors Scale (of Total Stressors) on various
Predictors of Model and their Interactions
Time 2
Independent
Dependent β SEβ Beta t-Values R2
(Adjusted) F-
Values Workload Stressors
Total Demands .58 .02 .75 22.81 .57 520.55
Workload Stressors
Total Control -.67 .03 -.68 -18.30 .46 335.07
Workload Stressors
Supervisor Supports -.72 .03 -.76 -23.21 .58 538.82
Workload Stressors
Colleagues Supports -.45 .03 -.57 -13.71 .33 187.97
Workload Stressors
Total Stressors .97 .01 .90 40.97 .82 1678.97
Workload Stressors
Job Strain .68 .02 .80 26.40 .64 697.15
Workload Stressors Job Anxiety .37 .02 .65 16.65 .42 277.24 Workload Stressors
Job Dissatisfaction .98 .03 .80 25.73 .63 662.08
Workload Stressors
Somatic Complaints .61 .03 .70 19.08 .48 264.40
NOTE: β = Unstandardized Co-efficient of Regression, SE β = Standard Errors in Beta (unstandardised).
Beta= Standardized coefficients. All Beta and F values are significance at ***p<.001.

281
Appendix C4 (Time-2) Linear Regression Analyses of Conflicts Stressors Scale (of Total Stressors) on various
Predictors of Model and their Interactions
Time 2
Independent
Dependent Β SEβ Beta t-Values R2
(Adjusted) F-
Values Conflicts Stressors
Total Demands .61 .02 .76 22.90 .58 524.60
Conflicts Stressors
Total Control -.67 .03 -.65 -17.05 .43 290.75
Conflicts Stressors
Supervisor Supports -.77 .03 -.79 -24.86 .61 618.08
Conflicts Stressors
Colleagues Supports -.85 .05 -.61 -15.07 .37 226.55
Conflicts Stressors
Total Stressors .83 .02 .90 40.92 .81 1673.30
Conflicts Stressors
Job Strain .70 .02 .80 25.87 .63 669.50
Conflicts Stressors Job Anxiety .41 .02 .67 17.68 .45 312.87 Conflicts Stressors
Job Dissatisfaction 1.02 .04 .79 25.67 .63 659.11
Conflicts Stressors
Somatic Complaints .64 .03 .70 19.22 .49 369.46
NOTE: β = Unstandardized Co-efficient of Regression, SE β = Standard Errors in Beta (unstandardised).
Beta= Standardized coefficients. All Beta and F values are significance at ***p<.001.

282
Appendix D1 (Time-2) Linear Regression Analyses of Sub-Set of Demands Scale on various Predictors of Model
and their Interactions with Sub-Set Control and Stressors.
Time 2
Independent
Dependent Β SEβ Beta t-Values R2
(Adjusted) F-
Values Qualitative Demands
Qualitative Control -.78 .04 -.67 -19.5 .45 319.31
Employees Demands
Employees Control -.49 .03 -.45 -12.25 .30 158.25
Workload Demands
Workload Control -.73 .03 -.70 -18.76 .47 351.05
Conflicts Demands
Conflicts Control -.63 .04 -.61 -15.75 .37 223.75
Qualitative Demands
Qualitative Stressors .82 .04 .69 18.74 .47 351.16
Employees Demands
Employees Stressors .60 .03 .41 10.14 .28 137.13
Workload Demands
Workload Stressors .67 .03 .75 22.00 .56 484.42
Conflicts Demands
Conflicts Stressors .78 .03 .72 20.34 .52 413.75
Qualitative Control
Qualitative Stressors -.65 .04 -.64 -16.28 .41 265.05
Employees Control
Employees Stressors -.44 .03 -.56 -13.12 .31 172.71
Workload Control
Workload Stressors -.55 .03 -.65 -16.68 .42 278.25
Conflicts Control
Conflicts Stressors -.61 .04 -.58 -13.84 .33 191.65
NOTE: β = Unstandardized Co-efficient of Regression, SE β = Standard Errors in Beta (unstandardised).
Beta= Standardized coefficients. All Beta and F values are significance at ***p<.001.

283
Appendix D2 (Time-2) Hierarchical Regression Analyses of Sub-Set of Total Demands and Total Control Factors on
various Predictors of Model and their Interactions
Time 2
Dependent
Independent Β SEβ Beta t-Values
R2
(Adjusted) F-Values
Qualitative .19 .05 .21 3.86 Employees .12 .04 .12 1.40 Workload .32 .05 .40 6.43
1-Demands
Conflicts .27 .05 .26 4.69
.70 226.75
Qualitative -.25 .05 -.32 -4.36 Employees -.11 .05 -.12 -1.95 Workload -.17 .05 -.23 -2.96
Total Stressors
2-Control
Conflicts -.12 .06 -.11 -1.87
.55 119.69
Qualitative .25 .04 .29 5.84 Employees .12 .03 .14 1.13 Workload .28 .04 .37 6.66
1-Demands
Conflicts .25 .04 .25 5.07
.75 301.89
Qualitative -.32 .05 -.43 -6.13 Employees -.10 .04 -.12 -2.15 Workload -.12 .05 -.17 -2.31
Job Strain
2-Control
Conflicts -.09 .05 -.11 -1.72
.60 147.27
Qualitative .16 .04 .27 3.93 Employees .05 .03 .05 1.47 Workload .12 .04 .22 2.89
1-Demands
Conflicts .17 .04 .26 3.75
.54 114.12
Qualitative -.21 .04 -.42 -4.77 Employees -
.011 .04 -.05 -.26
Workload -.06 .04 -.12 -1.36
Job Anxiety
2-Control
Conflicts -.06 .04 -.10 -1.37
.39 62.33

284
Dependent
Independent Β SEβ Beta t-Values
R2
(Adjusted) F-
Values
DependentQualitative .35 .06 .28 5.28 Employees .11 .06 .10 1.17 Workload .43 .07 .38 6.39
1-Demands
Conflicts .32 .06 .23 4.22
.72 248.08
Qualitative -.43 .07 -.40 -5.60 Employees -.17 .07 -.14 -2.42 Workload -.21 .07 -.21 -2.80
Job Dissatisfaction
2-Control
Conflicts -.11 .08 -.08 -1.36
.60 144.16
Qualitative .31 .06 .34 5.09 Employees .11 .06 .09 1.13 Workload .20 .05 .25 3.36
1-Demands
Conflicts .18 .06 .18 2.59
.55 118.09
Qualitative -.28 .06 -.37 -4.42 Employees -.11 .06 -.15 -.21 Workload -.12 .06 -.16 -1.17
Somatic Symptoms
2-Control
Conflicts -.14 .07 -.14 -2.00
.42 7.38
NOTE: β = Unstandardized Co-efficient of Regression, SE β = Standard Errors in Beta (unstandardised).
Beta= Standardized coefficients. All Beta and F values are significance at ***p<.001. Predictor Vigor Activity has been ignored in Time 2 study because of non-significance relationship.

285
Appendix D3 (Time-2) Linear Regression Analyses of Job Demands Scales upon A Single Job Factor and Predictor
of Model and their Interactions
Time 2
Independent
Dependent Β SEβ Beta t-Values
R2
(Adjusted) F-Values
Total Demands Total Stressors .94 .03 .82 28.75 .68 826.59
Total Demands Job Strain .94 .02 .86 32.57 .73 1061.25
Total Demands Job Anxiety .55 .02 .73 21.14 .54 447.02 Total Demands Job
Dissatisfaction 1.32 .04 .83 29.71 .70 883.09
Total Demands Somatic Complaints .82 .03 .73 21.01 .53 441.41
Total Demands Job Performance -1.02 .03 -.81 -27.68 .66 766.64
Total Demands Mastery Scale .79 .03 .73 21.08 .53 444.39 Total Demands Negative
Personality .73 .03 .78 24.28 .60 589.77
Total Demands E. Turnover Intention 1.30 .04 .84 31.43 .72 988.03
Total Demands Neuroticism .57 .02 .73 21.38 .54 457.19 Total Demands Job
Participation -.72 .02 -.78 -24.79 .61 614.93
Total Demands Job Consideration -.58 .03 -.70 -19.32 .49 373.32
NOTE: β = Unstandardized Co-efficient of Regression, SE β = Standard Errors in Beta (unstandardised).
Beta= Standardized coefficients. All Beta and F values are significance at ***p<.001. Predictor Vigor Activity has been ignored in Time 2 study because of non-significance relationship.

286
Appendix D4 (Time-2) Linear Regression Analyses of Job Control Scales upon A Single Job Factor and Predictor
of Model and their Interactions
Time 2
Independent
Dependent Β SEβ Beta t-Values R2
(Adjusted) F-
Values Total Control Total
Stressors -.66 .03 -.74 -21.80 .55 475.36
Total Control Job Strain -.66 .02 -.77 -23.88 .60 570.59
Total Control Job Anxiety -.36 .02 -.62 -15.39 .38 236.91
Total Control Job Dissatisfaction -.96 .04 -.77 -23.73 .59 563.10
Total Control Somatic Complaints -.56 .03 -.64 -16.46 .41 270.94
Total Control Job Performance .69 .03 .70 19.23 .49 370.13
Total Control Mastery Scale -.56 .03 -.65 -17.14 .43 294.08
Total Control Negative Personality -.52 .02 -.70 -19.20 .49 368.82
Total Control E. Turnover Intention -.88 .04 -.73 -21.47 .54 461.03
Total Control Neuroticism -.41 .02 -.66 -17.42 .44 303.65
Total Control Job Participation .51 .02 .70 19.29 .49 372.20
Total Control Job Consideration .38 .02 .58 14.29 .34 204.39
NOTE: β = Unstandardized Co-efficient of Regression, SE β = Standard Errors in Beta (unstandardised).
Beta= Standardized coefficients. All Beta and F values are significance at ***p<.001.

287
Appendix D5 (Time-2) Linear Regression Analyses of Job Supervisory Supports Scales upon A Single Job Factor
and Predictor of Model and their Interactions Time 2
Independent
Dependent Β SEβ Beta t-
Values R2
(Adjusted) F-Values
Supervisor Support
Total Stressors -.79 .02 -.85 -31.67 .72 1003.35
Supervisor Support
Job Strain -.78 .02 -.86 -34.56 .75 1194.15
Supervisor Support Job Anxiety -.48 .02 -.77 -23.96 .60 574.51 Supervisor Support
Job Dissatisfaction -1.09 .03 -.84 -29.98 .70 898.84
Supervisor Support
Somatic Complaints -.70 .03 -.75 -22.25 .56 495.13
Supervisor Support
Job Performance .87 .02 .84 30.68 .71 941.29
Supervisor Support Mastery Scale -.67 .03 -.74 -22.14 .56 490.29 Supervisor Support
Negative Personality -.60 .02 -.78 -24.31 .60 591.39
Supervisor Support
E. Turnover Intention -1.09 .03 -.87 -34.68 .75 1203.09
Supervisor Support Neuroticism -.46 .02 -.73 -20.80 .52 432.69 Supervisor Support
Job Participation .61 .02 .80 26.61 .64 708.33
Supervisor Support
Job Consideration .87 .02 .71 20.28 .51 411.27
NOTE: β = Unstandardized Co-efficient of Regression, SE β = Standard Errors in Beta (unstandardised).
Beta= Standardized coefficients. All Beta and F values are significance at ***p<.001.

288
Appendix D6 (Time-2) Linear Regression Analyses of Job Colleagues Scales upon A Single Job Factor and Predictor
of Model and their Interactions Time 2
Independent
Dependent Β SEβ Beta t-
Values R2
(Adjusted) F-Values
Colleagues Supports
Total Stressors -.45 .02 -.69 -18.90 .48 357.80
Colleagues Supports
Job Strain -.42 .02 -.66 -17.49 .44 306.03
Colleagues Supports Job Anxiety -.23 .01 -.54 -12.68 .29 160.93 Colleagues Supports
Job Dissatisfaction -.61 .03 -.66 -17.27 .43 298.52
Colleagues Supports
Somatic Complaints -.36 .02 -.56 -13.31 .31 177.32
Colleagues Supports
Job Performance .45 .09 .62 15.60 .39 243.49
Colleagues Supports Mastery Scale -.35 .02 -.57 -13.51 .32 182.61 Colleagues Supports
Negative Personality -.32 .02 -.60 -14.68 .36 215.73
Colleagues Supports
E. Turnover Intention -.58 .03 -.66 -17.33 .43 300.38
Colleagues Supports Neuroticism -.25 .01 -.56 -13.30 .31 178.93 Colleagues Supports
Job Participation -.31 .02 .59 14.46 .35 209.21
Colleagues Supports
Job Consideration .25 .02 .53 12.31 .28 151.59
NOTE: β = Unstandardized Co-efficient of Regression, SE β = Standard Errors in Beta (unstandardised).
Beta= Standardized coefficients. All Beta and F values are significance at ***p<.001.

289
Appendix D7 (Time-2) Linear Regression Analyses of Job Social Supports Scales upon A Single Job Factor and
Predictor of Model and their Interactions Time 2
Independent
Dependent Β SEβ Beta t-
Values R2
(Adjusted) F-Values
Social Supports Total Stressors -.73 .04 -.66 -17.51 .44 306.82
Social Supports Job Strain -.71 .04 -.67 -17.89 .45 319.28
Social Supports Job Anxiety -.44 .03 -.60 -14.72 .36 216.89 Social Supports Job
Dissatisfaction -.99 .06 -.64 -16.51 .42 272.52
Social Supports Somatic Complaints -.63 .04 -.58 -13.96 .33 195.06
Social Supports Job Performance .83 .04 .68 18.46 .47 340.76
Social Supports Mastery Scale -.62 .04 -.59 -14.38 .35 207.00 Social Supports Negative
Personality -.57 .03 -.63 -15.80 .39 249.92
Social Supports E. Turnover Intention -1.02 .05 -.68 -18.71 .47 350.11
Social Supports Neuroticism -.45 .03 -.60 -14.76 .36 217.96 Social Supports Job
Participation .58 .03 .64 16.66 .42 277.64
Social Supports Job Consideration .46 .03 .58 14.02 .34 196.73
NOTE: β = Unstandardized Co-efficient of Regression, SE β = Standard Errors in Beta (unstandardised).
Beta= Standardized coefficients. All Beta and F values are significance at ***p<.001. Social Support = Supervisor Support + Colleague Support. Predictor Vigor Activity has been ignored in Time 2 study because of non-significance relationship.

290 Appendix D8 (Time-2)
Hierarchical Regression Analyses of Job Stressors and Job Strain Scales upon A Single Job Factor and Predictors of Model and their Interactions
Time 2
Dependent
Independent Β SEβ Beta t-Values R2
(Adjusted) F-
Values Total Demands .69 .04 .61 14.98 Total
Stressors Total Control -.25 .03 -.28 -6.90 .72 487.20
Total Demands .69 .04 .63 17.24 Job Strain Total Control -.25 .03 -.29 -8.11 .77 652.78
Total Demands .46 .03 .62 11.95 Job Anxiety Total Control -.09 .03 -.15 -2.92 .54 232.15
Total Demands .93 .06 .59 15.05 Job Dissatisfaction Total Control .42 .03 -.33 -8.50 .74 559.22
Total Demands .64 .05 .58 11.07 Somatic Complaints Total Control -.19 .04 -.21 -4.12 .55 238.83
Total Demands -.84 .05 -.66 -15.35 Job Performance Total Control .19 .04 .20 4.61 .68 414.12
Total Demands .59 .05 .54 10.73 Mastery Scale Total Control -.21 .04 -.24 -4.85 .56 246.93
Total Demands .54 .04 .58 12.47 Negative Personality Total Control -.19 .03 -.26 -5.67 .63 334.76
Total Demands 1.03 .06 .67 17.26 E. Turnover Intention Total Control -.28 .03 -.23 -5.96 .74 556.06
Total Demands .42 .03 .54 10.83 Neuroticism Total Control -.15 .03 -.25 -5.01 .56 255.53
Total Demands -.54 .04 -.59 -12.87 Job Participation Total Control .18 .03 .25 5.57 .64 246.94
Total Demands -.49 .04 -.59 -10.94 Job Consideration Total Control .09 .03 .14 2.60 .49 192.85
NOTE: β = Unstandardized Co-efficient of Regression, SE β = Standard Errors in Beta (unstandardised).
Beta= Standardized coefficients. All Beta and F values are significance at ***p<.001.

291 Appendix D9 (Time-2)
Hierarchical Regression Analyses of Job Demands and Job Social Supports Scales upon A Single Job Factor and Predictors of Model and their Interactions
Time 2
Dependent
Independent Β SEβ Beta t-Values R2
(Adjusted) F-
Values Total Demands .77 .04 .67 19.08 Total
Stressors Social Supports -.25 .03 -.23 -6.52 .71 479.20
Total Demands .79 .03 .72 22.18 Job Strain Social Supports -.22 .03 -.21 -6.50 .76 608.68
Total Demands .44 .03 .59 13.50 Job Anxiety Social Supports -.16 .03 -.22 -5.09 .56 250.88
Total Demands 1.13 .05 .71 20.25 Job Dissatisfaction Social Supports -.28 .05 -.18 -5.25 .71 485.70
Total Demands .69 .05 .61 13.77 Somatic Complaints Social Supports -.21 .04 -.19 -4.27 .55 239.58
Total Demands -.81 .04 -.64 -17.90 Job Performance Social Supports .33 .04 .27 7.71 .71 471.19
Total Demands .65 .04 .60 13.62 Mastery Scale Social Supports -.21 .04 -.21 -4.72 .56 245.60
Total Demands .60 .03 .64 15.86 Negative Personality Social Supports -.20 .03 -.21 -5.44 .63 331.57
Total Demands 1.05 .05 .69 21.01 E. Turnover Intention Social Supports -.37 .04 -.25 -7.57 .75 594.82
Total Demands .46 .03 .60 13.72 Neuroticism Social Supports -.16 .03 -.22 -5.03 .57 255.69
Total Demands -.57 .03 -.62 -15.97 Job Participation Social Supports .22 .03 .25 6.25 .65 357.59
Total Demands -.46 .03 -.55 -12.16 Job Consideration Social Supports .18 .03 .22 4.87 .52 209.52
NOTE: β = Unstandardized Co-efficient of Regression, SE β = Standard Errors in Beta (unstandardised). Beta= Standardized coefficients. All Beta and F values are significance at ***p<.001.
Predictor Vigor Activity has been ignored in Time 2 study because of non-significance relationship.

292 Appendix D10 (Time-2)
Hierarchical Regression Analyses of Job Stressors and Job Strain Scales upon A Single Job Factor and Predictors of Model and their Interactions
Time 2
Dependent
Independent Β SEβ Beta t-Values R2
(Adjusted) F-
Values Total Control -.49 .02 -.55 -17.07 Total
Stressors Social Supports -.45 .03 -.41 -12.62 .68 414.74
Total Control -.51 .02 -.58 -19.36 Job Strain Social Supports -.42 .03 -.40 -13.23 .72 501.64
Total Control -.25 .02 -.43 -10.66 Job Anxiety Social Supports -.29 .03 -.40 -9.88 .51 196.97
Total Control -.75 .04 -.60 -19.00 Job Dissatisfaction Social Supports -.56 .04 -.36 -11.52 .70 444.12
Total Control -.42 .03 -.47 -11.86 Somatic Complaints Social Supports -.39 .04 -.35 -8.92 .51 203.10
Total Control .48 .03 .48 14.40 Job Performance Social Supports .56 .04 .45 13.58 .65 365.09
Total Control -.41 .03 -.48 -12.48 Mastery Scale Social Supports -.38 .04 -.36 -9.30 .53 222.83
Total Control -.38 .02 -.52 -14.39 Negative Personality Social Supports -.35 .03 -.38 -10.67 .60 295.21
Total Control -.64 .03 -.53 -16.84 E. Turnover Intention Social Supports -.65 .04 -.44 -14.00 .70 444.94
Total Control -.30 .02 -.49 -12.71 Neuroticism Social Supports -.28 .02 -.37 -9.67 .54 234.92
Total Control .37 .02 .51 14.45 Job Participation Social Supports .37 .03 .41 11.61 .62 317.85
Total Control .26 .02 .40 9.68 Job Consideration Social Supports .31 .03 .39 9.35 .46 168.78
NOTE: β = Unstandardized Co-efficient of Regression, SE β = Standard Errors in Beta (unstandardised). Beta= Standardized coefficients. All Beta and F values are significance at ***p<.001.
Predictor Vigor Activity has been ignored in Time 2 study because of non-significance relationship.

293
Appendix D11 (Time-2) Hierarchical Regression Analyses of Job Demands, Job Control and Job Social Supports
Scales upon A Single Job Factor and Predictor of Model and their Interactions. Time 2
Dependent
Independent Β SEβ Beta t-
Values R2
(Adjusted) F-
Values Total Demands .51 .05 .45 10.23 Total Control -.26 .03 -.29 -7.57 Total
Stressors Social Supports -.26 .03 -.23 -7.21
.74 385.14
Total Demands .53 .04 .48 12.26 Total Control -.26 .03 -.30 -8.89 Job
Strain Social Supports -.23 .03 -.22 -7.41
.80 514.37
Total Demands .35 .04 .46 8.09 Total Control -.09 .03 -.16 -3.18 Job Anxiety
Scale Social Supports -.16 .03 -.22 -5.24
.57 174.59
Total Demands .72 .06 .45 10.62 Total Control -.42 .04 -.33 -9.09 Job
Dissatisfaction Social Supports -.30 .05 -.19 -6.05
.76 419.69
Total Demands .49 .06 .43 7.59 Total Control -.19 .04 -.22 -4.42 Somatic
Complaints Social Supports -.21 .04 -.19 -4.50
.57 174.01
Total Demands -.60 .05 -.47 -10.34 Total Control .20 .04 .21 5.24 Job
Performance Social Supports .34 .04 .22 8.13
.72 344.85
Total Demands .43 .06 .40 7.08 Total Control -.21 .04 -.25 -5.15 Mastery Scale Social Supports -.22 .04 -.21 -5.05
.58 183.47
Total Demands .40 .04 .42 8.34 Total Control -.20 .03 -.22 -6.09 Negative
Personality Social Supports -.02 .03 -.27 -5.87
.66 254.14
Total Demands .77 .06 .50 12.11 Total Control -.29 .04 -.24 -6.70 E. Turnover
Intention Social Supports -.37 .04 -.25 -8.19
.78 456.87

294
Dependent
Independent Β SEβ Beta t-Values
R2
(Adjusted) F-
Values Total Demands .31 .04 .39 7.05 Total Control -.16 .03 -.26 -5.36 Neuroticism
Scale Social Supports -.17 .03 -.22 -5.37
.60 192.33
Total Demands -.39 .04 -.42 -8.43 Total Control .19 .03 .26 6.09 Job
Participation Social Supports .22 .03 .25 6.73
.68 273.12
Total Demands -.36 .05 -.44 -7.28 Total Control .09 .03 .05 2.83 Job
Consideration Social Supports .18 .03 .22 5.00
.53 144.92
Appendix D12 (Time-2)
Linear Regression Analyses of Job Stressors Scales upon A Single Job Factor of Job Strain and Predictor of Model and their Interactions
Time 2
Independent
Dependent Β SEβ Beta t-Values R2
(Adjusted) F-
Values Job Stress Job Anxiety .48 .02 .73 21.18 .54 448.77 Job Stress Job
Dissatisfaction 1.22 .03 .87 35.82 .76 1283.27
Job Stress Somatic Complaints .74 .03 .77 24.07 .60 579.72
Job Stress Job Performance -.90 .03 -.81 -27.25 .66 742.57
Job Stress Mastery Scale .71 .03 .75 22.65 .56 513.17 Job Stress Negative
Personality .66 .02 .80 26.20 .64 686.56
Job Stress E. Turnover Intention 1.06 .03 .86 33.24 .74 1105.23
Job Stress Neuroticism .52 .02 .75 22.64 .57 512.63 Job Stress Job
Participation -.63 .02 -.78 -24.94 .62 622.36
Job Stress Job Consideration .50 .02 -.69 -18.75 .48 351.50
NOTE: β = Unstandardized Co-efficient of Regression, SE β = Standard Errors in Beta (unstandardised).

295
Appendix D13 (Time-2) Linear Regression Analyses of Job Strain Scales upon A Single Job Factor and Predictor
of Model and their Interactions.
Time 2
Independent
Dependent Β SEβ Beta t-Values R2
(Adjusted) F-
Values Job Strain Job Anxiety .54 .02 .78 24.90 .61 620.19 Job Strain Job
Dissatisfaction 1.14 .01 .97 82.56 .94 6817.46
Job Strain Somatic Complaints .81 .03 .78 24.66 .61 608.49
Job Strain Job Performance -.98 .03 -.86 -32.91 .74 1083.44
Job Strain Mastery Scale .76 .03 .77 23.87 .60 570.07 Job Strain Negative
Personality .70 .02 .81 27.17 .66 738.52
Job Strain E. Turnover Intention 1.34 .02 .96 68.01 .92 4625.85
Job Strain Neuroticism .54 .02 .76 23.33 .58 544.59 Job Strain Job
Participation -.70 .02 -.82 -28.72 .68 825.09
Job Strain Job Consideration -.56 .02 -.74 -21.75 .55 473.16
NOTE: β = Unstandardized Co-efficient of Regression, SE β = Standard Errors in Beta (unstandardised).
Beta= Standardized coefficients. All Beta and F values are significance at ***p<.001. Predictor Vigor Activity has been ignored in Time 2 study because of non-significance relationship.

296
Appendix D14 (Time-2) Hierarchical Regression Analyses of Job Stressors and Job Strain Scales upon A Single
Job Factor and Predictor of Model and their Interactions Time 2
Independent
Dependent Β SEβ Beta t-
Values R2
(Adjusted) F-Values
.12 .04 .18 2.71 Job Stress + Job Strain Job Anxiety
.42 .04 .62 9.37 .62 318.91
.11 .03 .08 3.20 Job Stress + Job Strain
Job Dissatisfaction 1.31 .03 .90 36.34 .94 3495.81
.37 .06 .38 5.84 Job Stress + Job Strain
Somatic Complaints .46 .06 .44 6.88 .64 347.52
-.26 .06 -.23 -4.38 Job Stress + Job Strain
Job Performance -.74 .06 -.64 -11.98 .75 576.94
.31 .06 .33 4.97 Job Stress + Job Strain Mastery Scale
.47 .06 .47 7.14 .62 314.88
.31 .05 .38 6.30 Job Stress + Job Strain
Negative Personality .40 .05 .48 7.80 .69 426.16
.07 .04 .05 1.82 Job Stress + Job Strain
E. Turnover Intention 1.27 .04 .91 30.37 .92 2328.44
.25 .04 .36 5.33 Job Stress + Job Strain Neuroticism
.32 .04 .44 6.62 .61 305.83
-.21 .04 -.25 -4.27 Job Stress + Job Strain
Job Participation -.50 .05 -.59 -9.98 .70 440.17
-.11 .05 -.16 -2.16 Job Stress + Job Strain
Job Consideration -.45 .05 -.60 -8.34 .55 241.15
NOTE: β = Unstandardized Co-efficient of Regression, SE β = Standard Errors in Beta (unstandardised).
Beta= Standardized coefficients. All Beta and F values are significance at ***p<.001. Predictor Vigor Activity has been ignored in Time 2 study because of non-significance relationship.

297
Appendix A1 (Time-1 & 2) Linear Regression Analyses of Qualitative Demands Scale (of Total Demands) on various Predictors of Model and their
Interactions.
Time 1 Time 2
Independent
Dependent β SEβ Beta t-Values
R2
(Adjusted) F-Values β SEβ Beta t-Values
R2
(Adjusted) F-Values
Qualitative Demand
Total Demands .75 .015 .93*** 51.26 .87 2627.74*** .73 .01 .92 46.94 .85 2202.38
Qualitative Demand
Total Control -.65 .033 -.70** -19.71 .50 388.116*** -.70 .03 -.68 -18.50 .47 342.06
Qualitative Demand
Supervisor Supports -.68 .026 -.80** -26.15 .63 683.56*** -.76 .03 -.79 -25.32 .62 641.38
Qualitative Demand
Colleagues Supports -.93 .04 -
.76***-23.34 .58 544.90*** -.52 .03 -.64 -16.30 .40 265.87
Qualitative Demand
Total Stressors .63 .025 .79** 25.38 .62 649.26** .70 .02 .77 23.85 .60 569.13
Qualitative Demand
Job Strain .78 .027 .82*** 28.53 .67 813.76*** .71 .02 .81 27.58 .66 760.98
Qualitative Demand Job Anxiety .36 .017 .72*** 20.48 .51 449.75*** .42 .02 .70 18.87 .48 356.38 Qualitative Demand
Job Dissatisfaction .85 .025 .81* 27.37 .65 749.00** 1.00 .03 .79 25.66 .63 658.60
Qualitative Demand
Somatic Complaints .53 .027 .69** 19.05 .47 362.90** .64 .03 .71 19.91 .51 396.60
NOTE: β = Unstandardized Co-efficient of Regression, SE β = Standard Errors in Beta (unstandardised).
Beta= Standardized coefficients. All Beta and F values are significance at ***p<.001. Predictor Vigor Activity has been ignored in Time 2 study because of non-significance relationship.

298
Appendix A2 (Time-1 & 2) Linear Regression Analyses of Employees Demands Scale (of Total Demands) on various Predictors of Model and their
Interactions
Time 1 Time 2
Independent
Dependent β SEβ Beta t-Values
R2
(Adjusted) F-Values Β SEβ Beta t-Values
R2
(Adjusted) F-
Values Employees Demand
Total Demands .95 .03 .86*** 33.34 .74 1111.67*** ..81 .04 .71 20.15 .50 410.00
Employees Demand
Total Control -.90 .05 .66** -17.65 .44 311.76*** -.73 .04 .54 -18.25 .39 333.06
Employees Demand
Supervisor Supports -.87 .046 -
.68*** -18.76 .47 351.85*** .96 .05 .69 19.12 .44 365.71 Employees Demand
Colleagues Supports -1.16 .06 -.65** -17.00 .42 289.29** -.54 .05 -.42 -10.80 .27 116.64
Employees Demand
Total Stressors .80 .043 .68* 18.48 .47 341.65** .61 .02 .58 30.50 .61 930.25
Employees Demand
Job Strain .96 .051 .69*** 19.12 .48 365.71*** .83 .02 .40 29.66 .55 765.44
Employees Demand Job Anxiety .45 .029 .61** 15.31 .37 234.47** .71 .02 .46 23.66 .54 560.11 Employees Demand
Job Dissatisfaction 8.49 .45 .68* 18.53 .46 343.40** .88 .03 .58 29.33 .58 860.00
Employees Demand
Somatic Complaints .60 .047 .54** 12.88 .29 165.97** .75 .05 .68 14.87 .33 218.55
NOTE: β = Unstandardized Co-efficient of Regression, SE β = Standard Errors in Beta (unstandardised). Beta= Standardized coefficients. All Beta and F values are significance at ***p<.001.
Predictor Vigor Activity has been ignored in Time 2 study because of non-significance relationship.

299
Appendix A3 (Time-1 & 2)
Linear Regression Analyses of Workload Demands Scale (of Total Demands) on various Predictors of Model and their Interactions.
Time 1 Time 2
Independent
Dependent β SEβ Beta t-
Values R2
(Adjusted) F-Values β SEβ Beta t-Values
R2
(Adjusted) F-
Values Workload Demand
Total Demands .87 .014 .95*** 63.37 .91 4015.76*** .65 .01 .94 54.91 .88 3015
Workload Demand
Total Control -.78 .03 -
.75*** -22.45 .56 504.17*** -.64 .03 -.72 -20.74 .53 430.28
Workload Demand
Supervisor Supports -.77 .03 -.79** -26.02 .63 677.03*** -
.68 .02 -.81 -26.97 .65 727.96
Workload Demand
Colleagues Supports
-1.06 .044 -.77** -24.20 .59 585.59** -
.75 .05 -.64 -16.28 .44 304.15 Workload Demand
Total Stressors .72 .028 .79*** 25.87 .63 669.06*** .65 .02 .81 27.44 .66 753.22
Workload Demand
Job Strain .89 .03 .83** 29.25 .68 855.49*** .64 .02 .84 30.40 .71 924.55
Workload Demand Job Anxiety .39 .020 .69** 19.30 .48 372.33*** .36 .01 .70 19.11 .49 365.54 Workload Demand
Job Dissatisfaction 7.83 .28 .83** 28.13 .66 791.06** .91 .03 .82 28.27 .67 799.38
Workload Demand
Somatic Complaints .56 .032 .66 17.60 .44 309.81*** .56 .02 .71 19.62 .50 384.96
NOTE: β = Unstandardized Co-efficient of Regression, SE β = Standard Errors in Beta (unstandardised).
Beta= Standardized coefficients. All Beta and F values are significance at ***p<.001. Predictor Vigor Activity has been ignored in Time 2 study because of non-significance relationship.

300
Appendix A4 (Time-1 & 2)
Linear Regression Analyses of Conflicts Demands Scale (of Total Demands) on various Predictors of Model and their Interactions
Time 1 Time 2
Independent
Dependent β SEβ Beta t-
Values R2
(Adjusted) F-Values β SEβ Beta t-Values
R2
(Adjusted) F-Values
Conflicts Demand
Total Demands .94 .019 .93*** 49.42 .86 2443.09*** .81 .01 .92 46.40 .85 2153.34
Conflicts Demand
Total Control -.84 .041 -.71** -20.41 .51 416.37*** -.79 .04 -.71 -19.56 .50 382.81
Conflicts Demand
Supervisor Supports -.83 .035 -.76** -23.45 .58 549.86*** -.81 .03 -.76 -22.85 .57 522.16
Conflicts Demand
Colleagues Supports
-1.153 .051 -.75** -22.39 .56 501.21*** -.83 .06 -.60 -16.80 .39 264.15
Conflicts Demand
Total Stressors .80 .032 .78*** 25.12 .61 631.38*** .79 .03 .78 24.87 .60 618.76
Conflicts Demand
Job Strain .98 .035 .83*** 28.39 .67 805.83** .78 .02 .81 27.18 .66 739.02
Conflicts Demand Job Anxiety .44 .023 .70** 19.51 .49 380.92** .46 .02 .70 18.86 .48 355.95 Conflicts Demand
Job Dissatisf- Action 8.86 .31 .81* 27.53 .64 757.82** 1.10 .04 .78 25.01 .62 625.55
Conflicts Demand
Somatic Complaints .62 .037 .64 16.81 .42 282.45 .68 .03 .68 18.28 .46 334.20
NOTE: β = Unstandardized Co-efficient of Regression, SE β = Standard Errors in Beta (unstandardised). Beta= Standardized coefficients. All Beta and F values are significance at ***p<.001.
Predictor Vigor Activity has been ignored in Time 2 study because of non-significance relationship.

301
Appendix B1 (Time-1 & 2)
Linear Regression Analyses of Qualitative Control Scale (of Total Control) on various Predictors of Model and their Interactions.
Time 1 Time 2
Independent
Dependent β SEβ Beta t-
Values R2
(Adjusted) F-Values β SEβ Beta t-Values
R2
(Adjusted) F-Values
Qualitative Control
Total Demands -.54 .025 -
.73*** -21.47 .53 461.02*** -.50 .02 -.73 -21.16 .54 448.14
Qualitative Control
Total Control .78 .016 .93*** 48.57 .85 2357.77*** .82 .01 .94 54.83 .88 3007.02
Qualitative Control
Supervisor Supports .56 .027 .72*** 20.43 .51 417.40*** .58 .03 .70 19.23 .49 369.91
Qualitative Control
Colleagues Supports .77 .04 .69** 19.07 .48 363.87** .59 .05 .56 15.31 .35 228.07
Qualitative Control
Total Stressors -.53 .025 -
.72*** -20.60 .51 424.54*** -.56 .02 -.72 -20.25 .51 410.13
Qualitative Control
Job Strain -.65 .029 -
.75*** -22.40 .56 501.85*** -.56 .02 -.76 -22.95 .58 526.90
Qualitative Control Job Anxiety -.29 .017 -
.64*** -16.82 .41 283.12*** -.35 .02 -.64 -15.46 .40 329.06
Qualitative Control
Job Dissatisfaction
-5.67 .26 -.74* -21.65 .54 468.74** -
.85 .03 -.75 -22.48 .57 505.38
Qualitative Control
Somatic Complaints -.42 .027 -
.61*** -15.36 .37 235.95** -.48 .03 -.64 -16.15 .40 261.00
NOTE: β = Unstandardized Co-efficient of Regression, SE β = Standard Errors in Beta (unstandardised).
Beta= Standardized coefficients. All Beta and F values are significance at ***p<.001. Predictor Vigor Activity has been ignored in Time 2 study because of non-significance relationship.

302
Appendix B2 (Time-1 & 2) Linear Regression Analyses of Employees Control Scale (of Total Control) on various Predictors of Model and their
Interactions
Time 1 Time 2
Independent
Dependent β SEβ Beta t-Values
R2
(Adjusted) F-Values β SEβ Beta t-Values
R2
(Adjusted) F-Values
Employees Control
Total Demands -.64 .033 -
.70*** -19.52 .49 381.07*** -.51 .02 .67 -17.90 .45 320.27 Employees Control
Total Control .98 .02 .93*** 49.54 .86 2454.59*** .86 .02 .91 41.90 .82 1756.03
Employees Control
Supervisor Supports .64 .037 .66** 17.37 .43 301.64*** .55 .03 .61 15.09 .41 287.22
Employees Control
Colleagues Supports .90 .05 .64* 16.81 .42 282.66** .51 .02 .53 13.08 .36 245.22
Employees Control
Total Stressors -.63 .033 -.69** -19.10 .48 364.80*** -.56 .03 -.67 -17.13 .43 293.68
Employees Control
Job Strain -.76 .039 -
.70*** -19.34 .48 374.08*** -.56 .03 -.68 -18.37 .46 337.58 Employees Control Job Anxiety -.33 .023 -.57** -14.03 .33 197.03*** -49 .05 -.50 -14.62 .37 248.55 Employees Control
Job Dissatisfaction
-6.64 .35 -.69** -18.80 .47 353.12** -.82 .04 -.68 -18.54 .47 343.75
Employees Control
Somatic Complaints -.48 .036 -.55** -13.30 .31 176.94** 1.03 .02 -.56 -14.32 .39 288.21
NOTE: β = Unstandardized Co-efficient of Regression, SE β = Standard Errors in Beta (unstandardised).
Beta= Standardized coefficients. All Beta and F values are significance at ***p<.001. Predictor Vigor Activity has been ignored in Time 2 study because of non-significance relationship.

303
Appendix B3 (Time-1 & 2) Linear Regression Analyses of Workload Control Scale (of Total Control) on various Predictors of Model and their Interactions
Time 1 Time 2
Independent
Dependent β SEβ Beta t-
Values R2
(Adjusted) F-Values β SEβ Beta t-Values
R2
(Adjusted) F-Values
Workload Control
Total Demands -.54 .023 -
.75*** -20.30 .57 538.61*** -.46 .02 -.71 -19.84 .51 393.85
Workload Control
Total Control .79 .011 .96*** 73.20 .93 5358.59*** .80 .01 .95 58.62 .90 3435.81
Workload Control
Supervisor Supports .54 .027 .71*** 20.32 .51 412.84*** .53 .03 .67 17.59 .44 309.28
Workload Control
Colleagues Supports .75 .039 .70** 19.38 .48 375.70** .55 .05 .48 10.93 .33 219.32
Workload Control
Total Stressors -.53 .024 -
.74*** -22.17 .55 491.52** -.53 .02 -.71 -19.65 .50 386.35
Workload Control
Job Strain -.63 .028 -
.75*** -22.31 .55 497.86*** -.52 .02 -.72 -20.74 .53 430.20
Workload Control Job Anxiety -.27 .017 -
.63*** -16.00 .39 256.23** -.28 .02 -.58 -13.98 .38 295.43
Workload Control
Job Dissatisfaction
-5.50 .25 -
.73*** -21.29 .53 459.20*** -.76 .03 -.73 -20.91 .53 437.22
Workload Control
Somatic Complaints -.42 .026 -.63** -16.21 .40 262.63** -
.45 .03 -.61 -15.00 .38 255.15
NOTE: β = Unstandardized Co-efficient of Regression, SE β = Standard Errors in Beta (unstandardised).
Beta= Standardized coefficients. All Beta and F values are significance at ***p<.001. Predictor Vigor Activity has been ignored in Time 2 study because of non-significance relationship.

304
Appendix B4 (Time-1 & 2)
Linear Regression Analyses of Conflicts Control Scale (of Total Control) on various Predictors of Model and their Interactions
Time 1 Time 2
Independent
Dependent β SEβ Beta t-Values
R2
(Adjusted) F-Values β SEβ Beta t-Values
R2
(Adjusted) F-Values
Conflicts Control
Total Demands -.65 .035 -.68** -18.42 .46 346.50*** -
.55.03 -.65 -16.56 .41 274.41
Conflicts Control
Total Control 1.01 .022 .92*** 46.95 .85 2204.00*** .98 .02 .90 40.78 .81 1663.43
Conflicts Control
Supervisor Supports .68 .039 .66*** 17.53 .43 307.41** .64 .04 .62 15.46 .38 339.11
Conflicts Control
Colleagues Supports .95 .055 .65** 17.08 .42 291.84*** .38 .05 .51 13.45 .36 289.15
Conflicts Control
Total Stressors -.65 .035 -
.68*** -18.43 .46 339.65*** -.64
.03 -.68 -17.24 .43 297.24
Conflicts Control
Job Strain -.80 .04 -.71** -19.94 .50 397.53** -
.64.03 -.68 -18.24 .46 332.74
Conflicts Control Job Anxiety -.34 .024 -.58** -14.10 .33 198.92** -
.35.02 -.55 -13.19 .35 255.25
Conflicts Control
Job Dissatisfaction
-7.03
.36 -.70** -19.37 .48 375.25** -.92
.05 -.67 -17.85 .45 318.74
Conflicts Control
Somatic Complaints -.51 .037 -.67** -13.82 .32 190.90*** -
.56.04 -.58 -14.09 .34 197.90
NOTE: β = Unstandardized Co-efficient of Regression, SE β = Standard Errors in Beta (unstandardised). Beta= Standardized coefficients. All Beta and F values are significance at ***p<.001.
Predictor Vigor Activity has been ignored in Time 2 study because of non-significance relationship.

305
Appendix C1 (Time-1 & 2) Linear Regression Analyses of Qualitative Stressors Scale (of Total Stressors) on various Predictors of Model and their
Interactions
Time 1 Time 2
Independent
Dependent β SEβ Beta t-Values
R2
(Adjusted) F-Values β SEβ Beta t-Values
R2
(Adjusted) F-Values
Qualitative Stressors
Total Demands .51 .025 .71** 20.41 .51 416.72** .49 .02 .73 20.81 .53 433.18
Qualitative Stressors
Total Control -.54 .033 -
.66*** -17.63 .44 310.71*** -.57 .03 -.67 -17.77 .45 315.98
Qualitative Stressors
Supervisor Supports -.57 .026 -
.74*** -21.90 .54 479.80*** -.62 .02 -.76 -22.99 .58 528.86
Qualitative Stressors
Colleagues Supports -.80 .037 -.73** -21.47 .53 460.91*** -
.74 .04 -.63 -15.81 .39 250.04 Qualitative Stressors
Total Stressors .63 .017 .88*** 36.90 .77 1361.96*** .69 .01 .91 41.43 .82 1749.91
Qualitative Stressors
Job Strain .66 .027 .78*** 24.81 .61 615.38*** .58 .02 .80 26.06 .64 679.25
Qualitative Stressors Job Anxiety .29 .017 .66** 17.44 .43 304.05*** .33 .01 .65 16.90 .42 285.59 Qualitative Stressors
Job Dissatisfaction 5.82 .24 .78* 24.07 .59 579.30** .84 .03 .79 25.55 .63 653.02
Qualitative Stressors
Somatic Complaints .48 .023 .72*** 20.68 .52 427.55** .56 .02 .74 21.52 .54 463.17
NOTE: β = Unstandardized Co-efficient of Regression, SE β = Standard Errors in Beta (unstandardised). Beta= Standardized coefficients. All Beta and F values are significance at ***p<.001.
Predictor Vigor Activity has been ignored in Time 2 study because of non-significance relationship.

306
Appendix C2 (Time-1 & 2)
Linear Regression Analyses of Employees Stressors Scale (of Total Stressors) on various Predictors of Model and their Interactions.
Time 1 Time 2
Independent
Dependent β SEβ Beta t-
Values R2
(Adjusted) F-Values β SEβ Beta t-Values
R2
(Adjusted) F-Values
Employees Stressors
Total Demands .82 .039 .72*** 20.86 .52 435.29*** .66 .03 .71 19.71 .50 388.39
Employees Stressors
Total Control -.85 .05 -.65** -17.16 .42 294.70** -.75 .04 -.65 -16.61 .42 275.71
Employees Stressors
Supervisor Supports -.89 .04 -
.73*** -21.65 .54 468.74*** -.83 .04 -.73 -20.87 .53 435.82
Employees Stressors
Colleagues Supports
-1.28 .057 -.75** -22.35 .55 499.53*** -.97 .06 -.60 -14.77 .35 218.17
Employees Stressors
Total Stressors .98 .028 .87*** 34.70 .75 1203.98*** .92 .02 .86 33.67 .75 1133.72
Employees Stressors
Job Strain 1.02 .043 .76** 23.61 .58 557.23*** .77 .03 .75 22.70 .57 518.51
Employees Stressors Job Anxiety .82 .039 .72*** 20.86 .52 435.29*** .46 .02 .66 17.13 .43 293.49 Employees Stressors
Job Dissatisfaction -.85 .05 -.65** -17.16 .42 294.70** 1.11 .05 .75 22.22 .56 493.82
Employees Stressors
Somatic Complaints -.89 .04 -
.73*** -21.65 .54 468.74*** .65 .04 .62 15.44 .38 239.51
NOTE: β = Unstandardized Co-efficient of Regression, SE β = Standard Errors in Beta (unstandardised). Beta= Standardized coefficients. All Beta and F values are significance at ***p<.001.
Predictor Vigor Activity has been ignored in Time 2 study because of non-significance relationship.

307
Appendix C3 (Time-1 & 2) Linear Regression Analyses of Workload Stressors Scale (of Total Stressors) on various Predictors of Model and their
Interactions
Time 1 Time 2
Independent
Dependent β SEβ Beta t-Values
R2
(Adjusted) F-Values β SEβ Beta t-Values
R2
(Adjusted) F-Values
Workload Stressors
Total Demands .69 .027 .78*** 25.37 .62 643.367*** .58 .02 .75 22.81 .57 520.55
Workload Stressors
Total Control -.73 .035 -.72** -21.02 .52 442.08*** -
.67 .03 -.68 -18.30 .46 335.07
Workload Stressors
Supervisor Supports -.74 .028 -
.79*** -26.07 .63 679.82 -.72 .03 -.76 -23.21 .58 538.82
Workload Stressors
Colleagues Supports
-1.07 .039 -.81** -27.26 .65 743.12*** -
.45 .03 -.57 -13.71 .33 187.97 Workload Stressors
Total Stressors .83 .015 .94*** 56.42 .88 3186.68*** .97 .01 .90 40.97 .82 1678.97
Workload Stressors
Job Strain .87 .028 .84*** 30.84 .71 951.41** .68 .02 .80 26.40 .64 697.15
Workload Stressors Job Anxiety .38 .019 .71*** 20.12 .50 404.82*** .37 .02 .65 16.65 .42 277.24 Workload Stressors
Job Dissatisfaction 7.63 .25 .83*** 29.64 .69 878.69*** .98 .03 .80 25.73 .63 662.08
Workload Stressors
Somatic Complaints .59 .029 .72 20.56 .51 422.85*** .61 .03 .70 19.08 .48 264.40
NOTE: β = Unstandardized Co-efficient of Regression, SE β = Standard Errors in Beta (unstandardised).
Beta= Standardized coefficients. All Beta and F values are significance at ***p<.001. Predictor Vigor Activity has been ignored in Time 2 study because of non-significance relationship.

308
Appendix C4 (Time-1 & 2) Linear Regression Analyses of Conflicts Stressors Scale (of Total Stressors) on various Predictors of Model and their
Interactions
Time 1 Time 2
Independent
Dependent β SEβ Beta t-Values
R2
(Adjusted) F-Values β SEβ Beta t-Values
R2
(Adjusted) F-Values
Conflicts Stressors
Total Demands .72 .03 .79*** 23.99 .59 575.90*** .61 .02 .76 22.90 .58 524.60
Conflicts Stressors
Total Control -.73 .039 -
.68*** -18.58 .46 345.26** -.67 .03 -.65 -17.05 .43 290.75
Conflicts Stressors
Supervisor Supports -.78 .031 -
.78*** -24.64 .60 607.53*** -.77 .03 -.79 -24.86 .61 618.08
Conflicts Stressors
Colleagues Supports
-1.11 .044 -.78** 25.19 .61 634.84** -.85 .05 -.61 -15.07 .37 226.55
Conflicts Stressors
Total Stressors .84 .020 .90*** 41.27 .81 1703.56*** .83 .02 .90 40.92 .81 1673.30
Conflicts Stressors
Job Strain .87 .034 .79** 25.94 .63 672.94*** .70 .02 .80 25.87 .63 669.50
Conflicts Stressors Job Anxiety .39 .021 .68*** 18.79 .47 354.00*** .41 .02 .67 17.68 .45 312.87 Conflicts Stressors
Job Dissatisfaction 7.66 .31 .79*** 24.84 .61 616.932*** 1.02 .04 .79 25.67 .63 659.11
Conflicts Stressors
Somatic Complaints .59 .031 .67** 18.25 .53 333.17*** .64 .03 .70 19.22 .49 369.46
NOTE: β = Unstandardized Co-efficient of Regression, SE β = Standard Errors in Beta (unstandardised).
Beta= Standardized coefficients. All Beta and F values are significance at ***p<.001. Predictor Vigor Activity has been ignored in Time 2 study because of non-significance relationship.

309
Appendix D1 (Time-1 & 2) Linear Regression Analyses of Sub-Set of Demands Scale on various Predictors of Model and their Interactions with Sub-Set
Control and Stressors. Time 1 Time 2
Independent
Dependent β SEβ Beta t-
Values R2
(Adjusted) F-Values β SEβ Beta t-Values
R2
(Adjusted)F-
Values Qualitative Demands
Qualitative Control -.74 .041 -
.67*** -18.34 .46 336.50*** -.78 .04 -.67 -17.86 .45 319.31 Employees Demands
Employees Control -.76 .052 -.59** -14.68 .35 215.62** -.49 .03 -.45 -12.25 .30 158.25
Workload Demands
Workload Control -.94 .042 -.73** -21.64 .45 468.50** -.73 .03 -.70 -18.76 .47 351.05
Conflicts Demands
Conflicts Control -.67 .041 -
.63*** -16.25 .40 264.10** -.63 .04 -.61 -14.95 .37 223.75 Qualitative Demands
Qualitative Stressors .76 .041 .68*** 18.38 .46 338.02*** .82 .04 .69 18.74 .47 351.16
Employees Demands
Employees Stressors .60 .043 .57*** 13.91 .32 193.52** .60 .03 .41 10.14 .28 137.13
Workload Demands
Workload Stressors .78 .035 .75** 22.37 .56 500.45*** .67 .03 .75 22.00 .56 484.42
Conflicts Demands
Conflicts Stressors .78 .038 .71*** 20.38 .51 412.22** .78 .03 .72 20.34 .52 413.75
Qualitative Control
Qualitative Stressors -.63 .040 -.62** -15.70 .38 246.51** -.65 .04 -.64 -16.28 .41 265.05
Employees Control
Employees Stressors -.47 .033 -
.58*** -14.20 .33 201.68** -.44 .03 -.56 -13.12 .31 172.71 Workload Control
Workload Stressors -.58 .029 -.71** -20.24 .51 409.87*** -.55 .03 -.65 -16.68 .42 278.25
Conflicts Control
Conflicts Stressors -.62 .041 -
.61*** -15.18 .36 230.41** -.61 .04 -.58 -13.84 .33 191.65
NOTE: β = Unstandardized Co-efficient of Regression, SE β = Standard Errors in Beta (unstandardised).
Beta= Standardized coefficients. All Beta and F values are significance at ***p<.001. Predictor Vigor Activity has been ignored in Time 2 study because of non-significance relationship.

310
Appendix D2 (Time-1 & 2) Hierarchical Regression Analyses of Sub-Set of Total Demands and Total Control Factors on various Predictors of Model and
their Interactions.
Time 1 Time-2 Dependent
Independent Β SEβ Beta t-
Values R2
(Adjusted) F-
Values Β SEβ Beta t-Values
R2
(Adjusted) F-Values
Qualitative .24 .04 .30 5.31 .19 .05 .21 3.86 Employees .027 .05 .022 .47 .12 .04 .12 1.40 Workload .25 .06 .27 4.14 .32 .05 .40 6.43
1-Demands
Conflicts .29 .05 .28 5.08
.69 224.11
.27 .05 .26 4.69
.70 226.75
Qualitative -.18 .05 -.24 -3.61 -.25 .05 -.32 -4.36 Employees -.09 .06 -.11 -1.55 -.11 .05 -.12 -1.95 Workload -.27 .05 -.38 -4.80 -.17 .05 -.23 -2.96
Total Stressors
2-Control
Conflicts -.067 .06 -.07 -1.05
.57 137.52
-.12 .06 -.11 -1.87
.55 119.69
Qualitative .31 .04 .32 6.32 .25 .04 .29 5.84 Employees -.03 .06 -.027 -.64 .12 .03 .14 1.13 Workload .33 .06 .31 5.25 .28 .04 .37 6.66
1-Demands
Conflicts .37 .06 .31 6.19
.75 305.56
.25 .04 .25 5.07
.75 301.89
Qualitative -.30 .05 -.34 -5.2 -.32 .05 -.43 -6.13
Employees -.056 .07 -.05 -.78 -.10 .04 -.12 -2.15
Workload -.22 .06 -.26 -3.4 -.12 .05 -.17 -2.31
Job Strain
2-Control
Conflicts -.18 .07 -.16 -2.5
.60 152.85
-.09 .05 -.11 -1.72
.60 147.27
Qualitative .17 .03 .35 5.15 .16 .04 .27 3.93 Employees .02 .04 .035 .61 .05 .03 .05 1.47 Workload .12 .04 .22 2.89
Job Anxiety 1-Demands
Conflicts .17 .04 .26 3.75
.55 124.65
.17 .04 .26 3.75
.54 114.12

311
Dependent
Independent Β SEβ Beta t-
Values R2
(Adjusted) F-
Values Β SEβ Beta t-Values
R2
(Adjusted) F-Values
Qualitative -.17 .03 -.39 -4.92 -.21 .04 -.42 -4.77
Employees .001 .04 .001 .019 -.011
.04 -.05 -.26
Workload -.10 .04 -.23 -2.52 -.06 .04 -.12 -1.36
2-Control
Conflicts -.039
.04 -.066 -.85
.43 76.56
-.06 .04 -.10 -1.37
.39 62.33
Qualitative 2.65 .44 .32 5.92 .35 .06 .28 5.28 Employees -.43 .55 -.03 -.78 .11 .06 .10 1.17 Workload 2.95 .58 .31 5.03 .43 .07 .38 6.39
1-Demands
Conflicts 3.42 .56 .32 6.08
.73 277.44
.32 .06 .23 4.22
.72 248.08
Qualitative -2.66
.52 -.34 -5.05 -.43 .07 -.40 -5.60
Employees -.53 .66 -.05 -.83 -.17 .07 -.14 -2.42
Workload -1.87
.59 -.25 -3.16 -.21 .07 -.21 -2.80
Job Dissatisfaction
2-Control
Conflicts -1.66
.67 -.16 -2.49
.58 141.3
-.11 .08 -.08 -1.36
.60 144.16
Qualitative .32 .05 .42 5.84 .31 .06 .34 5.09 Employees -.08 .06 -.07 -1.20 .11 .06 .09 1.13 Workload .19 .07 .22 2.63 .20 .05 .25 3.36
1-Demands
Conflicts .16 .06 .16 2.28
.50 100.64
.18 .06 .18 2.59
.55 118.09
Qualitative -.18 .05 -.26 -3.21 -.28 .06 -.37 -4.42 Employees .039 .07 .045 .55 -.11 .06 -.15 -.21 Workload -.25 .06 -.38 -4.12 -.12 .06 -.16 -1.17
Somatic Symptoms
2-Control
Conflicts -.06 .07 -.07 -.88
.41 70.62
-.14 .07 -.14 -2.00
.42 7.38
NOTE: β = Unstandardized Co-efficient of Regression, SE β = Standard Errors in Beta (unstandardised). Beta= Standardized coefficients. All Beta and F values are significance at ***p<.001. Predictor Vigor Activity has been ignored in Time 2 study because of non-significance relationship.

312
Appendix D3 (Time-1 & 2) Linear Regression Analyses of Job Demands Scales upon A Single Job Factor and Predictor of Model and their Interactions
Time 1 Time 2 Independent
Dependent β SEβ Beta t-
Values R2
(Adjusted) F-Values β SEβ Beta t-Values
R2
(Adjusted) F-Values
Total Demands Total Stressors .83 .028 .83*** 30.15 .69 909.22*** .94 .03 .82 28.75 .68 826.59
Total Demands Job Strain 1.02 .029 .86* 34.90 .75 1218.52** .94 .02 .86 32.57 .73 1061.25
Total Demands Job Anxiety .46 .02 .75** 22.56 .56 509.08** .55 .02 .73 21.14 .54 447.02 Total Demands Job
Dissatisfaction 9.02 .27 .86** 33.22 .73 1104.09** 1.32 .04 .83 29.71 .70 883.09
Total Demands Somatic Complaints .66 .034 .70*** 19.55 .48 382.17*** .82 .03 .73 21.01 .53 441.41
Total Demands Job Performance -.60 .022 -
.81*** -27.53 .65 758.25*** -1.02 .03 -.81 -27.68 .66 766.64
Total Demands Mastery Scale 7.12 .31 .75** 22.70 .56 515.25*** .79 .03 .73 21.08 .53 444.39 Total Demands Negative
Personality .59 .026 .75*** 22.70 .56 515.18** .73 .03 .78 24.28 .60 589.77
Total Demands E. Turnover Intention 1.07 .037 .83*** 29.19 .68 842.09*** 1.30 .04 .84 31.43 .72 988.03
Total Demands E. Turnover Intention 1.07 .037 .83*** 29.19 .68 842.09*** 1.30 .04 .84 31.43 .72 988.03
Total Demands Vigor Activity .072 .02 .17* 3.41 .026 11.53* - - - - - - Total Demands Neuroticism .47 .02 .71*** 20.23 .51 409.42*** .57 .02 .73 21.38 .54 457.19 Total Demands Job
Participation -.56 .024 -.74** -22.09 .55 488.19*** -.72 .02 -.78 -24.79 .61 614.93
Total Demands Job Consideration -.58 .03 -.70 -19.56 .49 482.66*** -.58 .03 -.70 -19.32 .49 373.32
NOTE: β = Unstandardized Co-efficient of Regression, SE β = Standard Errors in Beta (unstandardised). Beta= Standardized coefficients. All Beta and F values are significance at ***p<.001.

313
Appendix D4 (Time-1 & 2) Linear Regression Analyses of Job Control Scales upon A Single Job Factor and Predictor of Model and their Interactions.
Time 1 Time 2
Independent
Dependent β SEβ Beta t-
Values R2
(Adjusted) F-Values β SEβ Beta t-Values
R2
(Adjusted) F-
Values
Total Control Total Stressors -.66 .028 -.76** -23.29 .57 542.41*** -
.66 .03 -.74 -21.80 .55 475.36
Total Control Job Strain -.79 .033 -
.77*** -24.39 .60 594.91** -.66 .02 -.77 -23.88 .60 570.59
Total Control Job Anxiety -.35 .020 -.65** -16.97 .42 288.16*** -.36 .02 -.62 -15.39 .38 236.91
Total Control Job Dissatisfaction
-6.96 .29 -.76** -23.44 .58 549.61** -
.96 .04 -.77 -23.73 .59 563.10
Total Control Somatic Complaints -.52 .032 -.63** -16.42 .40 268.57** -
.56 .03 -.64 -16.46 .41 270.94
Total Control Job Performance .45 .023 .70*** 19.72 .49 388.87*** .69 .03 .70 19.23 .49 370.13
Total Control Mastery Scale -5.58 .30 -.67** -18.43 .46 339.68** -
.56 .03 -.65 -17.14 .43 294.08
Total Control Negative Personality -.47 .025 -.68** -18.85 .47 355.35*** -
.52 .02 -.70 -19.20 .49 368.82
Total Control E. Turnover Intention -.83 .039 -
.72*** -20.78 .52 431.78*** -.88 .04 -.73 -21.47 .54 461.03
Total Control Vigor Activity -.044 .018 -.12* -2.41 .012 5.81* - - - - - -
Total Control Neuroticism -.38 .012 -.67*** -18.25 .45 333.34*** -
.41 .02 -.66 -17.42 .44 303.65
Total Control Job Participation .41 .023 .66** 17.57 .43 308.74** .51 .02 .70 19.29 .49 372.20
Total Control Job Consideration .42 .03 .58*** 14.25 .34 203.16** .38 .02 .58 14.29 .34 204.39
NOTE: β = Unstandardized Co-efficient of Regression, SE β = Standard Errors in Beta (unstandardised). Beta= Standardized coefficients. All Beta and F values are significance at ***p<.001.

314
Appendix D5 (Time-1 & 2) Linear Regression Analyses of Job Supervisory Supports Scales upon A Single Job Factor and Predictor of Model and their
Interactions. Time 1 Time 2
Independent
Dependent β SEβ Beta t-
Values R2
(Adjusted) F-Values β SEβ Beta t-Values
R2
(Adjusted) F-
Values Supervisor Support
Total Stressors -.79 .025 -
.85*** -31.94 .72 1020.42*** -.79 .02 -.85 -31.67 .72 1003.35
Supervisor Support
Job Strain -.97 .026 -
.88*** -36.62 .77 1340.84*** -.78 .02 -.86 -34.56 .75 1194.15
Supervisor Support Job Anxiety -.46 .018 -.79** -26.11 .63 681.82** -.48 .02 -.77 -23.96 .60 574.51
Supervisor Support
Job Dissatisfaction -8.57 .24 -
.87*** -35.02 .75 1226.72*** -1.09 .03 -.84 -29.98 .70 898.84
Supervisor Support
Somatic Complaints -.66 .03 -.75** -22.51 .56 506.63*** -.70 .03 -.75 -22.25 .56 495.13
Supervisor Support
Job Performance .59 .018 .85** 32.65 .73 1066.31** .87 .02 .84 30.68 .71 941.29
Supervisor Support Mastery Scale -7.05 .27 -.79** -26.13 .63 682.71** -.67 .03 -.74 -22.14 .56 490.29
Supervisor Support
Negative Personality -.59 .022 -.79** -26.02 .63 677.05*** -.60 .02 -.78 -24.31 .60 591.39
Supervisor Support
E. Turnover Intention -1.03 .033 -
.84*** -31.22 .71 974.97*** -1.09 .03 -.87 -34.68 .75 1203.09
Supervisor Support Vigor Activity -.07 .02 -.19* -3.90 .034 15.23* - - - - - -
Supervisor Support Neuroticism -.46 .021 -
.75*** -22.62 .56 511.53** -.46 .02 -.73 -20.80 .52 432.69
Supervisor Support
Job Participation .53 .020 .79** 25.77 .62 664.40*** .61 .02 .80 26.61 .64 708.33
Supervisor Support
Job Consideration .57 .027 .73*** 21.45 .53 460.29*** .87 .02 .71 20.28 .51 411.27
Supervisor Support
Total Stressors -.79 .025 -
.85*** -31.94 .72 1020.42*** -.79 .02 -.85 -31.67 .72 1003.35
NOTE: β = Unstandardized Co-efficient of Regression, SE β = Standard Errors in Beta (unstandardised). Beta= Standardized coefficients All Beta and F values are significance at ***p<.001. Predictor Vigor Activity has been ignored in Time 2 study because of non-significance relationship.

315
Appendix D6 (Time-1 & 2) Linear Regression Analyses of Job Colleagues Scales upon A Single Job Factor and Predictor of Model and their Interactions.
Time 1 Time 2 Independent
Dependent β SEβ Beta t-
Values R2
(Adjusted) F-Values β SEβ Beta t-Values
R2
(Adjusted) F-
Values Colleagues Supports
Total Stressors -.56 .017 -
.85*** -32.92 .73 1083.20*** -.45 .02 -.69 -18.90 .48 357.80
Colleagues Supports
Job Strain -.65 .021 -
.84*** -31.80 .72 1011.45*** -.42 .02 -.66 -17.49 .44 306.03
Colleagues Supports Job Anxiety -.29 .014 -.72** -21.11 .53 445.84** -.23 .01 -.54 -12.68 .29 160.93
Colleagues Supports
Job Dissatisfaction -5.80 .19 -.84** -30.42 .70 925.08*** -.61 .03 -.66 -17.27 .43 298.52
Colleagues Supports
Somatic Complaints -.44 .022 -
.71*** -20.12 .50 405.04*** -.36 .02 -.56 -13.31 .31 177.32
Colleagues Supports
Job Performance .39 .014 .81*** 27.29 .65 745.08*** .45 .09 .62 15.60 .39 243.49
Colleagues Supports Mastery Scale -4.89 .195 -.78** -25.15 .62 632.49** -.35 .02 -.57 -13.51 .32 182.61
Colleagues Supports
Negative Personality -.41 .016 -.78** -25.33 .62 641.74*** -.32 .02 -.60 -14.68 .36 215.73
Colleagues Supports
E. Turnover Intention -.69 .025 -
.81*** -27.74 .66 770.00*** -.58 .03 -.66 -17.33 .43 300.38
Colleagues Supports Vigor Activity -.014 .014 -.16* -3.22 .025 10.40* - - - - - -
Colleagues Supports Neuroticism -.32 .015 -
.74*** -22.22 .55 493.98*** -.25 .01 -.56 -13.30 .31 178.93
Colleagues Supports
Job Participation .35 .015 .75** 22.80 .56 520.09*** -.31 .02 .59 14.46 .35 209.21
Colleagues Supports
Job Consideration .38 .02 .69** 19.17 .48 367.51** .25 .02 .53 12.31 .28 151.59
Colleagues Supports
Total Stressors -.56 .017 -
.85*** -32.92 .73 1083.20*** -.45 .02 -.69 -18.90 .48 357.80
NOTE: β = Unstandardized Co-efficient of Regression, SE β = Standard Errors in Beta (unstandardised). Beta= Standardized coefficients All Beta and F values are significance at ***p<.001. Predictor Vigor Activity has been ignored in Time 2 study because of non-significance relationship.

316
Appendix D7 (Time-1 & 2) Linear Regression Analyses of Job Social Supports Scales upon A Single Job Factor and Predictor of Model and their
Interactions. Time 1 Time 2
Independent
Dependent β SEβ Beta t-
Values R2
(Adjusted) F-Values β SEβ Beta t-Values
R2
(Adjusted) F-
Values Social Supports
Total Stressors -.69 .019 -
.87*** -36.35 .77 1321.75** -.73 .04 -.66 -17.51 .44 306.82
Social Supports
Job Strain -.83 .022 -
.88*** -37.83 .78 1431.20*** -.71 .04 -.67 -17.89 .45 319.28
Social Supports Job Anxiety -.38 .016 -.78** -24.59 .60 604.36*** -.44 .03 -.60 -14.72 .36 216.89
Social Supports
Job Dissatisfaction -7.32 .204 -
.87*** -35.89 .76 1288.06** -.99 .06 -.64 -16.51 .42 272.52
Social Supports
Somatic Complaints -.56 .025 -
.74*** -22.41 .55 501.90** -.63 .04 -.58 -13.96 .33 195.06
Social Supports
Job Performance .50 .016 .85*** 32.19 .72 1036.41*** .83 .04 .68 18.46 .47 340.76
Social Supports Mastery Scale -6.11 .22 -.81** -27.62 .65 763.25** -.62 .04 -.59 -14.38 .35 207.00
Social Supports
Negative Personality -.51 .018 -
.81*** -27.70 .66 767.66*** -.57 .03 -.63 -15.80 .39 249.92
Social Supports
E. Turnover Intention -.87 .027 -.85** -31.95 .72 1021.16** -1.02 .05 -.68 -18.71 .47 350.11
Social Supports Vigor Activity -.068 .017 -.18** -3.61 .029 13.01** - - - - - -
Social Supports Neuroticism -.41 .017 -
.77*** -23.92 .58 572.16*** -.45 .03 -.60 -14.76 .36 217.96
Social Supports
Job Participation .45 .017 .79** 25.74 .62 662.75** .58 .03 .64 16.66 .42 277.64
Social Supports
Job Consideration .49 .023 .73*** 21.27 .53 452.75*** .46 .03 .58 14.02 .34 196.73
Social Supports
Total Stressors -.69 .019 -
.87*** -36.35 .77 1321.75** -.73 .04 -.66 -17.51 .44 306.82
NOTE: β = Unstandardized Co-efficient of Regression, SE β = Standard Errors in Beta (unstandardised). Beta= Standardized coefficients All Beta and F values are significance at ***p<.001. Social Support = Supervisor Support + Colleague Support Predictor Vigor Activity has been ignored in Time 2 study because of non-significance relationship.

317
.Appendix D8 (Time-1 & 2)
Hierarchical Regression Analyses of Job Demands and Job Control Scales upon A Single Job Factor and Predictors of Model and their Interactions
Time 1 Time 2
Dependent
Independent β SEβ Beta t-Values R2
(Adjusted) F-
Values β SEβ Beta t-Values R2
(Adjusted) F-
Values .61 .041 .61 14.95 .69 .04 .61 14.98 Total
Stressors Total Demands Total Control -.25 .036 -.28 -7.04 .73 553.99 -.25 .03 -.28 -6.90 .72 487.20
.79 .042 .67 18.16 .69 .04 .63 17.24 Job Strain
Total Demands Total Control -.26 .038 -.26 -7.01 .78 707.14 -.25 .03 -.29 -8.11 .77 652.78
.38 .032 .61 11.96 .46 .03 .62 11.95 Job Anxiety Total Demands Total Control -.09 .028 -.17 -3.38 .57 266.94 -.09 .03 -.15 -2.92 .54 232.15
7.01 .40 .67 17.28 .93 .06 .59 15.05 Job Dissatisfaction
Total Demands Total Control -
2.27 .35 -.25 -6.43 .76 627.58 .42 .03 -.33 -8.50 .74 559.22
.49 .05 .52 9.42 .64 .05 .58 11.07 Somatic Complaints
Total Demands Total Control -.19 .04 -.23 -4.31 .51 208.74 -.19 .04 -.21 -4.12 .55 238.83
-.49 .03 -.66 -14.66 -.84 .05 -.66 -15.35 Job Performance
Total Demands Total Control .13 .02 .19 4.30 .67 404.97 .19 .04 .20 4.61 .68 414.12
5.32 .48 .56 11.13 .59 .05 .54 10.73 Mastery Scale Total Demands
Total Control -2.02 .41 -.25 -4.86 .58 284.06 -.21 .04 -.24 -4.85 .56 246.93
.43 .03 .55 10.88 .54 .04 .58 12.47 Negative Personality
Total Demands Total Control -.18 .03 -.26 -5.28 .59 289.16 -.19 .03 -.26 -5.67 .63 334.76
.85 .05 .66 15.25 1.03 .06 .67 17.26 E. Turnover Intention
Total Demands Total Control -.24 .04 -.21 -4.90 .69 457.35 -.28 .03 -.23 -5.96 .74 556.06
.08 .03 .18 2.41 - - - - Vigor Activity Total Demands Total Control .009 .02 .02 .31 .024 5.85 - - - -
- - -
.31 .03 .47 8.91 .42 .03 .54 10.83 Neuroticism Total Demands Total Control -.18 .03 -.31 -5.89 .54 239.07 -.15 .03 -.25 -5.01 .56 255.53
-.41 .03 -.57 -11.11 -.54 .04 -.59 -12.87 Job Participation
Total Demands Total Control .13 .03 .22 4.25 .57 263.48 .18 .03 .25 5.57 .64 246.94
-.52 .04 -.62 -11.09 -.49 .04 -.59 -10.94 Job Consideration
Total Demands Total Control .07 .04 .10 1.84 .49 194.16 .09 .03 .14 2.60 .49 192.85
NOTE: β = Unstandardized Co-efficient of Regression, SE β = Standard Errors in Beta (unstandardised). Beta= Standardized coefficients All Beta and F values are significance at ***p<.001. Predictor Vigor Activity has been ignored in Time 2 study because of non-significance relationship.

318
Appendix D9 (Time-1 & 2) Hierarchical Regression Analyses of Job Demands and Job Social Supports Scales upon A Single Job Factor and Predictors of
Model and their Interactions Time 1 Time 2
Dependent
Independent β SEβ Beta t-Values R2
(Adjusted) F-Values β SEβ Beta t-Values R2
(Adjusted) F-Values
Total Demands .33 .04 .33 8.09 .77 .04 .67 19.08 Total Stressors Social Supports -.47 .03 -.60 -14.55 .80 800.08 -.25 .03 -.23 -6.52 .71 479.20
Total Demands .50 .04 .42 11.41 .79 .03 .72 22.18 Job Strain Social Supports -.49 .03 -.52 -14.10 .83 1011.89 -.22 .03 -.21 -6.50 .76 608.68
Total Demands .20 .03 .33 5.93 .44 .03 .59 13.50 Job Anxiety Social Supports -.24 .02 -.49 -8.96 .63 3465.53 -.16 .03 -.22 -5.09 .56 250.88
Total Demands 4.41 .41 .42 10.59 1.13 .05 .71 20.25 Job Dissatisfaction Social Supports -4.38 .33 -.52 -13.21 .81 879.07 -.28 .05 -.18 -5.25 .71 485.70
Total Demands .23 .05 .24 4.13 .69 .05 .61 13.77 Somatic Complaints Social Supports -.40 .04 -.53 -8.98 .57 269.48 -.21 .04 -.19 -4.27 .55 239.58
Total Demands -.24 .03 -.34 -7.14 -.81 .04 -.64 -17.90 Job Performance Social Supports .34 .02 .57 12.61 .75 608.46 .33 .04 .27 7.71 .71 471.19
Total Demands 2.27 .50 .24 4.55 .65 .04 .60 13.62 Mastery Scale Social Supports -4.6 .39 -.61 -11.59 .67 410.82 -.21 .04 -.21 -4.72 .56 245.60
Total Demands .18 .04 .23 4.52 .60 .03 .64 15.86 Negative Personality Social Supports -.38 .03 -.61 -11.66 .67 412.74 -.20 .03 -.21 -5.44 .63 331.57
Total Demands .49 .05 .38 8.44 1.05 .05 .69 21.01 E. Turnover Intention Social Supports -.54 .04 -.53 -11.79 .76 635.91 -.37 .04 -.25 -7.57 .75 594.82
Total Demands .028 .03 .06 .72 - - - - Vigor Activity Social Supports -.04 .03 -.12 -1.36 .028 6.75 - - - - -
-
Total Demands .15 .03 .23 3.95 .46 .03 .60 13.72 Neuroticism Social Supports -.30 .03 -.57 -9.94 .61 304.35 -.16 .03 -.22 -5.03 .57 255.69
Total Demands -.19 .04 -.26 -4.86 -.57 .03 -.62 -15.97 Job Participation Social Supports .32 .03 .56 -10.33 .64 362.00 .22 .03 .25 6.25 .65 357.59
Total Demands -.25 .05 -.30 -4.85 -.46 .03 -.55 -12.16 Job Consideration Social Supports .32 .04 .48 7.84 .56 250.96 .18 .03 .22 4.87 .52 209.52
NOTE: β = Unstandardized Co-efficient of Regression, SE β = Standard Errors in Beta (unstandardised). Beta= Standardized coefficients All Beta and F values are significance at ***p<.001.

319
Appendix D10 (Time-1 & 2)
Hierarchical Regression Analyses of Job Control and Social Supports Scales upon A Single Job Factor and Predictors of Model and their Interactions
Time 1 Time 2
Dependent
Independent β SEβ Beta t-
Values R2
(Adjusted) F-Values β SEβ Beta t-Values
R2
(Adjusted) F-
Values Total Control -.21 .03 -.24 -6.96 -.49 .02 -.55 -17.07 Total
Stressors Social Supports -.55 .02 -.70 -20.39 .79 763.54 -.45 .03 -.41 -12.62 .68 414.74
Total Control -.26 .03 -.25 -7.89 -.51 .02 -.58 -19.36 Job Strain Social Supports -.65 .03 -.69 -21.21 .81 856.51 -.42 .03 -.40 -13.23 .72 501.64
Total Control -.08 .02 -.15 -3.32 -.25 .02 -.43 -10.66 Job Anxiety Social Supports -.32 .02 -.66 -14.12 .61 315.30 -.29 .03 -.40 -9.88 .51 196.97
Total Control -2.26 .31 -.25 -7.18 -.75 .04 -.60 -19.00 Job Dissatisfaction Social Supports -5.78 .28 -.68 -20.05 .79 751.37 -.56 .04 -.36 -11.52 .70 444.12
Total Control -.14 .04 -.17 -3.59 -.42 .03 -.47 -11.86 Somatic Complaints Social Supports -.46 .03 -.61 -12.48 .57 264.84 -.39 .04 -.35 -8.92 .51 203.10
Total Control .10 .02 .15 4.00 .48 .03 .48 14.40 Job Performance Social Supports .43 .02 .73 18.88 .73 545.72 .56 .04 .45 13.58 .65 365.09
Total Control -1.37 .35 -.16 -3.85 -.41 .03 -.48 -12.48 Mastery Scale Social Supports -5.17 .32 -.68 -15.87 .66 402.70 -.38 .04 -.36 -9.30 .53 222.83
Total Control -.13 .02 -.18 -4.27 -.38 .02 -.52 -14.39 Negative Personality Social Supports -.42 .02 -.67 -15.68 .67 409.56 -.35 .03 -.38 -10.67 .60 295.21
Total Control -.23 .04 -.20 -5.18 -.64 .03 -.53 -16.84 E. Turnover Intention Social Supports -.72 .04 -.70 -18.12 .73 557.37 -.65 .04 -.44 -14.00 .70 444.94
Total Control .01 .03 .028 .38 - - - - Vigor Activity Social Supports -.06 .02 -.20 -2.69 .027 6.56 - - - - -
-
Total Control -.13 .02 -.23 -4.93 -.30 .02 -.49 -12.71 Neuroticism Social Supports -.31 .02 -.59 -12.73 .61 314.93 -.28 .02 -.37 -9.67 .54 234.92
Total Control .09 .02 .16 3.55 .37 .02 .51 14.45 Job Participation Social Supports .37 .02 .67 14.77 .63 347.29 .37 .03 .41 11.61 .62 317.85
Total Control .06 .03 .08 1.64 .26 .02 .40 9.68 Job Consideration Social Supports .44 .03 .67 12.99 .53 228.68 .31 .03 .39 9.35 .46 168.78
NOTE: β = Unstandardized Co-efficient of Regression, SE β = Standard Errors in Beta (unstandardised). Beta= Standardized coefficients All Beta and F values are significance at ***p<.001. Predictor Vigor Activity has been ignored in Time 2 study because of non-significance relationship.

320
Appendix D11 (Time-1 & 2)
Hierarchical Regression Analyses of Job Demands, Job Control and Job Social Supports Scales upon A Single Job Factor and Predictor of Model and their Interactions.
Time 1 Time 2
Dependent
Independent Β SEβ Beta t-
Values R2
(Adjusted) F-Values Β SEβ Beta t-Values
R2
(Adjusted) F-
Values Total Demands .26 .04 .26 5.85 .51 .05 .45 10.23
Total Control -.13 .03 -.15 -4.30 -.26 .03 -.29 -7.57 Total
Stressors Social Supports -.43 .03 -.54 -13.02
.81 562.94 -.26 .03 -.23 -7.21
.74 385.14
Total Demands .42 .04 .35 8.95 .53 .04 .48 12.26 Total Control -.15 .03 -.14 -4.33 -
.26 .03 -.30 -8.89 Job Strain
Social Supports -.45 .03 -.48 -12.61
.84 710.98 -.23 .03 -.22 -7.41
.80 514.37
Total Demands .18 .03 .30 4.97 .35 .04 .46 8.09
Total Control -.03 .02 -.05 -1.14 -.09 .03 -.16 -3.18 Job Anxiety
Scale Social Supports -.24 .02 -.48 -8.26
.63 4.98 -.16 .03 -.22 -5.24
.57 174.59
Total Demands 3.73 .45 .35 8.35 .72 .06 .45 10.62 Total Control -1.20 .32 -.13 -3.79 -
.42 .04 -.33 -9.09 Job Dissatisfaction
Social Supports -4.01 .34 -.48 -11.79
.82 610.46 -.30 .05 -.19 -6.05
.76 419.69
Total Demands .18 .06 .19 2.94 .49 .06 .43 7.59
Total Control -.09 .04 -.11 -2.15 -.19 .04 -.22 -4.42 Somatic
Complaints Social Supports -.37 .04 -.50 -8.03
.58 182.83 -.21 .04 -.19 -4.50
.57 174.01

321
Dependent
Independent Β SEβ Beta t-
Values R2
(Adjusted) F-Values Β SEβ Beta t-Values
R2
(Adjusted) F-
Values Total Demands -.22 .03 -.30 -5.97 -.60 .05 -.47 -10.34 Total Control .03 .02 .05 1.42 .20 .04 .21 5.24 Job
Performance Social Supports .33 .02 .55 11.69 .75 407.40
.34 .04 .22 8.13 .72 344.85
Total Demands .14 .04 .18 3.10 .43 .06 .40 7.08 Total Control -.08 .03 -.13 -2.73 -.21 .04 -.25 -5.15 Mastery Scale Social Supports -.35 .03 -.57 -10.50
.68 282.07 -.22 .04 -.21 -5.05
.58 183.47
Total Demands 1.78 .54 .19 3.29 .40 .04 .42 8.34 Total Control -.86 .38 -.10 -2.26 -.20 .03 -.22 -6.09 Negative
Personality Social Supports -4.33 .41 -.57 -10.52 .68 278.40
-.02 .03 -.27 -5.87 .66 254.14
Total Demands .43 .06 .33 8.86 .77 .06 .50 12.11 Total Control -.10 .04 -.09 -2.27 -.29 .04 -.24 -6.70 E. Turnover
Intention Social Supports -.51 .04 -.49 -10.71 .76 430.07
-.37 .04 -.25 -8.19 .78 456.87
Total Demands .04 .04 .09 .95 - - - - Total Control .02 .03 .06 .73 - - - - Vigor Activity
Scales Social Supports -.05 .03 -.14 -1.51 .027 4.67
- - - -
-
-
Total Demands .09 .04 ..14 2.22 .31 .04 .39 7.05 Total Control -.11 .02 -.18 -3.66 -.16 .03 -.26 -5.36 Neuroticism
Scale Social Supports -.27 .03 -.51 -8.62 .61 2130.62
-.17 .03 -.22 -5.37 .60 192.33
Total Demands -.16 .04 -.22 -3.75 -.39 .04 -.42 -8.43 Total Control .05 .03 .09 1.81 .19 .03 .26 6.09 Job
Participation Social Supports .30 .03 .54 9.45 .64 243.49
.22 .03 .25 6.73 .68 273.12
Total Demands -.26 .05 -.30 -4.56 -.36 .05 -.44 -7.28 Total Control -.01 .04 -.01 -.28 .09 .03 .05 2.83 Job
Consideration Social Supports .32 .04 .485 7.58 .55 166.79
.18 .03 .22 5.00 .53 144.92
NOTE: β = Unstandardized Co-efficient of Regression, SE β = Standard Errors in Beta (unstandardised). Beta= Standardized coefficients All Beta and F values are significance at ***p<.001. Predictor Vigor Activity has been ignored in Time 2 study because of non-significance relationship.

322
Appendix D12 (Time-1 & 2) Hierarchical Regression Analyses of Job Demands and Job Control Scales upon A Single Job Factor and Predictors of Model
and their Interactions.
Time 1 Time 2 Independent
Dependent β SEβ Beta t-
Values R2
(Adjusted) F-Values β SEβ Beta t-Values
R2
(Adjusted)F-
Values Job Stress Job Anxiety .47 .02 .76 23.21 .58 539.40 .48 .02 .73 21.18 .54 448.77 Job Stress Job
Dissatisfaction 9.21 .25 .87 35.77 .76 1279.99 1.22 .03 .87 35.82 .76 1283.27
Job Stress Somatic Complaints .72 .03 .76 23.47 .58 551.04 .74 .03 .77 24.07 .60 579.72
Job Stress Job Performance -.60 .02 -.80 -26.72 .64 714.29 -.90 .03 -.81 -27.25 .66 742.57
Job Stress Mastery Scale 7.49 .29 .78 25.59 .62 654.84 .71 .03 .75 22.65 .56 513.17 Job Stress Negative
Personality .63 .02 .80 26.31 .63 692.37 .66 .02 .80 26.20 .64 686.56
Job Stress E. Turnover Intention 1.07 .03 .82 29.13 .68 848.47 1.06 .03 .86 33.24 .74 1105.23
Job Stress Vigor Activity .06 .02 .15 3.20 .02 10.28 - - - - - - Job Stress Neuroticism .50 .02 .75 22.69 .56 514.73 .52 .02 .75 22.64 .57 512.63 Job Stress Job
Participation -.53 .02 -.75 -22.57 .56 509.47 -.63 .02 -.78 -24.94 .62 622.36
Job Stress Job Consideration -.56 .03 -.67 -18.12 .45 328.48 .50 .02 -.69 -18.75 .48 351.50
NOTE: β = Unstandardized Co-efficient of Regression, SE β = Standard Errors in Beta (unstandardised). Beta= Standardized coefficients All Beta and F values are significance at ***p<.001. Predictor Vigor Activity has been ignored in Time 2 study because of non-significance relationship.

323
Appendix D13 (Time-1 & 2) Linear Regression Analyses of Job Strain Scales upon A Single Job Factor and Predictor of Model and their Interactions
Time 1 Time 2 Independent
Dependent β SEβ Beta t-
Values R2
(Adjusted) F-Values β SEβ Beta t-Values
R2
(Adjusted)F-
Values Job Strain Job Anxiety .43 .01 .82 28.12 .66 790.93 .54 .02 .78 24.90 .61 620.19 Job Strain Job
Dissatisfaction 8.90 .03 .99 264.04 .99 69720 1.14 .01 .97 82.56 .94 6817.46
Job Strain Somatic Complaints .60 .02 .75 22.84 .56 521.93 .81 .03 .78 24.66 .61 608.49
Job Strain Job Performance -.54 .016 -.87 -35.10 .75 1232.23 -.98 .03 -.86 -32.91 .74 1083.44
Job Strain Mastery Scale 6.40 .24 .80 26.38 .63 685.83 .76 .03 .77 23.87 .60 570.07 Job Strain Negative
Personality .53 .02 .79 25.83 .62 667.22 .70 .02 .81 27.17 .66 738.52
Job Strain E. Turnover Intention 1.07 .01 .94 56.94 .89 3241.86 1.34 .02 .96 68.01 .92 4625.85
Job Strain Vigor Activity .06 .01 .17 3.57 .03 12.79 - - - - - - Job Strain Neuroticism .41 .01 .73 21.71 .54 471.44 .54 .02 .76 23.33 .58 544.59 Job Strain Job
Participation -.48 .01 -.80 -26.51 .64 702.76 -.70 .02 -.82 -28.72 .68 825.09
Job Strain Job Consideration -.54 .02 -.75 -22.97 .57 527.74 -.56 .02 -.74 -21.75 .55 473.16
Job Strain Job Anxiety .43 .01 .82 28.12 .66 790.93 .54 .02 .78 24.90 .61 620.19 Job Strain Job
Dissatisfaction 8.90 .03 .99 264.04 .99 69720 1.14 .01 .97 82.56 .94 6817.46
Job Strain Somatic Complaints .60 .02 .75 22.84 .56 521.93 .81 .03 .78 24.66 .61 608.49
NOTE: β = Unstandardized Co-efficient of Regression, SE β = Standard Errors in Beta (unstandardised). Beta= Standardized coefficients. All Beta and F values are significance at ***p<.001. Predictor Vigor Activity has been ignored in Time 2 study because of non-significance relationship.

324
Appendix D14 (Time-1 & 2)
Hierarchical Regression Analyses of Job Stress and Job Strain Scales upon A Single Job Factor and Predictors of Model and their Interactions
Time 1 Time 2 Independent
Dependent β SEβ Beta t-
ValuesR2
(Adjusted)F-
Values β SEβ Beta t-Values
R2
(Adjusted)F-
Values .10 .03 .16 2.73 .12 .04 .18 2.71 Job Stress +
Job Strain Job Anxiety .35 .03 .67 10.79 .67 405.57 .42 .04 .62 9.37 .62 318.91
-.46 .08 -.04 -5.55 .11 .03 .08 3.20 Job Stress + Job Strain
Job Dissatisfaction 9.24 .07 1.03 132.43 .99 37472.38 1.31 .03 .90 36.34 .94 3495.81
.41 .06 .44 6.54 .37 .06 .38 5.84 Job Stress + Job Strain
Somatic Complaints .29 .05 .36 5.40 .61 309.54 .46 .06 .44 6.88 .64 347.52
-.11 .03 -.15 -2.78 -.26 .06 -.23 -4.38 Job Stress + Job Strain
Job Performance -.46 .03 -.74 -14.02 .76 630.40 -.74 .06 -.64 -11.98 .75 576.94
3.63 .59 .38 6.15 .31 .06 .33 4.97 Job Stress + Job Strain Mastery Scale 3.69 .49 .46 7.40 .66 398.85 .47 .06 .47 7.14 .62 314.88
.35 .04 .44 7.18 .31 .05 .38 6.30 Job Stress + Job Strain
Negative Personality .26 .04 .39 6.42 .67 401.58 .40 .05 .48 7.80 .69 426.16
-.06 .04 -.05 -1.35 .07 .04 .05 1.82 Job Stress + Job Strain
E. Turnover Intention 1.08 .03 .98 27.75 .89 1625.21 1.27 .04 .91 30.37 .92 2328.44
.005 .05 .012 .11 - - - - Job Stress + Job Strain Vigor Activity .06 .03 .16 1.57 .026 6.38 - - - -
-
-
.30 .04 .45 6.62 .25 .04 .36 5.33 Job Stress + Job Strain Neuroticism .18 .03 .33 4.78 .58 282.90 .32 .04 .44 6.62 .61 305.83
-.14 .04 -.19 -3.03 -.21 .04 -.25 -4.27 Job Stress + Job Strain
Job Participation -.37 .03 -.62 -9.79 .64 363.17 -.50 .05 -.59 -9.98 .70 440.17
-.02 .05 .02 -.27 -.11 .05 -.16 -2.16 Job Stress + Job Strain
Job Consideration -.52 .05 -.74 -10.45 .57 263.29 -.45 .05 -.60 -8.34 .55 241.15
NOTE: β = Unstandardized Co-efficient of Regression, SE β = Standard Errors in Beta (unstandardised). Beta= Standardized coefficients JS + JS = Job Stress + Job Strain All Beta and F values are significance at ***p<.001 except Vigor Activity which is p<.05 or above. If the significance value of F is larger than say 0.05 then the independent variables do not explain the variation in the dependent variable.

325
Appendix D15 (Time-1 & 2) Linear Regression Analyses of Specific Job Factors Scale (of Total Demands) on various outcomes of Job Strain and their
Interactions.
Time 1 Time 2 Independent
Dependent β SEβ Beta t-
ValuesR2
(Adjusted) F-Values β SEβ Beta t-Values
R2
(Adjusted)F-
Values Qualitative Demands
Employees T. Intention .81 .03 .77 24.36 .60 593 .97 .03 .80 26.39 .64 696
Qualitative Demands
Mastery Scale 5.50 .02 72 20.71 .52 429 .61 .03 .71 19.96 .50 398
Qualitative Demands Neuroticism .36 .01 .68 18.69 .45 349 .43 .02 .69 19.06 .48 363
Qualitative Demands
Negative Personality .46 .02 .72 20.71 .52 429 .55 .02 .74 21.64 .54 468
Qualitative Demands
Job Performance -.46 .01 -.77 -24.00 .59 575 -.77 .03 -.77 -24.01 .60 576
Qualitative Demands
Job Participation -.40 .02 -.71 -19.90 .50 396 -.54 .02 -.75 -22.44 .55 490
Qualitative Demands
Job Consideration -.45 .02 -.66 -17.68 .44 312 -.43 .02 -.66 -17.41 .44 303
NOTE: β = Unstandardized Co-efficient of Regression, SE β = Standard Errors in Beta (unstandardised). Beta= Standardized coefficients. * p<.05 ** p<.01 ***p<.001

326
Appendix D16 (Time-1 & 2) Linear Regression Analyses of Specific Job Factors Scale (of Total Demands) on various outcomes of Job Strain and their
Interactions
Time 1 Time 2
Independent
Dependent β SEβ Beta t-Values
R2
(Adjusted) F-Values β SEβ Beta t-Values
R2
(Adjusted)F-
Values Employees Demands
Employees T. Intention 1.00 .05 .65 17.20 .42 296 .70 .09 .33 7.66 .13 58
Employees Demands
Mastery Scale 6.75 .45 .60 15.00 .36 225 .40 .06 .29 6.03 .08 36
Employees Demands Neuroticism .43 .03 .55 13.16 .30 173 .30 .04 .30 6.16 .08 36
Employees Demands
Negative Personality .55 .03 .59 14.65 .35 214 .38 .05 .32 6.60 .10 43
Employees Demands
Job Performance -.59 .03 -.67 -18.12 .45 328 -.58 .07 -.36 -7.65 .12 58
Employees Demands
Job Participation -.52 .03 -.62 -15.62 .38 243 -.41 .05 -.35 -7.50 .13 56
Employees Demands
Job Consideration -.57 .04 -.57 -14.00 .33 196 -.33 .05 -.31 -6.55 .10 43
NOTE: β = Unstandardized Co-efficient of Regression, SE β = Standard Errors in Beta (unstandardised). Beta= Standardized coefficients. * p<.05 ** p<.01 ***p<.001

327
Appendix D17 (Time-1 & 2) Linear Regression Analyses of Specific Job Factors Scale (of Total Demands) on various outcomes of Job Strain and their
Interactions
Time 1 Time 2
Independent
Dependent β SEβ Beta t-Values
R2
(Adjusted) F-Values β SEβ Beta t-Values
R2
(Adjusted)F-
Values Workload Demands
Employees T. Intention .93 .03 .78 25.24 .61 637 .88 .03 .83 29.00 .68 840
Workload Demands
Mastery Scale 6.14 .30 .72 21.12 .50 404 .54 .02 .71 19.80 .49 392
Workload Demands Neuroticism .41 .02 .67 18.14 .45 329 .39 .01 .72 20.83 .53 434
Workload Demands
Negative Personality .51 .02 .71 20.23 .50 409 .50 .02 .76 23.13 .58 535
Workload Demands
Job Performance -.52 .02 -.78 -24.07 .59 578 -.70 .02 -.79 -25.53 .63 652
Workload Demands
Job Participation -.45 .02 -.71 -19.88 .50 395 -.49 .02 -.76 -22.83 .57 521
Workload Demands
Job Consideration -.51 .02 -.70 -18.01 .45 324 -.40 .02 -.69 -18.72 .47 350
NOTE: β = Unstandardized Co-efficient of Regression, SE β = Standard Errors in Beta (unstandardised). Beta=Standardized coefficients. * p<.05 ** p<.01 ***p<.001

328
Appendix D18 (Time-1 & 2) Linear Regression Analyses of Specific Job Factors Scale (of Total Demands) on various outcomes of Job Strain and their
Interactions
Time 1 Time 2
Independent
Dependent β SEβ Beta t-Values
R2
(Adjusted) F-Values β SEβ Beta t-Values
R2
(Adjusted)F-
Values Conflicts Demands
Employees T. Intention 1.03 .04 .78 25.14 .61 631 1.08 .04 .80 26.56 .64 705
Conflicts Demands
Mastery Scale 6.83 .34 .71 20.00 .50 400 .66 .03 .69 18.76 .48 352
Conflicts Demands Neuroticism .45 .02 .67 18.22 .45 332 .48 .02 .70 19.23 .49 370
Conflicts Demands
Negative Personality .57 .02 .71 20.10 .50 404 .61 .02 .74 21.50 .54 462
Conflicts Demands
Job Performance -.56 .02 -.74 -22.43 .55 503 -.85 .03 -.76 -23.41 .58 548
Conflicts Demands
Job Participation -.49 .02 -.68 -18.39 .46 338 -.60 .02 -.73 -21.06 .53 443
Conflicts Demands
Job Consideration -.55 .03 -.64 -16.92 .42 286 -.47 .02 -.65 -16.72 .42 279
NOTE: β = Unstandardized Co-efficient of Regression, SE β = Standard Errors in Beta (unstandardised). Beta=Standardized coefficients. * p<.05 ** p<.01 ***p<.001

329
Appendix D19 (Time-1 & 2) Linear Regression Analyses of Specific Job Factors Scale (of Total Control) on various outcomes of Job Strain and their
Interactions
Time 1 Time 2
Independent
Dependent β SEβ Beta t-Values
R2
(Adjusted) F-Values β SEβ Beta t-Values
R2
(Adjusted)F-
Values Qualitative Control
Employees T. Intention -.67 .03 -.71 -19.72 .49 289 -.71 .03 -.73 -21.09 .53 445
Qualitative Control
Mastery Scale
-4.53 .26 -.65 -17.16 .42 295 -.47 .02 -.64 -16.56 .41 214
Qualitative Control Neuroticism -.31 .01 -.65 -17.07 .42 292 -.33 .02 -.63 -16.03 .40 257
Qualitative Control
Negative Personality -.38 .02 -.66 -17.59 .44 309 -.43 .02 -.67 -18.02 .45 324
Qualitative Control
Job Performance .37 .02 .69 19.10 .47 365 .59 .03 .69 19.86 .48 355
Qualitative Control
Job Participation .34 .02 .65 17.30 .43 300 .43 .03 .70 19.24 .48 370
Qualitative Control
Job Consideration .35 .02 .58 14.13 .33 200 .34 .02 .60 14.78 .36 218
NOTE: β = Unstandardized Co-efficient of Regression, SE β = Standard Errors in Beta (unstandardised). Beta=Standardized coefficients. * p<.05 ** p<.01 ***p<.001

330
Appendix D20 (Time-1 & 2) Linear Regression Analyses of Specific Job Factors Scale (of Total Control) on various outcomes of Job Strain and their
Interactions.
Time 1 Time 2
Independent
Dependent β SEβ Beta t-Values
R2
(Adjusted) F-Values β SEβ Beta t-Values
R2
(Adjusted)F-
Values Employees Control
Employees T. Intention -.77 .04 -.64 -16.83 .41 283 -.74 .04 -.64 -16.61 .41 276
Employees Control
Mastery Scale
-5.25 .34 -.60 -15.08 .36 228 -.45 .03 -.56 -13.37 .31 178
Employees Control Neuroticism -.36 .02 -.61 -15.13 .36 228 -.35 .02 -.60 -14.93 .36 223
Employees Control
Negative Personality -.44 .02 -.61 -15.49 .37 240 -.44 .02 -.62 -15.44 .38 238
Employees Control
Job Performance .42 .02 .62 15.67 .38 245 .59 .03 .63 15.95 .39 254
Employees Control
Job Participation .38 .02 .57 14.09 .33 198 .44 .02 .64 16.22 .40 263
Employees Control
Job Consideration .39 .03 .50 11.61 .25 135 .32 .02 .52 11.95 .27 142
NOTE: β = Unstandardized Co-efficient of Regression, SE β = Standard Errors in Beta (unstandardised). Beta= Standardized Coefficients. * p<.05 ** p<.01 ***p<.001

331
Appendix D21 (Time-1 & 2) Linear Regression Analyses of Specific Job Factors Scale (of Total Control) on various outcomes of Job Strain and their
Interactions
Time 1 Time 2
Independent
Dependent β SEβ Beta t-Values
R2
(Adjusted) F-Values β SEβ Beta t-Values
R2
(Adjusted)F-
Values Workload Control
Employees T. Intention -.64 .03 -.69 -18.94 .47 360 -.69 .03 -.69 -18.74 .47 351
Workload Control
Mastery Scale
-4.52 .25 -.67 -17.90 .44 320 -.45 .02 -.63 -16.09 .40 258
Workload Control Neuroticism -.31 .01 -.67 -17.79 .44 317 -.33 .02 -.63 -16.06 .40 257
Workload Control
Negative Personality -.38 .02 -.67 -18.28 .45 334 -.41 .02 -.67 -17.68 .45 312
Workload Control
Job Performance .36 .01 .69 18.95 .47 359 .54 .03 .65 17.43 .43 290
Workload Control
Job Participation .33 .01 .65 17.00 .42 289 .40 .02 .65 16.86 .42 284
Workload Control
Job Consideration .34 .02 .57 13.92 .32 193 .29 .02 .54 12.75 .29 162
NOTE: β = Unstandardized Co-efficient of Regression, SE β = Standard Errors in Beta (unstandardised). Beta= Standardized Coefficients. * p<.05 ** p<.01 ***p<.001

332
Appendix D22 (Time-1 & 2) Linear Regression Analyses of Specific Job Factors Scale (of Total Control) on various outcomes of Job Strain and their
Interactions
Time 1 Time 2
Independent
Dependent β SEβ Beta t-Values
R2
(Adjusted) F-Values β SEβ Beta t-Values
R2
(Adjusted)F-
Values Conflicts Control
Employees T. Intention -.83 .04 -.66 -17.80 .44 317 -.85 .05 -.65 -17.03 .43 290
Conflicts Control
Mastery Scale
-5.50 .36 -.60 -15.17 .36 230 -.54 .03 -.58 -14.13 .34 199
Conflicts Control Neuroticism -.38 .02 -.59 -14.74 .35 217 -.38 .02 -.57 -13.91 .33 193
Conflicts Control
Negative Personality -.46 .03 -.61 -15.32 .36 235 -.49 .03 -.61 -15.34 .37 235
Conflicts Control
Job Performance .44 .02 .62 15.94 .39 254 .65 .04 .60 14.79 .36 218
Conflicts Control
Job Participation .40 .02 .58 14.35 .34 206 .47 .03 .59 14.52 .35 210
Conflicts Control
Job Consideration .41 .03 .51 11.93 .26 142 .35 .03 .50 11.42 .25 130
NOTE: β = Unstandardized Co-efficient of Regression, SE β = Standard Errors in Beta (unstandardised). Beta= Standardized Coefficients. * p<.05 ** p<.01 ***p<.001

333
Appendix D23 (Time-1 & 2) Hierarchical Regression Analyses of Job Demands and Job Control Scales upon A Single Job Factor and Predictors of Model
and their Interactions. Time 1 Time 2
Dependent
Independent β SEβ Beta t-
Values R2
(Adjusted) F-Values β SEβ Beta t-Values
R2
(Adjusted) F-
Values Qualitative Demands .57 .04 .54 13.80 .68 .04 .56 15.28 Employees T.
Intention Qualitative Control -.31 .03 -.33 -8.31
.65 382 -.36 .03 -.35 -9.48
.71 473
Qualitative Demands 3.93 .34 .51 11.50 .43 .03 .51 11.13
Mastery Scale Qualitative Control -2.11 .31 -.30 -6.80
.56 262 -.22 .03 -.30 -6.58
.55 242
Qualitative Demands .24 .02 .44 9.65 .31 .02 .49 10.53
Neuroticism Qualitative Control -.16 .02 -.34 -7.43
.53 226 -.15 .02 -.29 -6.37
.53 220
Qualitative Demands .32 .02 .50 11.32 .39 .03 .52 12.07 Negative
Personality Qualitative Control -.18 .02 -.32 -7.23
.57 268 -.20 .02 -.32 -7.52
.60 296
Qualitative Demands -.33 .02 -.55 -13.69 -.56 .04 -.56 -13.87 Job
Performance Qualitative Control .17 .02 .31 7.80
.64 362 .26 .03 .32 7.74
.65 362
Qualitative Demands -.28 .02 -.48 -10.70 -.37 .03 -.50 -12.07 Job
Participation Qualitative Control .17 .02 .33 7.21
.55 249 .22 .02 .35 8.57
.63 327
Employees Demands -.34 .03 -.50 -10.12 -.31 .03 -.47 -9.55 Job
Consideration Employees Control .14 .03 .23 4.82
.47 176 .15 .02 .28 5.70
.48 180
NOTE: β = Unstandardized Co-efficient of Regression, SE β = Standard Errors in Beta (unstandardised). Beta= Standardized coefficients. All Beta and F values are significance at ***p<.001. Predictor Vigor Activity has been ignored in Time 2 study because of non-significance relationship

334
Appendix D24 (Time-1 & 2) Hierarchical Regression Analyses of Job Demands and Job Control Scales upon A Single Job Factor and Predictors of Model
and their Interactions. Time 1 Time 2
Dependent
Independent β SEβ Beta t-
Values R2
(Adjusted) F-Values β SEβ Beta t-Values
R2
(Adjusted) F-
Values Employees Demands .64 .06 .41 9.77 .34 .07 .17 4.37 Employees T.
Intention Employees Control -.47 .05 -.39 -9.31
.53 222 -.67 .04 -.59 -14.71
.44 152
Employees Demands 4.21 .51 .37 8.17 .17 .06 .12 2.88
Mastery Scale Employees Control -3.31 .40 -.38 -8.28
.45 165 -.42 .03 -.52 -11.87
.33 95
Employees Demands .23 .03 .30 6.28 .11 .04 .11 2.78
Neuroticism Employees Control -.26 .02 -.42 -9.50
.42 145 -.33 .02 -.56 -13.39
.37 117
Employees Demands .33 .04 .35 7.68 .16 .05 .13 3.23 Negative
Personality Employees Control -.29 .03 -.40 -8.81
.45 166 -.40 .02 -.57 -13.78
.40 127
Employees Demands -.41 .03 -.47 -11.02 -.30 .06 -.18 -4.43 Job
Performance Employees Control .23 .02 .33 7.88
.52 220 .54 .02 .57 14.09
.42 143
Employees Demands -.35 .03 -.42 -9.15 -.20 .04 -.17 -4.21 Job
Participation Employees Control .21 .03 .32 7.06
.45 142 .40 .02 .58 14.37
.43 146
Employees Demands -.42 .04 -.43 -8.62 -.17 .04 -.16 -3.71 Job
Consideration Employees Control 19 .03 .25 5.07
.36 117 .28 .02 .46 10.33
.29 81
NOTE: β = Unstandardized Co-efficient of Regression, SE β = Standard Errors in Beta (unstandardised). Beta= Standardized coefficients. All Beta and F values are significance at ***p<.001.

335
Appendix D25 (Time-1 & 2) Hierarchical Regression Analyses of Job Demands and Job Control Scales upon A Single Job Factor and Predictors of Model
and their Interactions.
Time-1 Time 2
Dependent
Independent β SEβ Beta t-Values
R2
(Adjusted) F-Values β SEβ Beta t-Values
R2
(Adjusted) F-
Values Workload Demands .72 .05 .60 13.70 .71 .04 .87 17.77 Employees T.
Intention Workload Control -.23 .04 -.24 -5.51
.64 357 -.22 .03 -.22 -6.00
.71 476
Workload Demands 4.12 .43 .47 9.62 .39 .03 .52 10.96
Mastery Scale Workload Control -2.14 .33 -.31 -6.40
.55 243 -.19 .03 -.27 -5.71
.54 228
Workload Demands .24 .03 .40 7.76 .30 .02 .55 11.92
Neuroticism Workload Control -.17 .02 -.37 -7.24
.51 212 -.27 .02 -.24 -5.32
.56 246
Workload Demands .34 .03 .47 9.52 .38 .02 .57 13.23 Negative
Personality Workload Control -.18 .02 -.33 -6.73
.55 250 -.16 .02 -.27 -6.24
.62 313
Workload Demands -.38 .03 -.57 -12.66 -.57 .03 -.65 -15.63 Job
Performance Workload Control .41 .02 .26 5.91
.62 331 .15 .03 .20 4.92
.65 357
Workload Demands -.32 .03 -.50 -9.87 -.38 .02 -.59 -13.34 Job
Participation Workload Control .14 .03 .28 5.60
.53 228 .14 .02 .24 5.48
.60 295
Workload Demands -.41 .04 -.54 -10.01 -.34 .02 -.60 -11.88 Job
Consideration Workload Control .10 .03 .17 3.20
.46 171 .07 .02 .12 2.54
.48 180
NOTE: β = Unstandardized Co-efficient of Regression, SE β = Standard Errors in Beta (unstandardised). Beta= Standardized coefficients. All Beta and F values are significance at ***p<.001.

336
Appendix D26 (Time-1 & 2) Hierarchical Regression Analyses of Job Demands and Job Control Scales upon A Single Job Factor and Predictors of Model
and their Interactions Time 1 Time 2
Dependent
Independent β SEβ Beta t-Values R2
(Adjusted) F-Values β SEβ Beta t-Values R2
(Adjusted) F-Values
Conflicts Demands .80 .05 .60 16.06 .87 .04 .64 18.07 Employees T.
Intention Conflicts Control -.35 .04 -.28 -7.50 .66 389
-.34 .04 -.26 -7.43 .69 430
Conflicts Demands 5.22 .42 .54 12.37 .51 .04 .53 12.00 Mastery Scale Conflicts Control -2.40 .40 -.26 -6.07
.54 235 -.24 .04 -.26 -5.90
.52 208
Conflicts Demands .33 .03 .50 10.90 .38 .03 .55 12.54 Neuroticism Conflicts Control -.17 .02 -.28 -6.14
.50 200 -.16 .02 -.24 -5.53
52 214
Conflicts Demands .43 .03 .54 12.42 .48 .03 .57 14.07 Negative
Personality Conflicts Control -.20 .03 -.26 -6.15 .54 239
-.21 .03 -.26 -6.49 .58 276
Conflicts Demands -.44 .03 -.58 -14.30 -.71 .04 -.63 -16.01 Job Performance Conflicts Control .18 .02 .25 6.18
.59 294 .23 .04 .21 5.47
.61 309
Conflicts Demands -.37 .03 -.51 -11.24 -.47 .03 -.58 -13.98 Job Participation Conflicts Control .17 .03 .25 5.68
.50 198 .17 .03 .23 5.71
.57 256
Conflicts Demands -.45 .04 -.53 -11.10 -.39 .03 -.54 -11.32 Job Consideration Conflicts Control .14 .03 .17 3.60
.43 154 .12 .03 .17 3.62
.44 150
NOTE: β = Unstandardized Co-efficient of Regression, SE β = Standard Errors in Beta (unstandardised). Beta= Standardized coefficients. All Beta and F values are significance at ***p<.001.

337
Appendix D27 (Time-1 & 2) Hierarchical Regression Analyses of Specific Job Factor (Qualitative Control) upon Supervisory Support and Predictors of
Model and their Interactions
Time 1 Time 2
Dependent
Independent β SEβ Beta t-Values
R2
(Adjusted) F-
Values β SEβ Beta t-Values
R2
(Adjusted) F-
Values Qualitative Control -.20 .03 -.20 -5.52 -.25 .03 -.24 -7.23 Employees T.
Intention Supervisory Support -.84 .04 -.69 -18.69
.73 538 -.88 .04 -.70 -21.31
.78 710
Qualitative Control -1.19 .29 -.17 -4.02 -.17 .03 -.23 -5.20
Mastery Scale Supervisory Support -5.96 .37 -.67 -15.74
.64 362 -.52 .04 -.58 -12.72
.59 275
Qualitative Control -.11 .02 -.23 -5.06 -.12 .04 -.24 -5.12
Neuroticism Supervisory Support -.36 .02 -.58 -12.68
.59 284 -.35 .03 -.55 -11.77
.55 243
Qualitative Control -.11 .02 -.19 -4.51 -.16 .02 -.25 -6.05 Negative
Personality Supervisory Support -.48 .03 -.65 -15.41
.64 362 -.46 .03 -.59 -13.94
.64 340
Qualitative Control .09 .02 .17 4.55 .17 .03 .20 5.47 Job
Performance Supervisory Support .54 .02 .74 20.14
.74 569 .72 .03 .70 18.91
.73 520
Qualitative Control .09 .02 .18 4.26 .16 .02 .26 6.69 Job
Participation Supervisory Support .44 .02 .66 15.36
.64 355 .46 .03 .62 15.40
.68 416
Qualitative Control .06 .03 .11 2.29 -.25 .03 -.24 -7.23 Job
Consideration Supervisory Support .51 .03 ..65 13.39
.54 235 -.88 .04 -.70 -21.31
.53 221
NOTE: β = Unstandardized Co-efficient of Regression, SE β = Standard Errors in Beta (unstandardised). Beta= Standardized coefficients. All Beta and F values are significance at ***p<.001.

338
Appendix D28 (Time-1 & 2) Hierarchical Regression Analyses of Specific Job Factor (Employees Control) upon Supervisory Support and Predictors of
Model and their Interactions Time 1 Time 2
Dependent
Independent β SEβ Beta t-
Values R2
(Adjusted) F-
Values β SEβ Beta t-Values
R2
(Adjusted) F-
Values Employees Control -.19 .04 -.16 -4.62 -21 .03 -.18
Employees T. Intention Supervisory
Support -.89 .04 -.73 -21.13 .73 523 -
.95 .03 -.75 -25.07 .77 676
Employees Control
-1.24 .34 -.14 -3.60 -
.13 .03 -.17 -15.43 Mastery Scale
Supervisory Support
-6.22 .35 -.70 -17.65
.64 358 -.36 .02 -.56 -13.53
.58 263
Employees Control -.12 .02 -.19 -4.59 -
.15 .02 -.25 -4.08 Neuroticism
Supervisory Support -.38 .02 -.62 -14.48
.58 279 -.57 .03 -.64 -16.51
.57 255
Employees Control -.11 .02 -.16 -4.09 -
.16 .03 -.22 6.13 Negative Personality Supervisory
Support -.50 .02 -.68 -17.34 .64 360 -
.49 .02 -.63 -5.94
.64 339
Employees Control .07 .02 .10 2.94 .17 .03 .18 21.86 Job
Performance Supervisory Support .54 .02 .79 22.95
.73 547 .75 .03 .72 5.60
.73 523
Employees Control .06 .02 .10 2.52 .16 .02 .23 .6.64 Job
Participation Supervisory Support .48 .02 .72 17.93
.63 340 .50 .02 .66 18.27
.68 412
Employees Control .03 .03 .04 0.87 .08 .02 .13 2.86 Job
Consideration Supervisory Support .55 .03 .73 15.62
.53 230 .43 .03 .63 14.44
.52 214
NOTE: β = Unstandardized Co-efficient of Regression, SE β = Standard Errors in Beta (unstandardised). Beta= Standardized coefficients. All Beta and F values are significance at ***p<.001.

339
Appendix D29 (Time-1 & 2) Hierarchical Regression Analyses of Specific Job Factor (Workload Control) upon Supervisory Support and Predictors of
Model and their Interactions Time 1 Time 2
Dependent
Independent β SEβ Beta t-
Values R2
(Adjusted) F-
Values β SEβ Beta t-Values
R2
(Adjusted) F-
Values Workload Control -.16 .03 -.17 -4.75 -
.19 .03 -.19 -6.16 Employees T. Intention Supervisory
Support -.86 .04 -.71 -19.10 .72 525 -.93 .04 -.73 -22.95
.77 677
Workload Control
-1.38 .28 -.20 -4.87 -
.17 .03 -.24 -5.56 Mastery Scale
Supervisory Support
-5.73 .37 -.64 -15.37 .65 372 -
.52 .03 -.58 -13.42 .59 279
Workload Control -.12 .02 -.26 -5.86 -
.13 .02 -.26 -5.93 Neuroticism
Supervisory Support -.34 .02 -.56 -12.33 .59 294 -
.35 .02 -.54 -12.22 .56 253
Workload Control -.12 .02 -.22 -5.30 -
.16 .02 -.27 -6.65 Negative Personality Supervisory
Support -.46 .03 -.63 -15.06 .65 375 -.46 .03 -.59 -14.68
.64 350
Workload Control .08 .01 .16 4.47 .14 .03 17 4.70 Job
Performance Supervisory Support .51 .02 .73 20.25 .74 569 .75 .03 .73 20.35
.72 507
Workload Control .09 .02 .17 4.01 .12 .02 .20 5.27 Job
Participation Supervisory Support .44 .02 .66 15.56 .64 352 .50 .03 .66 17.00
.67 392
Workload Control .06 .02 .10 2.10 .06 .02 .11 2.50 Job
Consideration Supervisory Support .51 .03 .66 13.62 .54 234 .43 .03 .64 13.55
.52 211
NOTE: β = Unstandardized Co-efficient of Regression, SE β = Standard Errors in Beta (unstandardised). Beta= Standardized Coefficients. All Beta and F values are significance at ***p<.001.

340
Appendix D30 (Time-1 & 2) Hierarchical Regression Analyses of Specific Job Factor (Conflicts Control) upon Supervisory Support and Predictors of Model
and their Interactions
Time 1 Time 2
Dependent
Independent β SEβ Beta t-Values
R2
(Adjusted) F-Values β SEβ Beta t-Values
R2
(Adjusted) F-
Values Conflicts Control -.24 .04 -.19 -5.62 -.24 .04 -.18 -6.21 Employees T.
Intention Supervisory Support -.86 .04 -.72 -20.65
.73 540 -.95 .03 -.75 -24.72
.78 679
Conflicts Control -1.30 .36 -.14 -3.59 -.18 .03 -.19 -4.70
Mastery Scale Supervisory Support -6.21 .35 -.70 -17.57
.64 358 -.55 .03 -.62 -14.97
.58 269
Conflicts Control -.11 .02 -.17 -4.07 -.13 .02 -.20 -4.81
Neuroticism Supervisory Support -.39 .02 -.63 -14.64
.57 274 -.38 .02 -.59 -13.84
.55 240
Conflicts Control -.11 .03 -.15 -3.79 -.17 .03 -.32 -5.52 Negative
Personality Supervisory Support -.51 .02 -.69 -17.38
.64 357 -.49 .03 -.64 -16.40
.63 334
Conflicts Control .07 .02 .10 3.15 .14 .03 .13 3.80 Job
Performance Supervisory Support .54 .02 .78 22.75
.73 550 .79 .03 .76 22.18
.72 494
Conflicts Control .07 .02 .11 2.72 .12 .03 .15 4.17 Job
Participation Supervisory Support .47 .02 .71 17.74
.63 341 .53 .02 .70 18.79
.66 377
Conflicts Control .04 .03 .05 1.18 .06 .03 .09 2.11 Job
Consideration Supervisory Support .53 .03 .69 15.36
.53 231 .44 .03 .65 4.71
.52 209
NOTE: β = Unstandardized Co-efficient of Regression, SE β = Standard Errors in Beta (unstandardised). Beta= Standardized Coefficients. All Beta and F values are significance at ***p<.001.

341
Appendix D31 (Time-1 & 2) Hierarchical Regression Analyses of Specific Job Factor (Qualitative Control) upon Colleagues Support and Predictors of
Model and their Interactions
Time 1 Time 2
Dependent
Independent β SEβ Beta t-Values
R2
(Adjusted) F-
Values β SEβ Beta t-Values
R2
(Adjusted) F-
Values Qualitative Control -.25 .03 -.27 -7.13 -.55 .03 -.53 -15.42
E. T. Intention Colleagues Support -.53 .03 -.62 -16.37 .70 458 -.34 .03 -.39 -11.38 .65 361
Qualitative Control -1.47 .29 -.21 -5.08 -.35 .03 -.48 -11.53 Mastery Scale Colleagues Support -3.97 .26 -.63 -15.24 .63 349 -.20 .02 -.32 -7.81 .49 188
Qualitative Control -.12 .02 -.26 -5.86 -.24 .02 -.47 -11.07 Neuroticism Colleagues Support -.24 .01 -.56 -12.69 .58 284 -.14 .01 -.32 -7.70 .48 177
Qualitative Control -.13 .02 -.22 -5.48 -.32 .02 -.50 -12.71 Negative Personality Colleagues Support -.31 .02 -.63 -15.20 .64 359 -.19 .02 -.34 -8.80 .55 233
Qualitative Control .13 .02 .25 6.58 .43 .03 .50 13.38 Job Performance Colleagues Support .30 .01 .63 16.28 .68 433 .26 .02 .36 9.67 .58 267
Qualitative Control .13 .02 .25 5.90 .33 .02 .53 13.93 Job Participation Colleagues Support .26 .02 .57 13.11 .60 299 .18 .02 .32 8.40 .56 253
Qualitative Control .11 .03 .19 3.87 .25 .02 .44 10.11 Job Consideration Colleagues Support .31 .02 .26 11.43 .49 197 .14 .02 .30 6.95 .43 146
NOTE: β = Unstandardized Co-efficient of Regression, SE β = Standard Errors in Beta (unstandardised). Beta= Standardized Coefficients. All Beta and F values are significance at ***p<.001.

342
Appendix D32 (Time-1 & 2) Hierarchical Regression Analyses of Specific Job Factor (Employees Control) upon Colleagues Support and Predictors of Model
and their Interactions
Time 1 Time 2
Dependent
Independent β SEβ Beta t-Values
R2
(Adjusted) F-
Values β SEβ Beta t-Values
R2
(Adjusted) F-
Values Employees Control -.24 .04 -.20 -5.65 -.50 .04 -.44 -12.17 Employees T.
Intention Colleagues Support -.57 .03 -.67 -18.40
.68 430 -.41 .03 -.46 -12.95
.59 281
Employees Control -1.47 .34 -.17 -4.22 -.31 .03 -.38 -9.19
Mastery Scale Colleagues Support -4.21 .24 -.67 -16.93
.63 338 -.24 .02 -.39 -9.35
.44 153
Employees Control -.13 .02 -.21 -5.02 -.26 .02 -.44 -10.31
Neuroticism Colleagues Support -.26 .01 -.60 -14.28
.58 274 -.16 .01 -.36 -8.88
.47 173
Employees Control -.13 .02 -.18 -4.63 -.31 .02 -.44 -11.14 Negative
Personality Colleagues Support -.34 .02 -.66 -16.90
.63 348 -.22 .02 -.40 -10.26
.51 204
Employees Control .11 .02 .16 4.42 .42 .03 .44 11.57 Job
Performance Colleagues Support .34 .01 .70 18.53
.66 399 .31 .02 .42 11.17
.54 230
Employees Control .10 .02 .15 3.72 .32 .02 .46 11.96 Job
Participation Colleagues Support .30 .02 .65 15.34
.58 375 .20 .02 .38 9.95
52 214
Employees Control .07 .03 .09 2.06 .22 .02 .35 7.97 Job
Consideration Colleagues Support .35 .02 .63 13.40
.48 187 .17 .02 .37 8.42
.38 119
NOTE: β = Unstandardized Co-efficient of Regression, SE β = Standard Errors in Beta (unstandardised). Beta= Standardized Coefficients. All Beta and F values are significance at ***p<.001.

343
Appendix D33 (Time-1 & 2) Hierarchical Regression Analyses of Specific Job Factor (Workload Control) upon Colleagues Support and Predictors of Model
and their Interactions Time 1 Time 2
Dependent
Independent β SEβ Beta t-
Values R2
(Adjusted) F-
Values β SEβ Beta t-Values
R2
(Adjusted) F-
Values Workload Control -.22 .03 -.23 -6.13 -.48 .03 -.48 -13.36 Employees T.
Intention Colleagues Support -.55 .03 -.64 -16.65
.69 439 -.37 .03 -.42 -11.81
.61 308
Workload Control -1.60 -.28 -.23 -5.68 -.33 .03 -.46 -11.26
Mastery Scale Colleagues Support -3.88 -.26 -.62 -14.80
.64 357 -.22 .02 -.33 -8.13
.48 184
Workload Control -.13 .02 -.28 -6.44 -.24 .02 -.47 -11.27
Neuroticism Colleagues Support -.23 .01 -.54 -12.26
.59 292 -.14 .01 -.33 -7.92
.48 180
Workload Control -.14 .02 -.24 -6.02 -.30 .02 -.49 -12.59 Negative
Personality Colleagues Support -.31 .02 -.61 -14.78
.65 367 -.19 .02 -.35 -9.12
.54 231
Workload Control .13 .02 .24 6.23 .38 .03 .46 11.82 Job
Performance Colleagues Support .31 .01 .63 16.17
.68 427 .29 .02 .39 1016
.55 235
Workload Control .12 .02 .24 5.44 .28 .02 .47 11.93 Job
Participation Colleagues Support .27 .02 .58 13.14
.59 293 .19 .02 .36 9.00
.52 212
Workload Control .10 .03 .17 3.51 .20 .02 .37 8.23 Job
Consideration Colleagues Support .31 .02 .57 11.52
.49 195 .16 .02 .34 7.66
.38 112
NOTE: β = Unstandardized Co-efficient of Regression, SE β = Standard Errors in Beta (unstandardised). Beta= Standardized Coefficients. All Beta and F values are significance at ***p<.001.

344
Appendix D34 (Time-1 & 2) Hierarchical Regression Analyses of Specific Job Factor (Qualitative Control) upon Colleagues Support and Predictors of
Model and their Interactions
Time 1 Time 2
Dependent
Independent β SEβ Beta t-Values
R2
(Adjusted) F-
Values β SEβ Beta t-Values
R2
(Adjusted) F-
Values Conflicts Control -.29 .04 -.23 -6.52 -.58 .04 -.44 -12.24 Employees T.
Intention Colleagues Support -.59 .03 -.65 -17.93
.69 448 -.41 .03 -.45 -12.56
.59 282
Conflicts Control -1.51 .36 -.16 -4.13 -.38 .03 -.41 -9.75
Mastery Scale Colleagues Support -4.22 .25 -.67 -16.82
.62 337 -.23 .02 -.37 -8.96
.45 160
Conflicts Control -.12 .02 -.19 -4.42 -.27 .02 -.4 -9.54
Neuroticism Colleagues Support -.27 .01 -.63 -14.40
.57 268 -.16 .01 -.37 -8.79
.44 154
Conflicts Control -.13 .03 -.17 -4.26 -.34 .03 -.43 -10.75 Negative
Personality Colleagues Support -.35 .02 -.67 -16.90
.63 343 -.21 .02 -.40 -9.98
.50 197
Conflicts Control .12 .02 .17 4.53 .43 .04 .40 10.05 Job
Performance Colleagues Support .34 .01 .69 -18.31
.67 401 .32 .02 .044 10.99
.51 203
Conflicts Control .11 .02 .18 3.84 .32 .03 .40 9.95 Job
Participation Colleagues Support .30 .02 .64 15.14
.59 276 .21 .02 .40 9.87
.48 180
Conflicts Control .08 .03 .10 2.31 .23 .03 .33 7.22 Job
Consideration Colleagues Support .34 .02 .62 13.15
.48 188 .18 .02 .38 8.26
.36 111
NOTE: β = Unstandardized Co-efficient of Regression, SE β = Standard Errors in Beta (unstandardised). Beta= Standardized Coefficients. All Beta and F values are significance at ***p<.001.

345 Appendix E-1 (T-1)
CORRELATION MATRIX (N=402) TIME 1
Time Variables S.
No. Job Factors 1 2 3 4 5 6 7 8 9 10 11 12 13 14
1 Qualitative Demands 1 2 Employees Demands .75 1 3 Workload Demands .85 .80 1 4 Conflicts Demands .82 .74 .85 1 5 Total Demands .93 .86 .95 .93 1 6 Qualitative Control -.68 -.64 -.70 -.68 -.73 1 7 Employees Control -.63 -.60 -.68 -.66 -.70 .84 1 8 Workload Control -.70 -.66 -.73 -.69 -.76 86 .85 1 9 Conflicts Control -.61 -.58 -.67 -.63 -.68 .80 81 .85 1
10 Total Control -.70 -.66 -.75 -.71 -.77 .93 .93 .96 .92 1 11 Qualitative Stressors .68 .58 .68 .68 71 -.62 -.59 -.65 -.61 -.66 1 12 Employees Stressors .68 .57 .69 .69 .72 -.63 -.58 -.64 -.57 -.65 .70 1 13 Workload Stressors .74 .65 .75 .73 .78 -.68 -.67 -.71 -.64 -.72 .77 .76 1 14 Conflicts Stressors .72 .63 .72 .72 .77 -.65 -.62 -.66 -.60 -.68 .71 .71 .81 1 15 Total Stressors .79 .68 .79 .78 .83 -.72 -.69 -.74 -.68 -.76 .88 .87 .94 .90 16 Job Dissatisfaction .79 .66 .79 .77 .84 -.71 -.67 -.72 -.68 -.75 .76 .74 .82 .77 17 Job Satisfaction .60 .50 .62 .62 .64 -.55 -.51 -.53 -.51 -.56 .59 .54 .60 .56 18 Employees Turnover .77 .65 .78 .78 .82 -.70 -.64 -.69 -.67 -.72 .72 .71 .73 .74 19 Somatic Complaints .69 .54 .66 .64 .70 -.61 -.55 -.63 -.57 -.65 .72 .62 .72 .67 20 Job Anxiety .75 .64 .74 .73 .79 -.68 -.61 -.67 -.61 -.69 .70 .70 .76 .72
21 Vigor Activity -.17 -.13 -.13 -.17 -.17 .15 .11 .09 .10 .12 .12 -.17 -.13 -.15
22 Neuroticism .68 .55 .67 .67 .71 -.65 -.60 -.66 -.59 -.67 .68 .62 .71 .67 23 Mastery Scale .72 .60 .71 .71 .75 -.65 -.60 -.67 -.60 -.68 .72 .66 .75 .69
24 Performance -.77 -.68 -.77 -.75 -.82 .69 .64 .70 .64 .71 -.72 -.70 -.74 -.74
25 Job Participation -.71 -.62 -.71 -.68 -.74 .85 .58 .65 .58 .66 -.65 -.67 -.67 -.70
26 Job Consideration -.66 -.57 -.67 -.65 -.70 .58 .50 .57 .51 .58 -.58 -.59 -.62 -.63
27 Supervisory Supports -.79 -.68 -.79 -.76 .83 .72 .66 .71 .66 .73 .64 .74 -.79 -
.78
28 Colleagues Supports -.25 -.24 -.24 -.22 -.26 .11 .09 .12 .06 .10 -.24 -.20 -.22 -.24

346
Continued…. CORRELATION MATRIX (N=402)
TIME 1
Time Variables S.
No. Job Factors 15 16 17 18 19 20 21 22 23 24 25 26 27 28
15 Total Stressors 1 16 Job Dissatisfaction .86 1 17 Job Satisfaction .64 .69 1
18 Employees Turnover .82 .85 .69 1
19 Somatic Complaints .76 .71 .55 .73 1
20 Job Anxiety .80 .82 .68 .81 .71 1
21 Vigor Activity .15 .16 .16 .18 .17 .18 .27 22 Neuroticism .75 .68 .53 .72 .75 .64 .11 11 23 Mastery Scale .79 .74 .59 .78 .80 .70 .14 .901 1 24 Performance -.82 -.81 -.65 -.84 -.73 -.81 -.19 -.73 -.781 1 25 Job Participation -.75 -.75 -.60 -.77 -.68 -.77 -.18 -.67 -.72 .83 1 26 Job Consideration -.67 -.70 -.59 -.75 -.63 -.71 -.71 -.62 -.67 .79 .82 1
27 Supervisory Supports -.84 -.82 -.68 -.84 -.75 -.83 -.19 -.75 -.79 .85 .79 .73 1
28 Colleagues Supports -.25 -.21 -.17 -.25 -.22 -.20 -.05 -.27 -.27 .30 .28 .25 .27 1
Figure 3.1 (Time 1) a. Reported are Pearson correlations for pairs of interval/ratio scaled variables (including all 16 composite scales and sub-scales of total demands, total control and stressors). b. Correlations are significant (two-tailed) at p < .001 if over .16, at p < .01.
(N = 389). c. For all analyses involving all independent and dependent variables of strain, scores were inverted so that (consistent with all other strain indices) high scores indicate high levels of strain.

347
Appendix E-2 (T-2) CORRELATION MATRIX (N=389)
Time-2
Time Variables S.
No. Job Factors 1 2 3 4 5 6 7 8 9 10 11 12 13 14
1 Qualitative Demands 1 2 Employees Demands 0.38 1 3 Workload Demands 0.84 0.37 1 4 Conflicts Demands 0.80 0.39 0.85 1 5 Qualitative Control -0.67 -0.37 -0.69 -0.69 1 6 Employees Control -0.61 -0.31 -0.65 -0.63 0.80 1 7 Workload Control -0.64 -0.37 -0.69 -0.66 0.86 0.80 1 8 Conflicts Control -0.59 -0.30 -0.63 -0.60 0.80 0.73 0.82 1 9 Qualitative Stressors 0.68 0.29 0.71 0.69 -0.63 -0.59 -0.63 -0.61 1 10 Employees Stressors 0.67 0.26 0.69 0.68 -0.62 -0.55 -0.63 -0.56 0.70 1 11 Workload Stressors 0.69 0.36 0.74 0.70 -0.65 -0.61 -0.64 -0.59 0.73 0.71 1 12 Conflicts Stressors 0.69 0.33 0.75 0.71 -0.65 -0.57 -0.61 -0.57 0.74 0.71 0.76 1 13 Total Demands 0.92 0.56 0.94 0.92 -0.73 -0.67 -0.71 -0.64 0.72 0.70 0.75 0.75 1 14 Total Control -0.68 -0.37 -0.72 -0.70 0.94 0.90 0.94 0.90 -0.67 -0.64 -0.68 -0.65 -0.74 1 15 Supervisor Supports -0.78 -0.34 -0.80 -0.75 0.69 0.60 0.66 0.61 -0.75 -0.72 -0.76 -0.78 -0.82 0.70 16 Colleagues Supports -0.57 -0.26 -0.58 -0.54 0.49 0.43 0.48 0.45 -0.62 -0.60 -0.63 -0.60 -0.59 0.50 17 Social Supports -0.63 -0.24 -0.62 -0.58 0.45 0.41 0.44 0.39 -0.61 -0.54 -0.57 -0.62 -0.63 0.46 18 Job Stressors 0.77 0.35 0.81 0.78 -0.71 -0.65 -0.70 -0.65 0.90 0.86 0.90 0.90 0.82 -0.74 19 Job Strain 0.81 0.35 0.83 0.81 -0.75 -0.68 -0.72 -0.68 0.79 0.75 0.80 0.79 0.85 -0.77 20 Job Anxiety 0.69 0.34 0.69 0.69 -0.61 -0.52 -0.57 -0.54 0.65 0.65 0.64 0.66 0.73 -0.61 21 Dissatisfaction 0.79 0.34 0.82 0.78 -0.75 -0.68 -0.72 -0.67 0.79 0.74 0.79 0.79 0.83 -0.77 22 Somatic Symptoms 0.71 0.30 0.70 0.68 -0.63 -0.54 -0.60 -0.58 0.73 0.61 0.69 0.69 0.73 -0.64 23 Job Performance -0.77 -0.36 -0.79 -0.76 0.69 0.62 0.65 0.60 -0.74 -0.69 -0.70 -0.74 -0.81 0.69 24 Negative Personality 0.74 0.31 0.76 0.73 -0.67 -0.61 -0.66 -0.61 0.74 0.68 0.71 0.70 0.77 -0.69 25 Mastery Scale 0.71 0.29 0.70 0.69 -0.64 -0.56 -0.63 -0.58 0.69 0.64 0.67 0.67 0.73 -0.65 26 E. Turnover Intension 0.80 0.36 0.82 0.80 -0.73 -0.64 -0.68 -0.65 0.77 0.73 0.77 0.78 0.84 -0.73 27 Neuroticism 0.69 0.29 0.72 0.69 -0.63 -0.60 -0.63 -0.57 0.70 0.63 0.67 0.67 0.73 -0.66 28 Job participation -0.74 -0.35 -0.75 -0.73 0.69 0.63 0.65 0.59 -0.72 -0.70 -0.66 -0.71 -0.78 0.70 29 Job Consideration -0.66 -0.31 -0.68 -0.64 0.60 0.51 0.54 0.50 -0.62 -0.62 -0.59 -0.64 -0.70 0.58

348 Continued…………
CORRELATION MATRIX (N=389)
Time-2 Time Variables
S. No. Job Factors 15 16 17 18 19 20 21 22 23 24 25 26 27 28 2915 Supervisor Supports 1 16 Colleagues Supports 0.62 1 17 Social Supports 0.77 0.65 1 18 Job Stressors -0.84 -0.69 -0.66 1 19 Job Strain -0.86 -0.66 -0.67 0.88 1 20 Job Anxiety -0.77 -0.54 -0.59 0.73 0.78 1 21 Dissatisfaction -0.83 -0.66 -0.64 0.87 0.97 0.74 1 22 Somatic Symptoms -0.74 -0.56 -0.57 0.77 0.78 0.66 0.75 1 23 Job Performance 0.84 0.62 0.68 -0.81 -0.85 -0.74 -0.83 -0.74 1 24 Negative Personality -0.77 -0.59 -0.62 0.79 0.81 0.66 0.79 0.78 -0.80 1 25 Mastery Scale -0.74 -0.56 -0.59 0.75 0.77 0.64 0.75 0.75 -0.76 0.94 1 26 Turnover Intension -0.86 -0.66 -0.68 0.86 0.96 0.79 0.88 0.78 -0.86 0.80 0.77 1 27 Neuroticism -0.72 -0.56 -0.60 0.75 0.76 0.60 0.76 0.73 -0.76 0.95 0.84 0.75 1 28 Job participation 0.80 0.59 0.64 -0.78 -0.82 -0.72 -0.79 -0.72 0.91 -0.80 -0.75 -0.83 -0.74 1 29 Job Consideration 0.71 0.53 0.58 -0.68 -0.74 -0.68 -0.70 -0.64 0.77 -0.69 -0.66 -0.75 -0.63 0.81 1
Figure 3.2 (Time 2) a. Reported are Pearson correlations for pairs of interval/ratio scaled variables (including all 16 composite scales and sub-scales of total demands, total control and stressors). b. Correlations are significant (two-tailed) at p < .001 if over .16, at p < .01.
(N = 389). c. For all analyses involving all independent and dependent variables of strain, scores were inverted so that (consistent with all other strain indices) high scores indicate high levels of strain.

Appendix E-3
Male……….. 1 Female ……...2
Strongly Against Don’t In Favour Strongly Against Care in Favour
1 2 3 4 5
And someone who is slightly in favour of there being more work with new technology would answer as follows:
How do you feel to do the work with new and difficult technology?
The aim of this survey is to provide an accurate picture of the current levels of job factors, immediate and remoteindices of strain amongst WAPDA employees. To achieve this objective, it is essential that all respondents give anhonest assessment of their work-related stressors. In giving your answers, please do not exaggerate your organization,nor pretend that these stressors don’t exist.
Most of the questions can be answered by circling a number. For example, a female would answer this question asfollows:
Are you a male of female?
a) Number of stressors at work; b) The root causes of these stressors;
STUDY OF WAPDA EMPLOYEES’ STRESS
In accordance with common practice in research servey, this questionnaire has been numbered to assist withreminder/follow-up procedures. Let me assure you, however, that your responses to this questionnaire are entirelyconfidential and they will be used to build us to produce a recommendation of what the entire population of WAPDAemployees thinks of their jobs. No employee of WAPDA or anyone else will have access to your individual responses.To preserve the confidentiality of your completed questionnaire, please seal it in the enclosed envelope, and place it ina mail box or hand over to concern researcher. No stamp is required. Please try to find the time to do this within theweek.
Many of the questions are similar to those included in the previous questionnaire you completed. This is quite
deliberate because we are interested in assessing:
Please answer all the questions in ways, which reflect your current views and feelings.
c) The magnitude of each stressors; and d) The level of control and support of employee to overcome these stressors.
428

employee.Completely
False
FALSE Neither more true nor more
false
TRUE Completely
True
A1 1 2 3 4 5A2 1 2 3 4 5
A3 1 2 3 4 5
A4 1 2 3 4 5
A5 1 2 3 4 5
A6 1 2 3 4 5
A7 1 2 3 4 5
A8
1 2 3 4 5
A9
1 2 3 4 5
A10
1 2 3 4 5
A11
1 2 3 4 5
A12
1 2 3 4 5
A13
quality demand. 1 2 3 4 5
A14
1 2 3 4 5
A15
1 2 3 4 5
A16
1 2 3 4 5
I occasionally have difficulties & conflicts with
the organization due to promotional policies.
JOB DEMANDS
I occasionally have difficulties & conflicts
with the organization due to low salary
1. This question asks you to describe the requirements of your job as objectively as possible. To what extent is each of the following statements true of your current job as an
The job involved a lot of repetitive work .
The job involved an excessive amount of work
Different work than required in job description
consumables etc.
SECTION ONE
hours of my personal time.
with my colleagues.
My capability and potential are not utilized.
The job is not free from conflicting demands.
with my management policies.
I am frequently restricted by deptt. excessive,
The demands of my job take up many
The job required lots of physical/mental effort.
The job does not required learning new things
with my superiors.
I occasionally have difficulties or conflicts
I occasionally have difficulties or conflicts
I occasionally have difficulties or conflicts
administrative paper work formalities
I frequently need training for my career
I occasionally have difficulties & conflicts with th
organization due to lack of funds materials,
development,and for continuously growing
428

Have virtually no
control No control
Have considerable
control Control
Have complete control
B1 1 2 3 4 5
B2
1 2 3 4 5
B3
1 2 3 4 5
B4
1 2 3 4 5
B5
1 2 3 4 5
B61 2 3 4 5
B71 2 3 4 5
B8
1 2 3 4 5
B91 2 3 4 5
B101 2 3 4 5
B11
1 2 3 4 5
B12
1 2 3 4 5
B13
1 2 3 4 5
B14
1 2 3 4 5
B15
1 2 3 4 5
B16
1 2 3 4 5
training for career development and for,
The extent to which I have difficulties or,
conflicts with my salary package.
growing quality demand.
The extent to which I have difficulties due to,
materials, funds and consumables etc.
The extent to which I have difficulties with,
organization’s promotion policies.
The extent to which I have difficulties in getting,
The extent to which the work
or conflicts with mgt policies.
conflicts with my superior(s).
The extent to which I have difficulties orconflicts with my colleagues.
and practices or formalities restrict me.
The extent to which my department's policies
The extent to which I have difficulties
of physical/mental effort.
The extent to which my job required learning new things
The extent to which I have difficulties and
The extent to which my job required lots
The extent to which my job involved an
amount of excessive work.
The extent to I have to do different work than
required in job description
The extent to which my job is free from
conflicting demands.
2. This next question contains a list of job factors similar to the last. This time, you areasked to indicate the extent to which you feel you can change, influence or exercise controlover these aspects of your job individually or by collectively.
The extent to which my job involved a lot
of repetitive work .
makes demamds upon my personal time.
Employee's level of creativity and motivation.
JOB CONTROL
428

JOB STRESS
Currently not a source of stress to me at all
Not a source
of stress
Currently a
minor source
of stress to me
Source of
stress
Currently a major
source of stress to me
C1 1 2 3 4 5
C2 1 2 3 4 5
C3 1 2 3 4 5
C4 1 2 3 4 5
C5 1 2 3 4 5
C6 1 2 3 4 5
C7 1 2 3 4 5
C8 1 2 3 4 5
C9 1 2 3 4 5
C10 1 2 3 4 5
C11
1 2 3 4 5
C12
1 2 3 4 5
C13 1 2 3 4 5
1 2 3 4 5
C14 1 2 3 4 5
C15 1 2 3 4 5
C16 Conflicts/disagreement with organizational
1 2 3 4 5
My job is not free from conflicting demands.
My job required lots of physical effort.
Different work than required in job description
3. In this question, you are asked to indicate the extent to which each of the following is asource of stress to you in your current job as an employee.
Lack of employee's creativity and motivation.
My job involved a lot of repetitive work .
My job involved an excessive amount of work
My job does not require learning new things
Conflicts/ disagreement with my salary package.
Lack of funds, materials and resources.
Disagreements/ conflicts with my superiors.
Disagreements/ conflicts with my colleagues.
Disagreements/ conflicts with mgt policies.
The Department’s policies and practices or
formalities.
The demands of my job take up many
hours of my personal time.
The degree of difficulties with growing quality
demands.
promotional policies.
428

Strongly
Disagree
Disagree Neither Agree
nor Disagree
Agree Strongly
Agree
D1 1 2 3 4 5D2 1 2 3 4 5D3 1 2 3 4 5
D41 2 3 4 5
D51 2 3 4 5
D6 1 2 3 4 5
D71 2 3 4 5
D81 2 3 4 5
D91 2 3 4 5
D10
1 2 3 4 5
D111 2 3 4 5
Not at all Hardly at all About once a
month
Once every few
weeks
Once a week
at least
E1 1 2 3 4 5E2 1 2 3 4 5E3 1 2 3 4 5E4 1 2 3 4 5E5 1 2 3 4 5E6 1 2 3 4 5E7 1 2 3 4 5E8 1 2 3 4 5
E9 1 2 3 4 5E10 1 2 3 4 5
5. This question contains a list of minor physical symptoms. Please indicate the frequencywith which you have experienced each of these symptoms so far during the service inWAPDA.
different occupation.
Over the past month, I have seriously thought about
I feel a great deal of stress because of my careerdevelopment and promotion policies.
Over the past month, I have seriously thought aboutseeking a transfer to another department or place.
about making a real effort to enter a new and
There is a good chance I would take a new jobif offered me.
resigning from WAPDA altogether.
Over the past month, I have seriously thought
Headaches
There are number of jobs I would prefer
I put least effort into my work in the department
Many stressful things happen to me at work
over this one
I often find it difficult to get motivated at work these days
Overall, my job is satisfying.
SECTION TWO YOUR LEVEL OF STRESS AND DISSATISFACTION
4. Please indicate the extent to which you agree with each of the following statements:
I feel a great deal of stress because of my job
Muscular tension/pains Back Pain
Irritation or Aggression
Stomach or other digestive problemsSleeping disturbances
Feeling of physical exhaustionEyestrain. Cold & flu symptoms
Wake up tired in the morning
428

Not at all A little Moderately Quite a bit Extremely
F1 1 2 3 4 5F2 1 2 3 4 5F3 1 2 3 4 5F4 1 2 3 4 5F5 1 2 3 4 5F6 1 2 3 4 5F7 1 2 3 4 5F8 1 2 3 4 5F9 1 2 3 4 5
F10 1 2 3 4 5
Not at all Very little To some extent Quite a lot To a great
extent
H1 1 2 3 4 5
H2 1 2 3 4 5
H3 1 2 3 4 5
H4 1 2 3 4 5
H51 2 3 4 5
H6 1 2 3 4 5H7 1 2 3 4 5H8
1 2 3 4 5H9
1 2 3 4 5H10
1 2 3 4 5H11
1 2 3 4 5H12
1 2 3 4 5H13
1 2 3 4 5H14 1 2 3 4 5H15
TenseActive
6. Below is a list of words that describe feelings people may have whilst working. Pleasecircle the number which best describes how you have been feeling at work during the pastweek.
RelaxedUneasy
On edge
RestlessCarefreeNervousVigorous
supervisor in mind. If you are working in a one officer’s office, or a small office where you are the
7. The next two questions ask about your office administration. Usually, this means both your chief head and
duty chief officer(s). If your feelings about these people differ greatly, respond with your immediate
Anxious
YOUR ORGANIZATION AND YOUR ROLE WITHIN IT (ACTIVITY PARTICIPATION)SECTION THREE
administration, please skip these questions & go straight to question 14.
The members of the office administration…
Maintain high standards of staff performance
Allow staff to participate in important decisions
Do things to make it pleasant to work at this office
Ensure staff work up to their capacity
Frequently call on staff for ideas
they disagree with a decision Are really interested in whetherstaff are satisfied in their work
to solve office’s problemsAre friendly to all staffInsist that staff work hardMake decisions which affectstaff without much consultationOften treat staff without considering their feelingsfeelings/demands.Expect staff to speak up when
Turn a “blind eye” to staff whoare not performing wellFrequently ask staff for their opinions in meetingsthe meetings.Express appreciation when staff do a good jobDemands that staff do high quality work.
428

Not at all Very little Somewhat Quite a lot Very much
J1
1 2 3 4 5
J21 2 3 4 5
J31 2 3 4 5
J41 2 3 4 5
Not at all Very little Some what Quite a lot Very much
K11 2 3 4 5
K2 1 2 3 4 5
K31 2 3 4 5
K41 2 3 4 5
How easy is it to talk to members of your office,
How easy is it to talk to your office colleagues.
easier for you?
How much do your department administration,staffs go out of their way to make life
8. In this next question, you are asked to indicate the extent to which you feel support is available from members of your department’s administration.
administration.
How much can your administration staff be relied,on when things get tough at work
to make easier for you?
How much are the members of our administration, willing to listen to your personal problems?
9. This next question is similar to the last, but it asks about the extent to which you feel support isavailable from your colleagues at work.
How much do your colleagues go out of their way,
How much can your colleagues be relied on whenthings get tough at work
How much are colleagues of our office willing tolisten to your personal problems?
428

Strongly Disagree
Disagree Agree Strongly Agree
L11 2 3 4
L2 1 2 3 4
L31 2 3 4
L4 1 2 3 4
L5 1 2 3 4
L6 1 2 3 4
L7 1 2 3 4
L8 1 2 3 4
L91 2 3 4
L10 1 2 3 4
L11 1 2 3 4
L12 1 2 3 4
L13 1 2 3 4
L14 1 2 3 4
L15 1 2 3 4
L16 1 2 3 4
L17 1 2 3 4
L18 1 2 3 4
L19 1 2 3 4
L20 1 2 3 4
L21 1 2 3 4
L22 1 2 3 4
L23 1 2 3 4
L24 1 2 3 4
that happen to me
10. In this last section, we first ask you to complete a set of questions regarding your self andyour general attitudes. (Remember this is all anonymous).
Many times I feel that I have little influence over the things,
SECTION FOUR ABOUT YOU
of the important things in my life
I often feel “fed up”.
I worry too long after an embarrasing experience
My moods often go up and down
I enjoy going to the movies, I sometimes feel just miserable,for no reason
I tend to get on with most people I met
There is really no way I can solve some of the problems I have.
I am an irritable person
My feelings are easily hurt.
I take an active interest in new technology
There is little I can do to change many
I enjoy playing team sports.
I would call myself a nervous person
Sometimes I feel that I’m being pushed around in life
I am a worrier
I prefer to relax, rather than be active, on holidays
I often feel helpless in dealing with the problems of live
I would call myself tense or "highly strung".
I like mixing with people from different cultures
I suffer from “nerves”
What happens to me in the future, Mostly depends on me
I often feel lonely
I am often troubled by feelings of guilt.
I can do just about anything I really set my mind to do 428

1 Year or less _______ ______________ ______________ ______________ ______________ ______________ _______
1 _______ _______2 _______ _______3 _______ _______4 _______ _______5 _______ _______
6 or more _______ ______________
11-15 Years6-10 Years2-5 Years 2-5 Years
1 Year of less
6-10 Years
16-20 Years11-15 Years
21 Years or more
less then 10 Employees
Size of Firm
10-19 Employees20-49 Employees50-99 Employees100-249 Employees250-499 Employees500 or more
Educationl Level
SSC (matric) 25 or less
Age
HSSC (Inter.)
College graduate
Uni. Graduate
Post graduate work
27 to 35
36 to 45
46 to 55
57 or older
Gross Income Under Rs, 9,999
Rs, 10,000- Rs, 19,999
GenderMale
FemaleRs, 20,000- Rs, 29,999
Rs, 30,000- Rs, 39,999
Rs, 40,000- Rs, 49,999
Rs, 50,000 or more
Name of Organization/ Company _____________________________________________________
questionnaire to reasearcher)
THANK YOU VERY MUCH FOR YOUR PARTICIPATION(Please check back to make sure you have answered all the questions, and then hand over the
Designation of your Job /BPS________________________________________________________________________________________________________________________________________
16-20 Years21 Years or more
Number of Firms Worked For
CHARACTERISTICS OF THE SAMPLETotal job ExperienceYears with current Firm
428
Related Documents