Development Policy Review, 2005, 23 (2): 145-163 © Overseas Development Institute, 2005. Published by Blackwell Publishing, Oxford OX4 2DQ, UK and 350 Main Street, Malden, MA 02148, USA. Inter-State Disparities in Health Outcomes in Rural India: An Analysis Using a Stochastic Production Frontier Approach Vinish Kathuria and Deepa Sankar ∗ In an era of reforms in the health sector and with the role of government in health provision diminishing, emphasis is shifting to making the sector efficient. This article analyses the performance of the rural public health systems of 16 major States in India, using stochastic production frontier techniques and panel data for the period 1986-97. The results show that States differ not only in capacity-building in terms of health infrastructure created, but also in efficiency in using these inputs. There is scope for health systems to re-orient their strategies in order to provide the best health in the most efficient way or at the lowest possible cost. 1 Introduction Health systems 1 deserve the highest priority in any endeavour to improve people’s health, since they provide the critical interface between life-saving interventions and the people who need them. The World Health Organisation (2000) has rightly emphasised that the primary goal of a health system should be to provide better health in a responsive manner and with a fair financial distribution. However, how well a health system accomplishes this goal is reflected in actual health outcomes (attainments) in relation to potential, given the endowments/health investments (performance). Until very recently, the analysis of health systems centred on the indicators that reflect health attainments, such as infant mortality rates (IMR) and life expectancy at birth (LEB), or a combined human development index (HDI) using education and incomes along with health indicators. This approach failed to take account of differences in health care endowments and their efficient use. The fact that much of the variation in the health outcomes of different health systems was attributable to the differences in their performance (Murray and Frenk, 2001) was not really examined. Taking this analytical gap into consideration, the World Bank’s Health, Nutrition and Population (HNP) sector paper (Wang et al., 1999) and WHO (2000) made the early attempts to measure the efficiency of the health systems of 115 and 191 countries ∗ Vinish Kathuria ([email protected]) is an Associate Professor at Madras School of Economics, Gandhi Mandapam Road, Kottur, Chennai, 600025, TN, India and Deepa Sankar ([email protected]) is an economist with the World Bank, New Delhi. The article was written when both were at the Institute of Economic Growth in Delhi. An earlier version was presented at the 39th Indian Econometric Society Conference held at MS University, Baroda, 8-10 February 2003. The views expressed are those of the authors only and in no way reflect the policies of their affiliated institutions or any other organisations. 1. WHO (2000) defines ‘health systems’ as comprising all organisations, institutions and resources devoted to health activity.

Welcome message from author
This document is posted to help you gain knowledge. Please leave a comment to let me know what you think about it! Share it to your friends and learn new things together.
Transcript
Development Policy Review, 2005, 23 (2): 145-163
© Overseas Development Institute, 2005.
Published by Blackwell Publishing, Oxford OX4 2DQ, UK and 350 Main Street, Malden, MA 02148, USA.
Inter-State Disparities in Health Outcomes in Rural India: An Analysis Using a Stochastic Production Frontier Approach
Vinish Kathuria and Deepa Sankar∗
In an era of reforms in the health sector and with the role of government in health provision diminishing, emphasis is shifting to making the sector efficient. This article analyses the performance of the rural public health systems of 16 major States in India, using stochastic production frontier techniques and panel data for the period 1986-97. The results show that States differ not only in capacity-building in terms of health infrastructure created, but also in efficiency in using these inputs. There is scope for health systems to re-orient their strategies in order to provide the best health in the most efficient way or at the lowest possible cost.
1 Introduction Health systems1 deserve the highest priority in any endeavour to improve people’s health, since they provide the critical interface between life-saving interventions and the people who need them. The World Health Organisation (2000) has rightly emphasised that the primary goal of a health system should be to provide better health in a responsive manner and with a fair financial distribution. However, how well a health system accomplishes this goal is reflected in actual health outcomes (attainments) in relation to potential, given the endowments/health investments (performance). Until very recently, the analysis of health systems centred on the indicators that reflect health attainments, such as infant mortality rates (IMR) and life expectancy at birth (LEB), or a combined human development index (HDI) using education and incomes along with health indicators. This approach failed to take account of differences in health care endowments and their efficient use. The fact that much of the variation in the health outcomes of different health systems was attributable to the differences in their performance (Murray and Frenk, 2001) was not really examined.
Taking this analytical gap into consideration, the World Bank’s Health, Nutrition and Population (HNP) sector paper (Wang et al., 1999) and WHO (2000) made the early attempts to measure the efficiency of the health systems of 115 and 191 countries
∗Vinish Kathuria ([email protected]) is an Associate Professor at Madras School of Economics, Gandhi Mandapam Road, Kottur, Chennai, 600025, TN, India and Deepa Sankar ([email protected]) is an economist with the World Bank, New Delhi. The article was written when both were at the Institute of Economic Growth in Delhi. An earlier version was presented at the 39th Indian Econometric Society Conference held at MS University, Baroda, 8-10 February 2003. The views expressed are those of the authors only and in no way reflect the policies of their affiliated institutions or any other organisations.
1. WHO (2000) defines ‘health systems’ as comprising all organisations, institutions and resources devoted to health activity.
146 Vinish Kathuria and Deepa Sankar
respectively across the globe, using different performance indicators. They found that countries vary enormously in health outcomes, in spite of similar levels of income and educational attainments. Since then, there has been considerable interest in issues related to efficiency in health care, with the focus shifting from mere attainment levels to health systems’ performance or efficiency in achieving their goals. Studies by Hollingsworth and Wildman (2002), Jamison et al. (2001), Salomon et al. (2001), and Evans et al. (2001) are among these attempts at the health-system level. However, as far as we are aware, there are no studies analysing the performances of intra-regional health systems, especially those in developing countries such as India, Kenya, Bangladesh, etc. where the disparities in the health attainments of different regions are quite stark. The 2001 Human Development Report (HDR) (Government of India, 2001), assessing the health status of people across different Indian States using a Human Development Index (HDI),2 has already indicated the intra-regional difference in health attainment levels in India. It also points out that the foremost problem in Indian health systems is the persistent gaps in manpower and infrastructure, with wide inter-State disparities, especially at the primary health-care level, and their detrimental impact on less developed, backward and rural areas.
Against this backdrop, this article focuses on the relative efficiency of public health systems in improving the health outcomes in the rural areas of different States in India, given the resource base. Taking into account the level of investments (in health infrastructure), the process of attaining the outcomes (the efficiency of the system) and the actual outcomes, such an analysis should assist the States in devising an appropriate health investment strategy (i) to achieve a higher level of overall goal attainment without increasing its resource inputs; (ii) to address the question of the adequacy of the health infrastructure; and (iii) to address the exogenous determinants of its efficiency. It is widely felt that a better understanding of the factors underlying the variations in performance at State level is needed for reform strategies and better management of the health sector. It is also acknowledged that the differences in efficiency are related to the differences in the way the health infrastructure and facilities are provided and managed. This may require identifying factors outside the health sector that explain differences in efficiency.
The study focuses on rural areas, public health, government provision and State-level performances on the basis of the following considerations: (i) the majority of the Indian population live in rural areas,3 and so the variations in performance of rural health systems are reflected in the overall health outcomes of different States (and the country as a whole); (ii) public health, comprising mostly preventive and promotive care and family and community welfare activities, and representing a merit good offering both community and private benefits, is the key to maintaining a healthy society; (iii) pivotal to the rural public-health systems in India are the primary health centres (PHCs), established and managed by the government;4 and (iv) as outlined in the
2. The Planning Commission, Government of India made the first-ever official attempt to index human
development in India using a combined index of health and educational attainment and State Domestic Product, similar to that started by the UNDP in the early 1990s.
3. Overall, the rural population accounted for around 79% of the Indian population in the 1980s and 75% in the 1990s.
4. The case of the urban health systems is quite different since they are relatively well endowed with not only the public provision of secondary and tertiary sector care, but also an even larger private sector. It should
Inter-State Disparities in Health Outcomes in Rural India 147
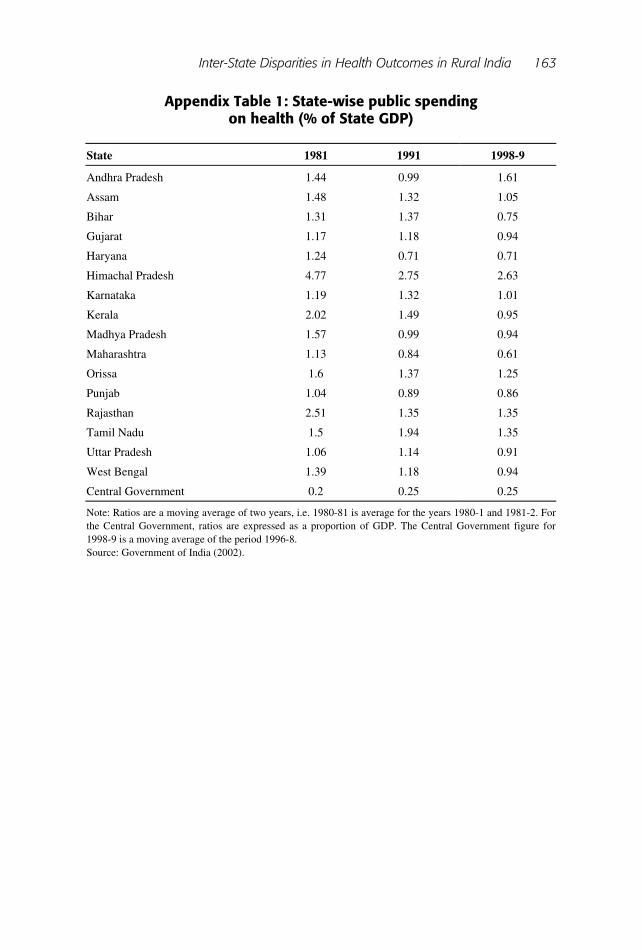
Indian Constitution, the public provision of health care is a responsibility shared by the State, Central and local governments, although it is effectively a State responsibility in terms of delivery.5 This is well supported by the data, which indicate that the State and local governments account for about three-quarters, and the Central government for about a quarter, of public spending on health, though there are large variations across States.6
The article is structured as follows. Section 2 discusses the concept of health-system performance and efficiency; it also gives the methodology for arriving at the indicators representing ‘performance’/‘efficiency’. In Section 3, the models for the analysis are specified. Section 4 gives a brief description of the data and variables constructed, and Section 5 analyses the results. The article concludes with a discussion in Section 6. 2 Concept and methodology An efficient health service is one that achieves its objectives with the least cost. The idea of an ‘efficient’ health facility is derived from the neoclassical production model in which agents choose inputs to minimise costs. However, in health care, outcomes are the most important aspect and efficiency would essentially mean improving the health of people, either by utilising the current level of inputs to the maximum or, if that is achieved, increasing the inputs to reach a higher level of outcomes. One way to achieve this is to identify those systems that are performing better than others and to look into the factors that have induced these systems to perform better.
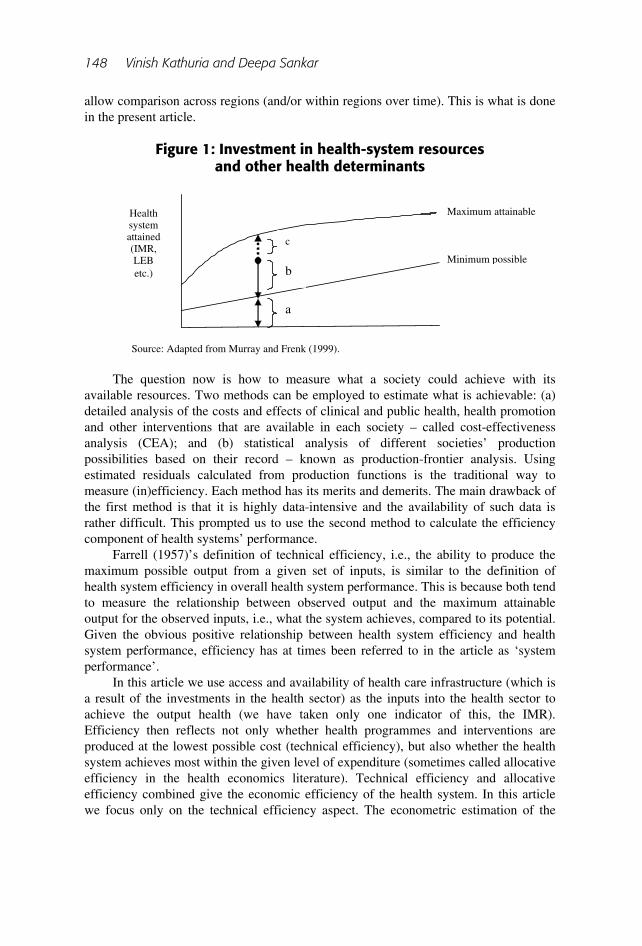
As a prelude to estimating the health system performance of different States7 of India, the concept of ‘efficiency’ or health system performance is illustrated here following Murray and Frenk (1999) and Evans et al. (2001). In Figure 1, the goal of the health system as reflected by various health indicators – IMR or LEB or net birth rate (NBR), etc. – is measured on the vertical axis, while the inputs that produce the goal are on the horizontal axis. The upper line represents the frontier, or the maximum possible level that could be obtained for a given level of inputs. The lower line in Figure 1 depicts the health level that would occur in the absence of the system. Assuming that a society is observed to have achieved a+b units of health against the maximum possible of a+b+c units, system performance under the scenario will be b/(b+c). This indicates what the system achieves as compared with its potential. The system could have achieved better outcomes with the resources that it has invested in the health system and in the other determinants of the health outcome. The challenge for health-sector reform is to find a way of measuring health system performance in a systematic way so as to
be noted that while the primary care includes basic preventive care and some basic curative care, the secondary and tertiary sectors mainly involve curative care, including hospitalisation and specialty treatment.
5. India has a federal structure like that of the US, with the responsibilities of the State governments clearly delineated in many spheres including health, education, etc.
6. See Appendix Table 1 for details. 7. The unit of analysis can be countries (as in the WHO (2000) study) or States or districts or villages in a
district, depending upon the availability of data and the research problem in question. Since we did not have data at the village or district level, we had to use aggregate data at the State level.
148 Vinish Kathuria and Deepa Sankar
allow comparison across regions (and/or within regions over time). This is what is done in the present article.
Figure 1: Investment in health-system resources
and other health determinants
The question now is how to measure what a society could achieve with its available resources. Two methods can be employed to estimate what is achievable: (a) detailed analysis of the costs and effects of clinical and public health, health promotion and other interventions that are available in each society – called cost-effectiveness analysis (CEA); and (b) statistical analysis of different societies’ production possibilities based on their record – known as production-frontier analysis. Using estimated residuals calculated from production functions is the traditional way to measure (in)efficiency. Each method has its merits and demerits. The main drawback of the first method is that it is highly data-intensive and the availability of such data is rather difficult. This prompted us to use the second method to calculate the efficiency component of health systems’ performance.
Farrell (1957)’s definition of technical efficiency, i.e., the ability to produce the maximum possible output from a given set of inputs, is similar to the definition of health system efficiency in overall health system performance. This is because both tend to measure the relationship between observed output and the maximum attainable output for the observed inputs, i.e., what the system achieves, compared to its potential. Given the obvious positive relationship between health system efficiency and health system performance, efficiency has at times been referred to in the article as ‘system performance’.
In this article we use access and availability of health care infrastructure (which is a result of the investments in the health sector) as the inputs into the health sector to achieve the output health (we have taken only one indicator of this, the IMR). Efficiency then reflects not only whether health programmes and interventions are produced at the lowest possible cost (technical efficiency), but also whether the health system achieves most within the given level of expenditure (sometimes called allocative efficiency in the health economics literature). Technical efficiency and allocative efficiency combined give the economic efficiency of the health system. In this article we focus only on the technical efficiency aspect. The econometric estimation of the
Health system attained (IMR, LEB etc.)
c
b
a
Maximum attainable
Minimum possible
Investment in health system resources and other health determinants
Source: Adapted from Murray and Frenk (1999).
Inter-State Disparities in Health Outcomes in Rural India 149
frontier is carried out from a sample of observed infrastructure and accessibility inputs and outputs from different States of India.
The estimation is undertaken in two stages. In the first stage, data on health inputs and the outcome of these inputs are employed to generate a vector of State-specific efficiency indices using stochastic production frontier (SPF) techniques and panel data. In the second stage, these efficiency indices are compared with the most efficient state (MES) to generate the relative efficiency of the States. The article then examines the factors determining the relative efficiency of the States. 3 Model specification(s) We start with a simple production function, with health outcome Y of ith State as a function of the access and availability of health infrastructure (k) inputs, denoted by Xks:
)( kitiit XFAY = (1)
where Ai is the level of productivity, which is assumed to vary across different States, since each State is a distinct entity and utilises infrastructure differently even under similar conditions. The empirical model can be written as:
,iititit uvXy −++= βα ' (2)
Here ‘i’ indexes States and ‘t’ indexes time periods. The value yit is output (for State ‘i’ in time t), whereas Xkit is a vector of k inputs. In the present model, the health output of a State is rural IMR and the k inputs are infrastructure as represented by per capita beds, doctors and paramedical staff availability, while per capita primary health centres reflect the access. The νits represent the usual normally distributed statistical noise accounting for random disturbances beyond the control of the State, measurement errors and minor omitted variables. ui (ui ≥ 0) represents the technical (in)efficiency of the State, and differs across States. The νits are uncorrelated with the regressors Xit. We assume ui to be independently and identically distributed with mean µ and variance σ2u and independent of νit.
The technical efficiency ui reflects that the health performance of a State must lie on or below the frontier, α+X’itβ+νit. Although ui is unobserved by the econometrician, its permanence implies that the States tend to observe ui and take its level into account when demanding infrastructure inputs in the future. For example, if it is interpreted as administrative inefficiency, it is quite apt to assume that its realisation will be known to the State health administrators and will affect their further choice of infrastructural inputs. This violates the linear model assumption of the uncorrelatedness of regressors, with the error term rendering the estimation inconsistent. However, including the firm-specific effects ui as regressors rather than relegating them to the error term removes any biases that would have resulted from correlation between ui and regressors.
Most earlier studies on frontier estimation have been cross-sectional, and have their own limitations (see Schmidt and Sickles, 1984 for enumeration of these limitations). Availability of panel data, i.e., repeated observations for States or individuals over time, obviates the need for strong distributional assumptions about the
150 Vinish Kathuria and Deepa Sankar
error term, as is common in cross-sectional studies. This facilitates estimation of State-specific technical efficiency. In addition, the assumption that technical efficiency is independent of factor inputs does not have to be imposed. Pitt and Lee (1981) and Schmidt and Sickles (1984) were the first to employ panel data to estimate the efficiency frontier. Thus the model can be re-written as:
ititiit vXy ++= βα ' (3)
where αi [= α - ui] is the ith State’s efficiency. The intercept αi is a State-specific effect and can be estimated using the fixed-effects method8 (Schmidt and Sickles, 1984). The level of health performance of a State can be examined relative to the level achieved by the MES. For N states, there would be N estimated performance measures given by α1, α2, α3, …., αN. If α (= max (αN)) is the health performance of the MES, then the relative efficiency of ith State would be:
αα −= iiz (4)
A high value of zi in absolute terms implies that State i is very inefficient relative to the MES. Furthermore, following Schmidt and Sickles (1984), we assume that the MES in the sample is 100% efficient. This also recovers the one-sided individual effects. Thus, each State’s estimated productive efficiency is relative to an absolute standard of 100% efficiency and will be given by:9
States 1,2,3,...N ,α/ii zs = (5) This is also called the ‘dispersion’ in efficiency and is nothing but E (yit| ui, Xkit)/ E (yit| ui = 0, Xkit) given by Farrell (1957), where yit is health outcome, ui is inefficiency and Xkits are the independent variables.
The aim of the study is two-fold: (a) finding which of the States is the most efficient with respect to health performance; and then (b) looking into non-health-related external parameters that have resulted in the better performance of one State over another. There are a number of factors, the presence of which can induce a State to have higher efficiency in providing health services. Some of the important ones are the literacy level, per capita income, share of health expenditure in GDP, etc. Since many diseases like cholera, dysentery, etc. arise from poor sanitation, IMR is directly linked to water and sanitation availability. This is well supported by studies by Leiziger et al. (2003), Jain and Visaria (1988), among others. In addition, the post-birth health care of the mother plays a vital role in the mortality of a child. These variables have also been taken into account by considering access to drinking water, access to sanitation and mothers taking care after the birth. Furthermore, in the past few years, India has been running some parallel health programmes such as pulse polio, AIDS awareness, etc. This implies that a State’s better performance could be due to the successful
8. Evans et al. (2001) have also used the fixed-effect model to determine the health performances of different
countries. 9. The WHO model also ensures that one country is always efficient and all these data are bound by the
frontier production function.
Inter-State Disparities in Health Outcomes in Rural India 151
implementation of these programmes. Since the focus of the present article is on IMR, only the pulse polio/immunisation programme will have any impact. Thus, in the second stage, a number of such variables are introduced to see the impact on efficiency dispersion:
si = f(rural literacy, per-capita income, share of health expenditure in GDP, access to sanitation, water availability, child immunisation, mother taking post-birth care) + error term (6)
3.1 Estimation technique According to Schmidt and Sickles (1984), when repeated observations over time are available, the model can be estimated by different methods such as fixed effects ‘within’, or random effects ‘Generalised Least Squares’ (GLS), or random effects ‘Maximum Likelihood Estimates’ (MLE), assuming a particular distribution for the one-sided error ui in the equation. The following discussion briefly examines the merits and limitations of each method.
A fixed effects (FE) model is an appropriate specification if the focus is on a specific set of cross-sectional series such as the States in our study. The inference in this case is conditional on the particular N States that are observed (Baltagi, 2001). The FE approach takes αi
to be a group-specific constant term in the regression models. However, there are too many parameters in the FE model and the loss of degrees of freedom can be avoided if the ui can be assumed to be random. The random effects (RE) approach specifies that αi is a group/State-specific disturbance, similar to vi except that, for each group, there is only a single draw that enters the regressions identically in each period (Greene, 2000). Though the asymptotic properties of MLE estimators are good, a finite sample relying solely on simple MLE estimates will most likely lead to erroneous efficiency comparisons. This is because a percentage change in the firm-specific technical efficiency levels from the MLE estimates is quite severe when the degree of measurement error increases (Dhawan and Jochumzen, 2000).
From a purely practical standpoint, the FE approach is costly in terms of the degrees of freedom lost, and in a wide longitudinal data set the RE model has some intuitive appeal. On the other hand, the FE approach has considerable virtue, since there is no justification for treating the individual effects as uncorrelated with the other regressors, which is assumed in the RE model. The RE treatment may, therefore, suffer from the inconsistency due to omitted variables (Greene, 2000). Whether we should use the FE or the RE model can be tested statistically using the Hausman test, which is a test of equality between the coefficients estimated via the FE and RE models. Assuming that the model is correctly specified, a significant difference in the coefficient estimates is indicative of correlation between the individual effects and the regressors. Where this correction is present, the estimates using a RE model will be biased (Greene, 2000; Evans et al., 2001).
Thus in stage 1, the Hausman test decides whether to go for the FE model or the RE model. However, in stage 2, a simple Ordinary Least Squares (OLS) technique is employed to investigate the causes for efficiency dispersion across States.
152 Vinish Kathuria and Deepa Sankar
4 Data and variables In order to estimate equations 3 and 6, a number of data sources have been used to make a balanced panel of different variables from 1986 to 1997 for all the 16 major States of India, namely, Andhra Pradesh (AP), Assam, Bihar, Gujarat, Haryana, Himachal Pradesh (HP), Karnataka, Kerala, Maharashtra, Madhya Pradesh (MP), Orissa, Punjab, Rajasthan, Tamil Nadu (TN), Uttar Pradesh (UP) and West Bengal (WB).10 Region-wise distribution shows that each of three zones − North, South and East – has four States, while West has three States and one State is in the Central region. The data for IMR and other relative health indicators were taken from the Bulletin on Rural Health Statistics of India published by the Ministry of Health and Family Welfare for the corresponding years, and the data regarding the rural health infrastructure were obtained from Health Information of India, Central Bureau of Health Intelligence, Director of General Health Services for the corresponding years.
To measure the efficiency of health systems using the production-function approach, three types of variables are essential (WHO, 2000; Evans et al., 2001). First, it is necessary to identify an appropriate outcome indicator that represents the output of the health system. Second, it is imperative to measure the health-system inputs that contribute to producing that output, and third, it is necessary to include the effect of controllable non-health-system determinants of health. The following sub-sections explain how the output and input variables were constructed. 4.1 Output variable In terms of output, it is generally agreed that the single most important goal of the health system is to improve the health of the population. It would have been ideal if we could have developed an index of improvement in health care. However, data constraints prevented us from attempting this. Clinical outcomes, such as an increase in the LEB or a decline in the IMR, are considered possible good general indicators for public health since they represent cumulative efforts in employing health services to lengthen life. Ideally we should have used the IMR and LEB to some degree. Since LEB is computed only quinquennially, this would have forced us to extrapolate it between two terminal years, which would not have introduced enough variation in the variable for robust results.11 We measure public health here in terms of the IMR. It should be noted that reduction in IMR is also the focus of the main health-related Millennium Development Goal (MDG) that almost all countries, including India, have committed themselves to attain by 2015, namely, to reduce the IMR by two-thirds between 1990 and 2015.
The data for the IMR are taken from the Sample Registration System (SRS) estimations published annually by the Registrar General of India, considered to be the most reliable source of data for fertility and child mortality-related issues in the Indian
10. From November 2000 onwards, some of the bigger States like UP, Bihar and MP have been bifurcated
into two smaller States. Since the present study uses data before 2000, the bifurcation has no impact on the analysis.
11. It should be noted that the WHO study of the health system performance of 191 countries uses LEB as an output indicator.

Inter-State Disparities in Health Outcomes in Rural India 153
States. Since the data are collected by the same agency across all States, inter-State bias is systematically accounted for. 4.2 Input variables With respect to input variables, there were two options: either to use the monetary expenditure on health, such as the average per capita public expenditure on health, or to use physical inputs as such. Since we were examining the efficiency of the rural health system, we were required to use the public health expenditure per capita of the rural population of the different States, which unfortunately is not available for all years. Also, if public health expenditure were to be taken as a variable, then it would have to be used as a lagged variable because the impact of such expenditure is reflected only after a certain point in time. Finding an appropriate time lag is quite a difficult task and is often a matter of debate.
Alternatively, one can argue that it is the stock of expenditure in the past that is mirrored in current health system performance. The variables that would precisely reflect the stock of expenditure will then be the physical inputs, such as the number of primary health centres (PHCs) or beds, etc. Since population and area vary across States and this could affect physical access to these facilities, the variables need to be standardised with population or area coverage before they are used. The physical inputs used here cater specifically to the rural areas. The variable ‘paramedical staff’ used in the analysis includes all health workers recruited to create awareness about health care among the population.
It is well recognised that health is not solely a function of services provided by the health system, however broadly the system is defined (Murray and Frenk, 1999). Indeed, some of the pioneer studies in this field have focused exclusively on the non-health-system determinants, such as income and educational levels, measured in various ways (see, for example, Schultz, 1963 and Becker, 1992, which establish the link between education and human capital, building on health and mortality). While this approach can be defended in studies that aim to track fertility and mortality trends, it is not appropriate for efficiency analysis of the health system itself, where the estimation of efficiency should be based on controllable inputs to the production process. Moreover, identifying relevant variables that are available to all States, but which are not highly correlated with health infrastructure data, is difficult. For example, income per capita – one of the most obvious indicators of general development – is highly collinear with health expenditure per capita. While it would be possible to add income per capita directly into the estimated equations, income is not a direct determinant of the production of health. It works through other inputs such as education and housing amenities like safe drinking water and sanitation facilities, and it is better to capture these inputs directly. In terms of the tradition of production function analysis, income per capita can be regarded as an uncontrollable variable outside the production process, which should not be included in the estimation of efficiency in the first stage. Similarly, rural literacy can be used later in the second stage. The data relating to rural literacy have been taken from the census reports.
Thus, the following input variables were used in the first-stage analysis: (i) number of primary health centres (Phcpc), (ii) number of doctors (Drpc), (iii) number of para-medical staff (Parapc), (iv) number of hospital beds available (Bedpc) and (v)

154 Vinish Kathuria and Deepa Sankar
percentage of institutionalised deliveries (Totalbir). The first four variables were standardised for total population covered (using the availability of facilities per 100,000 population) and the last variable was used to look at the extent of the utilisation of the health infrastructure, expressed as the percentage of total births, which also contributes to the health outcomes. Table 1 gives the descriptive statistics of various variables used in the first stage (of estimation of SPF) and second stage (i.e., factors affecting dispersion in efficiency) of regression.
Table 1: Summary statistics
(N=208; 16 States, 14 years)
Variable Definition Mean SD Max. Min.
Phcpc No. of (government) Primary Health Centres per 100,000 rural population
2.99 .903 5.63 0.77
Drpc No. of (government) doctors per 100,000 rural population
4.97 2.58 13.00 1.36
Parapc No. of (government) paramedical staff per 100,000 rural population
54.21 18.62 114.30 15.33
Bedpc Hospital beds per 100,000 rural population
21.64 41.10 201.69 0.86
Lphcpc Log of Phcpc 1.04 0.35 1.73 -0.26
Ldrpc Log of Drpc 1.49 0.47 2.56 0.31
Lparapc Log of Parapc 3.97 0.39 4.74 2.73
Lbedpc Log of Bedpc 2.39 1.02 5.31 -0.15
Totalbir % of births medically attended 47.47 25.47 99.80 11.00
Rurallita Rural literacy rates (%) 36.92 12.82 76.96 17.99
IMR Infant mortality rates 78.04 25.14 140.00 11.00
LIMR Log of IMR 4.28 0.434 4.94 2.40
Lavatorya HHd having access to lavatory (%)
26.20 19.52 7.71 81.33
WaterAvaila Hhd having access to drinking water (%)
93.32 6.05 75.90 99.70
ChildVaccntda Children immunised (%) 42.12 18.67 10.70 65.10
HeRatioa Public spending on health (%) 5.89 1.32 4.04 9.44
Notes: a) descriptive statistics for 16 States.
It is important to mention some of the limitations of the data used. For health care
facilities, which are used in the first stage, we take into account all the PHCs which are working on record, and all the posts of doctors and paramedical staff which are filled. There was no way of checking whether these PHCs were really operating or whether the medical and paramedical staffs were regularly attending their health centres. Due to non-availability of data, we have also not taken account of the effects of such issues as the private sector’s complementary role.

Inter-State Disparities in Health Outcomes in Rural India 155
5 Results We begin this section with the estimates from the SPF model given in equation (3), followed by a discussion on the estimates of efficiencies. Table 2 shows the results of the Hausman specification test. As can be seen from the test statistic, which is 18.76 and is significant at the 1% level, the null of no correlation is rejected and a FE model is clearly preferable to a RE model.
Table 2: Hausman specification test (coefficient estimates using expected value of LDIMR (log of 1/IMR) as dependent variable. Panel estimates)
LDIMR Fixed Effects Random Effects Difference
Lphcpc .2486299 .243685 .0049448
Ldrpc .0729573 .0739103 -.0009529
Lparapc -.039914 -.06154 .021626
Lbedpc .0393186 .0848206 -.045502
Totalbir .0071638 .0071494 .0000144
Chi square (5) 18.76a
Notes: a) denotes significance at 1% level.
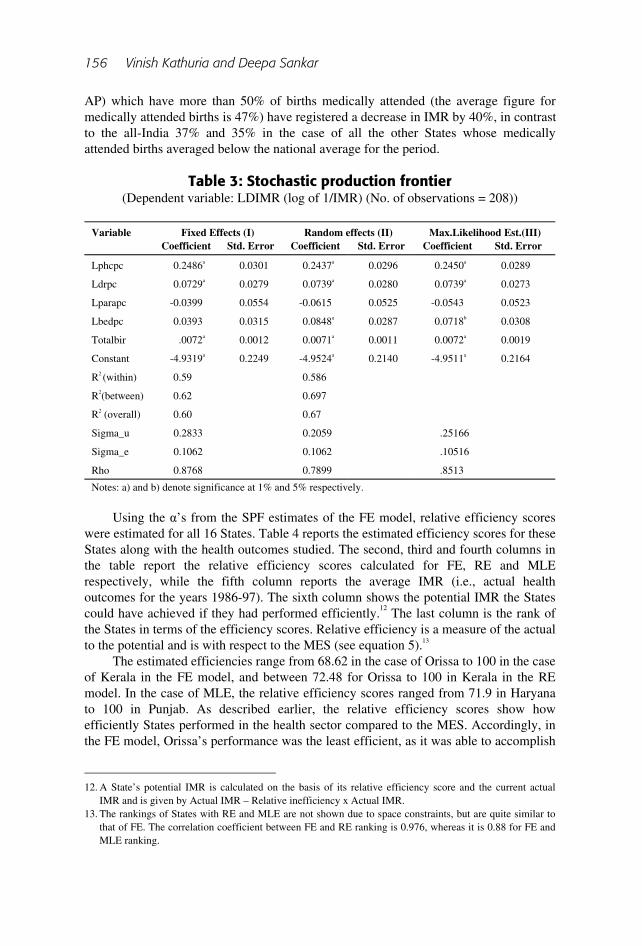
The SPF estimates for the FE, RE and MLE models are given in Table 3, from
which it can be observed that the estimates of within, GLS and MLE show almost similar results. The estimates indicate that the coefficients on health-care facilities like Lphcpc, Ldrpc, Lbedpc and Totalbir not only have the correct sign but are also statistically significant (except in the case of Lbedpc in FE). Only Lparapc is not significant. The implication here is that States with higher per capita health facilities (Lphcpc), more qualified doctors in rural areas (Ldrpc), better infrastructure in terms of beds per capita and a relatively high percentage of attended births have higher chances of better health outcomes in the form of lower IMR. The results also imply that, though the availability of doctors and health facilities by itself ensures somewhat better health outcomes, it does not reflect better accessibility in terms of the affordability or social acceptability of the facilities. In this context, the actual facility-use variable like percentage of births attended medically becomes important. If two States have similar infrastructure in terms of Phcpc, Drpc, Bedpc and Parapc, the State with the higher percentage of births medically attended would have lower IMR.
To illustrate this further, two States – Gujarat and UP – are taken. Their average figures for Phcpc and Drpc variables are almost identical, but their mean figures for Bedpc and Totalbir differ considerably. While the mean of the Totalbir variable is 31% in the case of UP, it is 57% in the case of Gujarat. Accordingly, the average IMR is as high as 104 in the case of UP while it is only 80 in the case of Gujarat. Further, the decline in the rates of IMR for the period 1986-97 is 43% for UP, while it is 54% in the case of Gujarat, which could be attributable to the better utilisation factors. The data further illustrate that six States (Kerala, Karnataka, Haryana, Punjab, Tamil Nadu and
156 Vinish Kathuria and Deepa Sankar
AP) which have more than 50% of births medically attended (the average figure for medically attended births is 47%) have registered a decrease in IMR by 40%, in contrast to the all-India 37% and 35% in the case of all the other States whose medically attended births averaged below the national average for the period.
Table 3: Stochastic production frontier
(Dependent variable: LDIMR (log of 1/IMR) (No. of observations = 208))
Variable Fixed Effects (I) Random effects (II) Max.Likelihood Est.(III) Coefficient Std. Error Coefficient Std. Error Coefficient Std. Error
Lphcpc 0.2486a 0.0301 0.2437a 0.0296 0.2450a 0.0289
Ldrpc 0.0729a 0.0279 0.0739a 0.0280 0.0739a 0.0273
Lparapc -0.0399 0.0554 -0.0615 0.0525 -0.0543 0.0523
Lbedpc 0.0393 0.0315 0.0848a 0.0287 0.0718b 0.0308
Totalbir .0072a 0.0012 0.0071a 0.0011 0.0072a 0.0019
Constant -4.9319a 0.2249 -4.9524a 0.2140 -4.9511a 0.2164
R2 (within) 0.59 0.586
R2(between) 0.62 0.697
R2 (overall) 0.60 0.67
Sigma_u 0.2833 0.2059 .25166
Sigma_e 0.1062 0.1062 .10516
Rho 0.8768 0.7899 .8513
Notes: a) and b) denote significance at 1% and 5% respectively.
Using the α’s from the SPF estimates of the FE model, relative efficiency scores
were estimated for all 16 States. Table 4 reports the estimated efficiency scores for these States along with the health outcomes studied. The second, third and fourth columns in the table report the relative efficiency scores calculated for FE, RE and MLE respectively, while the fifth column reports the average IMR (i.e., actual health outcomes for the years 1986-97). The sixth column shows the potential IMR the States could have achieved if they had performed efficiently.12 The last column is the rank of the States in terms of the efficiency scores. Relative efficiency is a measure of the actual to the potential and is with respect to the MES (see equation 5).13
The estimated efficiencies range from 68.62 in the case of Orissa to 100 in the case of Kerala in the FE model, and between 72.48 for Orissa to 100 in Kerala in the RE model. In the case of MLE, the relative efficiency scores ranged from 71.9 in Haryana to 100 in Punjab. As described earlier, the relative efficiency scores show how efficiently States performed in the health sector compared to the MES. Accordingly, in the FE model, Orissa’s performance was the least efficient, as it was able to accomplish
12. A State’s potential IMR is calculated on the basis of its relative efficiency score and the current actual
IMR and is given by Actual IMR – Relative inefficiency x Actual IMR. 13. The rankings of States with RE and MLE are not shown due to space constraints, but are quite similar to
that of FE. The correlation coefficient between FE and RE ranking is 0.976, whereas it is 0.88 for FE and MLE ranking.
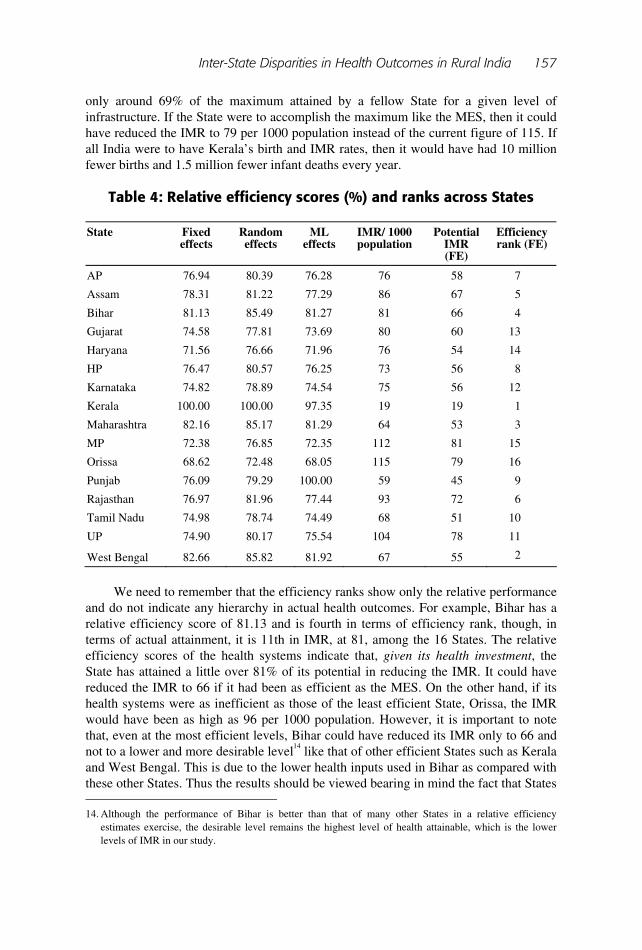
Inter-State Disparities in Health Outcomes in Rural India 157
only around 69% of the maximum attained by a fellow State for a given level of infrastructure. If the State were to accomplish the maximum like the MES, then it could have reduced the IMR to 79 per 1000 population instead of the current figure of 115. If all India were to have Kerala’s birth and IMR rates, then it would have had 10 million fewer births and 1.5 million fewer infant deaths every year.
Table 4: Relative efficiency scores (%) and ranks across States
State Fixed effects
Random effects
ML effects
IMR/ 1000 population
Potential IMR (FE)
Efficiency rank (FE)
AP 76.94 80.39 76.28 76 58 7
Assam 78.31 81.22 77.29 86 67 5
Bihar 81.13 85.49 81.27 81 66 4
Gujarat 74.58 77.81 73.69 80 60 13
Haryana 71.56 76.66 71.96 76 54 14
HP 76.47 80.57 76.25 73 56 8
Karnataka 74.82 78.89 74.54 75 56 12
Kerala 100.00 100.00 97.35 19 19 1
Maharashtra 82.16 85.17 81.29 64 53 3
MP 72.38 76.85 72.35 112 81 15
Orissa 68.62 72.48 68.05 115 79 16
Punjab 76.09 79.29 100.00 59 45 9
Rajasthan 76.97 81.96 77.44 93 72 6
Tamil Nadu 74.98 78.74 74.49 68 51 10
UP 74.90 80.17 75.54 104 78 11
West Bengal 82.66 85.82 81.92 67 55 2
We need to remember that the efficiency ranks show only the relative performance
and do not indicate any hierarchy in actual health outcomes. For example, Bihar has a relative efficiency score of 81.13 and is fourth in terms of efficiency rank, though, in terms of actual attainment, it is 11th in IMR, at 81, among the 16 States. The relative efficiency scores of the health systems indicate that, given its health investment, the State has attained a little over 81% of its potential in reducing the IMR. It could have reduced the IMR to 66 if it had been as efficient as the MES. On the other hand, if its health systems were as inefficient as those of the least efficient State, Orissa, the IMR would have been as high as 96 per 1000 population. However, it is important to note that, even at the most efficient levels, Bihar could have reduced its IMR only to 66 and not to a lower and more desirable level14 like that of other efficient States such as Kerala and West Bengal. This is due to the lower health inputs used in Bihar as compared with these other States. Thus the results should be viewed bearing in mind the fact that States 14. Although the performance of Bihar is better than that of many other States in a relative efficiency
estimates exercise, the desirable level remains the highest level of health attainable, which is the lower levels of IMR in our study.

158 Vinish Kathuria and Deepa Sankar
differ in their health-system inputs and health outcomes. It could be said that (i) lack of real investment in the health sector (caused by poor demand as represented by literacy and awareness) along with (ii) not-so-efficient performance of the rural health systems are the reasons for low levels of health outcomes and achievements.
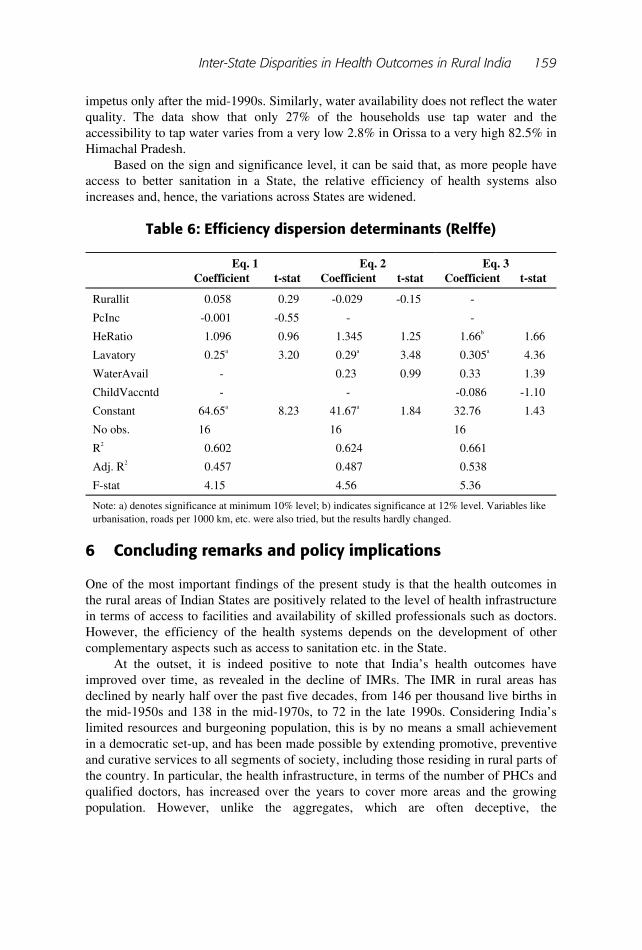
To find out what are the factors that affect the relative efficiency (Relffe) or the dispersion in efficiency, the efficiency index was regressed against the other non-health system determinants of health. We used rural literacy rates (Rurallit), health expenditure as a share of GDP (HeGDP),15 per capita income (PcInc), availability of water – percentage of rural households with drinking water (WaterAvail), percentage of population having a lavatory (Lavatory) and percentage of mothers receiving after-birth care (MotRecdCar). Lastly, the impact of immunisation programmes has been explored, using the percentage of children fully vaccinated (ChildVaccintd). Since some of the variables like child immunisation and mother taking post-birth care are a reflection of awareness in the population, as they move together with the literacy rates, the use of these variables in the same estimates would have led to multi-collinearity, rendering the estimates inefficient. This deterred us from the use of all the variables together in the regressions. Table 5 gives the correlation matrix for different variables. Table 6 gives the results for three variants of the model as shown in equation (6).
Table 5: Correlation matrix
Relffe Percapit Rurallit HeRatio Lavatory WaterAvail
Child Vaccntd
MotRecd Car
Relffe 1.0000
Percapit -0.056 1.0000
Rurallit 0.4372 0.2837 1.0000
HeRatio 0.2666 -0.0998 0.3695 1.0000
Lavatory 0.729 0.0806 0.4595 0.0327 1.0000
WaterAvail -0.055 0.5074 0.0625 0.0065 -0.3166 1.0000
ChildVaccntd 0.1021 0.7434 0.6516 0.3247 0.1640 0.3192 1.0000
MotRecdCar 0.3014 0.5647 0.7103 0.4042 0.3171 0.3258 0.8888 1.0000
It is indeed surprising that literacy is not an important non-health infrastructure-
related variable contributing to the dispersion of relative efficiencies across States. In fact, in none of the variants of the model, has it emerged as significant. Similar results are obtained with respect to the proportion of GDP devoted to health expenditure. However, a house having a lavatory has direct impact on the IMR and hence the efficiency of a State in reducing the IMR. Interestingly, vaccination16 or water availability have come out with the right sign, but are not significant statistically. One possible reason for child vaccination not turning out to be significant is that in the second stage the study used data up to 1997. However, the programme has shown more
15. Per capita health expenditure was also tried, but the results turned out slightly better with HeGDP.
Moreover, these two variables are highly correlated. 16. We could not use MotRecdCar, as it was found to be highly correlated with ChildVaccintd with a
correlation coefficient of 0.89 (see Table 5).
Inter-State Disparities in Health Outcomes in Rural India 159
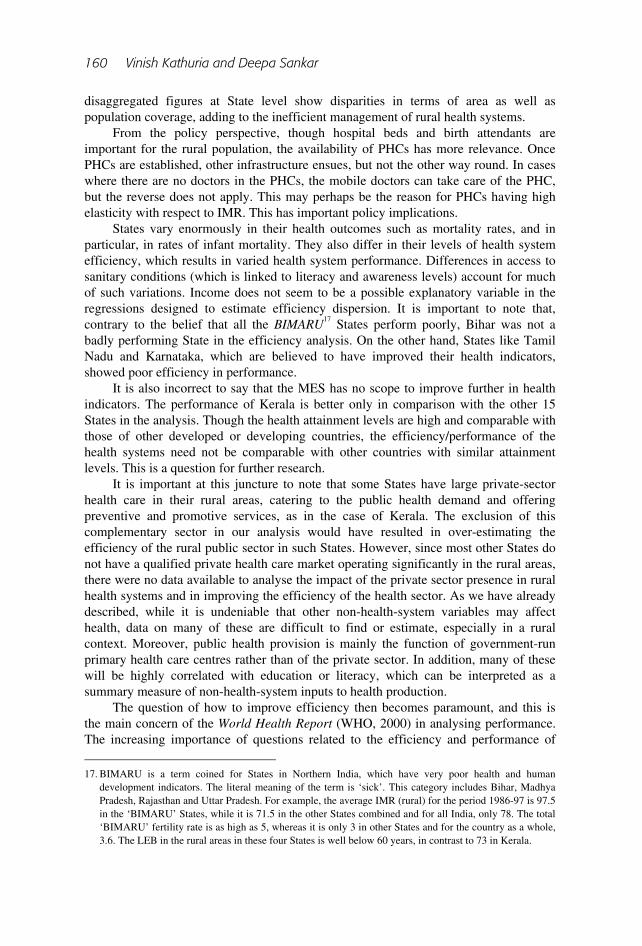
impetus only after the mid-1990s. Similarly, water availability does not reflect the water quality. The data show that only 27% of the households use tap water and the accessibility to tap water varies from a very low 2.8% in Orissa to a very high 82.5% in Himachal Pradesh.
Based on the sign and significance level, it can be said that, as more people have access to better sanitation in a State, the relative efficiency of health systems also increases and, hence, the variations across States are widened.
Table 6: Efficiency dispersion determinants (Relffe)
Eq. 1 Eq. 2 Eq. 3 Coefficient t-stat Coefficient t-stat Coefficient t-stat
Rurallit 0.058 0.29 -0.029 -0.15 -
PcInc -0.001 -0.55 - -
HeRatio 1.096 0.96 1.345 1.25 1.66b 1.66
Lavatory 0.25a 3.20 0.29a 3.48 0.305a 4.36
WaterAvail - 0.23 0.99 0.33 1.39
ChildVaccntd - - -0.086 -1.10
Constant 64.65a 8.23 41.67a 1.84 32.76 1.43
No obs. 16 16 16
R2 0.602 0.624 0.661
Adj. R2 0.457 0.487 0.538
F-stat 4.15 4.56 5.36
Note: a) denotes significance at minimum 10% level; b) indicates significance at 12% level. Variables like urbanisation, roads per 1000 km, etc. were also tried, but the results hardly changed.
6 Concluding remarks and policy implications One of the most important findings of the present study is that the health outcomes in the rural areas of Indian States are positively related to the level of health infrastructure in terms of access to facilities and availability of skilled professionals such as doctors. However, the efficiency of the health systems depends on the development of other complementary aspects such as access to sanitation etc. in the State.
At the outset, it is indeed positive to note that India’s health outcomes have improved over time, as revealed in the decline of IMRs. The IMR in rural areas has declined by nearly half over the past five decades, from 146 per thousand live births in the mid-1950s and 138 in the mid-1970s, to 72 in the late 1990s. Considering India’s limited resources and burgeoning population, this is by no means a small achievement in a democratic set-up, and has been made possible by extending promotive, preventive and curative services to all segments of society, including those residing in rural parts of the country. In particular, the health infrastructure, in terms of the number of PHCs and qualified doctors, has increased over the years to cover more areas and the growing population. However, unlike the aggregates, which are often deceptive, the
160 Vinish Kathuria and Deepa Sankar
disaggregated figures at State level show disparities in terms of area as well as population coverage, adding to the inefficient management of rural health systems.
From the policy perspective, though hospital beds and birth attendants are important for the rural population, the availability of PHCs has more relevance. Once PHCs are established, other infrastructure ensues, but not the other way round. In cases where there are no doctors in the PHCs, the mobile doctors can take care of the PHC, but the reverse does not apply. This may perhaps be the reason for PHCs having high elasticity with respect to IMR. This has important policy implications.
States vary enormously in their health outcomes such as mortality rates, and in particular, in rates of infant mortality. They also differ in their levels of health system efficiency, which results in varied health system performance. Differences in access to sanitary conditions (which is linked to literacy and awareness levels) account for much of such variations. Income does not seem to be a possible explanatory variable in the regressions designed to estimate efficiency dispersion. It is important to note that, contrary to the belief that all the BIMARU
17 States perform poorly, Bihar was not a badly performing State in the efficiency analysis. On the other hand, States like Tamil Nadu and Karnataka, which are believed to have improved their health indicators, showed poor efficiency in performance.
It is also incorrect to say that the MES has no scope to improve further in health indicators. The performance of Kerala is better only in comparison with the other 15 States in the analysis. Though the health attainment levels are high and comparable with those of other developed or developing countries, the efficiency/performance of the health systems need not be comparable with other countries with similar attainment levels. This is a question for further research.
It is important at this juncture to note that some States have large private-sector health care in their rural areas, catering to the public health demand and offering preventive and promotive services, as in the case of Kerala. The exclusion of this complementary sector in our analysis would have resulted in over-estimating the efficiency of the rural public sector in such States. However, since most other States do not have a qualified private health care market operating significantly in the rural areas, there were no data available to analyse the impact of the private sector presence in rural health systems and in improving the efficiency of the health sector. As we have already described, while it is undeniable that other non-health-system variables may affect health, data on many of these are difficult to find or estimate, especially in a rural context. Moreover, public health provision is mainly the function of government-run primary health care centres rather than of the private sector. In addition, many of these will be highly correlated with education or literacy, which can be interpreted as a summary measure of non-health-system inputs to health production.
The question of how to improve efficiency then becomes paramount, and this is the main concern of the World Health Report (WHO, 2000) in analysing performance. The increasing importance of questions related to the efficiency and performance of
17. BIMARU is a term coined for States in Northern India, which have very poor health and human
development indicators. The literal meaning of the term is ‘sick’. This category includes Bihar, Madhya Pradesh, Rajasthan and Uttar Pradesh. For example, the average IMR (rural) for the period 1986-97 is 97.5 in the ‘BIMARU’ States, while it is 71.5 in the other States combined and for all India, only 78. The total ‘BIMARU’ fertility rate is as high as 5, whereas it is only 3 in other States and for the country as a whole, 3.6. The LEB in the rural areas in these four States is well below 60 years, in contrast to 73 in Kerala.

Inter-State Disparities in Health Outcomes in Rural India 161
health systems in developing countries arises from the resource crunch faced by these countries and the need for fiscal prudence in the wake of economic reforms. Overall health expenditure in India is estimated at 4.5% of GDP, below the average of 5.6% for low and middle-income countries. Public health expenditure is less than 1% of GDP, which is among the lowest in the world (World Bank, 2001). Since resources are limited, it is important that they are used wisely and efficiently. Reducing waste and inefficiency is one way of doing this, and choosing the appropriate mix of interventions is also important. The analysis of variations across States in the health systems in rural areas suggests that there are two critical ways to improve health outcomes. The first is to enhance the efficiency of the health sector, i.e., moving further to the frontier. The second is to create more health infrastructure and thus provide better access to rural health facilities and make more physicians available in the rural areas. So, in order to cure what ails the health system in many Indian States, efforts need to be made in the direction not only of providing more infrastructure (quantitative efforts) but also of using them in the most efficient way (qualitative measures).
To conclude, this study has tried to analyse the performance of health systems in the 16 major States in India and to go beyond looking at actual health attainment levels in order to understand the potential levels the States can achieve. To measure performance, it used stochastic production frontier techniques and panel data estimation using data for the period 1986-97. It was found that not all States with better health indicators have efficient health systems. Relative efficiencies differ across States, due to the differences not only in health sector endowment, but also in its efficient use. This demonstrates that States should not only increase their investment in the health sector, but should also manage it more efficiently in order to achieve better health outcomes. In an era of liberalisation of the health sector and diminishing role of government in health provision, the emphasis should definitely be on improving performance.
first submitted June 2004 final revision accepted January 2005
References Baltagi, B. H. (2001) Econometric Analysis of Panel Data. 2nd edn. Chichester: Wiley
Europe Publications. Becker, G. S. (1992) ‘The Economic Way of Looking at Life’, Nobel Lecture,
University of Chicago. Dhawan, R. and Jochumzen, P. (2000) Stochastic Frontier Production Function with
Error-In-Variables. Working Paper 99-07. Sweden: Lund University. Evans, D. B., Tandon, A., Murray, C. J. L. and Lauer, J. A. (2001) The Comparative
Efficiency of National Health Systems in Producing Health: An Analysis of 191 Countries. GPE Discussion Paper Series No. 29. Geneva: WHO, EIP/GPE/EQC.
Farrell, M. J. (1957) ‘The Measurement of Productive Efficiency’, Journal of the Royal Statistical Society Series A, 120 (3): 253-78.
Government of India (2002) India: National Human Development Report 2001. New Delhi: Oxford University Press for the Planning Commission.
Greene, W. H. (2000) Econometric Analysis. 4th edn. Upper Saddle River, NJ: Prentice Hall International Inc.
162 Vinish Kathuria and Deepa Sankar
Hollingsworth, B. and Wildman, J. (2002) The Efficiency of Health Production: Re-estimating the WHO Panel Data Using Parametric and Nonparametric Approaches to Provide Additional Information. Working Paper No. 131. Melbourne: Monash University, Centre for Health Program Evaluation.
Jain, A. K. and Visaria, P. (eds) (1988) Infant Mortality in India: Differentials and Determinants. New Delhi: Sage Publications.
Jamison, D. T., Sandbu, M. and Wang, J. (2001) Cross Country Variation in Mortality Decline, 1962-87: The Role of Country Specific Technical Progress. CMH Working Paper No. WGI: 4. Geneva: WHO, Commission on Macroeconomics and Health.
Leiziger, D., Fay, M., Wodon, W. and Yepes, T. (2003) Achieving Millennium Development Goals – A Multi-Sectoral Approach Revisited. Washington, DC: World Bank.
Murray, C. J. L. and Frenk, J. (1999) A WHO Framework for Health System Performance Assessment: Global Programme on Evidence and Information for Policy. Washington, DC: World Bank.
Murray, C. J. L. and Frenk, J. (2001) ‘World Health Report 2000: A Step towards Evidence-based Health Policy’, The Lancet 357: 1698-1700.
Pitt, M. M. and Lee, L. F. (1981) ‘The Measurement and Sources of Technical Inefficiency in the Indonesian Weaving Industry’, Journal of Development Economics 9: 43-64.
Salomon, J. A., Mathers, C. D., Murray, C. J. L., and Ferguson, B. (2001) Method for Life Expectancy and Healthy Life Expectancy Uncertainty Analysis. Global Programme on Evidence for Health Policy Working Paper No. 10. Geneva: WHO.
Schmidt, P. and Sickles, R. C. (1984) ‘Production Frontiers and Panel Data’, Journal of Business and Economic Statistics 2 (4): 309-16.
Schultz, T. W. (1963) The Economic Value of Education. New York: Columbia University Press.
Wang, J., Jamison, D. T., Bos, E., Preker, A. and Peaboy, J. (1999) Measuring Country Performance on Health: Selected Indicators for 115 countries. Human Development Network, Health, Nutrition and Population Studies. Washington, DC: World Bank.
World Bank (2001) India, Raising the Sights: Better Health Systems for India’s Poor. New Delhi: World Bank, Health, Nutrition, Population Sector Unit.
World Health Organisation (2000) World Health Report: Health Systems: Improving Performance. Geneva: WHO.
Inter-State Disparities in Health Outcomes in Rural India 163
Appendix Table 1: State-wise public spending on health (% of State GDP)
State 1981 1991 1998-9
Andhra Pradesh 1.44 0.99 1.61
Assam 1.48 1.32 1.05
Bihar 1.31 1.37 0.75
Gujarat 1.17 1.18 0.94
Haryana 1.24 0.71 0.71
Himachal Pradesh 4.77 2.75 2.63
Karnataka 1.19 1.32 1.01
Kerala 2.02 1.49 0.95
Madhya Pradesh 1.57 0.99 0.94
Maharashtra 1.13 0.84 0.61
Orissa 1.6 1.37 1.25
Punjab 1.04 0.89 0.86
Rajasthan 2.51 1.35 1.35
Tamil Nadu 1.5 1.94 1.35
Uttar Pradesh 1.06 1.14 0.91
West Bengal 1.39 1.18 0.94
Central Government 0.2 0.25 0.25
Note: Ratios are a moving average of two years, i.e. 1980-81 is average for the years 1980-1 and 1981-2. For the Central Government, ratios are expressed as a proportion of GDP. The Central Government figure for 1998-9 is a moving average of the period 1996-8. Source: Government of India (2002).
Related Documents