Molecular Ecology (1999) 8 , 1753 –1768 © 1999 Blackwell Science Ltd Blackwell Science, Ltd PRIMER NOTES 1753 1754 Graphicraft Limited, Hong Kong Microsatellite loci to determine population structure of the Patagonian toothfish Dissostichus eleginoides A. REILLY and R. D. WARD CSIRO Marine Research, GPO Box 1538 Hobart, Tasmania 7001, Australia Keywords : Dissostichus eleginoides , heterozygosity, microsatellites, Patagonian toothfish, population structure Received 12 March 1999; revision accepted 21 April 1999 Correspondence: A. Reilly. Fax: + 61 (3) 6232 5000; E-mail: [email protected] The Patagonian toothfish ( Dissostichus eleginoides ), found in sub-Antarctic waters, is currently being fished off the east and west coasts of South America and on sea-mounts and submarine ridges of the Indian Ocean. The species is dis- persed throughout the Southern Ocean, crossing a number of political and management zones. With little known of its migrations or life cycle, the extent to which the populations are separated is poorly understood (CCAMLR 1995). How- ever, a knowledge of population distribution is vital for the effective management and sustainability of this fishery. Microsatellites are polymorphic markers, useful for popu- lation genetics studies, including analysis of fishery stock structures (O’Connell & Wright 1997). We report here the isolation and characterization of five D. eleginoides microsatellite loci. To evaluate their suitability for population assessment, each microsatellite locus was analysed in samples from one of the main Australian fishing grounds, Macquarie Island. A genomic DNA library was constructed from DNA extracted from muscle tissue of a single individual (Sambrook et al . 1989). DNA was digested with Sau 3A enzyme and the 500 –750 bp fraction ligated into the dephosphorylated Bam HI site of the vector, pGEM™28 –3Zf(+) (Promega) (Reilly et al . 1999). Ligated plasmids were transformed into XL-1 Blue supercompetent cells (Stratagene). Cells were plated onto selective media and replicated onto uncharged nylon membrane filters (Boehringer Mannheim). The library, consisting of approximately 25 000 recom- binant clones, was screened for microsatellite repeats with a (CA) 9 probe, and later with a combined (AAT) 9 and (AAC) 8 probe. Probes were 3 ′ -end-labelled with digoxygenin molecules, and standard hybridization and wash conditions were used (Boehringer Mannheim 1995). The nucleotide sequence of positive candidate clones was determined with ABI Prism™ Dye Terminator Cycle Sequencing (Perkin- Elmer) using double-stranded plasmid DNA, prepared by the alkaline lysis method (Sambrook et al . 1989). Sequencing products were analysed on an ABI377 Prism DNA auto- sequencer. PCR primers were designed for unique flanking regions of the microsatellite repeats. Oligonucleotides were synthesized by Bresatec, and one primer from each pair was labelled with a fluorescent tag. For microsatellite analysis, total genomic DNA was extracted from 50 mg of alcohol-preserved muscle samples (Sambrook et al . 1989). PCR amplifications were performed in a Perkin-Elmer thermocycler 9600 as 25 μ L reactions con- taining 67 m m Tris-HCl, pH 8.8; 16.6 m m (NH 4 ) 2 SO 4 ; 0.45% Triton X-100; 0.2 mg/mL gelatin; 1.5 m m or 2.5 m m MgCl 2 (Table 1); 0.4 μ m of each primer; 200 μ m dNTPs; 0.5 units Taq F1 DNA polymerase (Fisher Biotech); and ≈ 20 ng genomic DNA template. Denaturation for 3 min at 95 ° C was fol- lowed by 35 cycles made up of 30 s at 96 ° C, 30 s at the annealing temperature (Table 1) and 1 min at 72 ° C. The final step was a prolonged extension of 20 min at 72 ° C. The amplified products were diluted, mixed with formamide loading-dye containing Tamra size standards (ABI), heat- denatured and then loaded on a 4% denaturing acrylamide gel. The samples were run on an ABI377 Prism DNA auto- sequencer and analysed with accompanying software (Genotyper® 2.0). Between 15 and 17 fish were examined from each of two sites about 60 km apart off Macquarie Island. Of 11 loci tested, five were consistently scorable with suitable levels of polymorphism for a population-structure study. Geno- types for each locus were determined and allele frequencies estimated. Each of the five loci was highly polymorphic, Table 1 Characteristics of the five Patagonian toothfish microsatellite loci developed Locus Primer (5′–3′) [MgCl 2 ] (mm) Repeat motif Alleles (n) Anneal temp. (°C29 GenBank Accession no. cmrDe4 GCCTTCCCAAACCTGAGC 2.5 (CAA) 8 12 52 AF105071 ACCCCCTCATCCCAACAC cmrDe13 GAGAGAAGACAGGATAAACAC 2.5 (CAA) 7 7 48 AF105072 TGGCTAAAGCCTTTTTAAC cmrDe9 TGAGGAGCATCCTAATAC 2.5 (CA) 32 24 48 AF105073 AACCAATAGAATCCAGAG cmrDe30 CACTGACCTTTAACCTGCG 1.5 (CA) 14 9 50 AF105074 CCAGCCAAAAAACCTCAC cmrDe2 GAGACCTCTGACAGGGTAG 1.5 (CA) 29 16 50 AF105075 TGACAGATGTTTTCTGATTAAG

Welcome message from author
This document is posted to help you gain knowledge. Please leave a comment to let me know what you think about it! Share it to your friends and learn new things together.
Transcript
Molecular Ecology (1999)
8
, 1753–1768
© 1999 Blackwell Science Ltd
Blackwell Science, Ltd
PRIMER NOTES
17531754Graphicraft Limited, Hong Kong
Microsatellite loci to determine population structure of the Patagonian toothfish
Dissostichus eleginoides
A . REILLY and R . D . WARD
CSIRO Marine Research, GPO Box 1538 Hobart, Tasmania 7001, Australia
Keywords
:
Dissostichus eleginoides
, heterozygosity, microsatellites, Patagonian toothfish, population structure
Received 12 March 1999; revision accepted 21 April 1999
Correspondence: A. Reilly. Fax: + 61 (3) 6232 5000; E-mail: [email protected]
The Patagonian toothfish (
Dissostichus eleginoides
), found insub-Antarctic waters, is currently being fished off the eastand west coasts of South America and on sea-mounts andsubmarine ridges of the Indian Ocean. The species is dis-persed throughout the Southern Ocean, crossing a number ofpolitical and management zones. With little known of itsmigrations or life cycle, the extent to which the populationsare separated is poorly understood (CCAMLR 1995). How-ever, a knowledge of population distribution is vital for theeffective management and sustainability of this fishery.
Microsatellites are polymorphic markers, useful for popu-lation genetics studies, including analysis of fishery stockstructures (O’Connell & Wright 1997). We report here theisolation and characterization of five
D. eleginoides
microsatelliteloci. To evaluate their suitability for population assessment,each microsatellite locus was analysed in samples from oneof the main Australian fishing grounds, Macquarie Island.
A genomic DNA library was constructed from DNAextracted from muscle tissue of a single individual (Sambrook
et al
. 1989). DNA was digested with
Sau
3A enzyme andthe 500–750 bp fraction ligated into the dephosphorylated
Bam
HI site of the vector, pGEM™28–3Zf(+) (Promega) (Reilly
et al
. 1999). Ligated plasmids were transformed into XL-1Blue supercompetent cells (Stratagene). Cells were platedonto selective media and replicated onto uncharged nylonmembrane filters (Boehringer Mannheim).
The library, consisting of approximately 25 000 recom-binant clones, was screened for microsatellite repeats witha (CA)
9
probe, and later with a combined (AAT)
9
and(AAC)
8
probe. Probes were 3
′
-end-labelled with digoxygeninmolecules, and standard hybridization and wash conditionswere used (Boehringer Mannheim 1995). The nucleotidesequence of positive candidate clones was determined withABI Prism™ Dye Terminator Cycle Sequencing (Perkin-Elmer) using double-stranded plasmid DNA, prepared bythe alkaline lysis method (Sambrook
et al
. 1989). Sequencingproducts were analysed on an ABI377 Prism DNA auto-sequencer. PCR primers were designed for unique flankingregions of the microsatellite repeats. Oligonucleotides weresynthesized by Bresatec, and one primer from each pair waslabelled with a fluorescent tag.
For microsatellite analysis, total genomic DNA wasextracted from 50 mg of alcohol-preserved muscle samples(Sambrook
et al
. 1989). PCR amplifications were performedin a Perkin-Elmer thermocycler 9600 as 25
µ
L reactions con-taining 67 m
m
Tris-HCl, pH 8.8; 16.6 m
m
(NH
4
)
2
SO
4
; 0.45%Triton X-100; 0.2 mg/mL gelatin; 1.5 m
m
or 2.5 m
m
MgCl
2
(Table 1); 0.4
µ
m
of each primer; 200
µ
m
dNTPs; 0.5 units
Taq
F1 DNA polymerase (Fisher Biotech); and
≈
20 ng genomicDNA template. Denaturation for 3 min at 95
°
C was fol-lowed by 35 cycles made up of 30 s at 96
°
C, 30 s at theannealing temperature (Table 1) and 1 min at 72
°
C. The finalstep was a prolonged extension of 20 min at 72
°
C. Theamplified products were diluted, mixed with formamideloading-dye containing Tamra size standards (ABI), heat-denatured and then loaded on a 4% denaturing acrylamidegel. The samples were run on an ABI377 Prism DNA auto-sequencer and analysed with accompanying software(Genotyper® 2.0).
Between 15 and 17 fish were examined from each of twosites about 60 km apart off Macquarie Island. Of 11 locitested, five were consistently scorable with suitable levels ofpolymorphism for a population-structure study. Geno-types for each locus were determined and allele frequenciesestimated. Each of the five loci was highly polymorphic,
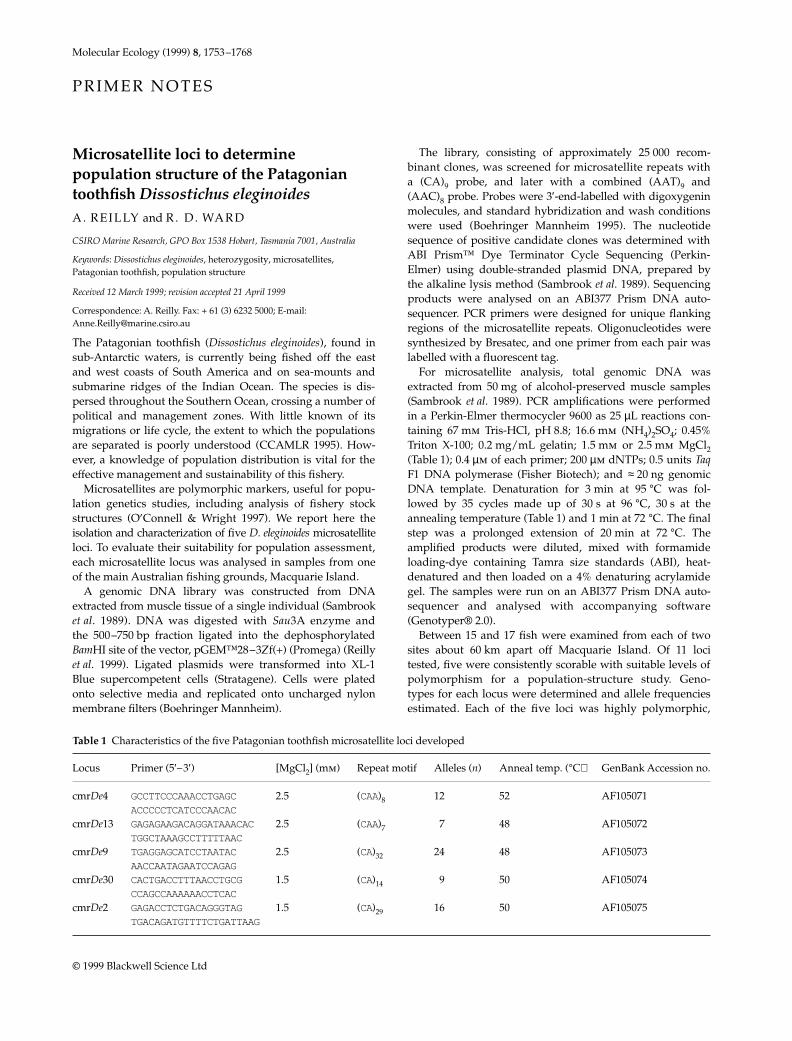
Table 1 Characteristics of the five Patagonian toothfish microsatellite loci developed
Locus Primer (5′–3′) [MgCl2] (mm) Repeat motif Alleles (n) Anneal temp. (°C) GenBank Accession no.
cmrDe4 GCCTTCCCAAACCTGAGC 2.5 (CAA)8 12 52 AF105071ACCCCCTCATCCCAACAC
cmrDe13 GAGAGAAGACAGGATAAACAC2.5 (CAA)7 7 48 AF105072TGGCTAAAGCCTTTTTAAC
cmrDe9 TGAGGAGCATCCTAATAC 2.5 (CA)32 24 48 AF105073AACCAATAGAATCCAGAG
cmrDe30 CACTGACCTTTAACCTGCG 1.5 (CA)14 9 50 AF105074CCAGCCAAAAAACCTCAC
cmrDe2 GAGACCTCTGACAGGGTAG 1.5 (CA)29 16 50 AF105075TGACAGATGTTTTCTGATTAAG
MEC723.fm Page 1753 Wednesday, September 29, 1999 10:30 AM
1754
P R I M E R N O T E S
© 1999 Blackwell Science Ltd,
Molecular Ecology
, 8, 1753–1768
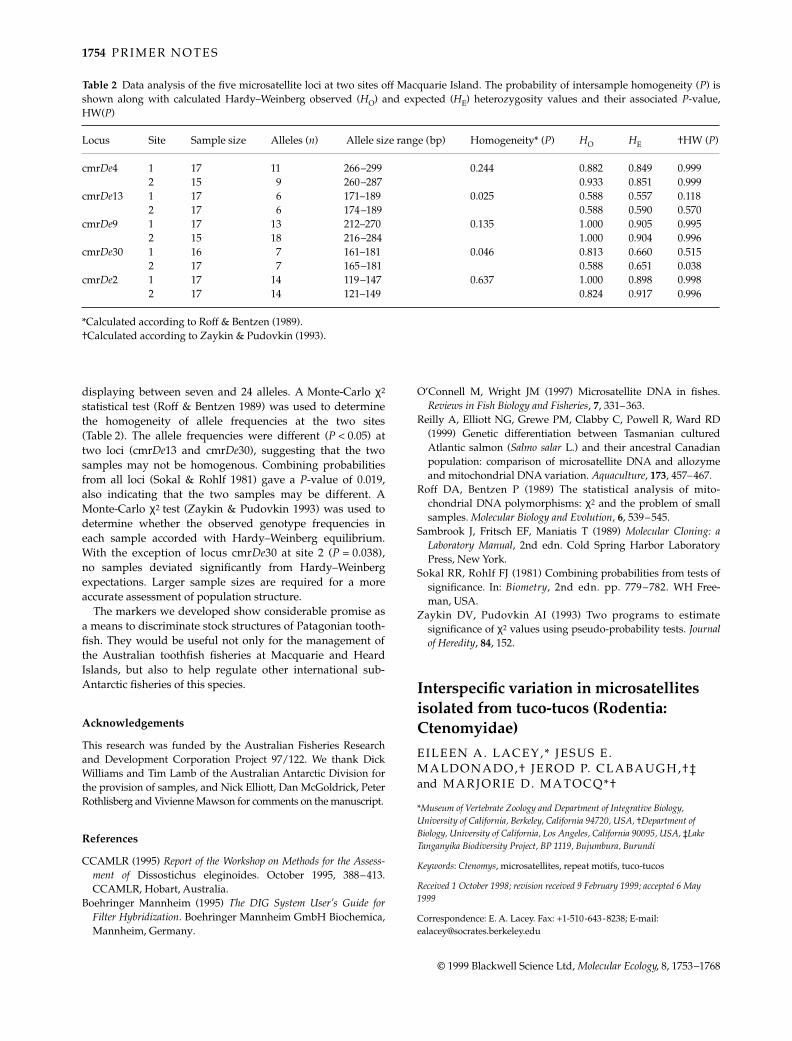
displaying between seven and 24 alleles. A Monte-Carlo
χ
2
statistical test (Roff & Bentzen 1989) was used to determinethe homogeneity of allele frequencies at the two sites(Table 2). The allele frequencies were different (
P
< 0.05) attwo loci (cmr
De
13 and cmr
De
30), suggesting that the twosamples may not be homogenous. Combining probabilitiesfrom all loci (Sokal & Rohlf 1981) gave a
P
-value of 0.019,also indicating that the two samples may be different. AMonte-Carlo
χ
2
test (Zaykin & Pudovkin 1993) was used todetermine whether the observed genotype frequencies ineach sample accorded with Hardy–Weinberg equilibrium.With the exception of locus cmr
De
30 at site 2 (
P
= 0.038),no samples deviated significantly from Hardy–Weinbergexpectations. Larger sample sizes are required for a moreaccurate assessment of population structure.
The markers we developed show considerable promise asa means to discriminate stock structures of Patagonian tooth-fish. They would be useful not only for the management ofthe Australian toothfish fisheries at Macquarie and HeardIslands, but also to help regulate other international sub-Antarctic fisheries of this species.
Acknowledgements
This research was funded by the Australian Fisheries Researchand Development Corporation Project 97/122. We thank DickWilliams and Tim Lamb of the Australian Antarctic Division forthe provision of samples, and Nick Elliott, Dan McGoldrick, PeterRothlisberg and Vivienne Mawson for comments on the manuscript.
References
CCAMLR (1995)
Report of the Workshop on Methods for the Assess-ment of
Dissostichus eleginoides. October 1995, 388–413.CCAMLR, Hobart, Australia.
Boehringer Mannheim (1995)
The DIG System User’s Guide forFilter Hybridization
. Boehringer Mannheim GmbH Biochemica,Mannheim, Germany.
O’Connell M, Wright JM (1997) Microsatellite DNA in fishes.
Reviews in Fish Biology and Fisheries
,
7
, 331–363.Reilly A, Elliott NG, Grewe PM, Clabby C, Powell R, Ward RD
(1999) Genetic differentiation between Tasmanian culturedAtlantic salmon (
Salmo salar
L.) and their ancestral Canadianpopulation: comparison of microsatellite DNA and allozymeand mitochondrial DNA variation.
Aquaculture
,
173
, 457–467.Roff DA, Bentzen P (1989) The statistical analysis of mito-
chondrial DNA polymorphisms:
χ
2
and the problem of smallsamples.
Molecular Biology and Evolution
,
6
, 539–545.Sambrook J, Fritsch EF, Maniatis T (1989)
Molecular Cloning: aLaboratory Manual
, 2nd edn. Cold Spring Harbor LaboratoryPress, New York.
Sokal RR, Rohlf FJ (1981) Combining probabilities from tests ofsignificance. In:
Biometry
, 2nd edn. pp. 779–782. WH Free-man, USA.
Zaykin DV, Pudovkin AI (1993) Two programs to estimatesignificance of
χ
2
values using pseudo-probability tests.
Journalof Heredity
,
84
, 152.
8101999731
primer noteprimer note
17541756Graphicraft Limited, Hong Kong
Interspecific variation in microsatellites isolated from tuco-tucos (Rodentia: Ctenomyidae)
E ILEEN A. LACEY,* JESUS E . MALDONADO,† JEROD P. CLABAUGH,†‡ and MARJORIE D. MATOCQ*†
*
Museum of Vertebrate Zoology and Department of Integrative Biology, University of California, Berkeley, California 94720, USA,
†
Department of Biology, University of California, Los Angeles, California 90095, USA,
‡
Lake Tanganyika Biodiversity Project, BP 1119, Bujumbura, Burundi
Keywords
:
Ctenomys
, microsatellites, repeat motifs, tuco-tucos
Received 1 October 1998; revision received 9 February 1999; accepted 6 May 1999
Correspondence: E. A. Lacey. Fax: +1-510-643-8238; E-mail: [email protected]
Table 2 Data analysis of the five microsatellite loci at two sites off Macquarie Island. The probability of intersample homogeneity (P) isshown along with calculated Hardy–Weinberg observed (HO) and expected (HE) heterozygosity values and their associated P-value,HW(P)
Locus Site Sample size Alleles (n) Allele size range (bp) Homogeneity* (P) HO HE †HW (P)
cmrDe4 1 17 11 266–299 0.244 0.882 0.849 0.9992 15 9 260–287 0.933 0.851 0.999
cmrDe13 1 17 6 171–189 0.025 0.588 0.557 0.1182 17 6 174–189 0.588 0.590 0.570
cmrDe9 1 17 13 212–270 0.135 1.000 0.905 0.9952 15 18 216–284 1.000 0.904 0.996
cmrDe30 1 16 7 161–181 0.046 0.813 0.660 0.5152 17 7 165–181 0.588 0.651 0.038
cmrDe2 1 17 14 119–147 0.637 1.000 0.898 0.9982 17 14 121–149 0.824 0.917 0.996
*Calculated according to Roff & Bentzen (1989).†Calculated according to Zaykin & Pudovkin (1993).
MEC723.fm Page 1754 Wednesday, September 29, 1999 10:30 AM
P R I M E R N O T E S
1755
© 1999 Blackwell Science Ltd,
Molecular Ecology
, 8, 1753–1768
Microsatellites are widely used in studies of populationgenetic structure due to their often high levels of intraspe-cific variability. Although the utility of these markers isincreased if primers designed for one species are used toamplify loci from numerous taxa, concerns have arisenregarding interspecific differences in repeat motifs that mayinfluence levels of variability (Estoup
et al
. 1995; van Treuren
et al
. 1997). In particular, interruption of simple dinucleotiderepeats has been linked to decreased allelic diversity (e.g.Pépin
et al
. 1995), suggesting that microsatellite structureshould be considered when choosing loci for interspecificcomparisons of genetic variation.
In the current study, microsatellites were developed tocompare population genetic structure in two species ofctenomyid rodents: the Patagonian tuco-tuco (
Ctenomyshaigi
) and the colonial tuco-tuco (
C. sociabilis
). Microsatelliteloci were isolated from a genomic library for
C. haigi
; thedecision to use
C. haigi
as the source for microsatellites was
based on the quality of genomic DNA extracted from threeindividuals of each species.
Sau
3AI-digested DNA from asingle
C. haigi
was ligated into pBK-CMV phagemid vector(ZAP Express Vector Kit; Stratagene). Ligation products werepackaged (Gigapack III Gold Packaging Kit; Stratagene),after which the packaged phage was incorporated into XL1-Blue MRF
′
cells (Stratagene) that had been heat shocked at37
°
C for 15 min. The resulting library was screened using a(CA)
15
probe that had been end-labelled with [
γ
32
P]-ATP(Richardson 1965). Clones that scored positive during twosuccessive rounds of screening were sequenced in both direc-tions using M13 Reverse and T7 Promoter primers (UnitedStates Biochemical).
PCR primers were designed for 20 repeat-containingsequences using Primer 0.5 (Whitehead Institute, MIT). Thir-teen of these primer pairs produced well-resolved PCR prod-ucts for both
C. sociabilis
and
C. haigi
(Table 1). Amplificationof microsatellites was carried out in a 15-
µ
L volume containing
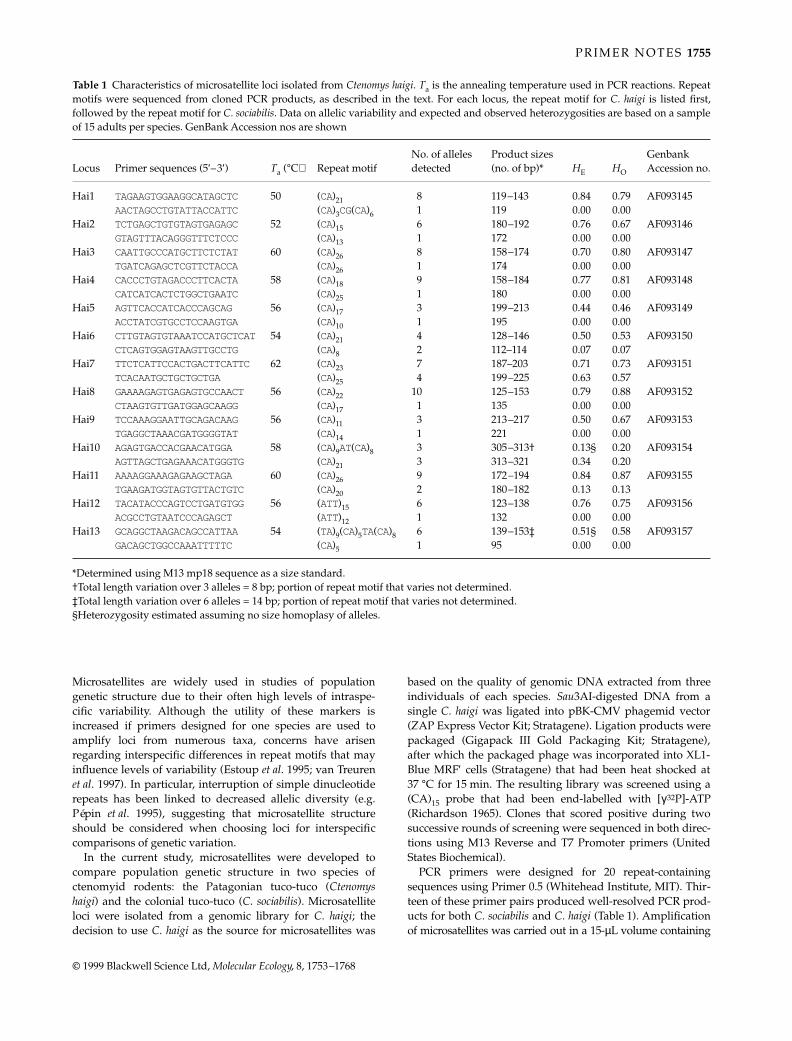
Table 1 Characteristics of microsatellite loci isolated from Ctenomys haigi. Ta is the annealing temperature used in PCR reactions. Repeatmotifs were sequenced from cloned PCR products, as described in the text. For each locus, the repeat motif for C. haigi is listed first,followed by the repeat motif for C. sociabilis. Data on allelic variability and expected and observed heterozygosities are based on a sampleof 15 adults per species. GenBank Accession nos are shown
Locus Primer sequences (5′–3′) Ta (°C) Repeat motifNo. of alleles detected
Product sizes (no. of bp)* HE HO
Genbank Accession no.
Hai1 TAGAAGTGGAAGGCATAGCTC 50 (CA)21 8 119–143 0.84 0.79 AF093145AACTAGCCTGTATTACCATTC (CA)3CG(CA)6 1 119 0.00 0.00
Hai2 TCTGAGCTGTGTAGTGAGAGC 52 (CA)15 6 180–192 0.76 0.67 AF093146GTAGTTTACAGGGTTTCTCCC (CA)13 1 172 0.00 0.00
Hai3 CAATTGCCCATGCTTCTCTAT 60 (CA)26 8 158–174 0.70 0.80 AF093147TGATCAGAGCTCGTTCTACCA (CA)26 1 174 0.00 0.00
Hai4 CACCCTGTAGACCCTTCACTA 58 (CA)18 9 158–184 0.77 0.81 AF093148CATCATCACTCTGGCTGAATC (CA)25 1 180 0.00 0.00
Hai5 AGTTCACCATCACCCAGCAG 56 (CA)17 3 199–213 0.44 0.46 AF093149ACCTATCGTGCCTCCAAGTGA (CA)10 1 195 0.00 0.00
Hai6 CTTGTAGTGTAAATCCATGCTCAT54 (CA)21 4 128–146 0.50 0.53 AF093150CTCAGTGGAGTAAGTTGCCTG (CA)8 2 112–114 0.07 0.07
Hai7 TTCTCATTCCACTGACTTCATTC 62 (CA)23 7 187–203 0.71 0.73 AF093151TCACAATGCTGCTGCTGA (CA)25 4 199–225 0.63 0.57
Hai8 GAAAAGAGTGAGAGTGCCAACT 56 (CA)22 10 125–153 0.79 0.88 AF093152CTAAGTGTTGATGGAGCAAGG (CA)17 1 135 0.00 0.00
Hai9 TCCAAAGGAATTGCAGACAAG 56 (CA)11 3 213–217 0.50 0.67 AF093153TGAGGCTAAACGATGGGGTAT (CA)14 1 221 0.00 0.00
Hai10 AGAGTGACCACGAACATGGA 58 (CA)9AT(CA)8 3 305–313† 0.13§ 0.20 AF093154AGTTAGCTGAGAAACATGGGTG (CA)21 3 313–321 0.34 0.20
Hai11 AAAAGGAAAGAGAAGCTAGA 60 (CA)26 9 172–194 0.84 0.87 AF093155TGAAGATGGTAGTGTTACTGTC (CA)20 2 180–182 0.13 0.13
Hai12 TACATACCCAGTCCTGATGTGG 56 (ATT)15 6 123–138 0.76 0.75 AF093156ACGCCTGTAATCCCAGAGCT (ATT)12 1 132 0.00 0.00
Hai13 GCAGGCTAAGACAGCCATTAA 54 (TA)9(CA)5TA(CA)8 6 139–153‡ 0.51§ 0.58 AF093157GACAGCTGGCCAAATTTTTC (CA)5 1 95 0.00 0.00
*Determined using M13 mp18 sequence as a size standard.†Total length variation over 3 alleles = 8 bp; portion of repeat motif that varies not determined.‡Total length variation over 6 alleles = 14 bp; portion of repeat motif that varies not determined.§Heterozygosity estimated assuming no size homoplasy of alleles.
MEC723.fm Page 1755 Wednesday, September 29, 1999 10:30 AM
1756 P R I M E R N O T E S
© 1999 Blackwell Science Ltd, Molecular Ecology, 8, 1753–1768
30 ng of DNA, 0.2 µm each primer, 0.2 mm dNTP, 1× Taq buffer(1.5 mm MgCl2, 10 mm Tris-HCl, 50 mm KCl), and 0.75 unitsof Taq polymerase (Boehringer Mannheim). Amplificationconditions were 94 °C for 5 min, followed by 34 cycles of94 °C for 30 s, Ta for 30 s, and 72 °C for 45 s, with a finalextension of 72 °C for 5 min. Locus-specific annealing tem-peratures are given in Table 1. To assess allelic variation ateach locus, DNA samples from 15 adults per species wereamplified as above, but with one primer per locus end-labelled with [γ32P]-ATP. PCR products were electrophoresedon 6% polyacrylamide sequencing gels and then visualizedvia autoradiography. Radioactively labelled M13 mp18sequence was used as a size standard on all gels.
To compare repeat motifs in C. haigi and C. sociabilis, wecloned (TA Cloning Kit; Invitrogen) and then sequenced (T7promotor primer) PCR products from one individual perspecies per locus. Repeat motifs at 10 (76.9%) of the locisurveyed did not differ between the study species (Table 1). Incontrast, interspecific differences in repeat motif weredetected for the three remaining loci (Hai 1, 10, 13). At eachof these loci, one species exhibited a simple repeat motifwhile the other exhibited a compound motif composed of twoor more distinct repeat segments. Two of these compoundrepeats were present in C. haigi, indicating that imperfectrepeat motifs occurred in the source, as well as the non-source, species for microsatellites.
Although the effects of imperfect repeats on allelic diver-sity in tuco-tucos have yet to be determined, interruptedrepeat motifs are thought to be associated with decreasedlevels of microsatellite variability in other taxa (Garza et al.1995; Pépin et al. 1995; Jarne & Lagoda 1996). If perfect andimperfect repeats differentially affect allelic diversity theninterspecific variation in repeat motifs may confound cross-taxa comparisons of genetic variability. Nearly 25% of theloci surveyed in this study exhibited interspecific differencesin repeat motif, underscoring the need to examine micro-satellite structure when comparing patterns of geneticvariability among species.
Acknowledgements
We thank R. K. Wayne for the use of his laboratory during theearly stages of this project. K. P. Koepfli and M. F. Smith alsoassisted with the development of microsatellite loci. Funding forthis project was provided by the Miller Institute for BasicResearch in Science and the Museum of Vertebrate Zoology, bothat the University of California, Berkeley.
References
Estoup A, Tailliez C, Cornuet J-M, Solignac M (1995) Size homo-plasy and mutational processes of interrupted microsatellitesin two bee species, Apis mellifera and Bombus terrestris (Apidae).Molecular Biology and Evolution, 12, 1074–1084.
Garza JC, Slatkin M, Freimer NB (1995) Microsatellite allele fre-quencies in humans and chimpanzees, with implications forconstraints on allele size. Molecular Biology and Evolution, 12,594–603.
Jarne P, Lagoda PJL (1996) Microsatellites, from molecules to
populations and back. Trends in Ecology and Evolution, 11, 424–429.
Pépin L, Amigues Y, Lépingle A, Berthier J-L, Bensaid A, Vaiman D(1995) Sequence conservation of microsatellites between Bostaurus (cattle), Capra hircus (goat) and related species. Examplesof use in parentage testing and phylogeny analysis. Heredity,74, 53–61.
Richardson CC (1965) Phosphorylation of nucleic acid by anenzyme from T4 bacteriophage-infected Escherichia coli. Proceedingsof the National Academy of Sciences of the USA, 54, 158–165.
van Treuren R, Kuittinen H, Kärkkäinen K, Baena-Gonzalez E,Savolainen O (1997) Evolution of microsatellites in Arabispetraea and Arabis lyrata, outcrossing relatives of Arabidopsisthaliana. Molecular Biology and Evolution, 14, 220–229.
8101999736primer notes. susnik, a. snoj and p. dovˇ17561758Graphicraft Limited, Hong Kong
Microsatellites in grayling (Thymallus thymallus): comparison of two geographically remote populations from the Danubian and Adriatic river basin in Slovenia
S . SUSNIK, A. SNOJ and P. DOV3
Department of Animal Science, Biotechnical Faculty, University of Ljubljana, Groblje 3, 1230 Dom9ale, Slovenia
Keywords: grayling, microsatellites, polymorphism, Thymallus
Received 26 February 1999; revision received 30 March 1999; accepted 14 May 1999
Correspondence: S. Suznik. Fax: + 386 61 721005; E-mail: [email protected]
There are two geographically separate populations of gray-ling (Thymallus thymallus) in Slovenia inhabiting the Danubiandrainage (Danubian type) and the So5a river system (Adri-atic type). The two populations have their own phenotypiccharacteristics which make them morphologically different(Volj5 & Ocvirk 1982). No detailed analysis has been per-formed to evaluate these differences at the molecular level,except for one microsatellite locus (Snoj et al. 1999). Intensivestocking of the So5a drainage with Danubian grayling duringthe last few years could cause an uncontrolled mixing of bothpopulations and potentially threaten the existence of Adri-atic grayling in Slovenia. To help differentiate these popula-tions for conservation purposes and to assess the diversitybetween populations, we compared both types of graylingfor genetic polymorphisms.
To identify genetic polymorphisms between the Adriaticand Danubian grayling, we examined several microsatelliteloci. DNA was extracted from erythrocytes (Medrano et al.1990) and a genomic library was constructed as described byRassmann et al. (1991). Briefly, size-selected (200–800 bp) Sau3AIgenomic restriction fragments were ligated into the BamHI-restricted pBluescript vector (Stratagene) and propagatedinto Epicurian Coli Cells (Stratagene). Recombinant colonieswere probed with (CA)n and (AG)n polymers. Screening ofthe library was performed with the Chemilluminescence
MEC723.fm Page 1756 Wednesday, September 29, 1999 10:30 AM
P R I M E R N O T E S 1757
© 1999 Blackwell Science Ltd, Molecular Ecology, 8, 1753–1768
Quick-Light™ Genome Mapping Probe Kit (FMC, Bioproducts)according to the manufacturer’s instructions. Plasmids frompositive clones were cycle-sequenced using universal T3 and T7primers and the dRhodamine Terminator Cycle SequencingReady Reaction Kit (PE Applied Biosystems) following themanufacturer’s protocol. The extension products were analysedusing the ABI Prism 310 automated sequencer. Sequence datafor the microsatellites studied have been deposited at theGenBank Data Library (Table 1).
Microsatellite polymorphisms were analysed for five loci(BFRO005, BFRO006, BRO007, BFRO008 and BFRO009) usingprimers designed from unique sequences flanking a micro-satellite repeat. These loci were amplified using the polymerasechain reaction (PCR), with the profile of initial denaturationof 94 °C for 3 min and 30 cycles of 94 °C for 45 s, 55 °C for 15 sand 72 °C for 5 s, in the MJ Research PTC-100 Thermalcycler. All PCRs (10 µL) contained 50 ng of template DNA,0.5 µM of each primer, 0.2 mm dNTP, 1.5 mm MgCl2, 20 mmTris-HCl, 50 mm KCl and 0.5 U of Taq polymerase (PE AppliedBiosystems). Aliquots of fluorescently labelled amplifiedDNA were mixed with formamide and GENESCAN-350(TAMRA) Size Standard (PE Applied Biosystems) and geno-typed on the ABI Prism 310 Genetic Analyser using theGeneScan™ Analysis Software 2.1.
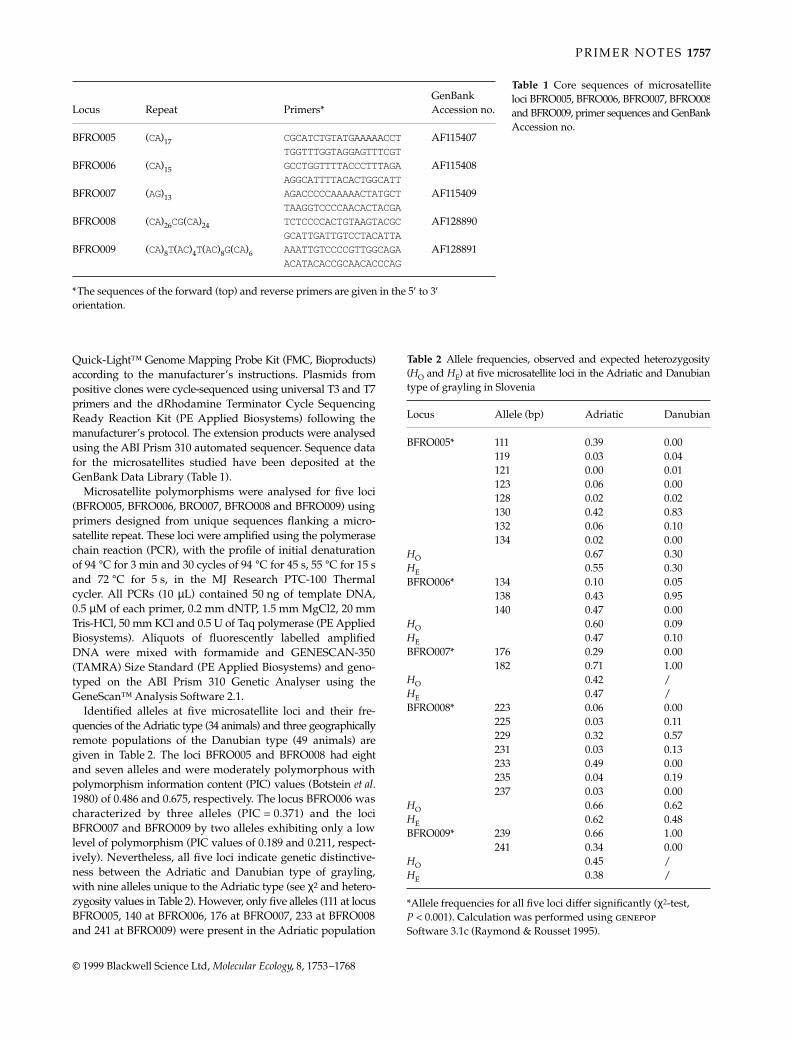
Identified alleles at five microsatellite loci and their fre-quencies of the Adriatic type (34 animals) and three geographicallyremote populations of the Danubian type (49 animals) aregiven in Table 2. The loci BFRO005 and BFRO008 had eightand seven alleles and were moderately polymorphous withpolymorphism information content (PIC) values (Botstein et al.1980) of 0.486 and 0.675, respectively. The locus BFRO006 wascharacterized by three alleles (PIC = 0.371) and the lociBFRO007 and BFRO009 by two alleles exhibiting only a lowlevel of polymorphism (PIC values of 0.189 and 0.211, respect-ively). Nevertheless, all five loci indicate genetic distinctive-ness between the Adriatic and Danubian type of grayling,with nine alleles unique to the Adriatic type (see χ2 and hetero-zygosity values in Table 2). However, only five alleles (111 at locusBFRO005, 140 at BFRO006, 176 at BFRO007, 233 at BFRO008and 241 at BFRO009) were present in the Adriatic population
Locus Repeat Primers*GenBank Accession no.
BFRO005 (CA)17 CGCATCTGTATGAAAAACCT AF115407TGGTTTGGTAGGAGTTTCGT
BFRO006 (CA)15 GCCTGGTTTTACCCTTTAGA AF115408AGGCATTTTACACTGGCATT
BFRO007 (AG)13 AGACCCCCAAAAACTATGCT AF115409TAAGGTCCCCAACACTACGA
BFRO008 (CA)26CG(CA)24 TCTCCCCACTGTAAGTACGC AF128890GCATTGATTGTCCTACATTA
BFRO009 (CA)8T(AC)4T(AC)8G(CA)6 AAATTGTCCCCGTTGGCAGA AF128891ACATACACCGCAACACCCAG
*The sequences of the forward (top) and reverse primers are given in the 5′ to 3′ orientation.
Table 1 Core sequences of microsatelliteloci BFRO005, BFRO006, BFRO007, BFRO008and BFRO009, primer sequences and GenBankAccession no.
Table 2 Allele frequencies, observed and expected heterozygosity(HO and HE) at five microsatellite loci in the Adriatic and Danubiantype of grayling in Slovenia
Locus Allele (bp) Adriatic Danubian
BFRO005* 111 0.39 0.00119 0.03 0.04121 0.00 0.01123 0.06 0.00128 0.02 0.02130 0.42 0.83132 0.06 0.10134 0.02 0.00
HO 0.67 0.30HE 0.55 0.30BFRO006* 134 0.10 0.05
138 0.43 0.95140 0.47 0.00
HO 0.60 0.09HE 0.47 0.10BFRO007* 176 0.29 0.00
182 0.71 1.00HO 0.42 /HE 0.47 /BFRO008* 223 0.06 0.00
225 0.03 0.11229 0.32 0.57231 0.03 0.13233 0.49 0.00235 0.04 0.19237 0.03 0.00
HO 0.66 0.62HE 0.62 0.48BFRO009* 239 0.66 1.00
241 0.34 0.00HO 0.45 /HE 0.38 /
*Allele frequencies for all five loci differ significantly (χ2-test, P < 0.001). Calculation was performed using genepop Software 3.1c (Raymond & Rousset 1995).
MEC723.fm Page 1757 Wednesday, September 29, 1999 10:30 AM
1758 P R I M E R N O T E S
© 1999 Blackwell Science Ltd, Molecular Ecology, 8, 1753–1768
at sufficiently high frequencies to be useful as a diagnostictool for the differentiation between the Adriatic and Danubiantype of grayling.
Acknowledgements
We thank Duzan Jesenzek, Duzan Ul5ar, Spela Budihna andSimon Plezko for providing samples.
References
Botstein D, White R, Skolnik M, Dawis RW (1980) Constructionof genetic linkage map using RFLP. American Journal of HumanGenetics, 32, 314–331.
Medrano FJ, Aasen E, Sharrow L (1990) DNA extraction fromnucleated red blood cells. Biotechniques, 8, 43.
Rassmann K, Schlötterer C, Tautz D (1991) Isolation of simple-sequence loci for use in polymerase chain reaction-based DNAfingerprinting. Electrophoresis, 12, 113–118.
Raymond M, Rousset F (1995) genepop (Version 1.2): populationgenetics software for exact tests and ecumenicism. Journal ofHeredity, 86, 248–249.
Snoj A, Suznik S, Pohar J, Dov, P (1999) The first microsatellitemarker (BFRO004) for grayling, informative for its Adriatic popu-lation. Animal Genetics, 30, 74.
Volj5 B, Ocvirk J (1982) Endemi5ne sladkovodne ribje vrste vjadranskih pritokih (2). Ribi8, 7–8, 211–213.
8101999747primer noteg. tan et al.17581760Graphicraft Limited, Hong Kong
Polymorphic microsatellite markers in Ictalurus punctatus and related catfish species
G. TAN, A. KARSI , P. L I , S . KIM, X . ZHENG, H. KUCUKTAS, B . J . ARGUE, R . A. DUNHAM and Z . J . L IU
The Fish Molecular Genetics and Biotechnology Laboratory, Department of Fisheries and Allied Aquacultures, and Program in Cell and Molecular Biosciences, Auburn University, Auburn, AL 36849, USA
Keywords: mapping, population, resource family
Received 26 February 1999; revision accepted 30 April 1999
Correspondence: Z. J. Liu. Fax: +1-334-844–9208; E-mail: [email protected]
Although several types of efficient molecular marker systemssuch as random amplified polymorphic DNA (RAPD) andamplified fragment length polymorphism (AFLP) have beenused in catfish (Liu et al. 1998a, b), microsatellite markers offerseveral advantages. They are abundant, codominant, small insize, and highly polymorphic among highly related individuals,which provides tools for ecological studies of closely relatedpopulations (Hughes & Queller 1993). Such population gen-etic analysis, when conducted in proper families establishedfor genetic linkage and quantitative trait loci (QTL) analysis,would make it possible to localize genes and construct geneticlinkage and QTL maps.
Little is known about population structures and genetic
resource variations of catfishes at the molecular level. This wasat least in part due to a lack of highly polymorphic markersbefore microsatellite markers were reported (Waldbieser &Bosworth 1997). Many ecological issues involving geneticsneed to be addressed for catfishes. For instance, channel catfishis the most important cultured fish in the United States, but itsgenetic resource variations are not known.
We previously reported high levels of evolutionary con-servation of microsatellite flanking sequences among severalcatfish species (Liu et al. 1999). We present here developmentof 30 microsatellite markers, their PCR primers, amplifica-tion conditions, and informativeness in the Auburn resourcefamilies.
Channel catfish (Ictalurus punctatus) small-insert librarieswere constructed as previously described (Liu et al. 1999).Double-stranded DNA was sequenced and PCR primersdesigned using oligo (National Biosciences, Inc., Plymouth,MN, USA). Among the 30 microsatellite loci, 21 loci harboursimple microsatellite repeats and nine harbour compositemicrosatellites.
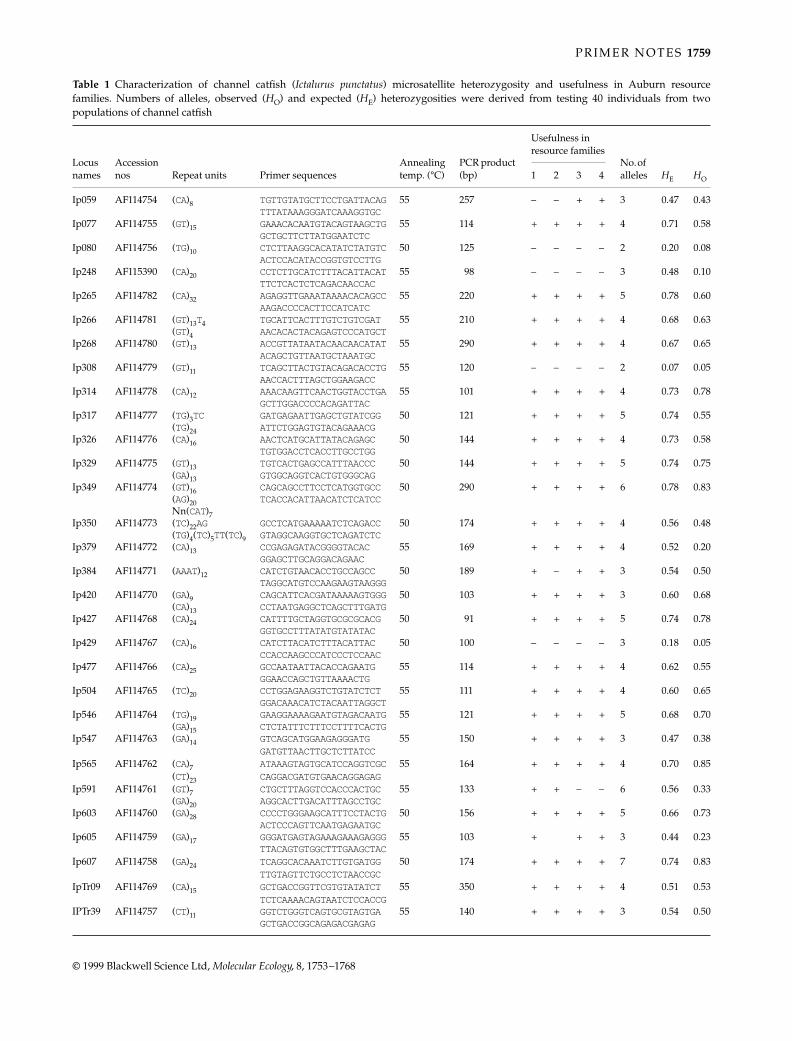
Sixty-five clones were sequenced, of which 47 clonesproduced enough sequences appropriate for designing PCRprimers. All designed primer pairs were first tested withone fish for the amplifiability of the microsatellite loci. Thirtypairs of primers successfully amplified their microsatellite lociusing genomic DNA of channel catfish (Table 1). Approximately200 ng of genomic DNA was amplified in PCR reactions of50 µL containing 50 mm KCl, 10 mm Tris (pH 9.0 at 25 °C),0.1% Triton X-100, 0.25 mm each of deoxynucleotide triphos-phate (dNTPs), 1.5 mm MgCl2, 20 µm each primer, and 2.5 unitsof Taq DNA polymerase (Promega, Madison, WI, USA; or LifeTechnologies, Bethesda, MD, USA). The general temperatureprofiles used in initial amplification trials were 94 °C for30 s, 55 °C for 1 min, and 72 °C for 2 min, for 35–40 cycles.An initial denaturing period of 1 min at 94 °C was used. Fol-lowing amplification, samples of 3 µL were mixed with 1 µLof loading dye and electrophoresed on 10% acrylamide gelsor sequencing gels. To optimize PCR conditions for efficientamplification, every pair of primers was initially tested at55 °C. For those primers that did not efficiently amplify theexpected products at 55 °C, they were tested at 45 °C, 50 °C,or 60 °C. The highest temperature that efficiently amplifiedthe expected products is listed in Table 1. Under these condi-tions, the PCR amplification results were consistently obtained.
Loci with shorter repeat units appeared to have lower levelsof polymorphism (Table 1). This is consistent with the slip-page theory for microsatellite polymorphism (Levinson &Gutman 1987; Tautz 1989). Therefore, microsatellite clonescontaining low repeat numbers should be avoided in futureefforts. The high informativeness of these microsatellite markersin the resource families should facilitate genetic linkage andQTL mapping in catfish. Microsatellites were shown to behighly conserved among several ictalurid catfish (Liu et al.1999). That means that the markers developed from channelcatfish will probably work as well in closely related ictaluridcatfishes. These polymorphic microsatellite markers thusprovide valuable tools for various ecological studies (Morinet al. 1994; Small et al. 1998) such as genetic resource analysis,relative contribution, stocking success evaluation, population
MEC723.fm Page 1758 Wednesday, September 29, 1999 10:30 AM
P R I M E R N O T E S 1759
© 1999 Blackwell Science Ltd, Molecular Ecology, 8, 1753–1768
Table 1 Characterization of channel catfish (Ictalurus punctatus) microsatellite heterozygosity and usefulness in Auburn resourcefamilies. Numbers of alleles, observed (HO) and expected (HE) heterozygosities were derived from testing 40 individuals from twopopulations of channel catfish
Locus names
Accession nos Repeat units Primer sequences
Annealing temp. (°C)
PCR product (bp)
Usefulness in resource families
No. of alleles HE HO1 2 3 4
Ip059 AF114754 (CA)8 TGTTGTATGCTTCCTGATTACAG55 257 – – + + 3 0.47 0.43TTTATAAAGGGATCAAAGGTGC
Ip077 AF114755 (GT)15 GAAACACAATGTACAGTAAGCTG55 114 + + + + 4 0.71 0.58GCTGCTTCTTATGGAATCTC
Ip080 AF114756 (TG)10 CTCTTAAGGCACATATCTATGTC50 125 – – – – 2 0.20 0.08ACTCCACATACCGGTGTCCTTG
Ip248 AF115390 (CA)20 CCTCTTGCATCTTTACATTACAT55 98 – – – – 3 0.48 0.10TTCTCACTCTCAGACAACCAC
Ip265 AF114782 (CA)32 AGAGGTTGAAATAAAACACAGCC55 220 + + + + 5 0.78 0.60AAGACCCCACTTCCATCATC
Ip266 AF114781 (GT)13T4 TGCATTCACTTTGTCTGTCGAT 55 210 + + + + 4 0.68 0.63(GT)4 AACACACTACAGAGTCCCATGCT
Ip268 AF114780 (GT)13 ACCGTTATAATACAACAACATAT55 290 + + + + 4 0.67 0.65ACAGCTGTTAATGCTAAATGC
Ip308 AF114779 (GT)11 TCAGCTTACTGTACAGACACCTG55 120 – – – – 2 0.07 0.05AACCACTTTAGCTGGAAGACC
Ip314 AF114778 (CA)12 AAACAAGTTCAACTGGTACCTGA55 101 + + + + 4 0.73 0.78GCTTGGACCCCACAGATTAC
Ip317 AF114777 (TG)3TC GATGAGAATTGAGCTGTATCGG50 121 + + + + 5 0.74 0.55(TG)24 ATTCTGGAGTGTACAGAAACG
Ip326 AF114776 (CA)16 AACTCATGCATTATACAGAGC 50 144 + + + + 4 0.73 0.58TGTGGACCTCACCTTGCCTGG
Ip329 AF114775 (GT)13 TGTCACTGAGCCATTTAACCC 50 144 + + + + 5 0.74 0.75(GA)13 GTGGCAGGTCACTGTGGGCAG
Ip349 AF114774 (GT)16 CAGCAGCCTTCCTCATGGTGCC50 290 + + + + 6 0.78 0.83(AG)20 TCACCACATTAACATCTCATCCNn(CAT)7
Ip350 AF114773 (TC)22AG GCCTCATGAAAAATCTCAGACC50 174 + + + + 4 0.56 0.48(TG)4(TC)5TT(TC)9 GTAGGCAAGGTGCTCAGATCTC
Ip379 AF114772 (CA)13 CCGAGAGATACGGGGTACAC 55 169 + + + + 4 0.52 0.20GGAGCTTGCAGGACAGAAC
Ip384 AF114771 (AAAT)12 CATCTGTAACACCTGCCAGCC 50 189 + – + + 3 0.54 0.50TAGGCATGTCCAAGAAGTAAGGG
Ip420 AF114770 (GA)9 CAGCATTCACGATAAAAAGTGGG50 103 + + + + 3 0.60 0.68(CA)13 CCTAATGAGGCTCAGCTTTGATG
Ip427 AF114768 (CA)24 CATTTTGCTAGGTGCGCGCACG50 91 + + + + 5 0.74 0.78GGTGCCTTTATATGTATATAC
Ip429 AF114767 (CA)16 CATCTTACATCTTTACATTAC 50 100 – – – – 3 0.18 0.05CCACCAAGCCCATCCCTCCAAC
Ip477 AF114766 (CA)25 GCCAATAATTACACCAGAATG 55 114 + + + + 4 0.62 0.55GGAACCAGCTGTTAAAACTG
Ip504 AF114765 (TC)20 CCTGGAGAAGGTCTGTATCTCT55 111 + + + + 4 0.60 0.65GGACAAACATCTACAATTAGGCT
Ip546 AF114764 (TG)19 GAAGGAAAAGAATGTAGACAATG55 121 + + + + 5 0.68 0.70(GA)15 CTCTATTTCTTTCCTTTTCACTG
Ip547 AF114763 (GA)14 GTCAGCATGGAAGAGGGATG 55 150 + + + + 3 0.47 0.38GATGTTAACTTGCTCTTATCC
Ip565 AF114762 (CA)7 ATAAAGTAGTGCATCCAGGTCGC55 164 + + + + 4 0.70 0.85(CT)23 CAGGACGATGTGAACAGGAGAG
Ip591 AF114761 (GT)7 CTGCTTTAGGTCCACCCACTGC55 133 + + – – 6 0.56 0.33(GA)20 AGGCACTTGACATTTAGCCTGC
Ip603 AF114760 (GA)28 CCCCTGGGAAGCATTTCCTACTG50 156 + + + + 5 0.66 0.73ACTCCCAGTTCAATGAGAATGC
Ip605 AF114759 (GA)17 GGGATGAGTAGAAAGAAAGAGGG55 103 + + + 3 0.44 0.23TTACAGTGTGGCTTTGAAGCTAC
Ip607 AF114758 (GA)24 TCAGGCACAAATCTTGTGATGG50 174 + + + + 7 0.74 0.83TTGTAGTTCTGCCTCTAACCGC
IpTr09 AF114769 (CA)15 GCTGACCGGTTCGTGTATATCT55 350 + + + + 4 0.51 0.53TCTCAAAACAGTAATCTCCACCG
IPTr39 AF114757 (CT)11 GGTCTGGGTCAGTGCGTAGTGA55 140 + + + + 3 0.54 0.50GCTGACCGGCAGAGACGAGAG
MEC723.fm Page 1759 Wednesday, September 29, 1999 10:30 AM
1760 P R I M E R N O T E S
© 1999 Blackwell Science Ltd, Molecular Ecology, 8, 1753–1768
structures, strain and paternity identification, and molecularsystematics.
Acknowledgements
This project was supported by USDA NRICGP no. 98–35205–6738. This paper is journal number 8–996022 of the AlabamaAgricultural Experiment Station.
References
Hughes CR, Queller DC (1993) Detection of highly polymorphicmicrosatellite loci in a species with little allozyme polymorph-ism. Molecular Ecology, 2, 131–137.
Levinson G, Gutman GA (1987) High frequency of short frame-shifts in poly-CA/GT tandem repeats borne by bacteriophageM13 in Escherichia coli K-12. Nucleic Acids Research, 15, 5323–5338.
Liu ZJ, Li P, Argue BJ, Dunham RA (1998a) Inheritance of RAPDmarkers in channel catfish (Ictalurus punctatus), blue catfish (I.furcatus) and their F1, F2, and backcross hybrids. Animal Gen-etics, 29, 58–62.
Liu ZJ, Nichols A, Li P, Dunham RA (1998b) Inheritance andusefulness of AFLP markers in channel catfish (Ictalurus punc-tatus), blue catfish (I. furcatus) and their F1, F2 and backcrosshybrids. Molecular and General Genetics, 258, 260–268.
Liu ZJ, Tan G, Kucuktas H, Li P, Karsi A, Yant DR, Dunham RA(1999) High levels of conservation at microsatellite loci amongictalurid catfishes. Journal of Heredity, 90, 307–312.
Morin PA, Wallis J, Moore JJ, Woodruff DS (1994) Paternityexclusion in a community of wild chimpanzees using hyper-variable simple sequence repeats. Molecular Ecology, 3, 469–478.
Small MP, Beacham TD, Withler RE, Nelson RJ (1998) Discrimin-ating coho salmon (Oncorrhynchus kisutch) populations within theFraser River, British Columbia, using microsatellite DNA markers.Molecular Ecology, 7, 141–155.
Tautz D (1989) Hypervariability of simple sequences as a generalsource for polymorphic DNA markers. Nucleic Acids Research, 17,6563–6571.
Waldbieser GC, Bosworth BG (1997) Cloning and characteriza-tion of microsatellite loci in channel catfish, Ictalurus punctatus.Animal Genetics, 28, 295–298.
8101999744primer notea. davison17601761Graphicraft Limited, Hong KongIsolation and characterization of long compound microsatellite repeat loci in the land snail, Cepaea nemoralis L. (Mollusca, Gastropoda, Pulmonata)A. DAVISON
Institute of Genetics, Queens Medical Centre, University of Nottingham, Nottingham, NG7 2UH, UK
Keywords: allozyme, area effects, polymorphism, snail, tetranucleotide, trinucleotide
Received 26 April 1999; revision accepted 19 May 1999
Correspondence: A. Davison. Fax: + 44 (0)115 9709906; E-mail: [email protected]
The study of land snails has been fundamental to understand-ing the origins and maintenance of genetic diversity. The realiza-tion that the frequencies of Cepaea shell colour and bandingmorphs are affected by selection against predation by thrushes(Cain & Sheppard 1950) was followed by the discovery of ‘areaeffects’, patterns of gene frequencies in which particular shell-colour or banding morphs predominate over areas much largerthan the Mendelian population (Cain & Currey 1963). Studiesof allozymes helped to estimate the relative contributions ofselection, gene flow and history in bringing about differencesbetween neighbouring populations in area effects ( Johnson 1976;Ochman et al. 1983). I have now developed microsatelliteprimers for Cepea nemoralis, with the continuing aim of study-ing the relationships between populations of land snails.
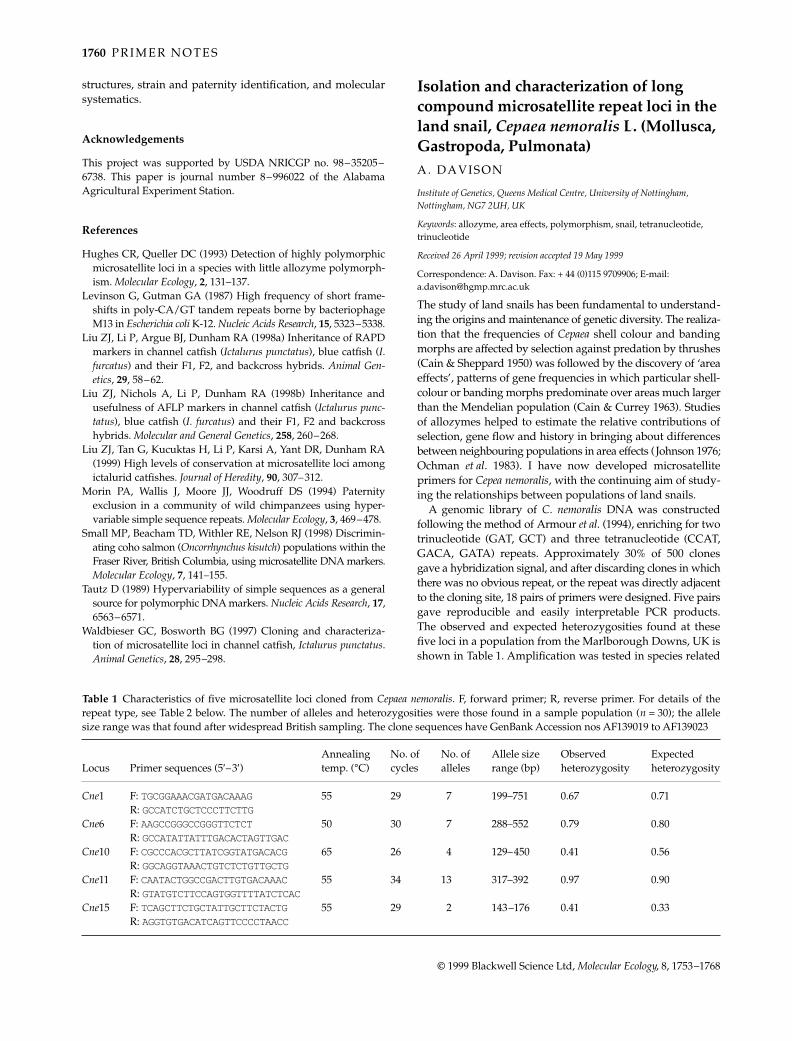
A genomic library of C. nemoralis DNA was constructedfollowing the method of Armour et al. (1994), enriching for twotrinucleotide (GAT, GCT) and three tetranucleotide (CCAT,GACA, GATA) repeats. Approximately 30% of 500 clonesgave a hybridization signal, and after discarding clones in whichthere was no obvious repeat, or the repeat was directly adjacentto the cloning site, 18 pairs of primers were designed. Five pairsgave reproducible and easily interpretable PCR products.The observed and expected heterozygosities found at thesefive loci in a population from the Marlborough Downs, UK isshown in Table 1. Amplification was tested in species related
Table 1 Characteristics of five microsatellite loci cloned from Cepaea nemoralis. F, forward primer; R, reverse primer. For details of therepeat type, see Table 2 below. The number of alleles and heterozygosities were those found in a sample population (n = 30); the allelesize range was that found after widespread British sampling. The clone sequences have GenBank Accession nos AF139019 to AF139023
Locus Primer sequences (5′–3′)Annealing temp. (°C)
No. of cycles
No. of alleles
Allele size range (bp)
Observed heterozygosity
Expected heterozygosity
Cne1 F: TGCGGAAACGATGACAAAG 55 29 7 199–751 0.67 0.71R: GCCATCTGCTCCCTTCTTG
Cne6 F: AAGCCGGGCCGGGTTCTCT 50 30 7 288–552 0.79 0.80R: GCCATATTATTTGACACTAGTTGAC
Cne10 F: CGCCCACGCTTATCGGTATGACACG 65 26 4 129–450 0.41 0.56R: GGCAGGTAAACTGTCTCTGTTGCTG
Cne11 F: CAATACTGGCCGACTTGTGACAAAC 55 34 13 317–392 0.97 0.90R: GTATGTCTTCCAGTGGTTTTATCTCAC
Cne15 F: TCAGCTTCTGCTATTGCTTCTACTG 55 29 2 143–176 0.41 0.33R: AGGTGTGACATCAGTTCCCCTAACC
MEC723.fm Page 1760 Wednesday, September 29, 1999 10:30 AM
P R I M E R N O T E S 1761
© 1999 Blackwell Science Ltd, Molecular Ecology, 8, 1753–1768
to C. nemoralis, but failed in all except C. hortensis, in whichmost loci appeared to be monomorphic. All repeats werecompound and some alleles were very long (Table 2).
For the routine screening of microsatellites, DNA wasextracted from C. nemoralis using Nucleon Phytopure kits(Nucleon Biosciences). For PCR, 5 pmol of forward primerwas labelled at the 5′ terminus with [γ32P]-ATP using T4polynucleotide kinase (Sambrook et al. 1989). Five pmol of thecomplementary reverse primer was provided with 0.1 mm ofeach dNTP, 1.5 mm MgCl2, 0.3 U Thermoprimeplus polymerase(Advanced Biotechnologies) and 1 µL of 10× PCR buffer (750 mmTris-HCl pH 8.8, 200 mm ammonium sulphate, 0.1% v/vTween 20). All PCR reactions/amplifications were carriedout in a 10 µL final volume using approximately 50 ng oftemplate DNA. The standard PCR conditions were 96 °C for1 min, followed by n cycles of 94 °C for 20 s, t °C for 20 s, and72 °C for 1 min. The annealing temperatures (t) and num-bers of cycles (n) used are shown in Table 1. A relatively longextension time ensured the amplification of very long alleles(up to 750 bp). The amplification of the loci Cne1 and Cne10was improved by the use of a high-dNTP PCR buffer (50 mmTris-HCl pH 8.8, 12 mm ammonium sulphate, 5 mm MgCl2,7.4 mm 2-mercaptoethanol, 1.1 mm each dNTP and 125 µg/mL bovine serum albumen, final concentration).
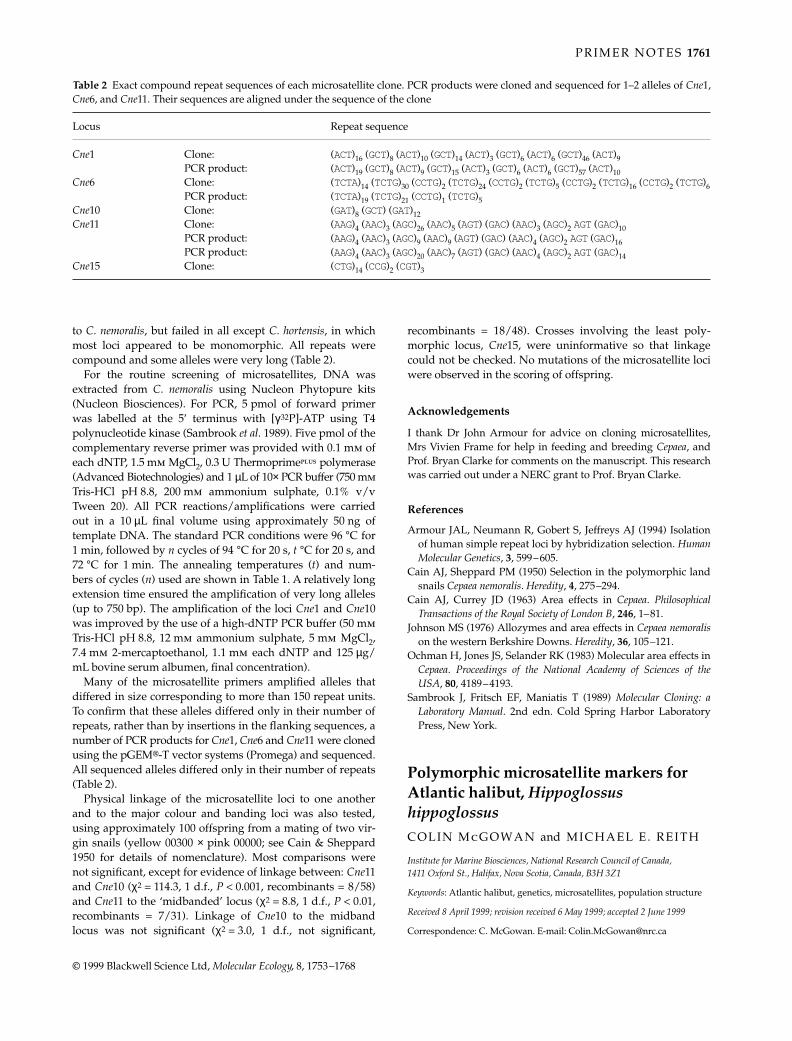
Many of the microsatellite primers amplified alleles thatdiffered in size corresponding to more than 150 repeat units.To confirm that these alleles differed only in their number ofrepeats, rather than by insertions in the flanking sequences, anumber of PCR products for Cne1, Cne6 and Cne11 were clonedusing the pGEM®-T vector systems (Promega) and sequenced.All sequenced alleles differed only in their number of repeats(Table 2).
Physical linkage of the microsatellite loci to one anotherand to the major colour and banding loci was also tested,using approximately 100 offspring from a mating of two vir-gin snails (yellow 00300 × pink 00000; see Cain & Sheppard1950 for details of nomenclature). Most comparisons werenot significant, except for evidence of linkage between: Cne11and Cne10 (χ2 = 114.3, 1 d.f., P < 0.001, recombinants = 8/58)and Cne11 to the ‘midbanded’ locus (χ2 = 8.8, 1 d.f., P < 0.01,recombinants = 7/31). Linkage of Cne10 to the midbandlocus was not significant (χ2 = 3.0, 1 d.f., not significant,
recombinants = 18/48). Crosses involving the least poly-morphic locus, Cne15, were uninformative so that linkagecould not be checked. No mutations of the microsatellite lociwere observed in the scoring of offspring.
Acknowledgements
I thank Dr John Armour for advice on cloning microsatellites,Mrs Vivien Frame for help in feeding and breeding Cepaea, andProf. Bryan Clarke for comments on the manuscript. This researchwas carried out under a NERC grant to Prof. Bryan Clarke.
References
Armour JAL, Neumann R, Gobert S, Jeffreys AJ (1994) Isolationof human simple repeat loci by hybridization selection. HumanMolecular Genetics, 3, 599–605.
Cain AJ, Sheppard PM (1950) Selection in the polymorphic landsnails Cepaea nemoralis. Heredity, 4, 275–294.
Cain AJ, Currey JD (1963) Area effects in Cepaea. PhilosophicalTransactions of the Royal Society of London B, 246, 1–81.
Johnson MS (1976) Allozymes and area effects in Cepaea nemoralison the western Berkshire Downs. Heredity, 36, 105–121.
Ochman H, Jones JS, Selander RK (1983) Molecular area effects inCepaea. Proceedings of the National Academy of Sciences of theUSA, 80, 4189–4193.
Sambrook J, Fritsch EF, Maniatis T (1989) Molecular Cloning: aLaboratory Manual. 2nd edn. Cold Spring Harbor LaboratoryPress, New York.
8101999753PRIMER NOTEPRIMER NOTE17611763Graphicraft Limited, Hong Kong
Polymorphic microsatellite markers for Atlantic halibut, Hippoglossus hippoglossusCOLIN McGOWAN and MICHAEL E . REITH
Institute for Marine Biosciences, National Research Council of Canada, 1411 Oxford St., Halifax, Nova Scotia, Canada, B3H 3Z1
Keywords: Atlantic halibut, genetics, microsatellites, population structure
Received 8 April 1999; revision received 6 May 1999; accepted 2 June 1999
Correspondence: C. McGowan. E-mail: [email protected]
Table 2 Exact compound repeat sequences of each microsatellite clone. PCR products were cloned and sequenced for 1–2 alleles of Cne1,Cne6, and Cne11. Their sequences are aligned under the sequence of the clone
Locus Repeat sequence
Cne1 Clone: (ACT)16 (GCT)8 (ACT)10 (GCT)14 (ACT)3 (GCT)6 (ACT)6 (GCT)46 (ACT)9PCR product: (ACT)19 (GCT)8 (ACT)9 (GCT)15 (ACT)3 (GCT)6 (ACT)6 (GCT)57 (ACT)10
Cne6 Clone: (TCTA)14 (TCTG)30 (CCTG)2 (TCTG)24 (CCTG)2 (TCTG)5 (CCTG)2 (TCTG)16 (CCTG)2 (TCTG)6PCR product: (TCTA)19 (TCTG)21 (CCTG)1 (TCTG)5
Cne10 Clone: (GAT)8 (GCT) (GAT)12Cne11 Clone: (AAG)4 (AAC)3 (AGC)26 (AAC)5 (AGT) (GAC) (AAC)3 (AGC)2 AGT (GAC)10
PCR product: (AAG)4 (AAC)3 (AGC)9 (AAC)9 (AGT) (GAC) (AAC)4 (AGC)2 AGT (GAC)16PCR product: (AAG)4 (AAC)3 (AGC)20 (AAC)7 (AGT) (GAC) (AAC)4 (AGC)2 AGT (GAC)14
Cne15 Clone: (CTG)14 (CCG)2 (CGT)3
MEC723.fm Page 1761 Wednesday, September 29, 1999 10:30 AM
1762 P R I M E R N O T E S
© 1999 Blackwell Science Ltd, Molecular Ecology, 8, 1753–1768
Atlantic halibut (Hippoglossus hippoglossus), the largest of theflatfish, is distributed throughout cold, boreal and subarcticwaters, on both sides of the north Atlantic (Scott & Scott1988). A growing body of allozyme data has suggested thatthere may be more than one panmictic population of halibutfrom Greenland eastward. (Foss et al. 1998). To the west ofGreenland, no genetic analysis of Atlantic halibut has beenundertaken, although two stocks, the Gulf of St Lawrenceand Scotian Shelf, are currently recognized on the bases ofdifferences in growth rate, age composition and movement(Trumble et al. 1993). To further our understanding of thegenetic structure of Atlantic halibut in the western Atlantic,we have developed microsatellite markers for use in popula-tion studies.
An amplicon was generated by digesting halibut genomicDNA with BglII, ligating primer-adapters to both ends of therestriction fragments, then amplifying the ligation productusing the polymerase chain reaction (PCR). The adaptors,primers and procedures used to generate the amplicon aredescribed by Lisitsyn et al. (1993). We found that by using arestriction enzyme with a 6-bp recognition sequence, longerflanking regions remained on either side of the repeat. Thissimplified subsequent design of primers for amplification ofthe microsatellite using PCR. The production of an ampliconfacilitated cloning.
The amplicon was subjected to electrophoresis througha 2% NuSeive®GTG® agarose gel (FMC Bioproducts) andthe 400–650 bp fragments recovered using the Wizard™PCR DNA purification system (Promega) according to themanufacturer’s instructions. The recovered fragmentswere ligated into the pCR® 2.1 vector (Invitrogen) and theligation product used to transform TOP10F′ One Shot™competent cells (Invitrogen) according to the manufacturer’sinstructions.
A library of 1500 colonies was screened with a (GT) ×11oligonucleotide probe which was 5′-end-labelled with [γ32P]-ATP (Taylor et al. 1994). One hundred positive clones wereidentified of which 50 were subjected to cycle sequencing
reactions using fluorescent labelled ddNTP. The nucleotidesequence of reaction products was determined using anautomated sequencer (Applied Biosystems). Primers weredesigned using C-Primer (Bristol & Andersen 1995).
Polymerase chain reactions were performed in a GeneAmpPCR System 9600 thermal cycler (Perkin-Elmer) using thefollowing temperature profile: initial denaturation for 5 minat 95 °C, followed by 30 cycles of 30 s at 94 °C, 30 s at 55 °Cand 30 s at 72 °C. An aliquot of each product was mixed withan equal volume of loading buffer (95% formamide, 20 mmEDTA, 0.05% bromophenol blue, 0.05% xylene cyanol FF),denatured at 85 °C for 5 min, then subjected to electrophoresisthrough an 8% highly denaturing polyacrylamide/formamidegel (Litt et al. 1993). Gels were dried without fixing, thenexposed to X-ray film overnight with intensifying screensat –70 °C.
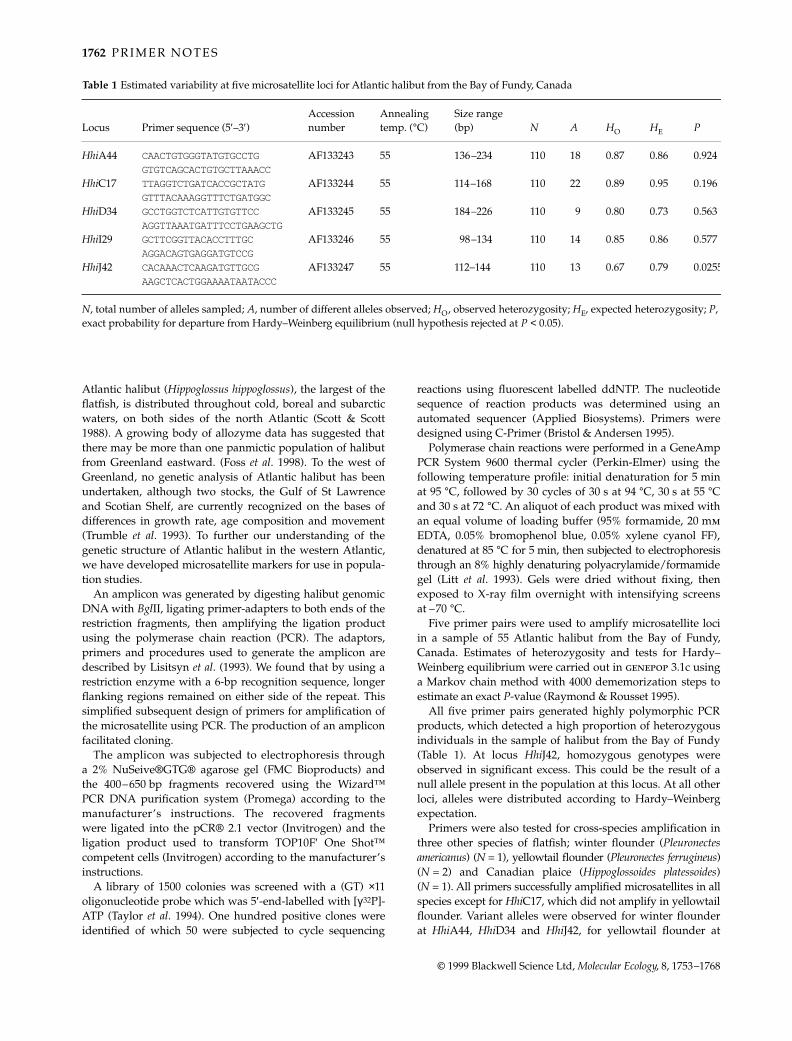
Five primer pairs were used to amplify microsatellite lociin a sample of 55 Atlantic halibut from the Bay of Fundy,Canada. Estimates of heterozygosity and tests for Hardy–Weinberg equilibrium were carried out in genepop 3.1c usinga Markov chain method with 4000 dememorization steps toestimate an exact P-value (Raymond & Rousset 1995).
All five primer pairs generated highly polymorphic PCRproducts, which detected a high proportion of heterozygousindividuals in the sample of halibut from the Bay of Fundy(Table 1). At locus HhiJ42, homozygous genotypes wereobserved in significant excess. This could be the result of anull allele present in the population at this locus. At all otherloci, alleles were distributed according to Hardy–Weinbergexpectation.
Primers were also tested for cross-species amplification inthree other species of flatfish; winter flounder (Pleuronectesamericanus) (N = 1), yellowtail flounder (Pleuronectes ferrugineus)(N = 2) and Canadian plaice (Hippoglossoides platessoides)(N = 1). All primers successfully amplified microsatellites in allspecies except for HhiC17, which did not amplify in yellowtailflounder. Variant alleles were observed for winter flounderat HhiA44, HhiD34 and HhiJ42, for yellowtail flounder at
Table 1 Estimated variability at five microsatellite loci for Atlantic halibut from the Bay of Fundy, Canada
Locus Primer sequence (5′–3′)Accession number
Annealing temp. (°C)
Size range (bp) N A HO HE P
HhiA44 CAACTGTGGGTATGTGCCTG AF133243 55 136–234 110 18 0.87 0.86 0.924GTGTCAGCACTGTGCTTAAACC
HhiC17 TTAGGTCTGATCACCGCTATG AF133244 55 114–168 110 22 0.89 0.95 0.196GTTTACAAAGGTTTCTGATGGC
HhiD34 GCCTGGTCTCATTGTGTTCC AF133245 55 184–226 110 9 0.80 0.73 0.563AGGTTAAATGATTTCCTGAAGCTG
HhiI29 GCTTCGGTTACACCTTTGC AF133246 55 98–134 110 14 0.85 0.86 0.577AGGACAGTGAGGATGTCCG
HhiJ42 CACAAACTCAAGATGTTGCG AF133247 55 112–144 110 13 0.67 0.79 0.0255AAGCTCACTGGAAAATAATACCC
N, total number of alleles sampled; A, number of different alleles observed; HO, observed heterozygosity; HE, expected heterozygosity; P, exact probability for departure from Hardy–Weinberg equilibrium (null hypothesis rejected at P < 0.05).
MEC723.fm Page 1762 Wednesday, September 29, 1999 10:30 AM
P R I M E R N O T E S 1763
© 1999 Blackwell Science Ltd, Molecular Ecology, 8, 1753–1768
HhiA44 and HhiJ42 and for Canadian plaice at HhiA44,HhiC17 and HhiJ42. This suggests that these loci may beinformative for other species of flatfish in addition to halibut.
Acknowledgements
We thank D. Martin-Robichaud, J. Gallant and S. Douglas fortissue and DNA samples. Funding for this project has beenprovided by an NSERC postdoctoral fellowship to C.M. This isNRC publication no. 42296.
References
Bristol G, Andersen RD (1995) C-Primer. Department of Medi-cine, Hem-Onc and the Department of Biochemistry, School ofMedicine, University of California, Los Angeles.
Foss A, Imsland AK, Nævdal (1998) Population genetic studiesof the Atlantic halibut in the North Atlantic Ocean. Journal ofFish Biology, 53, 901–905.
Lisitsyn N, Lisitsyn N, Wigler M (1993) Cloning the differencesbetween two complex genomes. Science, 259, 946–951.
Litt M, Hauge X, Sharma V (1993) Shadow bands seen when typ-ing polymorphic dinucleotide repeats: Some causes and cures.Biotechniques, 15, 280–284.
Raymond M, Rousset F (1995) genepop (Version 1.2): Populationgenetics software for exact tests and ecumenicism. Journal ofHeredity, 86, 248–249.
Scott WB, Scott MG (1988) Atlantic Fishes of Canada, University ofToronto Press, Toronto.
Taylor AC, Sherwin WB, Wayne RK (1994) Genetic variation ofmicrosatellite loci in a bottlenecked species: the northern hairy-nosed wombat Lasiorhinus krefftii. Molecular Ecology, 3, 277–290.
Trumble RJ, Neilson JD, Bowering WR, McCaughran DA (1993)Atlantic halibut (Hippoglossus hippoglossus) and Pacific halibut(H. stenolepis) and their North American fisheries. CanadianBulletin of Fisheries and Aquatic Sciences, no. 227, NationalResearch Council of Canada, Ottawa.
8101999762PRIMER NOTESPRIMER NOTES17631765Graphicraft Limited, Hong Kong
Characterization and isolation of microsatellite loci from the endangered North Atlantic right whale
R. C . WALDICK,* M. W. BROWN,†‡ and B . N. WHITE*
*Department of Biology, McMaster University, Hamilton, Ontario L8S 4J1 Canada, †Center for Coastal Studies, Provincetown, Massachusetts 02657, USA, ‡East Coast Ecosystems, PO Box 36 Freeport, Nova Scotia B0V 1B0
Keywords: Eubalaena australis, Eubalaena glacialis, microsatellites
Received 15 May 1999; revision accepted 19 June 1999
Correspondence: R. Waldick. Fax: +01-905-522-6066; E-mail: [email protected]
As a consequence of historic whaling pressures, the westernNorth Atlantic right whale (Eubalaena glacialis) is one of themost endangered of all large cetaceans (Knowlton et al. 1994).Although photoidentification techniques for individual iden-tification of whales and more than 18 years of monitoring
have provided extensive behavioural and life-history data,individual-specific genetic profiles would augment the studyby allowing whales for which only low-quality photographsexist to be identified (see Palsbøll et al. 1997).
Microsatellite loci are known to have high levels of geneticvariability in many taxa due to the high rates of mutation(Dietrich et al. 1992; Bruford & Wayne 1993). Moreover, asmicrosatellites are noncoding, allele frequencies will be sub-ject to random genetic drift, making these markers useful forstudying levels of genetic diversity and population structur-ing (Nauta & Weissing 1996).
Skin samples were collected from E. glacialis in the watersoff eastern Canada between 1988 and 1997. Samples werestored in DMSO (20% DMSO, 0.25 m sodium-EDTA, saturatedwith NaCl, pH 7.5; Amos & Hoelzel 1991) and DNA wasextracted using phenol–chloroform extractions (Brown et al.1991; Schaeff et al. 1993). Samples were also available forseveral South Atlantic right whales (E. australis) from nearPeninsula Valdes, Argentina (Schaeff et al. 1993).
Restriction digests of 1–3 mg of genomic DNA were con-ducted in 25 µL volumes using three blunt-end cuttingrestriction enzymes (RsaI, EcoRV, and AluI; Gibco-BRL). DNAfragments of < 450 bp were size separated on a 2% agarosegel. Cloning was carried-out as described in Rassman et al.(1991). Insert sequences were determined using the PRISM™Ready Reaction Dye Deoxy Termination kit (AppliedBiosystems Inc.), a Perkin-Elmer 9600 Thermal Cycler, andan Automated DNA Sequencing System (373A, AppliedBiosystems). Primers were developed for 14 of 34 micro-satellite sequences identified (Primer version 5; Lincolnet al. 1991).
Amplifications using the polymerase chain reaction (PCR)used 20–50 ng of DNA, 0.2 µm of each primer, 20 nm ofγ33P end-labelled primer, 2.0–2.5 mm MgCl2, 0.70U of Taq,1× reaction buffer, and 0.20 mm dNTPs (Gibco-BRL). PCRproducts were size-separated on a 6% denaturing, poly-acrylamide gel and visualized by autoradiography. Alleleswere sized relative to the clones. Loci were tested fordeviations from Hardy–Weinberg equilibrium (HWE) when> 58 chromosomes had been screened (Exact test; Raymond& Rousset 1995).
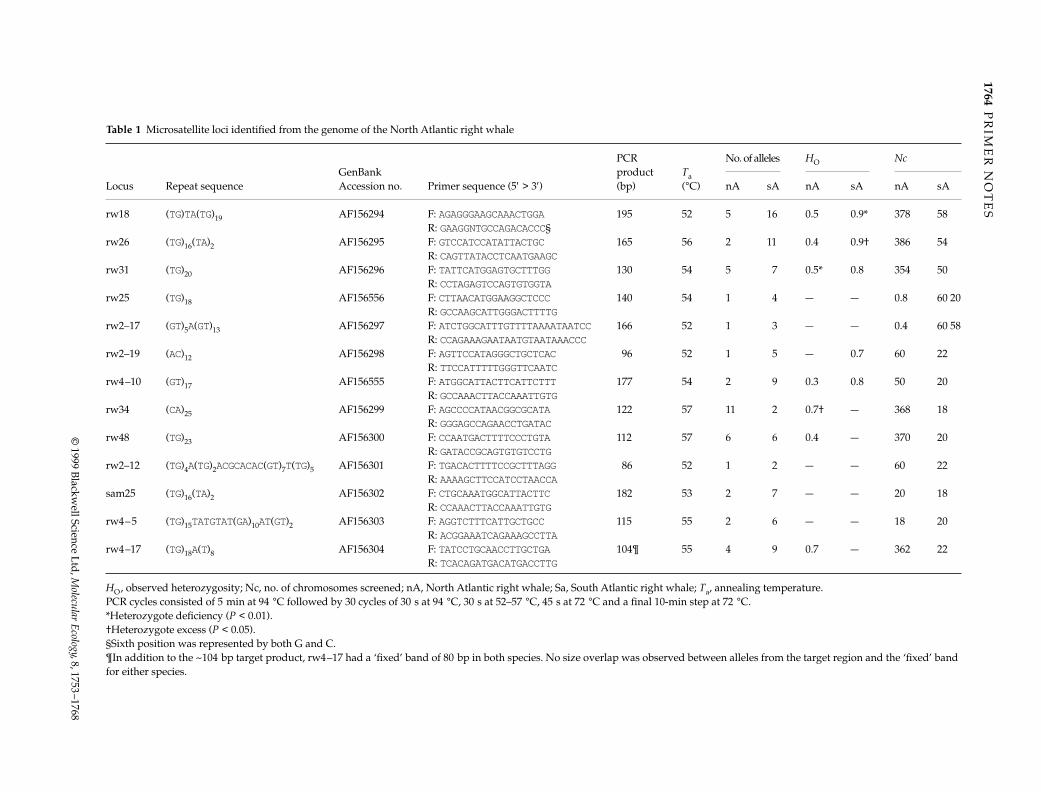
Loci were considered monomorphic when the most com-mon allele had a frequency of > 95% (N > 58 chromosomes).Only two of 13 and two of 10 polymorphic loci deviatedsignificantly from HWE in E. australis and E. glacialis (rw26& rw18 and rw31 & rw34, respectively). Allelic diversity wasas great or greater in E. australis than in E. glacialis at all butone locus (rw34).
The potential use of these microsatellites (Table 1) inthe study of toothed whales was assessed using seven ran-domly selected primer pairs on six beluga whale samples(Delphineptera leucas). All seven primer pairs produced PCRproducts and, despite the small sample size, four of theseven loci were variable (rw2–17, rw2–19, rw21, and rw26).
For the right whales, the microsatellite loci will allowindividual-specific profiles to be developed. In addition, forE. glacialis, the exclusionary power (PE) for paternity analysisis over 98% when the identity of one parent is known. In con-trast, high allelic diversity in E. australis provides a PE ≅ 99%
MEC723.fm Page 1763 Wednesday, September 29, 1999 10:30 AM
1764P
RIM
ER
NO
TE
S
© 1999 B
lackwell Science L
td, M
olecular Ecology, 8, 1753–1768
Table 1 Microsatellite loci identified from the genome of the North Atlantic right whale
Locus Repeat sequenceGenBank Accession no. Primer sequence (5′ > 3′)
PCR product (bp)
Ta (°C)
No. of alleles HO Nc
nA sA nA sA nA sA
rw18 (TG)TA(TG)19 AF156294 F: AGAGGGAAGCAAACTGGA 195 52 5 16 0.5 0.9* 378 58R: GAAGGNTGCCAGACACCC§
rw26 (TG)16(TA)2 AF156295 F: GTCCATCCATATTACTGC 165 56 2 11 0.4 0.9† 386 54R: CAGTTATACCTCAATGAAGC
rw31 (TG)20 AF156296 F: TATTCATGGAGTGCTTTGG 130 54 5 7 0.5* 0.8 354 50R: CCTAGAGTCCAGTGTGGTA
rw25 (TG)18 AF156556 F: CTTAACATGGAAGGCTCCC 140 54 1 4 — — 0.8 60 20R: GCCAAGCATTGGGACTTTTG
rw2–17 (GT)5A(GT)13 AF156297 F: ATCTGGCATTTGTTTTAAAATAATCC 166 52 1 3 — — 0.4 60 58R: CCAGAAAGAATAATGTAATAAACCC
rw2–19 (AC)12 AF156298 F: AGTTCCATAGGGCTGCTCAC 96 52 1 5 — 0.7 60 22R: TTCCATTTTTGGGTTCAATC
rw4–10 (GT)17 AF156555 F: ATGGCATTACTTCATTCTTT 177 54 2 9 0.3 0.8 50 20R: GCCAAACTTACCAAATTGTG
rw34 (CA)25 AF156299 F: AGCCCCATAACGGCGCATA 122 57 11 2 0.7† — 368 18R: GGGAGCCAGAACCTGATAC
rw48 (TG)23 AF156300 F: CCAATGACTTTTCCCTGTA 112 57 6 6 0.4 — 370 20R: GATACCGCAGTGTGTCCTG
rw2–12 (TG)4A(TG)2ACGCACAC(GT)7T(TG)5 AF156301 F: TGACACTTTTCCGCTTTAGG 86 52 1 2 — — 60 22R: AAAAGCTTCCATCCTAACCA
sam25 (TG)16(TA)2 AF156302 F: CTGCAAATGGCATTACTTC 182 53 2 7 — — 20 18R: CCAAACTTACCAAATTGTG
rw4–5 (TG)15TATGTAT(GA)10AT(GT)2 AF156303 F: AGGTCTTTCATTGCTGCC 115 55 2 6 — — 18 20R: ACGGAAATCAGAAAGCCTTA
rw4–17 (TG)18A(T)8 AF156304 F: TATCCTGCAACCTTGCTGA 104¶ 55 4 9 0.7 — 362 22R: TCACAGATGACATGACCTTG
HO, observed heterozygosity; Nc, no. of chromosomes screened; nA, North Atlantic right whale; Sa, South Atlantic right whale; Ta, annealing temperature.PCR cycles consisted of 5 min at 94 °C followed by 30 cycles of 30 s at 94 °C, 30 s at 52–57 °C, 45 s at 72 °C and a final 10-min step at 72 °C.*Heterozygote deficiency (P < 0.01).†Heterozygote excess (P < 0.05).§Sixth position was represented by both G and C.¶In addition to the ~104 bp target product, rw4–17 had a ‘fixed’ band of 80 bp in both species. No size overlap was observed between alleles from the target region and the ‘fixed’ band for either species.
ME
C723.fm
Page 1764 W
ednesday, Septem
ber 29, 1999 10:30 AM
P R I M E R N O T E S 1765
© 1999 Blackwell Science Ltd, Molecular Ecology, 8, 1753–1768
when neither parent is known. These microsatellite-basedprofiles will augment the E. glacialis catalogue by identify-ing new whales and confirming the identity of whales whenphotographs are of low quality.
Acknowledgements
This research was supported by the NMFS (U.S.A.), WWF (Canada),and grant and scholarship support from NSERC Canada.
References
Amos W, Hoelzel AR (1991) Long-term preservation of whaleskin for DNA analysis. Report of the International Whaling Com-mission (Special Issue), 13, 99–104.
Brown MW, Kraus SD, Gaskin DE (1991) Reaction of NorthAtlantic right whales (Eubalaena glacialis) to skin biopsy sam-pling for genetic and pollutant analysis. Report of the Interna-tional Whaling Commission (Special Issue), 13, 81–90.
Bruford MW, Wayne RK (1993) Microsatellites and their applica-tion to population genetics. Current Opinion in Genetics andDevelopment, 3, 939–943.
Dietrich W, Katz H, Linclon SE (1992) A genetic map of themouse suitable for typing intraspecific crosses. Genetics, 131,423–447.
Knowlton AR, Kraus SD, Kenney RD (1994) Reproduction inNorth Atlantic right whales (Eubalaena glacialis). Canadian Journalof Zoology, 72, 1297–1305.
Lincoln SE, Daly JJ, Lander ES (1991) Primer: a computer pro-gram for automatically selecting PCR primers, Version 0.5.Whitehead Institute for Biomedical Research, Cambridge, MA,USA.
Nauta MJ, Weissing FJ (1996) Constraints on allele size atmicrosatellite loci: implications for genetic differentiation. Gen-etics, 143, 1021–1032.
Palsbøll PJ, Allen J, Berubé M et al. (1997) Genetic tagging ofhumpback whales. Nature, 388, 676–679.
Rassman K, Schlotterer C, Tautz D (1991) Isolation of simple-sequence loci for use in polymerse chain reaction-based DNAfingerprinting. Electrophoresis, 12, 113–118.
Raymond M, Rousset F (1995) genepop (Version 1.2): populationgenetics software for exact tests and ecumenicism. Journal ofHeredity, 86, 248–249.
Schaeff CM, Kraus SD, Brown MW, White BN (1993) Assess-ment of the population structure of western North Atlanticright whales (Eubalaena glacialis) based on sighting and mito-chondrial DNA RFLP data. Canadian Journal of Zoology, 71,339–345.
8101999763primer notesprimer notes17651766Graphicraft Limited, Hong Kong
Microsatellites from the Amazonian tree Dinizia excelsa (Fabaceae)
C. W. DICK*‡ and M. B . HAMILTON†‡
*Department of Organismic and Evolutionary Biology, Harvard University, 26 Oxford St., Cambridge, MA 02138, USA, †Department of Biology, Reiss Sciences Bldg., Georgetown University, Washington, DC 20057–1229, USA, ‡Biological Dynamics of Forest Fragments Project, National Institute for Research in the Amazon (INPA), CP 478, Manaus, AM 69011–970, Brazil
Keywords: Dinizia excelsa, Fabaceae, microsatellite, paternity inference, tropical tree
Received 15 May 1999; revision accepted 15 June 1999
Correspondence: C. W. Dick. Present address: Smithsonian Tropical Research Institute, Apartado 2072, Balboa, Panamá. Fax: + 507–228–0516. E-mail: [email protected]
A central problem in conservation biology is to determinewhether spatially isolated rainforest trees experience repro-ductive isolation. To address this question, we developed micro-satellite primers to infer paternity in remnant populationsof the Amazonian tree Dinizia excelsa (Fabaceae).
Dinizia is one of the most phylogenetically isolated Legumegenera, marking the divergence between the Mimosoidand Caesalpinioid subfamilies (Herendeen & Dilcher 1990).D. excelsa is endemic to terra firme rainforests of the centralAmazon, is insect pollinated and bears indehiscent pods thatare wind dispersed. Members of this species include some ofthe largest trees in Amazonia, attaining 60 m in height and2.5 m in diameter (Ducke 1922). The prized hardwood accountsfor ≈ 50% of regional timber sales (Barbosa 1990). Becauseof their value for timber and shade, large individuals areoften left standing in pastures. Shade trees, along with indi-viduals in continuous and fragmented forest, provided anexperimental system to examine the breeding structure ofremnant populations (Dick 1999).
Microsatellites were isolated with standard methods toconstruct small insert genomic libraries (Rassmann et al. 1991).Genomic DNA was digested with Sau3A and 300–900 bpfragments were purified from 1.7% agarose (Gene Clean II;Bio101). DNA fragments were ligated to pBS SK+ plasmid(Stratagene) and transformed into XLR-1 Blue cells (Stratagene).Transformed cells were plated and colonies were lifted withHybond-N+ membranes (Amersham). We probed the colonylifts with 13 oligonucleotides [(AAAG)7 (ACG)10 (CA)15 (CCG)10(CTC)7 (CAC)7 (TC)10(CAT)7 (TAG)7 (AAG)7 (GGAT)4 (AAT)7(GATA)4] labelled with Digoxigenin-11-dATP for nonradioact-ive detection (Boehringer Mannheim). We screened 2500 recom-binant colonies. Fifty-eight positive clones were sequenced,yielding 29 microsatellite loci. Primer pairs for 16 loci weredesigned with amplify version 1.2 (Engels 1993).
To test the loci for polymorphism, template DNA wasextracted from 121 individuals from six populations usingDNeasy spin columns (Qiagen). Alleles were initially labelledby adding dye-labelled nucleotides (FdUTPs: Applied Biosys-tems Inc.; ABI) to the polymerase chain reaction (PCR) in aFdUTP:dNTP ratio of 1:1000. Dye-labelled primers were laterdeveloped for five loci used in the paternity study. Alleleswere sized on an automated DNA sequencer (ABI 377) usinggenescan version 2.1 (ABI) and Rox 400 size standard (ABI).The PCR cocktail (10 µL total) contained 250 µm of eachdNTP, 25 mm MgCl2, 1.25 units of Taq polymerase (Qiagen),and 0.5 µm of each primer. PCRs were performed on an MJResearch PTC-200 thermal cycler using the following thermalprotocol: 5 min at 94 °C; 25 cycles of 45 s at 94 °C, 1 min atthe primer-specific annealing temperature, and 30 s at 72 °C;ending with 15 min at 72 °C.
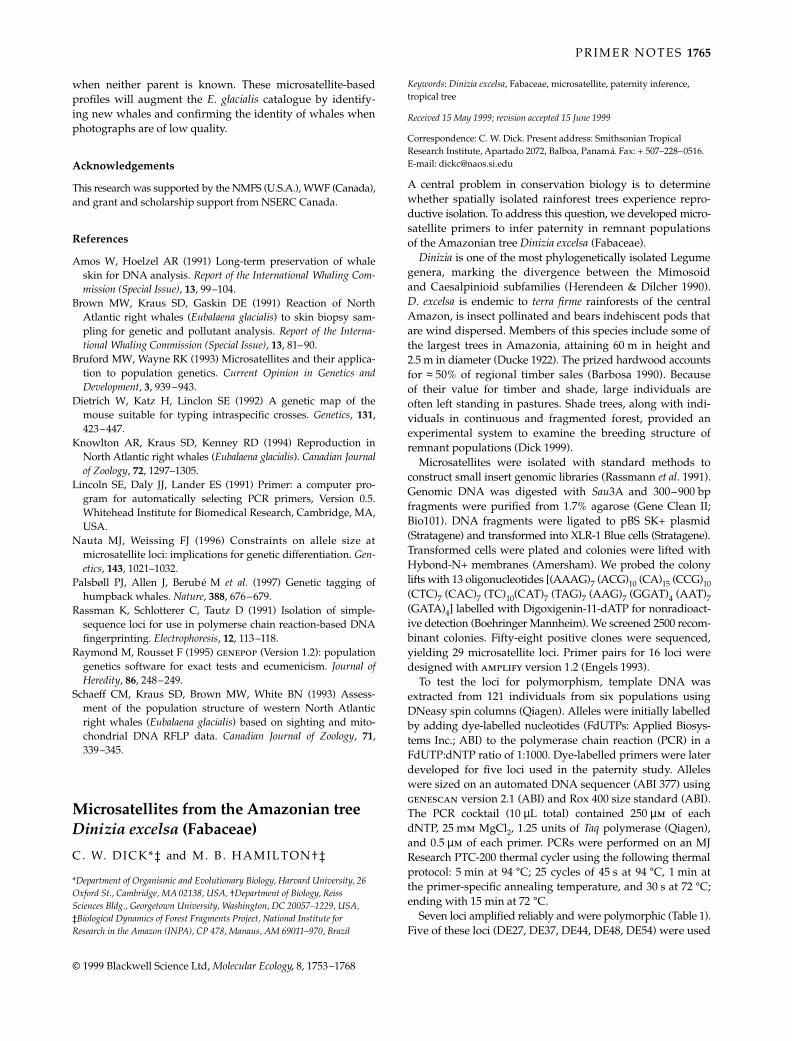
Seven loci amplified reliably and were polymorphic (Table 1).Five of these loci (DE27, DE37, DE44, DE48, DE54) were used
MEC723.fm Page 1765 Wednesday, September 29, 1999 10:30 AM
1766 P R I M E R N O T E S
© 1999 Blackwell Science Ltd, Molecular Ecology, 8, 1753–1768
for paternity analyses. Six loci that did not amplify reliablybut may be useful with different primers are (repeat arrayfollowed by GenBank Accession no.): (GA)13 (AF143977);(TG)13 (AF143978); (CT)19 (AF143981); (TG)11 (AF143983); (GA)24(AF143984); and (CT)23(AT)12 (AF143985).
The five loci used for paternity yielded 77 alleles with amean of 15 alleles per locus. Observed and expected hetero-zygosities ranged from 0.49 to 0.94. Hardy–Weinberg equilib-rium was tested with Fisher’s exact test of genepop version3.1d (Raymond & Rousset 1995). A significant excess of homo-zygotes was observed in three populations for DE48 andin five populations for DE54 (Table 1), presumably the resultof null alleles. The expected exclusion probabilities for singleloci ranged from 0.23 to 0.87 with a multilocus expectationof > 0.995 (Marshall et al. 1998). Together, these loci providedenough variation to resolve paternity for a large portion of theD. excelsa seed population.
Acknowledgements
We thank P. Ashton, R. C. Lewontin, S. Palumbi, members ofLewontin laboratory at Harvard and R. Fleischer for fruitfuldiscussions. Laboratory work was funded by a Deland Awardfrom the Arnold Arboretum, Sigma Xi, and the Lewontin Lab.
References
Barbosa RI (1990) Analysis of the timber sector in the state ofRoraima. Acta Amazonica, 20, 193–209.
Dick CW (1999) The effect of habitat fragmentation on the breedingstructure of rain forest trees. PhD Thesis, Harvard University.
Ducke A (1922) Plantes nouvelles ou peu connues de la règionamazonienne. Archivos Do Jardim Botanico Do Rio de Janeiro, 3, 2–269.
Engels WR (1993) Contributing software to the Internet: theAmplify program. Trends in Biochemical Sciences, 18, 448–450.
Herendeen PS, Dilcher DL (1990) Fossil mimosoid legumes from
the Eocene and Oligocene of southeastern North America.Review of Paleobotany and Palynology, 62, 339–362.
Marshall TC, Slate J, Kruuk LEB, Pemberton JM (1998) Statisticalconfidence for likelihood-based paternity inference in naturalpopulations. Molecular Ecology, 7, 639–655.
Rassmann K, Schlötterer C, Tautz D (1991) Isolation of simple-sequence loci for use in polymerase chain reaction-based DNAfingerprinting. Electrophoresis, 12, 113–118.
Raymond M, Rousset F (1995) GENEPOP (Version 1.2): Popula-tion genetics software for exact tests and ecumenicism. Journalof Heredity, 86, 248–249.
8101999765primer notesprimer notes17661768Graphicraft Limited, Hong Kong
Amplifying dolphin mitochondrial DNA from faecal plumes
KIM M. PARSONS,* JOHN F. DALLAS,† DIANE E . CLARIDGE,‡ JOHN W. DURBAN,* KENNETH C. BALCOMB I I I ,‡ PAUL M. THOMPSON§ and LES R . NOBLE*
*Department of Zoology, University of Abderdeen, Tillydrone Avenue, Aberdeen AB24 2TZ, UK, †NERC Molecular Genetics in Ecology Initiative, Department of Zoology, University of Abderdeen, Tillydrone Avenue, Aberdeen AB24 2TZ, UK, ‡Bahamas Marine Mammal Survey, PO Box AB20714, Marsh Harbour, Abaco, The Bahamas, §Lighthouse Field Station, University of Aberdeen, George St., Cromarty, Ross-shire IV11 8YJ, UK
Keywords: DNA extraction, Tursiops truncatus, faeces, PCR, mtDNA, cetaceans
Received 15 April 1999; revision received 2 June 1999; accepted 5 June 1999
Correspondence: K.M. Parsons. Fax: +44 (0) 1224 272396; E-mail: [email protected]
Molecular studies are increasingly used to support cetaceanconservation and management (Hoelzel 1994). Biopsy-darting
Table 1 Microsatellite loci of Dinizia excelsa, with number of individuals sampled (n), number of alleles observed (k), observedheterozygosity (HO), expected heterozygosity (HE) and expected exclusion probabilities (PE) calculated by cervus (Marshall et al. 1998).All sequences have been deposited in GenBank (AF143976, AF143979, AF143980, AF143982, AF143986, AF143987, AF143988)
LocusRepeat array Primer sequences (5′–3′)
Annealing temp (°C)
Clone size (bp) n k HO HE PE
DE27 (AAG)8 GCATTTAAAAATTTAAATGTAGGG 60 118 121 5 0.54 0.49 0.23GTGCAGTTTTGGATTCTTTGC
DE37 (AC)20 TAGAATGTGCGCGCACGTC 60 128 115 11 0.72 0.73 0.51GTGTATAACTGGTGTCACCC
DE44 (GT)13 ACGCTTAAAGGCTATTGAACC 60 144 119 9 0.66 0.64 0.40CAAATTTAAAAATAGATTAATTGAAAC
DE48 (GA)27 AGAAGAATTAGGGAGGGACG 60 143 106 31 0.80 0.94* 0.87GAATAAAAGCATGCTTTATTTTTC
DE54 (CT)39 GTGCAATGGGACAAAGCTTC 60 175 84 21 0.62 0.93* 0.85TCCCATTGCTCAAAGACTCG
DE60 (AAT)7 CAACGCAAATAAGGCCTAACC 62 238 23 2 0.35 0.29 —CATATATACCTGGGCTTACAG
DE64 (AAT)7 ATTCCACTGAGGCAAATCCC 60 134 36 2 0.03 0.03 —CCTCCGGCATTAACTCAGG
*Significant excess of homozygotes (P < 0.05) in some of the sample populations.
MEC723.fm Page 1766 Wednesday, September 29, 1999 10:30 AM
P R I M E R N O T E S 1767
© 1999 Blackwell Science Ltd, Molecular Ecology, 8, 1753–1768
(e.g. Lambertsen 1987) and collecting sloughed skin (e.g.Amos et al. 1992) have provided DNA from several species,but these methods are often impractical. An alternative is toextract DNA from faeces, as previously applied to terrestrial(e.g. Gerloff et al. 1995) and semiaquatic (Reed et al. 1997)mammals, and to floating dugong faeces (Tikel et al. 1996).Until now, however, the diffuse form of cetacean ‘faecalplumes’ has prevented their collection and genetic analysis.Here, we demonstrate the feasibility of collecting faeces,extracting total DNA, and reliably amplifying mitochondrialDNA (mtDNA) markers from free-ranging dolphins.
Five faecal samples were collected from bottlenose dol-phins (Tursiops truncatus) in the Bahamas (26°0′N 77°25′W).Upon observing defaecation, snorkelers collected sinkingfaeces in 100 mL plastic vials. Samples were immediatelypreserved in 20% DMSO/5 m NaCl (Amos & Hoelzel 1991),and frozen at –20 °C within 10 h.
Faeces were thawed immediately preceding extraction(total storage time 157–227 days). Cross-contamination wasavoided by using disposable plasticware, and by cleaningmetal instruments with ethanol, and flaming. One millilitreof faeces was suspended in 2 mL of 2× CTAB buffer (100 mmTris-HCl, pH 8, 1.4 m NaCl, 20 mm EDTA, 2% CTAB) (Milligan1992), and mixed by rotation. Debris was cleared by centri-fugation, and 2 mL of lysate transferred to a 2-mL micro-centrifuge tube. Following high-speed centrifugation, 1.5 mLof cleared suspension was extracted twice with 0.5 mL ofchloroform, and DNA precipitated by adding 0.67 mL ofisopropanol.
DNA pellets were dissolved in 1.8 mL of guanidine thio-cyanate (GITC) buffer (5 m GITC, 0.1 m Tris-HCl, pH 6.4) atambient temperature overnight. Three grammes of diat-omaceous earth particles (Sigma D-5384) were washed, three
times, in 50 mL of molecular-grade water, and centrifuged.Pelleted diatoms were then suspended in 12 mL of water andvortexed to create a slurry. One hundred microlitres of diat-omaceous slurry was added to the microfuge tube to recoverthe DNA. Diatoms were pelleted, resuspended in 600 µL ofGITC buffer, transferred to the insert of a 10-µm meshVectaSpin microtube (Whatman, no. 6838 0002) and centrifugedto remove buffer. The diatoms, and DNA, were washedtwice with 700 µL of ethanol, then incubated at 55 °C for30 min to evaporate residual traces of ethanol. DNA waseluted in 130 µL of TE (10 mm Tris-HCl, 0.1 mm EDTA,pH 8.0), incubated at 55 °C for 30 min, centrifuged to pelletdiatom traces, and 100 µL was transferred to a new 0.2-mL tube.
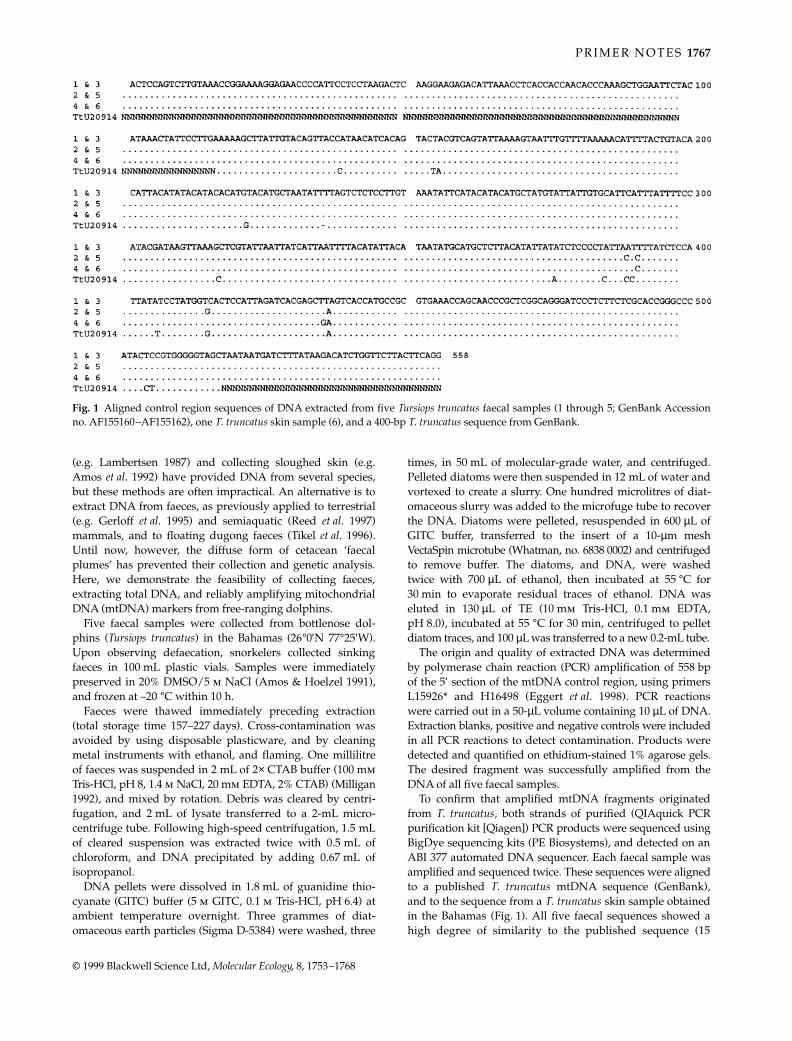
The origin and quality of extracted DNA was determinedby polymerase chain reaction (PCR) amplification of 558 bpof the 5′ section of the mtDNA control region, using primersL15926* and H16498 (Eggert et al. 1998). PCR reactionswere carried out in a 50-µL volume containing 10 µL of DNA.Extraction blanks, positive and negative controls were includedin all PCR reactions to detect contamination. Products weredetected and quantified on ethidium-stained 1% agarose gels.The desired fragment was successfully amplified from theDNA of all five faecal samples.
To confirm that amplified mtDNA fragments originatedfrom T. truncatus, both strands of purified (QIAquick PCRpurification kit [Qiagen]) PCR products were sequenced usingBigDye sequencing kits (PE Biosystems), and detected on anABI 377 automated DNA sequencer. Each faecal sample wasamplified and sequenced twice. These sequences were alignedto a published T. truncatus mtDNA sequence (GenBank),and to the sequence from a T. truncatus skin sample obtainedin the Bahamas (Fig. 1). All five faecal sequences showed ahigh degree of similarity to the published sequence (15
Fig. 1 Aligned control region sequences of DNA extracted from five Tursiops truncatus faecal samples (1 through 5; GenBank Accessionno. AF155160–AF155162), one T. truncatus skin sample (6), and a 400-bp T. truncatus sequence from GenBank.
MEC723.fm Page 1767 Wednesday, September 29, 1999 10:30 AM
1768 P R I M E R N O T E S
© 1999 Blackwell Science Ltd, Molecular Ecology, 8, 1753–1768
substitution sites; 14 transitions), and to the sequence fromdolphin skin (five substitution sites; five transitions). Thisindicates that the amplified mtDNA sequences originatedfrom dolphin DNA, and not from contaminating sources offaecal (e.g. prey) DNA.
Low quantities of target DNA can cause complications whenusing faecal-derived DNA in nuclear genotyping (Taberlet &Waits 1998). However, our mtDNA analyses produced reliableresults from the sequence of a single fragment, suggesting thatfaeces may represent a useful supplement to conventional sourcesof DNA for future studies of cetacean population genetics.
Acknowledgements
Thanks to the Bahama’s government for permission to conductfield research (permit MAF/FIS 12 A) and to the Centre forWhale Research and Earthwatch for logistic support. K.M.P. wassupported by ORS, NSERC, and the British Council.
References
Amos W, Hoelzel AR (1991) Long-term preservation of whaleskin for DNA analysis. Report of the International Whaling Com-mission, Special Issue, 13, 99–103.
Amos W, Whitehead H, Ferrari MJ, Payne R, Gordon J (1992)
Restrictable DNA from sloughed cetacean skin; its potentialfor use in population analysis. Marine Mammal Science, 8, 275–283.
Eggert LS, Lux CA, O’Corry-Crowe GM, Dizon AE (1998) Drieddolphin blood on fishery observer records provides DNA forgenetic analyses. Marine Ma mmal Science, 14, 136–143.
Gerloff U, Schlotterer C, Rassmann K, Rambold I, Hohmann G,Fruth B, Tautz D (1995) Amplification of hypervariablesimple sequence repeats (microsatellites) from excrementalDNA of wild living bonobos (Pan paniscus). Molecular Ecology,4, 515–518.
Hoelzel AR (1994) Genetics and ecology of whales and dolphins.Annual Review of Ecology and Systematics, 25, 377–399.
Lambertsen RH (1987) A biopsy system for large whales and itsuse for cytogenetics. Journal of Mammalogy, 68, 443–445.
Milligan BG (1992) Plant DNA isolation. In: Molecular GeneticAnalysis of Populations: a Practical Approach (ed. Hoelzel AR),pp. 65–66. Oxford University Press, USA.
Reed JZ, Tollit DJ, Thompson PM, Amos W (1997) Molecularscatology: the use of molecular genetic analysis to assign spe-cies, sex and individual identity to seal faeces. Molecular Ecology,6, 225–234.
Taberlet P, Waits LP (1998) Non-invasive genetic sampling. Trendsin Ecology and Evolution, 13, 26–27.
Tikel D, Blair D, Marsh HD (1996) Marine mammal faeces as asource of DNA. Molecular Ecology, 5, 456–457.
MEC723.fm Page 1768 Wednesday, September 29, 1999 10:30 AM
Related Documents


