UNITED STATES SECURITIES AND EXCHANGE COMMISSION WASHINGTON, D.C. 20549 _______________________ FORM 8-K _______________________ CURRENT REPORT PURSUANT TO SECTION 13 OR 15(d) OF THE SECURITIES EXCHANGE ACT OF 1934 Date of report (Date of earliest event reported): July 21, 2021 THE INTERPUBLIC GROUP OF COMPANIES, INC. (Exact name of registrant as specified in its charter) Delaware 1-6686 13-1024020 (State or other jurisdiction of incorporation or organization) (Commission File Number) (I.R.S. Employer Identification No.) 909 Third Avenue, New York, New York 10022 (Address of principal executive offices) (Zip Code) (212)704-1200 (Registrant’s telephone number, including area code) (Former name, former address and former fiscal year, if changed since last report) Check the appropriate box below if the Form 8-K filing is intended to simultaneously satisfy the filing obligation of the registrant under any of the following provisions: ☐ Written communications pursuant to Rule 425 under the Securities Act (17 CFR 230.425) ☐ Soliciting material pursuant to Rule 14a-12 under the Exchange Act (17 CFR 240.14a-12) ☐ Pre-commencement communications pursuant to Rule 14d-2(b) under the Exchange Act (17 CFR 240.14d-2(b)) ☐ Pre-commencement communications pursuant to Rule 13e-4(c) under the Exchange Act (17 CFR 240.13e-4(c)) Securities registered pursuant to Section 12(b) of the Act: Title of each class Trading Symbol(s) Name of each exchange on which registered Common Stock, par value $0.10 per share IPG The New York Stock Exchange Indicate by check mark whether the registrant is an emerging growth company as defined in Rule 405 of the Securities Act of 1933 (§230.405 of this chapter) or Rule 12b-2 of the Securities Exchange Act of 1934 (§240.12b-2 of this chapter). Emerging growth company ☐ If an emerging growth company, indicate by check mark if the registrant has elected not to use the extended transition period for complying with any new or revised financial accounting standards provided pursuant to Section 13(a) of the Exchange Act. ☐

Welcome message from author
This document is posted to help you gain knowledge. Please leave a comment to let me know what you think about it! Share it to your friends and learn new things together.
Transcript
UNITED STATESSECURITIES AND EXCHANGE COMMISSION
WASHINGTON, D.C. 20549 _______________________
FORM 8-K_______________________
CURRENT REPORTPURSUANT TO SECTION 13 OR 15(d) OF THE
SECURITIES EXCHANGE ACT OF 1934
Date of report (Date of earliest event reported): July 21, 2021
THE INTERPUBLIC GROUP OF COMPANIES, INC.(Exact name of registrant as specified in its charter)
Delaware1-6686 13-1024020
(State or other jurisdiction ofincorporation or organization) (Commission File Number)
(I.R.S. EmployerIdentification No.)
909 Third Avenue, New York, New York 10022(Address of principal executive offices) (Zip Code)
(212)704-1200(Registrant’s telephone number, including area code)
(Former name, former address and former fiscal year, if changed since last report) Check the appropriate box below if the Form 8-K filing is intended to simultaneously satisfy the filing obligation of the registrant under any of the following provisions: ☐ Written communications pursuant to Rule 425 under the Securities Act (17 CFR 230.425)
☐ Soliciting material pursuant to Rule 14a-12 under the Exchange Act (17 CFR 240.14a-12) ☐ Pre-commencement communications pursuant to Rule 14d-2(b) under the Exchange Act (17 CFR 240.14d-2(b)) ☐ Pre-commencement communications pursuant to Rule 13e-4(c) under the Exchange Act (17 CFR 240.13e-4(c))
Securities registered pursuant to Section 12(b) of the Act:
Title of each class Trading Symbol(s) Name of each exchange on which registeredCommon Stock, par value $0.10 per share IPG The New York Stock Exchange
Indicate by check mark whether the registrant is an emerging growth company as defined in Rule 405 of the Securities Act of 1933 (§230.405 of this chapter) or Rule 12b-2 of the Securities Exchange Act of 1934 (§240.12b-2 of thischapter).
Emerging growth company ☐
If an emerging growth company, indicate by check mark if the registrant has elected not to use the extended transition period for complying with any new or revised financial accounting standards provided pursuant to Section 13(a) ofthe Exchange Act. ☐

Item 2.02. Results of Operations and Financial Condition.
On July 21, 2021, The Interpublic Group of Companies, Inc. (i) issued a press release, a copy of which is attached hereto as Exhibit 99.1 and incorporated by reference herein, announcing its results for the second quarter and firsthalf of 2021, (ii) held a conference call to discuss the foregoing results and (iii) posted an investor presentation, a copy of which is attached hereto as Exhibit 99.2 and incorporated by reference herein, on its website in connection withthe conference call.
Item 9.01. Financial Statements and Exhibits.
Exhibit 99.1: Press release dated July 21, 2021 (furnished pursuant to Item 2.02)
Exhibit 99.2: Investor presentation dated July 21, 2021 (furnished pursuant to Item 2.02)
Exhibit 104: Cover Page Interactive Data File - the cover page XBRL tags are embedded within the Inline XBRL document (included as Exhibit 101).

SIGNATURES
Pursuant to the requirements of the Securities Exchange Act of 1934, the registrant has duly caused this report to be signed on its behalf by the undersigned hereunto duly authorized.
THE INTERPUBLIC GROUP OF COMPANIES, INC.Date: July 21, 2021 By: /s/ Andrew Bonzani
Name: Andrew BonzaniTitle: Executive Vice President, General Counsel
Exhibit 99.1
FOR IMMEDIATE RELEASE New York, NY (July 21, 2021)
Interpublic Announces Second Quarter and First Half 2021 Results
• Second quarter net revenue was $2.27 billion, an increase of 22.5% from a year ago, with organic growth of 19.8%• Net income was $263.3 million, with adjusted EBITA before restructuring charges of $405.8 million and margin of 17.9% on net revenue• Second quarter diluted EPS was $0.66 as reported, and $0.70 as adjusted compared with $0.23 a year ago• Company upgrades expectation for FY 2021 financial performance to organic growth of 9%-10% and adjusted EBITA margin of approximately 16.0%, with continued progress on public health
and sustained macro recovery
Philippe Krakowsky, CEO of IPG:
“Our performance this quarter is highlighted by very strong revenue growth across agencies, disciplines and world regions, and by outstanding margin performance. These results represent a remarkable rebound
from the impact of the pandemic on our business, demonstrating the resilience of our people, as well as their commitment to each other, our clients, and our craft.”
“Our results this quarter compare favorably not only to the same period last year – which while the steepest decrease of the recession was well ahead of our peer group – but also Q2 of 2019, which underscores
the continued evolution and vitality of our offerings. Strategic decisions we have taken over a number of years to combine our world-class creative storytelling capabilities with our ability to deliver addressable and
accountable data-powered marketing programs position us well for the future. Ultimately, our growth speaks to our role as a high value partner that helps marketers to drive sustained business results."
“As we emerge from the pandemic, we continue to focus on the health and well-being of our people. This includes a focus on equity and inclusion, as well as a long-term commitment across the ESG spectrum,
including climate change, responsible data stewardship, digital media and brand safety practices."
“In light of our very strong second quarter, we believe it’s appropriate at the mid-point of this unprecedented year to upgrade our expectations for full year performance. While doing so, we also recognize that the
COVID pandemic continues to pose a risk to the macro environment in many parts of the world. Predicated on continued progress on public health issues, we believe we can deliver organic growth for the full year
of 9%-10%, and, with that level of growth, weInterpublic Group 909 Third Avenue New York, NY 10022 212-704-1200 tel 212-704-1201 fax
1
would expect to achieve 2021 adjusted EBITA margin of approximately 16.0%. As such, we see this as another year of strong value creation for all of our stakeholders.”
Summary
Revenue
• Second quarter 2021 net revenue of $2.27 billion increased by 22.5% compared to $1.85 billion in the second quarter of 2020. During the quarter, our organic net revenue increase was 19.8%, which was
comprised of an organic net revenue increase of 17.4% in the U.S. and an increase of 24.4% internationally. Second quarter 2021 total revenue, which includes billable expenses, of $2.51 billion increased
by 23.9% compared to $2.03 billion in 2020.
• First half 2021 net revenue of $4.30 billion increased by 12.3% compared to $3.83 billion in the first half of 2020. During the quarter, our organic net revenue increase was 10.6%, which was comprised of an
organic net revenue increase of 8.3% in the U.S. and an increase of 15.2% internationally. First half 2021 total revenue, which includes billable expenses, of $4.77 billion increased by 8.7% compared to
$4.39 billion in 2020.
Operating Results
• Operating income in the second quarter of 2021 increased to $384.4 million, compared to $40.5 million in 2020. Adjusted EBITA before restructuring charges increased to $405.8 million in the second
quarter of 2021, compared to adjusted EBITA before restructuring charges of $174.9 million for the same period in 2020. Adjusted EBITA before restructuring charges margin on net revenue increased to
17.9%, compared to 9.4% in 2020.
• Restructuring charges of $(0.2) million and $1.1 million for the three and six months ended June 30, 2021, respectively, consist of adjustments to the Company's restructuring actions taken during 2020 to
lower its operating expenses structurally and permanently relative to revenue and to accelerate the transformation of our business; there were no new restructuring actions in 2021. Restructuring charges
were $112.6 million for the three and six months ended June 30, 2020.
• Operating income in the first half of 2021 increased to $627.4 million, compared to $116.4 million in 2020. Adjusted EBITA before restructuring charges increased to $671.7 million in the first half of 2021,
compared to adjusted EBITA before restructuring charges of $272.1 million for the same period in 2020. Adjusted EBITA before restructuring charges margin on net revenue increased to 15.6%, compared
to 7.1% in 2020.
• Refer to reconciliations on page 12 for further detail.
Interpublic Group 909 Third Avenue New York, NY 10022 212-704-1200 tel 212-704-1201 fax
2
Net Results
• Income tax provision in the second quarter of 2021 was $86.7 million on income before income taxes of $354.1 million.
• Second quarter 2021 net income available to IPG common stockholders was $263.3 million, resulting in earnings of $0.67 per basic share and $0.66 per diluted share, compared to a loss of $0.12 per basic
and diluted share for the same period in 2020. Adjusted earnings were $0.70 per diluted share, compared to adjusted earnings of $0.23 per diluted share a year ago. Second quarter 2021 adjusted earnings
excludes after-tax amortization of acquired intangibles of $17.4 million, after-tax restructuring charges of $(0.2) million and an after-tax loss of $0.7 million on the sales of businesses.
• Income tax provision in the first half of 2021 was $110.5 million on income before income taxes of $470.5 million.
• First half 2021 net income available to IPG common stockholders was $355.0 million, resulting in earnings of $0.90 per basic share and $0.89 per diluted share, compared to a loss of $0.11 per basic and
diluted share for the same period in 2020. Adjusted earnings were $1.15 per diluted share, compared to adjusted earnings of $0.34 per diluted share a year ago. First half 2021 adjusted earnings excludes
after-tax amortization of acquired intangibles of $34.8 million, after-tax restructuring charges of $0.8 million, an after-tax loss of $12.5 million on the sales of businesses and an after-tax loss of $55.5 million
on the early extinguishment of debt.
• Refer to reconciliations on pages 10 through 14 for further detail.
Operating Results
Revenue
Net revenue of $2.27 billion in the second quarter of 2021 increased 22.5% compared with the same period in 2020. During the quarter, the effect of foreign currency translation was positive 3.1%, the impact of net
dispositions was negative 0.4%, and the resulting organic net revenue increase was 19.8%. Total revenue, which includes billable expenses, increased to $2.51 billion in the second quarter of 2021, compared to
$2.03 billion in 2020.
Net revenue of $4.30 billion in the first half of 2021 increased 12.3% compared with the same period in 2020. During the first half of 2021, the effect of foreign currency translation was positive 2.3%, the impact of
net dispositions was negative 0.6%, and the resulting organic net revenue increase was 10.6%. Total revenue, which includes billable expenses, increased to $4.77 billion in the first half of 2021, compared to $4.39
billion in 2020.
Operating Expenses
For the second quarter of 2021, total operating expenses, excluding billable expenses, increased by 4.0%, compared to the net revenue increase of 22.5% from the same period a yearInterpublic Group 909 Third Avenue New York, NY 10022 212-704-1200 tel 212-704-1201 fax
3

ago. For the first half of 2021, total operating expenses, excluding billable expenses, decreased by 1.1% compared to the net revenue increase of 12.3% from the same period a year ago.
Staff cost ratio, which is total salaries and related expenses as a percentage of net revenue, decreased to 65.4% in the second quarter of 2021 from 70.5% in the same period in 2020, and decreased to 67.0% in
the first half of 2021 from 71.3% in the same period in 2020. Salaries and related expenses increased 13.7% to $1.48 billion during the second quarter of 2021, compared to $1.31 billion for the same period in
2020. Salaries and related expenses increased 5.5% to $2.88 billion during the first half of 2021, compared to $2.73 billion for the same period in 2020. The decreases in staff cost ratio as a percentage of net
revenue in the second quarter and first half of 2021 were primarily driven by leverage on base salaries, benefits and tax, partially offset by increased incentive expense, primarily related to better than projected
performance, and increased temporary help expense. The decrease was also driven by lower severance expense as a result of initiatives taken in the comparable prior-year quarter.
Office and other direct expenses decreased as a percentage of net revenue to 13.3% during the second quarter of 2021, compared to 17.1% a year ago, and decreased as a percentage of net revenue to 13.8%
during the first half of 2021, compared to 18.2% a year ago. In the second quarter of 2021, office and other direct expenses were $301.0 million, a decrease of 5.0% compared to the same period in 2020. In the
first half of 2021, office and other direct expenses were $593.9 million, a decrease of 14.6% compared to the same period in 2020. The change was mainly driven by lower bad debt expense and a year-over-year
change in contingent acquisition obligations, as well as savings on occupancy expense as a result of real estate restructuring actions taken in 2020.
Selling, general and administrative expenses increased as a percentage of net revenue to 1.3% during the second quarter of 2021, compared to 0.2% during the same period in 2020, and increased as a
percentage of net revenue to 1.3% during the first half of 2021, compared to 0.7% during the same period in 2020. The change was primarily due to increases in incentive expense and employee insurance
expense.
Depreciation and amortization as a percentage of net revenue decreased to 3.1% during the second quarter of 2021, compared to 3.9% a year ago, and decreased to 3.2% during the first half of 2021, compared to
3.8% a year ago. During the second quarter of 2021, depreciation and amortization was $70.1 million, a decrease of 4.1% compared to the same period in 2020. During the first half of 2021, depreciation and
amortization was $139.3 million, a decrease of 4.5% compared to the same period in 2020.
Restructuring charges in the second quarter of 2021 were $(0.2) million and were $1.1 million in the first half of 2021, consisting of adjustments to the Company's restructuring actions takenInterpublic Group 909 Third Avenue New York, NY 10022 212-704-1200 tel 212-704-1201 fax
4

during 2020 to lower its operating expenses structurally and permanently relative to revenue and to accelerate the transformation of our business; there were no new restructuring actions in 2021. Restructuring
charges were $112.6 million for the three and six months ended June 30, 2020.
Non-Operating Results and Tax
Net interest expense decreased by $8.9 million to $35.0 million in the second quarter of 2021 from a year ago, and decreased by $0.3 million to $77.7 million in the first half of 2021 from a year ago.
Other income, net was $4.7 million in the second quarter of 2021 and other expense, net was $79.2 million in the first half of 2021, which included a pre-tax loss of $74.0 million related to the early extinguishment
of debt from the first quarter of 2021.
The income tax provision in the second quarter of 2021 was $86.7 million on income before income taxes of $354.1 million. This compares to an income tax provision of $19.0 million for the second quarter of 2020
on loss before income taxes of $24.9 million.
The income tax provision in the first half of 2021 was $110.5 million on income before income taxes of $470.5 million. This compares to an income tax provision of $36.2 million for the first half of 2020 on loss
before income taxes of $4.9 million.
Balance Sheet
At June 30, 2021, cash and cash equivalents totaled $2.34 billion, compared to $2.51 billion at December 31, 2020 and $1.09 billion on June 30, 2020. Total debt was $3.47 billion at June 30, 2021, compared to
$3.47 billion at December 31, 2020. On February 25, 2021, the Company issued $500.0 million aggregate principal amount of 2.400% unsecured senior notes due 2031 and $500.0 million aggregate principal
amount of 3.375% unsecured senior notes due 2041. The net proceeds were used towards the early extinguishment of our 4.000% unsecured senior notes due 2022, 3.750% unsecured senior notes due 2023 and
half of our 4.200% unsecured senior notes due 2024.
Common Stock Dividend
During the second quarter of 2021, the Company declared and paid a common stock cash dividend of $0.270 per share, for a total of $106.1 million.
Interpublic Group 909 Third Avenue New York, NY 10022 212-704-1200 tel 212-704-1201 fax
5

For further information regarding the Company's financial results as well as certain non-GAAP measures including organic net revenue change, adjusted EBITA, adjusted EBITA before restructuring charges and
adjusted earnings per diluted share, and the reconciliations thereof, please refer to pages 10 to 14 and our Investor Presentation filed on Form 8-K herewith and available on our website, www.interpublic.com.
# # #
About Interpublic
Interpublic (NYSE: IPG) (www.interpublic.com) is a values-based, data-fueled, and creatively-driven provider of marketing solutions. Home to some of the world’s best-known and most innovative communicationsspecialists, IPG global brands include: Acxiom, Craft, FCB, FutureBrand, Golin, Huge, Initiative, Jack Morton, Kinesso, MAGNA, Matterkind, McCann, Mediahub, Momentum, MRM, MullenLowe Group, Octagon,R/GA, UM, Weber Shandwick and more. IPG is an S&P 500 company with net revenue of $8.06 billion in 2020.
# # #
Contact Information
Tom Cunningham(Press)(212) 704-1326
Jerry Leshne(Analysts, Investors)(212) 704-1439
Interpublic Group 909 Third Avenue New York, NY 10022 212-704-1200 tel 212-704-1201 fax
6

Cautionary Statement
This release contains forward-looking statements. Statements in this release that are not historical facts, including statements about management’s beliefs and expectations, constitute forward-looking statements.These statements are based on current plans, estimates and projections, and are subject to change based on a number of factors, including those outlined under item 1A, Risk Factors, in our most recent AnnualReport on Form 10-K and our quarterly reports on Form 10-Q and our other filings with the Securities and Exchange Commission ("SEC"). Forward-looking statements speak only as of the date they are made, andwe undertake no obligation to update publicly any of them in light of new information or future events.
Forward-looking statements involve inherent risks and uncertainties. A number of important factors could cause actual results to differ materially from those contained in any forward-looking statement. Such factorsinclude, but are not limited to, the following:
◦ the effects of a challenging economy on the demand for our advertising and marketing services, on our clients’ financial condition and on our business or financial condition;◦ the impacts of the novel coronavirus (COVID-19) pandemic and the measures to contain its spread, including social distancing efforts and restrictions on businesses, social activities and travel, any
failure to realize anticipated benefits from the rollout of COVID-19 vaccination campaigns and the resulting impact on the economy, our clients and demand for our services, which may precipitate orexacerbate other risks and uncertainties;
◦ our ability to attract new clients and retain existing clients;◦ our ability to retain and attract key employees;◦ risks associated with assumptions we make in connection with our critical accounting estimates, including changes in assumptions associated with any effects of a weakened economy;◦ potential adverse effects if we are required to recognize impairment charges or other adverse accounting-related developments;◦ risks associated with the effects of global, national and regional economic and political conditions, including counterparty risks and fluctuations in economic growth rates, interest rates and currency
exchange rates;◦ developments from changes in the regulatory and legal environment for advertising and marketing and communications services companies around the world, including laws and regulations related to
data protection and consumer privacy; and◦ failure to fully realize the anticipated benefits of our 2020 restructuring actions and other cost-saving initiatives.
Investors should carefully consider these factors and the additional risk factors outlined in more detail under Item 1A, Risk Factors, in our most recent Annual Report on Form 10-K and our quarterly reports on Form10-Q and our other SEC filings.
Interpublic Group 909 Third Avenue New York, NY 10022 212-704-1200 tel 212-704-1201 fax
7
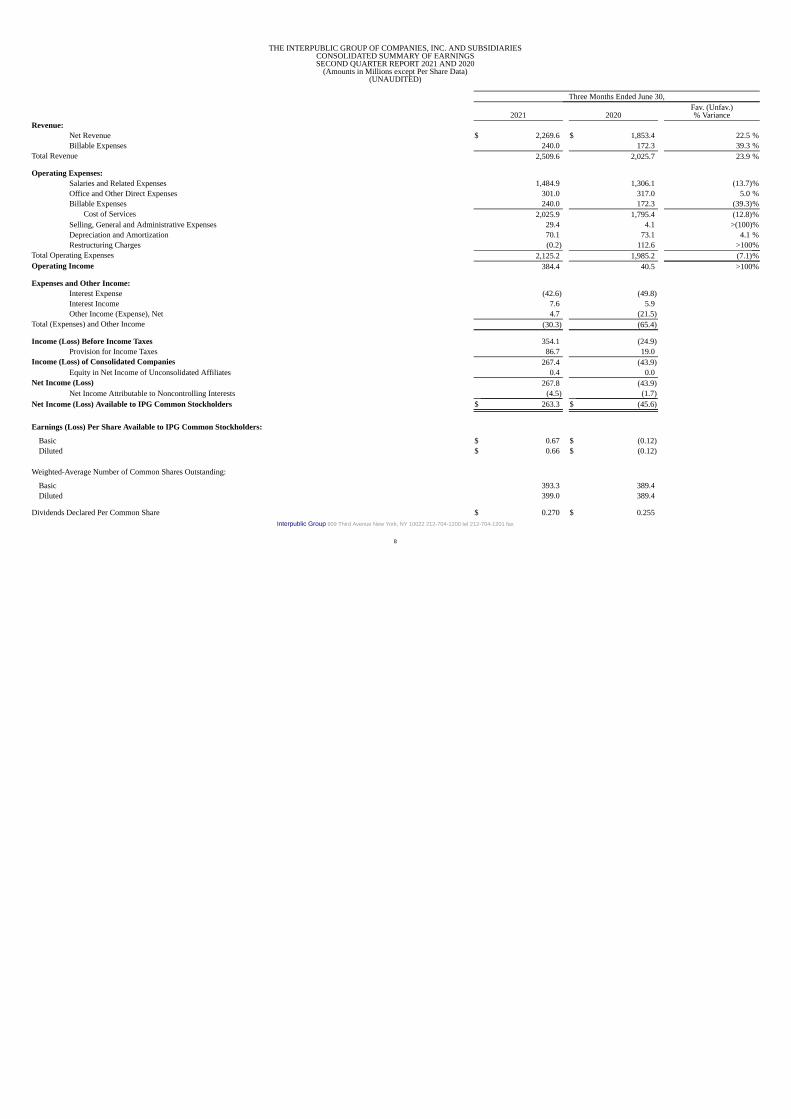
THE INTERPUBLIC GROUP OF COMPANIES, INC. AND SUBSIDIARIESCONSOLIDATED SUMMARY OF EARNINGSSECOND QUARTER REPORT 2021 AND 2020
(Amounts in Millions except Per Share Data)(UNAUDITED)
Three Months Ended June 30,
2021 2020Fav. (Unfav.)% Variance
Revenue:Net Revenue $ 2,269.6 $ 1,853.4 22.5 %Billable Expenses 240.0 172.3 39.3 %
Total Revenue 2,509.6 2,025.7 23.9 %
Operating Expenses:Salaries and Related Expenses 1,484.9 1,306.1 (13.7)%Office and Other Direct Expenses 301.0 317.0 5.0 %Billable Expenses 240.0 172.3 (39.3)%
Cost of Services 2,025.9 1,795.4 (12.8)%Selling, General and Administrative Expenses 29.4 4.1 >(100)%Depreciation and Amortization 70.1 73.1 4.1 %Restructuring Charges (0.2) 112.6 >100%
Total Operating Expenses 2,125.2 1,985.2 (7.1)%Operating Income 384.4 40.5 >100%
Expenses and Other Income:Interest Expense (42.6) (49.8)Interest Income 7.6 5.9 Other Income (Expense), Net 4.7 (21.5)
Total (Expenses) and Other Income (30.3) (65.4)
Income (Loss) Before Income Taxes 354.1 (24.9)Provision for Income Taxes 86.7 19.0
Income (Loss) of Consolidated Companies 267.4 (43.9)Equity in Net Income of Unconsolidated Affiliates 0.4 0.0
Net Income (Loss) 267.8 (43.9)Net Income Attributable to Noncontrolling Interests (4.5) (1.7)
Net Income (Loss) Available to IPG Common Stockholders $ 263.3 $ (45.6)
Earnings (Loss) Per Share Available to IPG Common Stockholders:
Basic $ 0.67 $ (0.12)Diluted $ 0.66 $ (0.12)
Weighted-Average Number of Common Shares Outstanding:
Basic 393.3 389.4 Diluted 399.0 389.4
Dividends Declared Per Common Share $ 0.270 $ 0.255 Interpublic Group 909 Third Avenue New York, NY 10022 212-704-1200 tel 212-704-1201 fax
8
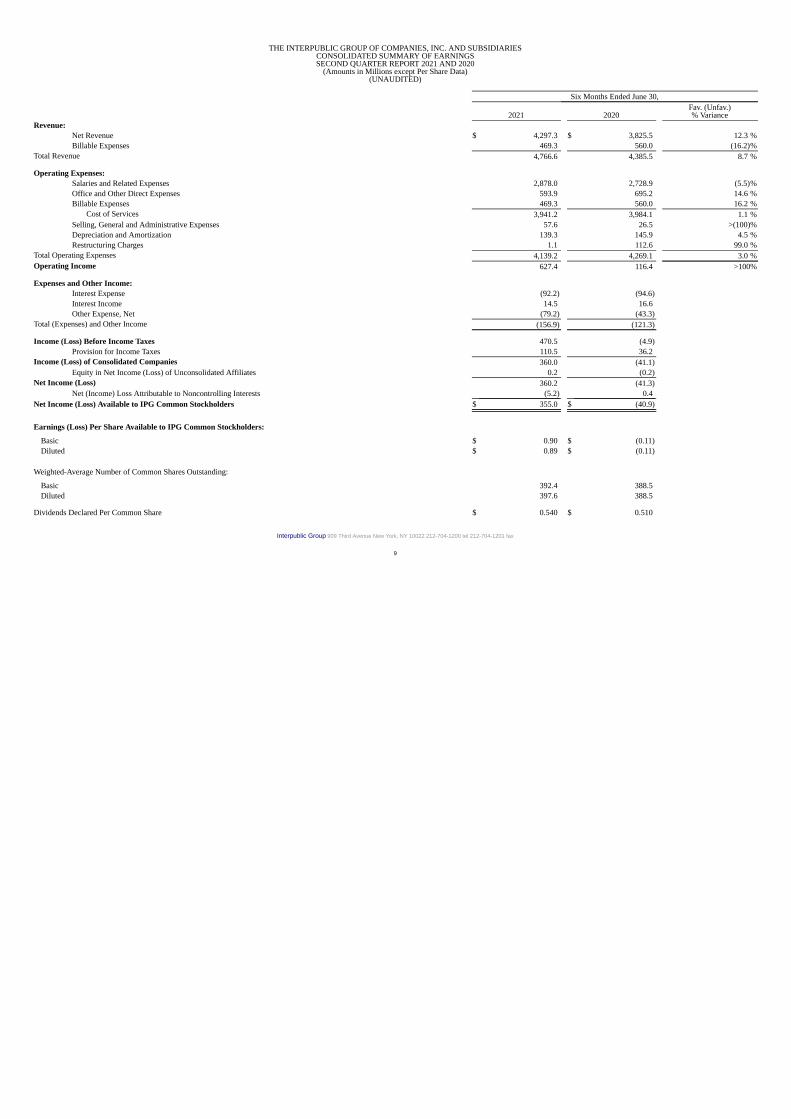
THE INTERPUBLIC GROUP OF COMPANIES, INC. AND SUBSIDIARIESCONSOLIDATED SUMMARY OF EARNINGSSECOND QUARTER REPORT 2021 AND 2020
(Amounts in Millions except Per Share Data)(UNAUDITED)
Six Months Ended June 30,
2021 2020Fav. (Unfav.)% Variance
Revenue:Net Revenue $ 4,297.3 $ 3,825.5 12.3 %Billable Expenses 469.3 560.0 (16.2)%
Total Revenue 4,766.6 4,385.5 8.7 %
Operating Expenses:Salaries and Related Expenses 2,878.0 2,728.9 (5.5)%Office and Other Direct Expenses 593.9 695.2 14.6 %Billable Expenses 469.3 560.0 16.2 %
Cost of Services 3,941.2 3,984.1 1.1 %Selling, General and Administrative Expenses 57.6 26.5 >(100)%Depreciation and Amortization 139.3 145.9 4.5 %Restructuring Charges 1.1 112.6 99.0 %
Total Operating Expenses 4,139.2 4,269.1 3.0 %Operating Income 627.4 116.4 >100%
Expenses and Other Income:Interest Expense (92.2) (94.6)Interest Income 14.5 16.6 Other Expense, Net (79.2) (43.3)
Total (Expenses) and Other Income (156.9) (121.3)
Income (Loss) Before Income Taxes 470.5 (4.9)Provision for Income Taxes 110.5 36.2
Income (Loss) of Consolidated Companies 360.0 (41.1)Equity in Net Income (Loss) of Unconsolidated Affiliates 0.2 (0.2)
Net Income (Loss) 360.2 (41.3)Net (Income) Loss Attributable to Noncontrolling Interests (5.2) 0.4
Net Income (Loss) Available to IPG Common Stockholders $ 355.0 $ (40.9)
Earnings (Loss) Per Share Available to IPG Common Stockholders:
Basic $ 0.90 $ (0.11)Diluted $ 0.89 $ (0.11)
Weighted-Average Number of Common Shares Outstanding:
Basic 392.4 388.5 Diluted 397.6 388.5
Dividends Declared Per Common Share $ 0.540 $ 0.510
Interpublic Group 909 Third Avenue New York, NY 10022 212-704-1200 tel 212-704-1201 fax
9
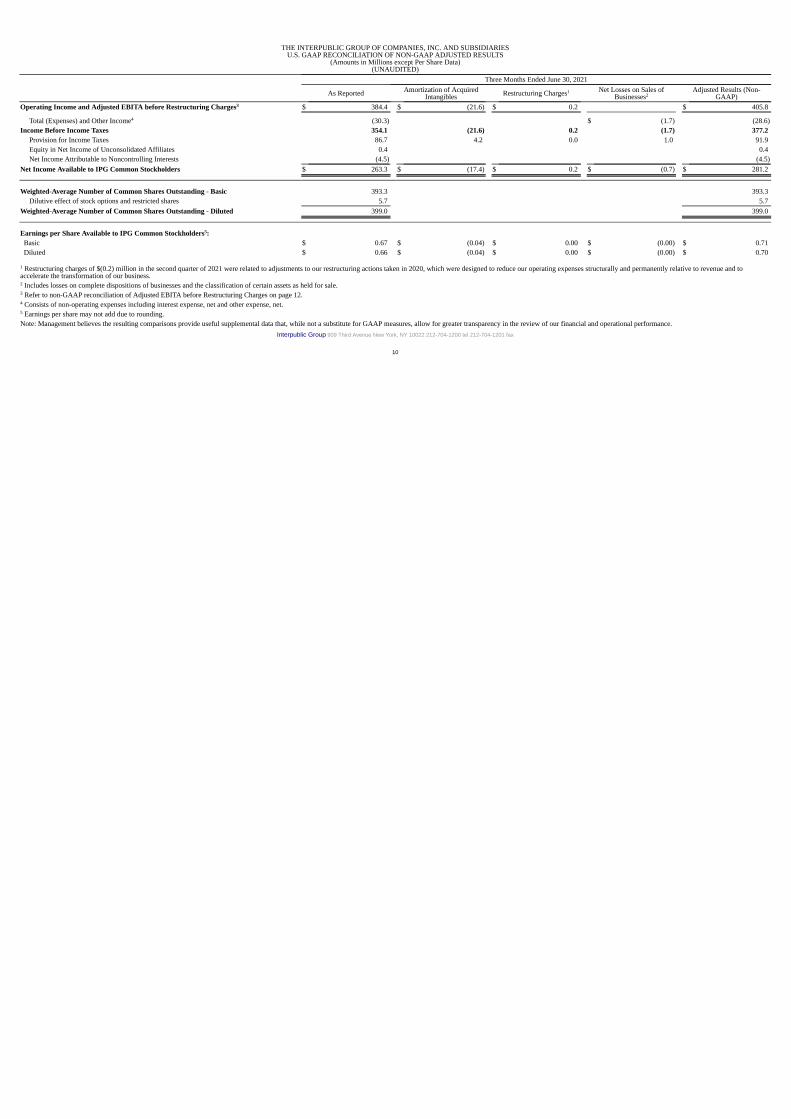
THE INTERPUBLIC GROUP OF COMPANIES, INC. AND SUBSIDIARIESU.S. GAAP RECONCILIATION OF NON-GAAP ADJUSTED RESULTS
(Amounts in Millions except Per Share Data)(UNAUDITED)
Three Months Ended June 30, 2021
As Reported Amortization of AcquiredIntangibles Restructuring Charges Net Losses on Sales of
BusinessesAdjusted Results (Non-
GAAP)Operating Income and Adjusted EBITA before Restructuring Charges $ 384.4 $ (21.6) $ 0.2 $ 405.8
Total (Expenses) and Other Income (30.3) $ (1.7) (28.6)Income Before Income Taxes 354.1 (21.6) 0.2 (1.7) 377.2
Provision for Income Taxes 86.7 4.2 0.0 1.0 91.9 Equity in Net Income of Unconsolidated Affiliates 0.4 0.4 Net Income Attributable to Noncontrolling Interests (4.5) (4.5)
Net Income Available to IPG Common Stockholders $ 263.3 $ (17.4) $ 0.2 $ (0.7) $ 281.2
Weighted-Average Number of Common Shares Outstanding - Basic 393.3 393.3 Dilutive effect of stock options and restricted shares 5.7 5.7
Weighted-Average Number of Common Shares Outstanding - Diluted 399.0 399.0
Earnings per Share Available to IPG Common Stockholders : Basic $ 0.67 $ (0.04) $ 0.00 $ (0.00) $ 0.71 Diluted $ 0.66 $ (0.04) $ 0.00 $ (0.00) $ 0.70
Restructuring charges of $(0.2) million in the second quarter of 2021 were related to adjustments to our restructuring actions taken in 2020, which were designed to reduce our operating expenses structurally and permanently relative to revenue and toaccelerate the transformation of our business. Includes losses on complete dispositions of businesses and the classification of certain assets as held for sale. Refer to non-GAAP reconciliation of Adjusted EBITA before Restructuring Charges on page 12. Consists of non-operating expenses including interest expense, net and other expense, net. Earnings per share may not add due to rounding.
Note: Management believes the resulting comparisons provide useful supplemental data that, while not a substitute for GAAP measures, allow for greater transparency in the review of our financial and operational performance.
12
3
4
5
1
2
3
4
5
Interpublic Group 909 Third Avenue New York, NY 10022 212-704-1200 tel 212-704-1201 fax
10

THE INTERPUBLIC GROUP OF COMPANIES, INC. AND SUBSIDIARIESU.S. GAAP RECONCILIATION OF NON-GAAP ADJUSTED RESULTS
(Amounts in Millions except Per Share Data)(UNAUDITED)
Six Months Ended June 30, 2021
As Reported Amortization of AcquiredIntangibles Restructuring Charges Net Losses on Sales of
BusinessesLoss on Early
Extinguishment of DebtAdjusted Results (Non-
GAAP)Operating Income and Adjusted EBITA before Restructuring Charges $ 627.4 $ (43.2) $ (1.1) $ 671.7
Total (Expenses) and Other Income (156.9) $ (14.2) $ (74.0) (68.7)Income Before Income Taxes 470.5 (43.2) (1.1) (14.2) (74.0) 603.0
Provision for Income Taxes 110.5 8.4 0.3 1.7 18.5 139.4 Equity in Net Income of Unconsolidated Affiliates 0.2 0.2 Net Income Attributable to Noncontrolling Interests (5.2) (5.2)
Net Income Available to IPG Common Stockholders $ 355.0 $ (34.8) $ (0.8) $ (12.5) $ (55.5) $ 458.6
Weighted-Average Number of Common Shares Outstanding - Basic 392.4 392.4 Dilutive effect of stock options and restricted shares 5.2 5.2
Weighted-Average Number of Common Shares Outstanding - Diluted 397.6 397.6
Earnings per Share Available to IPG Common Stockholders : Basic $ 0.90 $ (0.09) $ (0.00) $ (0.03) $ (0.14) $ 1.17 Diluted $ 0.89 $ (0.09) $ (0.00) $ (0.03) $ (0.14) $ 1.15
Restructuring charges of $1.1 million in the first half of 2021 were related to adjustments to our restructuring actions taken in 2020, which were designed to reduce our operating expenses structurally and permanently relative to revenue and to accelerate thetransformation of our business. Includes losses on complete dispositions of businesses and the classification of certain assets as held for sale.Consists of a loss incurred in the first quarter of 2021 related to the early extinguishment of our 4.000% unsecured senior notes due 2022, 3.750% unsecured senior notes due 2023 and half of our 4.200% unsecured senior notes due 2024. Refer to non-GAAP reconciliation of Adjusted EBITA before Restructuring Charges on page 12. Consists of non-operating expenses including interest expense, net and other expense, net. Earnings per share may not add due to rounding.
Note: Management believes the resulting comparisons provide useful supplemental data that, while not a substitute for GAAP measures, allow for greater transparency in the review of our financial and operational performance.
12 3
4
5
6
1
2
3
4
5
6
Interpublic Group 909 Third Avenue New York, NY 10022 212-704-1200 tel 212-704-1201 fax
11

THE INTERPUBLIC GROUP OF COMPANIES, INC. AND SUBSIDIARIESU.S. GAAP RECONCILIATION OF NON-GAAP ADJUSTED RESULTS
(Amounts in Millions)(UNAUDITED)
Three Months Ended June 30, Six Months Ended June 30,2021 2020 2021 2020
Net Revenue $ 2,269.6 $ 1,853.4 $ 4,297.3 $ 3,825.5
Non-GAAP Reconciliation:Net Income (Loss) Available to IPG Common Stockholders $ 263.3 $ (45.6) $ 355.0 $ (40.9)
Add Back:Provision for Income Taxes 86.7 19.0 110.5 36.2
Subtract:Total (Expenses) and Other Income (30.3) (65.4) (156.9) (121.3)Equity in Net Income (Loss) of Unconsolidated Affiliates 0.4 0.0 0.2 (0.2)Net (Income) Loss Attributable to Noncontrolling Interests (4.5) (1.7) (5.2) 0.4
Operating Income 384.4 40.5 627.4 116.4 Add Back:
Amortization of Acquired Intangibles 21.6 21.8 43.2 43.1 Adjusted EBITA $ 406.0 $ 62.3 $ 670.6 $ 159.5 Adjusted EBITA Margin on Net Revenue % 17.9 % 3.4 % 15.6 % 4.2 %
Restructuring Charges (0.2) 112.6 1.1 112.6 Adjusted EBITA before Restructuring Charges $ 405.8 $ 174.9 $ 671.7 $ 272.1 Adjusted EBITA before Restructuring Charges Margin on Net Revenue % 17.9 % 9.4 % 15.6 % 7.1 %
Restructuring charges of $(0.2) million and $1.1 million in the second quarter and first half of 2021, respectively, were related to adjustments to our restructuring actions taken in 2020, which were designed to reduce our operating expenses structurally andpermanently relative to revenue and to accelerate the transformation of our business.Note: Management believes the resulting comparisons provide useful supplemental data that, while not a substitute for GAAP measures, allow for greater transparency in the review of our financial and operational performance.
1
1
Interpublic Group 909 Third Avenue New York, NY 10022 212-704-1200 tel 212-704-1201 fax
12

THE INTERPUBLIC GROUP OF COMPANIES, INC. AND SUBSIDIARIESU.S. GAAP RECONCILIATION OF NON-GAAP ADJUSTED RESULTS
(Amounts in Millions except Per Share Data)(UNAUDITED)
Three Months Ended June 30, 2020
As Reported Amortization of AcquiredIntangibles Restructuring Charges Net Losses on Sales of
BusinessesNet Impact of Discrete
Tax ItemsAdjusted Results (Non-
GAAP)Operating Income and Adjusted EBITA before Restructuring Charges $ 40.5 $ (21.8) $ (112.6) $ 174.9
Total (Expenses) and Other Income (65.4) $ (19.9) (45.5)(Loss) Income Before Income Taxes (24.9) (21.8) (112.6) (19.9) 129.4
Provision for Income Taxes 19.0 4.2 25.4 0.0 $ (10.0) 38.6 Equity in Net Loss of Unconsolidated Affiliates 0.0 0.0 Net Income Attributable to Noncontrolling Interests (1.7) (1.7)
Net (Loss) Income Available to IPG Common Stockholders $ (45.6) $ (17.6) $ (87.2) $ (19.9) $ (10.0) $ 89.1
Weighted-Average Number of Common Shares Outstanding - Basic 389.4 389.4 Dilutive effect of stock options and restricted shares N/A 2.9
Weighted-Average Number of Common Shares Outstanding - Diluted 389.4 392.3
(Loss) Earnings per Share Available to IPG Common Stockholders : Basic $ (0.12) $ (0.05) $ (0.22) $ (0.05) $ (0.03) $ 0.23 Diluted $ (0.12) $ (0.05) $ (0.22) $ (0.05) $ (0.03) $ 0.23
Includes losses on complete dispositions of businesses and the classification of certain assets as held for sale.Consists of tax expense related to the estimated costs associated with our change in assertion (APB 23) that we will no longer permanently reinvest undistributed earnings attributable to certain foreign subsidiaries. Refer to non-GAAP reconciliation of Adjusted EBITA before Restructuring Charges on page 12. Consists of non-operating expenses including interest expense, net and other expense, net. Earnings per share may not add due to rounding.
Note: Management believes the resulting comparisons provide useful supplemental data that, while not a substitute for GAAP measures, allow for greater transparency in the review of our financial and operational performance.
1 2
3
4
5
1
2
3
4
5
Interpublic Group 909 Third Avenue New York, NY 10022 212-704-1200 tel 212-704-1201 fax
13
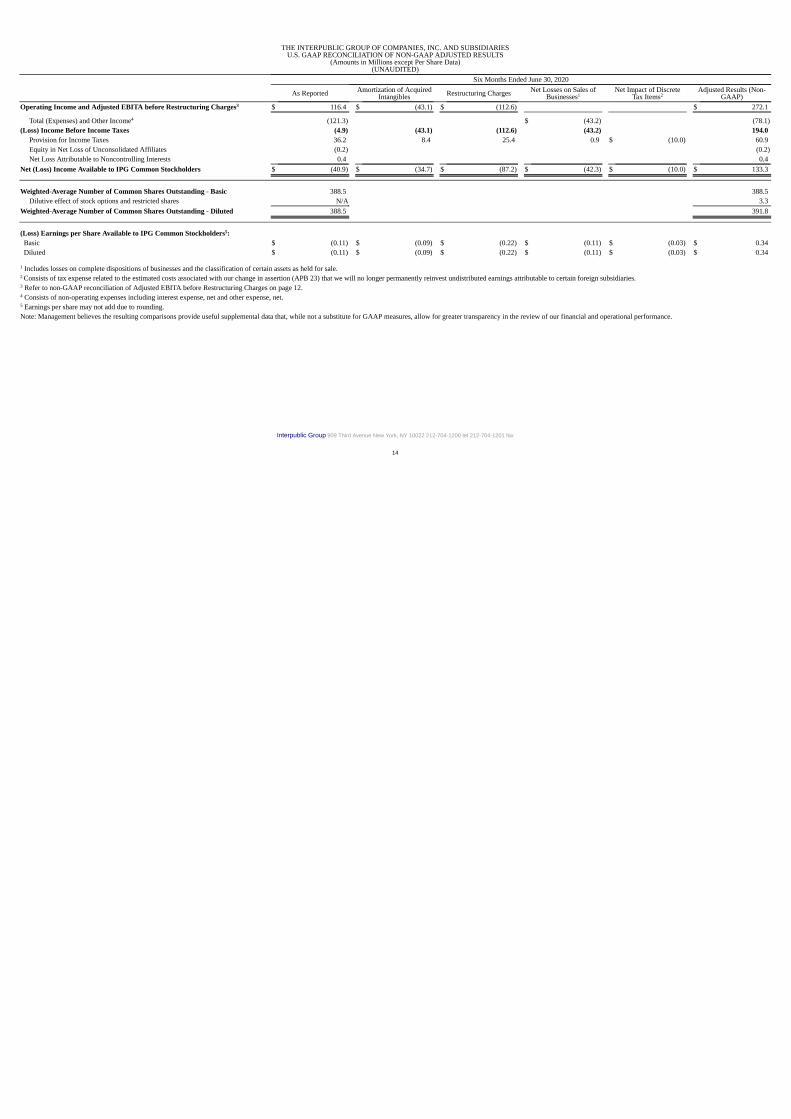
THE INTERPUBLIC GROUP OF COMPANIES, INC. AND SUBSIDIARIESU.S. GAAP RECONCILIATION OF NON-GAAP ADJUSTED RESULTS
(Amounts in Millions except Per Share Data)(UNAUDITED)
Six Months Ended June 30, 2020
As Reported Amortization of AcquiredIntangibles Restructuring Charges Net Losses on Sales of
BusinessesNet Impact of Discrete
Tax ItemsAdjusted Results (Non-
GAAP)Operating Income and Adjusted EBITA before Restructuring Charges $ 116.4 $ (43.1) $ (112.6) $ 272.1
Total (Expenses) and Other Income (121.3) $ (43.2) (78.1)(Loss) Income Before Income Taxes (4.9) (43.1) (112.6) (43.2) 194.0
Provision for Income Taxes 36.2 8.4 25.4 0.9 $ (10.0) 60.9 Equity in Net Loss of Unconsolidated Affiliates (0.2) (0.2)Net Loss Attributable to Noncontrolling Interests 0.4 0.4
Net (Loss) Income Available to IPG Common Stockholders $ (40.9) $ (34.7) $ (87.2) $ (42.3) $ (10.0) $ 133.3
Weighted-Average Number of Common Shares Outstanding - Basic 388.5 388.5 Dilutive effect of stock options and restricted shares N/A 3.3
Weighted-Average Number of Common Shares Outstanding - Diluted 388.5 391.8
(Loss) Earnings per Share Available to IPG Common Stockholders : Basic $ (0.11) $ (0.09) $ (0.22) $ (0.11) $ (0.03) $ 0.34 Diluted $ (0.11) $ (0.09) $ (0.22) $ (0.11) $ (0.03) $ 0.34
Includes losses on complete dispositions of businesses and the classification of certain assets as held for sale.Consists of tax expense related to the estimated costs associated with our change in assertion (APB 23) that we will no longer permanently reinvest undistributed earnings attributable to certain foreign subsidiaries. Refer to non-GAAP reconciliation of Adjusted EBITA before Restructuring Charges on page 12. Consists of non-operating expenses including interest expense, net and other expense, net. Earnings per share may not add due to rounding.
Note: Management believes the resulting comparisons provide useful supplemental data that, while not a substitute for GAAP measures, allow for greater transparency in the review of our financial and operational performance.
1 2
3
4
5
1
2
3
4
5
Interpublic Group 909 Third Avenue New York, NY 10022 212-704-1200 tel 212-704-1201 fax
14

Interpublic Group July 21, 2021 SECOND QUARTER 2021 EARNINGS CONFERENCE CALL
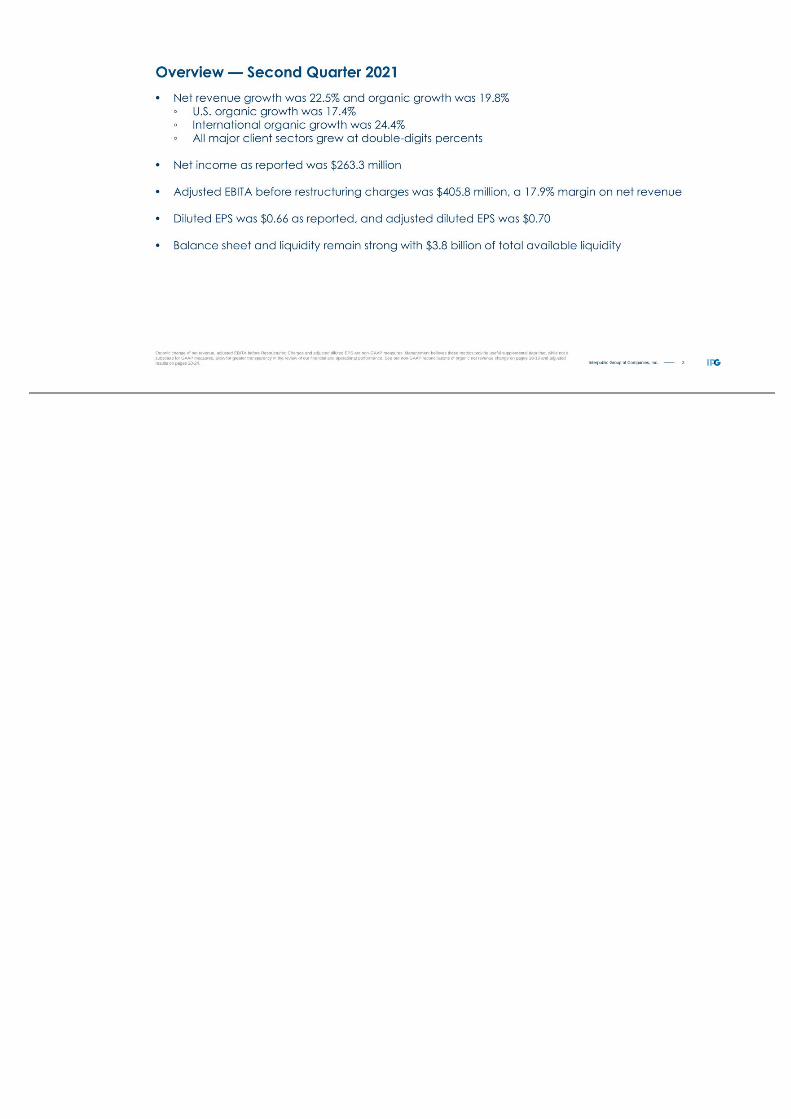
2Interpublic Group of Companies, Inc. Overview — Second Quarter 2021 Organic change of net revenue, adjusted EBITA before Restructuring Charges and adjusted diluted EPS are non-GAAP measures. Management believes these metrics provide useful supplemental data that, while not a substitute for GAAP measures, allow for greater transparency in the review of our financial and operational performance. See our non-GAAP reconciliations of organic net revenue change on pages 18-19 and adjusted results on pages 20-24. • Net revenue growth was 22.5% and organic growth was 19.8% ◦ U.S. organic growth was 17.4% ◦ International organic growth was 24.4% ◦ All major client sectors grew at double-digits percents • Net income as reported was $263.3 million • Adjusted EBITA before restructuring charges was $405.8 million, a 17.9% margin on net revenue • Diluted EPS was $0.66 as reported, and adjusted diluted EPS was $0.70 • Balance sheet and liquidity remain strong with $3.8 billion of total available liquidity

3Interpublic Group of Companies, Inc. Three Months Ended June 30, 2021 2020 Net Revenue $ 2,269.6 $ 1,853.4 Billable Expenses 240.0 172.3 Total Revenue 2,509.6 2,025.7 Salaries and Related Expenses 1,484.9 1,306.1 Office and Other Direct Expenses 301.0 317.0 Billable Expenses 240.0 172.3 Cost of Services 2,025.9 1,795.4 Selling, General and Administrative Expenses 29.4 4.1 Depreciation and Amortization 70.1 73.1 Restructuring Charges (0.2) 112.6 Total Operating Expenses 2,125.2 1,985.2 Operating Income 384.4 40.5 Interest Expense, net (35.0) (43.9) Other Income (Expense), net 4.7 (21.5) Income (Loss) Before Income Taxes 354.1 (24.9) Provision for Income Taxes 86.7 19.0 Equity in Net Income of Unconsolidated Affiliates 0.4 0.0 Net Income (Loss) 267.8 (43.9) Net Income Attributable to Noncontrolling Interests (4.5) (1.7) Net Income (Loss) Available to IPG Common Stockholders $ 263.3 $ (45.6) Earnings (Loss) per Share Available to IPG Common Stockholders - Basic $ 0.67 $ (0.12) Earnings (Loss) per Share Available to IPG Common Stockholders - Diluted $ 0.66 $ (0.12) Weighted-Average Number of Common Shares Outstanding - Basic 393.3 389.4 Weighted-Average Number of Common Shares Outstanding - Diluted 399.0 389.4 Dividends Declared per Common Share $ 0.270 $ 0.255 ($ in Millions, except per share amounts) Operating Performance

4Interpublic Group of Companies, Inc. Three Months Ended Six Months Ended $ % Change $ % Change June 30, 2020 $ 1,853.4 $ 3,825.5 Foreign currency 58.1 3.1% 87.4 2.3% Net acquisitions/(divestitures) (8.0) (0.4%) (19.7) (0.6%) Organic 366.1 19.8% 404.1 10.6% Total change 416.2 22.5% 471.8 12.3% June 30, 2021 $ 2,269.6 $ 4,297.3 Three Months Ended June 30, Six Months Ended June 30, Change Change 2021 2020 Organic Total 2021 2020 Organic Total IAN $ 1,954.5 $ 1,585.7 20.5% 23.3% $ 3,688.6 $ 3,250.2 11.6% 13.5% DXTRA $ 315.1 $ 267.7 15.1% 17.7% $ 608.7 $ 575.3 4.5% 5.8% See reconciliation of segment organic net revenue change on page 18. ($ in Millions) Net Revenue
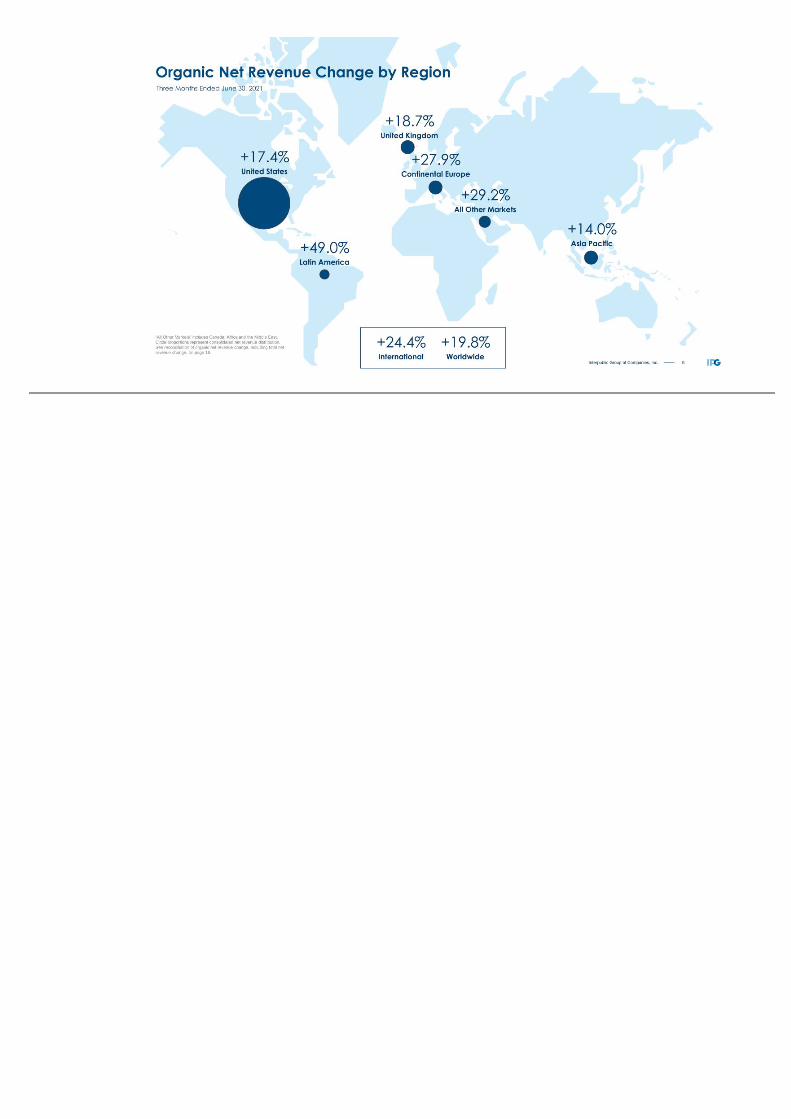
5Interpublic Group of Companies, Inc. Organic Net Revenue Change by Region “All Other Markets” includes Canada, Africa and the Middle East. Circle proportions represent consolidated net revenue distribution. See reconciliation of organic net revenue change, including total net revenue change, on page 18. Three Months Ended June 30, 2021 +17.4% United States +18.7% United Kingdom +27.9% Continental Europe +49.0% Latin America +14.0% Asia Pacific +24.4% International +19.8% Worldwide +29.2% All Other Markets

6Interpublic Group of Companies, Inc. Operating Expenses % of Net Revenue (1) Excludes amortization of acquired intangibles. Three Months Ended June 30 (1)

7Interpublic Group of Companies, Inc. Three Months Ended June 30, 2021 As Reported Amortization of Acquired Intangibles Restructuring Charges (1) Net Losses on Sales of Businesses Adjusted Results (Non-GAAP) Operating Income and Adjusted EBITA before Restructuring Charges $ 384.4 $ (21.6) $ 0.2 $ 405.8 Total (Expenses) and Other Income (3) (30.3) $ (1.7) (28.6) Income Before Income Taxes 354.1 (21.6) 0.2 (1.7) 377.2 Provision for Income Taxes 86.7 4.2 0.0 1.0 91.9 Equity in Net Income of Unconsolidated Affiliates 0.4 0.4 Net Income Attributable to Noncontrolling Interests (4.5) (4.5) DILUTED EPS COMPONENTS: Net Income Available to IPG Common Stockholders $ 263.3 $ (17.4) $ 0.2 $ (0.7) $ 281.2 Weighted-Average Number of Common Shares Outstanding 399.0 399.0 Earnings per Share Available to IPG Common Stockholders (4) $ 0.66 $ (0.04) $ 0.00 $ (0.00) $ 0.70 ($ in Millions, except per share amounts) (1) Restructuring charges of ($0.2) in the second quarter of 2021 were related to adjustments to our restructuring actions taken in 2020, which were designed to reduce our operating expenses structurally and permanently relative to revenue and to accelerate the transformation of our business. (2) Refer to non-GAAP reconciliation of Adjusted EBITA before Restructuring Charges on page 22. (3) Consists of non-operating expenses including interest expense, net and other expense, net. (4) Earnings per share may not add due to rounding. See full non-GAAP reconciliation of adjusted diluted earnings per share on page 20. Adjusted Diluted Earnings Per Share (2)
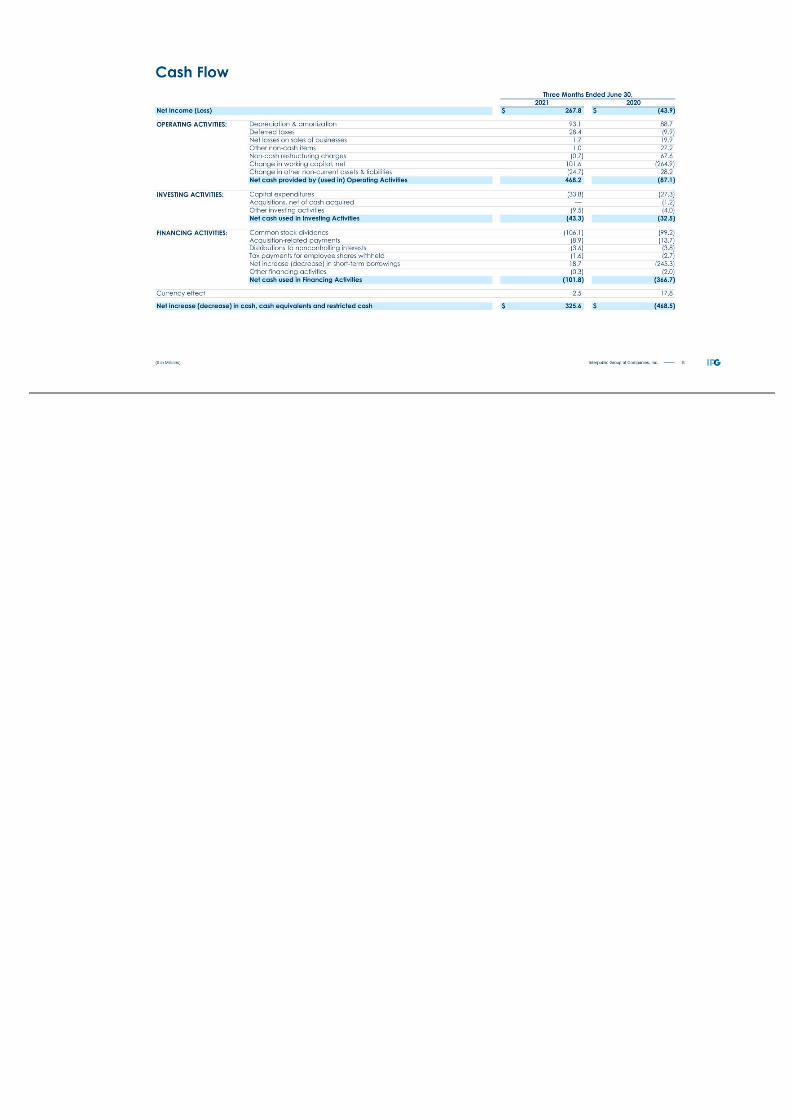
8Interpublic Group of Companies, Inc. Three Months Ended June 30, 2021 2020 Net Income (Loss) $ 267.8 $ (43.9) OPERATING ACTIVITIES: Depreciation & amortization 93.1 88.7 Deferred taxes 28.4 (9.9) Net losses on sales of businesses 1.7 19.9 Other non-cash items 1.0 27.2 Non-cash restructuring charges (0.7) 67.6 Change in working capital, net 101.6 (264.9) Change in other non-current assets & liabilities (24.7) 28.2 Net cash provided by (used in) Operating Activities 468.2 (87.1) INVESTING ACTIVITIES: Capital expenditures (33.8) (27.3) Acquisitions, net of cash acquired — (1.2) Other investing activities (9.5) (4.0) Net cash used in Investing Activities (43.3) (32.5) FINANCING ACTIVITIES: Common stock dividends (106.1) (99.2) Acquisition-related payments (8.9) (13.7) Distributions to noncontrolling interests (3.6) (3.8) Tax payments for employee shares withheld (1.6) (2.7) Net increase (decrease) in short-term borrowings 18.7 (245.3) Other financing activities (0.3) (2.0) Net cash used in Financing Activities (101.8) (366.7) Currency effect 2.5 17.8 Net increase (decrease) in cash, cash equivalents and restricted cash $ 325.6 $ (468.5) ($ in Millions) Cash Flow
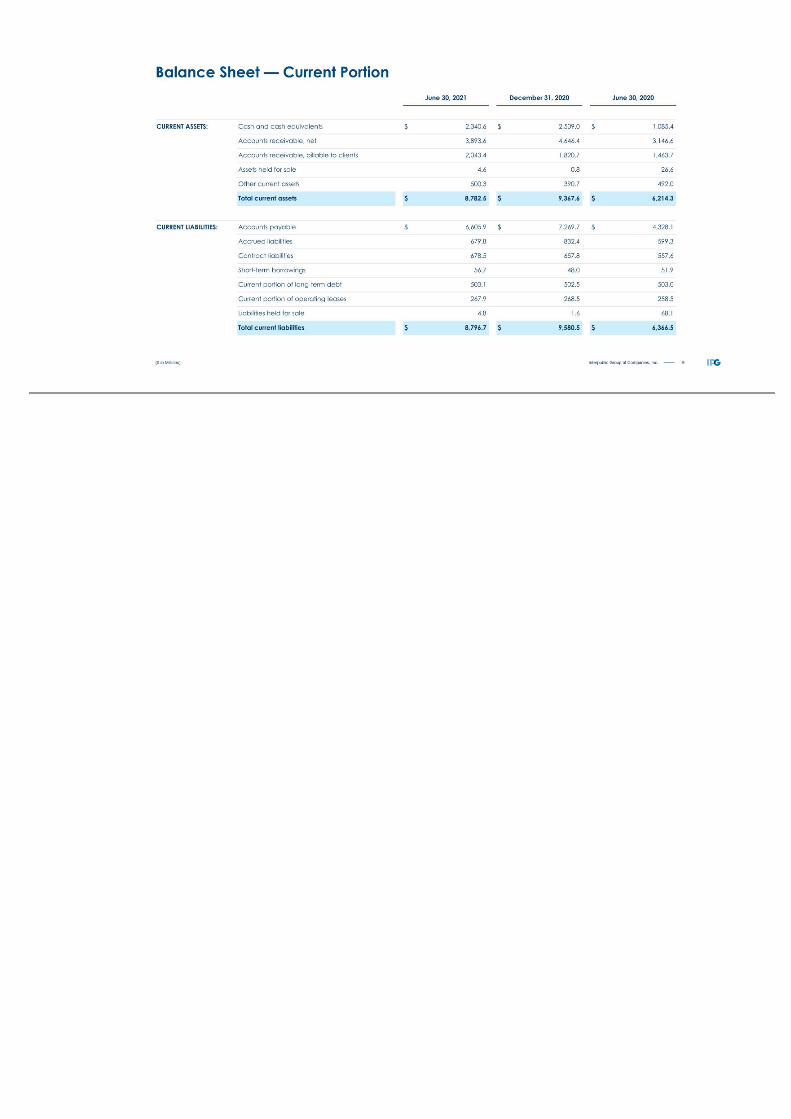
9Interpublic Group of Companies, Inc. June 30, 2021 December 31, 2020 June 30, 2020 CURRENT ASSETS: Cash and cash equivalents $ 2,340.6 $ 2,509.0 $ 1,085.4 Accounts receivable, net 3,893.6 4,646.4 3,146.6 Accounts receivable, billable to clients 2,043.4 1,820.7 1,463.7 Assets held for sale 4.6 0.8 26.6 Other current assets 500.3 390.7 492.0 Total current assets $ 8,782.5 $ 9,367.6 $ 6,214.3 CURRENT LIABILITIES: Accounts payable $ 6,605.9 $ 7,269.7 $ 4,328.1 Accrued liabilities 679.8 832.4 599.3 Contract liabilities 678.5 657.8 557.6 Short-term borrowings 56.7 48.0 51.9 Current portion of long-term debt 503.1 502.5 503.0 Current portion of operating leases 267.9 268.5 258.5 Liabilities held for sale 4.8 1.6 68.1 Total current liabilities $ 8,796.7 $ 9,580.5 $ 6,366.5 ($ in Millions) Balance Sheet — Current Portion
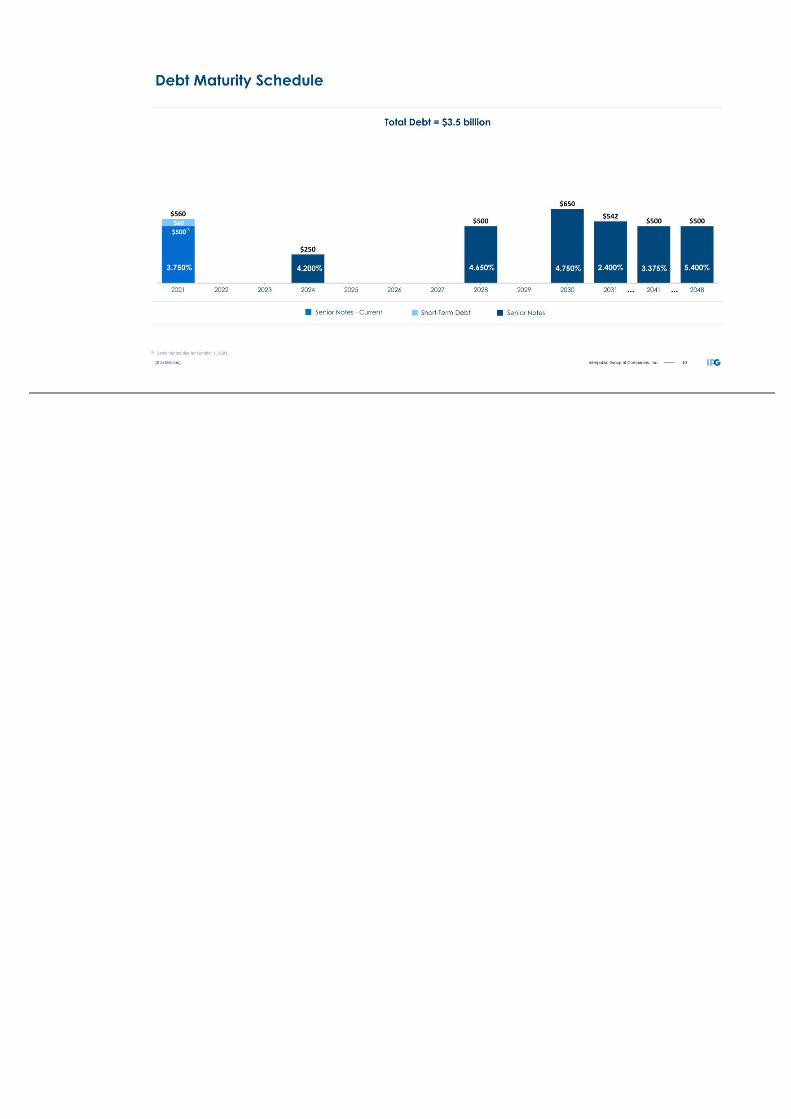
10Interpublic Group of Companies, Inc. Short-Term Debt Senior Notes - Current Senior Notes 3.750% 4.650% 5.400%2.400%4.200% Total Debt = $3.5 billion ($ in Millions) Debt Maturity Schedule 4.750% (1) Senior Notes due on October 1, 2021. 3.375% ... ... (1)
11Interpublic Group of Companies, Inc. Summary • Strong first-half of 2021 • Foundation for sustained growth and value creation ◦ Quality of our agency offerings and talent ◦ Data capabilities at scale ◦ Strong creative and innovative marketing & media solutions ◦ Integrated digital and digital specialists ◦ Evolving higher-value offerings ◦ "Open architecture" agency collaboration • Effective expense management is an ongoing priority • Financial strength a continued source of value creation

12Interpublic Group of Companies, Inc. Appendix
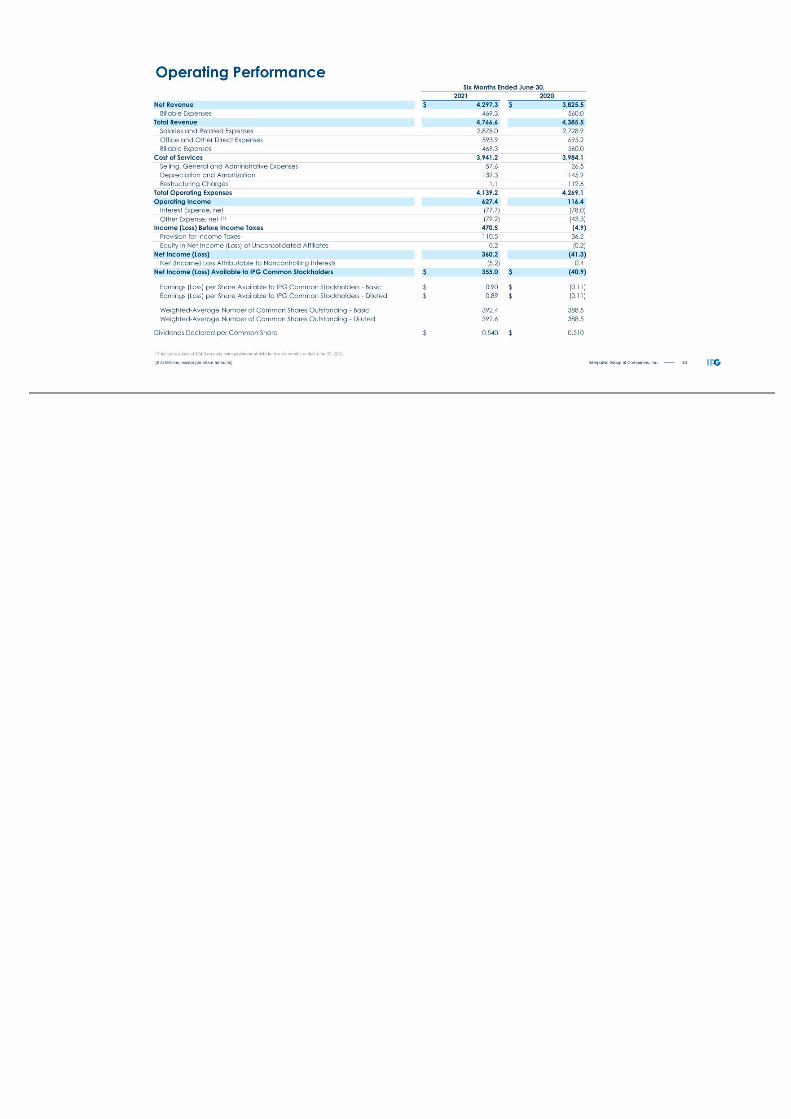
13Interpublic Group of Companies, Inc. Six Months Ended June 30, 2021 2020 Net Revenue $ 4,297.3 $ 3,825.5 Billable Expenses 469.3 560.0 Total Revenue 4,766.6 4,385.5 Salaries and Related Expenses 2,878.0 2,728.9 Office and Other Direct Expenses 593.9 695.2 Billable Expenses 469.3 560.0 Cost of Services 3,941.2 3,984.1 Selling, General and Administrative Expenses 57.6 26.5 Depreciation and Amortization 139.3 145.9 Restructuring Charges 1.1 112.6 Total Operating Expenses 4,139.2 4,269.1 Operating Income 627.4 116.4 Interest Expense, net (77.7) (78.0) Other Expense, net (1) (79.2) (43.3) Income (Loss) Before Income Taxes 470.5 (4.9) Provision for Income Taxes 110.5 36.2 Equity in Net Income (Loss) of Unconsolidated Affiliates 0.2 (0.2) Net Income (Loss) 360.2 (41.3) Net (Income) Loss Attributable to Noncontrolling Interests (5.2) 0.4 Net Income (Loss) Available to IPG Common Stockholders $ 355.0 $ (40.9) Earnings (Loss) per Share Available to IPG Common Stockholders - Basic $ 0.90 $ (0.11) Earnings (Loss) per Share Available to IPG Common Stockholders - Diluted $ 0.89 $ (0.11) Weighted-Average Number of Common Shares Outstanding - Basic 392.4 388.5 Weighted-Average Number of Common Shares Outstanding - Diluted 397.6 388.5 Dividends Declared per Common Share $ 0.540 $ 0.510 ($ in Millions, except per share amounts) Operating Performance (1) Includes a loss of $74.0 on early extinguishment of debt for the six months ended June 30, 2021.

14Interpublic Group of Companies, Inc. Organic Net Revenue Change by Region “All Other Markets” includes Canada, Africa and the Middle East. Circle proportions represent consolidated net revenue distribution. See reconciliation of organic net revenue change, including total net revenue change, on page 19. Six Months Ended June 30, 2021 +8.3% United States +10.6% United Kingdom +20.2% Continental Europe +24.4% Latin America +8.8% Asia Pacific +15.2% International +10.6% Worldwide +18.4% All Other Markets
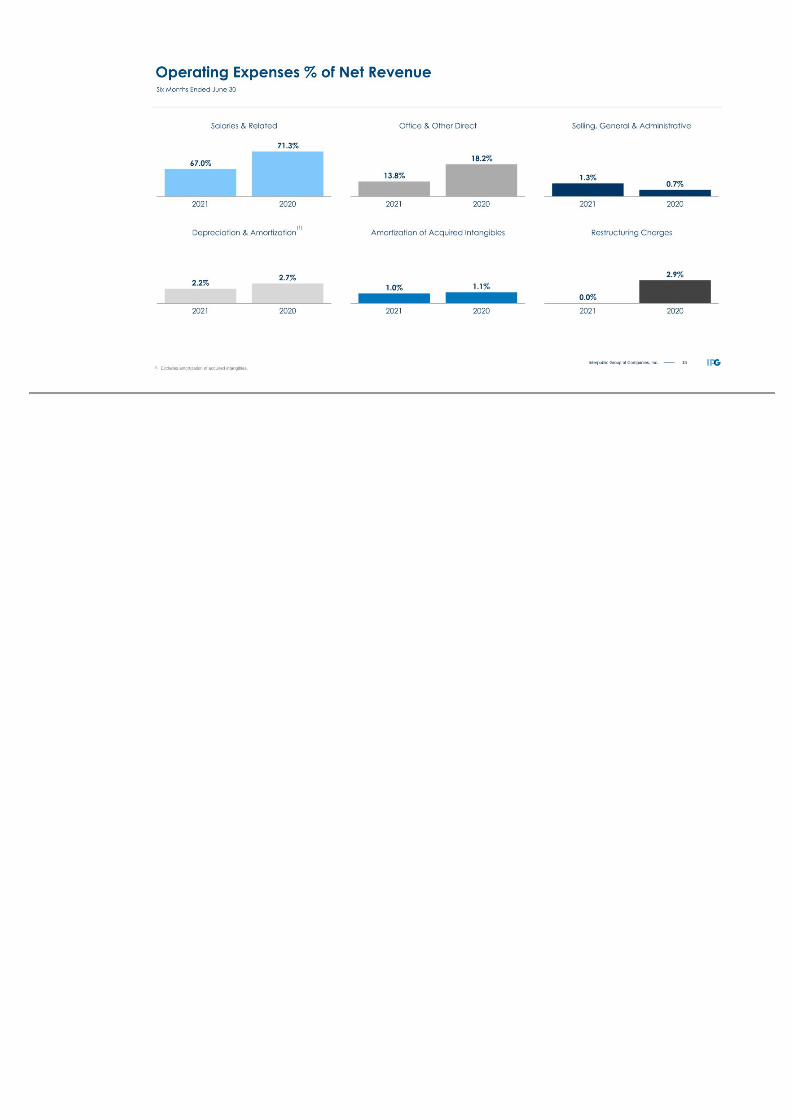
15Interpublic Group of Companies, Inc. Operating Expenses % of Net Revenue (1) Excludes amortization of acquired intangibles. . Six Months Ended June 30 (1)
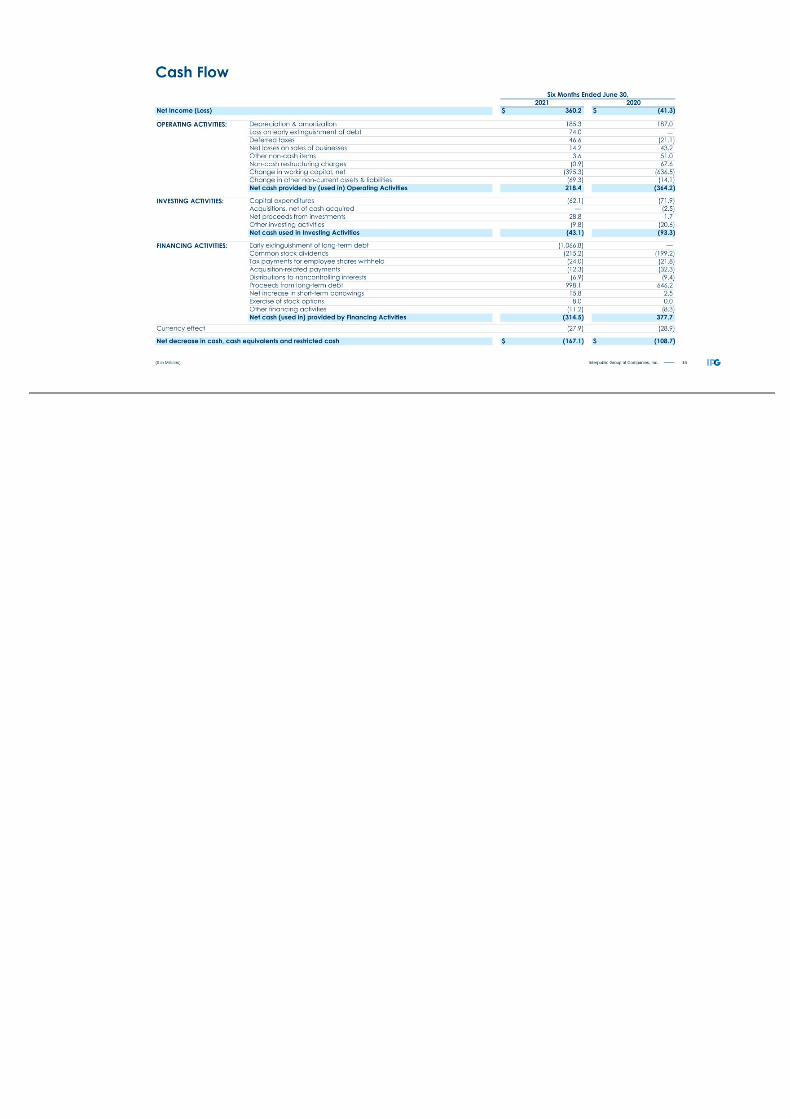
16Interpublic Group of Companies, Inc. Six Months Ended June 30, 2021 2020 Net Income (Loss) $ 360.2 $ (41.3) OPERATING ACTIVITIES: Depreciation & amortization 185.3 187.0 Loss on early extinguishment of debt 74.0 — Deferred taxes 46.6 (21.1) Net losses on sales of businesses 14.2 43.2 Other non-cash items 3.6 51.0 Non-cash restructuring charges (0.9) 67.6 Change in working capital, net (395.3) (636.5) Change in other non-current assets & liabilities (69.3) (14.1) Net cash provided by (used in) Operating Activities 218.4 (364.2) INVESTING ACTIVITIES: Capital expenditures (62.1) (71.9) Acquisitions, net of cash acquired — (2.5) Net proceeds from investments 28.8 1.7 Other investing activities (9.8) (20.6) Net cash used in Investing Activities (43.1) (93.3) FINANCING ACTIVITIES: Early extinguishment of long-term debt (1,066.8) — Common stock dividends (215.2) (199.2) Tax payments for employee shares withheld (24.0) (21.8) Acquisition-related payments (12.3) (32.3) Distributions to noncontrolling interests (6.9) (9.4) Proceeds from long-term debt 998.1 646.2 Net increase in short-term borrowings 15.8 2.5 Exercise of stock options 8.0 0.0 Other financing activities (11.2) (8.3) Net cash (used in) provided by Financing Activities (314.5) 377.7 Currency effect (27.9) (28.9) Net decrease in cash, cash equivalents and restricted cash $ (167.1) $ (108.7) ($ in Millions) Cash Flow
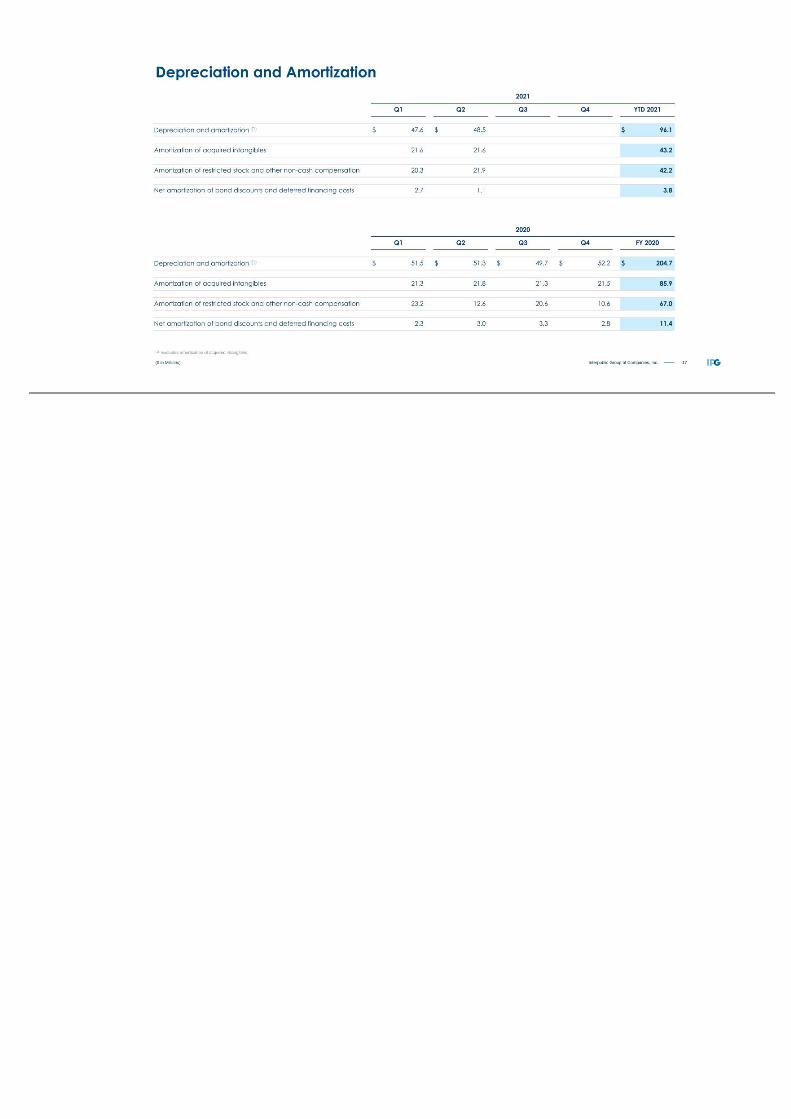
17Interpublic Group of Companies, Inc. 2021 Q1 Q2 Q3 Q4 YTD 2021 Depreciation and amortization (1) $ 47.6 $ 48.5 $ 96.1 Amortization of acquired intangibles 21.6 21.6 43.2 Amortization of restricted stock and other non-cash compensation 20.3 21.9 42.2 Net amortization of bond discounts and deferred financing costs 2.7 1.1 3.8 2020 Q1 Q2 Q3 Q4 FY 2020 Depreciation and amortization (1) $ 51.5 $ 51.3 $ 49.7 $ 52.2 $ 204.7 Amortization of acquired intangibles 21.3 21.8 21.3 21.5 85.9 Amortization of restricted stock and other non-cash compensation 23.2 12.6 20.6 10.6 67.0 Net amortization of bond discounts and deferred financing costs 2.3 3.0 3.3 2.8 11.4 ($ in Millions) (1) Excludes amortization of acquired intangibles. Depreciation and Amortization

18Interpublic Group of Companies, Inc. Components of Change Change Three Months Ended June 30, 2020 Foreign Currency Net Acquisitions/ (Divestitures) Organic Three Months Ended June 30, 2021 Organic Total SEGMENT: IAN $ 1,585.7 $ 48.6 $ (5.4) $ 325.6 $ 1,954.5 20.5% 23.3% DXTRA 267.7 9.5 (2.6) 40.5 315.1 15.1% 17.7% Total $ 1,853.4 $ 58.1 $ (8.0) $ 366.1 $ 2,269.6 19.8% 22.5% GEOGRAPHIC: United States $ 1,227.2 $ — $ (4.8) $ 213.1 $ 1,435.5 17.4% 17.0% International 626.2 58.1 (3.2) 153.0 834.1 24.4% 33.2% United Kingdom 147.2 19.9 — 27.5 194.6 18.7% 32.2% Continental Europe 149.7 14.5 (0.4) 41.7 205.5 27.9% 37.3% Asia Pacific 162.6 11.7 (4.6) 22.8 192.5 14.0% 18.4% Latin America 62.3 2.3 1.8 30.5 96.9 49.0% 55.5% All Other Markets 104.4 9.7 0.0 30.5 144.6 29.2% 38.5% Worldwide $ 1,853.4 $ 58.1 $ (8.0) $ 366.1 $ 2,269.6 19.8% 22.5% ($ in Millions) Reconciliation of Organic Net Revenue

19Interpublic Group of Companies, Inc. Components of Change Change Six Months Ended June 30, 2020 Foreign Currency Net Acquisitions/ (Divestitures) Organic Six Months Ended June 30, 2021 Organic Total SEGMENT: IAN $ 3,250.2 $ 71.4 $ (11.4) $ 378.4 $ 3,688.6 11.6% 13.5% DXTRA 575.3 16.0 (8.3) 25.7 608.7 4.5% 5.8% Total $ 3,825.5 $ 87.4 $ (19.7) $ 404.1 $ 4,297.3 10.6% 12.3% GEOGRAPHIC: United States $ 2,547.2 $ — $ (12.2) $ 210.3 $ 2,745.3 8.3% 7.8% International 1,278.3 87.4 (7.5) 193.8 1,552.0 15.2% 21.4% United Kingdom 312.9 31.5 0.9 33.3 378.6 10.6% 21.0% Continental Europe 295.7 27.7 (1.9) 59.8 381.3 20.2% 28.9% Asia Pacific 321.4 20.6 (8.6) 28.2 361.6 8.8% 12.5% Latin America 141.6 (5.9) 2.1 34.5 172.3 24.4% 21.7% All Other Markets 206.7 13.5 0.0 38.0 258.2 18.4% 24.9% Worldwide $ 3,825.5 $ 87.4 $ (19.7) $ 404.1 $ 4,297.3 10.6% 12.3% ($ in Millions) Reconciliation of Organic Net Revenue

20Interpublic Group of Companies, Inc. Three Months Ended June 30, 2021 As Reported Amortization of Acquired Intangibles Restructuring Charges (2) Net Losses on Sales of Businesses Adjusted Results (Non-GAAP) Operating Income and Adjusted EBITA before Restructuring Charges (3) $ 384.4 $ (21.6) $ 0.2 $ 405.8 Total (Expenses) and Other Income (4) (30.3) $ (1.7) (28.6) Income Before Income Taxes 354.1 (21.6) 0.2 (1.7) 377.2 Provision for Income Taxes 86.7 4.2 0.0 1.0 91.9 Equity in Net Income of Unconsolidated Affiliates 0.4 0.4 Net Income Attributable to Noncontrolling Interests (4.5) (4.5) Net Income Available to IPG Common Stockholders $ 263.3 $ (17.4) $ 0.2 $ (0.7) $ 281.2 Weighted-Average Number of Common Shares Outstanding - Basic 393.3 393.3 Dilutive effect of stock options and restricted shares 5.7 5.7 Weighted-Average Number of Common Shares Outstanding - Diluted 399.0 399.0 Earnings per Share Available to IPG Common Stockholders (5): Basic $ 0.67 $ (0.04) $ 0.00 $ (0.00) $ 0.71 Diluted $ 0.66 $ (0.04) $ 0.00 $ (0.00) $ 0.70 ($ in Millions, except per share amounts) (1) The table reconciles our reported results to our adjusted non-GAAP results. Management believes the resulting comparisons provide useful supplemental data that, while not a substitute for GAAP measures, allow for greater transparency in the review of our financial and operational performance. (2) Restructuring charges of ($0.2) in the second quarter of 2021 were related to adjustments to our restructuring actions taken in 2020, which were designed to reduce our operating expenses structurally and permanently relative to revenue and to accelerate the transformation of our business. (3) Refer to non-GAAP reconciliation of Adjusted EBITA before Restructuring Charges on page 22. (4) Consists of non-operating expenses including interest expense, net and other expense, net. (5) Earnings per share may not add due to rounding. Reconciliation of Adjusted Results (1)

21Interpublic Group of Companies, Inc. Six Months Ended June 30, 2021 As Reported Amortization of Acquired Intangibles Restructuring Charges (2) Net Losses on Sales of Businesses Loss on Early Extinguishment of Debt (3) Adjusted Results (Non-GAAP) Operating Income and Adjusted EBITA before Restructuring Charges $ 627.4 $ (43.2) $ (1.1) $ 671.7 Total (Expenses) and Other Income (5) (156.9) $ (14.2) $ (74.0) (68.7) Income Before Income Taxes 470.5 (43.2) (1.1) (14.2) (74.0) 603.0 Provision for Income Taxes 110.5 8.4 0.3 1.7 18.5 139.4 Equity in Net Income of Unconsolidated Affiliates 0.2 0.2 Net Income Attributable to Noncontrolling Interests (5.2) (5.2) Net Income Available to IPG Common Stockholders $ 355.0 $ (34.8) $ (0.8) $ (12.5) $ (55.5) $ 458.6 Weighted-Average Number of Common Shares Outstanding - Basic 392.4 392.4 Dilutive effect of stock options and restricted shares 5.2 5.2 Weighted-Average Number of Common Shares Outstanding - Diluted 397.6 397.6 Earnings per Share Available to IPG Common Stockholders (6): Basic $ 0.90 $ (0.09) $ (0.00) $ (0.03) $ (0.14) $ 1.17 Diluted $ 0.89 $ (0.09) $ (0.00) $ (0.03) $ (0.14) $ 1.15 ($ in Millions, except per share amounts) Reconciliation of Adjusted Results (1) (1) The table reconciles our reported results to our adjusted non-GAAP results. Management believes the resulting comparisons provide useful supplemental data that, while not a substitute for GAAP measures, allow for greater transparency in the review of our financial and operational performance. (2) Restructuring charges of $1.1 in the first half of 2021 were related to adjustments to our restructuring actions taken in 2020, which were designed to reduce our operating expenses structurally and permanently relative to revenue and to accelerate the transformation of our business. (3) Consists of a loss related to the early extinguishment of our 4.000% unsecured senior notes due 2022, 3.750% unsecured senior notes due 2023 and half of our 4.200% unsecured senior notes due 2024. (4) Refer to non-GAAP reconciliation of Adjusted EBITA before Restructuring Charges on slide 22. (5) Consists of non-operating expenses including interest ex
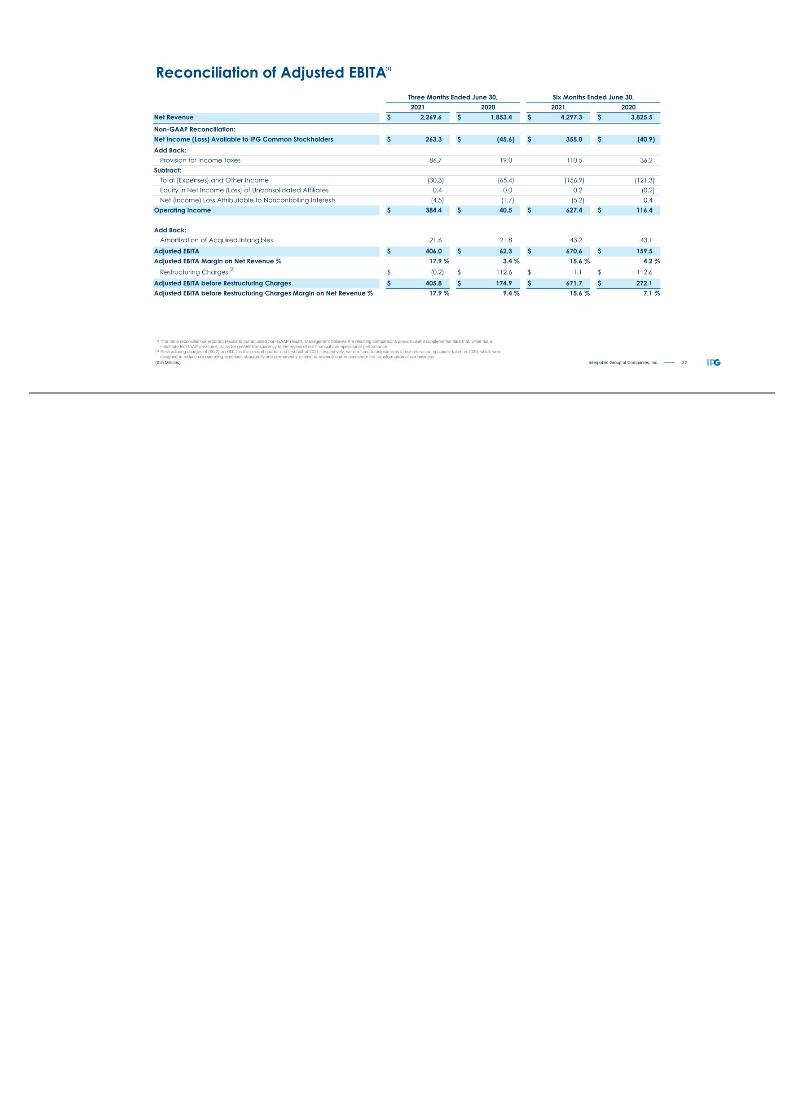
22Interpublic Group of Companies, Inc. Reconciliation of Adjusted EBITA Three Months Ended June 30, Six Months Ended June 30, 2021 2020 2021 2020 Net Revenue $ 2,269.6 $ 1,853.4 $ 4,297.3 $ 3,825.5 Non-GAAP Reconciliation: Net Income (Loss) Available to IPG Common Stockholders $ 263.3 $ (45.6) $ 355.0 $ (40.9) Add Back: Provision for Income Taxes 86.7 19.0 110.5 36.2 Subtract: Total (Expenses) and Other Income (30.3) (65.4) (156.9) (121.3) Equity in Net Income (Loss) of Unconsolidated Affiliates 0.4 0.0 0.2 (0.2) Net (Income) Loss Attributable to Noncontrolling Interests (4.5) (1.7) (5.2) 0.4 Operating Income $ 384.4 $ 40.5 $ 627.4 $ 116.4 Add Back: Amortization of Acquired Intangibles 21.6 21.8 43.2 43.1 Adjusted EBITA $ 406.0 $ 62.3 $ 670.6 $ 159.5 Adjusted EBITA Margin on Net Revenue % 17.9 % 3.4 % 15.6 % 4.2 % Restructuring Charges $ (0.2) $ 112.6 $ 1.1 $ 112.6 Adjusted EBITA before Restructuring Charges $ 405.8 $ 174.9 $ 671.7 $ 272.1 Adjusted EBITA before Restructuring Charges Margin on Net Revenue % 17.9 % 9.4 % 15.6 % 7.1 % (1) ($ in Millions) (1) The table reconciles our reported results to our adjusted non-GAAP results. Management believes the resulting comparisons provide useful supplemental data that, while not a substitute for GAAP measures, allow for greater transparency in the review of our financial and operational performance. (2) Restructuring charges of ($0.2) and $1.1 in the second quarter and first half of 2021, respectively, were related to adjustments to our restructuring actions taken in 2020, which were designed to reduce our operating expenses structurally and permanently relative to revenue and to accelerate the transformation of our business. (2)
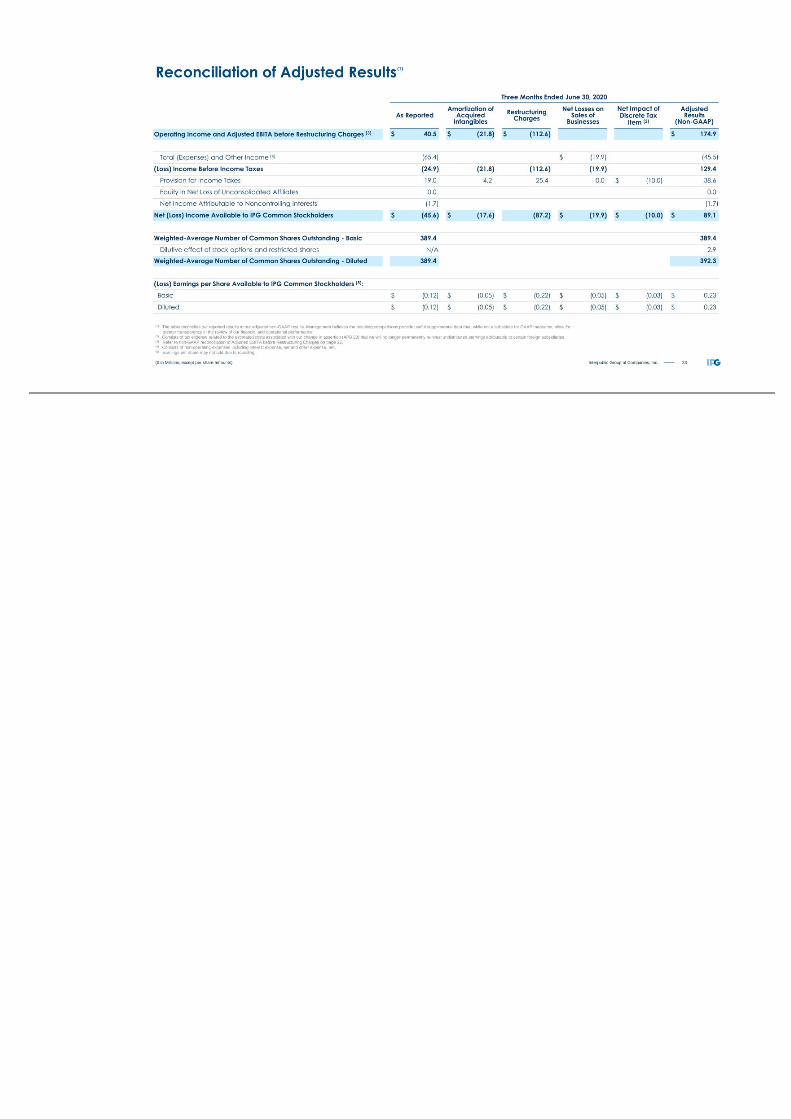
23Interpublic Group of Companies, Inc. Three Months Ended June 30, 2020 As Reported Amortization of Acquired Intangibles Restructuring Charges Net Losses on Sales of Businesses Net Impact of Discrete Tax Item (2) Adjusted Results (Non-GAAP) Operating Income and Adjusted EBITA before Restructuring Charges (3) $ 40.5 $ (21.8) $ (112.6) $ 174.9 Total (Expenses) and Other Income (4) (65.4) $ (19.9) (45.5) (Loss) Income Before Income Taxes (24.9) (21.8) (112.6) (19.9) 129.4 Provision for Income Taxes 19.0 4.2 25.4 0.0 $ (10.0) 38.6 Equity in Net Loss of Unconsolidated Affiliates 0.0 0.0 Net Income Attributable to Noncontrolling Interests (1.7) (1.7) Net (Loss) Income Available to IPG Common Stockholders $ (45.6) $ (17.6) (87.2) $ (19.9) $ (10.0) $ 89.1 Weighted-Average Number of Common Shares Outstanding - Basic 389.4 389.4 Dilutive effect of stock options and restricted shares N/A 2.9 Weighted-Average Number of Common Shares Outstanding - Diluted 389.4 392.3 (Loss) Earnings per Share Available to IPG Common Stockholders (5): Basic $ (0.12) $ (0.05) $ (0.22) $ (0.05) $ (0.03) $ 0.23 Diluted $ (0.12) $ (0.05) $ (0.22) $ (0.05) $ (0.03) $ 0.23 ($ in Millions, except per share amounts) (1) The table reconciles our reported results to our adjusted non-GAAP results. Management believes the resulting comparisons provide useful supplemental data that, while not a substitute for GAAP measures, allow for greater transparency in the review of our financial and operational performance. (2) Consists of tax expense related to the estimated costs associated with our change in assertion (APB 23) that we will no longer permanently reinvest undistributed earnings attributable to certain foreign subsidiaries. (3) Refer to non-GAAP reconciliation of Adjusted EBITA before Restructuring Charges on page 22. (4) Consists of non-operating expenses including interest expense, net and other expense, net. (5) Earnings per share may not add due to rounding. Reconciliation of Adjusted Results (1)

24Interpublic Group of Companies, Inc. Six Months Ended June 30, 2020 As Reported Amortization of Acquired Intangibles Restructuring Charges Net Losses on Sales of Businesses Net Impact of Discrete Tax Item (2) Adjusted Results (Non-GAAP) Operating Income and Adjusted EBITA before Restructuring Charges (3) $ 116.4 $ (43.1) $ (112.6) $ 272.1 Total (Expenses) and Other Income (4) (121.3) $ (43.2) (78.1) (Loss) Income Before Income Taxes (4.9) (43.1) (112.6) (43.2) 194.0 Provision for Income Taxes 36.2 8.4 25.4 0.9 $ (10.0) 60.9 Equity in Net Loss of Unconsolidated Affiliates (0.2) (0.2) Net Loss Attributable to Noncontrolling Interests 0.4 0.4 Net (Loss) Income Available to IPG Common Stockholders $ (40.9) $ (34.7) $ (87.2) $ (42.3) $ (10.0) $ 133.3 Weighted-Average Number of Common Shares Outstanding - Basic 388.5 388.5 Dilutive effect of stock options and restricted shares N/A 3.3 Weighted-Average Number of Common Shares Outstanding - Diluted 388.5 391.8 (Loss) Earnings per Share Available to IPG Common Stockholders (5): Basic $ (0.11) $ (0.09) $ (0.22) $ (0.11) $ (0.03) $ 0.34 Diluted $ (0.11) $ (0.09) $ (0.22) $ (0.11) $ (0.03) $ 0.34 ($ in Millions, except per share amounts) (1) The table reconciles our reported results to our adjusted non-GAAP results. Management believes the resulting comparisons provide useful supplemental data that, while not a substitute for GAAP measures, allow for greater transparency in the review of our financial and operational performance. (2) Consists of tax expense related to the estimated costs associated with our change in assertion (APB 23) that we will no longer permanently reinvest undistributed earnings attributable to certain foreign subsidiaries. (3) Refer to non-GAAP reconciliation of Adjusted EBITA before Restructuring Charges on slide 22. (4) Consists of non-operating expenses including interest expense, net and other expense, net. (5) Earnings per share may not add due to rounding. Reconciliation of Adjusted Results (1)

25Interpublic Group of Companies, Inc. Metrics Update

26Interpublic Group of Companies, Inc. Metrics Update CATEGORY: SALARIES & RELATED OFFICE & OTHER DIRECT FINANCIAL (% of net revenue) (% of net revenue) METRIC: Trailing Twelve Months Trailing Twelve Months Available Liquidity Base, Benefits & Tax Occupancy Expense Credit Facility Covenant Incentive Expense All Other Office and Other Direct Expenses Severance Expense Temporary Help

27Interpublic Group of Companies, Inc. Salaries & Related Expenses % of Net Revenue, Trailing Twelve Months
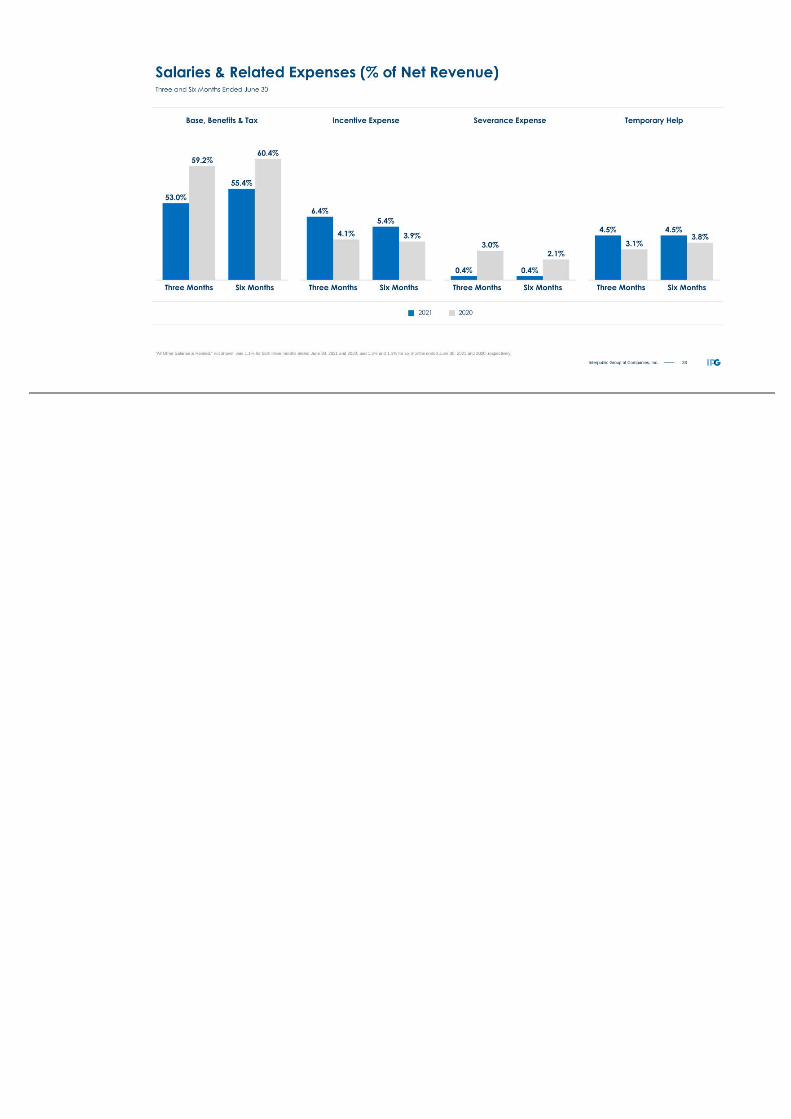
28Interpublic Group of Companies, Inc. Salaries & Related Expenses (% of Net Revenue) “All Other Salaries & Related,” not shown, was 1.1% for both three months ended June 30, 2021 and 2020, and 1.3% and 1.1% for six months ended June 30, 2021 and 2020, respectively. Three and Six Months Ended June 30 2021 2020
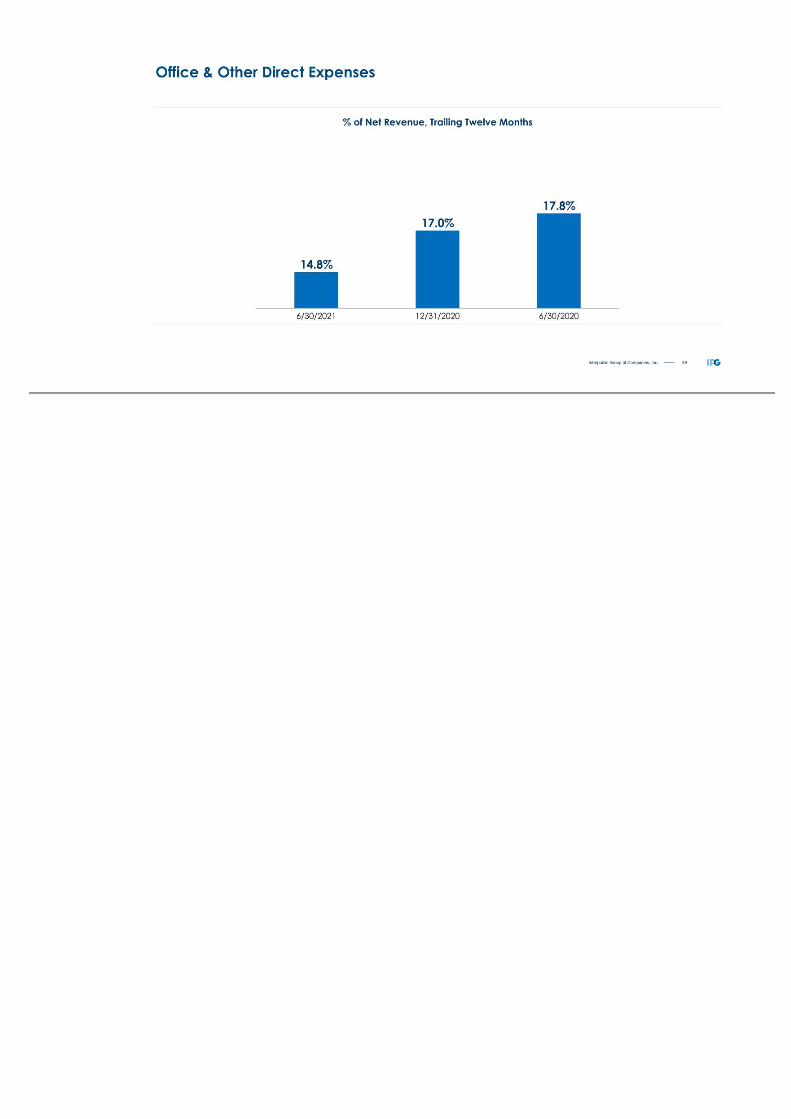
29Interpublic Group of Companies, Inc. Office & Other Direct Expenses % of Net Revenue, Trailing Twelve Months
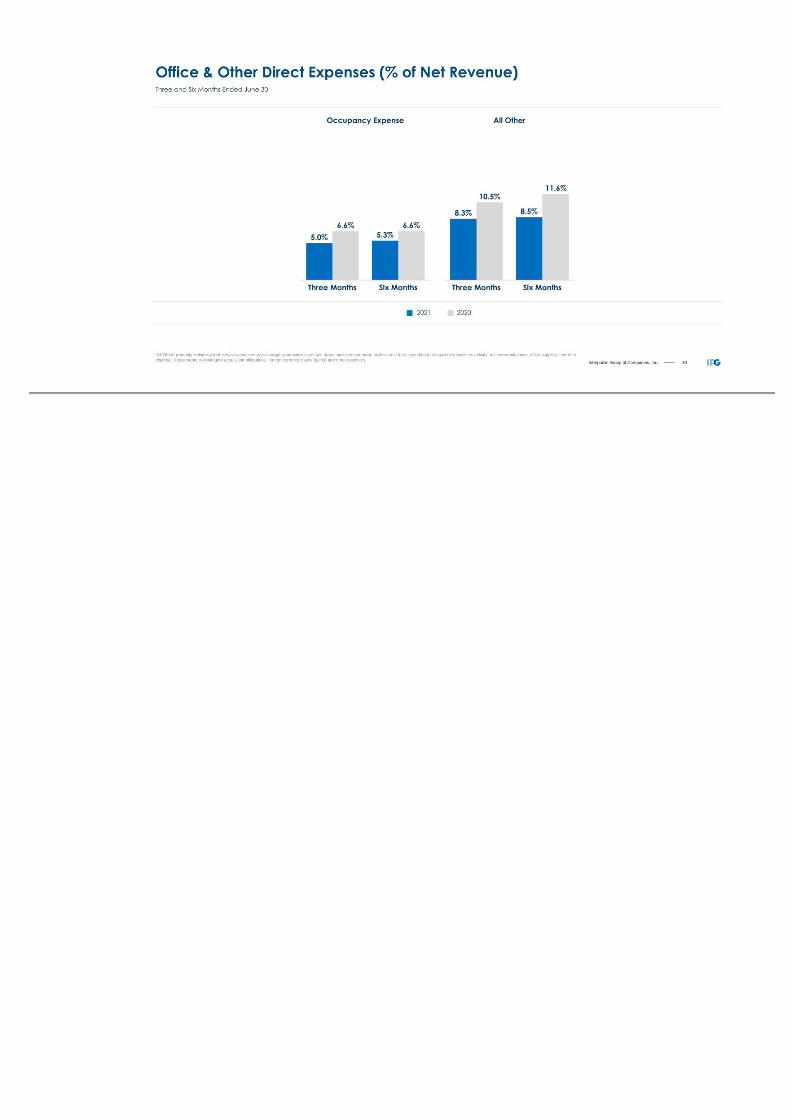
30Interpublic Group of Companies, Inc. Office & Other Direct Expenses (% of Net Revenue) “All Other” primarily includes client service costs, non-pass through production expenses, travel and entertainment, professional fees, spending to support new business activity, telecommunications, office supplies, bad debt expense, adjustments to contingent acquisition obligations, foreign currency losses (gains) and other expenses. Three and Six Months Ended June 30 2021 2020
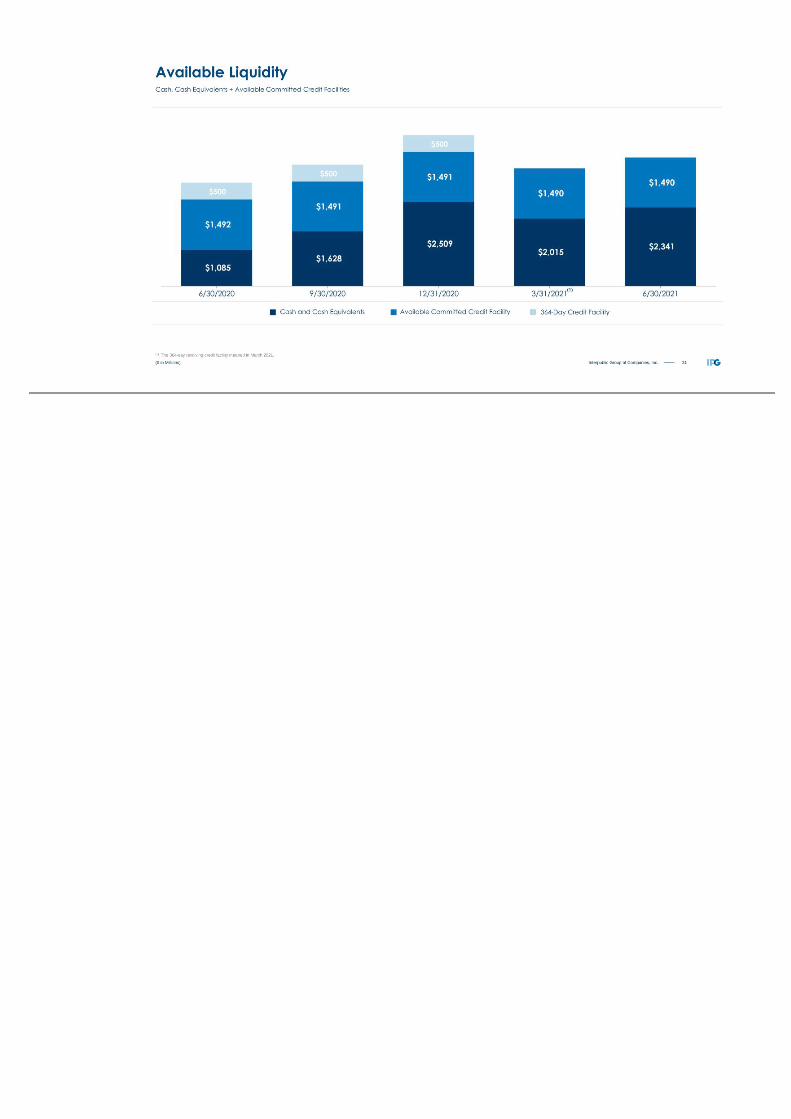
31Interpublic Group of Companies, Inc. ($ in Millions) Available Liquidity Cash, Cash Equivalents + Available Committed Credit Facilities Available Committed Credit FacilityCash and Cash Equivalents 364-Day Credit Facility (1) The 364-day revolving credit facility matured in March 2021. (1) (1)

32Interpublic Group of Companies, Inc. Financial Covenant Four Quarters Ended June 30, 2021 Leverage Ratio (not greater than) (2) (3) 4.25x Actual Leverage Ratio 2.10x CREDIT AGREEMENT EBITDA RECONCILIATION: Four Quarters Ended June 30, 2021 Net Income Available to IPG Common Stockholders $ 747.0 + Non-Operating Adjustments (4) 352.4 Operating Income $ 1,099.4 + Depreciation and Amortization 399.5 + Other Non-cash Charges Reducing Operating Income 154.9 Credit Agreement EBITDA (2): $ 1,653.8 ($ in Millions) Credit Facility Covenant (1) (1) The leverage ratio financial covenant applies to our committed corporate credit facility, amended and restated as of November 1, 2019 ( the "Credit Agreement"). (2) The leverage ratio is defined as debt as of the last day of such fiscal quarter to EBITDA (as defined in the Credit Agreement) for the four quarters then ended. (3) On July 28, 2020, we entered into Amendment No. 1 to the Credit Agreement. The Amendment increased the maximum leverage ratio covenant to (i) 4.25x through the quarter ended June 30, 2021, and (ii) 3.50x thereafter. (4) Includes adjustments of the following items from our consolidated statement of operations: (benefit of) provision for income taxes, total (expenses) and other income, equity in net (loss) income of unconsolidated affiliates, and net loss (income) attributable to noncontrolling interests.

33Interpublic Group of Companies, Inc. This investor presentation contains forward-looking statements. Statements in this investor presentation that are not historical facts, including statements about management’s beliefs and expectations, constitute forward-looking statements. These statements are based on current plans, estimates and projections, and are subject to change based on a number of factors, including those outlined under item 1A, Risk Factors, in our most recent Annual Report on Form 10-K and our quarterly reports on Form 10-Q and our other filings with the Securities and Exchange Commission ("SEC"). Forward-looking statements speak only as of the date they are made, and we undertake no obligation to update publicly any of them in light of new information or future events. Forward-looking statements involve inherent risks and uncertainties. A number of important factors could cause actual results to differ materially from those contained in any forward-looking statement. Such factors include, but are not limited to, the following: ▪ the effects of a challenging economy on the demand for our advertising and marketing services, on our clients’ financial condition and on our business or financial condition; ▪ the impacts of the novel coronavirus (COVID-19) pandemic and, the measures to contain its spread, including social distancing efforts and restrictions on businesses, social activities and travel, any failure to realize anticipated benefits from the rollout of COVID-19 vaccination campaigns and the resulting impact on the economy, our clients and demand for our services, which may precipitate or exacerbate other risks and uncertainties; ▪ our ability to attract new clients and retain existing clients; ▪ our ability to retain and attract key employees; ▪ risks associated with assumptions we make in connection with our critical accounting estimates, including changes in assumptions associated with any effects of a weakened economy; ▪ potential adverse effects if we are required to recognize impairment charges or other adverse accounting-related developments; ▪ risks associated with the effects of global, national and regional economic and political conditions, including counterparty risks and fluctuations in economic growth rates, interest rates and currency exchange rates; ▪ developments from chafailure to fully realize the anticipated benefits of our 2020 restructuring actions and other cost-saving initiatives. Investors should carefully consider these factors and the additional risk factors outlined in more detail under Item 1A, Risk Factors, in our most recent Annual Report on Form 10-K and our quarterly reports on Form 10-Q and our other SEC filings. Cautionary Statement

Related Documents