Interpreting the data: Parallel analysis with Sawzall LIN Wenbin 25 Mar 2014

Interpreting the data: Parallel analysis with Sawzall LIN Wenbin 25 Mar 2014.
Dec 27, 2015
Welcome message from author
This document is posted to help you gain knowledge. Please leave a comment to let me know what you think about it! Share it to your friends and learn new things together.
Transcript

Interpreting the data: Parallel analysis with
SawzallLIN Wenbin
25 Mar 2014

OUTLINE
• Introduction•Motivation• System model• Language•Performance• Future work & Conclusion
OUTLINE
• Introduction•Motivation• System model• Language•Performance• Future work & Conclusion

• Many data sets are too large, too dynamic• Files distributed across many disks on many computers
• An analysis may consume months of CPU time• With a thousand machines that will only take a few hours of real time
• Break our calculations into two phases• Evaluates the analysis on each record individually• Aggregates the results
Introduction

Introduction
• GFS and MapReduce• Fault tolerance and reliability and provide a powerful framework upon
which to implement a large, parallel system for distributed analysis
• Sawzall• Expressing the analysis cleanly and executing it quickly

OUTLINE
• Introduction•Motivation• System model• Language•Performance• Future work & Conclusion

Motivation
• Google's server logs • Stored as large collections of records (protocol buffers) • Partitioned over many disks within Google File System (GFS)• Perform calculations•Write MapReduce programs

Motivation
• Parallelism• Separating out the aggregators• Providing a restricted model for distributed processing (one record at a time)
• Clearer, more compact, more expressive• Support domain-special types at a lower level• Easier to write quick scripts
OUTLINE
• Introduction•Motivation• System model• Language•Performance• Future work & Conclusion

System model
• Sawzall language written in C++• The compiler and byte-code interpreter are part of the same binary• Aggregators are implemented by saw• Implemented above MapReduce, running Sawzall in the map phase
and the aggregators in the reduce phase• MapReduce manages the distribution of execution and aggregation
machines, locates the computation, and handles machine failure and other faults
System model
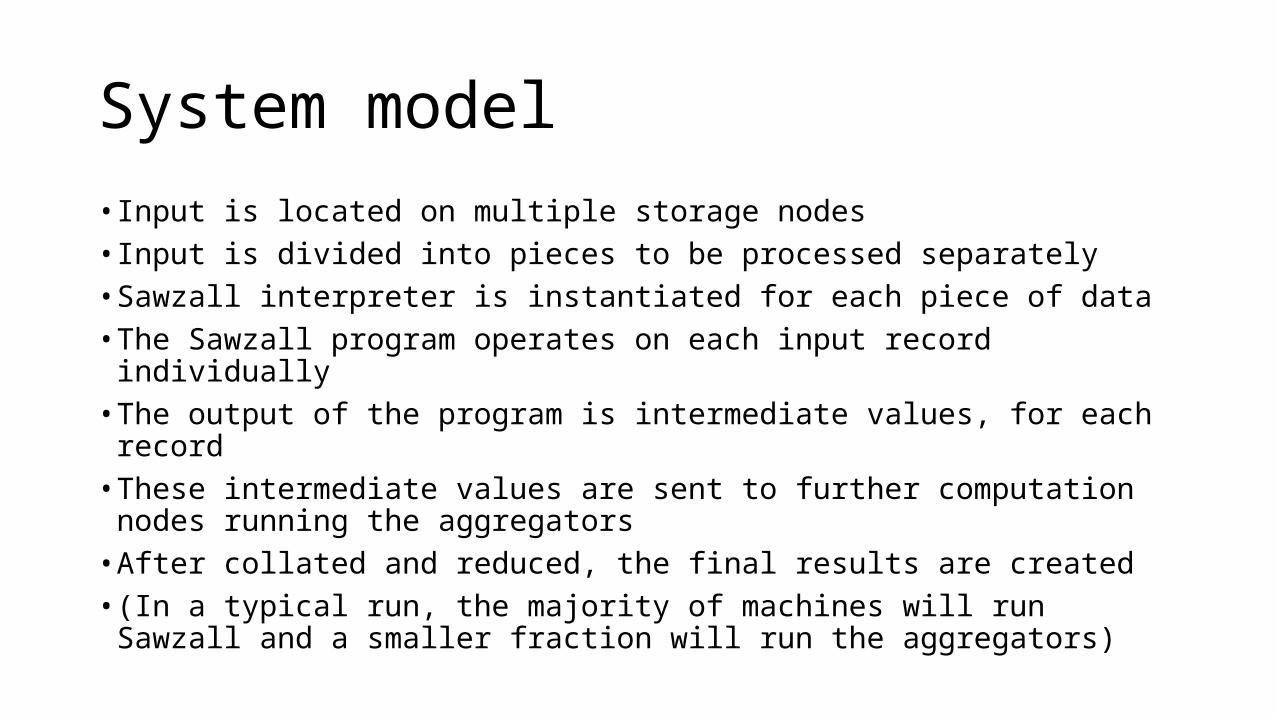
• Input is located on multiple storage nodes• Input is divided into pieces to be processed separately• Sawzall interpreter is instantiated for each piece of data• The Sawzall program operates on each input record individually• The output of the program is intermediate values, for each record• These intermediate values are sent to further computation nodes
running the aggregators• After collated and reduced, the final results are created• (In a typical run, the majority of machines will run Sawzall and a smaller
fraction will run the aggregators)

System model
• saw command• program Sawzall source file• Input_files standard Unix shell file-name-matching metacharacters• destination names of the output files• @ the number of files (the number of aggregation
machines)

OUTLINE
• Introduction•Motivation• System model• Language•Performance• Future work & Conclusion

Language
• Example 1• Overview• Aggregators• Indexed aggregators• Example 2• Quantifiers• Example 3

Example 1• Return the number of records, the sum of the values, and
the sum of the squares of the values

Overview• Basic types• int signed 64-bit quantity• float 64-bit IEEE floating-point value• bool Boolean value• time unsigned 64-bit quantity recording microseconds
• Array-like types• bytes string of 8-bit unsigned bytes• strings string of 16-bit Unicode characters.
• Compound types• arrays an (unspecified) number of components, all of the same type• maps key-value pairs• tuples a fixed number of members of possibly different types

Overview• Declarations
• Statements
• emit (send intermediate values to the aggregators)

Overview• proto (imports the DDL for a protocol buffer from a file)
• static (avoid initialization for every record)

Aggregators
• Collection (A list of all the duplicates emitted values in arbitrary order)
• Sum (Summation of all the emitted arithmetic values)
• Maximum (The highest-weighted values)
• Top (The most popular values)

Indexed aggregators
• An aggregator can be indexed• Create a distinct individual aggregator for each unique value
• Find the 1000 most popular request for each country, for each hour

Example 2• Show how the queries are distributed around the globe

• Query distribution
Example 2

Quantifiers
• when statement, defines a quantifier, a variable, a Boolean condition.
• Three quantifier types• some if the condition is true for any value (arbitrary choice for
more than one values)• each for all the values that satisfy the condition• all if the condition is true for all valid values

Example 3• Count the occurrences of certain words, for each day

OUTLINE
• Introduction•Motivation• System model• Language•Performance• Future work & Conclusion
Performance
• Test the single-CPU speed of Sawzall interpreter• Compare with that of other interpreted languages
• Test how the speed scales• Run program using different numbers of machines

Test the single-CPU speed of Sawzall interpreter• Computes pixel values for displaying the Mandelbrot set• Measure basic arithmetic and loop performance
• Recursive function to calculate the first 35 Fibonacci numbers• Measures function invocation
• 2.8 GHz x86 desktop machine

• 1.6 times slower than interpreted Java• 21 times slower than compiled Java• 51 times slower than compiled C++
Test the single-CPU speed of Sawzall interpreter

• 450 GB sample of compressed query log data• count the occurrences of certain words
• 50 – 600 2.4 GHz Xeon computers
Test how the speed scales

• Sawzall program
Test how the speed scales

• The solid line is elapsed time• The dashed line is the product of machines and elapsed time• The machine-minutes product degrades only 30%

OUTLINE
• Introduction•Motivation• System model• Language•Performance• Future work & Conclusion

Future work
• Aggressive compilation• More complex analyses• Run once per machine, apply the accelerated binary to each input record
• Interface to query an external database• Suspend processing of one record
• Language extensions• Multiple passes over the data
• Join operations• Join data from multiple input sources

Conclusion• New interpreted programming language called Sawzall• Programming model (one record at a time)• Interface to a novel set of aggregators
•Write short, clear programs that are guaranteed to work well on thousands of machines in parallel• Know nothing about parallel programming

THANK YOU
Related Documents