Interpreting and Using Existing Data to Identify Pollution Causes and Sources

Interpreting and Using Existing Data to Identify Pollution Causes and Sources.
Dec 19, 2015
Welcome message from author
This document is posted to help you gain knowledge. Please leave a comment to let me know what you think about it! Share it to your friends and learn new things together.
Transcript

Interpreting and Using Existing Data to Identify
Pollution Causes and Sources

Confirm impairments and identify pollutants
Compare available monitoring data to wqs:• Document magnitude of impairment• Document seasonal/temporal patterns• Document spatial distribution

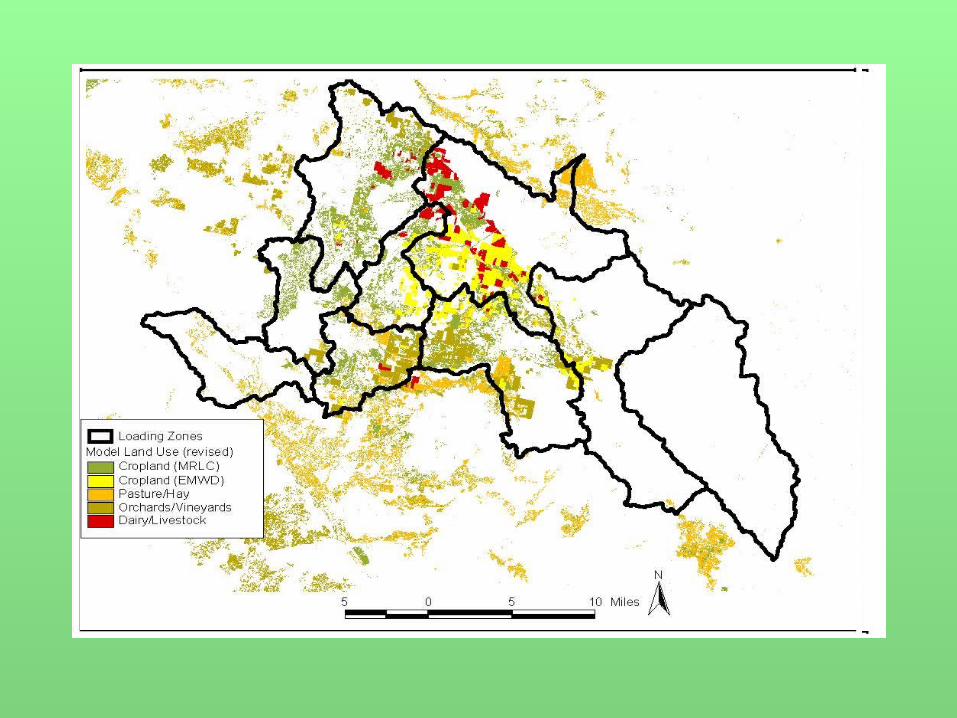
Spatial Analysis
• Isolate critical subwatersheds• Combine with land use/land cover data

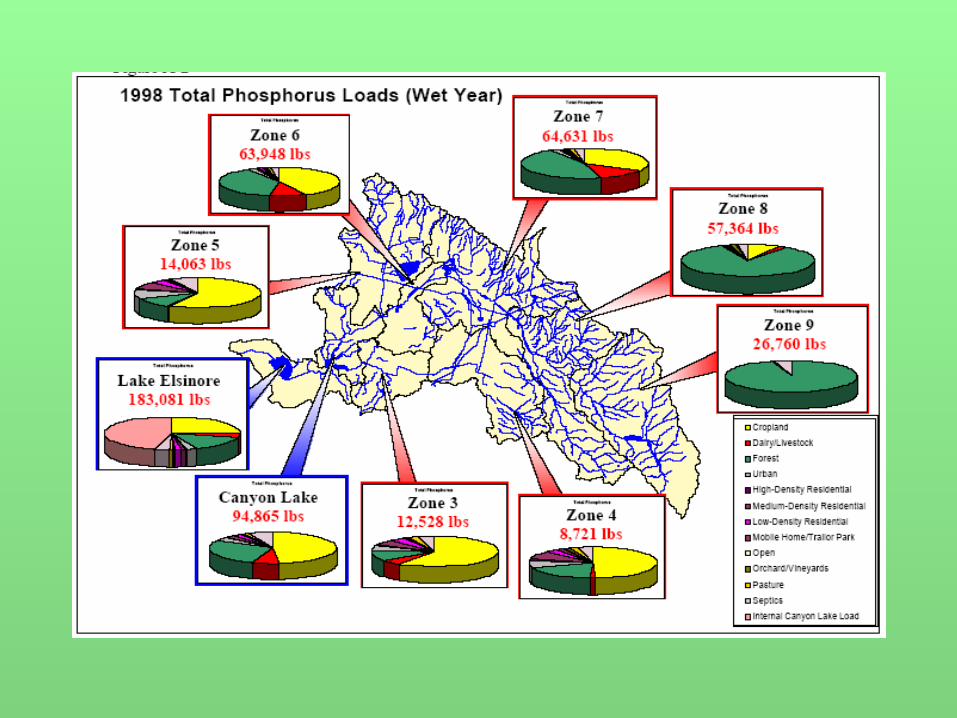

Flow Relationships
• Point vs. Nonpoint
Flow Relationships
• Point vs. Nonpoint


Temporal Analysis
• Seasonality• Stratify data by potential source activities
– Tillage– Crop canopy development– Manure/fertilizer applications– Grazing season– Logging– Construction projects– Street cleaning
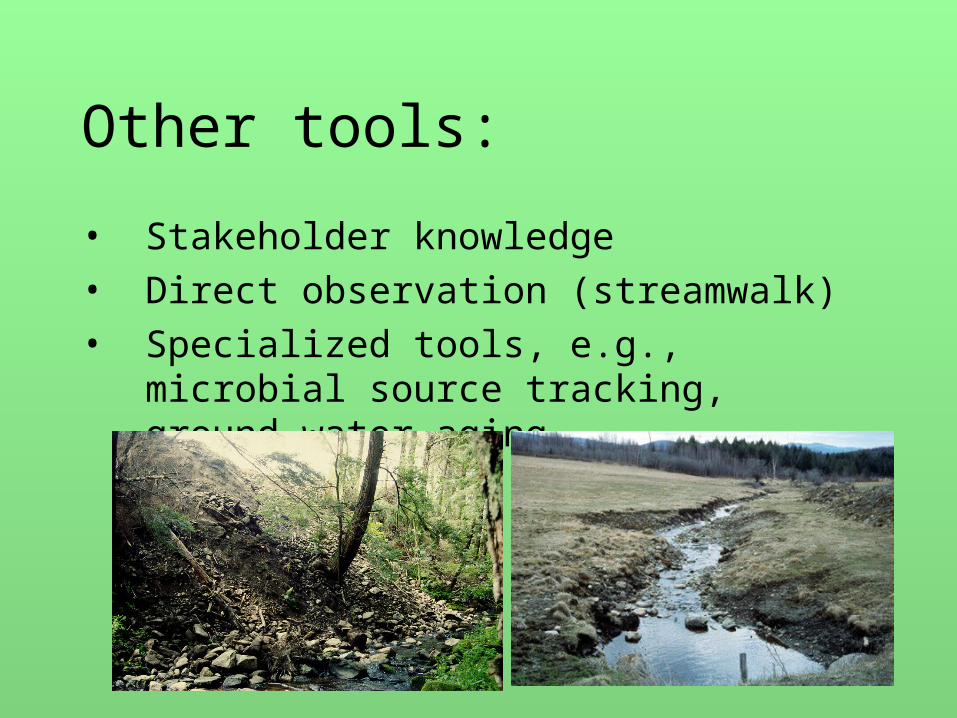
Other tools:
• Stakeholder knowledge• Direct observation (streamwalk)• Specialized tools, e.g., microbial source
tracking, ground water aging
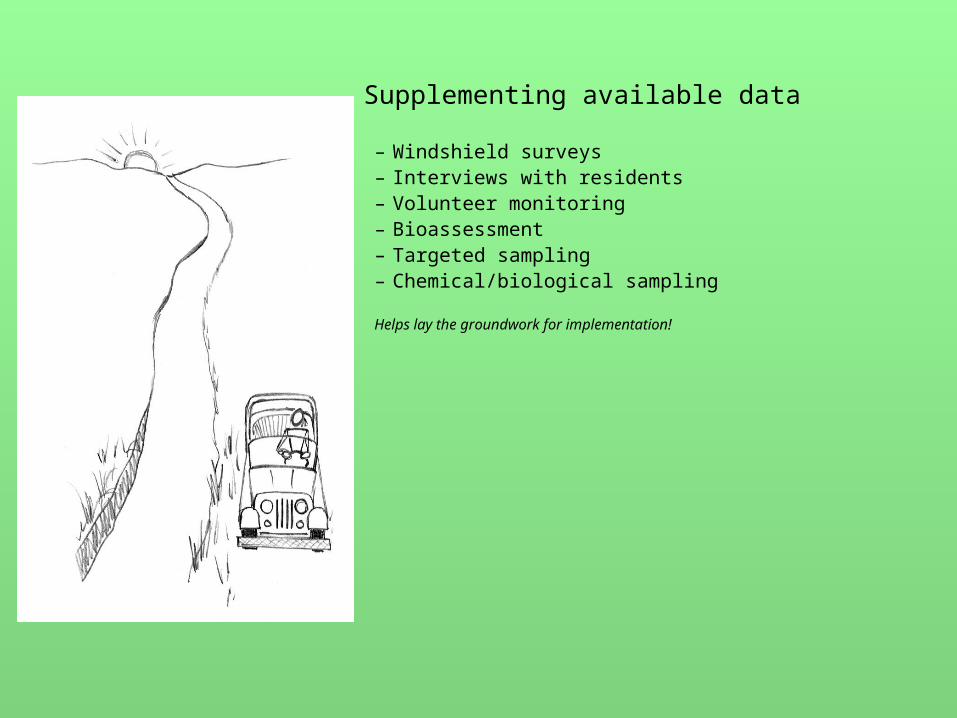
Supplementing available data
– Windshield surveys– Interviews with residents– Volunteer monitoring– Bioassessment– Targeted sampling– Chemical/biological sampling
Helps lay the groundwork for implementation!

Examples

St. Albans Bay VT RCWP
• Known WQ impairment due to eutrophication– Obvious algae blooms & macrophyte growth– Declining State Park visits, beach closures– State DEC P monitoring
• Excessive P loads to Bay• 75% point source/25% nps
• NRCS knowledge about current status of animal waste management, milkhouse waste, cropland erosion

St. Albans Bay VT RCWP

Lake Pittsfield IL
• Lake Pittsfield is a 220 ac lake located near the city of Pittsfield in the 25,393 ac Blue Creek watershed in Pike County, western Illinois
• Constructed in 1961 as a flood control reservoir.
• Sediment deposition the dominant water quality problem

0
500
1000
1500
2000
2500
3000
3500
4000
1961 1974 1979 1985 1992
Lak
e V
olu
me
(ac-
ft)
0
100
200
300
400
500
600
700
800
900
1000
Sed
imen
t V
olu
me
(ac-
ft)
Lake volume Sediment volume
Lake Pittsfield IL

• 1979 vegetative practices on agricultural land slowed sedimentation rate
• Lake sedimentation still higher than desired• Additional practices needed – WASCOBs and
sediment retention basins
Lake Pittsfield IL
An
nu
al S
edim
ent
Yie
ld (
ton
s/ac
re)
or
Y
ield
/Dis
char
ge (
ton
s/ac
-ft)
0
2
4
6
8
10
12
WASCOBs installedConstruction of 12 rock riffles (Newbury Weirs)Station D annual sediment yield (tons/acre)Station C annual sediment yield (tons/acre)Station D yield/discharge (tons/ac-ft)Station C yield/discharge (tons/ac-ft)
1992 1993 1994 1995 1996 1997 1998 1999 2000 2001 2002 2003 2004
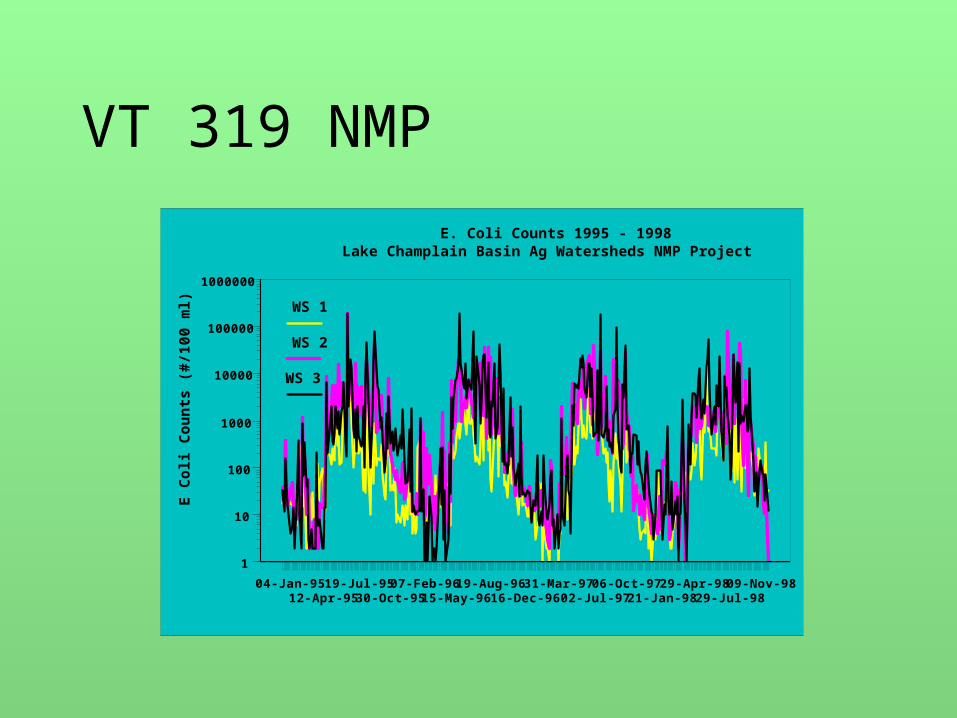
VT 319 NMP
04-Jan-9512-Apr-95
19-Jul-9530-Oct-95
07-Feb-9615-May-96
19-Aug-9616-Dec-96
31-Mar-9702-Jul-97
06-Oct-9721-Jan-98
29-Apr-9829-Jul-98
09-Nov-98
1
10
100
1000
10000
100000
1000000
E C
oli
Co
un
ts (
#/10
0 m
l)
WS 1
WS 2
WS 3
E. Coli Counts 1995 - 1998Lake Champlain Basin Ag Watersheds NMP Project

VT 319 NMP
0.1 1 10 100 1000
Instantaneous Streamflow (ft3/sec)
1
10
100
1000
10000
100000
1000000
E. C
oli C
ount
s (#
/100
ml)
Streamflow and E. Coli CountsWS 2 1995 - 1998
Lake Champlain Ag Watersheds NMP Project

VT 319 NMP
0.1 1 10 100 1000
Instantaneous Streamflow (ft3/sec)
1
10
100
1000
10000
100000
1000000
E. C
oli C
ount
s (#
/100
ml)
WinterSummer
Seasonal Streamflow and E. Coli CountsWS 2 1995 - 1998
Lake Champlain Basin Ag Watersheds NMP Project

VT 319 NMP
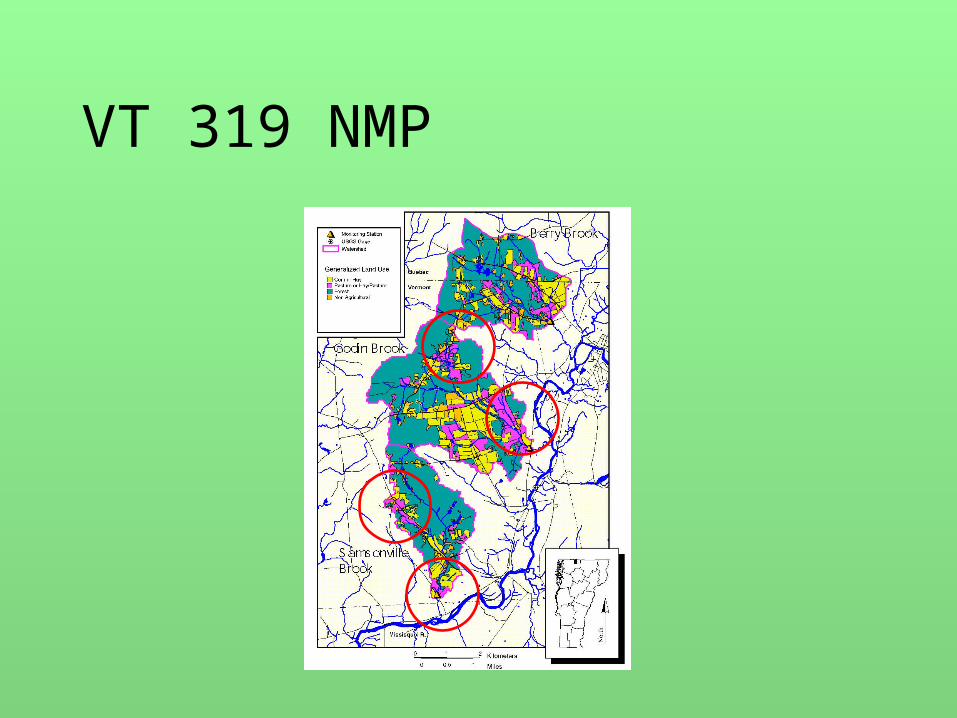
VT 319 NMP

Identification of stressors
• Where causes of biological impairment are unknown, use characterization data to help identify stressors

Stressor Identification
Stressor Identification
Resources:• USEPA Stressor Identification Guidance Document
www.epa.gov/waterscience/biocriteria/stressors/stressors.html
• USEPA Causal Analysis/Diagnosis Decision Information System (CADDIS) http://cfpub.epa.gov/caddis/home.cfm
Related Documents