Interpretation validation on vertically exaggerated reflection seismic sections S.A. Stewart Institute of Petroleum Engineering, Heriot-Watt University, Edinburgh EH14 4AS, UK article info Article history: Received 18 April 2011 Received in revised form 24 February 2012 Accepted 29 February 2012 Available online 21 March 2012 Keywords: Reflection seismic Vertical exaggeration Validation Restoration abstract Reflection seismic data is usually displayed with a vertical exaggeration factor in the range 2e6 irrespective of whether it is time or depth domain data. This vertical exaggeration gives certain advantages to stratigraphic and structural interpretation, and is sometimes a prerequisite to view long-wavelength structures. However, vertical exaggeration distorts geological structures, affecting dip, curvature, line length, cross-sectional area, volume and angular relationships. Reflection seismic can be assigned a “vertical exaggeration heterogeneity factor” based on the extremes of seismic velocities. In the absence of appreciable poorly-compacted units and bathymetry, and generally on depth domain data, vertical exaggeration is relatively homogeneous. Analytical solutions are derived to quantify the distortion of angular relationships, curvature and bed thickness under homogeneous vertical exagger- ation. Modelled extensional and compressional geometries give acceptable area balance restorations using vertical shear under homogeneous vertical exaggeration. These vertically exaggerated restorations are neither admissible nor viable because the deformed and restored state sections are unrealistic. Given low heterogeneity of vertical exaggeration, and relatively simple structure that typifies many extensional geometries and some thrust geometries, aspect ratios of 1:1 are not definitively required for section validation by restoration. Ó 2012 Elsevier Ltd. All rights reserved. 1. Introduction Vertical exaggeration (VE) is defined here as the vertical to horizontal aspect ratio, measured in equal units of depth and distance, of a cross section. Reflection seismic cross sections are commonly displayed with a degree of vertical exaggeration such that the aspect ratio of the section is 2e6 or greater (Stewart, 2011). Vertical exaggeration is not necessarily homogeneous in a given line of section (Fig. 1). Section validation techniques were originally developed to augment field-based studies but for many years have applied to structural interpretations based on reflection seismic data (Gibbs, 1983; Rowan and Kligfield, 1989). This paper examines how geological structures are distorted by vertical exaggeration and considers the impact on the process of structural interpretation and validation. Given that, in certain circumstances, vertical exaggeration may be a significant issue, this paper addressed the question “are any validation methods robust to vertical exaggeration?” 2. Reflection seismic data 2.1. Vertical exaggeration of reflection seismic data Reflection seismic is a standard subsurface imaging tool in the oil & gas industry, underpinning most mapping, drilling and development projects. Reviews of published reflection seismic interpretations and interpretation processes indicate that individ- uals working with reflection seismic rarely view the data with “true” aspect ratio where the vertical depth scale is set equal to the horizontal scale e some 38% of all published reflection seismic is displayed with vertical exaggeration in the range 2e6, and a further 37% is presented with even greater vertical exaggerations (Fig. 2; Bacon et al., 2003; Stewart, 2011). Although vertical exaggeration is used to enhance aspects of display and interpretation, the impact of this distortion on structural aspects of interpretation and validation is rarely considered. This paper does not consider other sources of uncertainty in the reflection seismic method such as low signal to noise ratio (see Feagin, 1981; Bond et al., 2007 , 2012), lateral seismic image posi- tioning errors (e.g. Gray et al., 2001; Pon and Lines, 2005), or geometrical distortion arising from oblique intersection of geological structures (see Groshong, 2006 p.137e141). The term “exaggeration” is used synonymously here with “stretch”, “depth E-mail address: [email protected]. Contents lists available at SciVerse ScienceDirect Journal of Structural Geology journal homepage: www.elsevier.com/locate/jsg 0191-8141/$ e see front matter Ó 2012 Elsevier Ltd. All rights reserved. doi:10.1016/j.jsg.2012.02.021 Journal of Structural Geology 41 (2012) 38e46

Interpretation Validation on Vertically Exaggerated Reflection Seismic Sections
Dec 12, 2015
display manipulation of seismic sections and its effects on interpretation
Welcome message from author
This document is posted to help you gain knowledge. Please leave a comment to let me know what you think about it! Share it to your friends and learn new things together.
Transcript
at SciVerse ScienceDirect
Journal of Structural Geology 41 (2012) 38e46
Contents lists available
Journal of Structural Geology
journal homepage: www.elsevier .com/locate/ jsg
Interpretation validation on vertically exaggerated reflection seismic sections
S.A. StewartInstitute of Petroleum Engineering, Heriot-Watt University, Edinburgh EH14 4AS, UK
a r t i c l e i n f o
Article history:Received 18 April 2011Received in revised form24 February 2012Accepted 29 February 2012Available online 21 March 2012
Keywords:Reflection seismicVertical exaggerationValidationRestoration
E-mail address: [email protected].
0191-8141/$ e see front matter � 2012 Elsevier Ltd.doi:10.1016/j.jsg.2012.02.021
a b s t r a c t
Reflection seismic data is usually displayed with a vertical exaggeration factor in the range 2e6irrespective of whether it is time or depth domain data. This vertical exaggeration gives certainadvantages to stratigraphic and structural interpretation, and is sometimes a prerequisite to viewlong-wavelength structures. However, vertical exaggeration distorts geological structures, affectingdip, curvature, line length, cross-sectional area, volume and angular relationships. Reflection seismic canbe assigned a “vertical exaggeration heterogeneity factor” based on the extremes of seismic velocities. Inthe absence of appreciable poorly-compacted units and bathymetry, and generally on depth domain data,vertical exaggeration is relatively homogeneous. Analytical solutions are derived to quantify thedistortion of angular relationships, curvature and bed thickness under homogeneous vertical exagger-ation. Modelled extensional and compressional geometries give acceptable area balance restorationsusing vertical shear under homogeneous vertical exaggeration. These vertically exaggerated restorationsare neither admissible nor viable because the deformed and restored state sections are unrealistic. Givenlow heterogeneity of vertical exaggeration, and relatively simple structure that typifies many extensionalgeometries and some thrust geometries, aspect ratios of 1:1 are not definitively required for sectionvalidation by restoration.
� 2012 Elsevier Ltd. All rights reserved.
1. Introduction
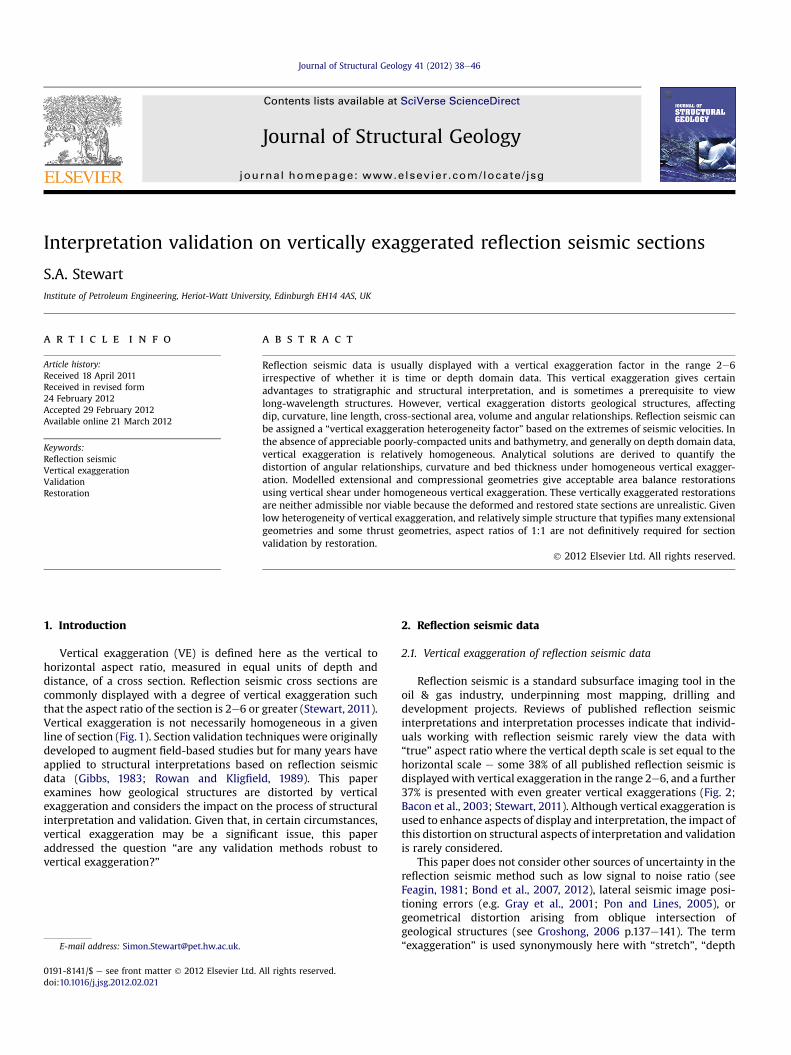
Vertical exaggeration (VE) is defined here as the vertical tohorizontal aspect ratio, measured in equal units of depth anddistance, of a cross section. Reflection seismic cross sections arecommonly displayed with a degree of vertical exaggeration suchthat the aspect ratio of the section is 2e6 or greater (Stewart, 2011).Vertical exaggeration is not necessarily homogeneous in a givenline of section (Fig. 1). Section validation techniques were originallydeveloped to augment field-based studies but for many years haveapplied to structural interpretations based on reflection seismicdata (Gibbs, 1983; Rowan and Kligfield, 1989). This paperexamines how geological structures are distorted by verticalexaggeration and considers the impact on the process of structuralinterpretation and validation. Given that, in certain circumstances,vertical exaggeration may be a significant issue, this paperaddressed the question “are any validation methods robust tovertical exaggeration?”
All rights reserved.
2. Reflection seismic data
2.1. Vertical exaggeration of reflection seismic data
Reflection seismic is a standard subsurface imaging tool in theoil & gas industry, underpinning most mapping, drilling anddevelopment projects. Reviews of published reflection seismicinterpretations and interpretation processes indicate that individ-uals working with reflection seismic rarely view the data with“true” aspect ratio where the vertical depth scale is set equal to thehorizontal scale e some 38% of all published reflection seismic isdisplayedwith vertical exaggeration in the range 2e6, and a further37% is presented with even greater vertical exaggerations (Fig. 2;Bacon et al., 2003; Stewart, 2011). Although vertical exaggeration isused to enhance aspects of display and interpretation, the impact ofthis distortion on structural aspects of interpretation and validationis rarely considered.
This paper does not consider other sources of uncertainty in thereflection seismic method such as low signal to noise ratio (seeFeagin, 1981; Bond et al., 2007, 2012), lateral seismic image posi-tioning errors (e.g. Gray et al., 2001; Pon and Lines, 2005), orgeometrical distortion arising from oblique intersection ofgeological structures (see Groshong, 2006 p.137e141). The term“exaggeration” is used synonymously here with “stretch”, “depth
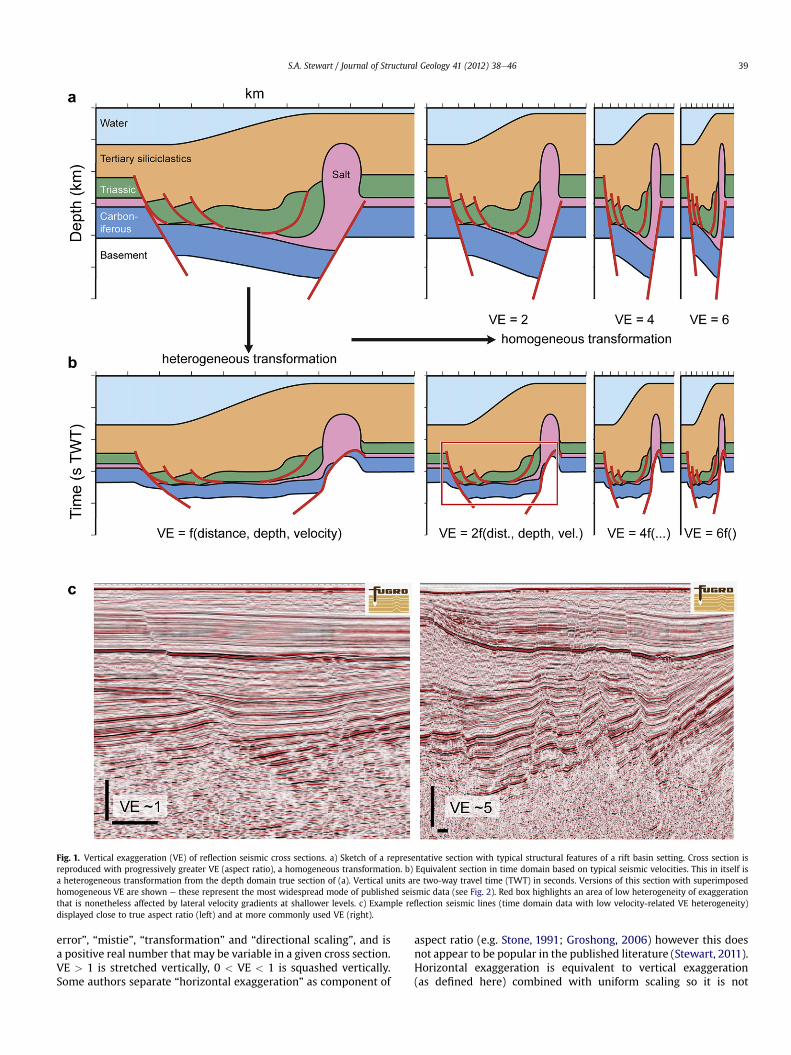
Fig. 1. Vertical exaggeration (VE) of reflection seismic cross sections. a) Sketch of a representative section with typical structural features of a rift basin setting. Cross section isreproduced with progressively greater VE (aspect ratio), a homogeneous transformation. b) Equivalent section in time domain based on typical seismic velocities. This in itself isa heterogeneous transformation from the depth domain true section of (a). Vertical units are two-way travel time (TWT) in seconds. Versions of this section with superimposedhomogeneous VE are shown e these represent the most widespread mode of published seismic data (see Fig. 2). Red box highlights an area of low heterogeneity of exaggerationthat is nonetheless affected by lateral velocity gradients at shallower levels. c) Example reflection seismic lines (time domain data with low velocity-related VE heterogeneity)displayed close to true aspect ratio (left) and at more commonly used VE (right).
S.A. Stewart / Journal of Structural Geology 41 (2012) 38e46 39
error”, “mistie”, “transformation” and “directional scaling”, and isa positive real number that may be variable in a given cross section.VE > 1 is stretched vertically, 0 < VE < 1 is squashed vertically.Some authors separate “horizontal exaggeration” as component of
aspect ratio (e.g. Stone, 1991; Groshong, 2006) however this doesnot appear to be popular in the published literature (Stewart, 2011).Horizontal exaggeration is equivalent to vertical exaggeration(as defined here) combined with uniform scaling so it is not
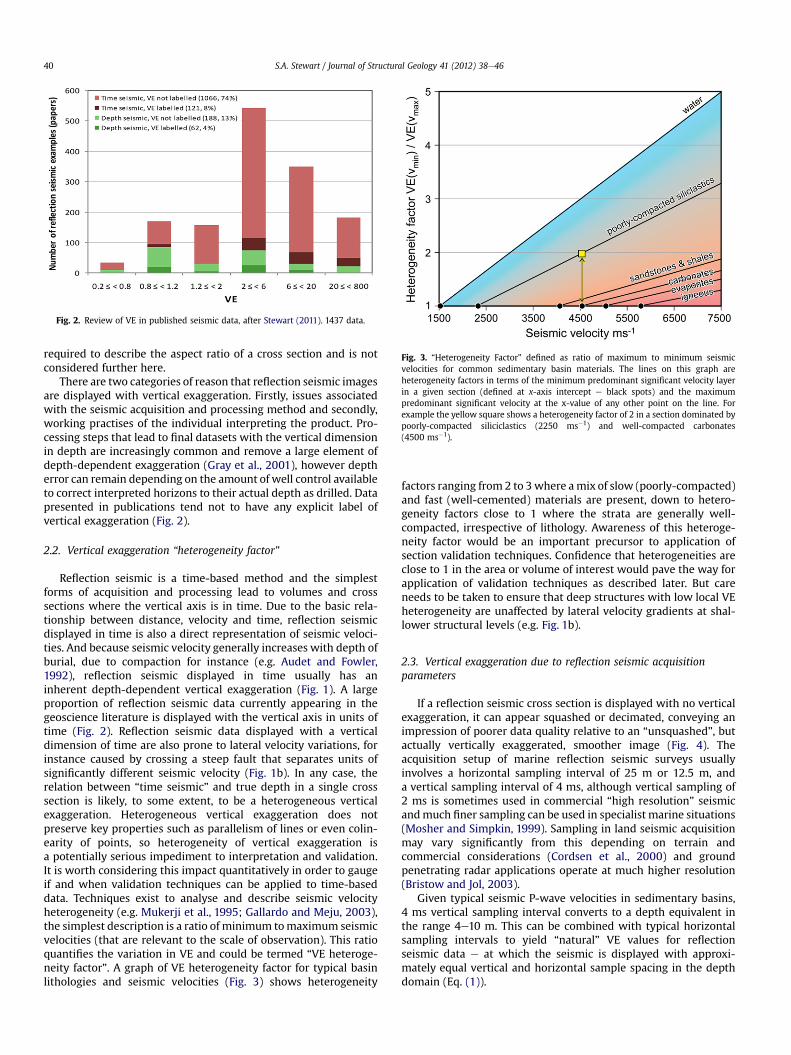
Fig. 2. Review of VE in published seismic data, after Stewart (2011). 1437 data.
Fig. 3. “Heterogeneity Factor” defined as ratio of maximum to minimum seismicvelocities for common sedimentary basin materials. The lines on this graph areheterogeneity factors in terms of the minimum predominant significant velocity layerin a given section (defined at x-axis intercept e black spots) and the maximumpredominant significant velocity at the x-value of any other point on the line. Forexample the yellow square shows a heterogeneity factor of 2 in a section dominated bypoorly-compacted siliciclastics (2250 ms�1) and well-compacted carbonates(4500 ms�1).
S.A. Stewart / Journal of Structural Geology 41 (2012) 38e4640
required to describe the aspect ratio of a cross section and is notconsidered further here.
There are two categories of reason that reflection seismic imagesare displayed with vertical exaggeration. Firstly, issues associatedwith the seismic acquisition and processing method and secondly,working practises of the individual interpreting the product. Pro-cessing steps that lead to final datasets with the vertical dimensionin depth are increasingly common and remove a large element ofdepth-dependent exaggeration (Gray et al., 2001), however deptherror can remain depending on the amount of well control availableto correct interpreted horizons to their actual depth as drilled. Datapresented in publications tend not to have any explicit label ofvertical exaggeration (Fig. 2).
2.2. Vertical exaggeration “heterogeneity factor”
Reflection seismic is a time-based method and the simplestforms of acquisition and processing lead to volumes and crosssections where the vertical axis is in time. Due to the basic rela-tionship between distance, velocity and time, reflection seismicdisplayed in time is also a direct representation of seismic veloci-ties. And because seismic velocity generally increases with depth ofburial, due to compaction for instance (e.g. Audet and Fowler,1992), reflection seismic displayed in time usually has aninherent depth-dependent vertical exaggeration (Fig. 1). A largeproportion of reflection seismic data currently appearing in thegeoscience literature is displayed with the vertical axis in units oftime (Fig. 2). Reflection seismic data displayed with a verticaldimension of time are also prone to lateral velocity variations, forinstance caused by crossing a steep fault that separates units ofsignificantly different seismic velocity (Fig. 1b). In any case, therelation between “time seismic” and true depth in a single crosssection is likely, to some extent, to be a heterogeneous verticalexaggeration. Heterogeneous vertical exaggeration does notpreserve key properties such as parallelism of lines or even colin-earity of points, so heterogeneity of vertical exaggeration isa potentially serious impediment to interpretation and validation.It is worth considering this impact quantitatively in order to gaugeif and when validation techniques can be applied to time-baseddata. Techniques exist to analyse and describe seismic velocityheterogeneity (e.g. Mukerji et al., 1995; Gallardo and Meju, 2003),the simplest description is a ratio of minimum tomaximum seismicvelocities (that are relevant to the scale of observation). This ratioquantifies the variation in VE and could be termed “VE heteroge-neity factor”. A graph of VE heterogeneity factor for typical basinlithologies and seismic velocities (Fig. 3) shows heterogeneity
factors ranging from 2 to 3where amix of slow (poorly-compacted)and fast (well-cemented) materials are present, down to hetero-geneity factors close to 1 where the strata are generally well-compacted, irrespective of lithology. Awareness of this heteroge-neity factor would be an important precursor to application ofsection validation techniques. Confidence that heterogeneities areclose to 1 in the area or volume of interest would pave the way forapplication of validation techniques as described later. But careneeds to be taken to ensure that deep structures with low local VEheterogeneity are unaffected by lateral velocity gradients at shal-lower structural levels (e.g. Fig. 1b).
2.3. Vertical exaggeration due to reflection seismic acquisitionparameters
If a reflection seismic cross section is displayed with no verticalexaggeration, it can appear squashed or decimated, conveying animpression of poorer data quality relative to an “unsquashed”, butactually vertically exaggerated, smoother image (Fig. 4). Theacquisition setup of marine reflection seismic surveys usuallyinvolves a horizontal sampling interval of 25 m or 12.5 m, anda vertical sampling interval of 4 ms, although vertical sampling of2 ms is sometimes used in commercial “high resolution” seismicandmuch finer sampling can be used in specialist marine situations(Mosher and Simpkin, 1999). Sampling in land seismic acquisitionmay vary significantly from this depending on terrain andcommercial considerations (Cordsen et al., 2000) and groundpenetrating radar applications operate at much higher resolution(Bristow and Jol, 2003).
Given typical seismic P-wave velocities in sedimentary basins,4 ms vertical sampling interval converts to a depth equivalent inthe range 4e10 m. This can be combined with typical horizontalsampling intervals to yield “natural” VE values for reflectionseismic data e at which the seismic is displayed with approxi-mately equal vertical and horizontal sample spacing in the depthdomain (Eq. (1)).
Fig. 4. Spatial sampling of reflection seismic data and possible predisposition to VE. a) Graph of vertical exaggerations resulting from display of seismic on a grid with equal samplespacing on vertical and horizontal axes. HI: horizontal sampling interval. VI: vertical sampling interval. b) (i) representation of actual sampling of typical reflection seismic data. (ii)relatively even sampling can give a less stretched appearance of seismic data and may be preferred data display. c) Reflection seismic example at (i) seismic sampling mapped on toan even display grid (ii) a portion of the same line displayed at VE z 1. Seismic data originally appeared in Fig. 2 of Butler and Paton (2010).
S.A. Stewart / Journal of Structural Geology 41 (2012) 38e46 41
VE ðequal spatial sampling on seismicÞ ¼ 2000HIv VI
(1)
Where VE (equal spatial sampling on seismic) is vertical exagger-ation based on equal spatial sampling in vertical and horizontaldirections, v is seismic velocity (ms�1), VI is vertical sampling intwo-way travel time (ms) and HI is horizontal sampling (m). Sodisplay of a reflection seismic cross section with an approximatelyequal vertical and horizontal spatial sampling has a vertical exag-geration of 2e3 in the case of 12.5m horizontally sampled data, and3e6 in the case of data sampled at 25 m horizontal spacing (Fig. 4).The strength of this effect on practitioners is difficult to quantify butit is easy to imagine an interpreter preferring the aesthetics of“unstretched” seismic displayed with even vertical and horizontalsampling.
2.4. Vertical exaggeration due to data management andinterpretation issues
The full seismic volume as acquired and processed is notnecessarily available to the interpretere seismic may be decimatedon loading, for example a survey acquired with HI ¼ 12.5 mmay beloaded dropping every second trace, to save computer memory orincrease interpretational efficiency, giving a 25 m spacing. Thesampling parameters discussed here apply to the seismic volume
that is available to the interpreter, i.e. as loaded to the interpreta-tion system.
A related user-driven factor arises from the seismic interpreta-tion workflow often being horizontally-biased; the majority ofmapping in sedimentary basins follows sub-horizontal features suchas bedding planes, rather than steep structures. Again this results ina tendency to increase vertical exaggeration, driven in this case bya desire to ease the interpretation of a given reflector, and increasethe lateral extent of the area of interest available on-screen at a giventime. This lateral squashing, also known as “foreshortening” (Feagin,1981; Bertram and Milton, 1996), amplifies low-angle stratigraphicand structural relationships, again easing interpretation.
In contrast to the heterogeneous nature of vertical exaggerationof seismic displayed with a time-based vertical axis, these “user-driven” forms of vertical exaggeration represent homogeneoustransforms in that a single directional scaling factor applies to thewhole cross section.
3. Impact of vertical exaggeration on structural criteria
3.1. Homogeneous vertical exaggeration
Homogeneous vertical exaggeration is an affine transformation,so straight lines remain straight, parallel lines remain parallel and
S.A. Stewart / Journal of Structural Geology 41 (2012) 38e4642
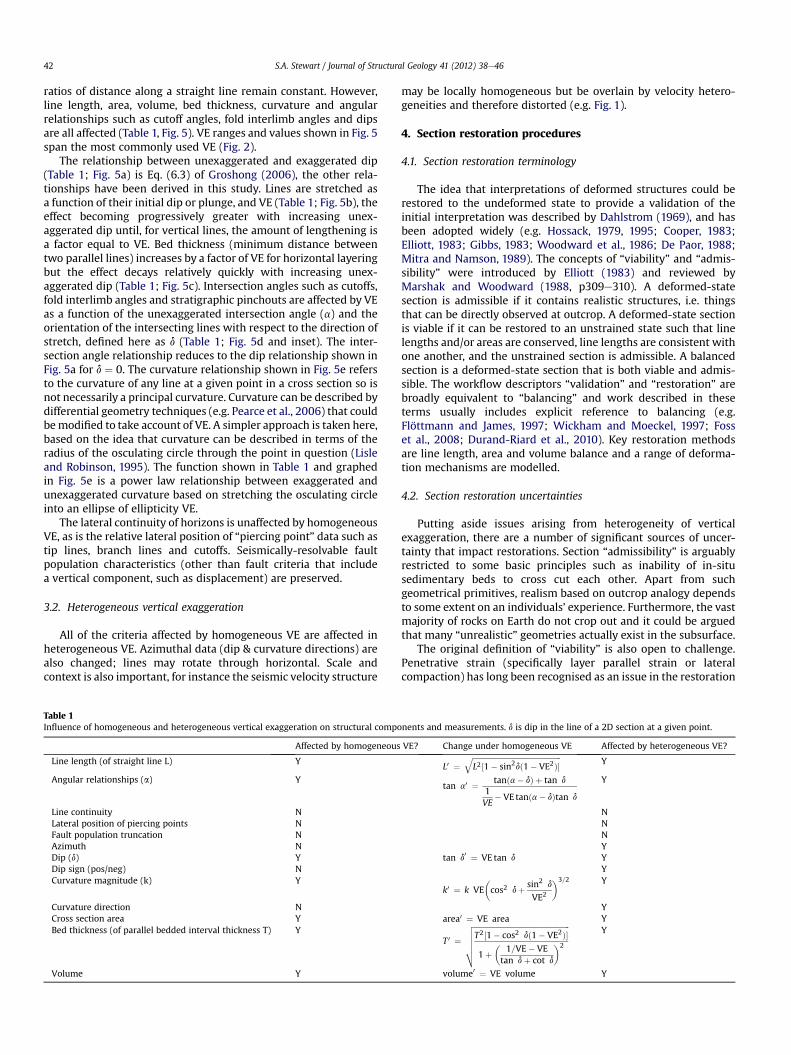
ratios of distance along a straight line remain constant. However,line length, area, volume, bed thickness, curvature and angularrelationships such as cutoff angles, fold interlimb angles and dipsare all affected (Table 1, Fig. 5). VE ranges and values shown in Fig. 5span the most commonly used VE (Fig. 2).
The relationship between unexaggerated and exaggerated dip(Table 1; Fig. 5a) is Eq. (6.3) of Groshong (2006), the other rela-tionships have been derived in this study. Lines are stretched asa function of their initial dip or plunge, and VE (Table 1; Fig. 5b), theeffect becoming progressively greater with increasing unex-aggerated dip until, for vertical lines, the amount of lengthening isa factor equal to VE. Bed thickness (minimum distance betweentwo parallel lines) increases by a factor of VE for horizontal layeringbut the effect decays relatively quickly with increasing unex-aggerated dip (Table 1; Fig. 5c). Intersection angles such as cutoffs,fold interlimb angles and stratigraphic pinchouts are affected by VEas a function of the unexaggerated intersection angle (a) and theorientation of the intersecting lines with respect to the direction ofstretch, defined here as d (Table 1; Fig. 5d and inset). The inter-section angle relationship reduces to the dip relationship shown inFig. 5a for d ¼ 0. The curvature relationship shown in Fig. 5e refersto the curvature of any line at a given point in a cross section so isnot necessarily a principal curvature. Curvature can be described bydifferential geometry techniques (e.g. Pearce et al., 2006) that couldbemodified to take account of VE. A simpler approach is taken here,based on the idea that curvature can be described in terms of theradius of the osculating circle through the point in question (Lisleand Robinson, 1995). The function shown in Table 1 and graphedin Fig. 5e is a power law relationship between exaggerated andunexaggerated curvature based on stretching the osculating circleinto an ellipse of ellipticity VE.
The lateral continuity of horizons is unaffected by homogeneousVE, as is the relative lateral position of “piercing point” data such astip lines, branch lines and cutoffs. Seismically-resolvable faultpopulation characteristics (other than fault criteria that includea vertical component, such as displacement) are preserved.
3.2. Heterogeneous vertical exaggeration
All of the criteria affected by homogeneous VE are affected inheterogeneous VE. Azimuthal data (dip & curvature directions) arealso changed; lines may rotate through horizontal. Scale andcontext is also important, for instance the seismic velocity structure
Table 1Influence of homogeneous and heterogeneous vertical exaggeration on structural compo
Affected by homogeneous
Line length (of straight line L) Y
Angular relationships (a) Y
Line continuity NLateral position of piercing points NFault population truncation NAzimuth NDip (d) YDip sign (pos/neg) NCurvature magnitude (k) Y
Curvature direction NCross section area YBed thickness (of parallel bedded interval thickness T) Y
Volume Y
may be locally homogeneous but be overlain by velocity hetero-geneities and therefore distorted (e.g. Fig. 1).
4. Section restoration procedures
4.1. Section restoration terminology
The idea that interpretations of deformed structures could berestored to the undeformed state to provide a validation of theinitial interpretation was described by Dahlstrom (1969), and hasbeen adopted widely (e.g. Hossack, 1979, 1995; Cooper, 1983;Elliott, 1983; Gibbs, 1983; Woodward et al., 1986; De Paor, 1988;Mitra and Namson, 1989). The concepts of “viability” and “admis-sibility” were introduced by Elliott (1983) and reviewed byMarshak and Woodward (1988, p309e310). A deformed-statesection is admissible if it contains realistic structures, i.e. thingsthat can be directly observed at outcrop. A deformed-state sectionis viable if it can be restored to an unstrained state such that linelengths and/or areas are conserved, line lengths are consistent withone another, and the unstrained section is admissible. A balancedsection is a deformed-state section that is both viable and admis-sible. The workflow descriptors “validation” and “restoration” arebroadly equivalent to “balancing” and work described in theseterms usually includes explicit reference to balancing (e.g.Flöttmann and James, 1997; Wickham and Moeckel, 1997; Fosset al., 2008; Durand-Riard et al., 2010). Key restoration methodsare line length, area and volume balance and a range of deforma-tion mechanisms are modelled.
4.2. Section restoration uncertainties
Putting aside issues arising from heterogeneity of verticalexaggeration, there are a number of significant sources of uncer-tainty that impact restorations. Section “admissibility” is arguablyrestricted to some basic principles such as inability of in-situsedimentary beds to cross cut each other. Apart from suchgeometrical primitives, realism based on outcrop analogy dependsto some extent on an individuals’ experience. Furthermore, the vastmajority of rocks on Earth do not crop out and it could be arguedthat many “unrealistic” geometries actually exist in the subsurface.
The original definition of “viability” is also open to challenge.Penetrative strain (specifically layer parallel strain or lateralcompaction) has long been recognised as an issue in the restoration
nents and measurements. d is dip in the line of a 2D section at a given point.
VE? Change under homogeneous VE Affected by heterogeneous VE?
L0 ¼ffiffiffiffiffiffiffiffiffiffiffiffiffiffiffiffiffiffiffiffiffiffiffiffiffiffiffiffiffiffiffiffiffiffiffiffiffiffiffiffiffiffiffiffiffiffiffiffiL2½1� sin2dð1� VE2Þ�
qY
tan a0 ¼ tanða� dÞ þ tan d
1VE
� VE tanða� dÞtan d
Y
NNNY
tan d0 ¼ VE tan d YY
k0 ¼ k VE�cos2 dþ sin2 d
VE2
�3=2 Y
Yarea0 ¼ VE area Y
T 0 ¼ffiffiffiffiffiffiffiffiffiffiffiffiffiffiffiffiffiffiffiffiffiffiffiffiffiffiffiffiffiffiffiffiffiffiffiffiffiffiffiffiffiffiffiffiffiffiffiffiffiffiffiffiT2½1� cos2 dð1� VE2Þ�
1þ�
1=VE� VEtan dþ cot d
�2
vuuuutY
volume0 ¼ VE volume Y
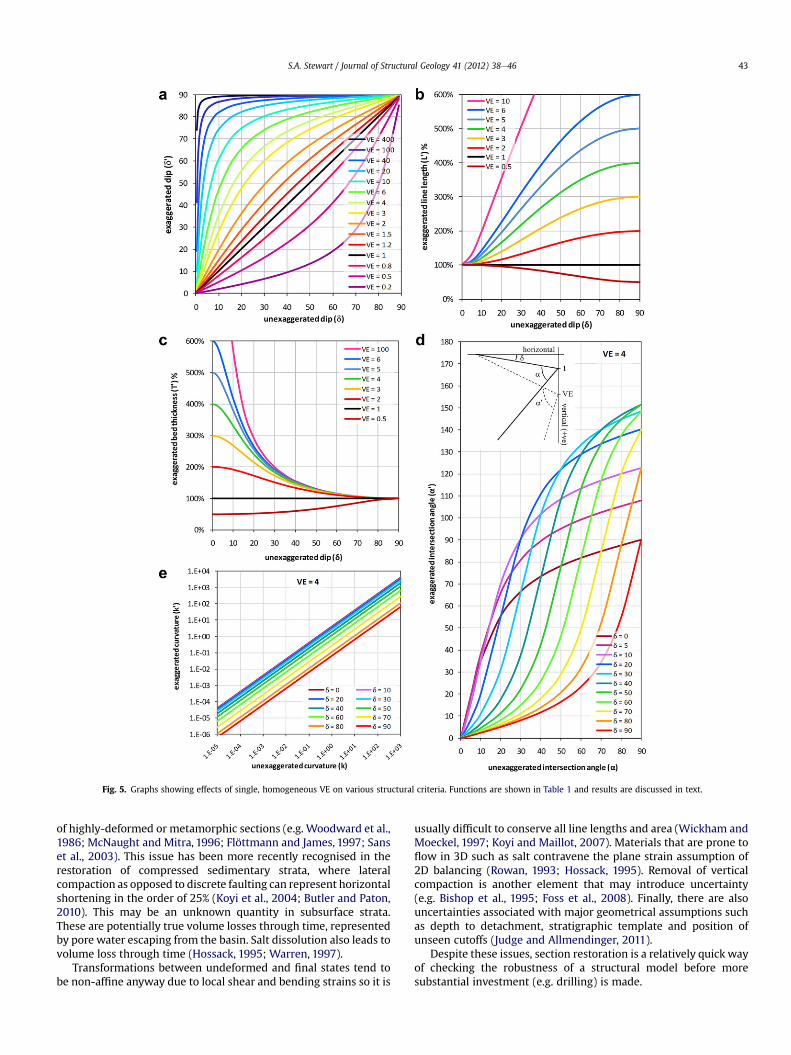
Fig. 5. Graphs showing effects of single, homogeneous VE on various structural criteria. Functions are shown in Table 1 and results are discussed in text.
S.A. Stewart / Journal of Structural Geology 41 (2012) 38e46 43
of highly-deformed or metamorphic sections (e.g. Woodward et al.,1986; McNaught and Mitra, 1996; Flöttmann and James, 1997; Sanset al., 2003). This issue has been more recently recognised in therestoration of compressed sedimentary strata, where lateralcompaction as opposed to discrete faulting can represent horizontalshortening in the order of 25% (Koyi et al., 2004; Butler and Paton,2010). This may be an unknown quantity in subsurface strata.These are potentially true volume losses through time, representedby pore water escaping from the basin. Salt dissolution also leads tovolume loss through time (Hossack, 1995; Warren, 1997).
Transformations between undeformed and final states tend tobe non-affine anyway due to local shear and bending strains so it is
usually difficult to conserve all line lengths and area (Wickham andMoeckel, 1997; Koyi and Maillot, 2007). Materials that are prone toflow in 3D such as salt contravene the plane strain assumption of2D balancing (Rowan, 1993; Hossack, 1995). Removal of verticalcompaction is another element that may introduce uncertainty(e.g. Bishop et al., 1995; Foss et al., 2008). Finally, there are alsouncertainties associated with major geometrical assumptions suchas depth to detachment, stratigraphic template and position ofunseen cutoffs (Judge and Allmendinger, 2011).
Despite these issues, section restoration is a relatively quick wayof checking the robustness of a structural model before moresubstantial investment (e.g. drilling) is made.
S.A. Stewart / Journal of Structural Geology 41 (2012) 38e4644
5. Implications of vertical exaggeration for seismicinterpretation and validation
5.1. Seismic interpretation
The general aim of seismic interpretation is to extract as accu-rate and comprehensive a description as possible of the subsurfacegeometry of geological structures and architectures. In practise thiseffort is usually focussed on a specific area of interest withina dataset, guided by commercial or academic priorities, and theremay be tight deadlines, so workflow efficiency is important. Theprimary geological elements to be mapped are key Formationboundaries and faults, and the challenge in seismic interpretation isto establish correlation of Formations across the area of interest,particularly across faults, especially in areas of relatively weakgeophysical signal.
5.2. Interpretation validation
When faced with validation of interpretations based on reflec-tion seismic data, particularly time-domain sections, workflowsshould ideally include depth conversion. However, the impact ofvertical exaggeration on restoration procedures is worth consid-ering for a number of reasons. Identification of procedures that arerobust to vertical exaggeration enables depth conversion topotentially be omitted in cases where, for example, project timeline
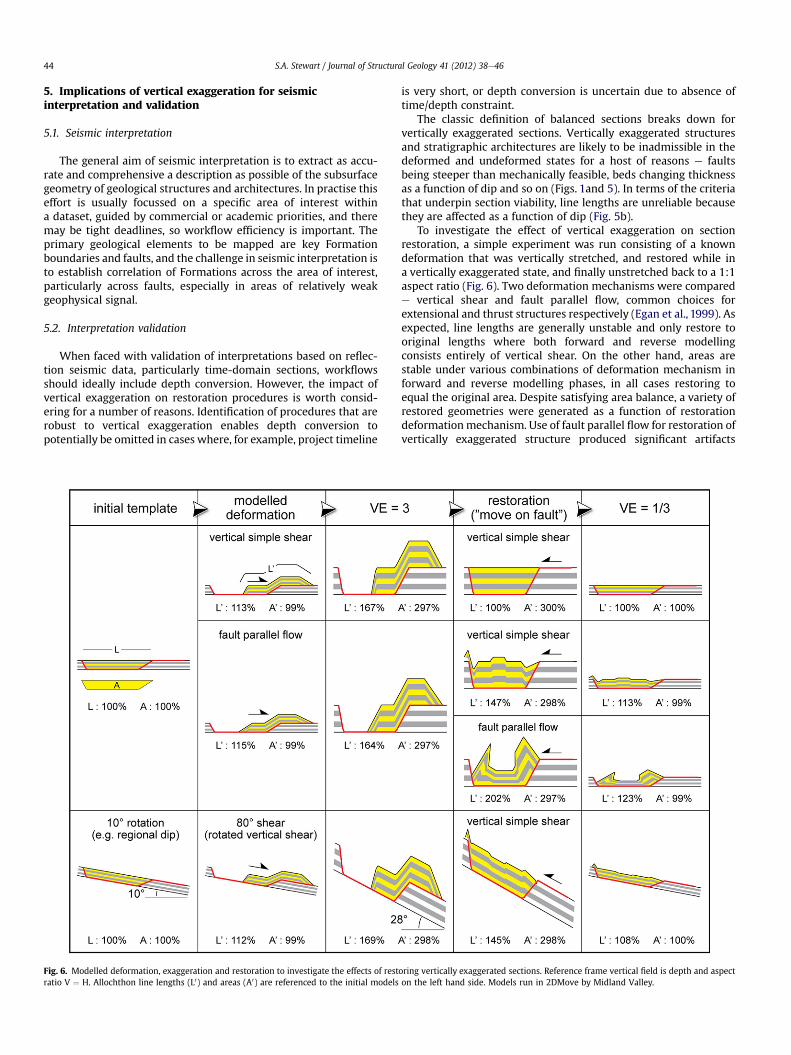
Fig. 6. Modelled deformation, exaggeration and restoration to investigate the effects of restratio V ¼ H. Allochthon line lengths (L0) and areas (A0) are referenced to the initial models
is very short, or depth conversion is uncertain due to absence oftime/depth constraint.
The classic definition of balanced sections breaks down forvertically exaggerated sections. Vertically exaggerated structuresand stratigraphic architectures are likely to be inadmissible in thedeformed and undeformed states for a host of reasons e faultsbeing steeper than mechanically feasible, beds changing thicknessas a function of dip and so on (Figs. 1and 5). In terms of the criteriathat underpin section viability, line lengths are unreliable becausethey are affected as a function of dip (Fig. 5b).
To investigate the effect of vertical exaggeration on sectionrestoration, a simple experiment was run consisting of a knowndeformation that was vertically stretched, and restored while ina vertically exaggerated state, and finally unstretched back to a 1:1aspect ratio (Fig. 6). Two deformation mechanisms were comparede vertical shear and fault parallel flow, common choices forextensional and thrust structures respectively (Egan et al., 1999). Asexpected, line lengths are generally unstable and only restore tooriginal lengths where both forward and reverse modellingconsists entirely of vertical shear. On the other hand, areas arestable under various combinations of deformation mechanism inforward and reverse modelling phases, in all cases restoring toequal the original area. Despite satisfying area balance, a variety ofrestored geometries were generated as a function of restorationdeformationmechanism. Use of fault parallel flow for restoration ofvertically exaggerated structure produced significant artifacts
oring vertically exaggerated sections. Reference frame vertical field is depth and aspecton the left hand side. Models run in 2DMove by Midland Valley.
S.A. Stewart / Journal of Structural Geology 41 (2012) 38e46 45
whereas vertical shear gave reasonable restorations includingcases where the initial deformation consisted of fault parallel flow,and where the initial reference frame is rotated (simulatingregional dip).
These models suggest that validation of vertically exaggeratedsections can be done assuming simple deformation mechanism(vertical shear) and relatively simple structure. It must beacknowledged that this can only ever be a “quicklook” approach tovalidation, rather than precision work that demands VE ¼ 1 anddetailed consideration of deformationmechanisms (e.g. Rowan andKligfield, 1989; Bulnes and McClay, 1999). As structure becomesmore complex e involving cross cutting faults and so on e it isprogressively less likely that a useful restoration using verticalshear in VE < 1 circumstances will be possible. For example, thruststructures in Tierra del Fuego that include backthrusting and out ofsequence thrusting, were forward modelled to reproduce Fig. 12 ofTorres Carbonell et al. (2008) then reverse modelled with VE ¼ 3but the results were geologically unrealistic (not shown).
6. Conclusions
Reflection seismic data is the source of much of the subsurfacemapping that supports oil & gas exploration and productionworldwide yet it is usually displayed with a vertical exaggerationfactor in the range 2e6 that leads to distortion of many geometricalcriteria. Although these distortions are not directly visible on maps,the distortions affect cross sections upon which maps are based.The simplest distortions result from homogeneous verticalstretch; if the velocity field and resulting vertical exaggeration isheterogeneous the distortion of structure will be complex andextremely difficult to restore. Heterogeneity can be categorised interms of the range of predominant seismic velocities in a givenarea of interest e mixtures of high velocity lithologies such aswell-compacted siliciclastics, carbonates and evaporites tend tohave relatively low vertical exaggeration heterogeneity. Heteroge-neous vertical exaggeration applies particularly to time-migratedseismic data; heterogeneity is largely accounted for in depthmigration processing.
Analytical solutions for distortion of criteria such as dip, linelength, bed thickness and angular relationships under homoge-neous vertical exaggeration are derived and quantify the effects ofVE. Restoration of vertically-exaggerated interpretations is neitheradmissible nor viable in the classic sense of dealing with realisticgeological structure. However, if it is accepted that verticallyexaggerated structures are a simple transform of admissiblestructures, it is possible to contemplate section balancing. Forwardmodels incorporating vertical exaggeration of known deformationsuggest that area balance via vertical shear can produce accuraterestorations and is therefore an option if there are reasons why anaccurate depth conversion is not possible. Reasons why depthconversion may not be possible include project time deadlines anduncertainty on seismic velocities. Use of this approach introducesimprecision by imposition of vertical shear as the reversemodellingdeformation mechanism regardless of the actual deformationmechanisms. However this issue may be compensated by theadvantage of facilitating work within a tight deadline or uncertainseismic velocities. Plus, as reviewed here, the goal of precise andaccurate restorations is fraught with uncertainties associated withvolume loss, deformation mechanism and so on.
In commercial scenarios, relatively straightforward issues suchas uncertainty regarding the presence or position of a given faultcan have significant impact for example requiring an additionalwell to achieve a target. The results shown here in terms ofheterogeneity of VE, quantification of the effects of VE ongeometrical criteria, and restorations under VE, provide a simple
toolkit to support restorations and validation if VE is not equal to 1or is uncertain.
Acknowledgements
Restorations in this study used 2DMove from Midland Valley,provided through their Academic Software Initiative. Fugro areacknowledged for providing reflection seismic data. The paperbenefited from reviews by M. Rowan and C. Bond.
References
Audet, D.M., Fowler, A.C., 1992. A mathematical model for compaction in sedi-mentary basins. Geophysical Journal International 110, 577e590.
Bacon, M., Simm, R., Redshaw, T., 2003. 3-D Seismic Interpretation. CambridgeUniversity Press, Cambridge.
Bertram, G.T., Milton, N.J., 1996. Seismic stratigraphy. In: Emery, D., Myers, K.,Bertram, G.T. (Eds.), Sequence Stratigraphy. Blackwell Science Ltd, Oxford,pp. 45e60.
Bishop, D.J., Buchanan, P.G., Bishop, C.J., 1995. Gravity-driven thin-skinned exten-sion above Zechstein Group evaporites in the Western Central North Sea: anapplication of computer-aided section restoration techniques. Marine andPetroleum Geology 12, 115e135.
Bond, C.E., Gibbs, A.D., Shipton, Z.K., Jones, S., 2007. What do you think this is?’Conceptual Uncertainty’ in geoscience interpretation. GSA Today 17, 4e10.
Bond, C.E., Lunn, R.J., Shipton, Z.K., Lunn, A.D., 2012. What makes an expert effectiveat interpreting seismic images? Geology 40, 75e78.
Bristow, C.S., Jol, H.M., 2003. An introduction to ground penetrating radar (GPR) insediments. In: Bristow, C.S., Jol, H.M. (Eds.), Ground Penetrating Radar inSediments. Geological Society, London, Special Publications, vol. 211, pp. 1e7.
Bulnes, M., McClay, K., 1999. Benefits and limitations of different 2D algorithmsused in cross-section restoration of inverted extensional faults: application tophysical experiments. Tectonophysics 312, 175e189.
Butler, R.W.H., Paton, D.A., 2010. Evaluating lateral compaction in deepwater foldand thrust belts: how much are we missing from “nature’s sandbox”? GSAToday 20, 4e10.
Cooper, M.A., 1983. The calculation of bulk strain in oblique and inclined balancedsections. Journal of Structural Geology 5, 161e165.
Cordsen, A., Galbraith, M., Peirce, J., 2000. Planning Land 3-D Seismic Surveys,Geophysical Development Series, vol. 9. Society of Exploration Geophysicists,Tulsa.
Dahlstrom, C.D.A., 1969. Balanced cross sections. Canadian Journal of Earth Sciences6, 743e757.
De Paor, D.G., 1988. Balanced section in thrust belts Part 1: construction. AmericanAssociation of Petroleum Geologists Bulletin 72, 73e90.
Durand-Riard, P., Caumon, G., Muron, P., 2010. Balanced restoration of geologicalvolumes with relaxed meshing constraints. Computers & Geosciences 36,441e452.
Egan, S.S., Kane, S., Buddin, T.S., Williams, G.D., Hodgetts, D., 1999. Computermodelling and visualisation of the structural deformation caused by movementalong geological faults. Computers & Geosciences 25, 283e297.
Elliott, D., 1983. The construction of balanced cross-sections. Journal of StructuralGeology 5, 101.
Feagin, F.J., 1981. Seismic data display and reflection perceptibility. Geophysics 46,106e120.
Flöttmann, T., James, P., 1997. Influence of basin architecture on the style of inver-sion and fold-thrust belt tectonicsethe southern Adelaide fold-thrust belt,South Australia. Journal of Structural Geology 19, 1093e1110.
Foss, S.-K., Rhodes, M., Dalstrøm, B., Gram, C., Welbon, A., 2008. Geologically con-strained seismic imaging - Workflow. Geophysics 73, VE313eVE319.
Gallardo, L.A., Meju, M.A., 2003. Characterization of heterogeneous near-surfacematerials by joint 2D inversion of dc resistivity and seismic data. GeophysicalResearch Letters 30, 4.
Gibbs, A.D., 1983. Balanced cross-section construction from seismic sections inareas of extensional tectonics. Journal of Structural Geology 5, 153e160.
Gray, S.H., Etgen, J., Dellinger, J., Whitmore, D., 2001. Seismic migration problemsand solutions. Geophysics 66, 1622e1640.
Groshong, R.H., 2006. 3-D Structural Geology: a Practical Guide to QuantitativeSurface and Subsurface Map Interpretation, second ed. Springer-Verlag, Berlin.
Hossack, J., 1995. Geometric rules of section balancing for salt structures. In:Jackson, M.P.A., Roberts, D.G., Snelson, S. (Eds.), Salt Tectonics: a GlobalPerspective. American Association of Petroleum Geologists Memoir, vol. 65,pp. 29e40.
Hossack, J.R., 1979. The use of balanced cross-sections in the calculation of orogeniccontraction: a review. Journal of the Geological Society, London 136, 705e711.
Judge, P.A., Allmendinger, R.W., 2011. Assessing uncertainties in balanced crosssections. Journal of Structural Geology 33, 458e467.
Koyi, H.A., Sans, M., Teixell, A., Cotton, J., Zeyen, H., 2004. The significance ofpenetrative strain in the restoration of shortened layers - Insights from sandmodels and the Spanish Pyrenees. In: McClay, K.R. (Ed.), Thrust Tectonics and
S.A. Stewart / Journal of Structural Geology 41 (2012) 38e4646
Hydrocarbon Systems. American Association of Petroleum Geologists Memoir,vol. 82, pp. 207e222.
Koyi, H.A., Maillot, B., 2007. Tectonic thickening of hanging-wall units over a ramp.Journal of Structural Geology 29, 924e932.
Lisle, R.J., Robinson, J.M., 1995. The Mohr circle for curvature and its application tofold description. Journal of Structural Geology 17, 739e750.
Marshak, S., Woodward, N., 1988. Introduction to cross section balancing. In:Marshak, S., Mitra, S. (Eds.), Basic Methods in Structural Geology. Prentice Hall,London.
McNaught, M.A., Mitra, G., 1996. The use of finite strain data in constructing a ret-rodeformable cross-section of the Meade thrust sheet, southeastern Idaho,U.S.A. Journal of Structural Geology 18, 573e583.
Mitra, S., Namson, J., 1989. Equal-area balancing. American Journal of Science 289,563e599.
Mosher, D.C., Simpkin, P., 1999. Status and trends of marine high-resolutionseismic-reflection profiling: data acquisition. Geoscience Canada 26, 174e188.
Mukerji, T., Mavko, G., Mujica, D., Lucet, N., 1995. Scale-dependent seismic velocityin heterogeneous media. Geophysics 60, 1222e1233.
Pearce, M.A., Jones, R.R., Smith, S.A.F., McCaffrey, K.J.W., Clegg, P., 2006. Numericalanalysis of fold curvature using data acquired by high-precision GPS. Journal ofStructural Geology 28, 1640e1646.
Pon, S., Lines, L.R., 2005. Sensitivity analysis of seismic depth migrations.Geophysics 70, S39eS42.
Rowan, M.G., 1993. A systematic technique for the sequential restoration of saltstructures. Tectonophysics 228, 331e348.
Rowan, M.G., Kligfield, R., 1989. Cross section restoration and balancing as aid toseismic interpretation in extensional terranes. American Association of Petro-leum Geologists Bulletin 73, 955e966.
Sans, M., Vergés, J., Gomis, E., Parés, J.M., Schiattarella, M., Travé, A.,Calvet, F., Santanach, P., Doulcet, A., 2003. Layer parallel shortening insalt-detached folds: constraint on cross-section restoration. Tectonophy-sics 372, 85e104.
Stewart, S.A., 2011. Vertical exaggeration of reflection seismic data in geosciencepublications 2006e2010. Marine and Petroleum Geology 28, 959e965.
Stone, D.S., 1991. Analysis of scale exaggeration on seismic profiles. AmericanAssociation of Petroleum Geologists Bulletin 75, 1161e1177.
Torres Carbonell, P.J., Olivero, E.B., Dimieri, L.V., 2008. Structure and evolution ofthe Fuegian Andes foreland thrust-fold belt, Tierra del Fuego, Argentina:Paleogeographic implications. Journal of South American Earth Sciences 25,417e439.
Warren, J.K., 1997. Evaporites, brines and base metals: fluids, flow and ’the evaporitethat was’. Australian Journal of Earth Sciences 44, 149e183.
Wickham, J., Moeckel, G., 1997. Restoration of structural cross-sections. Journal ofStructural Geology 19, 975e986.
Woodward, N.B., Gray, D.R., Spears, D.B., 1986. Including strain data in balancedcross-sections. Journal of Structural Geology 8, 313e324.
Related Documents