Geophys. J. Int. (2006) 167, 187–203 doi: 10.1111/j.1365-246X.2006.03000.x GJI Seismology Interpretation of subhorizontal crustal reflections by metamorphic and rheologic effects in the eastern part of the Pannonian Basin K´ aroly Posgay, 1 Tam´ as Bodoky, 1 Zolt´ an Hajnal, 2 Tivadar M. T´ oth, 3 Tam´ as Fancsik, 1 Endre Heged˝ us, 1 Attila Cs. Kov´ acs 1 and Ern˝ o Tak´ acs 1 1 E¨ otv¨ os Lor ´ and Geophysical Institute of Hungary, H-1140, POB 35, Budapest, Hungary. E-mail: [email protected] 2 Department of Geological Sciences, University of Saskatchewan, Saskatoon, Canada 3 Department of Mineralogy, Geochemistry and Petrology, University of Szeged, Hungary Accepted 2006 March 13. Received 2006 March 7; in original form 2005 February 9 SUMMARY The geologic origin of subhorizontal reflections, often observed in crustal seismic sections, was investigated by establishing metamorphic facies and strength of rocks in depth, and correlating these properties to seismic reflection sections from eastern Hungary. Estimation of the depths of metamorphic mineral stability zones utilized the principles developed by Fyfe et al. and known geothermal data of the area. The strength versus depth profile was derived by relating local seismic P-wave interval velocities to Meissner et al.’s activation energy. The results show that the series of subhorizontal reflections, observed in the Pannonian Basin, are a consequence of combined metamorphic and rheologic changes in depths. The synthesis of the integrated data set suggests that the retrograde alteration of the pre-Tertiary basement above the percolation threshold was made possible by the softening effect of shear zones and their water-conducting capacity. The subhorizontal reflections of highest energy, of the consolidated crust below the percolation threshold, originate in the depths of greenschist, amphibolite and granulite metamorphic mineral facies, which were formed in geothermal and pressure conditions similar to those existing today. These results imply the overprint of earlier (Variscan) metamorphic sequences of the crust by more recent retrograde metamorphic processes. Key words: crustal structure, metamorphism, rheology, seismic structure. 1 INTRODUCTION The current tasks of geophysical investigations have surpassed the original primary mandate of creating images of subsurface struc- tures. The synthesis of geophysical data now incorporates conclu- sions considering quality of rocks, their fluid content, and specific physical properties. This investigation—while searching for the con- ditions, which can produce reflections in the basement and deeper in the crust—also attempts to find the factors influencing the state of rocks. In the last decades a large number of papers have been published concerning the fundamental nature of the lithosphere and the asso- ciated seismic signatures: Dohr & Meissner (1975) interpreted the lamellae of the lower crust as the result of either intrusions or crystallization seams or peeling of mantle material. Klemperer (1987) concluded that in the consolidated crust just below the sedimentary cover, generally very few reflections can be found. Below this transparent zone, reflections appear where the temperature is reaching higher than 300 ◦ –400 ◦ C. As the upper boundary of the zone of rock ductility coincides with that of in- creasing reflectivity, he suggested that ductility may be the factor in inducing reflectivity. Christensen (1989) described the origin of subhorizontal re- flections, in Inner Piedmont (Southern Appalachian Mts., South Carolina), by investigation of rock samples from deep boreholes, which penetrated rocks of middle and lower crustal origin (upper amphibolite metamorphic facies). The synthetic seismograms, com- puted from density and velocity properties of drill cores, led to the conclusion that reflectivities are generated by 0.3–13.7 m variations in thickness of silicic and mafic layers, originating in the lower crust by metamorphism, most probably by ductile flow. In the vertical seismic profiling (VSP) study of James & Silver (1988) in the corridor stack (Leary et al. 1988) of the VSP data, subhorizontal reflectors of spatially variable strengths appear to be related to zones of fracturing and hydrothermal alteration. In the Cajon Pass, California deep drill hole and in surface outcrops intense zeolitic alteration of hydrothermal origin is visible. The laumontite mineralization is pervasive within 1 km of the San Andreas fault, decreases in intensity away from the fault until none is present in surface exposures more than 4 km from the fault (Vincent & Ehlig 1988). It appears that the zeolites are zoned near the rehydrated C 2006 The Authors 187 Journal compilation C 2006 RAS

Welcome message from author
This document is posted to help you gain knowledge. Please leave a comment to let me know what you think about it! Share it to your friends and learn new things together.
Transcript

Geophys. J. Int. (2006) 167, 187–203 doi: 10.1111/j.1365-246X.2006.03000.x
GJI
Sei
smol
ogy
Interpretation of subhorizontal crustal reflections by metamorphicand rheologic effects in the eastern part of the Pannonian Basin
Karoly Posgay,1 Tamas Bodoky,1 Zoltan Hajnal,2 Tivadar M. Toth,3 Tamas Fancsik,1
Endre Hegedus,1 Attila Cs. Kovacs1 and Erno Takacs1
1Eotvos Lorand Geophysical Institute of Hungary, H-1140, POB 35, Budapest, Hungary. E-mail: [email protected] of Geological Sciences, University of Saskatchewan, Saskatoon, Canada3Department of Mineralogy, Geochemistry and Petrology, University of Szeged, Hungary
Accepted 2006 March 13. Received 2006 March 7; in original form 2005 February 9
S U M M A R YThe geologic origin of subhorizontal reflections, often observed in crustal seismic sections, wasinvestigated by establishing metamorphic facies and strength of rocks in depth, and correlatingthese properties to seismic reflection sections from eastern Hungary. Estimation of the depthsof metamorphic mineral stability zones utilized the principles developed by Fyfe et al. andknown geothermal data of the area. The strength versus depth profile was derived by relatinglocal seismic P-wave interval velocities to Meissner et al.’s activation energy. The results showthat the series of subhorizontal reflections, observed in the Pannonian Basin, are a consequenceof combined metamorphic and rheologic changes in depths. The synthesis of the integrated dataset suggests that the retrograde alteration of the pre-Tertiary basement above the percolationthreshold was made possible by the softening effect of shear zones and their water-conductingcapacity. The subhorizontal reflections of highest energy, of the consolidated crust belowthe percolation threshold, originate in the depths of greenschist, amphibolite and granulitemetamorphic mineral facies, which were formed in geothermal and pressure conditions similarto those existing today. These results imply the overprint of earlier (Variscan) metamorphicsequences of the crust by more recent retrograde metamorphic processes.
Key words: crustal structure, metamorphism, rheology, seismic structure.
1 I N T RO D U C T I O N
The current tasks of geophysical investigations have surpassed the
original primary mandate of creating images of subsurface struc-
tures. The synthesis of geophysical data now incorporates conclu-
sions considering quality of rocks, their fluid content, and specific
physical properties. This investigation—while searching for the con-
ditions, which can produce reflections in the basement and deeper
in the crust—also attempts to find the factors influencing the state
of rocks.
In the last decades a large number of papers have been published
concerning the fundamental nature of the lithosphere and the asso-
ciated seismic signatures:
Dohr & Meissner (1975) interpreted the lamellae of the lower
crust as the result of either intrusions or crystallization seams or
peeling of mantle material.
Klemperer (1987) concluded that in the consolidated crust just
below the sedimentary cover, generally very few reflections can
be found. Below this transparent zone, reflections appear where
the temperature is reaching higher than 300◦–400◦C. As the upper
boundary of the zone of rock ductility coincides with that of in-
creasing reflectivity, he suggested that ductility may be the factor in
inducing reflectivity.
Christensen (1989) described the origin of subhorizontal re-
flections, in Inner Piedmont (Southern Appalachian Mts., South
Carolina), by investigation of rock samples from deep boreholes,
which penetrated rocks of middle and lower crustal origin (upper
amphibolite metamorphic facies). The synthetic seismograms, com-
puted from density and velocity properties of drill cores, led to the
conclusion that reflectivities are generated by 0.3–13.7 m variations
in thickness of silicic and mafic layers, originating in the lower crust
by metamorphism, most probably by ductile flow.
In the vertical seismic profiling (VSP) study of James & Silver
(1988) in the corridor stack (Leary et al. 1988) of the VSP data,
subhorizontal reflectors of spatially variable strengths appear to be
related to zones of fracturing and hydrothermal alteration. In the
Cajon Pass, California deep drill hole and in surface outcrops intense
zeolitic alteration of hydrothermal origin is visible. The laumontite
mineralization is pervasive within 1 km of the San Andreas fault,
decreases in intensity away from the fault until none is present in
surface exposures more than 4 km from the fault (Vincent & Ehlig
1988). It appears that the zeolites are zoned near the rehydrated
C© 2006 The Authors 187Journal compilation C© 2006 RAS

188 K. Posgay et al.
big fractures and this retrograde zoning can be recognized by the
subhorizontal reflections.
Lower crustal lamination has variously been ascribed to mafic
sills, ductile stretching fabric, cumulate layering, trapped fluids, or
some combination of all of these residing within the lower crust
(Nelson 1991).
According to Pavlenkova (1996) the low-velocity and low-
resistivity zones of high reflectivity, described by Western European
authors within the lower crust, in areas of thick continental crust, can
also be found in the middle crust. These middle crustal anomalous
zones can be recognized by the replacement of the steeply dipping
reflections of the upper crust with subhorizontal events. Deeper than
10 km the fluid-saturated fine fissuring causes the low velocity and
high conductivity as well as ductility and contributes to intensive
metamorphism.
The subhorizontal reflections of the crust are often interpreted as
consequences of igneous intrusions, doleritic sills (Holbrook et al.1992; Mooney & Meissner 1992; Juhlin 1990; Ross & Eaton 1997;
Mandler & Clowes 1997, 1998), which are tabular intrusions break-
ing through the older rock complexes (Nelson 1991).
Borradaile et al. (1999) studying the Kapuskasing Structural Zone
(KSZ) found that seismic reflections of consistent orientation did
not conform to the gneissic layering of a 30 km thick Archean gra-
noblastic gneiss bloc of granulite and upper amphibolite grade meta-
morphism, overthrust from the lower crust to the surface. The plane
of the seismic reflectors could, however, be attributed to mineral
orientation which manifested itself in magnetic lineation lines. The
magnetic fabric is defined through anisotropy of low-field magnetic
susceptibility (AMS), and by the anisotropy of anhysterestic re-
manence (AARM), which isolates the component of the magnetic
fabric due to magnetite. Both AMS and AARM are subhorizontal
and do not correspond with the visible lithologic layering. Thus,
the magnetic fabric and the reflections must indicate the ancient ex-
tension direction at depth—originating before the emergence of the
KSZ block.
Hurich et al. (2001) examining velocity and density data from
the Grenville Province of eastern Quebec conclude, that in the up-
per crust composition dominates the velocity and density structure,
while in the middle and lower crust, composition and metamorphism
play equally important roles.
The fundamental concepts behind virtually all of the possible ge-
ologic settings, which may be responsible for the observed crustal
reflectivity zones, are well documented by Mooney & Meissner
(1992). Contrary to these theories, the clarification of the source
of deep crustal seismic reflections is still a major challenge for
seismology, due to lack of direct calibration of observations to
known geology. Meanwhile, large-scale crustal seismic-profiling
such as COCORP (USA), LITHOPROBE (Canada), BIRPS (United
Kingdom), DECORP (Germany) ECORS (France), illustrated that
the crust is reflective globally. However, recent developments in
mining (hardrock) explorations (Drummond et al. 2000; Eaton et al.2003), provide novel perspectives to several kilometres depth about
petrophysical properties of crystalline rocks and their associated re-
flections. These studies, through correlation to boreholes at several
locations, demonstrate that special mineral assemblages, lithoto-
logic changes, alterations either of consequence of fluids flows or
metamorphism, do generate seismically recognizable geologic en-
vironments. A comprehensive study of acoustic properties of min-
erals and host rocks (Salisbury et al. 2003) demonstrates that the
acoustic impedance is a consequence of a special, favourable as-
semblage of minerals or rocks, which were created by a certain
process(es).
In Hungary, series of subhorizontal reflections appear in shallow
basement depth, and in variable settings. Many of these events were
recognized and interpreted with industrial perspectives such as the
structural study of the Mecsek mountains (Raner et al. 1979) or
the high amplitude subhorizontal reflections of the Transdanubian
Central Range, with its associated magnetotelluric conductivity
anomaly at a depth of 4–5 km (Papa et al. 1990; Redlerne-Tatrai &
Varga 2001). Subhorizontal reflectivity patterns are, however, also
evident in other regions of the Pannonian basin (Posgay et al. 1995,
1996).
Some of the atypical characteristics of these seismically anoma-
lous zones do not directly correspond to the above mentioned inter-
pretive concepts, thus providing the impetus for the investigations
presented here. These new results suggest that the reflectivity pat-
terns are the consequences of metamorphic processes which are
controlled by specific pressure and geothermal regimes of the dif-
ferent crustal depths. These recent deductions advance some novel
views of the crust and outline a fresh interpretation philosophy for
subbasement reflectors within the Pannonian Basin.
2 S U B H O R I Z O N TA L R E F L E C T I O N S O F
T H E P R E - T E RT I A RY B A S E M E N T
2.1 Geologic setting of the study area
The pre-Tertiary basement of the Pannonian Basin is consisted of
tectonic ‘terranes’ (Fig. 1) formed in various parts of the Tethys sea.
The region of this investigation falls on the Tisza terrane originating
from the European (northern) side of the Tethys. Kovacs et al. (2000)
estimate that the pre-Mesozoic rocks of the Tisza composite terrane
was subjected to the following three stages of metamorphism:
• between 440–400 Ma: P = 0.95–1.2 GPa and T = 600◦–560◦C
• between 350–330 Ma: P = 0.4–0.65 GPa and T = 640◦–650◦C
• between 330–270 Ma: P = 0.2–0.3 GPa and T = 680◦–685◦C.
The pre-Tertiary basement of the Pannonian Basin consists essen-
tially of Variscan metamorphic rocks (different gneiss, mica schist
and amphibolite varieties) and the overlying Mezosoic sedimentary
cover formations. As shown by Pogacsas et al. (1989), Posgay &
Szentgyorgyi (1991), Albu & Papa (1992), Tari et al. (1992, 1999),
Lorincz & Szabo (1993), Kovacs et al. (2000) among others, the
structural evolution of the metamorphic basement around the study
area was rather complex since the Variscan orogeny especially due to
the multiphase subsidence of the Pannonian Basin. Although some
of these tectonic events involved only the cover formations, others
also affected the basement rocks and contributed to the development
of the juxtaposed blocks of diverse metamorphic evolution. At the
present, as a result of the above processes, the basement is a mo-
saic of blocks of very much differing metamorphic evolutions and
ages. Following the poly-metamorphic evolution the basement was
exhumed and consequently retrogressed.
Secondary mineralization due to retrograde metamorphism and
other alteration processes (e.g. propylization, K-metasomatism,
weathering) is widespread in the basement rocks. Amphibolite usu-
ally contains secondary actinolite rim around hornblende, plagio-
clase is replaced by albite/oligocklase and ilmenite is rimmed by
sphene. Garnet and biotite in different gneiss and mica schist types
alter to chlorite, and sericitization of K-feldspar is a common pro-
cess as well. In addition to the above minerals, micro fissures also
contain epidote, clinozoisite, prehnite, pumpellyite, zeolite and car-
bonate minerals (Juhasz et al. 2002; M. Toth 1994). All these phe-
nomena suggest that, although the rocks of Variscan basement are
C© 2006 The Authors, GJI, 167, 187–203
Journal compilation C© 2006 RAS

Interpretation of subhorizontal crustal reflections 189
Figure 1. Location map and tectonic sketch of the study area: the Tisza Mega-unit (modified after Haas & Pero 2004).
relatively fresh, they all underwent significant retrograde alteration
during the exhumation from the middle crust. Through increasing
Fe3+ rimwards, chemical zoning of Ca–Al phases (epidote, pumpel-
lyite, prehnite) suggest growth during decreasing temperature
(M. Toth 1994, and unpublished results). Al-in-chlorite thermome-
try also shows identical tendency. In addition to above, fluid inclu-
sions confirm comparable development. Subsequent fracture filling
minerals (calcite and quartz) contain fluid inclusions of decreasing
homogenization temperature from >300◦C down to 50◦C (Juhasz
et al. 2002; Schubert & M. Toth 2003).
At present, in the uppermost part of the basement penetrated by
wells, a whole sequence of retrograde parageneses can be examined.
They clearly formed at subsequent depth intervals when uplifting
from the middle crust and now overlap in the most exhumed, and
most intensely altered rocks. Petrological study of rock samples
from the pre-Tertiary basement infers retrogression in a considerable
segment of the crust of the basin.
Based on the stratigraphic and facies character of those strata,
five structural units can be distinguished. They are, from the
bottom upwards: Mecsek–northern part of the Great Hungarian
Plain zone, Villany–Bihar zone, Papuk–Bekes-Lower Codru zone,
Northern Bacska–Upper Codru zone, and Nagybihar zone (Fig. 1).
Those structural units contain both Mesozoic and metamorphic
Palaeozoic and older series, except the Nagybihar zone, where no
Mesozoic formations are known. The upthrusting of those units oc-
curred in the upper Cretaceous (Middle–Upper Turonian).
Tectonic processes leading to the formation of the Pannonian
Basin (system) started in the Late Oligocene and/or in the Early
Miocene and culminated during the Middle Miocene. The early
and major synrift phase can be timed at 24–14 Ma, a consequent
thermal subsidence phase is defined at 14–4 Ma (Hamor et al.2001). The crust, which was significantly thicker prior to those
developments, extended 1.5 to 2 times of its original extension
(Horvath et al. 1988; Posgay et al. 1996) with considerable up
swell of the mantle lithosphere at certain locations (Posgay et al.1995).
Low-viscosity basalt volcanism occurred along faults (Hamor
et al. 2001). The activity started during the Pannonian times (11.5–
3.5 Ma) and ended in the Quartenary. Its total volume is small.
Lower Pannonian basalt was encountered in several wells on the
Tisza terrane and in seismic sections as well (Posgay et al. 1996).
2.2 Seismic images of the Pre-Tertiary basement
Figs 2 and 3 present seismic images of segments of this complex
upper crust region. The data originated from oil exploration sur-
veys in eastern Hungary. Their geographic location is marked A
and B in Fig. 4. (Data acquisition parameters: vibratory source, 240
fold coverage, 30 m seismometer array spacing, unattenuated nat-
ural frequency of seismometers 10 Hz, 12 s recording time, 4 ms
sampling rate. Data processing: DMO, wave form and phase cor-
rections, 2-D wave equation migration, deconvolution and depth
transformation.)
In the central part of profile A of Fig. 2a dipping shear zone can
be observed (a–a), which is disturbed in the depth range of 4.5–
5.5 km by a series of subhorizontal reflections (b–b). Compara-
ble events (c–c) at similar depth are evident in profile B of Fig. 3.
The origin of those subhorizontal reflections, which appear to be
younger than the dipping events, were investigated considering spe-
cific metamorphic and rheologic conditions in the above-mentioned
upper crustal depths.
Fig. 5 shows the approximate spatial distribution of mineral fa-
cies as derived from experimentally determined mineral stabilities—
(modified after Fyfe et al. 1978). The metamorphic facies are nor-
mally named after one of the characteristic assemblages found in
metabasalt. In the same figure marked also is the average tempera-
ture versus depth curve of the region from the vicinity of the seismic
profiles (Dovenyi et al. 1983; Cermak & Bodrine-Cvetkova 1987;
C© 2006 The Authors, GJI, 167, 187–203
Journal compilation C© 2006 RAS

190 K. Posgay et al.
Figure 2. A part of an oil-exploration seismic depth section from eastern Hungary. Its location is marked A in Fig. 4. In the depth range of 4–5 km, subhorizontal
reflections b–b overprint the shear zone a–a within the basement. We suppose that above the percolation threshold the water content of the shear zone made the
retrograde alteration of the metamorphic complex possible.
Figure 3. A part of an oil-exploration seismic depth section, marked B in Fig. 4. Subhorizontal reflections c–c can be observed in the same depth range as b–bin Fig. 2.
C© 2006 The Authors, GJI, 167, 187–203
Journal compilation C© 2006 RAS

Interpretation of subhorizontal crustal reflections 191
Figure 4. Location map of deep seismic profiles (solid lines) and deep boreholes in Eastern Hungary. The dotted lines of the CELEBRATION experiment
(Guterch et al. 2000) are used to determine the velocity and ray path density section of profile CEL 04 by 3-D tomography (Fig. 6).
Lenkey 1999) and the interval velocity-depth values determined
from KESZ-1 (Fig. 4) deep seismic survey (Posgay et al. 1981,
1986).
According to Fyfe et al. (1978) prograde metamorphism is ac-
companied by loss of water as well as by compaction. If the rock
is subjected to low P–T conditions after suffering high-grade meta-
morphism, it can again absorb a small amount of water but retains its
original structural fabric. Fyfe et al. conclude that ‘if dry high-grade
rocks are pervasively rehydrated, overthrusting may be indicated’.
Consequently, in the current case, the zone of reflectivity in the
central part of Fig. 2, a–a, suggests overthrusting, and the bundle
of high-energy subhorizontal reflections b–b is connected with the
rehydration zone.
Borehole temperatures, in the vicinity of seismic lines A and B are
also available to considerable depth. At the southern end of seismic
line B, in borehole Sar-1 (marked with ∗ in Figs 4 and 5) at a depth
of 4800 m the temperature is 290◦C (Arkai et al. 1998), meanwhile
in the borehole Derecske-1, close to line A, (marked with + in
Figs 4 and 5), at a depth of 5200 m the bottom temperature is 250◦C
(Dovenyi & Horvath 1988). These temperature observations are
higher than the average temperature values given by the temperature-
depth curve of Fig. 5. This significant anomaly is most probably
caused by the overlying more than 6500 m thick young sediments
of the Derecske trough (Kilenyi et al. 1991), since the sedimentary
fills thermal conductivity is much lower than that of the basement
rocks; consequently the temperature near the bottom of the trough
is significantly higher than in similar depths of areas where the
sedimentary cover is much thinner. Borehole Derecske-1 penetrated
5000 m Neogene sediments while Sar-1 was located on the edge
of the Derecske trough, but evidently it is still within the same
temperature regime.
In view of the observed data and the presently probable stability
zones of mineral facies given by Fig. 5, the subhorizontal reflections
of Figs 2 and 3 in the depth range of 4.5–5.5 km are associated with
metamorphic phases of the prehnite–pumpellyite zone. It seems,
however, expedient to study also these results from the point of
view of rheology, as well to interpret the data by considering both
approaches.
3 R H E O L O G Y S T U D I E S
Stress regimes originating within the Earth may continue from a
few seconds to several hundred million years. Rheologic response
of rocks to these stresses of varying magnitude and duration may
extend from elastic to ductile reactions (Ranalli 1995). Until the
oscillations of atoms do not surpass the potential threshold of the
cohesive forces, the response of the rock will be elastic (generally
in the case of the effect being shorter than 10 million years). Within
this elastic regime the deformation is proportional to stress. Tectonic
C© 2006 The Authors, GJI, 167, 187–203
Journal compilation C© 2006 RAS

192 K. Posgay et al.
Figure 5. Approximate locations of mineral facies in terms of experimentally determined mineral stabilities (modified after Fyfe et al. 1978). Facies are
normally named after one of the characteristic assemblages found in metabasalt. The interval velocities (Posgay et al. 1981) and the average temperature versus
depth diagram characteristic of the area (Dovenyi et al. 1983; Cermak & Bodrine-Cvetkova 1987; Lenkey 1999) are also plotted. Bottom-hole temperatures of
oil-exploration boreholes Sar-1 (Arkai et al. 1998) and Derecske-1 (Horvath et al. 1988) are marked with ∗ and +, respectively.
force depends on direction, that is, involvement of maximum (σ 1)
and minimum principle stress (σ 3) components. If the differential
stress (σ 1 − σ 3) surpasses the yield stress point of the rock, it suffers
permanent failure. Beyond this stress range of elastic behaviour the
material either fractures or undergoes plastic flow.
Rheology of the lithosphere can be characterized by a strength
versus depth diagram. Strength, in this diagram, is described by the
differential stress [or by its logarithm: log (σ 1 − σ 3)] at which the
cohesion of the rock ceases to exist. Constructing this diagram, for
several orders of magnitude laboratory steady-state data (Chen &
Molnar 1983; Strehlau & Meissner 1987) were extrapolated.
In the elastic part of the lithosphere, rheology is described by the
value of frictional failure (Sibson 1974; Byerlee 1978), taking into
account the pressure of the pore fluid as well (Ranalli & Murphy
1987). For the ductile segment of the lithosphere, where deformation
takes place in the form of steady-state creep, the stability computed
by a power-law empirical function (Kirby 1985) is lower than the one
computed by principles based on friction, therefore, the power-law
function is implemented.
The models of the crust published in the literature consists only
one or two layers (Chen & Molnar 1983; Strehlau & Meissner 1987;
Kusznir & Park 1987; Bodri 1995). Fundamental limitations of these
models are that they divide the crust into too few isotropic layers
and the characteristic physical parameters of these layers are de-
rived from velocities obtained by laboratory measurements of sam-
ples under high pressure and temperature (e.g. Christensen 1979).
Consequently the models could not account for intralayer parameter
variations.
In an attempt to minimize the errors arising from neglecting those
internal layer properties, the empirical relation between the longitu-
dinal interval velocities and the activation energy of rocks,—Vp −E diagrams—(Meissner 1989; Meissner et al. 1991) is considered
in parameter computations. The lithosphere, in the area of interest,
is divided into a number of physically distinct intervals. The divi-
sion is based on the interval velocities, derived from local seismic
data (Posgay et al. 2001). The empirical relations of Meissner et al.(1991) made it then possible to estimate the rock parameters utilizing
in situ velocity–depth curves instead of generalized laboratory data.
The physical basis of Meissner et al.’s diagram is the presumption
that increasing packing of minerals increases both activation energy
and acoustic wave velocity. Up to now we have found no reference in
the literature that considered these principles to generate a rheologic
model of the lithosphere.
For the upper crust, we have computed the frictional stress by
Sibson’s (1974) relation:
σ1 − σ3 = βρgz(1 − λ), (1)
where
σ 1 is the largest, and
σ 3 the smallest principal stress, Pa, in the extension phase of
the Pannonian Basin (Huismans et al. 2001) when subhorizontal
C© 2006 The Authors, GJI, 167, 187–203
Journal compilation C© 2006 RAS

Interpretation of subhorizontal crustal reflections 193
Table 1. The strength envelope curve at point X of seismic line A (Fig. 7) was computed by utilizing the parameters of certain
rows at the belonging depth shown in the first column.
H V int E A n T Reference Material
km km s−1 KJ mol−1 MPa−n s−1 K ◦
3.5 5.2 125 2 × 10⁻⁴ 1.9 475 Ranalli & Murphy (1987) wet granite
4 5.7 137 2 × 10⁻⁴ 1.9 500 Ranalli & Murphy (1987) wet granite
6 5.5 132 2 × 10⁻⁴ 1.9 570 Ranalli & Murphy (1987) wet granite
7 5.7 137 2 × 10⁻⁴ 1.9 600 Ranalli & Murphy (1987) wet granite
reflectors were formed, according to the classical theory of Anderson
(1951) σ 1 was vertical (see point 6.3),
β is a numerical parameter depending on the type of faulting (our
procedure was carried out using β = 0.75, which means normal
faults),
ρ is the average density, kg m−3,
g is the gravity acceleration, m s−2,
z is the depth, m,
λ is the pore fluid factor (in the upper crust, supposing the pore
pressure to be hydrostatic, λ = 0.36).
In the ductile zone we used the so-called Dorn relation (Ranalli
1995) with the necessary modification:
σ1 − σ3 =(
ε′
AD
)1/n
exp
(E
n RT
), (2)
where
ε′ is the creep rate, s−1, (our procedure was carried out using
ε′ = 10−15 s−1, Cloetingh et al. 1995; Posgay et al. 1996),
AD is a material constant (Dorn parameter), Pa−n s−1,
E is the creep activation energy, J mol−1,
n is the stress exponent,
R is the gas constant,
T is the temperature, ◦K.
To get an indicative model the activation energy E was estimated
for the consecutive depth intervals from seismic interval velocities
by the help of Meissner et al.’s (1991) Vp − E diagram.
From published laboratory data of Hansen (1982), Hansen &
Carter (1982), Ranalli & Murphy (1987) and Ranalli (1995) such
AD and n data were selected for what approximately the same E
values were determined. A further criteria in selecting a parame-
ter from the wide range of laboratory data was to find those rocks
which provided similar velocity values under high pressure and tem-
perature in laboratory tests as those determined in profile CEL 04
and KESZ-1, and whose occurrence in the given interval is proba-
ble (e.g. Christensen & Mooney 1995). At boreholes that reached
the basement, the associated rocks were also taken into considera-
tion. The creep parameter values of crustal materials (Tables 1–3)
are only indicative, and quantitatively assessed error limits can be
large (Ranalli 1995). In the literature dealing with rheological cal-
Table 2. The strength envelope curve at point Y of seismic line B (Fig. 8) was computed by utilizing the parameters of certain
rows at the belonging depth shown in the first column.
H V int E A n T Reference Material
km km s−1 KJ mol−1 MPa−n s−1 K ◦
2.5 5.7 137 2 × 10⁻⁴ 1.9 424 Ranalli & Murphy (1987) wet granite
3.75 6.9 235 3, 3 × 10⁻⁴ 3.2 500 Ranalli & Murphy (1987) anortozite
5 6.1 173 3, 2 × 10⁻² 1.9 540 Hansen (1982) wet quartzite
7 5.9 167 3, 2 × 10⁻² 1.9 640 Hansen (1982) wet quartzite
8.5 6.1 173 3, 2 × 10⁻² 1.9 643 Hansen (1982) wet quartzite
culations numerous papers describing the possible errors of those
calculations can be found (e.g. Chen & Molnar 1983; Kusznir &
Park 1987; Strehlau & Meissner 1987; Scholz 1988; Ranalli 1995;
Fernandez & Ranalli 1997). The absolute values on the stress scale
are not better than indicative, but the relative values of the strength
envelope curve (Figs 7, 8 and 10) show systematic vertical variations
comparable to the approximate locations of mineral facies in terms
of experimentally determined mineral stabilities (Fig. 5) and also
to the seismic sections showing likely the compositionally layered
crust (Figs 7–10).
4 I N T E R P R E TAT I O N O F
S U B H O R I Z O N TA L R E F L E C T I O N S I N
T H E P R E - T E RT I A RY B A S E M E N T
Implementing the new background perspectives for the interpreta-
tion of the high-amplitude subhorizontal reflections of Figs 2 and 3,
required the following steps:
(1) Determination of the necessary lateral and depth distribution
of velocity and ray path density along the relevant portion of CEL
04 seismic profile (Fig. 6). The best fit values are derived through
3-D tomographic inversion of the first-arrival traveltimes (Zelt &
Barton 1998) of northeastern Hungary. The location of this survey
line is nearly coincidental with lines A and B of this investigation
(Fig. 4). The CEL 04 line (Fig. 4) is a part of the Central European
Lithospheric Experiment Based on Refraction, 2000 (CELEBRA-
TION 2000) project (Guterch et al. 2000; CEL Org. Com. and Exp.
Team 2001). This major multinational survey was targeted to inves-
tigate the structure and evolution of the complex collage of dom-
inant tectonic features in the region of the Trans-European suture
zone (TESZ), the southwestern portion of the East European craton,
the Carpathian Mountains, the Pannonian Basin, and the Bohemian
massif. It was also complimented by specially designed experiments
(e.g. Hajnal et al. 2004).
The determination of the spatial velocity field of northeastern
Hungary was started with larger cell dimensions (10 × 10 ×5 km). To increase resolution of the tomographic reconstruction
the inversion continued with gradually reduced cell sizes (5 × 5 ×2 km, 2 × 2 × 1 km). The 3-D tomography inversion permitted the
display of a velocity profile (upper part of Fig. 6) and the plotting
C© 2006 The Authors, GJI, 167, 187–203
Journal compilation C© 2006 RAS

194 K. Posgay et al.
Table 3. The strength envelope curve of seismic section presented by Fig. 10 was computed by utilizing the parameters of certain
rows at the belonging depth shown in the first column.
H V int E A n T Reference Material
km km s−1 KJ mol−1 MPa−n s−1 K ◦
3.6 5.7 137 2 × 10⁻⁴ 1.9 420 Ranalli & Murphy (1987) Wet granite
6.9 6.9 235 3, 3 × 10⁻⁴ 3.2 523 Ranalli & Murphy (1987) Anortozite
9.3 6.5 220 1, 3 × 10⁻³ 2.4 623 Hansen (1982) quarz diorite
14 6.9 293 3, 2 × 10⁻¹ 2.4 773 Ranalli (1995) ortopyroxene
18.2 7.2 335 15.7 2.6 843 Ranalli 1995 clinoporoxene
24.1 7.7 445 1, 4 × 10⁻⁴ 4.2 1010 Ranalli 1995 mafic granulite
25.5 8.2 540 4 × 10⁶ 3 1030 Ranalli & Murphy (1987) olivine
of a ray path density profile (lower part of Fig. 6) along the CEL 04.
The ray path density shown belongs to a cell size of 5 × 5 × 2 km.
(2) The projection of the velocity isolines of the appropriate seg-
ment of the line CEL 04 onto the seismic profiles A and B (Figs 7
and 9). The comparatively small (5600–5700 m s−1) values of the
velocity field within the pre-Tertiary basement (Fig. 7) suggest the
rocks having been exposed to strong stress and strain effects.
(3) The strength envelopes curve at point X of the seismic profile
A (Fig. 7) and at point Y of profile B (Fig. 8) were determined utiliz-
ing the velocity distribution and the parameters of Table 1 for A and
those of Table 2 for B. For both profiles to consider the smoothing
effect of the tomography and to simplify the computations the ve-
locity curves were approximated by stepped velocity models. Their
breakpoints are shown by Tables 1 and 2. Considering the temper-
ature curves measured in the boreholes Sar-1 and Derecske-1 the
presently probable stability zones of mineral facies are presented in
accordance with the diagram of Fig. 5.
The structural fabric of the seismic section suggests that after
development of the shear zone a–a the basement rocks have suf-
fered an additional retrograde alteration phase by receiving water
from the intersecting shear zone. The existing near-vertical principal
maximum stress and geothermal gradient is leading to subhorizontal
foliation b–b and overprinting of the shear zone. This interpretation
is in harmony with the zonation of zeolite mineralogy as described
by James & Silver (1988) and findings of Kozlovsky (1987) in the
ultra-deep borehole of the Kola peninsula where retrograde meta-
morphism was found in fault zones combined with disintegrated
amphibolite and granitic gneiss zones.
Below the subhorizontal reflections a low-velocity domain
(<5600 m s−1) d − d is found. The origin of it is partly connected to
temperature effects (Holbrook et al. 1992) and partly to the overpres-
sure of the pore fluids below the zone of recrystallization (Hyndman
1988). The high-velocity domain (>5800 m s−1) e − e, near to the
basement-sediment contact, may represent the most dens segment
of the rocks (Meissner 1986a, p. 34) subjected to retrograde hy-
drothermal alteration.
(4) The subhorizontal reflections c–c of profile B are again
characterized by higher-velocity zones (Fig. 8). Associated with
the zone of subhorizontal reflections c–c, also here similarly to
profil A (Fig. 7), there are anomalously high-velocity segments
(>6500 m s−1) marked f and g (Fig. 8). Those are again regarded
(Meissner 1986a, p. 34) as the most progressive densification ef-
fects of the retrograde alteration. On the velocity distribution based
strength envelope profile the depth range of the subhorizontal re-
flections zone h is identified as the brittle–plastic transition zone.
Kohlstedt et al. (1995) consider it as a semi-brittle region.
(5) Considering the velocity values within the b–b and the c–czones, the temperature values of boreholes Derecske-1 (Dovenyi &
Horvath 1988) and Sar-1 (Arkai et al. 1998), and the appropriate
mineral stability zones (Fig. 5), the most-likely mineral stability
zone of the anomalous b–b and c–c segments were indicated on
Figs 7 and 8. It can be seen that the subhorizontal reflections fall
in the presently existing prehnite–pumpellyite metamorphic facies
zone. On the right-hand side of the Fig. 8 are also presented the
major geologic stratigraphic units of the borehole Sar-1. From the
borehole samples in the depth interval of 2925–3846 m Arkai et al.(1998) established that the Variscan or pre-Variscan (300–400 Ma)
prograde metamorphism altered the polymetamorphic overthrust
block to the amphibolite facies. The retrograde metamorphism of
prehnite–pumpellyite and subordinately greenschist facies of this
block is terminated with mylonitization and formation of catacla-
sites. (On the basis of crystallinity measurements the approximated
temperature was of ca. 300◦C, a thermal effect between anchizone
and epizone).
The underlying Mesozoic—probably Triassic—rocks (recog-
nized between 3846 and 4800 m) are para-autochtonous (Arkai
et al. 2000). Their upper portion suffered a low-temperature an-
chizone prograde metamorphism, while the lower segment belongs
to the epizone (greenschist facies) and the transition zone of an-
chi metamorphism and epizone metamorphism. The K–Ar isotope
geochronological results suggest, that this event and the retrograde
metamorphism of the overthrust block occurred during or slightly
preceding the Austrian and/or Subhercynian compressional events
(80–105 Ma) which are widespread in the region.
Subhorizontal reflections (c–c) appear slightly to the NNW of the
borehole Sar-1 and deeper than the bottom of the borehole. However,
the structural dips of the core samples are comparable to events i–iwhen projected into the section of Fig. 8.
The two SSE dipping shear zones, j − j and k–k (Fig. 8), bor-
dering the high-velocity blocks g and f are recognized regional tec-
tonic trends. Kovacs et al. (2000) describe the trend as an Austrian
and/or sub-Hercynian compressional event. These two zones are
overprinted by the younger retrograde alteration generating subhor-
izontal reflections. The strong reflectivity contrasts are indications,
that the retrograde recrystallization has changed the P-wave velocity
and stability of the rocks. This analysis is supported by the detailed,
velocity distribution determined by tomography and, furthermore by
the relative maximum value of the strength profile (elastic–brittle to
ductile transition zone) presumed in this depth.
5 I N T E R P R E TAT I O N O F
S U B H O R I Z O N TA L R E F L E C T I O N S I N
T H E M I D D L E A N D L O W E R C RU S T
Subhorizontal, high-amplitude reflections (l − l, m–m, n–n, o–o, p–
p), below the percolation threshold, can also be recognized on deep
sounding seismic profiles with focus to investigate the lithosphere
and asthenosphere. (Acquisition and processing data are given in
C© 2006 The Authors, GJI, 167, 187–203
Journal compilation C© 2006 RAS

Interpretation of subhorizontal crustal reflections 195
Figure 6. Tomographic velocity and ray path density section of profile CEL 04 derived through 3-D tomographic inversion for the first-arrival traveltimes of
northeastern Hungary. Lines A and B mark the projected positions of oil-exploration seismic profiles A and B. The profiles of CELEBRATION experiment
indicated by dotted lines in Fig. 4 are also used by 3-D tomography inversion. The scale of the upper profile represents velocity in m s−1. The lower scale is
ray-density per unit area. The diagram indicates, that within the region of interest along profiles A and B the ray density is high.
Posgay et al. 1995, 1996). Fig. 9 presents a part of the reflection
depth section of profile PGT-1 (modified after Posgay et al. 1995).
Its location is shown in Fig. 4. The pre-Neogene basement is marked
by B–B and the crust-mantle boundary by M–M . In the consolidated
crust several steeply NNW dipping zones (q–q, r–r, s–s) are evident
through their low amplitude signal characteristics. The low signal
levels of these zones are attributed to local heterogeneous velocity
intervals within complex displacement zones.
Fig. 10 displays a part of the migrated depth section of the same
profile (Posgay et al. 1995). The specific interval velocities of the
crust (left side of the diagram) were obtained from the data of
KESZ-1 deep seismic profile (Posgay et al. 1981, 1986). The
strength envelope-depth profile computation utilized those veloc-
ities and the parameters are listed in Table 3. The diagram of Fig. 10
marks also the zone of 300◦–400◦C temperature interval, which—
according to Klemperer (1987)—highlights the beginning of the
reflecting lower crust, and a regionally determined layer of high
conductivity (Adam 1987). The depth of the latter was calculated
by Adam’s empirical relation (1983):
H = 1718.7q−1.09, (3)
where
H is the depth, km,
q is the heat flow, mW m−2.
A medium strength reflectivity event (l − l in Fig. 10), in an
approximately 7 km depth, between horizontal distance markings
83 and 90 indicates the beginning of the prehnite–pumpellyite grade
C© 2006 The Authors, GJI, 167, 187–203
Journal compilation C© 2006 RAS

196 K. Posgay et al.
Figure 7. Velocity distribution of profile CEL 04 projected into the depth section of profile A (Fig. 2). Approximate locations of mineral facies in terms of
experimentally determined mineral stabilities are presented on the left side (to determine it Fyfe et al.’s (1978) results shown by Fig. 5 and the temperature
measurements carried out in the Derecske-1 deep borehole (Horvath et al. 1988) were used). The indicative strength envelope curve was determined utilizing
the velocity distribution at point X and the parameters of the Table 1. The subhorizontal reflections b–b appear to be related to hydrothermal alteration connected
to the fracture zone a–a partly overprinted by the later retrograde events.
Figure 8. Velocity distribution of profile CEL 04 projected into the depth section of profile B (Fig. 3). Approximate locations of mineral facies in terms of
experimentally determined mineral stabilities are presented on the left side (to determine it Fyfe et al.’s (1978) results shown by Fig. 5 and the temperature
measurements carried out in the Sar-1 deep borehole were used). The indicative strength envelope curve was determined utilizing the velocity distribution at
point Y and the parameters of the Table 2. Above subhorizontal reflections c–c, the V > 6500 m s−1 (f and g) velocity domain may mark the most solid rocks
originating during retrograde alteration. Recognized shear zones marked with i–i, j − j and k–k, are partly overprinted by later retrograde events.
metamorphic band, coincidental with the upper boundary of a zone
of relatively high stability (and high velocity).
The dominating subhorizontal reflections (from m–m to m 1 − m 1
in Fig. 10) in a depth range of 8.5–11 km outline the Klemperer’s
zone, and the upper part of the greenschist metamorphic facies sec-
tion. This depth range is also referred to by Kohlstedt et al. (1995)
as brittle–ductile transition or semi-brittle zone. Associated with
subhorizontal reflections m 1 − m 1 are some gently dipping events
(∼17◦, m 2 − m 2). The amplitudes of these events are similar to the
subhorizontal ones. We suggest that tectonic influences—occurred
C© 2006 The Authors, GJI, 167, 187–203
Journal compilation C© 2006 RAS

Interpretation of subhorizontal crustal reflections 197
Figure 9. A part of the seismic depth section of PGT-1 (modified after Posgay et al. 1995). The deep displacement zones, q–q, r–r, s–s disturb the continuance
of subhorizontal reflections. The pre-Neogene basement B–B, the crust-mantle boundary M–M are also indicated.
Figure 10. The upper part of a portion of migrated depth section of PGT-1 (modified after Posgay et al. 1995). Furthest left there are the interval velocities
(Posgay et al. 1981, 1986) followed by the estimated metamorphic facies and the strength envelope profile. Also marked are the 300◦–400◦C temperature range
which is according to Klemperer the beginning of reflecting lower crust, and the depth of regional conductive layer of Adam (1987). Subhorizontal reflections
l − l, m–m, n–n, o–o and p–p mark zones of mineral stability, and coincide with the depth of changes of the strength envelope profile, respectively.
C© 2006 The Authors, GJI, 167, 187–203
Journal compilation C© 2006 RAS

198 K. Posgay et al.
nearly in the time of the retrograde metamorphism- are responsible
for these dipping structures.
Above the percolation threshold, a–a (Fig. 2) and i–i, j − j as well
as k–k (Fig. 3) are considered as tectonic interfaces. In many places,
these were overprinted by presumably much younger subhorizon-
tal reflections. Below the percolation threshold, the horizontal and
slightly dipping events m–m, n–n, o–o and p–p (Fig. 10) appear
essentially by the same amplitudes. It is highly probable, that above
the percolation threshold the duration of retrograde metamorphism
was shorter than that below the percolation threshold because of
the more significant fracturing of rocks and the quantity of volatiles
present. The reason that below the percolation threshold the traces of
tectonic events appear in the same zone as the horizontal reflections
is an outcome of the presumably longer lasting retrograde processes.
The dipping interfaces are inferred to be:
(1) either horizons which were formed in an early phase of the
retrograde process where their northern parts were subsequently
uplifted, while their southern parts remained in original position
were blending with subhorizontal horizons created by later stages
of the same process,
(2) or horizons, which were formed by earlier movements creat-
ing a fragmented segment permitting the flow of volatiles possible.
The approximate depth of Adam’s (1987) conducting layer coincides
with the ductile zone and with Klemperer’s metamorphic process
generated free-fluids zone.
Starting at about 14 km depth, bundles of subhorizontal and gen-
tly dipping reflections n–n with prominent energy levels are visible
in Figs 9 and 10. They extend laterally to considerable distances.
These reflections mark the upper limit of amphibolite grade meta-
morphism. Similarly to Mueller et al. (1987) and Mueller (1991)
we suggest, that reflections in this portion of the crust are an effect
of positive change in the acoustic impedance (sudden increase in
interval velocities). This bundle of reflections can also be divided
into subhorizontal (n1 − n1) and dipping bands (n2 − n2).
Hurich et al. (2001) by determining velocities and densities of
gabbro and metagabbro samples (from greenschist to eclogite phase
metamorphism) conclude that reflectivity significantly increases at
the transition of the lower to upper amphibolite metamorphic fa-
cies. Similarly the reflectivity at around 18 km depth (o–o) can also
be attributed to sudden velocity increase as a result of the above
proposed metamorphic facies.
Earlier investigations in this region (Posgay 1993) credited the
reflectivity around 24 km depth (p–p) to the remnants of a former
crust/mantle boundary and interpreted here as a progress of meta-
morphic phase to granulite grade. AVO inversion in the vicinity of
the Mohorovicic discontinuity (Takacs & Hajnal 2000) along PGT-4
deep seismic profile (Fig. 4) recognized a trend comparable to the
strength envelope profile of Fig. 10 in the 21–26-km-depth range.
6 D I S C U S S I O N
6.1 Development model of subhorizontal reflections
The depth range of 5–10 km (as confining pressure increases to
about 200 Mpa) can be regarded as the uppermost regional limit
where reflectivity generated by retrograde metamorphism originates
as an influence of residual water. In this depth range, not consid-
ering anomalous tectonic disturbances, the original lithostatic pres-
sure (Holbrook et al. 1992) closed the primary microcrack systems.
Above this percolation threshold (Kornprobst 2002) surface waters
circulate in the tectonic zones, where a relatively low extent of fissur-
ing increases the possibility of retrograde alteration by providing the
necessary water and increasing permeability. The overthrusts of the
discussed area are regarded as the mechanism responsible for fluid
migration and initiation of retrograde alteration (Figs 2, 3, 7 and 8).
Reflectivity discontinues and the alteration process is ceased where
permeability of rocks approximates the state of a former prograde
metamorphism.
To understand whether retrograde reactions in the continental
crust may or may not be responsible for formation of the subhori-
zontal reflection packages, intensity of these metamorphic processes
should be modelled. To do so, first spatial distribution of the impor-
tant variables, like temperature, reactive minerals, as well as amount
of water available for reactions are to be studied. The metamorphic
basement fundamentally consists of diverse gneiss and amphibolite
types of medium to high-grade metamorphic rocks. Due essentially
to the fast uplift, most mineral phases of these rock types, at the
depth in question, become unstable under lower temperature condi-
tions and are not in equilibrium with water. Therefore, they usually
tend to be transformed to more stable, hydrous phases.
The upper continental crust contains about 40 per cent plagio-
clase, which is also the main constituent of the known lithologies
of the study area. Investigating H2O-fixing retrograde reactions of
feldspar, deductions can be made about the progress of the evolution
of an uplifting continental crust. The most significant mineral re-
actions of this type in the corresponding Ca–Al–Si–O–H chemical
system are the following:
4 An + H2O = Epi (+SiO2), (4)
An + H2O = Prh (+Al2O3 + SiO2), (5)
8 An + 7 H2O (+Mg2+) = Pump (+Al2O3 + SiO2), (6)
An + 4 H2O (+SiO2) = Lmt, (7)
An + 7 H2O (+SiO2) = Stb, (8)
(An—anorthite; Epi—epidote; Prh—prehnite; Pump—
pumpellyite; Lmt—laumontite and Stb—stilbite). In addition
to the plagioclase alteration reactions, Ca-Fe-Mg phases tend to
react forming chlorite and amphibole, (tremolite) K-feldspar alters
to sericite among many others. Besides hydration, also appearance
of secondary carbonate phases is common.
The fracture network of the brittle upper crust can be considered
water saturated. On the other hand, however, both pore space and per-
meability (Stober & Bucher 2004) supported by open, water-filled
fissures decreases progressively with depth. Long-term hydraulic
tests also confirm that hydraulic potential in crystalline basement
rocks is continuously decreasing with depth (Stober & Bucher 2004)
and does not reach steady state (Schulze et al. 2000). From such be-
haviour, Stober & Bucher (2004) conclude, ‘water tends to migrate
from shallow levels into deeper parts of the crystalline basement’.
They also propose that migration of water to depth and the mainte-
nance of a corresponding hydraulic gradient could result from con-
sumption of H2O by hydration reactions at depth. Because of the
huge amount of reactive plagioclase as well as decreasing fractured
porosity, the limiting factor of the mineral reactions is the amount
of available H2O, while the amount of plagioclase is unlimited.
In a numerical model of plagioclase alteration along the upper
crust (M. Toth & Schubert 2005), first the boundary conditions
should be given. All mineral reactions (eqs 4–8) are discontinuous
C© 2006 The Authors, GJI, 167, 187–203
Journal compilation C© 2006 RAS
Interpretation of subhorizontal crustal reflections 199
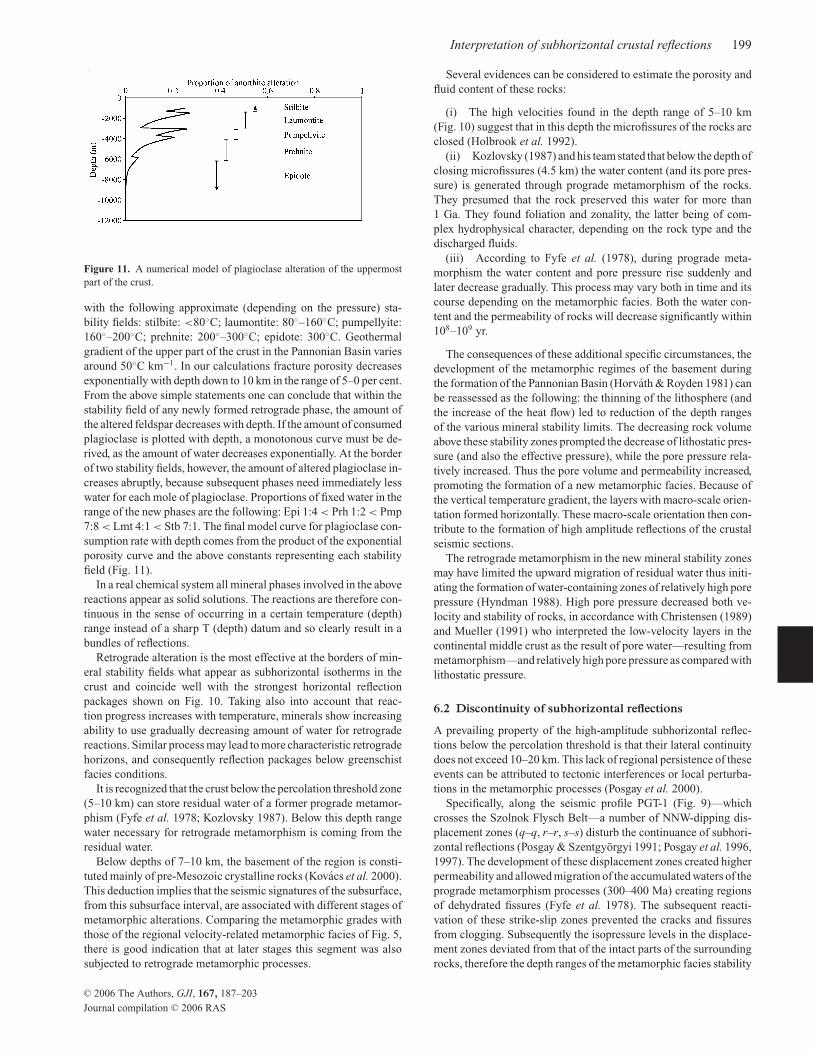
Figure 11. A numerical model of plagioclase alteration of the uppermost
part of the crust.
with the following approximate (depending on the pressure) sta-
bility fields: stilbite: <80◦C; laumontite: 80◦–160◦C; pumpellyite:
160◦–200◦C; prehnite: 200◦–300◦C; epidote: 300◦C. Geothermal
gradient of the upper part of the crust in the Pannonian Basin varies
around 50◦C km−1. In our calculations fracture porosity decreases
exponentially with depth down to 10 km in the range of 5–0 per cent.
From the above simple statements one can conclude that within the
stability field of any newly formed retrograde phase, the amount of
the altered feldspar decreases with depth. If the amount of consumed
plagioclase is plotted with depth, a monotonous curve must be de-
rived, as the amount of water decreases exponentially. At the border
of two stability fields, however, the amount of altered plagioclase in-
creases abruptly, because subsequent phases need immediately less
water for each mole of plagioclase. Proportions of fixed water in the
range of the new phases are the following: Epi 1:4 < Prh 1:2 < Pmp
7:8 < Lmt 4:1 < Stb 7:1. The final model curve for plagioclase con-
sumption rate with depth comes from the product of the exponential
porosity curve and the above constants representing each stability
field (Fig. 11).
In a real chemical system all mineral phases involved in the above
reactions appear as solid solutions. The reactions are therefore con-
tinuous in the sense of occurring in a certain temperature (depth)
range instead of a sharp T (depth) datum and so clearly result in a
bundles of reflections.
Retrograde alteration is the most effective at the borders of min-
eral stability fields what appear as subhorizontal isotherms in the
crust and coincide well with the strongest horizontal reflection
packages shown on Fig. 10. Taking also into account that reac-
tion progress increases with temperature, minerals show increasing
ability to use gradually decreasing amount of water for retrograde
reactions. Similar process may lead to more characteristic retrograde
horizons, and consequently reflection packages below greenschist
facies conditions.
It is recognized that the crust below the percolation threshold zone
(5–10 km) can store residual water of a former prograde metamor-
phism (Fyfe et al. 1978; Kozlovsky 1987). Below this depth range
water necessary for retrograde metamorphism is coming from the
residual water.
Below depths of 7–10 km, the basement of the region is consti-
tuted mainly of pre-Mesozoic crystalline rocks (Kovacs et al. 2000).
This deduction implies that the seismic signatures of the subsurface,
from this subsurface interval, are associated with different stages of
metamorphic alterations. Comparing the metamorphic grades with
those of the regional velocity-related metamorphic facies of Fig. 5,
there is good indication that at later stages this segment was also
subjected to retrograde metamorphic processes.
Several evidences can be considered to estimate the porosity and
fluid content of these rocks:
(i) The high velocities found in the depth range of 5–10 km
(Fig. 10) suggest that in this depth the microfissures of the rocks are
closed (Holbrook et al. 1992).
(ii) Kozlovsky (1987) and his team stated that below the depth of
closing microfissures (4.5 km) the water content (and its pore pres-
sure) is generated through prograde metamorphism of the rocks.
They presumed that the rock preserved this water for more than
1 Ga. They found foliation and zonality, the latter being of com-
plex hydrophysical character, depending on the rock type and the
discharged fluids.
(iii) According to Fyfe et al. (1978), during prograde meta-
morphism the water content and pore pressure rise suddenly and
later decrease gradually. This process may vary both in time and its
course depending on the metamorphic facies. Both the water con-
tent and the permeability of rocks will decrease significantly within
108–109 yr.
The consequences of these additional specific circumstances, the
development of the metamorphic regimes of the basement during
the formation of the Pannonian Basin (Horvath & Royden 1981) can
be reassessed as the following: the thinning of the lithosphere (and
the increase of the heat flow) led to reduction of the depth ranges
of the various mineral stability limits. The decreasing rock volume
above these stability zones prompted the decrease of lithostatic pres-
sure (and also the effective pressure), while the pore pressure rela-
tively increased. Thus the pore volume and permeability increased,
promoting the formation of a new metamorphic facies. Because of
the vertical temperature gradient, the layers with macro-scale orien-
tation formed horizontally. These macro-scale orientation then con-
tribute to the formation of high amplitude reflections of the crustal
seismic sections.
The retrograde metamorphism in the new mineral stability zones
may have limited the upward migration of residual water thus initi-
ating the formation of water-containing zones of relatively high pore
pressure (Hyndman 1988). High pore pressure decreased both ve-
locity and stability of rocks, in accordance with Christensen (1989)
and Mueller (1991) who interpreted the low-velocity layers in the
continental middle crust as the result of pore water—resulting from
metamorphism—and relatively high pore pressure as compared with
lithostatic pressure.
6.2 Discontinuity of subhorizontal reflections
A prevailing property of the high-amplitude subhorizontal reflec-
tions below the percolation threshold is that their lateral continuity
does not exceed 10–20 km. This lack of regional persistence of these
events can be attributed to tectonic interferences or local perturba-
tions in the metamorphic processes (Posgay et al. 2000).
Specifically, along the seismic profile PGT-1 (Fig. 9)—which
crosses the Szolnok Flysch Belt—a number of NNW-dipping dis-
placement zones (q–q, r–r, s–s) disturb the continuance of subhori-
zontal reflections (Posgay & Szentgyorgyi 1991; Posgay et al. 1996,
1997). The development of these displacement zones created higher
permeability and allowed migration of the accumulated waters of the
prograde metamorphism processes (300–400 Ma) creating regions
of dehydrated fissures (Fyfe et al. 1978). The subsequent reacti-
vation of these strike-slip zones prevented the cracks and fissures
from clogging. Subsequently the isopressure levels in the displace-
ment zones deviated from that of the intact parts of the surrounding
rocks, therefore the depth ranges of the metamorphic facies stability
C© 2006 The Authors, GJI, 167, 187–203
Journal compilation C© 2006 RAS
200 K. Posgay et al.
regions deviated in the two regions. It is also possible, that within
the displacement zones, the frequent variability of the pressure and
temperature did not allow sufficient time for development of a new
stable metamorphic zone.
The disruptive reflection pattern across the subhorizontal reflec-
tions on the right-hand side of Fig. 10, between 93 and 103 km
and at a depth of 7 km (u) is associated with a significant magnetic
anomaly (Turkeve anomaly: Posgay 1967) and is interpreted as the
root of an intrusive body.
6.3 Estimation of the age of subhorizontal reflections
The shear zone a–a of Fig. 2 is interpreted, based on its direction
and structural setting, as an Upper Cretaceous (80 Ma) overthrust,
a characteristic of the well established Tisza tectonic unit in the
Pannonian Basin (Kovacs et al. 2000). The bundle of subhorizon-
tal reflections b–b overprint zone a–a, therefore it must be younger
than 80 Ma. Systematization of Alpine metamorphic events in space
and time, in the Pannonian basin, is a significant result of the last
decade (Arkai 2001). Very few investigations are available in the
literature regarding younger alterations (e.g. Mezo–Alpine: 30–40
Ma: Balogh et al. 1990; Arkai et al. 2000; Arkai 2001; Balogh &
Pecskay 2001) and the associated tectonothermal history. Age deter-
mination of alteration, on borehole samples, along seismic profiles
where subhorizontal reflections were penetrated by drilling is still
not available. Extrapolation of published data, however, suggests that
the origin of the relatively shallow subhorizontal reflections may be
placed in time prior to the formation of the Pannonian Basin.
Model studies of subsidence and thermal history (Dovenyi 1994)
suggest an initial fast phase followed by an era of slow thermal
progression. The thermal isolines show greater perturbations in the
initial stage, and consequent slight alterations of their depth position.
In the last 2–10 Ma the rate of change of the geothermal gradient
did not appear to be significant. In reality, the fast deposition of
sediments of the deep basins has modified this model. Heating up
of basin sediments was relatively late phase of the tectonic events,
for two reasons:
(i) The ascending asthenosphere had to increase first the tem-
perature of the lithosphere (Lachenbruch & Sass 1977),
(ii) Continuous deposition of cold sediments delayed the devel-
opment of steady-state conditions (Stegena & Dovenyi 1983). In
certain deep basins thermal equilibrium has still not set in (Posgay
et al. 1995; Lenkey 1999). Under this thermal subsidence conditions
formation of some new stable mineral assemblages are favoured and
these are the main origin of the observed subhorizontal reflections
in the Pannonian Basin system and in other young extensional areas
(Meissner 1986; Mooney & Meissner 1992).
6.4 Potential alternate provenance of the
subhorizonal reflectivity
This is the first known investigation attempting to irradiate the origin
of the horizontal reflections of the deep subsurface in the Pannonian
Basin. A number of geologic models are already documented in the
literature, with the same intentions to explicate the origin of seismic
subhorizontal refection images from the crust. Brief assessment of
some of these currently recognized hypotheses as potential geologic
environments, which may be applicable in the Pannonian Basin,
inspired the following conclusions:
A Intrusions and underplating by mafic diabase sills is one of
the frequently considered geologic models (Dohr & Meissner 1975;
Holbrook et al. 1992; Mooney & Meissner 1992; Juhlin 1990; Ross
& Eaton 1997; Mandler & Clowes 1997, 1998). Within the Tisza
unit of the basin, above the Curie temperature (Tc = 600◦ C), the
lower crust could be modelled with significant susceptibility (K =1600 × 10−6; Posgay et al. 1995). Notwithstanding the above, strong
subhorizontal reflections were observed in the upper crust above the
magnetically modelled zone. As well, from the period when temper-
ature and pressure conditions were comparable to present setting,
mafic intrusions are known, but only in small localities and marginal
quantity (Hamor et al. 2001). Moreover, the reflective zones, based
on the current analysis, are associated with amphibolites.
B The cumulate layering hypothesis (Christensen, 1989), built on
laboratory observations, suggests that fine-scale layering of altered
rocks can produce observable reflection amplitudes in the crust. Es-
sentially this model is comparable to the current inference, by estab-
lishing acoustic impedances considering metamorphic processes.
Based on its original perspectives, it is a conceivable hypothesis for
upper crustal reflectivity. If, however, the original reflective horizons
were formed in the lower crust and uplifted at a later stage, it is ques-
tionable, that their original horizontal positions could be retained.
Since the presentation of the original Christensen model was based
on investigation of rock samples, it did not take into consideration
the importance of fluids although the importance of these factors
was recognized by others (Fyfe et al. 1978; Jones 1992). Concur-
rently, Warner (1990) had difficulty to reconcile the importance of
fluids; they required porosity at significant depths.
C The origins of many of the observed lower crustal reflectivity
images are rationalized through the stretching fabric model (Phin-
ney & Jurdy 1979; Matthews & Cheadle 1986; Smithson 1986;
Allmendinger et al. 1987; McCarthy & Thompson 1988; Reston
1988). Although these models have some differences in detail, all
consider ductile flow, through a stretching process where minerals
are aligned to generate impedance layering. Albeit involvement of
extensional forces was observed in the Pannonian Basin, the regional
extensional strain suffered by the crust is estimated to be less than
two (Horvath et al. 1988; Posgay et al. 1996). Transposed lithologic
layering and micaceous foliation in rocks require orders of higher
strain (Nelson 1991) than the documented levels of the basin.
Considering all the prior possibilities and the available geophys-
ical and geological information, our most logical resolution, for the
origin of the subhorizontal reflections in the Pannonian Basin, are the
retrograde metamorphic processes. Though the question may arise:
‘while it appears that the eastern Pannonian Basin shows a good
correlation between crustal reflectivity and metamorphic changes
with depth, why are there plenty of crustal-scale seismic reflection
data that do not show such a correlation?’.
It is likely, that in the Pannonian Basin the series of interfaces
evolved in the basement of the Neogene basin by retrograde meta-
morphism can be recognized and studied relatively easily because
the series of mineral facies evolved by retrograde metamorphism
took shape under comparatively quiet conditions roughly similar to
the presently existing ones and its interfaces are even today nearly
horizontal.
The dominant prograde metamorphism took place in the period
of 440–270 Ma. Parts of the volatiles originating from these changes
were preserved in the crust and provided the possibility for retro-
grade metamorphism. Geologic evidences indicate that the balance
of mineral phases stability, which developed by prograde metamor-
phism prior to development of the basin, may have been altered
during 24–4 Ma. At this time thick sedimentary layers were de-
posited in rapid succession in the eastern part of the basin. Therefore
C© 2006 The Authors, GJI, 167, 187–203
Journal compilation C© 2006 RAS

Interpretation of subhorizontal crustal reflections 201
the evolved series of retrograde mineral facies zones in the basement
were able to maintain their nearly horizontal positions.
It can be attributed to the difficulties of recognizing and study-
ing them, that no attempt was made up to now to compare seismic
deep reflection data against metamorphic lithology, rheology, geo-
chemical, magnetotelluric and tectonic data within the same study.
Though several paper can be found in the literature which demon-
strate that experiences by mutual application of different areas have
started. Beyond the ones cited in this paper we mention yet the
paper of Burwash et al. (2000) giving an account of a transcrystal-
lization process observed in a tectonic zone. We assume that similar
studies will appear more and more frequently, because they provide
not only scientific (e.g. palaeoseismic, palaeotermic, geochemical,
metamorphic, etc.) but also industrial (e.g. prospecting of hydrocar-
bons or minerals, environmental protection, nuclear waste deposit
site studies, etc.) results.
7 C O N C L U S I O N S
The integrated synthesis of the data sets reveals that the reflective
horizons of the consolidated crust were mainly generated by temper-
ature and pressure conditions comparable to the presently existing
environment with some alterations during the formation of the Pan-
nonian Basin. The depth coincidence of subhorizontal reflections
with well defined stability zones of metamorphic facies, and with
the relative maximum values of an indicative strength profile, sug-
gest that these subhorizontal events were developed by overprinting
after the formation of the Pannonian Basin.
In the crystalline basement, above the percolation threshold, in
around 5 km depth, water necessary for the retrograde alteration
to generate subhorizontal reflections was provided by intersecting
dipping shear zones.
The investigated area lies within the Kunsagia terrane of the Tisza
structural unit. Deep borehole studies in this region suggest that
the basement, below 7–10 km depths, is formed mainly by pre-
Mesozoic crystalline rocks. These rocks were metamorphosed dur-
ing the Variscan orogen at temperatures above 650◦C. The presently
observable temperature and pressure conditions indicate that these
rocks of relatively low permeability below the percolation thresh-
old were subjected to retrograde processes for which the necessary
waters were provided by the remnant fluids of the Variscan metamor-
phism. The new layering with subhorizontal macro-scale orientation
is the result of the vertical gravity and geothermal gradient.
Discontinuities of subhorizontal reflections (mainly below the
percolation threshold) along steeply dipping displacement zones of
the crust, may suggest the absence of retrograde transitions.
The novel ideas presented here may raise significant interest to
investigate the subhorizontal reflecting interfaces in areas where
the palaeotectonic and palaeothermic evolutions differ from those
in the Pannonian Basin, or perhaps study subhorizontal reflections
in depth of crust-mantle transition and mantle lithosphere together
with xenolites of the same depth intervals.
A C K N O W L E D G M E N T S
This study was prepared in the framework of an agreement between
MOL Hungarian Oil and Gas Co. and Eotvos Lorand Geophysical
Institute of Hungary (ELGI). The authors wish to express their
thanks to these institutions for the permission of publishing these
data.
The forward modelling and the inversion was executed on a SUN
Enterprise Server 10 000 of the National Information Infrastructure
Development Program in Hungary.
We are indebted to Z. Tımar for the excellent processing of seis-
mic sections, and to Mrs E. Banciu for the careful execution of
drawings.
We thank the reviewers and for their in-depth assessment of the
manuscript and for their constructive advices contributing to a more
advanced final form of this paper.
R E F E R E N C E S
Adam, A., 1983. EM induction in Finland and general crustal physics, in TheDevelopment of the Deep Geoelectric Model of the Baltic Shield. Part 2.pp. 0–16, ed. Hjelt, S.E., Report 8, Department of Geophysics, Univ. of
Oulu, Finland.
Adam, A., 1987. Are there two types of conductivity anomaly (CA) caused
by fluid in the crust?, Phys. Earth. planet. Inter., 45, 209–215.
Albu, I. & Papa, A., 1992. Application of high-resolution seismics in study-
ing reservoir characteristics of hydrocarbon deposits in Hungary. Geo-physics, 57(8), 1068–1088.
Allmendinger, R.W., Hauge, T., Hauser, E.C., Potter, C.S., Klemperer, S.L.,
Nelson, K.D., Kneupffer, P. & Oliver, J., 1987. Overview of the COCORP
400 transect, western United States: The fabric of an orogenic belt, Geol.Soc. Am. Bull., 98, 308–319.
Anderson, E.M., 1951. Dynamics of faulting, p. 206, Oliver and Boyd, Ed-
inburgh.
Arkai, P., 2001. Alpine regional metamorphism in the main tectonic units of
Hungary: a review, Acta Geologica Hungarica, 44(2–3), 329–344.
Arkai, P., Berczi-Makk, A. & Hajdu, D., 1998. Alpine prograde and ret-
rograde metamorphisms in an overthrusted part of the basement, Great
Plain, Pannonian Basin, Eastern Hungary, Acta Geologica Hungarica,41(2), 179–210.
Arkai, P., Berczi-Makk, A. & Balogh, K., 2000. Alpine low-T prograde meta-
morphism in the post-Variscan basement of the Great Plain, Tisza Unit
(Pannonian Basin, Hungary), Acta Geologica Hungarica, 43(1), 43–63.
Balogh, K. & Pecskay, Z., 2001. K/Ar and Ar/Ar geochronological stud-
ies in the Pannonian-Carpathians-Dinarides (PANCARDI) region, ActaGeologica Hungarica, 44(2–3), 281–299.
Balogh, K., Kovacs, A., Pecskay, Z., Svingor, E. & Arkay, P., 1990. Very low-
grade and low-grade metamorphic rocks in the pre-Tertiary basement of
the Drava Basin, SW-Hungary, II: K-Ar and Rb-Sr isotope geochronologic
data, Acta Geologica Hungarica, 33(1–4), 69–78.
Bodri, B., 1995. Earthquakes and geothermics in the Hungarian Basin. Part 2:
on thermal control of the depth distribution of seismicity (in Hungarian
with English and Russian abstracts), Magyar Geofizika, 36, 203–214.
Borradaile, G.J., Werner, T. & Lagroix, F., 1999. Magnetic fabrics and
anisotropy-controlled thrusting in the Kapuskasing Structural Zone,
Canada, Tectonophysics, 302, 241–256.
Burwash, R.A., Chacko, T., Muehlenbachs, K. & Bouzidi, Y., 2000. Oxygen
isotope systematics of Precambrian basement of Alberta: implications for
Paleoproterozoic and Phanerozoic tectonics in northwestern Alberta, Can.J. Earth Sci., 37, 1611–1628.
Byerlee, J., 1978. Friction of rocks, Pure appl. Geophys., 116, 615–626.
CELEBRATION Organizing Committee and Experiment Team, Correspon-
dents:Guterch, A., Grad, M. & Keller, R., 2001. Seismologists celebrate
the new millennium with an experiment in Central Europe, EOS, Trans.Am. geophys. Un., 82(45), 529, 534–535.
Cermak, V. & Bodrine-Cvetkova, L., 1987. Geothermal model of Eastern
and Central Europe, (in Hung. with English and Russian abstr.), MagyarGeofizika, 28(4–5), 153–189.
Chen, W.P. & Molnar, P., 1983. Focal depths and intraplate eartquakes and
their implications for the thermal and mechanical properties of the litho-
sphere, J. geophys. Res., 88(B5), 4183–4214.
Christensen, N.I., 1979. Compressional wave velocities in rocks at high
temperatures and pressures, critical thermal gradients, and crustal low-
velocity zones, J. geophs. Res., 84(B12), 6849–6857.
Christensen, N.I., 1989. Reflectivity and seismic properties of the deep con-
tinental crust, J. geophys. Res., 94(B12), 17 793–17 804.
C© 2006 The Authors, GJI, 167, 187–203
Journal compilation C© 2006 RAS

202 K. Posgay et al.
Christensen, N.I. & Mooney, W.D., 1995. Seismic velocity structure and
composition of the continental crust: A global view, J. geophys. Res.,100(B7), 9761–9788.
Cloetingh, S., van Wees, J.D., van der Beek, P.A. & Spadini, G., 1995. Role
of pre-rift rheology in kinematics of extensional basin formation: con-
straints from thermomechanical models of Mediterranean and intracra-
tonic basins, Marine and Petroleum Geology., 12(8), 793–807.
Dohr, G.P. & Meissner, R., 1975. Deep crustal reflections in Europe, Geo-physics, 40(1), 25–39.
Dovenyi, P., 1994. Geophysical investigations of the lithosphere of the Pan-
nonian basin, PhD Thesis, Eotvos Univ., Budapest, p. 127.
Dovenyi, P. & Horvath, F., 1988. A review of temperature, thermal conduc-
tivity and heat flow data from the Pannonian Basin, in The PannonianBasin, a study in basin evolution, Vol. 45, pp. 195–234, eds Royden, L.H.
& Horvath, F., AAPG Memoir.
Dovenyi, P., Horvath, F., Liebe, P., Galfi, J. & Erki, I., 1983. Geothermal
conditions of Hungary, Geophysical Transactions, Eotvos Lorand Geo-
physical Istitute of Hungary 29(1), 3–114.
Drummond, B.J., Goleby, B.R., Owen, A.J., Yeates, A.N., Swager, C., Zhang,
Y. & Jackson, J.K., 2000. Seismic reflection imaging of mineral systems:
Three case histories, Geophysics, 65, 1852–1861.
Eaton, D.W., Milkereit, B. & Salisbury, M., 2003. Hardrock seismic explo-
ration. Geophysical Development series No. 10, Society of Exploration
Geophysicists Publ. Tulsa, OK.
Fernandez, M. & Ranalli, G., 1997. The role of reology in extensional basin
formation modelling, Tectonophysics, 282, 129–145.
Fyfe, W.S., Price, N.J. & Thompson, A.B., 1978. Fluids in the Earth’sCrust. Developments in Geochemistry, Elsevier Sci. Publ. C. Amsterdam-
Oxford-New York.
Guterch, A. et al., 2000. CELEBRATION 2000, Huge seismic experiment
in Central Europe, Geologica Carpatica, 51(6), 413–414.
Haas, J. & Pero, Cs., 2004. Mesozoic evolution of the Tisza Mega-unit, Int.J. Earth Sci. (Geol. Rundsch.), 93, 297–313.
Hajnal, Z., Hegedus, E., Keller, G.R., Fancsik, T., Kovacs, A.Cs.,& Csabafi,
R., 2004 Low-frequency 3-D seismic survey of upper crustal magmatic
intrusions in the North-eastern Pannonian Basin of Hungary, Tectono-physics, 388, 239–252.
Hamor, G., Jambor, A. & Pogacsas, Gy., 2001. Paleogeographic/structural
evolutionary stages and the related volcanism of the Carpathian-
Pannonian Region, Acta Geologica Hungarica, 44(2–3), 193–222.
Hansen, F.D., 1982. Semibrittle creep of selected crustal rocks at 1000 MPa,
PhD thesis, Texas A&M Univ., College Station, Texas.
Hansen, F.D. & Carter, N.L., 1982. Creep of selected crustal rocks at 1000
MPa, EOS, Trans. Am. geophys. Un., 63, 437.
Holbrook, W.S., Gajewski, D. & Prodehl, C., 1987. Shear-wave velocity and
Poisson’s ratio structure of the upper lithosphere in Southwest Germany,
Geophys. Res. Lett., 14, 231–234.
Holbrook, W.S., Mooney, W.D. & Christensen, N.I., 1992. The seismic ve-
locity structure of the deep continental crust, in Continental Lower Crust,Developments in Geotectonics, pp. 1–43, eds Fountain, D.M., Arculus, R.
& Kay, R.W., Elsevier, Amsterdam-London-New York, Tokyo.
Horvath, F. & Royden, L.H., 1981. Mechanism for the formation of the intra-
Carpathian basins: a review, Earth Evolution Sciences, 3–4, 307–316.
Horvath, F., Dovenyi, P., Szalay, A. & Royden, L.H., 1988. Subsidence,
thermal, and maturation history of the Great Hungarian Plain, in ThePannonian Basin, a study in basin evolution, eds Royden, L.H. & Horvath,
F., AAPG (American Association of Petroleum Geologists and Hungarian
Geological Society) Memoir 45, 355–372.
Huismans, R.S., Podladchikov, Y.Y. & Cloethinh, S., 2001. Dynamic mod-
eling of the transition from passive to active rifting application to the
Pannonian Basin, Tectonics, 20(6), 1021–1039.
Hurich, C.A., Deemer, S.J., Indares, A. & Salisbury, M., 2001. Composi-
tional and metamorphic controls on velocity and reflectivity in the conti-
nental crust: an example from the Grenville Province of eastern Quebec,
J. geophys. Res., 106(B1), 665–682.
Hyndman, R.D., 1988. Dipping seismic reflectors, electrically conductive
zones, and trapped water in the crust over a subducting plate, J. geophys.Res., 93(B11), 13 391–13 405.
James, E.W. & Silver, L.T., 1988. Implications of zeolites and their zonation
in the Cajon Pass deep drillhole, Geophys. Res. Lett., 15(9), 973–976.
Jones, A.G., 1992. Electrical conductivity of the lower continental crust, in
Continental lower crust, pp. 81–143, eds Fountain, D.M., Arculus, R. &
Kay, R.M., Elsevier, Amsterdam.
Juhasz, A.M., Toth, T., Ramseyer, K. & Matter, A., 2002. Connected fluid
evolution in fractured crystalline basement and overlying sediments, Pan-
nonian Basin, SE Hungary, Chemical Geology, 182, 91–120.
Juhlin, C., 1990. Interpretation of reflections in the Siljan Ring area based
on results from the Gravberg-1 borehole, Tectonophysics, 173, 345–360.
Kilenyi, E., Kroll, A., Obernauer, D., Sefara, J., Steinhauser, P., Szabo, Z. &
Wessely, G., 1991. Pre-Tertiary basement contour map of the Carpathian
Basin beneath Austria, Czechoslovakia and Hungary, Geophysical Trans-actions, 36, 15–36.
Kirby, S.H., 1985. Rock mechanics observations pertinent to the rheology
of the continental lithosphere and the localization of strain along shear
zones, Tectonophysics, 119, 1–27.
Klemperer, S.L., 1987. A relation between continental heat flow and the
seismic reflectivity of the lower crust, J, Geophys., 61, 1–11.
Kohlstedt, D.L., Evans, B. & Mackwell, S.J., 1995. Strength of the litho-
sphere: constrains imposed by laboratory experiments, J. geophys. Res.,100(B9), 17 587–17 602.
Kornprobst, J., 2002. Metamorphic rocks and their geodynamic significance,
Kluwer Academic Publishers, Dordrecht/Boston/London.
Kovacs, S., Szederkenyi, T., Haas, J., Buda, Gy., Csaszar, G. & Nagymarosy,
A., 2000. Tectonostratigraphic terranes in the pre-Neogene basement of
the Hungarian part of the Pannonian area, Acta Geologica Hungarica,43(3), 225–328.
Kozlovsky, Ye.A., 1987. The superdeep well of the Kola Peninsula, Springer-
Verlag, Berlin, Heidelberg, New York.
Kusznir, N.J. & Park, R.G., 1987. The extensional strength of continental
lithosphere: its dependence on geothermal gradient, and crustal compo-
sition and thickness, in Continental Extensional Tectonics, Vol. 28, pp.
35–52, eds Coward, M.P., Dewey, J.F. & Hancock, P.L., Geological Soc.
Publ.
Lachenbruch, A.H. & Sass, J.H., 1977. Heat flow in the United States and
the thermal regime of the crust, in The Earth’s Crust, ed. Heacock, J.G.,
Geophysical monograph 20. A.G.U. Washington, DC.
Lachenbruch, A.H. & Sass, J.H., 1988. The stress heat-flow paradox and
thermal results from Cajon Pass, Geophys. Res. Lett. 15(9), 981–984.
Leary, P.C., Henyey, T.L. & Li, Y-G., 1988. Fracture related reflectors in
basement rock from vertical seismic profiling at Cajon Pass, Geophys.Res. Lett., 15(9), 1057–1060.
Lenkey, L., 1999. Geothermics of the Pannonian Basin and its bearing on the
tectonics of basin evolution, PhD thesis, Vrije University, Amsterdam.
Lorincz, K.D. & Szabo, P., 1993. Seismic analysis of multi-phase tectonism
in the central part of the Pannonian basin in Hungary, in Generation, Ac-cumulation and Production of Europe’s Hydrocarbons III , ed. Spencer,
A.M., Eur. Ass. of Petr. Geoscientist, No 3. Springer-Verlag, Berlin, Hei-
delberg.
Mandler, H.A.F. & Clowes, R.M., 1997. Evidence for extensive tabular intru-
sions in the Precambrian shild of western Canada: a 160-km-long sequence
of bright reflections, Geology, 25(3), 271–274.
Mandler, H.A.F. & Clowes, R.M., 1998. The HSI bright reflector: further
evidence for extensive magmatism in the Precmbrian of western Canada,
Tectonophysics, 208, 71–81.
Matthews, D.H. & Cheadle, M.J., 1986. Deep reflections from Caledonides
and the Variscides of Britain and comparison with the Himalayas, in
Reflection seismology: A global Perspective, Vol. 13, pp. 5–19, eds
Barazangi, M. & Brown, L.D., Am. Geophys Union Geodyn. Ser.
McCarthy, J. & Thompson, G.A., 1988. Seismic images of extended crust
with emphasis on the western United States, Geol. Soc. Am. Bull., 100,1361–1374.
Meissner, R., 1986. Twenty years of deep seismic reflection profiling in
Germany—a contribution to our knowledge of the nature of the lower
Variscan crust, in The Nature of the Lower Continental Crust, pp. 1–10,
eds Dawson, J.B., Carswell, D.A., Hall, J. & Wedepohl, K.H., Geological
Society Special Publications. No. 24.
C© 2006 The Authors, GJI, 167, 187–203
Journal compilation C© 2006 RAS

Interpretation of subhorizontal crustal reflections 203
Meissner, R., 1986a. The continental crust, Academic Press. San Diego,
London.
Meissner, R., 1989. Rupture, creep, lamellae and crocodiles: happenings in
the continental crust, TerraNova, 1, 17–28.
Meissner, R., Wever, Th. & Sadowiak, P., 1991. Continental collisions and
seismic signature, Geophys. J. Int., 105, 15–23.
Mooney, W.D. & Meissner, R., 1992. Multi-genetic origin of crustal reflec-
tivity: a review of seismic reflection profiling of the continental lower crust
and Moho, in Continental lower crust, Vol. 23, pp. 45–79, eds Fountain,
D.M., Arculus, R. & Kay, R.W. Developments in Geotectonics, Elsevier,
Amsterdam, London, New York, Tokyo.
M. Toth, T., 1994. Pre-metamorphic origin and metamorphic evolution of
amphibolites of the Tisia Unit in the vicinity of Szeghalom (in Hungarian),
PhD Thesis, Univ. Szeged, Hungary, p. 191.
M. Toth, T. & Schubert, F., 2006. Exhumation and retrograde evolution of
basement rocks from the Pannonian Basin, in publication.
Mueller, St., 1991. Towards a better understanding of crustal Dynamics,
IUGG Chronicle, 208, 262–267.
Mueller, St., Ansorge, J., Sierro, N., Finckh, P. & Emter, D., 1987. Synoptic
interpretation of seismic reflection and refraction data, Geophys. J. R. Astr.Soc., 89, 345–352.
Nelson, K.D., 1991. A unified view of craton evolution motivated by recent
deep seismic reflection and refraction results, Geophys. J. Int., 105, 25–35.
Papa, A., Raner, G. R., Tatrai, M. & Varga, G., 1990. Seismic and mag-
netotelluric investigation on a network of base lines, Acta GeodaeticaGeophysica et Montanistica Hungarica, 25(3–4), 309–323.
Pavlenkova, N.I., 1996. Crust and upper mantle structure in Northern Eurasia
from seismic data, in Advances in Geophysics, pp. 1–133, eds Dmowska,
R. & Saltzman, B., AP., 37, San Diego, New York, Boston.
Phinney, R.A. & Jurdy, D.M., 1979. Seismic imaging of deep crust, Geo-physics, 44, 1637–1660.
Pogacsas, Gy., Lakatos, L., Barvitz, A., Vakarcs, G. & Farkas, Cs., 1989.
Pliocene-Quartenary strike-slips in the Great Hungarian Plain, (in Hun-
garian). Altalanos Foldtani Szemle (Gen. Geological Review), 24, 149–
169.
Posgay, K., 1967. A comprehensive survey of geomagnetic masses in Hun-
gary (in Hungarian with extended English and Russian abstracts), Geo-physical Transactions, 16(4), 1–118.
Posgay, K., 1993. Formation of the crust-mantle boundary in the previous
upper mantle, GeophysicalTransactions, 37, 243–252.
Posgay, K. & Szentgyorgyi, K., 1991. Strike-slip fault system crossing the
lithosphere at the Eastern part of the Pannonian Basin (in Hungarian with
English abstract), Magyar Geofizika, 32, 1–15.
Posgay, K., Albu, I., Petrovics, I. & Raner, G., 1981. Character of the Earth’s
crust and upper mantle on the basis of seismic reflection measurements
in Hungary, Earth Evolution Sciences, 1, 272–279.
Posgay, K., Albu, I., Raner, G. & Varga, G., 1986. Characteristics of the
reflecting layers in the Earth’s crust and upper mantle in Hungary, in
Reflection Seismology: A Global Perspective, Vol. 13, pp. 55–66, eds
Barazangi M. & Brown, L., A. Geoph. Un. Geodyn. Ser.
Posgay, K. et al., 1995. Asthenospheric structure beneath a Neogene basin
in southeast Hungary, in Interplay of extension and compression in basinformation, Vol. 252, pp. 467–484, eds Cloetingh, S., D’Argenio, B., Cata-
lano, R., Horvath, F. & Sassi, W., Tectonophysics.
Posgay, K. et al., 1996. International deep reflection survey along the Hun-
garian Geotraverse, Geophisical Transactions, 40(1-2), 1–44.
Posgay, K., Bardocz, B., Bodoky, T., Albu, I., Guthy, T., Hegedus, E. &
Takacs, E., 1997. An approximate determination of the spatial position
of deep shear zones of the Hodmezovasarhely-Mako Graben and of the
Bekes Basin (in Hungarian with English abstract), Magyar Geofizika,38(2), 95–123.
Posgay, K., Nagymarosy, A., Papa, A., Hegedus, E. & D.Lorincz, K., 2000.
Deep structure of the Szolnok Flysch Belt, Geophysical Transactions,43(2), 71–91.
Posgay, K., Papa, A., Fancsik, T., Bodoky, T., Hegedus, E. & Takacs, E.,
2001. Metamorphic and rheologic effects shown by seismic data in the
Carpathian Basin, Acta Geologica Hungarica, 44(2-3), 113–134.
Ranalli, G., 1995. Rheology of the Earth, Chapman & Hall, London, Glas-
gow, Weinheim, New York, Tokyo, Melbourne, Madras.
Ranalli, G. & Murphy, D.C., 1987. Rheological stratification of the litho-
sphere, Tectonophysics, 132, 281–295.
Raner, G., Nemesi, L., Csorgei, J., Hegedus, E., Konya, A., Kummer, I. &
Varga, G., 1979. Geophysical studies on regional basic profiles, AnnualReport of the Eotvos Lorand Geophysical Institute of Hungary 1978, 31–
35.
Redlerne-Tatrai, M. & Varga, G., 2001. Newer data on deep-structure of
the Transdanubian Central Range (in Hungarian with English abstract),
Magyar Geofizika, 42(1), 22–35.
Reston, T.J., 1988. Evidence for shear zones in the lower crust offshore
Britain, Tectonics, 7, 929–945.
Ross, G.M. & Eaton, D.W., 1997. Winagami reflection sequence: seismic
evidence for postcollisional magmatism in the Proterozoic of western
Canada, Geology, 25, 199–202.
Salisbury, M.H., Harvey, C.W. & Matthews, L., 2003. The acoustic proper-
ties of ores and host rocks, in Hardrock seismic exploration, pp. 9–19, eds
Eaton, D.W., Milkereit, B. & Salisbury, M.H., Soc. Exploration Geophys.
Publ.
Scholz, C.H., 1988. The brittle-plastic transition and depth of seismic fault-
ing, Geol. Rundschau, 77(1), 319–328.
Schubert, F. & M. Toth, T., 2003. successive, isothermal hydrocarbon mi-
gration events recorded by fluid inclusions in fracture-filling quartz of
the Szeghalom dome (SE Hungary), Acta Mineralogica-Petrographica,Szeged, 44, 9–17.
Schulze, K.C., Kumpel, H.J. & Huenges, E., 2000. In situ petrohydraulic
parameters from tidal and barometric analysis of fluid level variations in
deep wells: some results from KTB, in Hydrogeology of Crystalline Rockspp. 141–175, eds Stober, I. & Bucher, K., Kluwer Academic Publishers,
Dordrecht.
Sibson, R.H., 1974. Frictional constraints on thrust, wrench and normal
faults, Nature, 249, 542–544.
Smithson, S.B., 1986. A physical model of the lower crust from North Amer-
ica based on seismic reflection data, in The nature of the lower continatalcrust, Vol. 24, pp. 23–34, eds Dawson, J.B., Carswell, D.A., Hall, J. &
Wedepohl K.H., Geol. Soc. London, Spec. Publ.
Stegena, L. & Dovenyi, P., 1983. Procedure to correct temperatures and
temperature gradients for geological effects, Zentralblatt fur Geologieund Palaontologie, Teil I. 4, 112, 25–34.
Stober, I. & Bucher, K., 2004. Fluid sinks within the earth’s crust, Geofluids,4, 143–151.
Strehlau, J. & Meissner, R., 1987. Estimation of crustal viscosities and shear
stresses from an extraploration of experimental steady state data, in Com-position, Structure and Dynamics of the Lithosphere-Asthenosphere Sys-tem, Vol. 16, pp. 69–87, eds Fuchs K. & Froidevaux, C., Geodynamics
Series, AGU.
Takacs, E. & Hajnal, Z., 2000. Amplitude Versus Offset case study on the
Moho, Geophysical Transactions, 43(2), 93–111.
Tari, G., Horvath, F. & Rumpler, J., 1992. Styles of extension in the Pannonian
Basin. Tectonophysics, 208, 203–219.
Tari, G., Dovenyi, P., Dunkl, I., Horvath, F., Lenkey, L., Stefanescu, M.,
Szafian, P., Toth, T., 1999. Lithospheric structure of the Pannonian basin
derived from seismic, gravity and geothermal data, In The Mediteter-ranean Basins: Tertiary Extension within the Alpine Orogen, Vol. 156,
pp. 215–250, eds Durand, B., Jolivet, L., Horvath, F. & Seranne, M., Ge-
ological Society, London, Spec. Publ.
Vincent, M.W. & Ehlig, P.L., 1988. Laumontite mineralization in rocks ex-
posed North of San Andreas Fault at Cajon Pass, Southern California,
Geophys. Res. Lett., 15(9), 977–980.
Warner, M., 1990. Basalts, water, or shear zones in the lower continental
crust? in Seismic probing of continets and their margins, Vol. 173, pp.
163–174, eds Leven, J.H., Finlayson, D.M., Wright, C., Dooley, J.C. &
Kennett, B.L., Tectonophysics.
Zelt, C.A. & Barton, P.J., 1998. Three-dimensional seismic refraction to-
mography: a comparison of two methods applied to data from the Faeroe
basin, J. geophys. Res., 103, 7187–7210.
C© 2006 The Authors, GJI, 167, 187–203
Journal compilation C© 2006 RAS
Related Documents