Interpretation of recent Antarctic sea ice variability Jiping Liu, 1 Judith A. Curry, 1 and Douglas G. Martinson 2 Received 29 September 2003; accepted 29 December 2003; published 22 January 2004. [1] Trends in the satellite-derived Antarctic sea ice concentrations (1979–2002) show pronounced increase (decrease) in the central Pacific sector (Bellingshausen/ western Weddell sector) by 4–10% per decade. Confidence levels for these regional trends exceed 95%. Positive polarities of the Antarctic Oscillation (AAO) lead to more (less) ice in the eastern Ross/Amundsen sector (Bellingshausen/northern Weddell sector), which are qualitatively opposite to the impacts of positive polarities of the El Nin ˜o-Southern Oscillation (ENSO). The mechanisms responsible for the covariability between the ice and the (a) AAO and (b) ENSO are demonstrated. Over the last 24 years, a positive AAO trend and a slightly negative ENSO trend produce a spatial pattern of ice changes similar to the regional ice trends. However, the magnitude of the ice changes associated with the AAO and ENSO is much smaller than the regional ice trends. More local (or less understood large) scale processes should be investigated for the explanations. INDEX TERMS: 4215 Oceanography: General: Climate and interannual variability (3309); 3319 Meteorology and Atmospheric Dynamics: General circulation; 3339 Meteorology and Atmospheric Dynamics: Ocean/atmosphere interactions (0312, 4504). Citation: Liu, J., J. A. Curry, and D. G. Martinson (2004), Interpretation of recent Antarctic sea ice variability, Geophys. Res. Lett., 31, L02205, doi:10.1029/2003GL018732. 1. Introduction and Questions [2] Hypotheses, models and observations suggest that the Antarctic sea ice plays an important role in the state and variability of regional and global climate through the ice albedo feedback, insulating effect, deep water formation and fresh water budget [e.g., Fletcher, 1969; Walsh, 1983; Curry et al., 1995; Rind et al., 1995]. In the context of greenhouse warming, there are two classic views on Antarctic sea ice changes: (1) sea ice cover would decrease with warmer surface temperature, and (2) sea ice cover would increase with warmer climate. The latter viewpoint assumes that increased precipitation with warmer atmosphere in the Antarctic would result in more snowfall on sea ice (which enhances the positive ice-albedo feedback) and lower salin- ity in the surface ocean layer (which reduces the contribu- tion of heat from the relatively warm deep water into the surface layer). [3] Undoubtedly, as a sensitive indicator of global climate change, a detailed understanding of the nature and causes of recent Antarctic sea ice variability is necessary. [4] Sea ice concentrations retrieved from the scanning multichannel microwave radiometer (SMMR) on the Nim- bus 7 satellite and the spatial sensor microwave/imager (SSMI) on several defense meteorological satellites provide so far the longest, quality-controlled record for studying the intraseasonal, interannual and even decadal Antarctic sea ice variability. Using the above ice data from 1979 to 1996 (1998), Cavalieri et al. [1997] and Zwally et al. [2002] reported that the total Antarctic sea ice extent and area increased by 14,300 km 2 /yr and 13,800 km 2 /yr (11,180 km 2 /yr and 10,860 km 2 /yr). Regionally, the trends are positive in the Pacific Ocean, Ross and Weddell Seas and negative in the Indian Ocean, Bellingshausen and Amundsen Seas. However, the ice data used in these studies is inadequate for covering one full, and potentially impor- tant, solar cycle (22 years). Additionally, because these time series are relatively short, a single unusual year might substantially affect the estimated trends as well. For exam- ple, Cavalieri and Parkinson [2003] recently showed that the Antarctic sea ice extent decreased dramatically over 1973 – 1977, before gradually increased from 1977 to 2002. However, there is a concern about the quality of the satellite-derived ice data prior to 1979, and they did not discuss regional ice trends. Do these ice trends (total and regional) persist in the longer quality-controlled satellite- based ice record (1979 – 2002)? [5] During the last two decades, a pronounced warming in the eastern Pacific sector of the Antarctic has occurred, in contrast to a cooling at plateau of East and West Antarctica [e.g., Comiso, 2000]. The signatures of atmospheric tele- connections (i.e., El Nin ˜o-Southern Oscillation (ENSO), Antarctic Oscillation (AAO), Semi-Annual Oscillation, Pa- cific-South American Pattern) involving in the Antarctic have been revealed in many studies [e.g., Jacobs and Comiso, 1997; Bromwich et al., 2000; Thompson and Wallace, 2000; Kwok and Comiso, 2002; see Carleton, 2003 for a review]. Clearly, the control of the Antarctic sea ice trends is determined by the interactions of physical processes at a variety of spatial and temporal scales. This paper investigates the extent to which the relatively well- understood large scale phenomena: AAO and ENSO can account for the recent Antarctic sea ice variability. 2. Data Sets [ 6] The monthly Antarctic sea ice concentrations retrieved from the SMMR/SSMI over the period 1979– 2002 [based on a bootstrap algorithm, see Zwally et al., 2002] were used in this study. The monthly Antarctic sea ice drifts derived from the SMMR/SSMI over 1979–2000 [W. Emery et al., personal communication, 2001], and the GEOPHYSICAL RESEARCH LETTERS, VOL. 31, L02205, doi:10.1029/2003GL018732, 2004 1 School of Earth and Atmospheric Sciences, Georgia Institute of Technology, Atlanta, Georgia, USA. 2 Lamont-Doherty Earth Observatory of Columbia University, Palisades, New York, USA. Copyright 2004 by the American Geophysical Union. 0094-8276/04/2003GL018732$05.00 L02205 1 of 4

Welcome message from author
This document is posted to help you gain knowledge. Please leave a comment to let me know what you think about it! Share it to your friends and learn new things together.
Transcript
Interpretation of recent Antarctic sea ice variability
Jiping Liu,1 Judith A. Curry,1 and Douglas G. Martinson2
Received 29 September 2003; accepted 29 December 2003; published 22 January 2004.
[1] Trends in the satellite-derived Antarctic sea iceconcentrations (1979–2002) show pronounced increase(decrease) in the central Pacific sector (Bellingshausen/western Weddell sector) by �4–10% per decade.Confidence levels for these regional trends exceed 95%.Positive polarities of the Antarctic Oscillation (AAO) leadto more (less) ice in the eastern Ross/Amundsen sector(Bellingshausen/northern Weddell sector), which arequalitatively opposite to the impacts of positive polaritiesof the El Nino-Southern Oscillation (ENSO). Themechanisms responsible for the covariability between theice and the (a) AAO and (b) ENSO are demonstrated. Overthe last 24 years, a positive AAO trend and a slightlynegative ENSO trend produce a spatial pattern of icechanges similar to the regional ice trends. However, themagnitude of the ice changes associated with the AAO andENSO is much smaller than the regional ice trends. Morelocal (or less understood large) scale processes should beinvestigated for the explanations. INDEX TERMS: 4215
Oceanography: General: Climate and interannual variability
(3309); 3319 Meteorology and Atmospheric Dynamics: General
circulation; 3339 Meteorology and Atmospheric Dynamics:
Ocean/atmosphere interactions (0312, 4504). Citation: Liu, J.,
J. A. Curry, and D. G. Martinson (2004), Interpretation of recent
Antarctic sea ice variability, Geophys. Res. Lett., 31, L02205,
doi:10.1029/2003GL018732.
1. Introduction and Questions
[2] Hypotheses, models and observations suggest that theAntarctic sea ice plays an important role in the state andvariability of regional and global climate through the icealbedo feedback, insulating effect, deep water formation andfresh water budget [e.g., Fletcher, 1969;Walsh, 1983; Curryet al., 1995; Rind et al., 1995]. In the context of greenhousewarming, there are two classic views on Antarctic sea icechanges: (1) sea ice cover would decrease with warmersurface temperature, and (2) sea ice cover would increasewith warmer climate. The latter viewpoint assumes thatincreased precipitation with warmer atmosphere in theAntarctic would result in more snowfall on sea ice (whichenhances the positive ice-albedo feedback) and lower salin-ity in the surface ocean layer (which reduces the contribu-tion of heat from the relatively warm deep water into thesurface layer).
[3] Undoubtedly, as a sensitive indicator of globalclimate change, a detailed understanding of the nature andcauses of recent Antarctic sea ice variability is necessary.[4] Sea ice concentrations retrieved from the scanning
multichannel microwave radiometer (SMMR) on the Nim-bus 7 satellite and the spatial sensor microwave/imager(SSMI) on several defense meteorological satellites provideso far the longest, quality-controlled record for studying theintraseasonal, interannual and even decadal Antarctic seaice variability. Using the above ice data from 1979 to 1996(1998), Cavalieri et al. [1997] and Zwally et al. [2002]reported that the total Antarctic sea ice extent and areaincreased by �14,300 km2/yr and �13,800 km2/yr(�11,180 km2/yr and �10,860 km2/yr). Regionally, thetrends are positive in the Pacific Ocean, Ross and WeddellSeas and negative in the Indian Ocean, Bellingshausen andAmundsen Seas. However, the ice data used in these studiesis inadequate for covering one full, and potentially impor-tant, solar cycle (�22 years). Additionally, because thesetime series are relatively short, a single unusual year mightsubstantially affect the estimated trends as well. For exam-ple, Cavalieri and Parkinson [2003] recently showed thatthe Antarctic sea ice extent decreased dramatically over1973–1977, before gradually increased from 1977 to 2002.However, there is a concern about the quality of thesatellite-derived ice data prior to 1979, and they did notdiscuss regional ice trends. Do these ice trends (total andregional) persist in the longer quality-controlled satellite-based ice record (1979–2002)?[5] During the last two decades, a pronounced warming
in the eastern Pacific sector of the Antarctic has occurred, incontrast to a cooling at plateau of East and West Antarctica[e.g., Comiso, 2000]. The signatures of atmospheric tele-connections (i.e., El Nino-Southern Oscillation (ENSO),Antarctic Oscillation (AAO), Semi-Annual Oscillation, Pa-cific-South American Pattern) involving in the Antarctichave been revealed in many studies [e.g., Jacobs andComiso, 1997; Bromwich et al., 2000; Thompson andWallace, 2000; Kwok and Comiso, 2002; see Carleton,2003 for a review]. Clearly, the control of the Antarcticsea ice trends is determined by the interactions of physicalprocesses at a variety of spatial and temporal scales. Thispaper investigates the extent to which the relatively well-understood large scale phenomena: AAO and ENSO canaccount for the recent Antarctic sea ice variability.
2. Data Sets
[6] The monthly Antarctic sea ice concentrationsretrieved from the SMMR/SSMI over the period 1979–2002 [based on a bootstrap algorithm, see Zwally et al.,2002] were used in this study. The monthly Antarctic sea icedrifts derived from the SMMR/SSMI over 1979–2000[W. Emery et al., personal communication, 2001], and the
GEOPHYSICAL RESEARCH LETTERS, VOL. 31, L02205, doi:10.1029/2003GL018732, 2004
1School of Earth and Atmospheric Sciences, Georgia Institute ofTechnology, Atlanta, Georgia, USA.
2Lamont-Doherty Earth Observatory of Columbia University, Palisades,New York, USA.
Copyright 2004 by the American Geophysical Union.0094-8276/04/2003GL018732$05.00
L02205 1 of 4
monthly mean 850 hpa geopotential height (GPH), airtemperature at 2 m (T), surface zonal (U) and meridional(V) winds south of 45�S from the National Centers forEnvironmental Prediction (NCEP) reanalysis over 1979–2002 were also used to facilitate the analysis. This period(1979–2002) covers one full solar cycle, different stages ofthe AAO, and several ENSO events.
3. Results
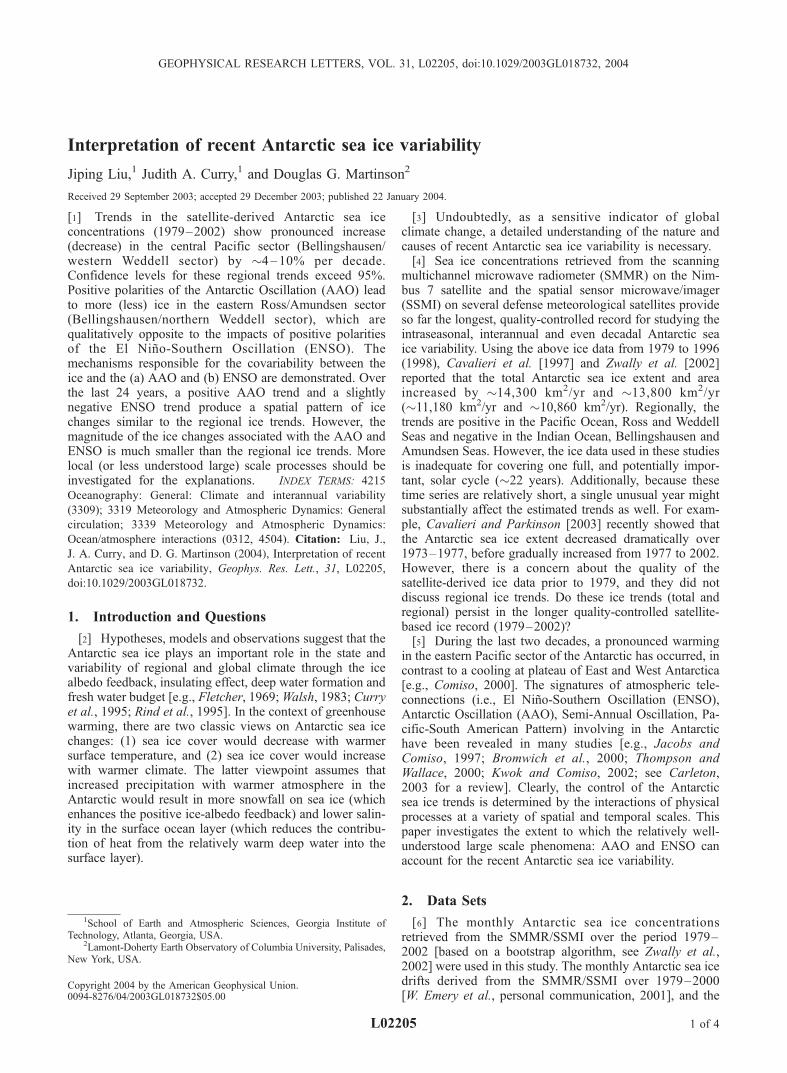
[7] A linear least-squares fit regression was applied toboth the total Antarctic sea ice extent and area, and theAntarctic sea ice concentration anomaly time series (afterremoving the seasonal cycle) in each grid cell over 1979–2002 to capture the trends. Overall, the total Antarctic seaice extent (the cumulative area of grid boxes covering atleast 15% ice concentrations) has shown an increasing trend(�4,801 km2/yr). This is smaller than previous studies havesuggested, and is not statistically significant. However, thetotal Antarctic sea ice area (the cumulative area of the oceanactually covered by at least 15% ice concentrations) hasincreased significantly by �13,295 km2/yr, exceeding the95% confidence level. The upward trends in the total iceextent and area are robust for different cutoffs of 15, 20, and30% ice concentrations (used to define the ice extent andarea). Regionally, as shown in Figure 1a, the Antarctic seaice has exhibited a pronounced increasing trend in thecentral Pacific sector and a markedly decreasing trend inthe Bellingshausen/western Weddell sector by �4–10% perdecade. Confidence levels for these regional trends exceed95% [Weatherhead et al., 1998]. The maximum positivetrend (+9.6% per decade, mark P in Figure 1a) arises fromthe trends in autumn (+15.8%), winter (+6.7%) and spring(+13.6%), since the ice is reduced to the continents insummer. By contrast, the maximum negative trend(�14.3% per decade, mark N in Figure 1a) arises fromthe trends in summer (�29%), autumn (�18.1%) and spring(�7.5%), since ice cover is almost complete in winter.In addition, the strong out of phase ice trends betweenthe central Pacific sector and the Bellingshausen/westernWeddell sector are persistent in seasonal analyses.[8] Are recent regional ice changes related to well-docu-
mented large-scale processes: the AAO and ENSO?[9] The atmospheric circulation of the southern high
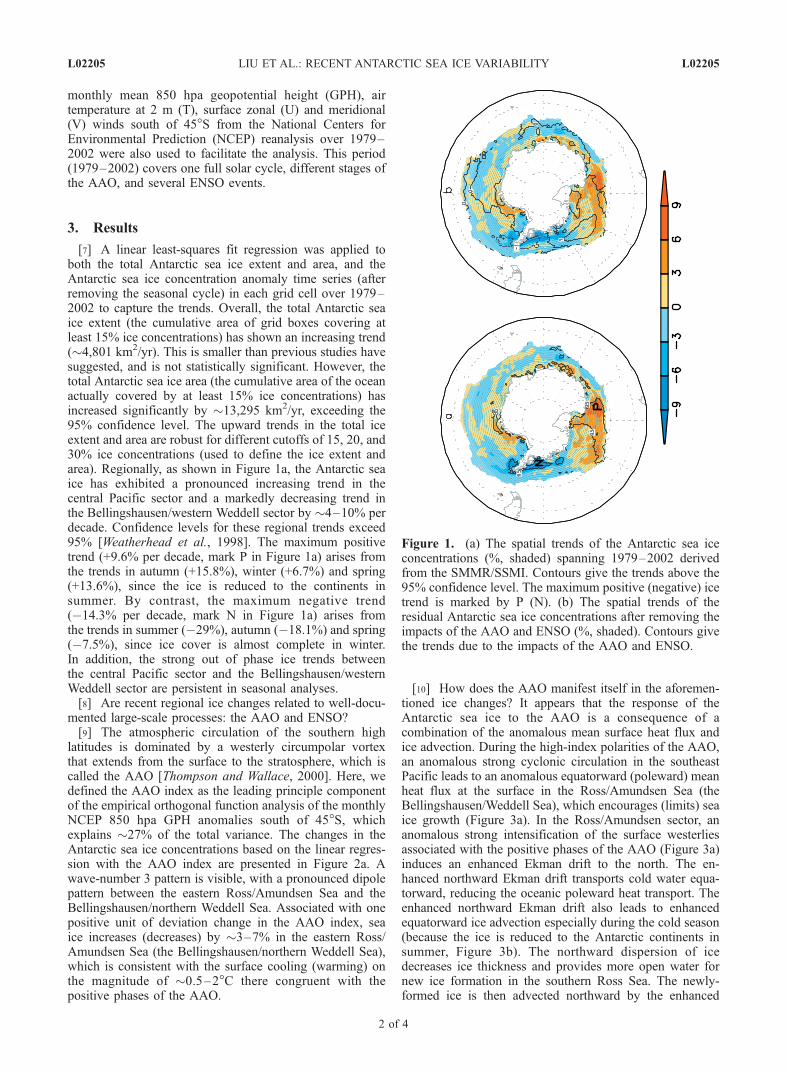
latitudes is dominated by a westerly circumpolar vortexthat extends from the surface to the stratosphere, which iscalled the AAO [Thompson and Wallace, 2000]. Here, wedefined the AAO index as the leading principle componentof the empirical orthogonal function analysis of the monthlyNCEP 850 hpa GPH anomalies south of 45�S, whichexplains �27% of the total variance. The changes in theAntarctic sea ice concentrations based on the linear regres-sion with the AAO index are presented in Figure 2a. Awave-number 3 pattern is visible, with a pronounced dipolepattern between the eastern Ross/Amundsen Sea and theBellingshausen/northern Weddell Sea. Associated with onepositive unit of deviation change in the AAO index, seaice increases (decreases) by �3–7% in the eastern Ross/Amundsen Sea (the Bellingshausen/northern Weddell Sea),which is consistent with the surface cooling (warming) onthe magnitude of �0.5–2�C there congruent with thepositive phases of the AAO.
[10] How does the AAO manifest itself in the aforemen-tioned ice changes? It appears that the response of theAntarctic sea ice to the AAO is a consequence of acombination of the anomalous mean surface heat flux andice advection. During the high-index polarities of the AAO,an anomalous strong cyclonic circulation in the southeastPacific leads to an anomalous equatorward (poleward) meanheat flux at the surface in the Ross/Amundsen Sea (theBellingshausen/Weddell Sea), which encourages (limits) seaice growth (Figure 3a). In the Ross/Amundsen sector, ananomalous strong intensification of the surface westerliesassociated with the positive phases of the AAO (Figure 3a)induces an enhanced Ekman drift to the north. The en-hanced northward Ekman drift transports cold water equa-torward, reducing the oceanic poleward heat transport. Theenhanced northward Ekman drift also leads to enhancedequatorward ice advection especially during the cold season(because the ice is reduced to the Antarctic continents insummer, Figure 3b). The northward dispersion of icedecreases ice thickness and provides more open water fornew ice formation in the southern Ross Sea. The newly-formed ice is then advected northward by the enhanced
Figure 1. (a) The spatial trends of the Antarctic sea iceconcentrations (%, shaded) spanning 1979–2002 derivedfrom the SMMR/SSMI. Contours give the trends above the95% confidence level. The maximum positive (negative) icetrend is marked by P (N). (b) The spatial trends of theresidual Antarctic sea ice concentrations after removing theimpacts of the AAO and ENSO (%, shaded). Contours givethe trends due to the impacts of the AAO and ENSO.
L02205 LIU ET AL.: RECENT ANTARCTIC SEA ICE VARIABILITY L02205
2 of 4
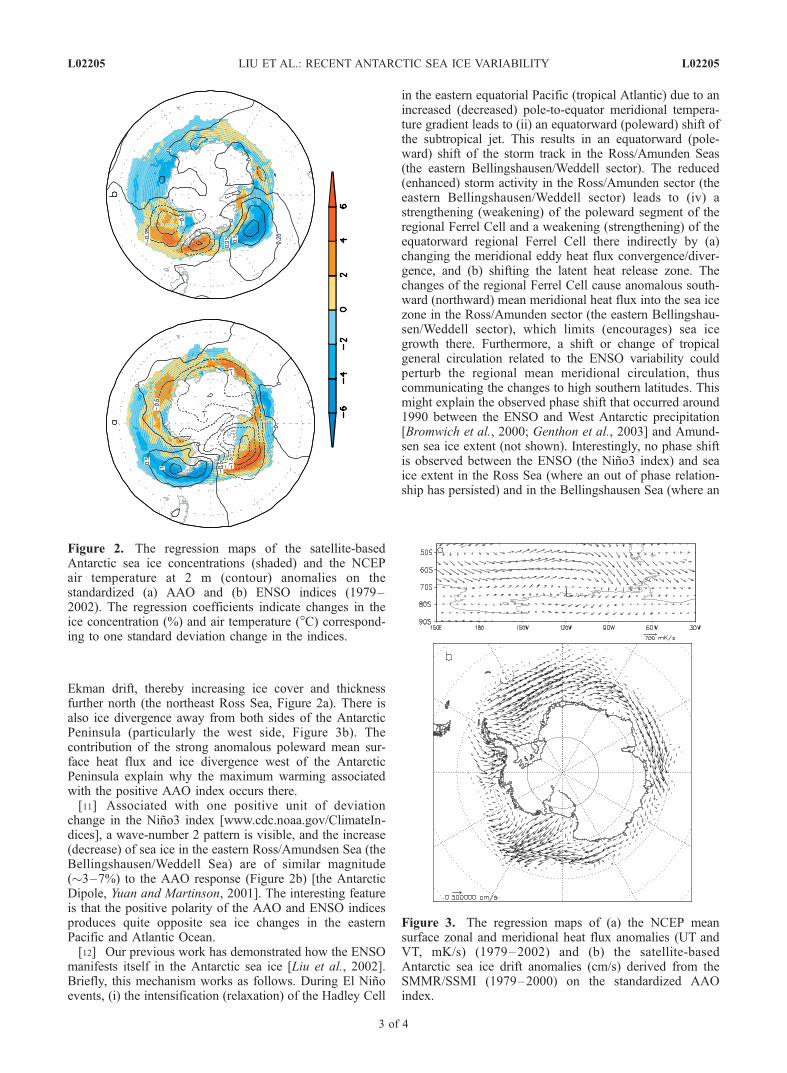
Ekman drift, thereby increasing ice cover and thicknessfurther north (the northeast Ross Sea, Figure 2a). There isalso ice divergence away from both sides of the AntarcticPeninsula (particularly the west side, Figure 3b). Thecontribution of the strong anomalous poleward mean sur-face heat flux and ice divergence west of the AntarcticPeninsula explain why the maximum warming associatedwith the positive AAO index occurs there.[11] Associated with one positive unit of deviation
change in the Nino3 index [www.cdc.noaa.gov/ClimateIn-dices], a wave-number 2 pattern is visible, and the increase(decrease) of sea ice in the eastern Ross/Amundsen Sea (theBellingshausen/Weddell Sea) are of similar magnitude(�3–7%) to the AAO response (Figure 2b) [the AntarcticDipole, Yuan and Martinson, 2001]. The interesting featureis that the positive polarity of the AAO and ENSO indicesproduces quite opposite sea ice changes in the easternPacific and Atlantic Ocean.[12] Our previous work has demonstrated how the ENSO
manifests itself in the Antarctic sea ice [Liu et al., 2002].Briefly, this mechanism works as follows. During El Ninoevents, (i) the intensification (relaxation) of the Hadley Cell
in the eastern equatorial Pacific (tropical Atlantic) due to anincreased (decreased) pole-to-equator meridional tempera-ture gradient leads to (ii) an equatorward (poleward) shift ofthe subtropical jet. This results in an equatorward (pole-ward) shift of the storm track in the Ross/Amunden Seas(the eastern Bellingshausen/Weddell sector). The reduced(enhanced) storm activity in the Ross/Amunden sector (theeastern Bellingshausen/Weddell sector) leads to (iv) astrengthening (weakening) of the poleward segment of theregional Ferrel Cell and a weakening (strengthening) of theequatorward regional Ferrel Cell there indirectly by (a)changing the meridional eddy heat flux convergence/diver-gence, and (b) shifting the latent heat release zone. Thechanges of the regional Ferrel Cell cause anomalous south-ward (northward) mean meridional heat flux into the sea icezone in the Ross/Amunden sector (the eastern Bellingshau-sen/Weddell sector), which limits (encourages) sea icegrowth there. Furthermore, a shift or change of tropicalgeneral circulation related to the ENSO variability couldperturb the regional mean meridional circulation, thuscommunicating the changes to high southern latitudes. Thismight explain the observed phase shift that occurred around1990 between the ENSO and West Antarctic precipitation[Bromwich et al., 2000; Genthon et al., 2003] and Amund-sen sea ice extent (not shown). Interestingly, no phase shiftis observed between the ENSO (the Nino3 index) and seaice extent in the Ross Sea (where an out of phase relation-ship has persisted) and in the Bellingshausen Sea (where an
Figure 2. The regression maps of the satellite-basedAntarctic sea ice concentrations (shaded) and the NCEPair temperature at 2 m (contour) anomalies on thestandardized (a) AAO and (b) ENSO indices (1979–2002). The regression coefficients indicate changes in theice concentration (%) and air temperature (�C) correspond-ing to one standard deviation change in the indices.
Figure 3. The regression maps of (a) the NCEP meansurface zonal and meridional heat flux anomalies (UT andVT, mK/s) (1979–2002) and (b) the satellite-basedAntarctic sea ice drift anomalies (cm/s) derived from theSMMR/SSMI (1979–2000) on the standardized AAOindex.
L02205 LIU ET AL.: RECENT ANTARCTIC SEA ICE VARIABILITY L02205
3 of 4
in phase relationship has continued) [S. Stammerjohn,personal communication, 2003].[13] Therefore, the AAO and ENSO do influence the
Antarctic sea ice greatly. Considering the variations of theAAO and ENSO are seasonal in nature, we also conductedseasonal regression analyses. The aforementioned spatialsignatures based on anomalies for all months in associationwith the AAO and ENSO are robust in the seasonalanalyses, though the magnitude of the responses varies withseasons (not shown). The logical question is whether therecent decadal regional ice trends are due to the AAO andENSO variability. For the last 24 years, the AAO index hasmoved toward high-index polarity; the trend for 1979–2002is 0.18/decade. This indicates a drift toward a spatial patternwith more ice in the eastern Ross/Amundsen sector and lessice in the Bellingshausen/northern Weddell sector. TheNino3 index has a slightly negative trend for 1979–2002(�0.09/decade). Over the 24-year period, the correlationbetween the AAO and ENSO is �0.19, which suggests theweak linear relationship between them. As a first approxi-mation, we can consider the AAO and ENSO as relativelyindependent physical processes.[14] Employing that assumption, we removed the linearly-
regressed impacts of the AAO and ENSO from the originalAntarctic sea ice concentration anomaly time series in eachgrid cell. Trend analysis of the residual Antarctic sea iceconcentration anomaly time series shows a spatial patternextremely similar to the original regional trends (Figure 1b).More specifically, the maximum increasing (decreasing)trend changes from +9.6% and �14.3% (Figure 1a, original)to +9.7% and �12.8% (Figure 1b, residual) respectively.Therefore, the AAO and ENSO can not explain the recentregional Antarctic sea ice trends, though they do influencesea ice dramatically on the intraseasonal (AAO) and inter-annual (AAO and ENSO) time scales, as illustrated by theregression maps.
4. Discussion and Conclusion
[15] To summarize, we have presented an analysis of theincreasing trends in the total Antarctic sea ice extent andarea obtained from the satellite-based sea ice record (1979–2002) that is robust for different ice concentration cut-offsand consistent with previous studies. More specifically, theAntarctic sea ice has increased in the central Pacific sectorand decreased in the Bellingshausen/western Weddell sectorby �4–10% per decade. These regional trends exceed the95% confidence level. Our study also demonstrated themanner in which the Antarctic sea ice changes are related tothe AAO and ENSO. Positive phases of the AAO result inmore (less) ice in the eastern Ross/Amundsen sector (theBellingshausen/northern Weddell sector) by a combinationof the anomalous mean surface heat flux and ice advection.These changes are qualitatively opposite to the signatures ofpositive phases of the ENSO, which modulates the meanmeridional heat flux through the control of the changes inthe regional mean meridional circulation. At decadal timescales, the upward (slightly downward) AAO (ENSO) trendduring 1979–2002 did indeed lead to more (less) ice in theeastern Ross/Amundsen sector (the Bellingshausen/northernWeddell sector) (Figure 1b). However, the AAO and ENSOcannot explain the recent regional ice trends.
[16] Therefore, to understand these trends, we need toconsider less understood large-scale processes such as theSemi-Annual Oscillation, Pacific-South American Pattern[e.g., Carleton, 2003] and the potentially complex nonlinearcoupling among large-scale processes, and local-scale pro-cesses such as katabatic winds. Locally, the meteorology ofthe Ross Sea sector - which shows significantly positive seaice trends - is profoundly influenced by katabatic winds.These winds are driven by the regional topography of theAntarctic ice sheet and adjacent transantarctic mountains,which transport cold air across the Ross ice-shelf andthrough the Ross Sea [Bromwich, 2001]. In order to betterunderstand how sea ice may change as climate warms, weneed to understand how these processes affect sea ice.
[17] Acknowledgments. This research was supported by the NASAglobal modeling and analysis program. We thank two reviewers for theirvaluable comments.
ReferencesBromwich, D. H. (2001), Scientific justification for RIME, The Ross islandmeteorological experiment (RIME), edited by A. J. Monaghan and L. R.Evertt, 1–5.
Bromwich, D. H., A. N. Rogers, P. Kallberg, R. I. Cullather, J. W. C. White,and K. J. Kreutz (2000), ECMWF analyses and reanalyses depiction ofENSO signal in Antarctic precipitation, J. Clim., 13, 1406–1420.
Carleton, A. M. (2003), Atmospheric teleconnections involving the South-ern Ocean, J. Geophys. Res., 108(C4), 8080, doi:10.1029/2000JC000379.
Cavalieri, D. J., and C. L. Parkinson (2003), 30-year satellite record revealscontrasting Arctic and Antarctic decadal sea ice variability, Geophys. Res.Lett., 30(18), 1970, doi:10.1029/2003GL018031.
Cavalieri, D. J., P. Gloersen, C. L. Parkinson, J. C. Comiso, and H. J.Zwally (1997), Observed hemispheric asymmetry in global sea icechanges, Science, 278, 1104–1106.
Comiso, J. C. (2000), Variability and trends in Antarctic surface tempera-tures from in situ and satellite infrared measurements, J. Clim., 13,1674–1696.
Curry, J. A., J. I. Schramm, and E. E. Ebert (1995), Sea ice-albedo climatefeedback mechanism, J. Clim., 8, 240–247.
Fletcher, J. O. (1969), Ice extent in the southern oceans and its relation toworld climate, J. Glaciol., 15, 417–427.
Genthon, C., G. Krinner, and M. Sacchettini (2003), Interannual Antarctictropospheric circulation and precipitation variability, Clim. Dyn., 21,289–307.
Jacobs, S. S., and J. C. Comiso (1997), Climate variability in the Amundsenand Bellingshausen Seas, J. Clim., 10, 697–709.
Kwok, R., and J. C. Comiso (2002), Southern ocean climate and sea iceanomalies associated with the Southern Oscillation, J. Clim., 15, 487–501.
Liu, J., X. Yuan, D. Rind, and D. G. Martinson (2002), Mechanism study ofthe ENSO and southern high latitude climate teleconnections, Geophys.Res. Lett., 29(14), 24-1–24-4, doi:10.1029/2002GL015143.
Rind, D., R. Healy, C. Parkinson, and D. G. Martinson (1995), The role ofsea ice in 2 � CO2 climate model sensitivity. Part I: The total influence ofsea ice thickness and extent, J. Clim., 8, 449–463.
Thompson, D. W., and J. M. Wallace (2000), Annular modes in extratro-pical circulation, Part II: Trends, J. Clim., 13, 1018–1036.
Walsh, J. E. (1983), The role of sea ice in climate variability: Theories andEvidence, Atmosphere-Ocean, 21, 229–242.
Weatherhead, E. C., G. C. Reinsel, G. C. Tiao, X. L. Meng, D. Choi, W. K.Cheang, T. Keller, J. DeLuisi, D. J. Wuebbles, J. B. Kerr, A. J. Miller,S. J. Oltmans, and J. E. Frederick (1998), Factors affecting the detectionof trends: Statistical considerations and applications to environmentaldata, J. Geophys. Res., 103(DD14), 17,149–17,161.
Yuan, X., and D. G. Martinson (2001), The Antarctic Dipole and itspredictability, Geophys. Res. Lett., 28(18), 3609–3612.
Zwally, J. H., J. C. Comiso, C. L. Parkinson, D. J. Cavalieri, and P. Gloersen(2002), Variability of Antarctic sea ice 1979–1998, J. Geophys. Res.,107(C5), 9-1–9-19, doi:10.1029/2000JC000733.
�����������������������J. A. Curry and J. Liu, School of Earth and Atmospheric Sciences,
Georgia Institute of Technology, Atlanta, GA 30332, USA. ( [email protected])D. G. Martinson, Lamont-Doherty Earth Observatory of Columbia
University, Palisades, NY 10964, USA.
L02205 LIU ET AL.: RECENT ANTARCTIC SEA ICE VARIABILITY L02205
4 of 4
Related Documents


![ANTARCTIC TREATY AND ANTARCTIC TERRITORY PROTECTION … · 463 Revista Chilena de Derecho, vol. 40 Nº 2, pp. 461 - 488 [2013] Villamizar Lamus, Fernando “Antarctic treaty and antarctic](https://static.cupdf.com/doc/110x72/5bd437f009d3f209338b8b25/antarctic-treaty-and-antarctic-territory-protection-463-revista-chilena-de-derecho.jpg)