REFRESHER COURSE OUTLINE Slxxvii Kevin K. Tremper, PhDMD Interpretation of non- invasive oxygen and carbon dioxide data The assurance of adequate oxygenation and ventilation is of primary importance when caring for anaesthetized patients. Although subjective signs of these vital func- tions are helpful clinically, it is known that they can be very misleading. ~ With this knowledge approximately 30 years ago, techniques were developed for measuring blood oxygen and CO2 tensions. 2 Over the past ten years, methods have been developed for continuously and noninvasively monitoring 02 and CO2. The following article briefly reviews the physics and physiology in- volved in these monitoring methods and endeavours to provide insight into the interpretation of these data. Oxygenation: oxygen measurement and monitoring Oxygenation is adequate when oxygen is being supplied to the tissues in adequate rates to maintain aerobic metabolism. Since blood is the delivery system which perfuses the tissues, it has been selected as the most reasonable tissue to sample. Hypoxia is defined as inadequate tissue oxygenation. It falls into two basic categories, ischaemic hypoxia, which results from inade- quate blood flow and hypoxaemic hypoxia, which results from inadequate arterial blood oxygenation (decreased arterial oxygen content). The oxygen content of arterial blood can be reduced by three mechanisms: hypoxic hypoxaemia, due to reduced arterial 02 tension (PaO2); anaemic hypoxaemia, due to decreased haemoglobin (Hb); and toxic hypoxaemia, due to decreased arterial haemoglobin saturation (SaO2) caused by increased con- centrations of methaemoglobin (metHb) or carboxy- haemoglobin (COHb). Oxygen measuring devices can be divided into two groups, those which measure oxygen partial pressure (PO2) and those which measure haemo- globin saturation (SO2). Each has been applied to both in vitro blood sample analysis and to in vivo noninvasive monitoring. Transcutaneous PO2 In the blood gas machine, PO2 is measured by an electrochemical cell known as a Clark polarographic electrode. In 1972, it was reported that if a Clark electrode was heated to 44 ~ C and applied to the skin surface of an infant, a continuous PO2 measurement was obtained which closely matched PaO2. Over the past 18 yr this technique, referred to as transcutaneous PO2 monitoring (PtcO2), has been evaluated in various age groups in clinical settings. Although PtcO2 is close to PaO2, in haemodynamically stable infants this is not true for older children or adults. The PtcO2 is the PO2 of heated skin and it changes with age and haemodynamic status. To quantify the relationship between PtcO2 and PaO2 the term transcutaneous 02 index (PtcO2 index = PtcO2/ PaO2) has been proposed. The Table summarizes PtcO2 index values as a function of age group and haemodynam- ic state. 3 PtcO2 has been used most frequently in neonatal intensive care. The lack of clinical acceptance of PtcO2 in adult medicine is due to several technical limitations and the availability of a simpler substitute, pulse oximetry. The limitations of PtcO2 include: calibration prior to use, a ten-minute warm-up time on the skin, the requirement of changing the sensor location at six-hour intervals to prevent skin bums and the potential for halothane interfer- ence. In addition the electrode sensor itself, being a Clark polarographic cell, is a sophisticated nd expensive device which requires maintenance and care to prevent damage. Newer devices diminish some of these limitations by providing push-button room air calibration and thicker teflon membranes on the electrode which nearly eliminate halothane interference. If the electrode temperature is maintained at 44 ~ C or less, the sensor can be left on me skin for up to eight hours in the same location on adults with a very low incidence of injury (none has been noted in our institution in over 20,000 monitored cases). To summarize, PtcO2 is the measurement of oxygen tension at the surface of heated hyperaemic skin. It follows changes in PaO2 when perfusion is adequate and decreases dramatically relative to PaO2 when perfusion becomes impaired. Pulse oximetry The method of measuring oxyhaemoglobin concentration by light absorbance (oximetry) is based on the Beer Lambert Law. This law relates the concentration of a Department of Anesthesiology, University of California, lrvine, 101 The City Drive, Orange, California 92668. CAN J ANAESTH 1990 / 37:4 / ppSlxxvii-Slxxxii

Welcome message from author
This document is posted to help you gain knowledge. Please leave a comment to let me know what you think about it! Share it to your friends and learn new things together.
Transcript

R E F R E S H E R C O U R S E O U T L I N E Slxxvii
Kevin K. Tremper, PhD MD
Interpretation of non- invasive oxygen and carbon dioxide data
The assurance of adequate oxygenation and ventilation is of primary importance when caring for anaesthetized patients. Although subjective signs of these vital func- tions are helpful clinically, it is known that they can be very misleading. ~ With this knowledge approximately 30 years ago, techniques were developed for measuring blood oxygen and CO2 tensions. 2 Over the past ten years, methods have been developed for continuously and noninvasively monitoring 02 and CO2. The following article briefly reviews the physics and physiology in- volved in these monitoring methods and endeavours to provide insight into the interpretation of these data.
Oxygenation: oxygen measurement and monitoring Oxygenation is adequate when oxygen is being supplied to the tissues in adequate rates to maintain aerobic metabolism. Since blood is the delivery system which perfuses the tissues, it has been selected as the most reasonable tissue to sample. Hypoxia is defined as inadequate tissue oxygenation. It falls into two basic categories, ischaemic hypoxia, which results from inade- quate blood flow and hypoxaemic hypoxia, which results from inadequate arterial blood oxygenation (decreased arterial oxygen content). The oxygen content of arterial blood can be reduced by three mechanisms: hypoxic hypoxaemia, due to reduced arterial 02 tension (PaO2); anaemic hypoxaemia, due to decreased haemoglobin (Hb); and toxic hypoxaemia, due to decreased arterial haemoglobin saturation (SaO2) caused by increased con- centrations of methaemoglobin (metHb) or carboxy- haemoglobin (COHb). Oxygen measuring devices can be divided into two groups, those which measure oxygen partial pressure (PO2) and those which measure haemo- globin saturation (SO2). Each has been applied to both in vitro blood sample analysis and to in vivo noninvasive monitoring.
Transcutaneous PO2 In the blood gas machine, PO2 is measured by an electrochemical cell known as a Clark polarographic electrode. In 1972, it was reported that if a Clark electrode was heated to 44 ~ C and applied to the skin surface of an infant, a continuous PO2 measurement was obtained
which closely matched PaO2. Over the past 18 yr this technique, referred to as transcutaneous PO2 monitoring (PtcO2), has been evaluated in various age groups in clinical settings. Although PtcO2 is close to PaO2, in haemodynamically stable infants this is not true for older children or adults. The PtcO2 is the PO2 of heated skin and it changes with age and haemodynamic status. To quantify the relationship between PtcO2 and PaO2 the term transcutaneous 02 index (PtcO2 index = PtcO2/ PaO2) has been proposed. The Table summarizes PtcO2 index values as a function of age group and haemodynam- ic state. 3 PtcO2 has been used most frequently in neonatal intensive care. The lack of clinical acceptance of PtcO2 in adult medicine is due to several technical limitations and the availability of a simpler substitute, pulse oximetry. The limitations of PtcO2 include: calibration prior to use, a ten-minute warm-up time on the skin, the requirement of changing the sensor location at six-hour intervals to prevent skin bums and the potential for halothane interfer- ence. In addition the electrode sensor itself, being a Clark polarographic cell, is a sophisticated nd expensive device which requires maintenance and care to prevent damage. Newer devices diminish some of these limitations by providing push-button room air calibration and thicker teflon membranes on the electrode which nearly eliminate halothane interference. If the electrode temperature is maintained at 44 ~ C or less, the sensor can be left on me skin for up to eight hours in the same location on adults with a very low incidence of injury (none has been noted in our institution in over 20,000 monitored cases). To summarize, PtcO2 is the measurement of oxygen tension at the surface of heated hyperaemic skin. It follows changes in PaO2 when perfusion is adequate and decreases dramatically relative to PaO2 when perfusion becomes impaired.
Pulse oximetry The method of measuring oxyhaemoglobin concentration by light absorbance (oximetry) is based on the Beer Lambert Law. This law relates the concentration of a
Department of Anesthesiology, University of California, lrvine, 101 The City Drive, Orange, California 92668.
CAN J A N A E S T H 1990 / 3 7 : 4 / ppSlxxvii-Slxxxii

Slxxviii
TABLE Changes in PtcOz index with age and cardiac output
Ptc02 Index* (PtcOz/Pa02) Age group
1. I Premature infants 1.0 Newborn 0.84 Paediatric 0.8 Adult 0.7 Older adult (65 yr)
*All these PtcO2 index values have a standard deviation of approx- imately 0. I.
=Ptc02 Indext Cardiac indexL.min -I. rain -2
0.8 >2.2 0.5 1.5 to 2.2 0.1 <1.5
l'These data are from adult patients.
solute in suspension exponentially to the intensity of light transmitted through the solution. Oxyhaemoglobin (HbO2) and reduced haemoglobin (Hb) have different absorbances at different wavelengths, i.e., Hb is blue and HbO2 is red. Laboratory oximeters use this principle to determine haemoglobin saturation by measuring the inten- sity of light transmitted through a cuvette filled with lysed red blood cells. Haemoglobin saturation has been defined as the fraction of oxyhaemoglobin to total haemoglobin:
HbO2 Fractional SaO2 HbO2 + Hb + metHb + COHb
Four wavelengths of light are required to identify the four types of haemoglobin (four equations, four unknowns). Because metHb and COHb do not contribute to functional oxygen transport, another saturation has been defined which ignores them.
HbO2 Functional SaO2 -
HbO2 + Hb
Function SaO2 only requires a two-wavelength oximeter (assuming very little metHb or COHb are present).
Noninvasive ear oximeters were developed in the 1940's and operate on the same light absorption principles but use the tissue between the light source and the light detector as an in vivo "cuvette." These early oximeters were first used in the operating room in the 1950's where the benefits of continuous oxygen monitoring were immediately realized. 4 Unfortunately, due to technical problems these devices did not gain clinical acceptance. Using light transmission through living tissue poses two basic difficulties for an oximeter trying to estimate SaO2. First, there are many light-absorbing tissues between the light source and the light detector other than blood.
CANADIAN JOURNAL OF ANAESTHESIA
100
90
80
,~, 70
~ 6o
~ 5o n 40
3o
20
10
0 0.4 0.6 0.8 1.0 1.2 1.4 1.6 1.8 2.0 2.2 2.4 2.6 2.8 3.0 3.2 3.4
AC~o/DC R = 6eo AC~/DC 94o
FIGURE I A typical pulse oximeter calibration curve. Note that arterial oxygen saturation (SaO2) is estimated from the ratio (R) of the pulse-added red absorbance at 660 nm (ace,~dc~,o) to the pulse-added infrared absorbance at 940 nm (acg~'dc94o). The ratios of red to infrared absorbances vary from approximately 0.4 at 100 per cent saturation to 3.4 at 0 per cent saturation. Note also that the ratio of red to infrared absorbance is 1.0 at a saturation of approxima- tely 85 per cent. Although approximate determinations of this curve can be made on a theoretical basis, accurate predictions of saturation by the pulse oximeter (SpO2) require experimental data. (From Tremper and Barker s with permission.)
Second, there is not only arterial but venous and capillary blood absorbing the light, making it difficult to discrimi- nate the arterial signal. The early oximeters overcame these problems by first compressing the tissue eliminating the blood and using the bloodless tissue as a zero baseline absorbance. They overcame the second problem by heat- ing the ear to 45 ~ C, therefore "arterializing" the blood in the tissue. In the 1980's a new generation of oximeters was developed which did not heat the tissue or require in
vivo calibration. These devices use an ingenious idea. Since the pulsatile absorbance within the tissue bed is due to the arterial blood, analysis of this signal will result in an arterial estimate. These new oximeters were therefore called pulse oximeters (SpO2). 5 These pulse oximeters measure the ratio of the pulsatile absorbance of red light to that of infrared light. 6 This ratio is then empirically calibrated to SaO2 by collecting data drom human volunteers during experimental desaturation. Figure 1 is an example of a pulse oximeter calibration curve. Current devices have small, light-weight sensors which are composed of a red and infrared light-emitting diodes (LED's) for light sources and photo diodes as light detectors. Pulse oximeters have rapidly gained wide clinical acceptance not only in the operating room but throughout critical care areas where patients are at risk of

Tremper: I N T E R P R E T A T I O N OF N O N - I N V A S I V E O X Y G E N AND CARBON D I O X I D E DATA Slxxix
oxygen desaturation. The acceptance has been wide- spread because the devices are relatively inexpensive, require no calibration and have been demonstrated to be accurate for clinical purposes (--- 2 to 3 per cent). 5
As with any other measurement device there are situations which may cause the pulse oximeter to produce erroneous values. These problems fall into two basic areas, signal artifact and light absorption artifact (dyes and dyshaemoglobins). Probably the most difficult prob- lem in pulse oximetry design is the identification of the "ripple" absorbance pattern of the arterial pulse in a "sea" of electro-magnetic artifacts. Artifact has three major sources: ambient light, low perfusion (low signal), and motion (large background noise). All of these result in a poor signal-to-noise ratio. The photodiodes used in the sensor as light detectors cannot discriminate one wave- length of light from another. Therefore the light detector does not know whether it is receiving light which originates from the red LED, the infrared LED or the room lights. This problem is solved by alternating the red and infrared LEDs. The red LED is turned on first, and the photodiode detector produces a current resulting from the red LED transmitted light plus the room lights. Next, the red LED is turned off and the infrared LED is turned on and the photodiode signal represents the infrared LED plus the room lights. Finally, both LED's are turned off and the photodiode generates a signal from the room lights alone. The sequence is repeated hundreds of times per second. In this way, the oximeter tries to eliminate light interference by measuring the signal from the background room lights and subtracting that signal hundreds of times a second. Unfortunately, some fluctuating light sources can cause problems in spite of this clever design. Clinically, ambient light artifact can be minimized by covering the sensor with an opaque shield.
Another engineering problem is that of low pulsatile signal. When a very small pulsatile signal is detected, the pulse oximeter will amplify that signal. In this way the pulse oximeter will attempt to measure saturation over a wide range of pulse amplitudes. Unfortunately, when a weak signal is amplified the background noise is also amplified. At the highest amplifications, the pulse oxim- eter may attempt to analyze the background noise thinking it is a pulsatile signal and calculate a saturation from an amplified noise signal. Since this background noise is usually equally amplified for both the red and infrared signals, the ratio will tend toward one which can be seen in Figure 1 results at a pulse oximeter reading near 85 per cent. A similar problem occurs when there is a very large background noise due to motion of the sensor causing the pulse oximeter to interpret this background noise as a pulsatile signal. Newer pulse oximeters try to allow the user to identify these problems by displaying a waveform
and/or incorporating an automatic cut-off in which the device will no longer attempt to estimate a saturation value. A misunderstanding of this auto gain process within the pulse oximeter has led some users to think that the pulse oximeter is indeed measuring peripheral perfu- sion. The device is indeed measuring a pulse but does not require flow and can amplify the pulse dramatically while attempting to estimate saturation. It has been demonstrat- ed that peripheral blood flow can be decreased to only ten per cent of normal before the pulse oximeter will have difficulty estimating a saturation. 7
Any substance which absorbs light in the red and near infrared range (600 to 1000 nm) and is in the arterial blood of a patient and was not in the arterial blood of the subjects used for the empirical calibration may cause an error in a pulse oximeter reading. The most frequently encountered problems are those due to intravenous dyes and dyshaemo- globins (COHb and metHb). It has been found that an injection of methylene blue, will cause a severe transient (1 to 2 min) decrease in saturation while indocyanine green causes a mild drop and indigo carmine may produce very little decrease in saturation, s Since COHb is red it might be expected that it may be interpreted as oxyhaemo- globin. Indeed, the presence of COHb will cause the pulse oximeter to overread fractional haemoglobin satura- tion and, therefore, cannot be used to detect the presence of COHb in patients suspected with carbon monoxide poisoning.9.,o MetHb absorbs light greatly in both the red and infrared range (it is dark brown in colour). For this reason it is seen as a large pulsatile absorbance in both the red and infrared range. Consequently, if greater than 30 per cent of the blood's haemoglobin is in the metHb form it will cause problems similar to those seen with poor signal-to-noise ratio, i.e., readings tending toward 85 per cent. I I
Since its introduction in the 1980's numerous studies have been conducted confirming the accuracy and clinical utility of pulse oximetry. In clinical practice the pulse oximeter has very few limitations, but there is a limitation to the physiological variable, itself SaOz. Looking at the oxyhaemoglobin dissociation curve one realizes that a pulse oximeter will be unable to detect changes in arterial oxygenation until the PaO2 decreases below 80 mmHg (SaO2 = 97 per cent). Although the device will quickly detect changes in SaO2 there may be change in pulmonary function without desaturation. It has been demonstrated that bronchial intubation may go undetected at inspired oxygen concentrations greater than 40 per cent and that air emboli may cause large acute decreases in PaO2 and PtcO2 without reaching the point of desaturation, t2't3 Nevertheless, the pulse oximeter should prevent any damage due to unrecognized desaturation which is the purpose for which it was designed.
Slxxx CANADIAN JOURNAL OF ANAESTHESIA
Ventilation: CO2 measuring and monitoring Although auscultation and observation can document the presence or absence of ventilation, the adequacy of ventilation is confirmed by a normal arterial carbon dioxide tension (PaCO2). Soon after Leland Clark pre- sented the polarographic oxygen electrode in 1956, John Severinghaus developed the carbon dioxide electrode in 1958. The CO2 electrode is referred to a secondary sensor because it is composed of a pH sensitive glass electrode in an electrolyte cell. Carbon dioxide diffuses through a membrane into the cell, reacts with water producing carbonic acid thereby changing the pH.
Transcutaneous PC02 (PtcC02) PtcCO2 was introduced shortly after PtcO2 in the early 1970's. Since the sensor is placed on the skin and heated, it is reasonable to expect that the CO2 values would be higher than PaCO2. Indeed, the original transcutaneous PtcCO2 values on awake subjects were 60 mmHg. Over the next decade methods were proposed to adjust the PtcCO2 values to estimate the PaCO2 value more closely so that clinicians could interpret the data more easily. The most commonly used correction is that proposed by John Severinghaus which divides the PtcCO2 value by 1.33 and subtracts 3. t4 It has been demonstrated that the Severing- haus adjustment enabled the PtcCO2 to predict the PaCO2 within _+ 10 per cent. ~4,~5 Again, as with PtcO2, PtcCO2 has been most extensively utilized in the care of neonatal patients. Unlike PteO2, PtcCO2 values are relatively insensitive to perfusion changes and do not change significantly with age. For these reasons it is much easier to interpret PtcCO2 values than its oxygen counterpart. The PtcCO2 sensor also requires calibration (in this case a two-point calibration) and maintenance. In this respect both transcutaneous sensors have similar limitations.
Capnometry Capnometry comes from the Greek word "capnos" meaning smoke, carbon dioxide (CO2) being the "smoke" of cellular metabolism. The shape and the physiological significance of the capnogram (expired CO2 waveform) were appreciated as early as 1928, although the clinical application of this knowledge to respiratory monitoring had to wait the development of rapidly responding CO2 analyzers. 16
Capnometers most frequently use infrared detection systems although mass spectrometers and Raman scatter- ing analyzers are also used for this purpose. Infrared devices detect CO2 using the same Beer Lambert Law as is applied in oximetry. Nitrous oxide also absorbs infrared light in the same range as carbon dioxide, therefore devices used in the operating room require a correction factor when nitrous oxide is present. Typically, respira-
tory gas is aspirated from the breathing circuit as close to the patient as possible through a small diameter tube into the infrared analyzer. The capnometers response time will be related to the internal volume of the sampling tubing and the measurement chamber within the device and the sample aspiration rate. The most common sampling rate used is 150 ml.min -~. Slower sampling rates not only produce delayed information but may distort the wave- form due to axial diffusion along the path of tubing. Faster sampling rates may also cause errors by aspirating not only the patient's expired gas but some of the fresh gas from the ventilator circuit. Because patients are expiring gas saturated with water vapour, a common problem with the sampling technique is that water vapour condenses in the capillary tubing. This is usually prevented by a series of water traps, filtres, and water permeable tubing. These aspiration-type capnometers are known as sidestream devices. Another type of infrared analyzer is also avail- able which measures CO2 concentration directly in the airway with an adaptor placed in the respiratory circuit. These devices are referred to as mainstream analyzers because the infrared light detects CO2 directly in the expired gas stream (i.e., the patient is actually breathing through the detector). Because of this direct measurement technique mainstream capnometers have a very fast response time and avoid the problems of clogged tubing, water traps, and sampling error. The disadvantages of mainstream analyzers are primarily the size and weight of the adaptor which must be placed on the tracheal tube and the increased cost of the miniaturized mainstream detector.
To understand capnography, one must have a basic understanding of dead space, t7 Dead space volume (VD) is defined as any part of the tidal volume (VT) which does not participate in CO2 exchange. Therefore, the VT is equal to the Vo plus the alveolar volume (V~l~v).
VT = VD + Val v
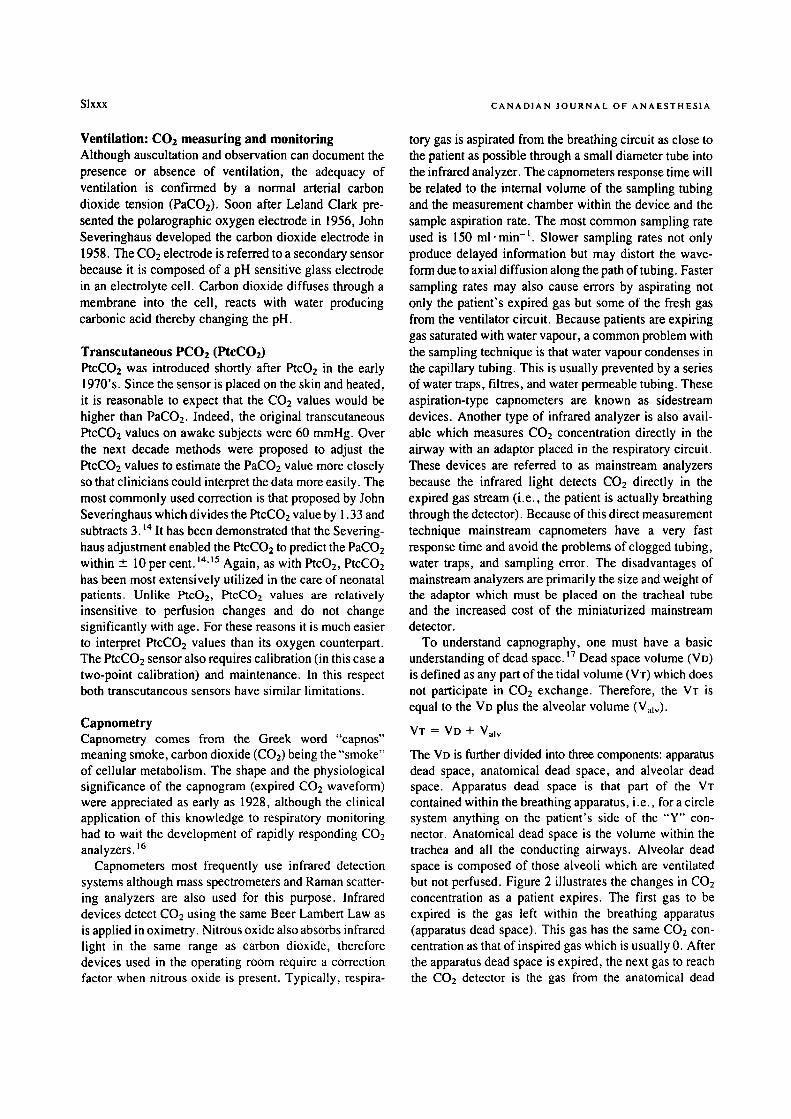
The VD is further divided into three components: apparatus dead space, anatomical dead space, and alveolar dead space. Apparatus dead space is that part of the VT contained within the breathing apparatus, i.e., for a circle system anything on the patient's side of the "Y" con- nector. Anatomical dead space is the volume within the trachea and all the conducting airways. Alveolar dead space is composed of those alveoli which are ventilated but not perfused. Figure 2 illustrates the changes in CO2 concentration as a patient expires. The first gas to be expired is the gas left within the breathing apparatus (apparatus dead space). This gas has the same CO2 con- centration as that of inspired gas which is usually 0. After the apparatus dead space is expired, the next gas to reach the CO2 detector is the gas from the anatomical dead
Tremper: INTERPRE T AT ION OF NON-INVASIVE OXYGEN AND CARBON DIOXIDE DATA Slxxxi
Apparalus dead space
Pulmonar~ artery
Pulmonat'r vein
FIGURE 2 This figure schematically illustrates the origins of apparatus, anatomical, and alveolar dead spaces and how they effect the capnogram. The apparatus and anatomical dead spaces are expired sequentially at the beginning of expiration and are referred to as series dead space. When alveolar gas reaches the detector there is an abrupt rise to a plateau. Note that this plateau is composed of gas from the alveolar dead space (non-perfused alveoli), and the ideal alveolar gas (well peffused alveoli), the proportions of which will produce the resultant alveolar plateau value of the capnogram. (Reprinted with permission from Reference 17,)
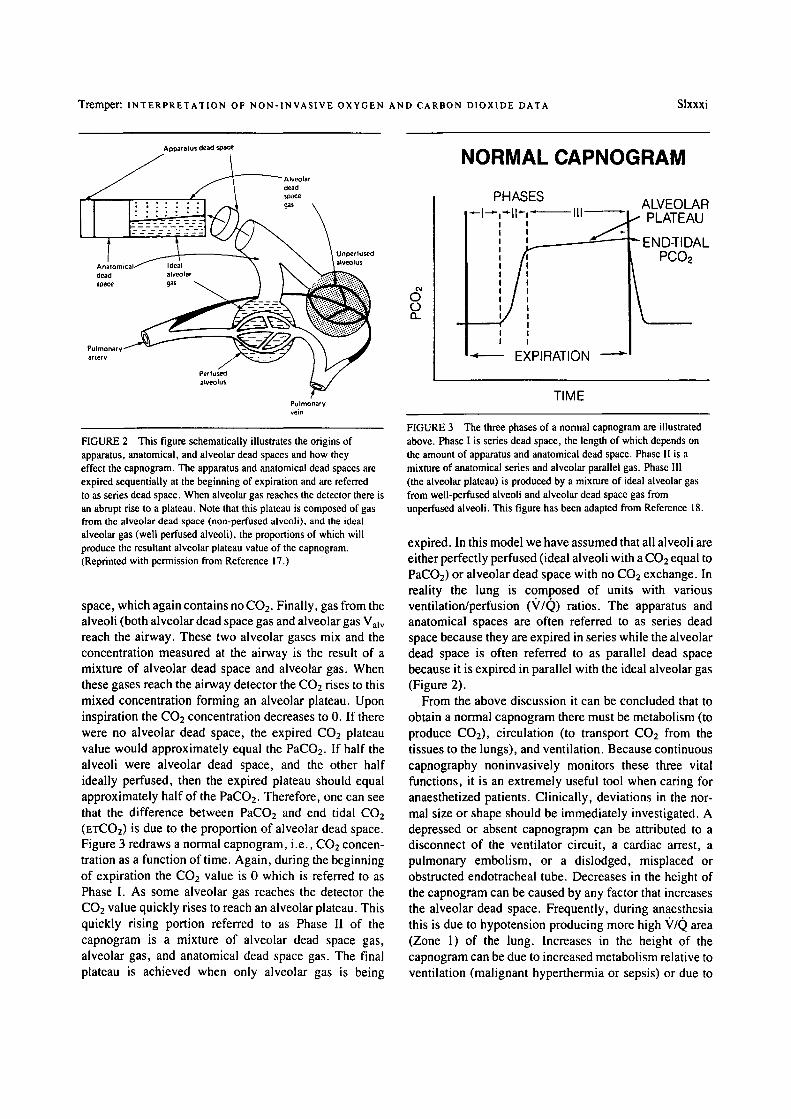
space, which again contains no CO2. Finally, gas from the alveoli (both alveolar dead space gas and alveolar gas Valv reach the airway. These two alveolar gases mix and the concentration measured at the airway is the result of a mixture of alveolar dead space and alveolar gas. When these gases reach the airway detector the CO2 rises to this mixed concentration forming an alveolar plateau. Upon inspiration the CO2 concentration decreases to 0. If there were no alveolar dead space, the expired CO2 plateau value would approximately equal the PaCO2. If half the alveoli were alveolar dead space, and the other half ideally perfused, then the expired plateau should equal approximately half of the PaCO2. Therefore, one can see that the difference between PaCO2 and end tidal CO2 (ETCO2) is due to the proportion of alveolar dead space. Figure 3 redraws a normal capnogram, i.e., CO2 concen- tration as a function of time. Again, during the beginning of expiration the CO2 value is 0 which is referred to as Phase I. As some alveolar gas reaches the detector the CO2 value quickly rises to reach an alveolar plateau. This quickly rising portion referred to as Phase II of the capnogram is a mixture of alveolar dead space gas, alveolar gas, and anatomical dead space gas. The final plateau is achieved when only alveolar gas is being
O O..
NORMAL CAPNOGRAM
PHASES ~l--.-,-.-ll ~, �9
I I t
I t
"~ EXPIRATION
ALVEOLAR ..- PLATEAU
"" END-TIDAL PCO2
\
TIME
FIGURE 3 The three phases of a normal capnogram are illustrated above. Phase I is series dead space, the length of which depends on the amount of apparatus and anatomical dead space. Phase II is a mixture of anatomical series and alveolar parallel gas. Phase III (the alveolar plateau) is produced by a mixture of ideal alveolar gas from well-perfused alveoli and alveolar dead space gas from unperfused alveoli. This figure has been adapted from Reference 18.
expired. In this model we have assumed that all alveoli are either perfectly perfused (ideal alveoli with a CO2 equal to PaCO2) or alveolar dead space with no CO2 exchange. In reality the lung is composed of units with various ventilation/perfusion (V/Q) ratios. The apparatus and anatomical spaces are often referred to as series dead space because they are expired in series while the alveolar dead space is often referred to as parallel dead space because it is expired in parallel with the ideal alveolar gas (Figure 2).
From the above discussion it can be concluded that to obtain a normal capnogram there must be metabolism (to produce CO2), circulation (to transport CO2 from the tissues to the lungs), and ventilation. Because continuous capnography noninvasively monitors these three vital functions, it is an extremely useful tool when caring for anaesthetized patients. Clinically, deviations in the nor- mal size or shape should be immediately investigated. A depressed or absent capnograpm can be attributed to a disconnect of the ventilator circuit, a cardiac arrest, a pulmonary embolism, or a dislodged, misplaced or obstructed endotracheal tube. Decreases in the height of the capnogram can be caused by any factor that increases the alveolar dead space. Frequently, during anaesthesia this is due to hypotension producing more high ~//0 area (Zone 1) of the lung. Increases in the height of the capnogram can be due to increased metabolism relative to ventilation (malignant hyperthermia or sepsis) or due to

Slxxxii CANADIAN JOURNAL OF ANAESTHESIA
CO2 being added to the circulation (bicarbonate injection, CO2 laparoscopy, or release of a tourniquet). CO2 rebreathing is noted by a non-zero baseline during the inspiratory phase. Because capnometers detect serious potential airway and circulatory complications on a breath to breath basis, they have become a standard of care.
Conclusion Currently there are four clinical techniques for continously noninvasively monitoring oxygen and carbon dioxide: SpO2 and PtcO2 for oxygen monitoring and ExCO2 and PtcCO2 for carbon dioxide monitoring. Oximetry and capnography use light absorption techniques whereas transcutaneous monitors use the same electrochemical sensors developed for use in blood gas machines non- invasively applied to the skin's surface. Pulse oximetry and PtcCO2 have been "calibrated" such that the data they provide accurately predicts the corresponding arterial blood values. On the other hand, ETCO2 and PtcO2 present different CO2 and 02 data than that provided by blood gases. The capnogram and its ETCO2 value provide extremely valuable data regarding perfusion and ventila- tion of the lung. The ETCO2 approaches the PaCO2 value as alveolar dead space approaches zero. PtcO2 values provide useful information regarding peripheral oxygena- tion and approach predictable relationships with the PaO2 as a function of age. As peripheral perfusion decreases, PtcO2 decreases as perfusion to the skin diminishes. ETCO2 and PtcO2 values are similar in that they provide useful continuous information, but when their values decrease the added information of an arterial blood gas sample may aid in the diagnosis of the cause of the problem. Clinically, the optical techniques (pulse oxi- metry and capnography) have the advantage that they require little or no calibration and essentially no "warm- up time" when applied to the patient. In the clinical setting these advantages have allowed for their widespread application. PtcO2 and PtcCO2 on the other hand require significant electrode maintenance, routine calibration, and a five- to ten-minute warm-up time on the patient's skin surface prior to providing useful data. Nevertheless there are some clinical situations where transcutaneous values maybe extremely useful. Whatever the clinical setting, continuous noninvasive monitoring of oxygena- tion and ventilation is routinely available and these techniques may allow for more judicious use of invasive sampling and monitoring techniques.
References 1 Comroe JH Jr, Botelho S. The reliability of cyanosis in the
recognition of arterial anoxemia. Am J Med Sci 1947; 214: I-6.
2 Severinghaus JW, Astrup PB. Boston: Little, Brown & Company, vol. 25, no. 4, 1987.
3 Tremper KK. Transcutaneous PO2 measurement. Can J Anaesth 1984; 3 I: 664-77.
4 Stephen CR, Slater HM, Johnson AL, Sekeji P. The oximeter - a technical aid for the anesthesiologist. Anesthesiology 1951; 12: 541-55.
5 Tremper KK, Barker SJ. Pulse oximetry. Anesthesiology 1989; 70: 98-108.
6 Pologe JA. Pulse oximetry: technical aspects of machine design. International Anesthesiology Clinics 1987; 25: 137-53.
7 Lawson D, Norley !, Korbon G, Lobe R, Ellis J. Blood flow limits and pulse oximeter signal detection. Anes- thesiology 1987; 67: 599-603.
8 Scheller MS, Unger R J, Kelner MJ. Effects of intrave- nously administered dyes on pulse oximeter readings. Anesthesiology 1986; 65: 550-2.
9 Raemer DB, Elliott WR, Topulos GP, Philip JH. The theoretical effect of carboxyhemoglobin on the pulse oximeter. J Clin Monit 1989; 5: 246-9.
10 Barker SJ, Tremper KK. The effect of carbon monoxide inhalation on pulse oximeter signal detection. Anesthe- siology 1987; 67: 599-603.
11 Barker S J, Tremper KK, Hyatt J. Effects of methemoglo- binemia on pulse oximetry and mixed venous oximetry. Anesthesiology 1989; 70:112-7.
12 Barker S J, Tremper KK, Heitzmann H. Comparison of three oxygen monitors in detecting endobronehial intubation. J Clin Monit 1988; 4: 240-3.
13 Glenski JA, Kucchiara RF. Transcutaneous 02 and CO2 monitoring of neurosurgical patients: detection of air emboli. Anesthesiology 1986; 64: 546-50.
14 Severinghaus JW, Stafford M, Bradley AF. tcPCO2 elec- trode design calibration and temperature gradient prob- lem. Acta Anaesthesiol Scand 1978 suppl; 68: 118-22.
15 Palmirano B, Severinghaus JW. Transcutaneous PcO2 and 1:'O2: a multicenter study of accuracy. J Clin Monit 1990; in press.
16 Ward SA. The capnogram: scope and limitations. Semi- nars in Anesthesia 1987; 6: 216-28.
17 Nunn JF. Applied Respiratory Physiology. 3rd ed., Lon- don: Butterworth's, 1987.
18 Tremper KK. Perioperative Capnometry. Refresher Course for American Society of Anesthesiologists, San Francisco, California, 1988; p. 421.

N O T E S D E C O U R S D E R E V U E SIxxxiii
K.K. Tremper PhD MD
Interpr6tation des mesures non-invasives d'oxyg6ne et de C O 2
L'assurance d'une oxyg6nation et d'une ventilation ad6quate est d'importance primordiale quant il s'agit de s'occuper de patients anesth6si6s. M~me si des signes indicateurs de ces functions sont tr~s utiles en clinique, ont sait qu'ils peuvent 6tre tr~s trompeurs. ~ Ceci a amen6 le d6veloppement il y a 30 ans, de techniques pour mesurer les tensions d'oxyg~ne et de CO2 dans le sang. 2 Au cours des dix derni6res ann6es, certaines m6thodes ont vule jour pour mesurer de fa~on continue et non-invasive I'oxyg~ne et le CO2. L'article suivant revoit bri~vement les aspects physiques et physiologiques de ces m6thodes de mesure et esp~re fournir des 616ments qui permettront de faciliter l'interpr6tation des donn6es.
Oxygenation : mesure de I'oxyg~.ne et surveillance On dit qu'une oxyg6nation est ad6quate lorsque I'oxygc3ne est amen~ en quantit~ suffisante aux tissus pour maintenir un m6tabolisme a6robique. Puisque le sang est le syst~me de livraison d'oxyg~ne aux tissus, il a 6t6 choisi comme materiel d'~chantillonage le plus pertinent. L'hypoxie est d~finie comme une oxygenation tissulaire inad6quate. Elle se partage en deux cat6gorics fondamentales ; d'abord le type isch~mique, qui provient d'une circulation inad6quate et le type hypox~mique, r~sultat d'une oxy- genation insuffisante du sang art~riel (diminution du contenu art~riel en oxyg~ne). Le contenu en oxyg~ne du sang art6riel peut ~tre r~duit par trois m6canismcs: l'hypox6mie hypoxique, dtqe :~ une diminution de la tension art6rielle en oxyg~ne (PaO2); l'hypox~mie an6mique, doe ~t une diminution du taux d'h~moglobine; et l 'hy- pox6mie toxique, provoqu6e par une diminution de saturation art~rielle de I'h6moglobine caus~e par des con- centrations accrues de meth6moglobinc (met-Hb) ou de carboxyh6moglobine (COHb). Les appareils de mesure de I'oxyg~ne peuvent ~tre divis6s en deux groupes, ceux qui mesurent la pression partielle de l'oxyg~ne (PO2), ct ceux qui mesurent la saturation en h6moglobine (SO2). Chacune de ces m6thodes a 6t6 utilis~e pour I'analyse in
vitro de sp6cimens et pour le monitoring non-invasif in vivo.
P02 transcutan6e Dans I'appareil pour gaz art6riels, la P02 est mesur6e par
une cellule 61ectrochimique, l'61ectrode polarographique de Clark. En 1972, on a d6couvert que si une 61ectrode de Clark 6tait chauff6e ~ 44 ~ C et appliqu6e h la surface de la peau d'un enfant, on pouvait obtenir une mesure de la PO2 qui 6tait proche de celle trouv6e dans le sang. Dans les i 8 derni~res ann6es cette technique connue comme monitor- ing de la PO2 transcutan6e (PtcO2), a 6t6 soumise en clinique h une 6valuation pour diff6rents groupes d'~ge. M~me si la PtcO2 est proche de la PaO2 chez les enfants de moins de deux ans h6modynamiquement stables, ce n'est pas aussi vrai pour les enfants plus ~g6s ou les adultes. La PtcO2 est la PO2 de la peau r6chauff6e ; elle change avec l'~tge.et l'6tat h6modynamique. Dans le but de quantifier la relation entre le PtcO2 et ie PaO2, on a propos6 l'index d'oxyg~ne trans-cutan6 (PtcO2 index6 = PtcO2/PaO2). Le Tableau (voir page Slxxviii) resume les valeurs d'index de PtcO2 en function du groupe d':~ge et de l'6tat h6mody- namique. 3 La PtcO2 a surtout 6t6 utilis6e en r6animation n60natale. Son mauvais accueil en m6decine adulte est dO /~ des limitations techniques importantes et ~t la disponibi- lit6 d'un substitut plus simple, I'oxym6trie pulsatile. Les limitations de PtcO2 comprennent : une calibration avant l'utilisation, un temps de r6chauffement de dix minutes sur la peau, la n6cessit6 de changer I'emplacement de la sonde aux six heures pour pr6venir les brOlures de la peau, et un potentiel d'interf6rence par I'halothane. De plus, l'61ectrode elle-m~me, puisqu'elle est une cellule pola- rographique de Clark, est complexe, cofiteuse, demande de l'entretien et beaucoup de soins pour qu'elle ne suit pas endommag6e. De nouveaux appareils diminuent quelques unes de ces restriction en fournissant une calibration l'air par simple pression d'un bouton et des membranes de teflon plus 6paisses sur 1'61ectrode, ce qui diminue :~ peu pros compl~tement l'interf6rence due ~ l'halothane. Si la temp6rature de 1'61ectrode est maintenue h 449 C ou moins, la sonde peut demeurer sur ia peau pour jusqu'~ huit heures au m6me endroit chez les adultes, avec une tr~s faible incidence de dommages (aucun not6 dans notre institution apr~s 20,000 utilisations). En r6sum6 le PtcO2 est la mesure de la tension de I'oxyg~ne :~ la surface de la peau chauff6e, en hyper6mie. La PtcO2 suit le change- ments de la PaO2 quand la perfusion est ad6quate et diminue de faqon dramatique Iorsque la perfussion s'ap- pauvrit de faqon significative.
CAN J ANAESTH 1990 / 37:4 / ppSlxxxfii-Slxxxviii

Slxxxiv C A N A D I A N J O U R N A L OF A N A E S T H E S I A
OxymEtrie pulsatile La mEthode de mesure de concentration de l'oxyhEmo- globine par le biais de l'absorbance de la lumi~re (oxymE- trie) est basEe sur la loi de Beer-Lambert. Cette ioi relie de fad:on exponentielle la concentration d'un solute en suspension :~ l'intensitE de la lumi~re transmise b. travers la solution. L'oxyhEmoglobine (HbO2) et I'hEmoglobine rEduite (Hb) ont diffErentes absorbances h des longueurs d'ondes diffErentes : l'hEmoglobine est bleue et la HbO2 est rouge. Les oxym~tres de laboratoire utilisent ce principe pour determiner la saturation de I'hEmoglobine en mesurant l'intensitE de la lumi~re transmise :~ travers une cuvette remplie de globules rouges hEmolysEs. La saturation de l'hEmoglobine a Et6 dEfinie comme Etant la fraction de l'oxyhEmoglobine par rapport h I'hEmoglo- bine totale :
HbO2 SaO2 -
HbO2 + Hb + metHb + COHb
Quatre longueurs d'ondes sont requises pour identifier les quatre types d'hEmoglobine (quatre Equations, quatre inconnues). Puisque la methEmoglobine et ia carboxy- hEmoglobine ne contribuent pas au transport fonctionnel de I'oxyg~ne, une autre saturation a EtE dEfinie et elle n'en tient pas compte.
HbO~ SaO2 fonctionnelle -
HbO2 + Hb
La saturation fonctionnelle en oxyg~ne exige seule- ment deux longueurs d'ondes (en assumant qu'il y a tr~s peu de methEmoglobine et de carboxyhEmoglobine prEsentes).
L'oxymEtrie non-invasive auriculaire est nee dans les annEes 1940, fonctionne sur le m~me principe d'absorp- tion de lumi~re, mais utilise le tissu entre la source lumineuse et le dEtecteur comme cuvette in vivo. Ces premiers oxym~tres ont d'abord 6tE utilisEs en salle d'opEration dans les annEes 1950 et on a reconnu tr~s vite le bEnEfice de la surveillance continuelle de l'oxyg~ne. 4 Malheureusement, h cause de probl~mes techniques, ces appareils n'ont pas acquis rapidement l'acceptation du c6tr clinique. L'utilisation de la transmission de la lumi~.re h travers le tissu vivant amine deux difficultEs fondamentales pour un oxym~tre qui essaie d'Evaluer la saturation artErielle en oxyg~ne. D'abord il y a plusieurs autres tissus que le sang qui absorbent la lumi~re entre la source lumineuse et le dEtecteur. Deuxi~mement, il y a non seulement du sang art6riel mais du sang veineux et capillaire qui absorbent cette lumi~re, ce qui rend difficile la discrimination du signal artEriel. Les premiers oxym~- tres ont surmontE ces probl~mes d'abord en comprimant les tissus, ce qui Elimine le sang, et ensuite en utilisant le tissus exsangue comme rEfErence (niveau 0) d'absor-
bance. On a rEussi ~ surmonter un deuxi~me probl~me en rEchauffant l'oreille h 45 ~ C, ce qui artErialise le sang dans les tissus. Dans les annEes 1980 apparalt une nouvelle gEnEration d'oxym~tres qui ne nEcessite pas de rEchauffe- ment des tissus ou de calibration in vivo. Ces appareiis fonctionnent selon un principe ingEnieux. Puisque l 'ab- sorbance pulsatile dans le tissu est doe au sang artEriel, l'analyse de ce signal produira un estimE artEriel. Ces nouveaux oxym~tres sont donc appelEs oxym~tres pulsa- tiles (SpO2). 5 Ces oxym~tres mesurent pendant la pulsa- tion le rapport d'absorbance de la lumi~re rouge par rapport ~ celle de la iumi~re infra-rouge. 6 Ce rapport est par la suite calibre empiriquement en fonction de valeurs de SaO2 dEterminEes h partir de sang de volontaires soumis ~ une dEsaturation. La figure I (voir page Slxxviii) est un exemple de courbe de calibration d'oxym~tre puisatile. Les appareils actuels ont de petites et IEg~res sondes qui contiennent des diodes Emettrices de lumi~res rouge et infra-rouge et des photo-diodes pour detecter cette lumi~re. Les oxym~tres pulsatiles ont rapidement acquis une grande popularitd en clinique non seulement dans la salle d'opEration, mais dans toutes les unites de soins lourds ofa il y a des patients h risque de dEsaturation. Cette popularitE demeure importante parce que les appa- reils sont relativement peu co0teux, ne demandent pas de calibration et sont suffisamment precis pour rEpondre aux besoins cliniques (--+ 2 -3 pour cent). 5 Comme pour tout autre appareil de mesure il y a des situations qui peuvent amener la lecture de valuers erronnEes. I1 y a deux grandes categories de probl~mes : les artefacts dus au signal et les artefacts d'absorption de lumi~re (colorant et dysh~,mo- globine). Le probl~me le plus difficile dans le dEveloppe- merit d'un oxym~tre pulsatile est I'identification de I'onde pulsatile noyEe dans un environnement d'artEfacts Electro-magnEtiques. L'artEfact lie au signal a trois sources importantes : la lumi~re ambiante, une perfusion faible (signal faible), et le mouvement (bruit de fond important). Ces trois facteurs am/ment une mauvaise discrimination du signal par rapport au bruit de fond. Les photodiodes utilisEes dans la sonde comme dEtecteurs de lumi~re ne peuvent distinguer une longuer d'onde de lumi~re de celle provenant d'une autre source lumineuse.
D~s lors, le dEtecteur de lumi~re ne sait pas s'il reqoit de la lumi/:re qui origine de I'Emetteur rouge, de I'Emetteur infra-rouge ou de la lumi~re environnante. Ce probl~me est rEsolu en Emettant de fa~on alternative de la lumi~re rouge et infra-rouge. Le faisceau rouge est d'abord dmis en premier, et la photodiode Emet un courant provenant de la transmission de ce faisceau rouge plus le courant dmis par la lumi~re de la piece. Ensuite, le faisceau rouge est fermE, le faisceau infra-rouge est mis en action et le signal de la photodiode reprEsente maintenant la somme de ce faisceau et de la lumi~re ambiante. Finalement, les deux

Tremper: INTERPRI~TATION DES MESURES NON-INVASIVES D'OXYG~,NE ET DE CO 2 SIxxxv
diodes Emettrices de lumi~re sont fermEes et la photo- diode gEnt.re maintenant un signal qui vient uniquement de la lumit~re de la pi~.ce. La sequence est rEpEtEe des centaines de fois par seconde. De cette fa<jon l'oxym~tre tend ~t Eliminer l'interfrrence due h la lumi~re ambiante en mesurant le signal autant du fond lumineux environnant et en soustrayant ce signal des centaines de fois h la seconde. Malheureusement, certaines sources de lumi~res a inten- site variable peuvent causer certains probl~mes en drpit de ce montage subtil. Dans un contexte clinique, l'artrfact dfi ~t la lumirre ambiante peut 6tre diminu6 en couvrant la sonde d'une enveloppe opaque.
Le signal pulsatil affaibli reprEsente une autre probl~.me d'ingEniErie. Quant il y a un tout petit signal pulsatil detect6 par la sonde, I 'oxymrtre va amplifier ce signal. De cette fa~on l'oxym~.tre pulsatile va tenter de mesurer la saturation dans un vaste rayon d'amplitudes de pouls. Malheureusement, quand un signal faible est amplifir, le bruit de fond devient lui aussi amplifir. Et ~ amplification maximale, l 'oxymrtre peut m~me analyser le bruit de fond amplifiE en considErant qu'il reprrsente un signal pulsatil et calculer une saturation ~t partir du signal de bruit de fond. Puisque ce bruit de fond est habituellement amplifiE autant pour le faisceau rouge que pour l'infra- rouge, le rapport va tendre vers I'unit~ ; ceci est illustr6 dans la figure 1 (voir page Slxxviii) Iorsque la saturation est aux environs de 85 pour cent. Un problrme semblable se produit lorsqu'il y a un important bruit de fond provenant du mouvement de la sonde, ce qui amrne l'oxym~.tre ~ interpreter ceci comme un signal pulsatil. Les plus nouveaux oxymrtres vont permettre :~ I'utilisa- teur d'identifier ces probl~.mes en illustrant la courbe et/ ou en incorporant un signal automatique de fermeture par lequel l'appareil va cesser d'rvaluer la saturation. Une mauvaise comprehension de cet ajustement de la sensibil- itE par l'oxym~.tre pulsatile a fait croire ~ certains usagers que I 'oxymrtre est en fait un appareil de la mesure de la perfusion pEriphrrique. L'appareil mesure en fait un pouls, mais n 'a pas besoin vEritablement de riot sanguin et peut amplifier le pouls de fa~on dramatique en cherchant Evaluer une saturation. On peut d6montrer que le d6bit sanguin pEriphErique pourra ~tre rrduit jusqu'~ dix pour cent des valeurs normales, avant que l 'oxymrtre pulsatile commence h presenter des difficultEs h Evaluer la satura- tion. 7
Toute substance qui absorbe la lumirre dans les zones rouges et proche infra-rouges (600 b. 1000 nm) et qui se trouvera dans le sang artEriel d'un patient, mais pas dans le sang artEdel des sujets utilisEs pour la calibration empirique de l'appareil, pourra amener une erreur dans I'estimE de saturation. Le problrme le plus frequent est dO aux colorants intra-veineux et aux dyshrmoglobines (COHb et metHb). Ainsi, I'injection de bleu de mrthy-
l~ne va amener une chute rapide mais de br~ve durre (une b. deux minutes) de la saturation alors que le vert d'indo- cyanine va amener une chute modrrre ; I'indogo carmin produira une diminution tr~s faible de la lecture de la saturation, s Puisque la COHb est rouge, on peut s'atten- dre b. ce qu'elle soit lue comme de l 'oxyhrmoglobine. De fait, la presence de carboxyhrmoglobine va amener I'oxym~tre pulsatil ~ surEvaluer la saturation et d~s lors, le satorom~tre ne peut ~tre employ6 pour detecter la prE- sence de carboxyhrmoglobine chez les patients possible- ment intoxiqurs au monoxyde de carbone. 9'1~ La metHb absorbe beaucoup la lumi~re autant dans le spectre rouge que infra-rouge (la metHb est brun foncr). Pour cette raison elle est per~ue comme une importante absorbance pulsatile autant dans le spectre rouge qu'infra-rouge. En consequence, s'il y a plus de 30 pour cent des hrmoglo- bines du sang qui sont sous forme metHb, on aura des probl~mes similaires h ceux vrcus lorsqu'on a une pauvre discrimination du signal, c'est-b.-dire des lectures qui tendent vers 85 pour cent. t t
Depuis le dt~but des ann~es 1980 de nombreux travaux ont t~valu6 la pr6cision et I'utilit6 en clinique de I 'oxymr- trie pulsatile. En soi, l 'oxym~tre a peu de limitations dans le cadre clinique mais la variable elle-m~me (ia SaO2), a certaines limitations. Lorsque l 'on observe la courbe de dissociation de I 'hrmoglobine, on rralise que l'oxym~tre digital sera incapable de drceler des changements d'oxy- grnation artrrielle jusqu'h ce que la PaO2 devienne infrrieure ~t 80 mmHg, ce qui donne une saturation d'~t peu pros 97 pour cent. M~me si l'appareil va drceler rapidement des changements de saturation, il pourra y avoir des changements de fonction pulmonaire sans drsaturation. On a pu drmontrer que I'intubation endo- bronchique peut ne pas ~.tre d~celre si la concentration d'oxyg~ne inspire est suprrieure h 40 pour cent et aussi que des embolies a6riennes peuvent provoquer de fortes baisses de PaOz et de PtcO2 sans que l 'on atteigne un point de drsaturation.~2'13 Nranmoins, l'oxym~tre pulsatile devrait prrvenir tout dommage cause par une drsaturation non reconnue et c'est le but pour lequel l'appareil a Et6 con~u.
V e n t i l a t i o n : m e s u r e et s u r v e i l l a n c e du CO2 Mt3me si l'auscultation et I'observation peuvent mettre en Evidence la presence ou I'absence de ventilation, la qualit6 de la ventilation sera confirmre par une tension normale de gaz carbonique (PaCO2). Peu de temps apr~s que Leland Clark eut present6 son 61ectrode polarogra- phique pour l'oxyg~ne en 1956, John Severinghaus a mis au point l'61ectrode ~ CO2 en 1958. Elle est considrrre comme une sonde secondaire, parce qu'elle est composre d'une 61ectrode de verre sensible aux changements de pH intrgrre dans une cellule b. 61ectrolytes. Le CO2 diffuse

Slxxxv i CANADIAN J O U R N A L OF A N A E S T H E S I A
dans la cellule ~t travers la membrane, rEagit avec I'eau de la solution Electrolyfique, et produit de l'acide carbonique, ce qui modifie le pH.
La PCO2 trans-cutanEe (PtcCO2) La PtcCO2 est apparue peu de temps apr~s la P t c O 2 dans le debut des annEes 1970. Puisque la sonde est placEe sur la peau et rEchauffEe, on peut s'attendre raisonnablement ~t ce que les valeurs de CO2 soient sensiblement plus EievEes que les valeurs de PaCO2. En fait, les valeurs de PtcCO2 sur les modules d'origine, chez des sujets EveillEs, Etaient de l'ordre de 60 mmHg. Dans la decade suivante, on a propose des fa~jons d'ajuster la PtcCO2 pour qu'elle Evalue mieux les valeurs de PaCO2, pour permettre une interprE- tation des donnEes plus facile. Le terme de correction le plus frEquemment utilis6 est celui propose par John Severinghaus, qui divise la valeur de PtcCO2 par 1,33 et soustrait 3.14 L'ajustement de Severinghaus permet au PtcCO2 de prEdire la PaCO2 avec une marge d'erreur de plus ou moins dix pour cent. 14.15 Comme dans le cas de la PtcO2, la PtcCO2 a eu un usage important dans les unites de soins nEonataux. Contrairement aux valeurs de PtcO2, celles de PtcCO2 sont plut6t insensibles aux changements de perfusion et n'ont pas de variation importante avec l'Age. Pour ces raisons il est plus facile d'interprEter les valeurs de PtcCO2 que les valeurs de PtcO2. La sonde de PtcCO2 demande une calibration (dans ce cas-ci une calibration en deux points) et de l'enuetien. A cet Egard les deux sondes transcutanEes ont des limitation similaires.
CapnomEtrie Le mot capnomEtrie vient du grec capnos (fumEe) ; le gaz carbonique (CO2) est considErE comme la fumEe du mEtabolisme cellulaire. La forme et la pertinence physio- Iogique du capnogramme (courbe de CO2 expirE) ont EtE EtudiEes d~s 1928 mEme si I'application clinique de ces connaissances :~ I'Evaluation respiratoire a d6 attendre le dEveloppement d'analyseurs de CO2 b. rEponse rapide. ,6
Les capnom~,tres utilisent les plus frEquemment des syst~,mes de detection par infra-rouge ; certains mod/~ies utilisent maintenant la spectromEtrie de masse et la dispersion Raman pour accomplir cette fonction. Les appareils ~ infra-rouge dEtectent le CO2 en utilisant aussi la Ioi de Beer-Lambert. Le protoxyde d'azote absorbe aussi l'infra-rouge dans le m~me secteur que le CO2 et pour cette raison les appareils utilisEs en salle d'opEration doivent inclure un facteur de correction lorsque le protoxyde d'azote est utilisE. De fa~on courante, le gaz respiratoire est aspire du circuit anesthEsique aussi pros que possible du patient, et amenE ,~ l'analyseur ~ infra- rouge par un tube de petit diam/~tre. Le temps de rEponse des capnom~:tres va ~tre proportionnel au volume interne du tube d'Echantillonage, b. celui de la chambre de
mesure et au debit d'aspiration de l'Echantillon. Le debit d'Echantillonage est habituellement de l'ordre de 150 ml.min -I. Des taux d'Echantillonage plus faibles non seulement vont retarder l'Emission de l'information mais aussi vont dEformer la courbe :~ cause d'une diffusion axiale le long du trajet de la tubulure. Des debits d'aspiration plus rapides vont aussi amener des erreurs, en prElevant non seulement le gaz expire des patients mais aussi une partie des gaz frais qui viennent du circuit de ventilation. Comme les patients expirent des gaz qui sont saturEs de vapeur d'eau, il existe aussi un probl~me courant cause par la condensation de vapeur d'eau dans la tubulure capillaire. Ce probl~me est prEvenu par des trappes heau, des filtres et des tubulures impermEables It l'eau. Ce type de capnom~,tre est connu comme appareil prEl~vement distal (sidestream). Un autre type de sonde mesure la concentration de CO2 directement, au moyen d'un adapteur place dans le circuit. Ces appareils sont connus comme des analyseurs directs (mainstream), puisque le faisceau infra-rouge dEtecte le CO2 directe- ment dans le gaz expiratoire (le patient respire en fait travers le dEtecteur). A cause de cette approche directe, ces capnom~tres ont un temps de rEponse tr~s rapide et Evitent les probl~,mes d'occlusion de tubulure, les trappes ~t eau, et l'erreur d'Echantillonnage. Les inconv~.nients de ces appareils b. mesure directe sont surtout relies b. la dimension et la masse de I'adapteur qui doit ~tre place sur le tube endotrachEal, et au coot plus important de la sonde miniaturisEe placEe dans le circuit.
Pour comprendre la capnographie, l'on doit avoir une comprehension de base de l'espace mort. 17 L'espace mort (VD) est dEfini comme toute partie du volume courant qui ne participe pas aux Echanges de CO2. D~s Iors, le volume courant est la somme de l'espace mort plus le volume de gaz alvEolaire (V~tv).
V T = V D "]- Val v
VD se divise en trois composantes : espace mort de l'appareillage, espace mort anatomique et espace mort alvEolaire. L'espace mort de l'appareillage est cette partie du volume courant contenu dans le circuit de ventilation, par exemple pour un circuit fermE, tout est ce qui est entre le connecteur en Y et le patient. L'espace mort anato- mique est le volume contenu dans la trachEe et les voies respiratoires de conduction. L'espace mort alvEolaire est compose du volume contenu dans les alvEoles ventilEes mais non perfusEes. La figure 2 (voir page Slxxxi) montre les changements de concentration de CO2 pendant l'ex- piration. Le premier gaz expire est le rEsidu contenu dans le circuit respiratoire. Ce gaz a la m(~me concentration de CO2 que le gaz inspirE, donc une concentration habituel- lement Egale ~ 0. Apr~s l'expiration de l'espace mort de I'appareillage, le prochain gaz ~ atteindre le dEtecteur de

Tremper: I N T E R P R I ~ T A T I O N DES M E S U R E S N O N - I N V A S I V E S D ' O X Y G ~ N E ET DE CO 2 Slxxxvii
CO2 provient de I'espace mort anatomique qui ne contient pas non plus de CO2. Finalement le melange provenant des alvEoles (espace mort alvOolaire et gaz alvOolaire) atteint ies voies aEriennes. Ces deux gaz alvEolaires se mElangent et la concentration mesurEe dans les voies a4riennes est le rEsultat du melange d'espace mort alvEolaire et de gaz alvEolaire. Quand ces gaz atteignent le dEtecteur, le CO2 augmente jusqu'au niveau de cette concentration mixte, et on obtient un plateau alvEolaire. A l'inspiration, la concentration de CO2 chute ~t 0. S'il n'y a pas d'espace mort alvEolaire, la valeur du plateau de CO2 expire devrait ~tre approximativement Egale ~t celle de la PaCO2. Si la moiti6 des alvOoles formaient un espace mort, et l'autre moiti6 Etait perfusEe de fa~on optimale, d~s lots la concentration au plateau expiratoire devrait ~tre Equivalente h la moitiE de la PaCO2. DOs lors, on peut comprendre que des differences entre le PaCO2 et la valeur du CO2 de fin d'expiration seront does ~t la proportion d'espace mort alvEolaire. La figure 3 (voir page Slxxxi) redessine un capnogramme normal c'est-~- dire une concentration de CO2 en fonction du temps. Ainsi au debut de l'expiration, la valeur de CO2 est nulle et ceci est dOcrit comme la phase 1. A mesure qu'une quantitE de gaz alvEolaire passe au dEtecteur, la valeur de CO2 augmente rapidement pour atteindre un plateau alvEolaire. Cette pente montante rapide est d&rite comme la phase Il du capnogramme et reprOsente un melange d'espace mort alvOolaire, de gaz alvOolaire et d'espace mort anatomique. Le plateau final est atteint seulement quand seul le gaz alvEolaire est expirE. Dans ce modOle nous avons assume la perfusion parfaite de toutes les alvEoles (des alvOoles idEales avec un CO2 Egal au PaCO2), ou la presence d'un espace mort alvEolaire sans 6change de CO2. En rEalit6, le poumon est compose d'unitEs avec des rapports ventilation/perfusion variables (v/Q). Le volume de l'appareillage et des espaces morts anatomiques sont souvent dEcrits comme des espaces morts en sOrie, parce qu'ils sont expires en sErie, alors que I'espace mort alvOolaire est dEcrit comme un espace mort parall~le, parce que son expiration se fait en parall~le avec le gaz alvOolaire ideal (figure 2).
A partie de ce qui precede, on peut conclure que pour obtenir un capnogramme normal il doit y avoir mEtabo- lisme (donc production de CO2), circulation (pour trans- porter le CO2 des tissus aux poumons), et ventilation. Puisque la capnographie 6value de fa~on continue ces trois fonctions vitales de faqon non-invasive, elle devient un outil extr%mement utile quand il s'agit de s'occuper de patients anesthEsiEs. Cliniquement, des Ecarts dans la forme ou la dimension de la courbe devraient faire I'objet d'une attention immediate. Un capnogramme trOs dimi- hUE ou absent peut 6tre attribuE/~ un dObranchement du circuit de ventilation, h un art& cardiaque, h une embolie
pulmonaire, ou ~ un tube endotrach6al dOplacE, mai place ou obstruE. Des diminutions dans la hauteur du plateau du capnogramme peuvent 6tre causEes par tout facteur qui augmente l'espace mort alvEolaire. Souvent, pendant I'anesthEsie, ceci est dO/t une hypotension qui va amener la presence de plus d'unitEs/t %//Q Elev6 dans le poumon (zone 1). Les augmentations de hauteur de ce plateau du capnogramme peuvent &re dues ~t une augmentation de mEtabolisme au del~ de ce qui est prOvu par la ventilation (hyperthermie maligne ou sepsis), ou h l'addition de C02
la circulation (injection de bicarbonate, laparoscopie au C02, ou liberation d'un tourniquet). La rEinspiration de C02 s'inscrit comme une ligne de base au-dessus de 0 pendant la phase inspiratoire. Comme les capnom/:tres vont detecter sur un mode continu des complications potentiellement sErieuses au niveau des voies aEriennes et du systOme circulatoire, il deviennent une norme de surveillance de la respiration.
Conclusion Actuellement il y a quatre techniques pour 6valuer de fa~on continue et non-invasive I'oxygOne et le dioxyde de carbone : la SpO2 et la PtcO2 pour le monitoring de I'oxy- gone, et I'ETCO2 et le PtcCO2 pour la surveillance du gaz carbonique. L'oxymEtrie et la capnographie utilisent des techniques d'absorbtion de lumi~re alors que les moniteurs trans-cutanOs utilisent des sondes 61ectrochi- miques dEveloppEes pour utilisation dans les machines gazomEtrie, mais appliquEes de faqon non-invasive h la surface de la peau. L'oxymEtrie pulsatile et la PtcCO2 sont << calibrEes ,, de telle sorte que les donnOes obtenues prOdisent avec precision les valeurs correspondantes dans le sang art4riel. Par contre l'analyse du CO2 expire et de I'oxygOne transcutanE montre des valeurs d'oxyg%ne et de CO2 diffErentes de celles retrouvEes dans le sang artEriel. Le capnogramme et sa valeur de CO2 expire fournissent des informations extrOmement utiles sur la perfusion et la ventilation pulmonaire. La valeur du CO2 expire se rapproche de plus en plus de la valeur du PaCO2 ~ mesure que I'espace mort alvEolaire tend vers 0. La valeur transcutan6e de tension en oxygOne procure des informa- tions utiles en ce qui conceme I'oxygEnation pEriphErique et reflOte de plus en plus la valeur de PaO2 :~ mesure que l'ftge progresse. Lorsque que la perfusion pEriphOrique diminue, la PtcO2 diminue selon la baisse de perfusion cutanEe. Les valeurs de CO2 expire et de PtcO2 sont similaires en ce qu'elles fournissent des informations sur une base continuelle, mais Iorsque ces valeurs diminuent, l'information supplEmentaire foumie par un Echantillon de gaz de sang artEriel peut aider h identifier la cause du probl~me. Cliniquement, les techniques optiques (oxy- mOtrie pulsatile et capnographie) ont I'avantage qu'elles demandent peu ou pas de calibration et h peu pros pas de

Slxxxviii C A N A D I A N J O U R N A L OF A N A E S T H E S I A
r6chauffement lorsqu'utilis6es chez un patient. Dans un environnement clinique, ces avantages ont permis de r6pandre leur utilisation. La PtcO2 et la PtcCO2 d'autre part exigent un entretien important des 61ectrodes, une calibration fr6quente, et cinq h dix minutes de r6chauffe- ment sur la surface cutan6e des patients avant de donner des inforrnations utiles. N6anmoins, il y a certaines situations cliniques o0 les valeurs trans-cutan6es peuvent 6tre extr~mement utiles. Quelque soit I'environnement clinique, la surveillance continue et non-invasive de l'oxyg6nation et de la ventilation sont disponibles facile- merit ; ces techniques pourront permettre un usage plus judicieux des m6thodes d'6chantillonnage et de surveil- lance invasive.
R~f~rences (Voir page Slxxxii)
Related Documents