INTERPRETATION OF HISTOGRAMS

Welcome message from author
This document is posted to help you gain knowledge. Please leave a comment to let me know what you think about it! Share it to your friends and learn new things together.
Transcript

INTERPRETATION OF HISTOGRAMS

PRINCIPLE OF CELL COUNTERElectronic impedence
• Wallace coulter (1956)
• Passage of cell displaces the volume of diluent and this increases resistance
• Impulse are generated due to difference in potential at two electrodes which is read at oscilloscope
• Number of impulse indicate number of cells and height indicates volume of cells

Optical light scatter
• A diluent suspension flows through a aperture so that the cells pass in a single file in front of light source
• Light is scattered by the cells passing through the light beam
• The amount of light scatter is detected by phomultiplier and photodiodes
• Electrical impulse are generated for counts

• Peroxidase based cell counter
• Fluorscence based cell counters
• Immunological based cell counters

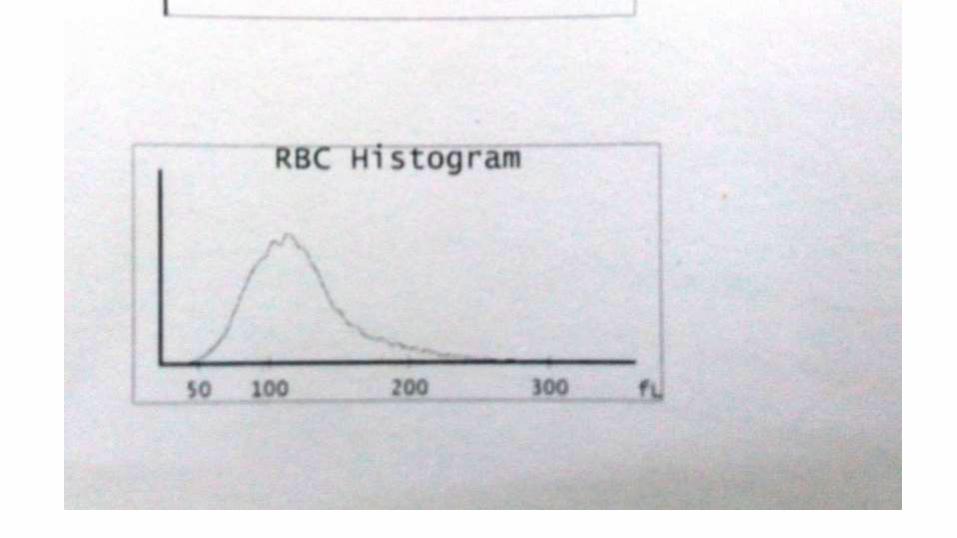
HISTOGRAMS
• These are the graphical representation of neumerical data of different cell population on cell counter
• Y axis represents the number of cells and X axis represents the cell size

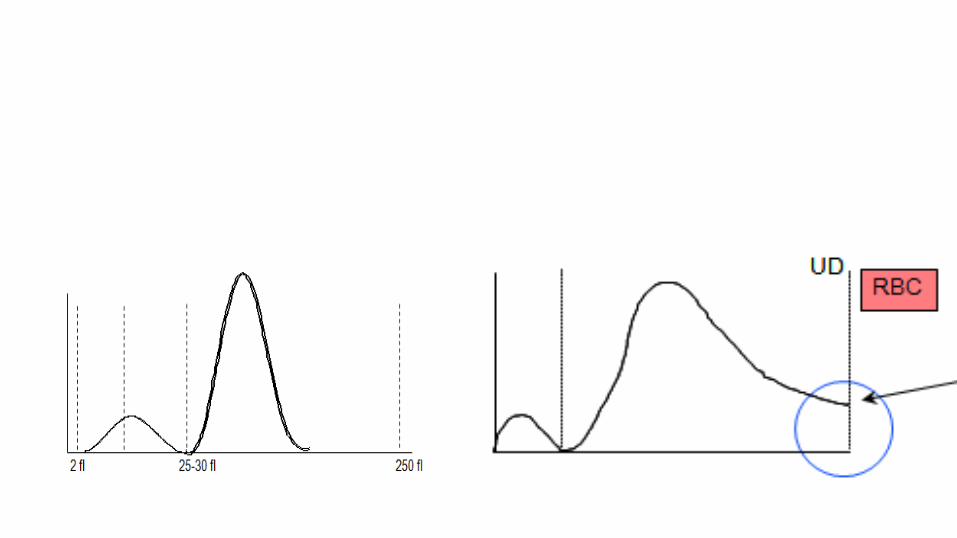
• Platelets have volume b/w 8-12 fl and counted b/w 2 to 25 fl.
• RBC have volume 80-100 fl and are counted b/w 25 to 250 fl.

Normal RBC histogram• Normal RBC distribution curve is Gaussian bell shaped curve
• Peak of curve should fall within the normal MCV range of 80-100 fl
• MCV is perpendicular line from peak of the curve to base
• There are two flexible discriminators LD (25-75 fl) and UD (200-250fl)

The distribution should always starts and ends on base line and should be located between the two discriminators

RED CELL FLAGSRL flag
• When lower discriminator exceeds the preset height by 10 %
• RBC count, HCT, MCV, MCH and MCHC show RL flag.


Possible causes of RL flag
• Giant platelets
• Microerythrocytes
• Fragmented RBCs
• Platelet clumps
• In case of fragmented RBC and extreme microerythrocytosis thethere is no clear separation in volume between platelets anderythrocytes. Due to high numbers of RBC the platelet resultmight be false high and should be checked with alternativemethods.

RU flag
• Flag is seen when UD exceeds the preset height by greater than 5 %.

Possible causes of RU flag
• Cold agglutination
• RBC aggluatination
• Rouleax formation
• RBC agglutination might cause a low incorrect RBC countand effect also the parameter Hct, MCV, MCH and MCHC. Incase of cold agglutinates warm the sample up to 37°C.(MCHC should trop back to normal value if the problem issolved)

Multiple peaks (MP)
• RDW SD shows the MP flag

Possible causes
• Iron defiecieny anemia in recovery
• Post transfusion
• Extreme leucocytosis

Thrombocyte histogram• The histogram curve should lay within the lower and upper platelet discriminator
(PL & PU) and start and end on the base line.
• PLT counted between 2 fl and 30 fl.
1 flexible Discriminator PL 2 to 6 fl.
1 flexible Discriminator PU 12-30 fl.
1 fixed Discriminator at 12 fl

Parameters of platelet histogram• MPV ( 8 - 12 fl)
• P-LCR - ratio of large platelets Reference range 15 - 35 %
• PDW – Platelet distribution width curve (9-14 fl)

PL flag
• When lower discriminator exceeds preset height by 10%
• Platelet count, P-LCR and MPV will show PL flag

Possible causes
• High blank value
• Cell fragments
• High numbers of bacteria
• Contaminated reagent
• Platelet aggregation

• In case of high background numbers (blank), check reagent for contamination (bacteria). Check expiry date.
• In order the background check is within range, the patient sample should be checked – platelet results might be incorrect high due to cell fragments or bacteria's.
• In some cases platelet aggregates might cause the problem. In this case the histogram curve would also show an abnormal distribution at the upper discriminator. Platelet aggregation might cause low incorrect platelet results.

PU flag
• This occurs when UD exceeds the preset height by more than 40%

Possible causes • PLT clumps
EDTA-incombatibilityClotted sample
• Giant Platelets
• Microerythrocytes
• Fragmentocytes or dysplastic RBC
In case of platelet aggregation, the PLT count is incorrect low.
Check EDTA incombatibility –e.g. re-collect the sample and use citrate as anticoagulance to avoid clocking caused by EDTA.
In case of extreme microerythrocytes or fragmented RBC the PLT count might be incorrect high. PLT results should be confirmed with alternative methods

Multiple peaks (MP)

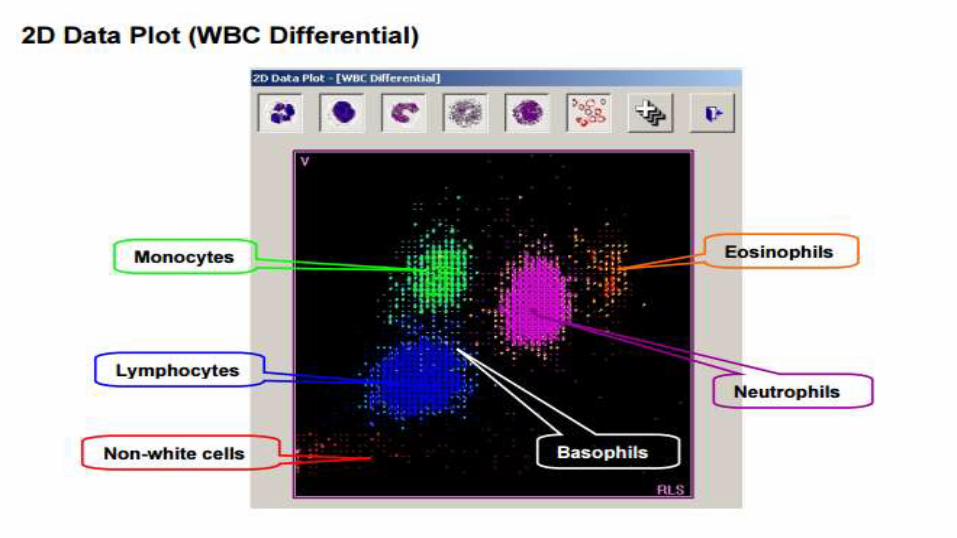
WBC histogram

• Lower discriminator in this fluctuates between 30 -60 fl
• Upper discrminator is fixed at 300 fl
• The number of cells between LD and UD is WBC count

• WBC histogram consists of two troughs, valley discriminators, T1 (78-114 fl) and T2 (<150 fl)
• Peak between LD and T1 represents small cells i.e. lymphocytes
• Peak between T1 and T2 includes eosinophils, monocytes, blasts, promyelocytes, myelocytes and metamyelocytes
• Peak after T2 represents neutrophils

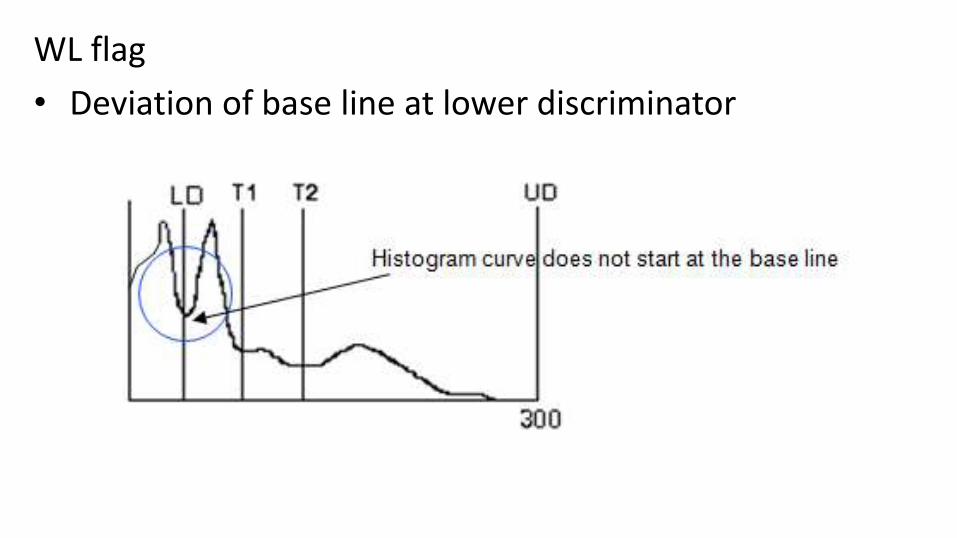
WL flag
• Deviation of base line at lower discriminator

Possible causes
• Lyse resistant RBC
• PLT ClumpsEDTA-incombatibilitycoagulated sample
• Erythroblasts (NRBC)
• Cold agglutinates

AG flag
• Abnormal curve in front of lower discriminator
Large platelet clumps (> 30fl) are
detected in the area before the lower
WBC discriminator. Due to their
enhanced size they may not affect the
PLT histogram curve. If “AG” mark will
be generated, the sample should be
checked for platelet clumps (e.g.
microscopic slide review).

WU flag
• Deviation on upper discriminator curve
Possible cause:
• extreme leukocytosis
• rare: WBC aggregation
The histogram curve does not match the
basis line at upper discriminator due to
high numbers of large particles (WBC
aggregation) or if the linearity of the white
blood cell count exceeds the limit. (WBC>
100 x 10³/µl)
Pre-dilution (e.g. 1:5) of the sample might
help to obtain correct results.

• T1 and T2 flags when discrimination between various cell population cannot be done due to presence of abnormal leucocytes

• F1, F2, F3 flags


RBC - 05.18
HB - 15.02
HCT - 45.08
MCV - 88.07
RDW - 16.03
RBC - 03.19
HB - 06.40
HCT - 20.05
MCV - 64.04
RDW - 18.00


• THANKS
Related Documents