GEOTHERMAL TRAINING PROGRAMME Reports 2004 Orkustofnun, Grensásvegur 9, Number 5 IS-108 Reykjavík, Iceland 57 INTERPRETATION OF GEOTHERMAL FLUID COMPOSITIONS FROM MENDELEEV VOLCANO, KUNASHIR, RUSSIA George Chelnokov Far East Geological Institute Far East Branch of Russian Academy of Science Vladivostok RUSSIA [email protected] ABSTRACT In this report, chemical analyses from the geothermal fields of the Mendeleev volcano (Kunashir Island), Krafla (Iceland) and Olkaria (Kenya) have been used to compare aquifer temperatures in wells using selected chemical geothermometers. Calcite and amorphous silica scaling potential has been assessed for selected wells and the environmental impact evaluated of the steam heated acid-sulphate waters on the rivers in the area. The speciation program WATCH was used to calculate amorphous silica and calcite saturation for variably boiled well waters for the assessment of scaling potential. The chemical data from the steam heated waters and wells were compared with requirements of Russian and European water quality standards. The geochemistry of the thermal water from Mendeleev volcano shows that the application of geothermometers to predict subsurface temperatures has to take into account physio-chemical parameters. Available data indicate that subsurface temperatures may be as high as 300°C. The physical processes that need to be taken into account include boiling, mixing with cold water, and steam heating. These processes affect water-mineral equilibria and can result in unreliable temperature predictions. 1 INTRODUCTION Significant geothermal resources exist in the South Kuril Islands, Russia. The Goriachy Pliazh geothermal system is located on the Kunashir Island, near the Mendeleev volcano 7 km southwest of the town of Uzhno-Kuril’sk which has a population of about 4000. Hot springs and fumaroles are widespread in this area. The first pilot geothermal power plant (0.7 MWe) was built on Kunashir Island in 1991 but currently it is not in operation. Many researchers have studied this area from about 1970 to the present day (Zelenov, 1972; Baskov and Surikov, 1975; Markhinin and Stratula, 1977; Lebedev, 1979; Kononov, 1983; Menyailov et al., 1988; Chudaev et al., 2004). However, information on geochemistry is limited.

Welcome message from author
This document is posted to help you gain knowledge. Please leave a comment to let me know what you think about it! Share it to your friends and learn new things together.
Transcript

GEOTHERMAL TRAINING PROGRAMME Reports 2004 Orkustofnun, Grensásvegur 9, Number 5 IS-108 Reykjavík, Iceland
57
INTERPRETATION OF GEOTHERMAL FLUID COMPOSITIONS FROM MENDELEEV VOLCANO, KUNASHIR, RUSSIA
George Chelnokov Far East Geological Institute
Far East Branch of Russian Academy of Science Vladivostok
RUSSIA [email protected]
ABSTRACT
In this report, chemical analyses from the geothermal fields of the Mendeleev volcano (Kunashir Island), Krafla (Iceland) and Olkaria (Kenya) have been used to compare aquifer temperatures in wells using selected chemical geothermometers. Calcite and amorphous silica scaling potential has been assessed for selected wells and the environmental impact evaluated of the steam heated acid-sulphate waters on the rivers in the area. The speciation program WATCH was used to calculate amorphous silica and calcite saturation for variably boiled well waters for the assessment of scaling potential. The chemical data from the steam heated waters and wells were compared with requirements of Russian and European water quality standards. The geochemistry of the thermal water from Mendeleev volcano shows that the application of geothermometers to predict subsurface temperatures has to take into account physio-chemical parameters. Available data indicate that subsurface temperatures may be as high as 300°C. The physical processes that need to be taken into account include boiling, mixing with cold water, and steam heating. These processes affect water-mineral equilibria and can result in unreliable temperature predictions.
1 INTRODUCTION Significant geothermal resources exist in the South Kuril Islands, Russia. The Goriachy Pliazh geothermal system is located on the Kunashir Island, near the Mendeleev volcano 7 km southwest of the town of Uzhno-Kuril’sk which has a population of about 4000. Hot springs and fumaroles are widespread in this area. The first pilot geothermal power plant (0.7 MWe) was built on Kunashir Island in 1991 but currently it is not in operation. Many researchers have studied this area from about 1970 to the present day (Zelenov, 1972; Baskov and Surikov, 1975; Markhinin and Stratula, 1977; Lebedev, 1979; Kononov, 1983; Menyailov et al., 1988; Chudaev et al., 2004). However, information on geochemistry is limited.

Chelnokov 58 Report 5
2. STUDY AREAS The main objective of this study is the interpretation of geochemical data on fluids from Goriachy Pliazh on Kuril Island. Two other systems have been chosen for comparison, Krafla in Iceland and Olkaria in Kenya. All three systems occur in volcanic rocks ranging from basaltic to silicic in composition. Karingithi (2002) and Gudmundsson and Arnórsson (2002) report the data from Olkaria and Krafla, respectively. 2.1 Geothermal activity at Mendeleev volcano 2.1.1 General background In the Russian Far East, a chain of volcanic islands, the Kuril Islands, stretches for a thousand kilometres from Kamchatka south to Japan, separating the frigid Okhotsk Sea from the vast Pacific Ocean (Figure 1). The richest geothermal heat reserves of Russia are in Kamchatka and the Kuril Islands. Reservoir temperatures of 280°C have been encountered. The generating power capacity at Kamchatka and the Kuril Islands has been estimated to be at least 2000 MW and the heat capacity more than 3000 MW. Geologists have identified two chains of volcanoes within the islands, referred to as the Small and the Big Kuril Island Chains. The Small Kuril Chain, including the islands of Shikotan and Kunashir, makes up the southern end of the chain nearest to Japan, while the Big Chain stretches north to Kamchatka. There are 85 volcanoes on the Kuril Islands Arc and 36 of them are active. The Kuril Chain of islands is a unique feature. There are lots of impressive phenomena of active volcanism, and abundant thermal manifestations. In the entrails of volcanoes, near the magmatic centres, ore deposits of noble rare and non-ferrous metals are formed. In the Kuril Archipelago, the direct use of geothermal heat has been developed on the islands of Kunashir and Paramushir for space heating (Yuzhno-Kuril'sk and Severo-Kuril'sk cities, respectively). In the Kuril Islands, utilization of the geothermal energy is becoming very important. 2.1.2 Kunashir Island The Kunashir Island is the southernmost island in the Big Kuril Chain. Its length from northeast to southwest is 123 km, and the width varies from 4 to 30 km. The total area of the island is 1490 km2. The climate is monsoonal. Administratively, Kunashir Island is a part of the Sakhalin region to which the Yuzhno-Kuril’skiy area belongs, together with the Small Kuril Islands. The administrative centre is Yuzhno-Kuril’sk town. There are several settlements on the island: Golovnino, Goriachy Pliazh, Otradnoe and Lagunnoe. The basis of economy of Kunashir Island is fisheries and the fishing industry. Much of the island's territory is mountainous with volcanic formations. Four active volcanoes (Tiatia-yama (1819 m), Ruruy (1485 m), Mendeleeva (890 m), and Golovnina (541 m))
FIGURE 1: Map of the Kuril Island arc showing location of the study area
Report 5 59 Chelnokov
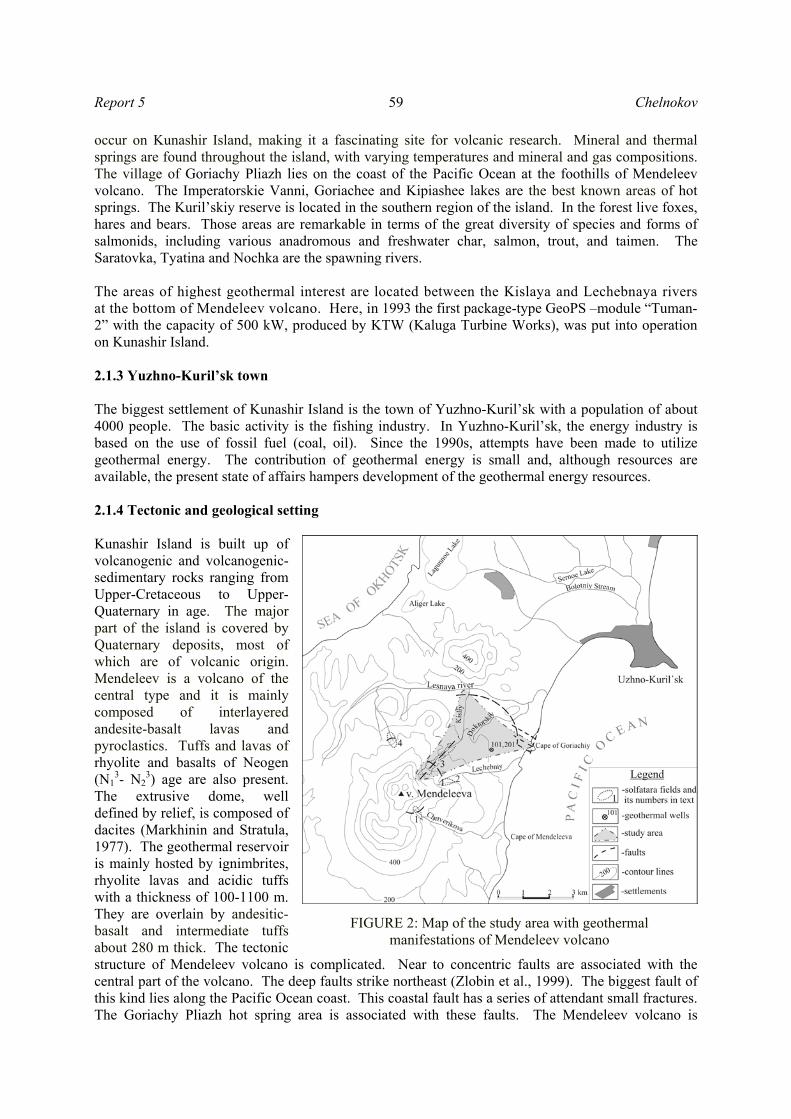
FIGURE 2: Map of the study area with geothermal manifestations of Mendeleev volcano
occur on Kunashir Island, making it a fascinating site for volcanic research. Mineral and thermal springs are found throughout the island, with varying temperatures and mineral and gas compositions. The village of Goriachy Pliazh lies on the coast of the Pacific Ocean at the foothills of Mendeleev volcano. The Imperatorskie Vanni, Goriachee and Kipiashee lakes are the best known areas of hot springs. The Kuril’skiy reserve is located in the southern region of the island. In the forest live foxes, hares and bears. Those areas are remarkable in terms of the great diversity of species and forms of salmonids, including various anadromous and freshwater char, salmon, trout, and taimen. The Saratovka, Tyatina and Nochka are the spawning rivers.
The areas of highest geothermal interest are located between the Kislaya and Lechebnaya rivers at the bottom of Mendeleev volcano. Here, in 1993 the first package-type GeoPS –module “Tuman-2” with the capacity of 500 kW, produced by KTW (Kaluga Turbine Works), was put into operation on Kunashir Island.
2.1.3 Yuzhno-Kuril’sk town The biggest settlement of Kunashir Island is the town of Yuzhno-Kuril’sk with a population of about 4000 people. The basic activity is the fishing industry. In Yuzhno-Kuril’sk, the energy industry is based on the use of fossil fuel (coal, oil). Since the 1990s, attempts have been made to utilize geothermal energy. The contribution of geothermal energy is small and, although resources are available, the present state of affairs hampers development of the geothermal energy resources. 2.1.4 Tectonic and geological setting Kunashir Island is built up of volcanogenic and volcanogenic-sedimentary rocks ranging from Upper-Cretaceous to Upper-Quaternary in age. The major part of the island is covered by Quaternary deposits, most of which are of volcanic origin. Mendeleev is a volcano of the central type and it is mainly composed of interlayered andesite-basalt lavas and pyroclastics. Tuffs and lavas of rhyolite and basalts of Neogen (N1
3- N23) age are also present.
The extrusive dome, well defined by relief, is composed of dacites (Markhinin and Stratula, 1977). The geothermal reservoir is mainly hosted by ignimbrites, rhyolite lavas and acidic tuffs with a thickness of 100-1100 m. They are overlain by andesitic-basalt and intermediate tuffs about 280 m thick. The tectonic structure of Mendeleev volcano is complicated. Near to concentric faults are associated with the central part of the volcano. The deep faults strike northeast (Zlobin et al., 1999). The biggest fault of this kind lies along the Pacific Ocean coast. This coastal fault has a series of attendant small fractures. The Goriachy Pliazh hot spring area is associated with these faults. The Mendeleev volcano is

Chelnokov 60 Report 5
FIGURE 3: Temperature for well 101 measured six months after drilling, and formation temperature
characterized by variable and intensive thermal manifestations at the surface. Thermal manifestations are located on the slopes of the volcano and form four solfatara fields (Figure 2): • Southeastern solfatara field is located at the source of the Chetvericovas stream and is about
250 - 300 m2. Outlets of steam occur at the boundary between andesites and tuffs. Maximum temperature of the steam heated water is 50-58°C; pH -2.5; strong smell of H2S is noticed.
• Eastern solfatara field is located at the source of the Lechebniy stream. Solfataras occur on both sides of the stream and form two small lakes. Temperature of the lakes is 80-100°C.
• Northeastern solfatara field is linked to two explosion craters. They are located at the source of the Kislaya river. The total area of the field is 2 km2. Temperature of the springs is 90-1000C and pH 1.5-1.8.
• Northwestern solfatara field is located near to the bottom of an extrusion dome at the upper part of the right inflow of the Lesnaya river. The total area of the field is about 0.05 km2. The field is characterized by powerful steam jets and a few groups of thermal springs. Deposits of sulphur are most noticeable here. Temperature of the springs is 90-100°C and their pH is 1.5-1.8.
The production wells № 101 and № 201 are located a short distance apart in the central part of the study area. Figure 3 shows temperature profiles measured in well № 101 and estimated formation temperature (Rosliy and Priadko, 1999). 2.2 Krafla geothermal field (Iceland) The Krafla geothermal area is located in one of the five volcanic systems associated with fissure swarms in the active volcanic rift zone in NE-Iceland (Figure 4). These are part of the surface expression of the Mid-Atlantic Ridge in Iceland. The surface of the Krafla area is mostly covered with basaltic lavas, with some hyaloclastites, also of basaltic composition. However, intermediate and silicic volcanic units also outcrop in the area. The volcanic activity at Krafla is episodic, occurring every 250-1000 years, each episode lasting 10-20 years. The latest eruptive period started in 1975 and terminated in September 1984. The Krafla central volcano developed a caldera during last interglacial period, about 100,000 years ago, which has almost been filled since with volcanic material. Within the Krafla caldera, there are numerous fumaroles and hot and altered ground that are mostly connected to tectonic fractures and faults. These geothermal manifestations indicate the existence of a large geothermal system. The exploration of this system began in 1970 (Stefánsson, 1981; Bödvarsson et al., 1984; Ármannsson et al., 1987). At the beginning of the 1975-1984 volcanic-rifting episode at Krafla (Björnsson et al., 1977), the gas content of the fumarolic steam, and in the steam of the only producing well at that time, increased very

Report 5 61 Chelnokov
much, in particular with regard to CO2. This increase in gas concentration has been attributed to the degassing of new magma intruded into the roots of the geothermal system (Ármannsson et al., 1982). The amount of this magmatic gas has since decreased with time. Gudmundsson and Arnórsson (2002) have estimated the excess fraction of CO2 in well discharges derived from this source of new magma. The degassing of the new magma upset mineral-CO2 equilibria in the geothermal reservoir and, therefore, also the CO2 geothermometer temperature. Drilling at Krafla started in 1974 with 1200 m deep exploration wells. Three production wells were drilled in 1975 and by the year 1978, 12 wells had been completed, all of which were in the Leirbotnar field, to the west
and south of the Hveragil gully. In 1976, the reservoir fluid at Leirbotnar became contaminated with magmatic gases, causing deposition and corrosion in the wells with simultaneous decline in their productivity. At present, 34 wells have been completed in the Krafla area. On average, 15-17 boreholes are used at any time and the station now operates with an installed capacity of 60 MW, as originally planned, and plans to enlarge it to 100 MWe are underway. Results of chemical analyses of selected samples from wells at Krafla are presented in Appendices .
2.3 Olkaria geothermal field (Kenya)
The Olkaria geothermal area, located within the Hell’s Gate National Park in the eastern branch of the African rift system in Kenya, has been under exploitation for over 20 years (Figure 5). The Olkaria area is located southwest of Lake Naivasha in the eastern sector of the African Rift Valley in Kenya. The Olkaria geothermal resource is located within the Greater Olkaria volcanic complex which consists of a series of lava domes and
FIGURE 4: Location of the Krafla geothemal area (Björnsson, 1985)
FIGURE 5: Location of the Olkaria geothermal area

Chelnokov 62 Report 5
ashes. Aquifer temperatures are between 200 and 340°C. At present, 102 wells have been drilled in this area, ranging in depth from 500 to 2800 m. The area has been divided into production and potential production fields namely East, Northeast, West, Central and Domes. The Olkaria East field is fully developed with a 45 MWe power station in operation. In the Northeast field, a 70 MWe power plant has been in operation since 2003. In Olkaria West, a 12 MWe plant is in operation, with plans to expand it to 60 MW. The Olkaria geothermal field is associated with the Olkaria volcanic complex. The geothermal reservoir is considered to be bounded by arcuate faults forming a ring or a caldera structure. A magmatic heat source might be represented by intrusions at deep levels inside the ring structure. Faults and fractures are prominent in the area with a general trend of N-S and E-W but there are also some inferred faults striking NW-SE. Other structures in the Olkaria area include the Ol’Njorowa gorge, N-S and NW-SE faults, and the ENE-WSW trending Olkaria Fault (Muchemi, 1999). Results of chemical analyses of samples from wells of the Olkaria geothermal area are shown in appendices. 3. SOLUTE GEOTHERMOMETERS Chemical and isotope geothermometers probably constitute the most important geochemical tool for the exploration and development of geothermal resources (Arnórsson, 2000a). A wide range of chemical geothermometers have been developed to estimate reservoir temperature in geothermal systems. In the 1960s, the first attempt was made to use water chemistry to evaluate subsurface temperature conditions in geothermal systems. The first geothermometer was entirely empirical. Bödvarsson and Pálmason (1961) observed that there was a good relation between the silica content of hot spring waters and reservoir temperature. Since then, several calibrations have been proposed for the quartz and chalcedony silica geothermometers. At present, geothermometers are classified into three groups (D’Amore and Arnórsson, 2000):
1) Water or solute geothermometers 2) Steam or gas geothermometers, and 3) Isotope geothermometers
The calculation of geothermal reservoir temperature, using chemical geothermometers (water and gas), involves various assumptions and simplifications. The application of water geothermometers is based on five basic assumptions (Fournier, 1977):
1) Temperature-dependent reactions involving rock and water fix the amount or amounts of dissolved “indicator” constituents in water;
2) There is an adequate supply of all reaction constituents; 3) There is equilibrium in the reservoir or aquifer with respect to the specific indicator reaction; 4) No re-equilibration of the “indicator” constituent occurs after the water leaves the reservoir; 5) Either no mixing of different waters occurs during ascent to the surface or evaluation of the
result of such mixing is possible.
Geothermometer equations are frequently described by the Wan’t Hoff equation:
273)(log−
+=
KbaT (1)

Report 5 63 Chelnokov
where a and b are constants that describe the linear relationship between log (K) and T, and T is in °C. The value of K depends on the reaction used for the geothermometer under consideration (KSiO2 for all silica geothermometers, K Na/K for all Na-K geothermometers, etc.). Only those minerals, whose solubility varies strongly with temperature, can be used as geothermometers. Such minerals include quartz and feldspars. It is the main reason why silica and the Na/K cation geothermometers are most common in the exploration for geothermal resources. Geothermometer equations used in this study are shown in Tables 1 and 2 in Appendix I. 3.1 Silica geothermometry The silica geothermometers are based on temperature-dependent changes in the solubility of the most common silica minerals: quartz, chalcedony, opal and amorphous silica. Also, solubilites of minerals may change with pressure. Pressure and added salts have little effect on the solubilites of quartz and amorphous silica below about 300°C (Fournier, 1989). Arnórsson (2000a) states that the quartz geothermometers work best in the temperature range of 120-250°C. At lower temperatures, other silica minerals such as chalcedony, cristobalite, or amorphous silica may control dissolved silica (Fournier, 1977), but there are no specific rules in this respect. In some areas, where water has been in contact with rock for a relatively long time, well developed quartz may control dissolved silica at temperatures less than 100°C. On the other hand, in some areas, chalcedony may control dissolved silica at temperatures as high as 180°C. Which silica mineral may constitute the controlling phase for aqueous silica concentration depends on the rate of two counteracting processes, dissolution of the primary silicate minerals of the rock, and precipitation of the silica mineral (D’Amore and Arnórsson, 2000). The rate of dissolution of the primary rock minerals is largely controlled by the pH of the water. 3.2 Cation geothermometry The cation geothermometers are based on temperature-dependent exchange reactions, which involve at least two minerals and the aqueous solution, thus fixing the ratios of suitable dissolved constituents. An exchange reaction between alkali feldspar and Na+ and K+ in aqueous solution has often been given as an example (Fournier and Truesdell, 1973):
K+ +NaAlSi3O8=K AlSi3O8+Na+ (2) The equilibrium constant for the reaction is:
))(())((
83
83+
+
=KONaAlSi
NaOKAlSiK (3)
Taking the solids to be pure (unit activity), no or equal complexing of Na+ and K+ in aqueous solution, and the activity coefficients to be the same to both ions, Equation 3 reduces to
[ ][ ]KNaK = (4)
where [Na] and [K] are the molalities of respective ions. The Na/K ratio generally works well for estimating temperatures of water above 200°C. The Na/K ratio can be affected by reactions with minerals other than alkali-feldspar, such as clay minerals.

Chelnokov 64 Report 5
4. CHEMICAL PROPERTIES OF THE GEOTHERMAL WATER 4.1 Sampling and analyses of geothermal fluids Samples of water from well № 101 and hot springs along the Kislaya River were collected by the geothermal group of the Far East Geological Institute in 2001. Also, samples of water from well № 201 and hot springs along the Doktorsky Brook were collected by the geothermal group of the Institute of Marine Geology and Geophysics in 2003. The water samples were filtered on site through a 0.45 µm pore filter into low density polyethylene bottles using a polypropylene filter holder. Measurement of pH, Eh, conductivity, carbonate carbon and dissolved oxygen were carried out on site. Major ion concentrations were analyzed by colorimetric, AAS and ICP-AES methods. The trace elements were analyzed by ICP-MS. Samples of gases were not collected. 4.2 Chemical composition of fluids from the Goriachy Pliazh field
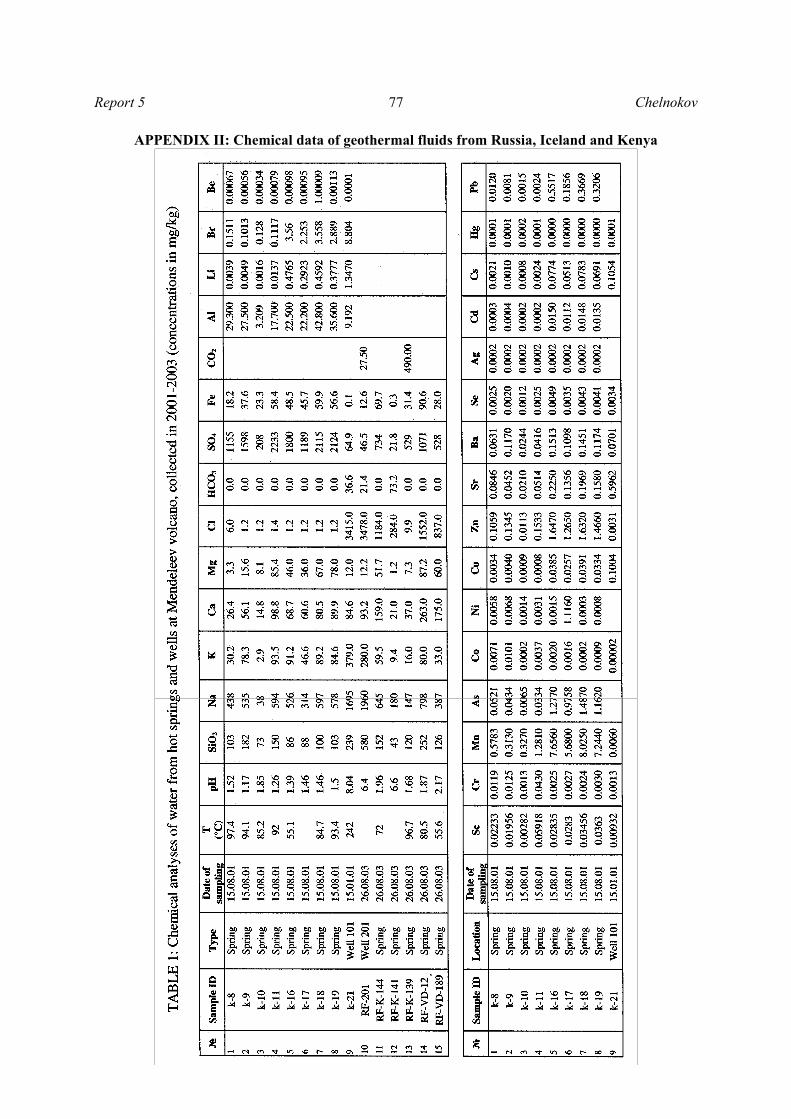
The present study is based on limited data from Russia obtained from samples collected in 2001 and 2003 of thermal springs and wells at Mendeleev volcano, a total of 15. Some of the samples were excluded because of the large differences in ionic balance. Of the samples considered, eleven were of waters from hot springs along the Kislaya River, two samples are of waters from hot springs along the Doktorskiy Brook, and the last two represent geothermal well discharges. Chemical analyses are shown in Table 1, Appendix II. Chemical analyses from Krafla and Olkaria are also shown there in Tables 2 and 3. Thermal waters have been classified as alkaline chloride waters, acid sulphate waters and acid sulphate-chloride waters (Ellis and Mahon, 1977). Three water types occur in the study area, Goriachy Pliazh field, Kunashir Island, as shown in Figures 6 and 7. The measured temperature of the springs at the times of collection of the samples was in the range of 55-97°C. The water discharged from the wells (alkali-chloride waters) contains high concentrations of chloride 3415-3478 ppm and sodium 1695-1960 ppm. The pH of the well samples is neutral 6.4-8.0 and TDS is in the range of 5145 – 6485 ppm. The hot springs can be divided into two groups: steam-heated acid sulphate (SO4) waters and acid sulphate-chloride (SO4-Cl) waters. The values of pH of the steam-heated SO4 waters range from 1.17 to 1.85. The content of sulphate is also very high 200-2233 ppm. The SO4-Cl waters have a little higher values of pH, 1.87-2.17. In these waters, the concentrations of Cl are 837-1552 ppm and SO4 734-1071 ppm. The process of formation for all types of thermal waters of the Goriachy Pliazh area is schematically shown in Figure 8. The alkali chloride thermal waters are long-time circulation waters (A). The
FIGURE 6: Triangular diagram for analyses of geothermal water, illustrating the principal water types

Report 5 65 Chelnokov
chemical composition of such waters is generally dominated by a close approach to mineral equilibria with respect to most components, but some components are conservative (chloride) (Ellis and Mahon, 1977). Hot steam, containing H2S, forms acid sulphate waters when rising from underground high-temperature waters, heating surface waters (B). Hydrogen sulphide in the steam is subsequently oxidized to sulphate, according to:
2O2+H2S → 2H+ +SO4-2
Hot springs of acid sulphate-chloride waters (C) may originate in several ways. Firstly, it may form by mixing of the water types mentioned above. Secondly, it may form by sulphide oxidation to bisulphate as in alkali chloride waters at depth. High-bisulphate waters of close to neutral pH underground may become acid on rising to cooler conditions at the
FIGURE 7: The relationships between Cl and SiO2, and Cl and SO4 in the Goriachy Pliazh field
FIGURE 8: Simplified geological cross-section of the Goriachy Pliazh geothermal system (modified from Baskov and Surikov,
1975) and model for the formation of various types of geothermal waters (see text for further explanation)
Chelnokov 66 Report 5
surface. Another way of forming acid sulphate-chloride waters is by sulphur hydrolysis at depth through reactions with sulphur-containing rocks. The hydrolysis of sulphur to sulphate produces an acid solution. Finally, theses types of waters form when high-temperature steam rises from molten material at shallow depths to condense into surface or near-surface waters. The relationship between chloride and sulphate (Figure 7) and chloride and silica is specific for each of the three types of thermal water. 5. APPLICATION OF CHEMICAL PROGRAMS The aqueous speciation program WATCH (Arnórsson et al., 1982; Arnórsson and Bjarnason, 1993; Bjarnason, 1994) is a useful tool for interpreting the chemical composition of geothermal fluids. The input to the program is a component analysis of each phase (liquid, water, steam) of the geothermal fluid at the surface, including the water pH and the temperature at which it was measured, and specification of the reference temperature at which the aqueous speciation is calculated. The temperature at which the program calculations are performed, refers either to equilibrium with quartz, chalcedony, the Na-K geothermometry temperature, or a value which may be arbitrarily selected, or which corresponds to the measured water temperature. All the chemical components that occur in major concentrations in geothermal waters and/or rocks commonly found in geothermal systems are included. The concentration of all the aqueous species (69) considered in the program are expressed in terms of the component concentration by mass balance equations. The chemical equilibria between the species are expressed as mass action equations. Solubility data of 29 commonly occurring geothermal minerals are also incorporated to facilitate comparison between water chemistry and mineral solubilities in order to assess the state of equilibrium between solution and particular minerals. The two sets of equations are solved simultaneously by an iterative procedure, which is carried out a few times during each run of the program. An initial estimate of the ionic strength of the water is obtained using only the concentrations of the major cations. This value is used to calculate all activity coefficients at the temperature of the pH measurement, using the extended Debye-Huckel equation. The aqueous species disseciation reaction and mass balance equations are now solved simultaneously at this temperature to yield a distribution of species. From the distribution of species, a new value for the ionic strength is computed. This value is used to recompute the activity coefficients and species concentrations, still at the temperature of the pH measurement. Activity coefficients of non-charged aqueous species are taken to be equal to unity. The calculations of individual aqueous species activities are repeated using the updated values for ionic strength until a certain small difference is attained between the updated ionic strength value and the previous one. The WATCH program may also be used to study chemical changes accompanying adiabatic boiling and conductive cooling of geothermal waters, to compute the resulting species concentrations, activity coefficients, and activity and solubility products from the reference temperature to some lower temperature (Bjarnason, 1994). In the present study, the WATCH program has been specially used to estimate saturation of common scale forming minerals during adiabatic boiling of selected geothermal waters.

Report 5 67 Chelnokov
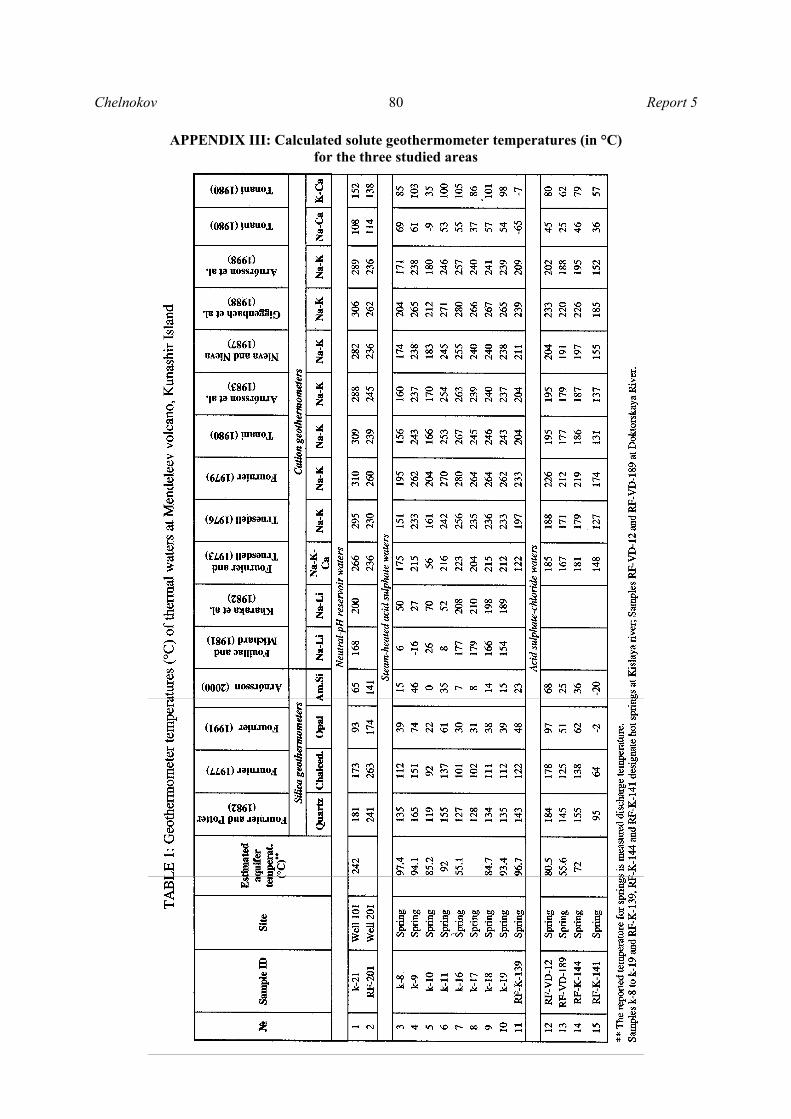
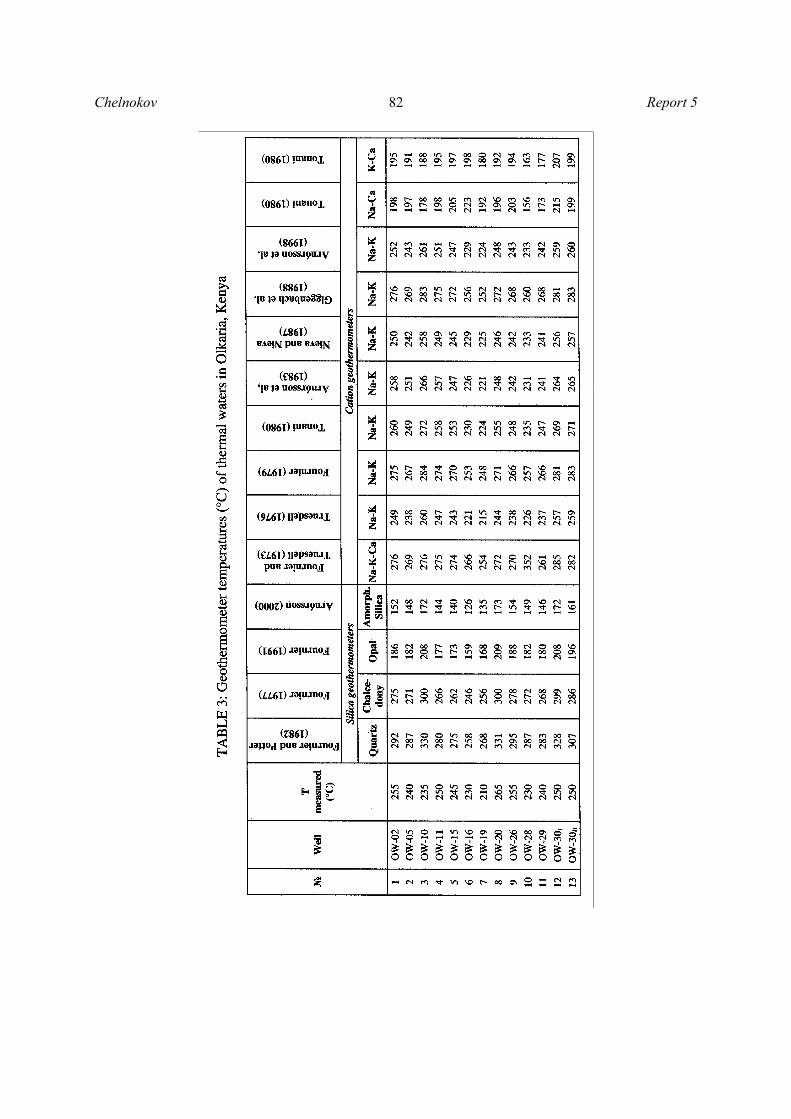
6. APPLICATION OF GEOTHERMOMETERS In this chapter, data from the three study areas were used to investigate the relationship between several geothermometer temperatures, and aquifer temperatures. Samples were collected under different conditions. At Krafla, water and steam samples were collected at the same pressure. At Olkaria, water samples were collected from the weirbox at atmospheric pressure, but steam samples at elevated pressure. At Goriachy Pliazh, only water samples were collected at atmospheric pressure. Quartz equilibrium and Na/K temperatures have been calculated for the three study areas together with some other geothermometer temperatures (Tables 1-3, Appendix III). Since all the study areas are of the high-temperature type, it is expected that the quartz and Na/K geothermometers will give reliable information on aquifer temperatures for individual wells. The other geothermometer temperatures provide useful information on the state of saturation of the respective silica phases in the steam-heated acid-sulphate waters. Different temperature equations have been proposed for the quartz geothermometer. For Krafla and Olkaria, the quartz solubility equation of Fournier and Potter (1982) yields, on average, temperatures which are 6° lower and 6°C higher, respectively, than the estimated aquifer temperature (Figure 9). For the only well at Goriachy Pliazh, the quartz geothermometer of Fournier and Potter (1982) gives a value which is 61°C lower than the aquifer temperature (Figure 9). This aquifer temperature is based on temperature measurements in the well after it had stabilized thermally and is regarded reliable. The discrepancy is unduly large. The cause is not known but the reason could be inadequate sampling causing some of the silica to be lost from solution in the time between sampling and analysis. The steam-heated acid waters are over-saturated with both quartz and chalcedony, but under-saturated with respect to opal and amorphous silica. It is therefore clear that these two phases do not control the silica concentrations in these waters. In view of their origin, the quartz or the chalcedony geothermometers do not reflect aquifer temperatures at depth. The Na-K geothermometer correlates well with the estimated aquifer and the quartz equilibrium temperatures for the wells at Krafla and Olkaria (Figure 10). For the only well at Goriachy Pliazh, for
FIGURE 9: Quartz geothermometer temperaturevs. measured temperature (the data for acid
water from Goriachy Pliazh show quartz equilibrium temperature vs. measured
discharge temperature)
FIGURE 10: Na-K geothermometer temperaturevs. measured temperature (the data for acid water
from Goriachy Pliazh show Na-K equilibrium temperature vs. measured discharge
temperature)
Chelnokov 68 Report 5
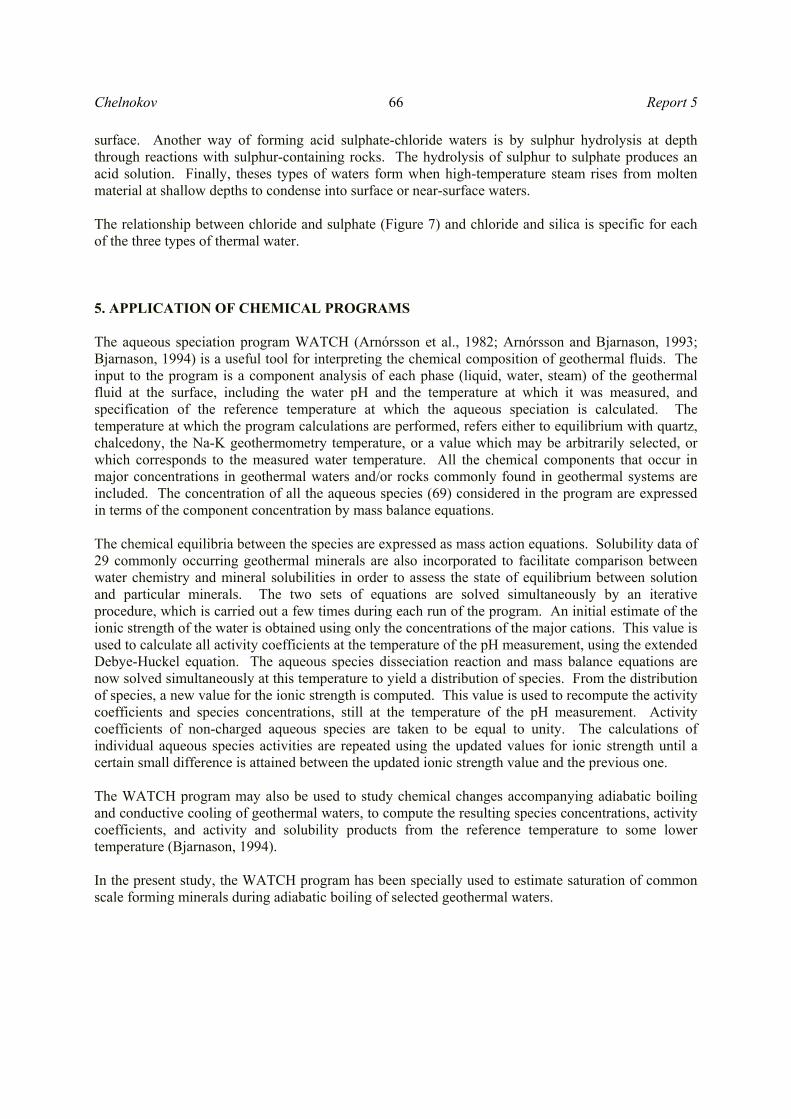
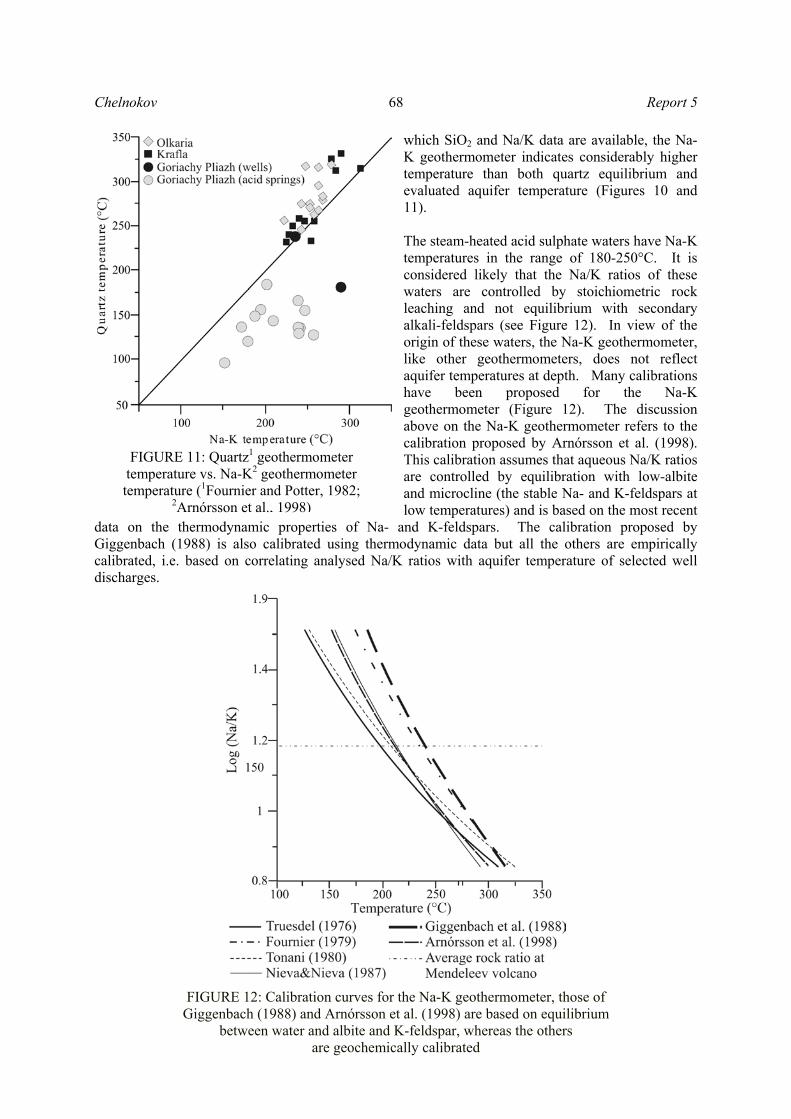
which SiO2 and Na/K data are available, the Na-K geothermometer indicates considerably higher temperature than both quartz equilibrium and evaluated aquifer temperature (Figures 10 and 11). The steam-heated acid sulphate waters have Na-K temperatures in the range of 180-250°C. It is considered likely that the Na/K ratios of these waters are controlled by stoichiometric rock leaching and not equilibrium with secondary alkali-feldspars (see Figure 12). In view of the origin of these waters, the Na-K geothermometer, like other geothermometers, does not reflect aquifer temperatures at depth. Many calibrations have been proposed for the Na-K geothermometer (Figure 12). The discussion above on the Na-K geothermometer refers to the calibration proposed by Arnórsson et al. (1998). This calibration assumes that aqueous Na/K ratios are controlled by equilibration with low-albite and microcline (the stable Na- and K-feldspars at low temperatures) and is based on the most recent
data on the thermodynamic properties of Na- and K-feldspars. The calibration proposed by Giggenbach (1988) is also calibrated using thermodynamic data but all the others are empirically calibrated, i.e. based on correlating analysed Na/K ratios with aquifer temperature of selected well discharges.
FIGURE 12: Calibration curves for the Na-K geothermometer, those of Giggenbach (1988) and Arnórsson et al. (1998) are based on equilibrium
between water and albite and K-feldspar, whereas the others are geochemically calibrated
FIGURE 11: Quartz1 geothermometer temperature vs. Na-K2 geothermometer temperature (1Fournier and Potter, 1982;
2Arnórsson et al., 1998)
Report 5 69 Chelnokov
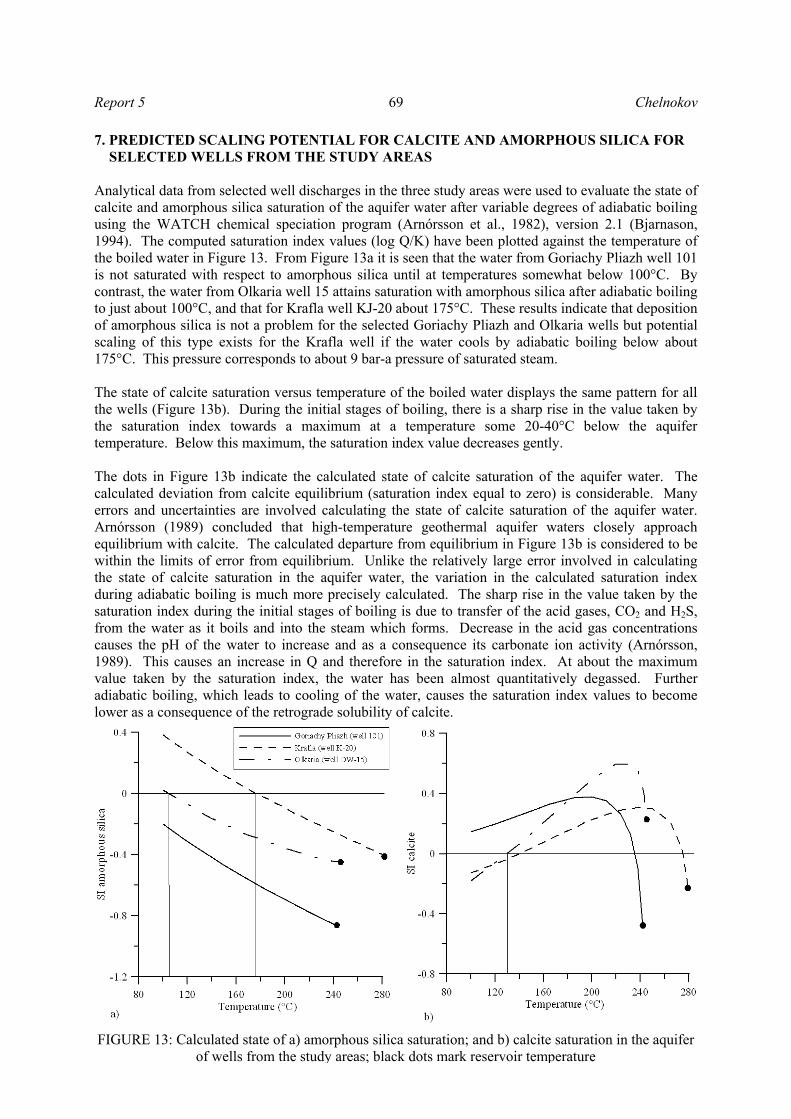
7. PREDICTED SCALING POTENTIAL FOR CALCITE AND AMORPHOUS SILICA FOR SELECTED WELLS FROM THE STUDY AREAS Analytical data from selected well discharges in the three study areas were used to evaluate the state of calcite and amorphous silica saturation of the aquifer water after variable degrees of adiabatic boiling using the WATCH chemical speciation program (Arnórsson et al., 1982), version 2.1 (Bjarnason, 1994). The computed saturation index values (log Q/K) have been plotted against the temperature of the boiled water in Figure 13. From Figure 13a it is seen that the water from Goriachy Pliazh well 101 is not saturated with respect to amorphous silica until at temperatures somewhat below 100°C. By contrast, the water from Olkaria well 15 attains saturation with amorphous silica after adiabatic boiling to just about 100°C, and that for Krafla well KJ-20 about 175°C. These results indicate that deposition of amorphous silica is not a problem for the selected Goriachy Pliazh and Olkaria wells but potential scaling of this type exists for the Krafla well if the water cools by adiabatic boiling below about 175°C. This pressure corresponds to about 9 bar-a pressure of saturated steam. The state of calcite saturation versus temperature of the boiled water displays the same pattern for all the wells (Figure 13b). During the initial stages of boiling, there is a sharp rise in the value taken by the saturation index towards a maximum at a temperature some 20-40°C below the aquifer temperature. Below this maximum, the saturation index value decreases gently. The dots in Figure 13b indicate the calculated state of calcite saturation of the aquifer water. The calculated deviation from calcite equilibrium (saturation index equal to zero) is considerable. Many errors and uncertainties are involved calculating the state of calcite saturation of the aquifer water. Arnórsson (1989) concluded that high-temperature geothermal aquifer waters closely approach equilibrium with calcite. The calculated departure from equilibrium in Figure 13b is considered to be within the limits of error from equilibrium. Unlike the relatively large error involved in calculating the state of calcite saturation in the aquifer water, the variation in the calculated saturation index during adiabatic boiling is much more precisely calculated. The sharp rise in the value taken by the saturation index during the initial stages of boiling is due to transfer of the acid gases, CO2 and H2S, from the water as it boils and into the steam which forms. Decrease in the acid gas concentrations causes the pH of the water to increase and as a consequence its carbonate ion activity (Arnórsson, 1989). This causes an increase in Q and therefore in the saturation index. At about the maximum value taken by the saturation index, the water has been almost quantitatively degassed. Further adiabatic boiling, which leads to cooling of the water, causes the saturation index values to become lower as a consequence of the retrograde solubility of calcite.
FIGURE 13: Calculated state of a) amorphous silica saturation; and b) calcite saturation in the aquifer of wells from the study areas; black dots mark reservoir temperature

Chelnokov 70 Report 5
Calcite precipitates readily from solution. Therefore boiling of an initially calcite saturated aquifer water, which leads to over-saturation, is expected to cause deposition of calcite. This deposition will be strongest during the initial stages of boiling, then decline and possibly stop. As pointed out by Arnórsson (1978, 1989), calcite scaling in production wells in high-temperature geothermal fields, is not expected to be a problem if extensive boiling occurs in producing aquifers. When this is the case, most of the calcite precipitation occurs in the aquifer and the aquifer rock is expected to have a much greater capacity to cope with the deposition than the well bore due to the larger volume of pore space. 8. ENVIRONMENTAL IMPACT OF THE ACID-SULPHATE WATERS ON THE NEARBY RIVERS IN THE GORIACHY PLIAZH GEOTHERMAL FIELD The objective of this chapter is to assess the environmental impact of the steam-heated acid-sulphate spring waters on the nearby rivers in the Mendeleev field. When assessing the characteristics of the chemistry of the springs, reference is made to Russian and European standards of water quality for domestic use and aquatic life. In general, geothermal waters with the highest pollution potential are those of high salinity and discharged from very hot reservoirs. As pointed out by Ellis (1978), the concentrations of heavy metals in geothermal waters tend to increase in proportion to the square of the mineralization. The most common pollutants in geothermal waters are hydrogen sulphide, arsenic, boron, mercury, aluminium and heavy metals, such as lead and cadmium (Ármannsson and Kristmannsdóttir, 1992). Trace element analyses of steam-heated acid sulphate springs in the solfatara field of the Kislaya River are presented in Table 1. Their content of Al, As, Cd, Co, Cs, Cu, Cr, Mn, Ni, Pb and Zn is higher than allowed values for domestic use by European Union standards, and for aquatic life by Russian standards, and sometimes much higher. This is particularly the case for Al but also Cu, and Cl is high.
TABLE 1: Water quality standards and average concentrations of trace elements in geothermal acid water at Goriachy Pliazh
Recommended maximum
Components Average in water
of Northeast solfatara field
Geothermal water from
well 101 European Union
standards1 Russian
standards2 рН 1.45 8.04 9.5 7-8 O2 (dissolved) 17.25 Not less 7-8
Concentrations in ppm Cl 1.82 3415 5 SO4 1552 64.9 250 5 Total Fe 43.51 0.1 0.2 0.3 Al 22.30 9.19 0.2 Pb 0.16 n.a 0.05 0.1 Zn 0.71 0.00 0.01 Ag 0.16 n.a 0.01 Cu 0.02 0.10 0.01 Ni 0.13 n.a 0.05 0.01 Cd 0.006 n.a 0.005 0.005 Mn 30.59 0.00 0.05 50 Co 0.00 0.00 0.01 Hg 0.00 n.a 0.001 As 0.56 n.a 0.05 0.05
1 European Union standards for domestic waters; 2 Russian standards for water-supply of salmon fishing farm; n.a – not analysed

Report 5 71 Chelnokov
Exploitation of geothermal systems causes reservoir pressures to decline. This is known to cause hot springs to dry out but it may enhance fumarolic activity. It should be specifically studied if exploitation of the geothermal resource at Mendeleev volcano could have a positive environmental impact with respect to the present natural chemical pollution of river water in the area. 9. CONCLUSIONS AND RECOMMENDATIONS The project pursued the following purposes:
• Geochemical interpretation of thermal fluids from Mendeleev volcano, Kunashir, Russia; • Geothermometry and scaling tendency; • The environmental impact of the steam-heated acid sulphate waters on the rivers in the
Mendeleev geothermal fields. The results obtained indicate that the geothermal waters from Mendeleev volcano are of three types: alkaline chloride waters, acid sulphate waters, and acid sulphate-chloride waters. The alkaline chloride waters are characteristic of the deep geothermal reservoir, the two other groups are steam-heated waters from springs. Based on this data and following Ellis and Mahon (1977), the modes of formation of various types of geothermal waters from Mendeleev volcano were described. For estimation of aquifer temperature of the wells, different solute geothermometers were used. Only one analysis of well discharge of Goriachy Pliazh area was accessible, but other well-known high-temperature geothermal fields were included in this study - Krafla in Iceland and Olkaria in Kenya. The silica and the most important cation geothermometers were used for this study. The silica geothermometer which is applicable is the quartz geothermometer since all the study areas are of the high-temperature type. For the cation geothermometers, Na-K, Na-Li, Na-K-Ca, Na-Ca and K-Ca temperatures were also calculated. For the Krafla and Olkaria areas, the Na-K geothermometer temperatures gave a good estimate of the aquifer temperatures. For the Goriachy Pliazh well, on the other hand, the Na-K geothermometer gives very high temperature. Na-Li, Na-Ca and K-Ca geothermometers give low values of temperature for the Goriachy Pliazh well. The same applies to Krafla and Olkaria. For the Goriachy Pliazh well, the geothermometer temperature which is closest to the aquifer temperature is that of the Na-K-Ca geothermometer. For Krafla and Olkaria, this temperature is lower than estimated aquifer temperatures. Chemical analyses of steam-heated acid water from springs of Mendeleev volcano cannot be used for estimation of reservoir temperatures because this water does not contain information about reservoir fluid. Due to this, it is important to take samples of gases (H2, N2, O2, CH4, CO2, H2S and others) from fumaroles for estimation of reservoir temperatures. The state of calcite and amorphous silica saturation in variably boiled reservoir waters was calculated with the aid of the WATCH chemical speciation program. Calcite scaling for all the studied fluids is expected to be most intense at the depth level of initial boiling in the aquifers. Amorphous silica scaling is only expected for the studied well at Krafla, Iceland, but no calcite scaling is predicted in the wells from any study areas.
The environmental impact of the natural geothermal manifestations on the nearby rivers of Mendeleev volcano have been evaluated. The chemical data from steam-heated waters and the exploitation well were compared with requirements of Russian and European Union water quality standards. The studied steam-heated waters have high concentrations of heavy metals and other trace elements that have an adverse effect on surface water quality in the area. According to the available chemical data, the main pollutants in this water are Cl, Cu and Al.

Chelnokov 72 Report 5
Also, the temperature of water is a very important factor. As a result of this warmer water, solubility of oxygen in water decreases. The amount of oxygen dissolved in the warmer water can become exhausted leading to death of aquatic living organisms. One way to improve the situation would be to develop the field, thus causing the hot springs to dry out. The waste water from the 0.7 MWe power plant at the Goriachy Pliazh was disposed of on the surface. This posed an additional environmental problem. This water has high temperature and contains chemical constituents in quantities unacceptable for direct discharge into fresh water.
ACKNOWLEDGEMENTS I wish to thank the Government of Iceland and the United Nations University for supporting this training programme. Deepest thanks are expressed to Dr. Ingvar B. Fridleifsson, director of the UNU Geothermal Training Programme and Mr. Lúdvík S. Georgsson, Deputy Director, for their excellent guidance and successful operation of the programme. My special thanks go to my supervisor Dr. Stefán Arnórsson, for his great help and critical advice during all stages of the data analysis and the preparation of this report. I sincerely thank Mrs. Gudrún Bjarnadóttir for generous help during all the time of my stay in Iceland. I wish to give my thanks to all lecturers and staff members at ÍSOR for their comprehensive presentations and willingness to share their knowledge and experience. Also I express my thanks to my colleagues for supplying the data presented here.
REFERENCES
Ármannsson, H., Gíslason, G., and Hauksson, T., 1982: Magmatic gases in well fluids aid the mapping of the flow pattern in a geothermal system. Geochim. Cosmochim. Acta, 46, 167-177. Ármannsson, H., Gudmundsson, Á., and Steingrímsson, B.S., 1987: Exploration and development of the Krafla geothermal area. Jökull, 37, 12-29. Ármannsson, H., and Kristmannsdóttir, H., 1992: Geothermal environmental impact. Geothermics, 21-5/6, 869-880. Arnórsson, S., 1978: Precipitation of calcite from flashed geothermal waters in Iceland. Contrib. Mineral. Petrol. 66, 21-28. Arnórsson, S., 1985: The use of mixing models and chemical geothermometers for estimating underground temperature in geothermal systems. J. Volc. Geotherm. Res., 23, 299-335. Arnórsson, S., 1989: Deposition of calcium carbonate minerals from geothermal waters-theoretical considerations. Geothermics, 18, 33-39. Arnórsson, S., (ed.), 2000a: Isotopic and chemical techniques in geothermal exploration, development and use. Sampling methods, data handling, interpretation. International Atomic Energy Agency, Vienna, 351 pp. Arnórsson, S., 2000b: The quartz and Na/K geothermometers. I. New thermodynamic calibration. Proceedings of the World Geothermal Congress 2000, Kyushu-Tohoku, Japan, 929-934.

Report 5 73 Chelnokov
Arnórsson, S., Andrésdóttir, A., Gunnarsson, I., and Stefánsson, A., 1998: New calibration for the quartz and Na/K geothermometers – valid in the range 0-350oC (in Icelandic). Proceedings of the Geoscience Society of Iceland Annual Meeting, April, 42-43. Arnórsson, S., and Bjarnason, J.Ö., 1993: Icelandic Water Chemistry Group presents the chemical speciation programme WATCH. Science Institute, University of Iceland, Orkustofnun, Reykjavík, 7 pp. Arnórsson, S., Gunnlaugsson, E., and Svavarsson, H., 1983: The chemistry of geothermal waters in Iceland III. Chemical geothermometry in geothermal investigations. Geochim. Cosmochim. Acta, 47, 567-577. Arnórsson, S., Sigurdsson, S., and Svavarsson, H., 1982: The chemistry of geothermal waters in Iceland I. Calculation of aqueous speciation from 0°C to 370°C. Geochim. Cosmochim. Acta, 46, 1513-1532. Baskov, E.A, and Surikov, S.N., 1975. Hydrotherms of the Pacific segment of the Earth. Nedra Publ. Moscow. Bjarnason, J.Ö., 1994: The speciation program WATCH, version 2.1. Orkustofnun, Reykjavík, 7 pp. Björnsson, A., 1985: Dynamics of crustal rifting in NE Iceland. J. Geophys. Res., 90-B12, 10151-10162. Björnsson, A., Saemundsson, K., Einarsson, P., Tryggvason, E., and Grönvold, K., 1977: Current rifting episode in North Iceland. Nature, 266, 318-323. Bödvarsson, G., and Pálmason, G., 1961: Exploration of subsurface temperatures in Iceland. Jökull, 11, 39-48. Bödvarsson, G.S., Benson, S.M., Sigurdsson, Ó., Stefánsson, V., and Elíasson, E.T., 1984: The Krafla geothermal field, Iceland. 1. Analysis of well test data. Water Resources Research, 20-11, 1515-1530. Chudaev, O.V., Chudaeva, V.A., Sugimori, K., Kuno A., Matsuo, M., and Nordstrom, D.K., 2004. Chemical composition and formation of thermal waters in Kuril’s Islands (Far East Russia). Water-Rock Interaction, Proceedings 1, 105-108. D’Amore, F., and Arnórsson, S., 2000: Geothermometry. In: Arnórsson, S. (ed.), Isotopic and chemical techniques in geothermal exploration, development and use. Sampling methods, data handling, interpretation. International Atomic Energy Agency, Vienna, 152-199. Ellis, A.J., 1978: Environmental impact of geothermal development. Report prepared for the United Nations Environmental Programme, UNEP. Ellis, A.J., and Mahon, W.A.J., 1977: Chemistry and geothermal systems. Academic Press, New York, 392 pp. Fouillac, C., and Michard, G., 1981: Sodium/lithium ratios in water applied to geothermometry of geothermal reservoirs. Geothermics, 10, 55-70. Fournier, R.O., 1977: Chemical geothermometers and mixing model for geothermal systems. Geothermics, 5, 41-50.

Chelnokov 74 Report 5
Fournier, R.O., 1979: A revised equation for Na-K geothermometer. Geoth. Res. Council, Trans., 3, 221-224. Fournier, R.O., 1989: Lectures on geochemical interpretation of hydrothermal waters. UNU-GTP, Iceland, report 10, 73 pp. Fournier, R.O., 1991: Water geothermometers applied to geothermal energy. In: D’Amore, F. (coordinator), Application of Geochemistry in Geothermal Reservoir Development. UNITAR/UNDP publication, Rome, 37-69. Fournier R.O., and Potter, R.W.III., 1982: A revised and expanded silica (quartz) geothermometer. Geotherm. Resourc. Counc., Bull., 11-10, 3-12. Fournier, R.O., and Truesdell, A.H., 1973: An empirical Na-K-Ca geothermometer for natural waters. Geochim. Cosmochim. Acta, 37, 1255-1275. Giggenbach, W.F., 1988: Geothermal solute equilibria. Derivation of Na-K-Mg-Ca geoindicators. Geochim. Cosmochim. Acta, 52, 2749-2765. Gudmundsson, B.T., and Arnórsson, S., 2002: Geochemical monitoring of the Krafla and Námafjall geothermal areas, N-Iceland. Geothermics, 31, 195-243. Gunnarsson, I., and Arnórsson, S., 2000: Amorphous silica solubility and the thermodynamic properties of H4SiO4 in the range 0° to 350°C at Psat. Geochim. Cosmochim. Acta, 64, 2295-2307. Karingithi, C.W., 2002: Hydrothermal mineral buffers controlling reactive gases concentration in the Greater Olkaria geothermal system, Kenya. University of Iceland, MSc. thesis, UNU-GTP, Iceland, report 2, 61 pp. Kharaka, Y.K., Lico, M.S., and Law, L.M., 1982: Chemical geothermometers applied to formation waters, Gulf of Mexico and California basins (abs.). Am. Assoc. Petrol. Geol. Bull., 66, 588. Kononov, V.I., 1983: Geochemistry of thermal waters in modern volcanic areas. Nauka Publ. Moscow. Lebedev, L.M., 1979: Minerals of modern hydrotherms. Nedra Publ. Moscow. Markhinin, E. K. and Stratula, D.S., 1977: Hydrotherms of the Kuril Islands. Nauka Publ. Moscow, 140-144. Menyailov, I.A., Nikitina, L.P. & Shapar, V.N., 1988: Features of chemical and isotopic composition of fumarole gases during inter-eruptive periods of Ebeko Volcano activity. Volcanol. Seismol., 4, 21-36. Muchemi, G.G., 1999: Conceptualised model of the Olkaria geothermal field. The Kenya Electricity Generating Company, Ltd, internal report, 46 pp. Nieva, D., and Nieva, R., 1987: Developments in geothermal energy in Mexico, part 12-A: Cationic composition geothermometer for prospection of geothermal resources. Heat Recovery Systems and CHP,7, 243-258. Rosliy, G.A., and Priadko, A.F., 1999: Estimation of resources of geothermal fluid in Mendeleev field of Goriachy Pliazh geothermal area. Vostokgeologia Ltd., Uzhno-Sakhalinsk, internal report (in Russian), 490 pp.

Report 5 75 Chelnokov
Stefánsson, V., 1981: The Krafla geothermal field, northeast Iceland. In: Rybach, L., and Muffler, L.J.P. (eds.), Geothermal systems: Principles and case histories. John Wiley and Son Ltd., Chichester, 273-294. Tonani, F., 1980: Some remarks on the application of geochemical techniques in geothermal exploration. Proceedings, Adv. Eur. Geoth. Res., 2nd Symposium, Strasbourg, 428-443. Truesdell, A.H., 1976: Summary of section III - geochemical techniques in exploration. Proceedings of the 2nd U.N. Symposium on the Development and Use of Geothermal Resources, San Francisco, 1, liii-lxxix. Zelenov, K.K., 1972: Volcanoes as sources of ore-forming components of sedimentary formations. Nauka Publ. Moscow. Zlobin, T.K., Abdurakhmanov, A.L., and Zlobina L.M., 1999: Prospecting of steam hydrothermal deposits of the Mendeleyev volcano by the seismic method (Kinashir Island). Geology of the Pacific Ocean, 18, 21-32.
APPENDIX I: Temperature equations for solute geothermometers
TABLE 1: Temperature equations for the silica geothermometers (S represents silica concentrations as SiO2 in mg/kg)
Geothermometer Equation Range (°C) Source
Quartz -42.2 + 0.28831S - 3.6686×10⁻⁴S2 + 3.1665 ×10⁻⁷S3 + 77.0341 log S 25-900 Fournier and Potter (1982)
Quartza,b -53.5 + 0.11236S - 0.5559×10⁻⁴ S2 + 0.1772×10⁻⁷ S3 + 88.390 log S Fournier and Potter (1982)
Chalcedony 15.273log69.4
1032−
− S 0-250 Fournier (1977)
Opal 15.273log51.4
781−
− S 25-250 Fournier (1991)
Amorphous silicac -121.6 + 0.2694S - 1.8101×10⁻⁴ S2
+7.5221×10⁻⁸ S3 + 55.1141 log S 0-350 Arnórsson (2000b)
a Silica concentrations in water initially in equilibrium with quartz after adiabatic boiling to 1000C; b As presented by Arnórsson (1985); c Based on Gunnarsson and Arnórsson (2000).

Chelnokov 76 Report 5
TABLE 2: Temperature equations for the cation geothermometers (concentrations are in ppm if not otherwise specified)
Geothermo-
meter Equation Range (°C) Source
Na-Ka 733.6-770.551Y + 378.189Y2 - 95.753Y3 + 9.544Y4 0-350 Arnórsson et al. (1998)
Na-Li c, d 15.273)/log(389.0
1000−
− LiNa Fouillac and Michard
(1981)
Na-Li d, e 15.273)/log(130.0
1195−
− LiNa Fouillac and Michard
(1981)
Na-Li 15.273)/log(779.0
1590−
+ LiNa Kharaka et al. (1982)
Na-K-Ca f 15.27324.2)/log()/log(
16475.0 −
++ NaCaKNa β Fournier and
Truesdell (1973)
Na-K 15.273)/log(857.0
856−
+ KNa 100-275 Truesdell (1976)
Na-K 15.273)/log(438.1
1217−
+ KNa Fournier (1979)
Na-K 15.273)/log(780.0
833−
+ KNa Tonani (1980)
Na-K 15.273)/log(993.0
933−
+ KNa 25-250 Arnórsson et al.
(1983)
Na-K 15.273)/log(699.1
1319−
+ KNa 250-350 Arnórsson et al.
(1983)
Na-K 15.273)/log(470.1
1178−
+ KNa Nieva and Nieva
(1987)
Na-K 15.273)/log(750.1
1390−
+ KNa Giggenbach (1988)
Na-Ca f 15.273)/log(08.3
7.10965.0 −
− CaNa Tonani (1980)
Na-Ca f 15.273)/log(861.3
19305.0 −
− CaKa Tonani (1980)
a Y designates the logarithm of the molal ratio Na/K; b For log (K2/Mg) <1.25; c Valid for Cl concentrations <0.3 mol/kg; d Concentrations are in mmol/kg; e Valid for Cl concentrations >0.3 mol/kg; f Concentrations are in mol/kg; Β = 4/3 for t<100°C and 1/3 for t>100°C and for log(Ca0.5/Na) < 0
Report 5 77 Chelnokov
APPENDIX II: Chemical data of geothermal fluids from Russia, Iceland and Kenya

Chelnokov 78 Report 5

Report 5 79 Chelnokov
Chelnokov 80 Report 5
APPENDIX III: Calculated solute geothermometer temperatures (in °C) for the three studied areas

Report 5 81 Chelnokov
Chelnokov 82 Report 5
Related Documents


