Interpretation and evaluation of combined measurement techniques for soil CO 2 efflux: Discrete surface chambers and continuous soil CO 2 concentration probes Diego A. Riveros-Iregui, 1 Brian L. McGlynn, 1 Howard E. Epstein, 2 and Daniel L. Welsch 3 Received 24 June 2008; revised 17 September 2008; accepted 27 October 2008; published 9 December 2008. [1] Soil CO 2 efflux is a large respiratory flux from terrestrial ecosystems and a critical component of the global carbon (C) cycle. Lack of process understanding of the spatiotemporal controls on soil CO 2 efflux limits our ability to extrapolate from fluxes measured at point scales to scales useful for corroboration with other ecosystem level measures of C exchange. Additional complications are introduced by the effects of soil water content seasonality and rainfall on the performance of measurement techniques. In this paper we present measurements of soil CO 2 efflux made at two contrasting sites within a characteristic subalpine forest of the northern Rocky Mountains. Comparison of measurements between the soil respiration chamber technique and the soil CO 2 profile technique over daily and seasonal time scales indicated that soil water content plays a major role in the magnitude and seasonality of soil CO 2 efflux, especially after snowmelt or following summer rainfall. Agreement between both techniques was limited during high soil water content conditions and after summer rainfall. Differences in diel hysteresis patterns of soil CO 2 efflux between sites were controlled by the effects of canopy cover and temporal differences in photosynthetic activity of vegetation. Our results indicate that an accurate parameterization of soil water content heterogeneity in space and time must be a critical component of realistic model representations of soil CO 2 efflux from heterogeneous landscapes. Citation: Riveros-Iregui, D. A., B. L. McGlynn, H. E. Epstein, and D. L. Welsch (2008), Interpretation and evaluation of combined measurement techniques for soil CO 2 efflux: Discrete surface chambers and continuous soil CO 2 concentration probes, J. Geophys. Res., 113, G04027, doi:10.1029/2008JG000811. 1. Introduction [2] Soil CO 2 efflux is a natural process by which soil carbon is released into the atmosphere through autotrophic and heterotrophic respiration. Evaluating and predicting soil CO 2 efflux response to differences in hydrologic conditions (e.g., groundwater recharge and discharge areas, soil water content, precipitation, and land cover) are largely constrained by the methods used to measure, interpret, and model soil CO 2 efflux. Rates of soil CO 2 efflux are currently estimated from a wide range of ecosystems with manual soil respira- tion chambers [Fang and Moncrieff, 1996; Subke and Tenhunen, 2004; Welsch and Hornberger, 2004], automated soil respiration chambers [Goulden and Crill, 1997; Savage and Davidson, 2001; Burrows et al., 2005], and the soil CO 2 profile technique [Tang et al., 2003; Jassal et al., 2005; Tang and Baldocchi, 2005]. Particularly in the last 5 years, the soil CO 2 profile technique has gained popularity because it can provide continuous and automated measurements at temporal scales useful for comparison with other techniques of ecosystem C exchange such as eddy covariance towers [Baldocchi et al., 2006]. While a wealth of ongoing studies use either technique, a direct comparison of their perfor- mance, measurements, strengths, and limitations in space and time is lacking. [3] It has been suggested that the interactions among precipitation, infiltration, evaporation, transpiration, and soil drainage exert a major control on vegetation activity in water-limited ecosystems [Ridolfi et al., 2000; Porporato et al., 2002]. Large gaps exist in our understanding of the variability of soil CO 2 efflux in response to changing hydrologic conditions across space and time. Traditionally, studies addressing the variability of soil CO 2 efflux focus on its temporal component (e.g., diel, seasonal, and yearly variability) but tend to omit the spatial component inherent to this flux (i.e., landscape-induced variability). This omis- sion limits the capability of temperature-based models [Lloyd and Taylor, 1994] to accurately estimate soil CO 2 efflux from areas having different characteristics within similar ecosystems. More importantly, this omission restricts our understanding of how CO 2 -producing processes simultaneously develop in space and time to generate the JOURNAL OF GEOPHYSICAL RESEARCH, VOL. 113, G04027, doi:10.1029/2008JG000811, 2008 1 Department of Land Resources and Environmental Sciences, Montana State University, Bozeman, Montana, USA. 2 Department of Environmental Sciences, University of Virginia, Charlottesville, Virginia, USA. 3 Canaan Valley Institute, Davis, West Virginia, USA. Copyright 2008 by the American Geophysical Union. 0148-0227/08/2008JG000811 G04027 1 of 11

Welcome message from author
This document is posted to help you gain knowledge. Please leave a comment to let me know what you think about it! Share it to your friends and learn new things together.
Transcript
Interpretation and evaluation of combined measurement techniques
for soil CO2 efflux: Discrete surface chambers and continuous soil CO2
concentration probes
Diego A. Riveros-Iregui,1 Brian L. McGlynn,1 Howard E. Epstein,2 and Daniel L. Welsch3
Received 24 June 2008; revised 17 September 2008; accepted 27 October 2008; published 9 December 2008.
[1] Soil CO2 efflux is a large respiratory flux from terrestrial ecosystems and a criticalcomponent of the global carbon (C) cycle. Lack of process understanding of thespatiotemporal controls on soil CO2 efflux limits our ability to extrapolate from fluxesmeasured at point scales to scales useful for corroboration with other ecosystem levelmeasures of C exchange. Additional complications are introduced by the effects of soilwater content seasonality and rainfall on the performance of measurement techniques. Inthis paper we present measurements of soil CO2 efflux made at two contrasting siteswithin a characteristic subalpine forest of the northern Rocky Mountains. Comparison ofmeasurements between the soil respiration chamber technique and the soil CO2 profiletechnique over daily and seasonal time scales indicated that soil water content plays amajor role in the magnitude and seasonality of soil CO2 efflux, especially after snowmeltor following summer rainfall. Agreement between both techniques was limited duringhigh soil water content conditions and after summer rainfall. Differences in diel hysteresispatterns of soil CO2 efflux between sites were controlled by the effects of canopycover and temporal differences in photosynthetic activity of vegetation. Our resultsindicate that an accurate parameterization of soil water content heterogeneity in space andtime must be a critical component of realistic model representations of soil CO2 effluxfrom heterogeneous landscapes.
Citation: Riveros-Iregui, D. A., B. L. McGlynn, H. E. Epstein, and D. L. Welsch (2008), Interpretation and evaluation of combined
measurement techniques for soil CO2 efflux: Discrete surface chambers and continuous soil CO2 concentration probes, J. Geophys.
Res., 113, G04027, doi:10.1029/2008JG000811.
1. Introduction
[2] Soil CO2 efflux is a natural process by which soilcarbon is released into the atmosphere through autotrophicand heterotrophic respiration. Evaluating and predicting soilCO2 efflux response to differences in hydrologic conditions(e.g., groundwater recharge and discharge areas, soil watercontent, precipitation, and land cover) are largely constrainedby the methods used to measure, interpret, and model soilCO2 efflux. Rates of soil CO2 efflux are currently estimatedfrom a wide range of ecosystems with manual soil respira-tion chambers [Fang and Moncrieff, 1996; Subke andTenhunen, 2004; Welsch and Hornberger, 2004], automatedsoil respiration chambers [Goulden and Crill, 1997; Savageand Davidson, 2001; Burrows et al., 2005], and the soilCO2 profile technique [Tang et al., 2003; Jassal et al., 2005;Tang and Baldocchi, 2005]. Particularly in the last 5 years,the soil CO2 profile technique has gained popularity because
it can provide continuous and automated measurements attemporal scales useful for comparison with other techniquesof ecosystem C exchange such as eddy covariance towers[Baldocchi et al., 2006]. While a wealth of ongoing studiesuse either technique, a direct comparison of their perfor-mance, measurements, strengths, and limitations in space andtime is lacking.[3] It has been suggested that the interactions among
precipitation, infiltration, evaporation, transpiration, andsoil drainage exert a major control on vegetation activityin water-limited ecosystems [Ridolfi et al., 2000; Porporatoet al., 2002]. Large gaps exist in our understanding of thevariability of soil CO2 efflux in response to changinghydrologic conditions across space and time. Traditionally,studies addressing the variability of soil CO2 efflux focus onits temporal component (e.g., diel, seasonal, and yearlyvariability) but tend to omit the spatial component inherentto this flux (i.e., landscape-induced variability). This omis-sion limits the capability of temperature-based models[Lloyd and Taylor, 1994] to accurately estimate soil CO2
efflux from areas having different characteristics withinsimilar ecosystems. More importantly, this omissionrestricts our understanding of how CO2-producing processessimultaneously develop in space and time to generate the
JOURNAL OF GEOPHYSICAL RESEARCH, VOL. 113, G04027, doi:10.1029/2008JG000811, 2008
1Department of Land Resources and Environmental Sciences, MontanaState University, Bozeman, Montana, USA.
2Department of Environmental Sciences, University of Virginia,Charlottesville, Virginia, USA.
3Canaan Valley Institute, Davis, West Virginia, USA.
Copyright 2008 by the American Geophysical Union.0148-0227/08/2008JG000811
G04027 1 of 11

soil CO2 rates that chambers or soil profile techniquesmeasure.[4] Recent studies [Riveros-Iregui et al., 2007] demon-
strated that soil water content controls the relationshipbetween soil CO2 efflux and soil temperature, as soil watercontent (1) enhances soil CO2 production and (2) inhibitssoil CO2 diffusion. Furthermore, the seasonality of soilwater content can control the switch from diffusion- toproduction-limited soil CO2 efflux [Riveros-Iregui et al.,2007; Riveros-Iregui, 2008; Pacific et al., 2008]. Thisconcept becomes especially important in ecosystems withconsiderable spatial variability in soil water content inducedby landscape morphology (i.e., convex versus concave areas[Scott-Denton et al., 2003; Pacific et al., 2008]). Vegetationcover and soil characteristics further control ecosystemresponse to changes in environmental conditions [Huxmanet al., 2004]. As a result, marked differences in soil watercontent regimes play a major role in ecosystem response,particularly soil CO2 efflux, of heterogeneous forests. In thispaper, we provide a comparison, over diel and seasonal timescales, of discrete (soil respiration chamber) and continuous(soil CO2 profile technique) measurements of soil CO2
efflux made at two sites: a wet riparian meadow and a dryupland forest. Both sites are colocated with eddy covariancetowers and are within a characteristic subalpine forest of thenorthern Rocky Mountains. Through this space-time com-parison we seek to (1) determine the mechanisms drivingvariability in soil CO2 efflux from riparian meadows andupland forests; (2) compare the performance of soil respi-ration chambers and solid-state CO2 probes throughout anentire growing season; and (3) assess, both mechanisticallyand methodologically, the confidence that these methodsoffer as providers of soil CO2 efflux rates from heteroge-neous landscapes. This information is essential to improvingprocess understanding of soil CO2 efflux from large areas,establishing a conceptual framework for soil CO2 efflux
modeling studies, and adding confidence to current anddeveloping measurement techniques.
2. Methods
2.1. Study Site
[5] This study was located in the Tenderfoot CreekExperimental Forest, in the Little Belt Mountains of centralMontana (Figure 1). These mountains are characteristic ofthe subalpine forests of the northern Rocky Mountains. Twocontrasting ecosystems that represent the two dominantsystems of these mountains were selected to address theobjectives of this study: a wet riparian meadow (hereafterriparian site) and a dry upland forest (hereafter upland site).Vegetation cover at the riparian site is predominantlyCalamagrostis canadensis (bluejoint reedgrass), whereasthe upland site is covered mostly by Pinus contorta (lodge-pole pine) and Pseudotsuga menziesii (Douglas fir) in theoverstory and Vaccinium spp. in the understory. Elevationsare 2169 and 2305 m at the riparian and upland sites,respectively. Mean annual precipitation is 880 mm with�70% falling as snow [Farnes et al., 1995], and peaksnowpack accumulations occur between late March andmid-April [Woods et al., 2006]. Mean annual temperatureis 0�C, and the growing season lasts from 45 to 75 days.
2.2. Environmental Variables
[6] Between 9 June 2006 and 7 September 2006 wemeasured volumetric soil water content (q) (CSI model 616,Campbell Scientific Inc., Logan, Utah) and soil temperature(TS) (CSI model 107, Campbell Scientific Inc., Logan, Utah)at 20 cm below the soil surface, at 20-min intervals, andcollected the data with a logger (model CR-10x, CampbellScientific Inc., Logan, Utah). Manual measurements (n = 3)of q were also taken with a portable meter (Hydrosense,Campbell Scientific Inc., Utah, USA) to obtain an integratedestimate of soil water content over the top 20 cm of the soilprofile. Measurements from the CSI Hydrosense meterwere experimentally corroborated with regular time domainreflectometry instruments (r2 = 0.986 and n = 121) toconfirm applicability of the CSI Hydrosense instrumentunder a full range of soil water contents. Precipitation wasmeasured by a tipping bucket rain gauge (TR-525M, accu-rate to within 1% for up to 50 mm h�1, Texas Electronics,Dallas, Texas, USA), at 20-min intervals and reported on adaily basis.
2.3. Measurements of Soil CO2 Efflux
[7] Soil CO2 efflux was measured independently at eachsite by the soil respiration chamber technique (discretemeasurements) and by the soil CO2 profile technique(continuous measurements). While the performance of soilrespiration chambers has been amply evaluated [Norman etal., 1997; Hutchinson and Livingston, 2001; Davidson etal., 2002], the performance of the relatively newer soil CO2
profile technique remains to be critically evaluated in spaceand time, as well as against soil respiration chambers.Discrete measurements were based on a soil respirationchamber model SRC-1 (footprint of 314.2 cm2, accuracywithin 1% of calibrated range (0–9.99 g CO2 m
�2 h�1), PPSystems, Massachusetts, USA) equipped with an infraredgas analyzer (EGM-4, accuracy within 1% of calibrated
Figure 1. Location of the Tenderfoot Creek ExperimentalForest in the Little Belt Mountains of central Montana. Thetwo most common ecosystems of these mountains wereselected for this study: a wet riparian meadow and a dryupland forest.
G04027 RIVEROS-IREGUI ET AL.: INTERPRETATION AND EVALUATION OF EFFLUX
2 of 11
G04027

range (0–2000 ppm), PP Systems, Massachusetts, USA).Chamber measurements were collected in triplicate every2–7 days at each site. At each site, a 0.5-m2 area was ropedoff to minimize disturbance and vegetation was clippedonce a week after measurements were collected. Roots wereleft intact to minimize disturbance to belowground respira-tion. Before each measurement, the chamber was flushedwith ambient air for 15 s and placed onto the soil, ensuring agood seal between the chamber and the soil surface. SoilCO2 efflux was calculated by measuring the rate of increasein CO2 concentration within the chamber and fitting aquadratic equation to the relationship between the increas-ing CO2 concentration and elapsed time (as recommendedby the manufacturer). In order to minimize introduction ofbiases during sampling, no chamber measurements weretaken before 1000 LT or after 1600 LT.[8] Continuous soil CO2 concentration measurements
were collected with solid-state CO2 probes (GMP221 withtransmitter, Vaisala, Helsinki, Finland) installed at 5 cmbelow the soil surface, logging continuously at 20-minintervals with a data logger (model CR10x, CampbellScientific Inc., Logan, Utah). Soil CO2 concentrationsmeasured by the probes were corrected for temperatureand pressure following compensatory procedures describedby Tang et al. [2003] and according to the manufacturer’srecommendation. When buried in the soil, these probesrespond to changes in CO2 concentrations in less than5 min [Tang et al., 2003]. Because it is difficult to measuresoil CO2 concentrations near the soil-atmosphere interface(e.g., z = 0), we tested the sensitivity of soil CO2 efflux tovariability in atmospheric concentrations by simultaneouslyusing three different CO2 concentration values (350, 450,and 550 ppm) at the soil-atmosphere interface. We chosethese three values on the basis of the range of variability ofinitial surface CO2 concentrations measured at each deploy-ment of the soil respiration chamber (ranging between �390and �530 ppm). Our results demonstrate that the assumedvalues do not compromise calculation of soil CO2 efflux, asthe diel variability of soil CO2 concentration at 5 cm ismuch greater than the diel variability of soil CO2 above thesoil surface given the atmospheric buffer. Previous studies[Tang et al., 2005b] have used similar assumptions(�370 ppm at 0.5 m above the soil surface). However, ourapproach of using all three values provides a confidence errorof 200 ppm (at z = 0), demonstrating that variations inconcentrations at the soil surface introduce little variation inestimated soil CO2 efflux given the natural diel variability ofsoil CO2 at depth (>5000 ppm). Nevertheless, to illustrate thiseffect, confidence bounds (for 350 and 550 ppm) wereestimated and presented with the results. Additional corrobo-ration and confidence is given when comparing continuousand discrete chamber soil CO2 efflux estimates (see section 3).[9] Continuous soil CO2 efflux based on solid-state
probes has been estimated in numerous recent studies acrossmultiple ecosystems [Tang et al., 2003; Jassal et al., 2005;Tang et al., 2005a, 2005b; Baldocchi et al., 2006; Vargasand Allen, 2008]. To estimate surface efflux, these studiesassumed that flux of soil CO2 was linear with depth, withincreasing concentrations with increasing depth. However,these assumptions become invalid when soil CO2 is greaterin shallow soils than in deeper soils, leading to bidirectionalconcentration gradients and fluxes. This scenario can occur
in response to disturbances such as precipitation and shal-low soil wetting [e.g., Tang et al., 2005b]. Because precip-itation was sporadic throughout the growing season in oursystem and we sought to investigate CO2 flux toward thesurface at both diel and seasonal time scales, we calculatedsoil CO2 efflux based on concentrations at 0 and 0.05 musing Fick’s first law of diffusion,
F ¼ �DP
@ CO2½ �@z
; ð1Þ
where F is CO2 flux between two depths and DP is thediffusion coefficient for CO2 in the air-filled pore space.The diffusion coefficient (DP) was calculated as a functionof total porosity (F) and air-filled porosity (e) and using themodel proposed by Moldrup et al. [1999]:
DP
DO
¼ F2 eF
� �2þ3b
; ð2Þ
where DO is the gas diffusion coefficient in free air and b isthe Campbell [1974] pore size distribution parameter. Thisparameter has been found to be strongly related (r2 = 0.96)to clay fraction content (CF) through the followingrelationship [Clapp and Hornberger, 1978; Olesen et al.,1996; Rolston and Moldrup, 2002]:
b ¼ 13:6CFþ 3:5: ð3Þ
[10] Diffusivity of CO2 in the gas phase is about 4 ordersof magnitude higher than in the liquid phase [Simunek andSuarez, 1993; Welsch and Hornberger, 2004]; therefore, weassumed that solubility of the gas phase CO2 is negligible.The characterization of the distribution of new moistureinputs in the soil, particularly in arid and semiarid environ-ments, remains challenging because of wetting front insta-bility or heterogeneity [Wang et al., 2007]. Soil macroporescaused by decaying roots, worm holes, and similar distur-bances can cause preferential flow and differences ininfiltration patterns [Geiger and Durnford, 2000; Devittand Smith, 2002] under ponding [Hill and Parlange,1972; Glass et al., 1989a, 1989b; Baker and Hillel, 1990]and nonponding conditions [Selker et al., 1992; Babel et al.,1995; Hendrickx and Yao, 1996; Yao and Hendrickx, 1996].Thus, we used the integrated 0–20 cm soil water contentbased on three replicates as a measure of volumetric watercontent over the top 20 cm of soil. Previous studies havestudied the heterogeneity of new moisture distribution byapplying vertical integrations [Noborio et al., 1996; Timlinand Pachepsky, 2002] and have found that this estimate is agood representation of soil water content, even in extremelynonuniform conditions [Topp et al., 1982a, 1982b; Robinsonet al., 2003]. Similarly, we assumed constant DP/DO andtemperature (used for density estimation in DO calculations)over the top 20 cm of the soil. We acknowledge potentialinaccuracies introduced by this approach and current probedesign constraints for water content profile estimation;however, this is an effective approximation of volumetricsoil water content and the DP/DO parameter.
G04027 RIVEROS-IREGUI ET AL.: INTERPRETATION AND EVALUATION OF EFFLUX
3 of 11
G04027

[11] Because solid-state soil CO2 probes are known torelease heat after operating for long periods of time [Hiranoet al., 2003; Jassal et al., 2005], we installed a double-poledouble-throw relay (6 VDC coil voltage, 115 mA, TycoElectronics, Berwyn, Pennsylvania) in the power linebetween the battery bank and the solid-state soil CO2 probes,controlled by the data logger. This setup allowed us to switchthe probes on prior to each measurement, including warmingtime as recommended by the manufacturer, and to switchthem off to prevent long-term heating while saving >75% ofbattery power.
2.4. Ecosystem Respiration
[12] Continuous measurements of land-atmosphere CO2
and water vapor exchange were made above the canopyof both ecosystems with the eddy covariance method[Baldocchi, 2003]. Wind velocity was measured with atriaxial sonic anemometer (CSAT3, Campbell ScientificInc., Logan, Utah). Carbon dioxide and water vapor fluctu-ations were measured with an open path, infrared absorptiongas analyzer (7500, LI-COR, Lincoln, Nebraska). Measure-ments were made at 10-Hz frequencies for the duration ofthe study. Estimates of nighttime ecosystem respirationwere selected on the basis of fluxes between 2300 LT and0400 LT and reported on a daily basis. A U* threshold of0.2 m s�1 was used to ensure periods with enough turbu-lence and reliable eddy covariance estimates. Because thepurpose of the eddy covariance measurements was exclu-sively to provide a relative comparison, values are presentedas nighttime ecosystem respiration fluxes, and no daytime
correction was applied to fluxes to avoid postprocessing andmodeling abstraction.
3. Results
3.1. Environmental Variables
[13] The variability of continuous and discrete measure-ments of volumetric soil water content (q) is presented inFigure 2. Throughout the growing season, values of qdecreased from over 50 to �10% at the riparian site andfrom �18 to �12% at the upland site (Figure 2). Given that70% of precipitation comes as snow and that peak runoffusually occurs between mid-May and early June [Woods etal., 2006], these ecosystems are subject to a rapid spring wetup followed by a prolonged seasonal dry down, typical ofsubalpine forests. Rainfall was higher in magnitude andoccurred more frequently before mid-July, after whichrainfall decreased and occurred on only 2 days late in theseason (Figure 2). The effects of rainfall on q differed inmagnitude between the wet riparian site and the drier uplandsite (Figure 2) and depended on antecedent conditions (wetsoil versus dry soil). These effects were also reflected, bothmechanistically and methodologically, on measured soilCO2 fluxes (section 3.2).[14] Soil temperature (TS) varied both daily and season-
ally (Figure 3), with a seasonal maximum toward the end ofJuly at both sites. This time corresponds with the minimumor near-minimum values of q (Figure 2), maximum soilthermal diffusivity [Ochsner et al., 2001], maximum soilgas diffusivity [Riveros-Iregui et al., 2007], and the initialdecrease in potential for biological activity, sporadically
Figure 2. Variability of (a) precipitation and soil water content (q) for (b) riparian and (c) upland sitesfor the 2006 growing season. Measurements of q were made continuously at 20 cm and discretelyintegrating over 0–20 cm as indicated by the symbols.
G04027 RIVEROS-IREGUI ET AL.: INTERPRETATION AND EVALUATION OF EFFLUX
4 of 11
G04027

reset by precipitation events (e.g., 18 August). While thetiming of daily TS maxima was well synchronized betweensites, the amplitude of the diel variability of TS was lower atthe upland site (Figure 3) because of the energy bufferimposed by the canopy cover. Overnight freezing temper-atures in August drove a decrease in daily TS maxima atboth sites, indicating the decline of the growing season.
3.2. Soil CO2 Efflux
[15] Both the soil respiration chamber and the soil CO2
technique measured increasing fluxes early in the growingseason at the riparian and upland sites (Figure 3), with thesoil CO2 profile having the advantage of increased samplingfrequency, allowing for detailed visualization of the dieldynamics of soil CO2 efflux. Similar diel dynamics have
been previously studied in detail [Tang et al., 2005a;Riveros-Iregui et al., 2007]; however, high-frequency meas-urements of soil CO2 efflux responding to seasonal changesin environmental conditions (e.g., snowmelt and early andlate season rainfall) between two sites within the samesmall-watershed ecosystem is, to our knowledge, unprece-dented. Confidence bounds for 350 and 550 ppm at the soil-atmosphere interface (z = 0) are shown along with soil CO2
efflux from the profile technique at both sites. The dottedlines in Figures 3c and 3e, almost identical to the solid lines,demonstrate that the error introduced by our approach isminimal compared to the natural variability of soil CO2
efflux on a diel and seasonal basis. For the remainder of thispaper we will refer to calculations and analyses based on
Figure 3. Variability in (a) precipitation, (b, d) soil temperature, and (c, e) soil CO2 efflux at the riparianand upland sites for the 2006 growing season. CO2 efflux was measured by the soil CO2 profile technique(solid-state CO2 sensors installed at depth) and by the soil respiration chamber technique. Boxesrepresent the mean, and error bars represent the standard deviation of three chamber measurements.
G04027 RIVEROS-IREGUI ET AL.: INTERPRETATION AND EVALUATION OF EFFLUX
5 of 11
G04027
soil CO2 concentration of 450 ppm at the soil-atmosphereinterface.[16] Seasonal dynamics recorded by the chamber tech-
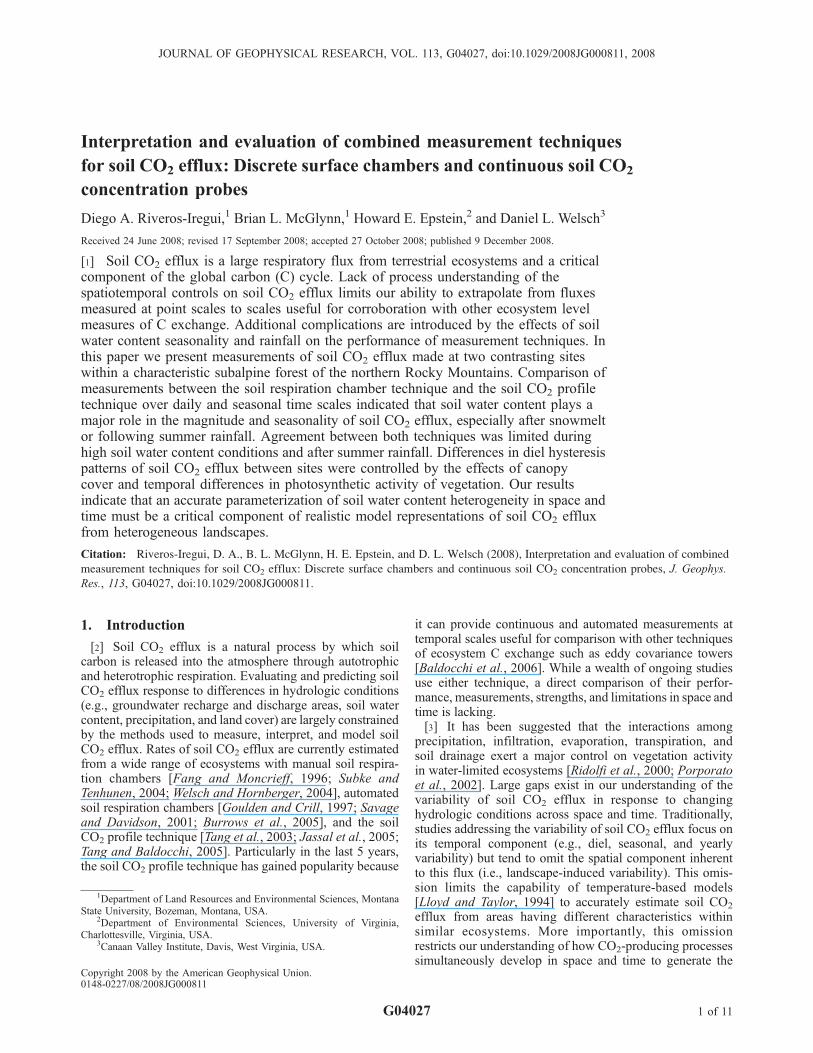
nique agreed well with estimates by the soil CO2 profiletechnique at both sites (Figure 3). However, marked differ-ences throughout the study were imposed by high soil watercontent and sporadic rainfall. Comparing chamber measure-ments and instantaneous efflux from the profile techniquefor the entire season shows moderate agreement for theentire growing season at both sites (r2 = 0.51; Figure 4).This agreement improved considerably when measurementswithin 2 days of at least 1-mm rainfall were excludedand when chamber measurements made on wet soil (q >0.25 m3 m�3) were further excluded from the comparison ateach site (Figure 5). However, by excluding such environ-mental disturbances from technique comparison, little canbe learned about ways to improve technique performance orovercome their limitations; therefore, disagreement due todisturbances must not be omitted from these types ofstudies.[17] Chamber measurements fell within the range of diel
values of soil CO2 efflux, except early in the season at theriparian site or following precipitation events at both sites(e.g., 10 and 13 July, Figure 6a). Accumulated on a dielbasis (Figure 6b), rates of soil CO2 efflux indicated that bothtechniques provide comparable estimates with the exceptionof those days following precipitation events, when chambermeasurements were up to 84% higher than estimates by thesoil CO2 profile technique.[18] Because the soil CO2 profile technique is currently
applied at different sampling frequencies (e.g., 5 min[Vargas and Allen, 2008] and 20 min (this study)), wetested the susceptibility of this technique to samplingfrequency and time-of-day biases. Our results demonstratethat high sampling frequencies do not necessarily improveseasonal estimates of soil CO2 efflux rates (Figure 7). Usingthe time of day at which the soil respiration chamber wasdeployed at each site (between 1000 LT and 1600 LT) to
capture instantaneous efflux by the soil CO2 profile tech-nique, similar seasonal estimates were found using allprofile measurements (5973 data points) or interpolatingbetween 34 daytime measurements at the riparian site and10 daytime measurements at the upland site (Figure 7).
4. Discussion
4.1. What Are the Mechanisms Driving the MainDifferences in Soil CO2 Efflux From RiparianMeadows and Upland Forests?
[19] A major challenge in process understanding of soilCO2 generation and efflux lies in the spatiotemporal natureof its biophysical controls. The interaction among soiltemperature, vegetation, soil substrate, soil physical prop-erties, and the landscape-induced redistribution of soil watercan exhibit confounding effects on soil CO2 efflux processes[Davidson et al., 1998]. However, particularly in subalpineecosystems, an important element that can be used to ouradvantage is the redistribution and seasonality in soil watercontent. There exists a degree of predictability in thatsnowmelt controls the time of the most dramatic increasein soil water content. Furthermore, landscape morphologyredistributes that moisture downslope to lower areas of thelandscape. Only through sporadic convective summerstorms does the ecosystem receive new moisture inputs thatcan enhance biological activity. In our study, a seasonalcomparison based on landscape position (Figure 3) demon-strates that soil CO2 efflux at the riparian site was higher for72% of the growing season, particularly after snowmelt, andwhen rainfall drove q higher at the riparian site. Only whensimilar q values were found between sites (e.g., after 29 July)
Figure 4. Comparison of instantaneous soil CO2 effluxmeasured by both techniques during the 2006 growingseason. Data include measurements at the riparian and theupland sites during rainy and dry days.
Figure 5. Comparison of techniques between (a, c)riparian and (b, d) upland sites, with all measurements ateach site (Figures 5a and 5b), and removing measurementson soil with q > 0.25 (m3 m�3) and measurements within 2days of precipitation over 1 mm (Figures 5c and 5d).
G04027 RIVEROS-IREGUI ET AL.: INTERPRETATION AND EVALUATION OF EFFLUX
6 of 11
G04027

were soil CO2 efflux rates similar or higher at the uplandsite (Figure 3).[20] A comparison of soil CO2 efflux and soil tempera-
ture during early, middle, and late season (Figure 6a)between the riparian (wet) and upland (dry) sites demon-strated spatial and temporal differences in diel hysteresispatterns introduced by differences in diel TS and CO2 efflux.Recent studies have highlighted the evolution of dielpatterns in both soil CO2 concentrations [Riveros-Iregui etal., 2007] and soil CO2 effluxes [Carbone et al., 2008]. Dielhysteresis in soil CO2 concentrations is controlled by watercontent-limited soil CO2 diffusion [Riveros-Iregui et al.,2007]. A decline in q results in enhanced soil CO2 diffusion,allowing belowground concentrations to remain at steadystate (@CO2/@t = 0 [Riveros-Iregui et al., 2007]). However,while the belowground concentrations can remain at steadystate, the observed aboveground efflux (F) is not at steady
state (@F/@t 6¼ 0), indicating that, particularly in dry soils,diel hysteresis in soil CO2 efflux is production limited andrepresents a rapid response of combined heterotrophic andautotrophic activities. Greater hysteresis patterns in effluxat the riparian site (e.g., 23 June at the riparian site versus22 June at the upland site) are likely due to the effects offaster short vegetation response to photosynthetic activity atthis site [Carbone and Trumbore, 2007] and the effects of ataller and more complete canopy cover on TS at the uplandsite. More circular hysteresis patterns late in the season atthe upland site (Figure 6a) indicate enhanced photosyntheticactivity of the forest canopy with respect to riparian grasses[Emanuel, 2007], and that riparian vegetation (senescing bythis time of the year) underwent late season water stressbefore upland vegetation. This suggests that upland vegeta-tion is better adapted to lower q, whereas riparian vegetationis adapted to higher q and is sensitive to q reduction over the
Figure 6. (a) Comparison of soil CO2 efflux measurements and soil temperature (TS) made on 3different days at the (left) riparian and (right) upland sites. Symbols denote day of the year. Open symbolsdenote measurements by the soil profile technique, and filled symbols denote measurements by the soilrespiration chamber. After rain events (i.e., 10–13 July), measurements by the soil respiration chamberare much greater than estimates by the soil profile technique. (b) Comparison of cumulative fluxes over24-h intervals at different times of the year at the (top) riparian and (bottom) upland sites. Dates ofmeasurements are indicated in each plot and correspond to dates of measurements in Figure 6a. A total of10.7 mm of rain occurred over 4 days prior to 10–13 July measurements.
G04027 RIVEROS-IREGUI ET AL.: INTERPRETATION AND EVALUATION OF EFFLUX
7 of 11
G04027

growing season. As a result, the riparian vegetation influenceon soil CO2 efflux diminished over the course of seasonaldry down.[21] These findings demonstrate how soil water content
distribution across the landscape exerts a major control onboth spatial and temporal (seasonal) differences of soil CO2
efflux. We suggest that parameterization of water contentheterogeneity in space and time must be a critical compo-nent for realistic model representations of soil CO2 efflux(understood as the balance between production and trans-port [Pacific et al., 2008]) from heterogeneous landscapes.To date, this fundamental concept remains to be robustlyapplied and integrated within studies of land-atmosphereexchange at the ecosystem level.
4.2. How Do Two of the Most Commonly UsedMethods to Measure Soil CO2 Efflux CompareAcross Sites and Across the Growing Season?
[22] To assess the effects of high soil water content andrainfall on discrepancies between techniques, we com-pared each site separately, both including and excludingmeasurements following rainfall and during early seasonhigh q (Figure 5). At both sites technique agreementsignificantly improved when measurements on wet soildays (q > 0.25 m3 m�3) and measurements taken within2 days of 1-mm rainfall were removed from the compar-ison. The disagreement between techniques following pre-cipitation is to be expected as new water inputs can causea CO2 burst in soil air because of a rapid gas displace-
ment in the pore space followed by enhanced biologicalactivity [Cable and Huxman, 2004; Huxman et al., 2004].However, the disagreement caused by the removal ofmeasurements with high q indicates that parameterizationof the soil CO2 profile method needs to be stronglyimproved and most likely differentiated between high qand low q, especially in ecosystems with large variability ofq. Previous studies attempting this technique corroboration[Baldocchi et al., 2006; Vargas and Allen, 2008] do notprovide context for when chamber measurements weretaken with respect to the seasonality of q, hence, little canbe learned from the agreement (or disagreement) of theirtechniques. Our results suggest that while good techniquecomparison can be attained during periods of stable con-ditions (e.g., constant q and no rainfall), environmentaldisturbances will affect method corroboration in space andtime. Excluding chamber measurements taken followingrainfall would improve technique correlation, but throughthis or similar exclusions, information on primary controlson soil CO2 efflux is lost. The strengths and limitations ofeach method, as well as full system understanding, can onlybe achieved with the direct comparison of both approaches.A context for environmental conditions under which meas-urements were taken is necessary to understand techniqueperformance (strengths and limitations) and variability ofthe fluxes (i.e., distinction between ecophysiological pro-cesses and environmental biases).[23] Analyzing instantaneous fluxes from the soil CO2
profile technique at different sampling frequencies indicatesthat on a cumulative basis the soil profile technique is notbiased by the time of the day at which sampling occurs orby the sampling frequency itself (Figure 7). This means thaton a cumulative basis the use of the soil CO2 profiletechnique at 20-min frequency intervals yields similarresults as when it is used every 2–7 days. Given that dailyminima of soil CO2 in this system occur before sunrise anddaily maxima occur during early to late evening [Riveros-Iregui et al., 2007], sampling soil CO2 efflux between1000 LT and 1600 LT (as in the example presented inFigure 7) may correspond to the 24-h mean of soil CO2
efflux. Our findings suggest that on a seasonal basis, it ismore critical to capture spatial variability and seasonaldynamics driven primarily by changes in soil water contentthan the diel dynamics caused by soil temperature and plantactivity. These results demonstrate that while the soil CO2
probes provide important resolution for short time scales,long-term (seasonal) measurements do not necessarily ben-efit from this high-frequency sampling. The tradeoff be-tween spatial coverage of chambers and temporal resolutionof the soil CO2 profile technique greatly depends on studygoals and whether one is interested in seasonal estimates ofsoil CO2 efflux rates or rapid dynamics of this flux.
4.3. What Are the Implications of These Findings forProcess Understanding of Soil CO2 Efflux FromSubalpine Ecosystems?
[24] A comparison of measurements by the soil respira-tion chamber and the soil CO2 profile technique demon-strates that, accumulated over the growing season, bothtechniques are within 7% of measurements for the ripariansite and within 32% of measurements for the upland site(Figure 8). Similar agreements between techniques have
Figure 7. Comparison of cumulative soil CO2 effluxestimates by the soil CO2 profile technique, modifying itssampling frequency. Solid lines indicate estimates from 20-min sampling over 83 days (n = 5973). Dashed (n = 34) anddotted (n = 10) lines indicate reduced sampling frequency(every 2–7 days), using the time of the soil respirationchamber deployment as an example. Agreement betweenhigh and moderate frequencies suggests little time-of-dayand sampling frequency bias. This comparison demonstratesthat on a cumulative basis the use of the soil CO2 profiletechnique at 20-min intervals yields similar results as whenit is used every 2–7 days.
G04027 RIVEROS-IREGUI ET AL.: INTERPRETATION AND EVALUATION OF EFFLUX
8 of 11
G04027

been reported [Tang et al., 2003; Baldocchi et al., 2006], butthe difference in agreement across sites had not beenpreviously observed. Better agreement at the riparian siteis likely due to the higher q in these areas, which leads to amore homogeneous water content profile in the top 20 cmof the soil, even after precipitation events (Figure 2). Newmoisture from precipitation can be distributed more homo-geneously within the top section of the soil profile. Con-versely, because q is lower at the upland site, the distributionof new moisture from precipitation in the topsoil does notoccur as homogeneously, and new moisture does notpenetrate as deeply, causing larger differences in diffusivitythroughout the soil profile, thus limiting the soil profiletechnique, especially late in the season.[25] Compared to nighttime ecosystem respiration, both
techniques provide comparable effluxes for each site(Figure 8). While this comparison is not intended forquantitative purposes, it provides the foundations forpotential, detailed examinations. For example, the differ-ence in soil CO2 efflux response between the riparian andupland sites, particularly after snowmelt and precipitation,demonstrates that different landscape positions may notrespond uniformly to environmental disturbances, particu-larly because of differences in q. On a cumulative basisriparian areas exhibit higher soil CO2 efflux and ecosystemrespiration than upland sites throughout the growing season(Figure 8d). While riparian meadows can occupy a smallerfraction of an entire forest (�2%) [Riveros-Iregui, 2008],soil CO2 efflux from these areas is larger than effluxes fromupland forests. Soil CO2 efflux from chamber measurementswas within 16% of nighttime ecosystem respiration at theriparian site and within 15% of nighttime ecosystem respi-ration at the upland site. However, these relationships, and
the magnitude of differences between sites and throughoutthe growing season, are nonlinear, which warrants futureinvestigations on how the parameterization of a nonstation-ary behavior of the landscape can be important to improvecurrent estimates of soil CO2 efflux from large areas and toimprove comparisons with other estimates of C exchange atthe ecosystem scale. Direct comparison of multiple techni-ques (soil respiration chambers, soil CO2 profile technique,and eddy covariance towers) is necessary to understand thespatiotemporal nature of C fluxes. The findings presentedhere are essential for enhancing process understanding ofsoil CO2 efflux from heterogeneous landscapes, providing aconceptual framework of soil CO2 efflux useful for model-ing studies, and gaining confidence in current and develop-ing soil CO2 efflux measuring techniques.
5. Conclusions and Implications
[26] 1. Soil water content was a major control on bothspatial and temporal (particularly seasonal) differences ofsoil CO2 efflux between a riparian meadow and an uplandforest, especially after snowmelt and rainfall. Parameteriza-tion of water content heterogeneity in space and time mustbe a critical component of realistic model representations ofsoil CO2 efflux rates from heterogeneous landscapes.[27] 2. Good agreement between the soil respiration
chamber technique and the soil CO2 profile technique canbe attained during periods of stable conditions (e.g., constantq and no rainfall). However, seasonality of soil watercontent and sporadic rainfall introduce physical effects thatlimit this agreement and play a major role in methodcorroboration. Providing a context for environmental con-ditions under which measurements were taken is necessary
Figure 8. (a) Relative precipitation. (b, c, d) Comparison of cumulative discrete (instantaneous)measurements made by the soil respiration chamber technique (including all data), 20-min measurementsby the soil profile technique, and nighttime ecosystem respiration (RE) by an eddy covariance system at ariparian and an upland site.
G04027 RIVEROS-IREGUI ET AL.: INTERPRETATION AND EVALUATION OF EFFLUX
9 of 11
G04027

to understanding performance of techniques and the sourceof the variability in measured efflux.[28] 3. On a 24-h basis both techniques yield comparable
results, except during periods of sporadic precipitation,when the chamber technique yields soil CO2 efflux ratesmuch larger than those by the soil profile technique. Thismeans that rapid changes in soil physical properties, respi-ration enhancement, and water-caused displacement of CO2
within the soil pore space might not be adequately capturedby solid-state CO2 sensors. Nonetheless, these sensorsremain a useful tool for capturing changes in soil CO2
caused by less transient, nonhydrological, ecophysiologicalprocesses (i.e., responses of plant and microbial activity tochanging environmental conditions).[29] 4. Differences in diel hysteresis patterns of soil CO2
efflux between sites were controlled by the effects ofcanopy cover on soil temperature and temporal differencesin photosynthetic activity of vegetation. Particularly in drysoils, diel hysteresis in soil CO2 efflux is production limitedand represents a rapid response of combined heterotrophicand autotrophic activities. More circular hysteresis patternslate in the season at the upland site suggest that uplandvegetation is better adapted to low soil water content andthat riparian vegetation influence on soil CO2 efflux dimin-ished over the course of seasonal dry down.[30] 5. On a seasonal basis soil CO2 efflux measurements
were not biased by the time of the day at which samplingoccurred, meaning that long-term (seasonal) measurementsdo not necessarily benefit from high-frequency sampling bysoil CO2 probes. Furthermore, if the study focuses onseasonality, capturing the spatial variability and seasonaldynamics of efflux driven primarily by changes in soil watercontent is more important than capturing diel dynamicscaused by soil temperature and plant activity.[31] 6. Both techniques can yield comparable efflux rates
with the exception of transient flux events caused byprecipitation or diffusion-limited flux caused by wet soils.Direct comparison of multiple techniques (soil respirationchambers, soil CO2 profile technique, and eddy covariancetowers) is necessary to gain insight into the primary controlson soil CO2 production and transport and the spatiotemporalnature of efflux. Acknowledging technique limitations isimportant for reporting realistic rates of soil CO2 efflux.[32] 7. These results have implications for interpreting
and evaluating rates of soil CO2 efflux measured by soilrespiration chambers and the soil CO2 profile technique,from both mechanistic and methodological perspectives.While the findings presented here were attained in asubalpine forest, they can be applied to current and futurestudies in a wide range of ecosystems. These implicationsshould be considered when measuring and modeling thedynamics of C cycling at the ecosystem level.
[33] Acknowledgments. Financial support was provided by the U.S.National Science Foundation Integrated Carbon Cycle Research Program(grants EAR-0404130, EAR-0403924, and EAR-0403906). D.A.R.-I.acknowledges support from the 2007 American Geophysical UnionHorton Research Grant, a NSF Doctoral Dissertation Improvement grant(DEB-0807272), and the USGS 104b Grant Program, administered bythe Montana Water Center. The authors thank the Tenderfoot CreekExperimental Forest and the USDA, Forest Service, Rocky MountainResearch Station, particularly Ward McCaughey. V. J. Pacific, R. E.Emanuel, and D. J. Muth provided helpful discussions during the devel-
opment of this work. Two anonymous reviewers provided helpful com-ments on a previous version of this paper.
ReferencesBabel, M. S., R. Loof, and A. Dasgupta (1995), Fingered preferential flowin unsaturated homogeneous coarse sands, Hydrol. Sci. J., 40(1), 1–17.
Baker, R. S., and D. Hillel (1990), Laboratory tests of a theory of fingeringduring infiltration into layered soils, Soil Sci. Soc. Am. J., 54(1), 20–30.
Baldocchi, D. D. (2003), Assessing the eddy covariance technique forevaluating carbon dioxide exchange rates of ecosystems: Past, presentand future, Global Change Biol., 9(4), 479–492, doi:10.1046/j.1365-2486.2003.00629.x.
Baldocchi, D., J. Tang, and L. Xu (2006), How switches and lags in bio-physical regulators affect spatial-temporal variation of soil respiration inan oak-grass savanna, J. Geophys. Res., 111, G02008, doi:10.1029/2005JG000063.
Burrows, E. H., J. L. Bubier, A. Mosedale, G. W. Cobb, and P. M. Crill(2005), Net ecosystem exchange of carbon dioxide in a temperatepoor fen: A comparison of automated and manual chamber techniques,Biogeochemistry, 76(1), 21–45, doi:10.1007/s10533-004-6334-6.
Cable, J. M., and T. E. Huxman (2004), Precipitation pulse size effects onSonoran Desert soil microbial crusts, Oecologia, 141(2), 317 – 324,doi:10.1007/s00442-003-1461-7.
Campbell, G. S. (1974), A simple method for determining unsaturatedconductivity from moisture retention data, Soil Sci., 117(6), 311–314,doi:10.1097/00010694-197406000-00001.
Carbone, M. S., and S. E. Trumbore (2007), Contribution of new photo-synthetic assimilates to respiration by perennial grasses and shrubs:Residence times and allocation patterns, New Phytol., 176(1), 124–135,doi:10.1111/j.1469-8137.2007.02153.x.
Carbone, M. S., G. C. Winston, and S. E. Trumbore (2008), Soil respirationin perennial grass and shrub ecosystems: Linking environmental con-trols with plant and microbial sources on seasonal and diel timescales,J. Geophys. Res., 113, G02022, doi:10.1029/2007JG000611.
Clapp, R. B., and G. M. Hornberger (1978), Empirical equations for somesoil hydraulic properties,Water Resour. Res., 14(4), 601–604, doi:10.1029/WR014i004p00601.
Davidson, E. A., E. Belk, and R. D. Boone (1998), Soil water contentand temperature as independent or confounded factors controlling soilrespiration in a temperate mixed hardwood forest, Global Change Biol.,4(2), 217–227, doi:10.1046/j.1365-2486.1998.00128.x.
Davidson, E. A., K. Savage, L. V. Verchot, and R. Navarro (2002), Mini-mizing artifacts and biases in chamber-based measurements of soilrespiration, Agric. For. Meteorol., 113(1–4), 21–37, doi:10.1016/S0168-1923(02)00100-4.
Devitt, D. A., and S. D. Smith (2002), Root channel macropores enhancedownward movement of water in a Mojave Desert ecosystem, J. AridEnviron., 50(1), 99–108, doi:10.1006/jare.2001.0853.
Emanuel, R. E. (2007), Vegetation water stress and its impact on land-atmosphere interaction, Ph.D. dissertation, 162 pp., Univ. of Va.,Charlottesville.
Fang, C., and J. B. Moncrieff (1996), An improved dynamic chambertechnique for measuring CO2 efflux from the surface of soil, Funct. Ecol.,10(2), 297–305, doi:10.2307/2389856.
Farnes, P. E., R. C. Shearer, W. W. McCaughey, and K. J. Hansen (1995),Comparisons of hydrology, geology, and physical characteristics betweenTenderfoot Creek Experimental Forest (east side) Montana, and CoramExperimental Forest (west side) Montana, Final Rep. RJVA-INT-92734,For. Sci. Lab., Intermountain Res. Stn., U.S. Dep. Agric. For. Serv.,Bozeman, Mont.
Geiger, S. L., and D. S. Durnford (2000), Infiltration in homogeneous sandsand a mechanistic model of unstable flow, Soil Sci. Soc. Am. J., 64(2),460–469.
Glass, R. J., J.-Y. Parlange, and T. S. Steenhuis (1989a), Wetting frontinstability: 1. Theoretical discussion and dimensional analysis, WaterResour. Res., 25(6), 1187–1194, doi:10.1029/WR025i006p01187.
Glass, R. J., T. S. Steenhuis, and J.-Y. Parlange (1989b), Wetting frontinstability: 2. Experimental determination of relationships betweensystem parameters and two-dimensional unstable flow field behaviorin initially dry porous media, Water Resour. Res., 25(6), 1195–1207,doi:10.1029/WR025i006p01195.
Goulden, M. L., and P. M. Crill (1997), Automated measurements of CO2
exchange at the moss surface of a black spruce forest, Tree Physiol.,17(8–9), 537–542.
Hendrickx, J. M. H., and T. M. Yao (1996), Prediction of wetting frontstability in dry field soils using soil and precipitation data, Geoderma,70(2–4), 265–280, doi:10.1016/0016-7061(95)00082-8.
Hill, D. E., and J.-Y. Parlange (1972), Wetting front instability in layeredsoils, Soil Sci. Soc. Am. Proc., 36(5), 697–702.
G04027 RIVEROS-IREGUI ET AL.: INTERPRETATION AND EVALUATION OF EFFLUX
10 of 11
G04027

Hirano, T., H. Kim, and Y. Tanaka (2003), Long-term half-hourly measure-ment of soil CO2 concentration and soil respiration in a temperate decid-uous forest, J. Geophys. Res., 108(D20), 4631, doi:10.1029/2003JD003766.
Hutchinson, G. L., and G. P. Livingston (2001), Vents and seals in non-steady-state chambers used for measuring gas exchange between soil andthe atmosphere, Eur. J. Soil Sci., 52(4), 675–682, doi:10.1046/j.1365-2389.2001.00415.x.
Huxman, T. E., J. M. Cable, D. D. Ignace, J. A. Eilts, N. B. English,J. Weltzin, and D. G. Williams (2004), Response of net ecosystem gasexchange to a simulated precipitation pulse in a semi-arid grassland: Therole of native versus non-native grasses and soil texture, Oecologia,141(2), 295–305.
Jassal, R., A. Black, M. Novak, K. Morgenstern, Z. Nesic, and D.Gaumont-Guay (2005), Relationship between soil CO2 concentrations and forest-floor CO2 effluxes, Agric. For. Meteorol., 130(3 – 4), 176 – 192,doi:10.1016/j.agrformet.2005.03.005.
Lloyd, J., and J. A. Taylor (1994), On the temperature-dependence of soilrespiration, Funct. Ecol., 8(3), 315–323, doi:10.2307/2389824.
Moldrup, P., T. Olesen, T. Yamaguchi, P. Schjonning, and D. E. Rolston(1999), Modeling diffusion and reaction in soils: IX. The Buckingham-Burdine-Campbell equation for gas diffusivity in undisturbed soil, SoilSci., 164(8), 542–551, doi:10.1097/00010694-199908000-00002.
Noborio, K., K. J. McInnes, and J. L. Heilman (1996), Measurements ofsoil water content, heat capacity, and thermal conductivity with a singleTDR probe, Soil Sci., 161(1), 22–28, doi:10.1097/00010694-199601000-00004.
Norman, J. M., C. J. Kucharik, S. T. Gower, D. D. Baldocchi, P. M. Crill,M. Rayment, K. Savage, and R. G. Striegl (1997), A comparison of sixmethods for measuring soil-surface carbon dioxide fluxes, J. Geophys.Res., 102(D24), 28,771–28,777, doi:10.1029/97JD01440.
Ochsner, T. E., R. Horton, and T. H. Ren (2001), A new perspective on soilthermal properties, Soil Sci. Soc. Am. J., 65(6), 1641–1647.
Olesen, T., P. Moldrup, K. Henriksen, and L. W. Petersen (1996), Modelingdiffusion and reaction in soils. 4. New models for predicting ion diffu-sivity, Soil Sci., 161(10), 633–645, doi:10.1097/00010694-199610000-00001.
Pacific, V. J., B. L. McGlynn, D. A. Riveros-Iregui, D. L. Welsch, and H. E.Epstein (2008), Variability in soil respiration across riparian-hillslopetransitions, Biogeochemistry, doi:10.1007/s10533-008-9258-8.
Porporato, A., P. D’Odorico, F. Laio, L. Ridolfi, and I. Rodriguez-Iturbe(2002), Ecohydrology of water-controlled ecosystems, Adv. WaterResour., 25(8–12), 1335–1348.
Ridolfi, L., P. D’Odorico, A. Porporato, and I. Rodriguez-Iturbe (2000),Impact of climate variability on the vegetation water stress, J. Geophys.Res., 105(D14), 18,013–18,025, doi:10.1029/2000JD900206.
Riveros-Iregui, D. A. (2008), Hydrologic-carbon cycle linkages in asubalpine catchment, Ph.D. dissertation, 220 pp., Mont. State Univ.,Bozeman.
Riveros-Iregui, D. A., R. E. Emanuel, D. J. Muth, B. L. McGlynn, H. E.Epstein, D. L. Welsch, V. J. Pacific, and J. M. Wraith (2007), Diurnalhysteresis between soil CO2 and soil temperature is controlled bysoil water content, Geophys. Res. Lett., 34, L17404, doi:10.1029/2007GL030938.
Robinson, D. A., S. B. Jones, J. M. Wraith, D. Or, and S. P. Friedman(2003), A review of advances in dielectric and electrical conductivitymeasurement in soils using time domain reflectometry, Vadose Zone J.,2, 444–475.
Rolston, D. E., and P. Moldrup (2002), Gas diffusivity, in Methods of SoilAnalysis: Part 4—Physical Methods, edited by J. H. Dane and G. C.Topp, pp. 1113–1139, Soil Sci. Soc. of Am., Madison, Wis.
Savage, K. E., and E. A. Davidson (2001), Interannual variation of soilrespiration in two New England forests, Global Biogeochem. Cycles,15(2), 337–350, doi:10.1029/1999GB001248.
Scott-Denton, L. E., K. L. Sparks, and R. K. Monson (2003), Spatial andtemporal controls of soil respiration rate in a high-elevation, subalpineforest, Soil Biol. Biochem., 35(4), 525 – 534, doi:10.1016/S0038-0717(03)00007-5.
Selker, J., P. Leclerq, J.-Y. Parlange, and T. Steenhuis (1992), Fingered flowin two dimensions: 1. Measurement of matric potential, Water Resour.Res., 28(9), 2513–2521, doi:10.1029/92WR00963.
Simunek, J., and D. L. Suarez (1993), Modeling of carbon dioxide transportand production in soil: 1. Model development, Water Resour. Res., 29(2),487–497, doi:10.1029/92WR02225.
Subke, J. A., and J. D. Tenhunen (2004), Direct measurements of CO2 fluxbelow a spruce forest canopy, Agric. For. Meteorol., 126(1–2), 157–168,doi:10.1016/j.agrformet.2004.06.007.
Tang, J. W., and D. D. Baldocchi (2005), Spatial-temporal variation in soilrespiration in an oak-grass savanna ecosystem in California and its parti-tioning into autotrophic and heterotrophic components, Biogeochemistry,73(1), 183–207, doi:10.1007/s10533-004-5889-6.
Tang, J. W., D. D. Baldocchi, Y. Qi, and L. K. Xu (2003), Assessing soilCO2 efflux using continuous measurements of CO2 profiles in soils withsmall solid-state sensors, Agric. For. Meteorol., 118(3 –4), 207–220,doi:10.1016/S0168-1923(03)00112-6.
Tang, J. W., D. D. Baldocchi, and L. Xu (2005a), Tree photosynthesismodulates soil respiration on a diurnal time scale, Global Change Biol.,11(8), 1298–1304, doi:10.1111/j.1365-2486.2005.00978.x.
Tang, J. W., L. Misson, A. Gershenson, W. X. Cheng, and A. H. Goldstein(2005b), Continuous measurements of soil respiration with and withoutroots in a ponderosa pine plantation in the Sierra Nevada Mountains,Agric. For. Meteorol., 132(3–4), 212–227, doi:10.1016/j.agrformet.2005.07.011.
Timlin, D., and Y. Pachepsky (2002), Infiltration measurement using avertical time-domain reflectometry probe and a reflection simulationmodel, Soil Sci., 167(1), 1–8, doi:10.1097/00010694-200201000-00001.
Topp, G. C., J. L. Davis, and A. P. Annan (1982a), Electromagnetic deter-mination of soil water content using TDR: I. Applications to wettingfronts and steep gradients, Soil Sci. Soc. Am. J., 46(4), 672–678.
Topp, G. C., J. L. Davis, and A. P. Annan (1982b), Electromagnetic deter-mination of soil water content using TDR: II. Evaluation of installationand configuration of parallel transmission lines, Soil Sci. Soc. Am. J., 46(4),678–684.
Vargas, R., and M. F. Allen (2008), Diel patterns of soil respiration in atropical forest after Hurricane Wilma, J. Geophys. Res., 113, G03021,doi:10.1029/2007JG000620.
Wang, X.-P., X.-R. Li, H.-L. Xiao, R. Berndtsson, and Y.-X. Pan (2007),Effects of surface characteristics on infiltration patterns in an arid shrubdesert, Hydrol. Process., 21(1), 72–79, doi:10.1002/hyp.6185.
Welsch, D. L., and G. M. Hornberger (2004), Spatial and temporal simula-tion of soil CO2 concentrations in a small forested catchment in Virginia,Biogeochemistry, 71(3), 413–434, doi:10.1023/B:BIOG.0000049350.24911.e9.
Woods, S. W., R. Ahl, J. Sappington, and W. McCaughey (2006), Snowaccumulation in thinned lodgepole pine stands, Montana, USA, For.Ecol. Manage., 235(1–3), 202–211, doi:10.1016/j.foreco.2006.08.013.
Yao, T. M., and J. M. H. Hendrickx (1996), Stability of wetting fronts in dryhomogeneous soils under low infiltration rates, Soil Sci. Soc. Am. J.,60(1), 20–28.
�����������������������H. E. Epstein, Department of Environmental Sciences, University of
Virginia, Charlottesville, VA 22904, USA.B. L. McGlynn and D. A. Riveros-Iregui, Department of Land Resources
and Environmental Sciences, Montana State University, 334 Leon JohnsonHall, Bozeman, MT 59717, USA. ([email protected])D. L. Welsch, Canaan Valley Institute, P.O. Box 673, Davis, WV 26260,
USA.
G04027 RIVEROS-IREGUI ET AL.: INTERPRETATION AND EVALUATION OF EFFLUX
11 of 11
G04027
Related Documents