United International University Page i Internship Report On Agricultural products impact on economic prosperity: A case study on GREENLAND TECHNOLOGIES LIMITED

Welcome message from author
This document is posted to help you gain knowledge. Please leave a comment to let me know what you think about it! Share it to your friends and learn new things together.
Transcript
United International University Page i
Internship Report
On
Agricultural products impact on economic prosperity: A case
study on
GREENLAND TECHNOLOGIES LIMITED
United International University Page ii
Internship Report
On
Agricultural products impact on economic prosperity: A case
study on
GREENLAND TECHNOLOGIES LIMITED
Supervised By:
Nusrat Farzana
Assistant Professor
School of Business & Economics
United International University
Submitted By:
Md Jonayed Kabir
ID: - 111-141-398
Major in finance
School of Business & Economics
United International University
Date of Submission: 6th
June, 2018
United International University Page iii
Letter of Transmittal
Date: 06.06.2018
To
Nusrat Farzana
Assistant Professor
School of Business & Economics
United International University
Subject: Submission of the Internship Report
Dear Madam,
With due respect, I would like to submit the report on “Agricultural products impact on
economic prosperity: A case study on Greenland Technologies Limited” which was the
topic of my internship program. I would like to say that this report was prepared by me under
the supervision of my internship supervisors.
I believe that this internship program has given me a vast opportunity to enrich both of my
knowledge and experience. I made my best effort to fulfill the objective of the report and
believe that it will meet your expectation.
In preparing this report I have tried utmost to include all the relevant information to make the
report comprehensive as well as workable one.
I, therefore, hope that you will enjoy reviewing this report.
Thank you.
…………………………...
United International University Page iv
Acknowledgement
I have incurred many debts of gratitude over the last three months while preparing for this
report. First and foremost, I would like to pay my gratitude to the almighty Allah for giving
me the ability to work hard. The report titled, as ―Financial Performance Analysis of
Greenland Technologies Limited‖- has been prepared to fulfill the requirements of BBA
program. I am very much fortunate that I have received utmost and sincere guidance,
supervision and co-operation from various persons while preparing this report. Many people
have helped unconditionally in making this report.
First of all, I would like to thank my academic Supervisor of the internship report, Nusrat
Farzana mam, Assistant Professor of United International University, for her supervision,
valuable time, assistance and constant guideline. Without her supervision the internship
report would not be a quality one.
Secondly, I want to thank my office supervisor Mr. Bijan Bhowmick (Manager, Finance)
who welcomed me into the beautiful corporate world of Greenland Technologies Limited. He
gave me the opportunity to have an excellent and enduring practical working experience, to
go out of my comfort zone and learn to be more creative, challenging and confident. And also
would like to thanks Mr. Khaled Mohammad Masum (Assistant Manager, Accounts), Mr.
Md. Hafizur Rahman Sumon (Senior Executive Officer, Accounts), S.M Ashik Ahmed
(Senior Executive, Accounts) & Shahed Ahamed Sajib (Executive Officer, Commercial &
Foreign Trade) for introducing me with the process and prospects of accounts related
activities. They have helped me with continuous guidance, support during the internship.
Finally, I would like to convey my gratitude to my Parents. Without their contribution it
would not be possible for me to complete the three months internship as well as my BBA
program.
United International University Page v
Executive Summary
Greenland Technologies Limited (GTL) is a reflection of GETCO Group’s vision to be a
leader of the best quality importing Agricultural & Industrial Equipment. GTL is owned by
K.M. Khaled (Chairman), K.M. Rakib Hasan (Managing Director) & K.M. Mobarak Hossain
(Director). The company was established in June 2011 but started its operation in June 2013
as a sister concern of GETCO Group. Now GTL owns more than 30 showrooms for its
agricultural tractors all over the Country also owns a showroom for its cleaning machineries
and other products in the Capital city Dhaka. It has become a well-known name for heavy
weight machineries and cleaning equipment’s.
Greenland Technologies Limited aspires to provide farmers with complete agricultural
solutions by importing quality tractor for modernizing of agriculture production, with
particular attention on increased production, processing and value addition. On the other hand
GTL mitigates the demand of home & Industrial cleaning machineries.
In the time of intern, I got the opportunity to use my accounting and financial term for three
months as an intern at GTL. Three month continuously learning and hard working at GTL,
helps me to prepare the term paper, it was the feedback of my internship time. Here, I am
going to discuss about the basic overview of the GTL Company and its products,
departments, my job responsibility as an intern and brief description about the agricultural
product economic impact and the four year financial data analysis of GTL. We also find out
how GTL’s agricultural product help improve the agricultural economic sector. After that we
analyses the important ratio by using the four years data (2013- 2016) which will help to tell
about the company’s present condition. Find out the outcome from the financial analysis
whether it negative or positive. In the recommendation part, it will tell about the task which
will help improve the negative finding.
We know that intern is a learning time for a student. I also learn lots of thing in three month
internship. The experience will help me to do better and stronger in my desire sector. I
learned how to work in pressure and also taught me that strategy is paly crucial part for a
United International University Page vi
company to survive in the market. Because of the wrong strategy may bring lot of problem
for a company.
Table of content
CH-01Introduction .................................................................................................................. 1
1.1Background of the study ................................................................................................................ 2
1.2Origin of the Report ....................................................................................................................... 2
1.3Objective of the Report ................................................................................................................. 3
1.3.1Main Objective ........................................................................................................................ 3
1.3.2Specific Objectives .................................................................................................................. 3
1.4Methodology .................................................................................................................................. 3
1.5 The study’s extent ......................................................................................................................... 3
1.6Limitations of the study ................................................................................................................. 4
CH-02 Company Profile .......................................................................................................... 5
2.1 Background of Greenland Technologies Limited .......................................................................... 6
2.2 Vision Statement: .......................................................................................................................... 7
2.3 Mission Statement: ....................................................................................................................... 7
2.4 Values of the Organization ............................................................................................................ 8
2.5 The Board of Directors of Greenland Technologies Limited ......................................................... 8
Chairman ............................................................................................................................................. 9
2.6 Hierarchy of the Organization ....................................................................................................... 9
2.6 Organization Structure .................................................................................................................. 9
2.7 The Total Employee of the company .......................................................................................... 10
2.8 SWOT Analysis: ........................................................................................................................... 10
2.9 Product of the Organization ........................................................................................................ 12
Ch-03Job Responsibility as an Intern at GTL .................................................................... 13
3.1 Financial Accounting Department of GTL ................................................................................... 14
3.2 Job Responsibilities ..................................................................................................................... 15
CH-04 GTL Agriculture’s Product Impact On Economic prosperity of BD ................... 16
4.1 GETCO’s Agriculture product ...................................................................................................... 17
United International University Page vii
4.2 How to sell the product .............................................................................................................. 18
4.2.1 Direct sell- ............................................................................................................................ 18
4.2.2 Installment- .......................................................................................................................... 19
4.2.3Leasing .................................................................................................................................. 19
4.3 Importance of the agriculture sector .......................................................................................... 20
4.3.1 Importance of agricultural growth ....................................................................................... 20
4.3.2 Importance Modernization of the agriculture ..................................................................... 20
4.3.3 Importance of the GTL’s agricultural product ...................................................................... 21
4.3.4 GTL’s Product name and details .......................................................................................... 21
4.4 Bangladesh GDP growth ............................................................................................................. 21
4.5 GTL impact on the economic prosperity ..................................................................................... 22
Ch-05Financial Performance Analysis of GTL ................................................................... 24
5.1 Objectives of Financial Ratio Analysis: ........................................................................................ 25
5.2 Methodology: .............................................................................................................................. 28
5.3 Financial Ratio Analysis of GTL .................................................................................................... 31
5.3.1 Liquidity Ratios ..................................................................................................................... 31
5.3.2 Activity Ratios....................................................................................................................... 34
5.3.3 Debt Ratio: ........................................................................................................................... 38
5.3.4 Profitability Ratios ................................................................................................................ 41
Ch-06: Findings ...................................................................................................................... 48
Ch-07: Recommendations ..................................................................................................... 51
Ch-08: Conclusion .................................................................................................................. 52
Ch-09 Appendix ..................................................................................................................... 53
CH-10 Bibliography ............................................................................................................... 54
United International University Page 1
CH-01Introduction
United International University Page 2
1.1Background of the study
Internship is the most crucial part and the ending part for a student. Each and every student
can do it. It is the place where a student will meet the actual working environment and, learn
the way of working with official discipline. They should determine to learn new things and
official task. A student can gain the theoretical learning in their long four year study life but a
student can gain practical knowledge through the internship program. This is the important
and quality time for a student to use the theoretical knowledge in practical life. In the whole
internship training program, a student can learn the practical way to use their theoretical
knowledge.
I had done my internship program at ―Greenland Technologies Limited‖ under accounting
and finance department. I gave the importance in agricultural economic sector and the
financial analysis of GTL that’s why the name of the topic for my report is “Agricultural
products impact on economic prosperity: A case study on Greenland Technologies
Limited”. My organization supervisor Mr. Bijan Bhodwmick (Manager, Finance, Greenland
Technologies Limited) and my institutional supervisor of United International University,
Assistant Professor, Nusrat Farzana mam accepted it.
1.2Origin of the Report
Students has a reason to complete the program and the important reason is to face the real
corporate working environment in the practical life and let the student learn about the
practical experience in real working sector by using the four years theoretical knowledge. It is
an important part for all the graduate students from United International University (UIU). I
completed my internship program on the ―Greenland Technologies Limited‖ and I prepared
my internship report based on this company. It is very important part for me to complete my
BBA graduation and the supervisor of the program is Nusrat Farzana mam who is the
assistant professor of UIU (United International University). It (report) is the result or
feedback of three months hardworking under Greenland Technologies Limited (GTL)
Company.
United International University Page 3
1.3Objective of the Report
1.3.1Main Objective
To evaluate the financial performance of Greenland Technologies Limited based on financial
management procedures & How the AED product (Agricultural Product) sells to the farmers
and the corporation and how it impacts on the agriculture sector by using the product.
1.3.2Specific Objectives
To understand the financial performance of GTL on different areas such as liquidity,
profitability and solvency.
To assess the company’s effectiveness and weakness in these segments.
To make recommendations to improve in these areas where it is needed.
To identify the importance of AED product in the agriculture sector.
To know the installment & leasing process of AED product.
To know about the consequences of default in AED sector.
1.4Methodology
The two types of data is being use to prepare a report. And those are-
1) Primary data
2) Secondary data
The closing ended question, personal interview, annual report information (confidential),
website, journal, article, prospectus, previous report, collected the information by observing
organizational procedure and various sources used to collect the data for the report.
1.5 The study’s extent
Here I searched about the Inadequacy, capacity, and positive and negative side of GTL by
using the financial data and also based on the impact of national economic prosperity. The
information and important data was gathered by the help of GTL’s employees. Those types’
of data is known as a primary data. And the secondary data is also used to prepare the report.
United International University Page 4
1.6Limitations of the study
I was working in the GTL for three months as an intern and it seems very short time. But it
was a great opportunity for me to working under them and the environment of the GTL office
was very friendly. Every one of my department always treat me well. Although we know that
there has some norm, rules and restriction in every firm. That’s why I had to face some
limitation to collect the information for preparing the report.
Large scale investigation was not possible due to time constraints.
The study was conducted only within few employees of GTL (Head Office).
Relevant data and documents collection were difficult due to the organizational
confidentiality.
United International University Page 5
CH-02 Company Profile
United International University Page 6
2.1 Background of Greenland Technologies Limited
Started with only one salesman, Head of operation also managed to bring the infant company
to a midsize company where there are now Greenland Technologies Limited (GTL), a
concern of GETCO Group was established in 2011. GTL is owned by K.M. Khaled
(Chairman), K.M. Rakib Hasan (Managing Director) & K.M. Mobarak Hossain (Director)
and it was established in 2011 but started its operation in 2013. Being inspired and directed
by Chairman, Executive Director Golam Arham Kibria managed to get distributorship of
Demag
Karcher
New Holland
Boge
Jungheinrich
And some another multinationals equipment companies.
There are now more than 200 employees, with 8 showrooms, 2 warehouses, Head office and
regional office in Chittagong. We are governed by ERP. Sales teams are supported by call
centers. All showrooms and offices now have their own computers, printers and scanners.
GTL have appointed most renowned audit firm ACNABIN as external auditor who will not
only assigned to audit our accounts but also to audit the whole operation system, just to
ensure that GTL will be an internationally recognized company for its operation methods by
end of 2019.
GETCO Group is one of the respected and reputed business houses in Bangladesh. Over the
last 45 years it has transformed itself from a small trading company into a leading diversified
business firm in Bangladesh. GETCO Group consists of nine sisters concern and Greenland
Technologies Limited is one of the major wings of the group. Greenland Technologies
limited is running profitably in different business area. The employees are highly dedicated
for their company and treat like it is their own company. There have more experienced
employees who have the magnificent leadership quality to run a company. The employees
always support the management in good and bad condition. They are also providing the
services after selling the product. The company has connection with high class manufacturer
who will provide the high class product to them and also has field worker who will provide
the product repair service and they are highly skilled to solve any kind of technical problem
in the product by taking a minimum service charge
United International University Page 7
Greenland Technologies Limited (GTL) was established in 2011 which contributes in
national economy through sustainable solutions to the agricultural sector and Industrial
Sector. Their strategic business units-Agro-Machineries, cleaning equipment for home and
garden as well for industrial cleaning machineries provides highly effective products to fulfill
the wide gap in Bangladesh market. Their aim is to provide this nation with a better future
with complete solution to the farmer, households and industrial sector through inspiring
innovations and keen focus on research and development.
They have the expertise and equipment to provide their clients with a complete range of
services necessary to maximize their rural investment. Their team has always been at the
forefront to solve the demand of growers as well as the demand of final customers in the
target market. They believe that in order to promote today’s global agriculture and industry, it
is essential to assist to the growers benefit, profit and happiness, along with fulfilling the
needs of the final consumer, price and quality wise.
2.2 Vision Statement:
To be a leader of the best quality import and capture the maximum market share.
To be the pioneer of Diversified & Quality Product Varieties.
Best after sales service provider in Agro and Industrial business.
2.3 Mission Statement:
We want to bring ethical and excellence in business practices in agro and industrial sector
contributing significantly to GDP and ensuring trust from grower to consumer.
United International University Page 8
2.4 Values of the Organization
Integrity : We are honest, transparent and ethical in all our dealings
Passion to Win : We deliver what we promise by bringing the best in all of us
Respect to individual : We win the hearts and minds of all people we interact with
Teamwork : We believe in trust, truth and team effort
Making a Better World : We compassionately contribute to the community we live in
Continuous Improvement: We strive to learn and innovate new paradigms
Every Paisa Counts : We treat every taka spent as our own
2.5 The Board of Directors of Greenland Technologies Limited
K.M.Khaled Chairman
K.M. Rakib Hasan Managing Director
K.M. Mobarak Hossain Director
Golam Arham Kibria Executive Director
United International University Page 9
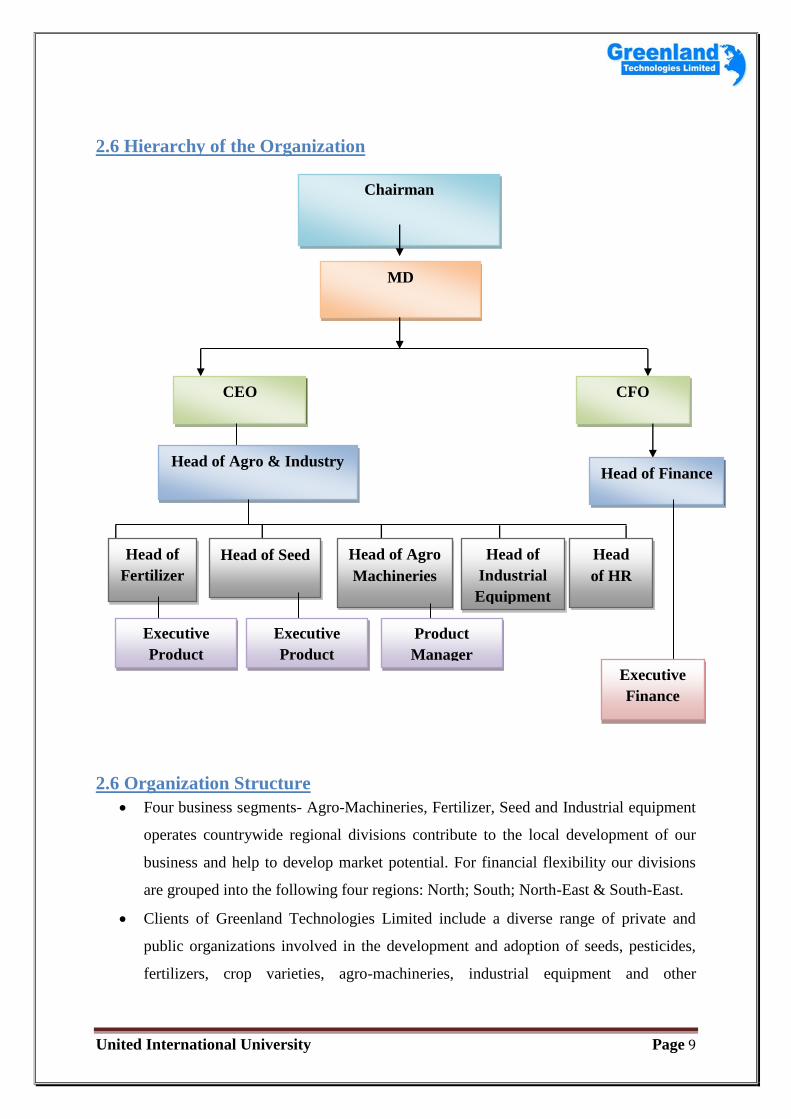
2.6 Hierarchy of the Organization
2.6 Organization Structure
Four business segments- Agro-Machineries, Fertilizer, Seed and Industrial equipment
operates countrywide regional divisions contribute to the local development of our
business and help to develop market potential. For financial flexibility our divisions
are grouped into the following four regions: North; South; North-East & South-East.
Clients of Greenland Technologies Limited include a diverse range of private and
public organizations involved in the development and adoption of seeds, pesticides,
fertilizers, crop varieties, agro-machineries, industrial equipment and other
Chairman
MD
CFO CEO
Head of Finance Head of Agro & Industry
Head of
Fertilizer
Head of Seed Head
of HR
Head of
Industrial
Equipment
Head of Agro
Machineries
Product
Manager
Executive
Product
Executive
Product
Executive
Finance
United International University Page 10
agricultural inputs. Their prime clients include farmer groups, agricultural
distributors, universities, research corporations and other government organizations.
Their team of experienced staff, proven systems, leading edge technology and
equipment reflects to your individual requirements.
They provide centrally coordinated after sales service on a national scale with our
extensive network of collaborators in other regions.
2.7 The Total Employee of the company
Greenland Technologies Company is developing day by day because of their business market
performance. That’s why they need more human power for maintaining and creating the new
working field in the business area. The theme of the GTL is ―one-bank one-family. It builds a
better work environment in the company and it is also working as a motivation for the
working crews of all the departments. There have total 50 employees in the main branch
where I was doing my intern. The company is always caring about their staff health and the
working environment. The company provide yearly holiday package for all employees, also
provide maternity leave. The company is also providing the benefit, and it is based on the
better performance of employees and also providing the festival bonus.
2.8 SWOT Analysis:
SWOT analysis is very important for every company. SWOT analysis helps the company to
justify about their strength, weakness, opportunity & threats.
S=Strength
W=Weakness
O=Opportunity
T=Threats
SWOT analysis of Greenland Technologies Limited is as follows:
United International University Page 11
Strengths:
Company Image
Strong Financial capabilities as a new company
Identified customer need
Professional sales team
Modern technology
Weaknesses:
New entry in Importing
Lack of experience in lease financing
Quick decision making problem
Manpower setup problem
Well distribution network problem
Opportunities:
Rapid mechanization of agriculture sector
Increase construction works in rural areas
ROI is substantial
Extension of variability of product
Ensure Market coverage against competitor’s product.
Add value to Attract Consumer.
Advertising and targeting the Target customer
Govt. support for agribusiness
Increase farmers awareness
Rapid mechanization of agriculture sector
Technology used in agribusiness
Threats:
Global economic recession
Dependent on foreign supply
Higher purchase model
United International University Page 12
Change the Govt. policy
Risk factor
Credit based business
High competition
Many national and international company in the market
Low quality product in the market
Maximizing sales
2.9 Product of the Organization
NEW HOLLAND TRACTOR
TARA POWERTILLER
TARA DIESEL ENGINE
United International University Page 13
Ch-03Job Responsibility as an Intern at GTL
United International University Page 14
3.1 Financial Accounting Department of GTL
A team of 10 people look after the Financial Accounting Department in GTL. This team is
accountable to deal with all the business transactions conforming the company policies and
practices. They also prepare the external and internal reports for all stakeholders as per
company requirements. The responsibilities of the employee of this department, is to manage
and control future cash collections and disbursement, using the resources effectively and
efficiently to generate more cash inflow. They use TALLY & VANGUARD software for
their convenience to collect the data. However, they have to take some risks for these types of
cash flows. Suitable accounting systems must be used in this section because company’s
financial result depends on these transactions. If any data mistakenly entered into the process
GTL have to suffer for this. As a consequence, the employees of this department need to be
very cunning and careful. Thus, GTL’s Finance department can avoid various risks, market
risk, credit risk and liquidity risk by managing the treasury effectively.
Although the department is very small with few people but their contributions are huge.
Some major activities under this department are:
Transfer funds from one account to another such as GTL to GTL Motors, GTL to
GETCO, GTL to MIL TRADE etc.
Monitoring the collections of daily sales proceeds and deposit them in bank accounts.
Maintaining relationships with different banks for account opening, closing etc. and
perform bank reconciliation.
Make payments for petty bills and third parties for raw materials, machineries
purchase etc.
Calculate depreciation expenses for fixed assets.
Deducting tax at source and withholding tax.
Opening letter of credit, settle the payments of LC, analyze exchange rate for
measuring foreign exchange gain and loss from LC operations.
Produce half yearly and annual financial reports.
Manage cash flows and liquidity crisis.
United International University Page 15
3.2 Job Responsibilities
I am honored because I got the chance to spend my internship period at the corporate head
office of GTL. There was really a good communication between the employees and every
one of them was efficient and talented in various works. I have learned many things from
them. I was assigned to work under the supervision of one person but I had the opportunity to
work with others also. Therefore, I have used my time effectively and efficiently. I have
started my internship at GTL on 15thth
January 2018 and ended up on 15th
April 2018. The
work environment was friendly. Before assigning any task, they made me understand from
the scrap and at the beginning they checked and monitored whether I was following the
instructions correctly or not. During my internship period, I have done various types of work
in Financial Accounting Department and I have tried my level best to complete all the jobs
accurately.
These are the following tasks I was responsible during my internship in the organization:
1. Coding for Customers of all products for VANGUARD posting
2. Collecting details information about supplier and customer company
3. Preparing product price rate comparison report among different companies
4. Documentation of sales invoice and delivery challan on monthly basis and preparing
report of collecting sales invoice and delivery challan on the basis of previous sales
5. Helping sending letter notice about overdue payment of customer company
6. Checking Documentation and procedure of letter of credit (LC) files
7. Prepare journal voucher for VANGUARD and posting into the system, print system
copies for documentation
8. Calculation, analysis and reporting of purchase order (PO)
9. Patty cash calculation, analysis and reporting
10. Bank Deposit Voucher calculation, analysis and reporting
11. Lunching VANGUARD with different modules like order entry and invoicing,
inventory and purchase order management , accounts receivable , sales analysis,
general ledger, accounts payable, cash book main menu.
12. Corporate bank account process.
United International University Page 16
CH-04 GTL Agriculture’s Product Impact On
Economic prosperity of BD
United International University Page 17
4.1 GETCO’s Agriculture product
New Holland Tractor is serving the needs of farmer and ranchers more than 110 years across
the North America. A huge collection of the product along with tractor, forge equipment,
harvesting crop production and material handling equipment are manufactured by the GTL
Company. New Holland also manufactures a compact tractor line equipped with the same
comfort and the product is designed in a way which is easy to use.
New Holland is a global brand of agricultural machinery produced by CNH Industrial. New
Holland agricultural products include tractors, combine harvesters, balers, forage harvesters,
self-propelled sprayers, haying tools, seeding equipment, hobby tractors, utility vehicles and
implements, as well as grape harvesters. The original New Holland Machine Company was
founded in 1895 in New Holland. New Holland equipment is manufactured globally and the
current administrative headquarters are in Turin, Italy, with New Holland, Pennsylvania
serving as the headquarters for North America and home of the largest hay tools production
facility in the world. With 18 plants spread globally, as well as six joint ventures in the
Americas, Asia, and the Middle East, the corporation is present in 170 countries worldwide.
Greenland Technologies Limited imports few those types product and sells it to the market.
They import the product from Asian’s New Holland Branch .There has no question about the
product quality because I am already mentioned above the history and reputation of the New
Holland Tractor. Greenland Technologies Limited brings these types of product because the
quality is matter for them. By using these types of equipment our farmer and user of the
product will be benefited.
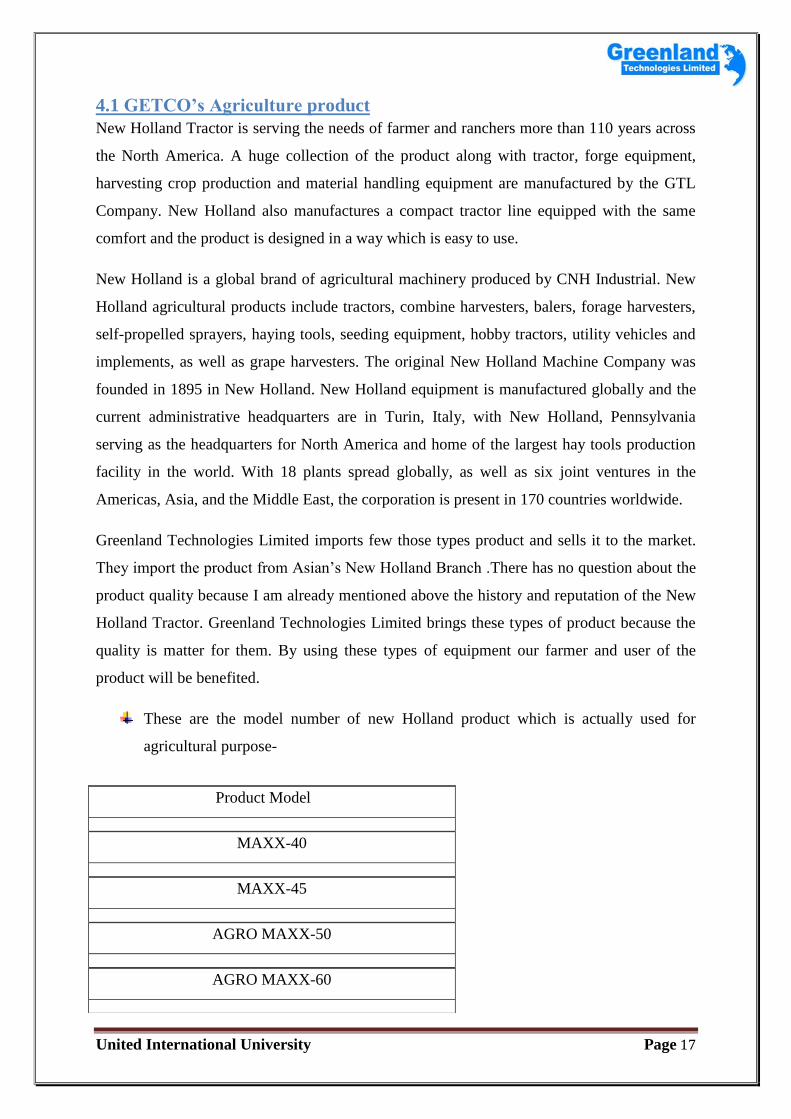
These are the model number of new Holland product which is actually used for
agricultural purpose-
Product Model
MAXX-40
MAXX-45
AGRO MAXX-50
AGRO MAXX-60
United International University Page 18
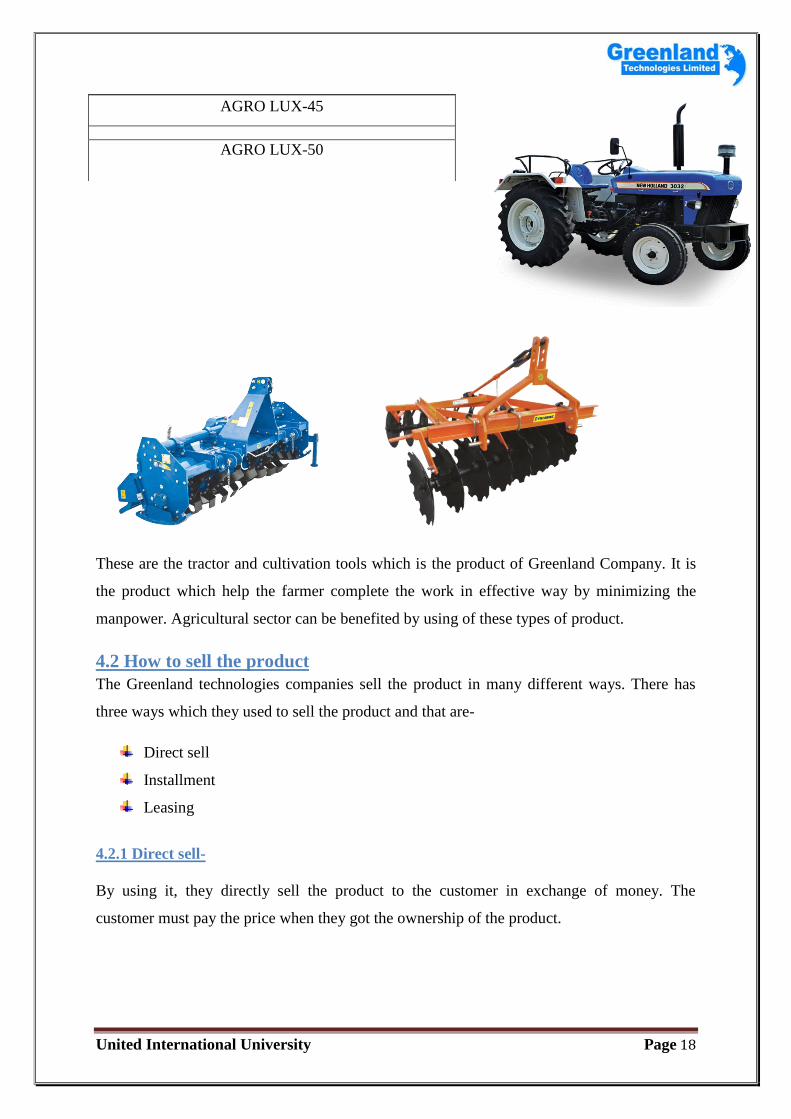
These are the tractor and cultivation tools which is the product of Greenland Company. It is
the product which help the farmer complete the work in effective way by minimizing the
manpower. Agricultural sector can be benefited by using of these types of product.
4.2 How to sell the product
The Greenland technologies companies sell the product in many different ways. There has
three ways which they used to sell the product and that are-
Direct sell
Installment
Leasing
4.2.1 Direct sell-
By using it, they directly sell the product to the customer in exchange of money. The
customer must pay the price when they got the ownership of the product.
AGRO LUX-45
AGRO LUX-50
United International University Page 19
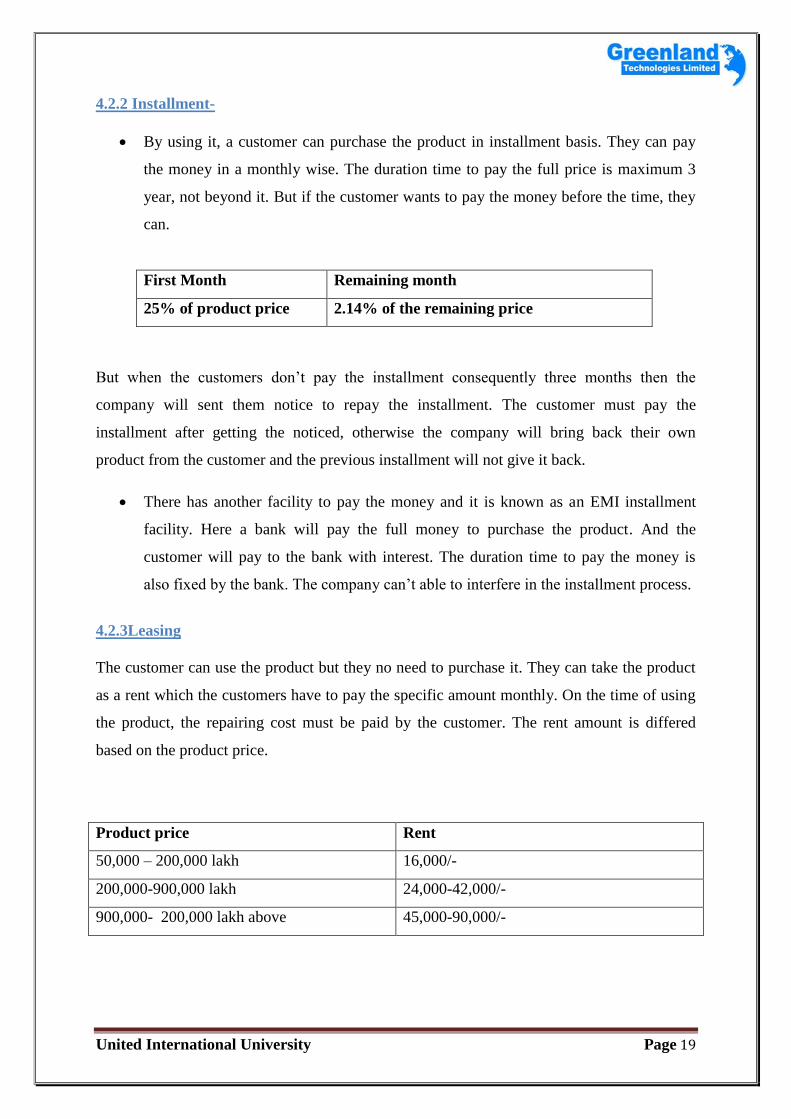
4.2.2 Installment-
By using it, a customer can purchase the product in installment basis. They can pay
the money in a monthly wise. The duration time to pay the full price is maximum 3
year, not beyond it. But if the customer wants to pay the money before the time, they
can.
First Month Remaining month
25% of product price 2.14% of the remaining price
But when the customers don’t pay the installment consequently three months then the
company will sent them notice to repay the installment. The customer must pay the
installment after getting the noticed, otherwise the company will bring back their own
product from the customer and the previous installment will not give it back.
There has another facility to pay the money and it is known as an EMI installment
facility. Here a bank will pay the full money to purchase the product. And the
customer will pay to the bank with interest. The duration time to pay the money is
also fixed by the bank. The company can’t able to interfere in the installment process.
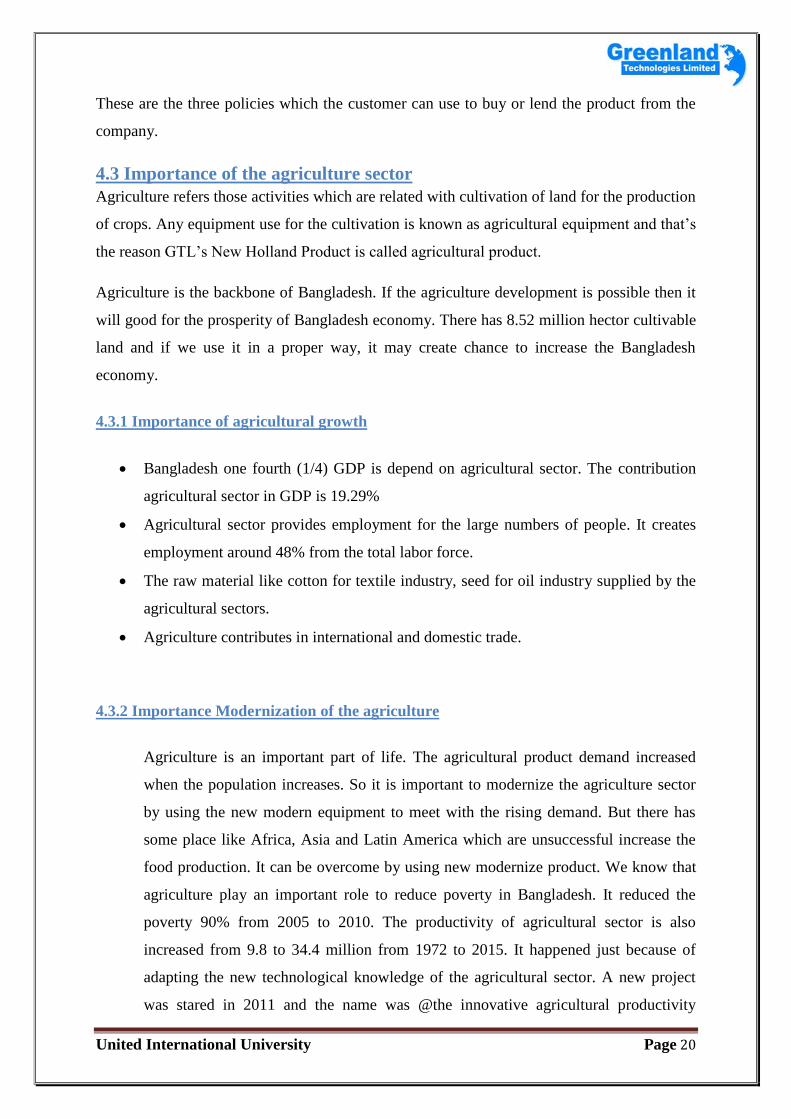
4.2.3Leasing
The customer can use the product but they no need to purchase it. They can take the product
as a rent which the customers have to pay the specific amount monthly. On the time of using
the product, the repairing cost must be paid by the customer. The rent amount is differed
based on the product price.
Product price Rent
50,000 – 200,000 lakh 16,000/-
200,000-900,000 lakh 24,000-42,000/-
900,000- 200,000 lakh above 45,000-90,000/-
United International University Page 20
These are the three policies which the customer can use to buy or lend the product from the
company.
4.3 Importance of the agriculture sector
Agriculture refers those activities which are related with cultivation of land for the production
of crops. Any equipment use for the cultivation is known as agricultural equipment and that’s
the reason GTL’s New Holland Product is called agricultural product.
Agriculture is the backbone of Bangladesh. If the agriculture development is possible then it
will good for the prosperity of Bangladesh economy. There has 8.52 million hector cultivable
land and if we use it in a proper way, it may create chance to increase the Bangladesh
economy.
4.3.1 Importance of agricultural growth
Bangladesh one fourth (1/4) GDP is depend on agricultural sector. The contribution
agricultural sector in GDP is 19.29%
Agricultural sector provides employment for the large numbers of people. It creates
employment around 48% from the total labor force.
The raw material like cotton for textile industry, seed for oil industry supplied by the
agricultural sectors.
Agriculture contributes in international and domestic trade.
4.3.2 Importance Modernization of the agriculture
Agriculture is an important part of life. The agricultural product demand increased
when the population increases. So it is important to modernize the agriculture sector
by using the new modern equipment to meet with the rising demand. But there has
some place like Africa, Asia and Latin America which are unsuccessful increase the
food production. It can be overcome by using new modernize product. We know that
agriculture play an important role to reduce poverty in Bangladesh. It reduced the
poverty 90% from 2005 to 2010. The productivity of agricultural sector is also
increased from 9.8 to 34.4 million from 1972 to 2015. It happened just because of
adapting the new technological knowledge of the agricultural sector. A new project
was stared in 2011 and the name was @the innovative agricultural productivity
United International University Page 21
project. It has provided technical training to about 300,000 farmers to improvise their
knowledge.
4.3.3 Importance of the GTL’s agricultural product
Normally the Greenland Technologies agricultural equipment’s are tractor and
cultivation tools. It helps farmers to make the work easy and effective. It will reduce
the need of man power for the cultivation and also reduce the extra cost. The big issue
is about the price of the equipment. But GTL offers the installment process and is also
giving the opportunity to use the product in lease. Because of it, the farmers or users
no need to think about the huge amount of price of the equipment. GTL offers the
opportunity because they know that advance equipment of the
Agricultural sector can help our country to dominate in the modern farming world.
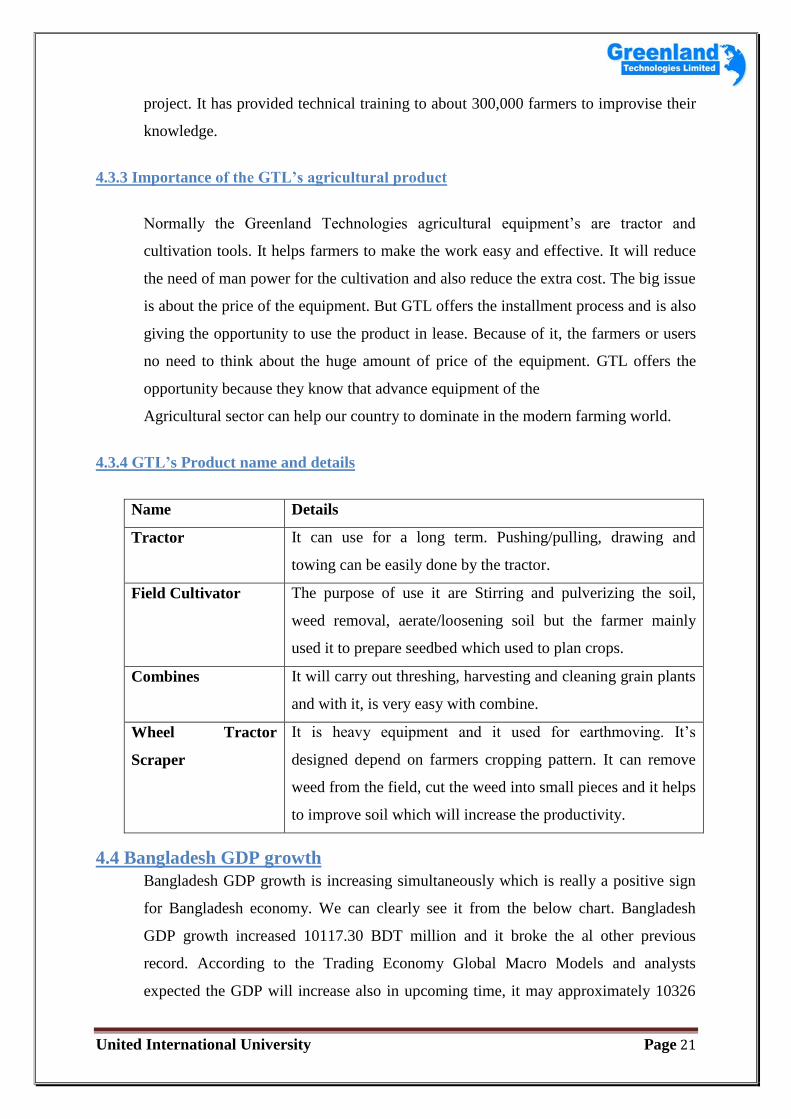
4.3.4 GTL’s Product name and details
Name Details
Tractor It can use for a long term. Pushing/pulling, drawing and
towing can be easily done by the tractor.
Field Cultivator The purpose of use it are Stirring and pulverizing the soil,
weed removal, aerate/loosening soil but the farmer mainly
used it to prepare seedbed which used to plan crops.
Combines It will carry out threshing, harvesting and cleaning grain plants
and with it, is very easy with combine.
Wheel Tractor
Scraper
It is heavy equipment and it used for earthmoving. It’s
designed depend on farmers cropping pattern. It can remove
weed from the field, cut the weed into small pieces and it helps
to improve soil which will increase the productivity.
4.4 Bangladesh GDP growth
Bangladesh GDP growth is increasing simultaneously which is really a positive sign
for Bangladesh economy. We can clearly see it from the below chart. Bangladesh
GDP growth increased 10117.30 BDT million and it broke the al other previous
record. According to the Trading Economy Global Macro Models and analysts
expected the GDP will increase also in upcoming time, it may approximately 10326
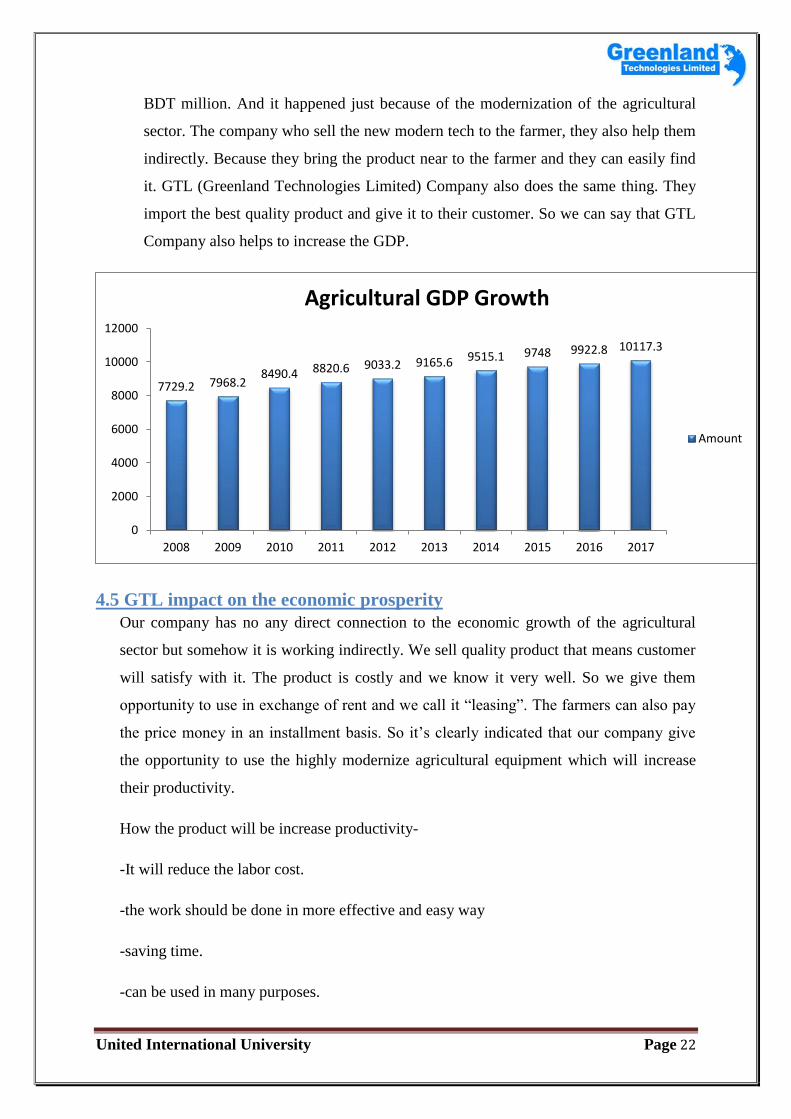
United International University Page 22
BDT million. And it happened just because of the modernization of the agricultural
sector. The company who sell the new modern tech to the farmer, they also help them
indirectly. Because they bring the product near to the farmer and they can easily find
it. GTL (Greenland Technologies Limited) Company also does the same thing. They
import the best quality product and give it to their customer. So we can say that GTL
Company also helps to increase the GDP.
4.5 GTL impact on the economic prosperity
Our company has no any direct connection to the economic growth of the agricultural
sector but somehow it is working indirectly. We sell quality product that means customer
will satisfy with it. The product is costly and we know it very well. So we give them
opportunity to use in exchange of rent and we call it ―leasing‖. The farmers can also pay
the price money in an installment basis. So it’s clearly indicated that our company give
the opportunity to use the highly modernize agricultural equipment which will increase
their productivity.
How the product will be increase productivity-
-It will reduce the labor cost.
-the work should be done in more effective and easy way
-saving time.
-can be used in many purposes.
7729.2 7968.2 8490.4 8820.6 9033.2 9165.6 9515.1 9748 9922.8 10117.3
0
2000
4000
6000
8000
10000
12000
2008 2009 2010 2011 2012 2013 2014 2015 2016 2017
Agricultural GDP Growth
Amount
United International University Page 23
Example: - Tractor can be used for the cultivation and also they use it to carry the crops or
food from one place to another
Our company also provides service warranty to the customer, which will reduce a farmer
repairing cost. So we can say that the Greenland Technologies company indirectly impact on
the Bangladesh economic prosperity.
Mr. Sharifuddin doulah is customer of our company. He bought a field cultivator from our
DINAJPUR (DJP) branch in an installment and he is happy with our product. He shared his
experience with us. He told us that the product is more effective. It reduces his cost and
increase the profit and productivity. He also share his experience with other farmer and they
also want get the same service from us. It means our product is really helping them to
increase their income. And when farmers earn more profit, it will create a positive impact on
the GDP growth. So that’s the reason, the GTL company indirectly impact on the Bangladesh
economic prosperity.
United International University Page 24
Ch-05Financial Performance Analysis of GTL
United International University Page 25
Financial ratios are useful indicators of a firm's performance and financial situation. Most of
the ratios can be calculated from information provided in the financial statements.
5.1 Objectives of Financial Ratio Analysis:
To analyze the financial statements of GTL.
To calculate the different types of financial ratios of the company.
To know the financial condition of the company.
To know the company’s financial development for last five years.
Using of the financial ratio:
The financial statement is the major part of company and it is regularly needed for the
company to measure the company’s operating efficiency. The information contain in the four
financial statements. The financial statement is based on the use of the ratio or relative value
that’s why relative is the main word here. To analysis and monitoring the firm performance
can be possible by calculating and understanding of the financial ratios. The income
statement and the balance sheet are the fundamental input to ratio analysis .
Types of Ratio Comparisons:
Ratio analysis is not merely the calculation of a given ratio. More important is the
interpretation of the ratio value. A meaningful basis for comparison is needed to answer such
questions as ―Is it too high or too low?‖ and ―Is it good or bad?‖ Two types of ratio
comparisons can be made:
Cross-sectional and
Time-series.
(i)Cross-Sectional Analysis: Cross-sectional analysis involves the comparison of different
firms’ financial ratios at the same point in time. Analysts are often interested in how well a
firm has performed in relation to other firms in its industry. Frequently, a firm will compare
its ratio values to those of a key competitor or group of competitors that it wishes to emulate.
This type of cross-sectional analysis, called benchmarking, has become very popular.
United International University Page 26
(ii)Time-Series Analysis: Time-series analysis evaluates performance over time.
Comparison of current to past performance, using ratios, enables analysts to assess the firm’s
progress. Developing trends can be seen by applying more than one year comparison. Each
and every significant year to year difference may be emblematic of a big problem for a
company in the cross functional analysis.
(iii)Combined Analysis: The Cross functional and time series analysis is the most
informative approach in the ratio analysis. A combined view makes it possible to assess the
trend in the behavior of the ratio in relation to the trend for the industry.
Cautions about Using Ratio Analysis:
Before discussing specific ratios, we should consider the following cautions about their use:
i. Ratios with large deviations from the norm only indicate symptoms of a problem.
Additional analysis is typically needed to isolate the causes of the problem. The
fundamental point is this: Ratio analysis merely directs attention to potential areas of
concern; it does not provide conclusive evidence of the existing complication.
ii. A firm can’t judge the overall performance of a company by using the single ratio
because of insufficient information. The important ratios are needed for the better
judgment. But for the specific reasons s firm can use three or two or one ratio to
know about the firm financial condition.
iii. The financial audited statement’s data get more priority for the financial ratio
analysis. We may not find the exact financial situation of a company without using
the financial statements which have been audited.
iv. The financial performance can be measured by the financial ratio. The ratio’s result
need to compare and need to calculate by using the financial statement. Otherwise
they may create fault in their task and decisions. Because of the seasonal impact may
create problem. For a demo like account receivable turnover value of a company at
the end of the June will not match with the end of the December value and it may
United International University Page 27
create barrier to take any decision if they don’t compare the seasonal changes during
a year.
v. Inventory and depreciation accounts can create misinterpret in the ratio analysis.
That’s why the financial data should be developed in the same way like the financial
data are being compared.
There has five basic ratios which are being used to analysis a company financial condition by
using a company financial statement. That are-
Liquidity,
Activity,
Debt,
Profitability, and
Market ratios.
To measure a company’s return we can use the profitability ratio but the market ratio is not
only measure the return of a company but also measure the risk of a company. The ratios
which main task is calculating the risk are known as liquidity ratio, debt ratio and activity
ratio.
The balance sheet and the income statement are playing an important part to analysis the
financial ratio. That’s why I collected those things from the Greenland Technologies Limited
(GTL) to analysis the financial condition.
United International University Page 28
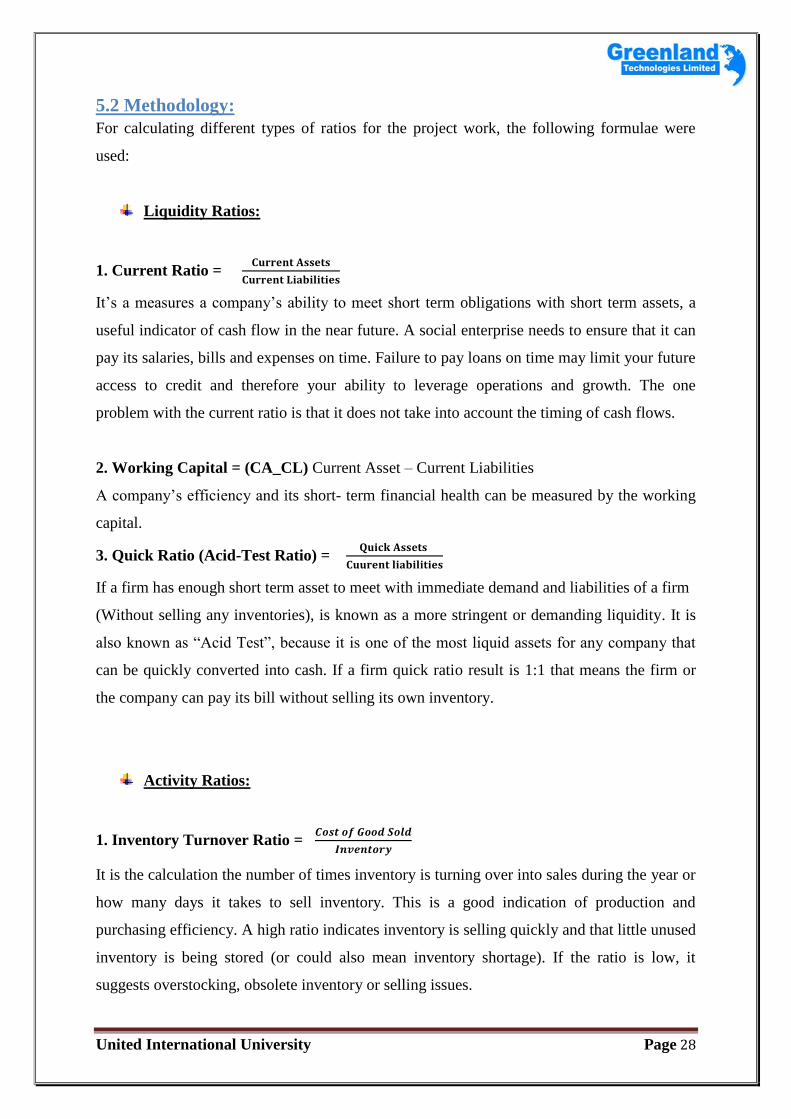
5.2 Methodology:
For calculating different types of ratios for the project work, the following formulae were
used:
Liquidity Ratios:
1. Current Ratio =
It’s a measures a company’s ability to meet short term obligations with short term assets, a
useful indicator of cash flow in the near future. A social enterprise needs to ensure that it can
pay its salaries, bills and expenses on time. Failure to pay loans on time may limit your future
access to credit and therefore your ability to leverage operations and growth. The one
problem with the current ratio is that it does not take into account the timing of cash flows.
2. Working Capital = (CA_CL) Current Asset – Current Liabilities
A company’s efficiency and its short- term financial health can be measured by the working
capital.
3. Quick Ratio (Acid-Test Ratio) =
If a firm has enough short term asset to meet with immediate demand and liabilities of a firm
(Without selling any inventories), is known as a more stringent or demanding liquidity. It is
also known as ―Acid Test‖, because it is one of the most liquid assets for any company that
can be quickly converted into cash. If a firm quick ratio result is 1:1 that means the firm or
the company can pay its bill without selling its own inventory.
Activity Ratios:
1. Inventory Turnover Ratio =
It is the calculation the number of times inventory is turning over into sales during the year or
how many days it takes to sell inventory. This is a good indication of production and
purchasing efficiency. A high ratio indicates inventory is selling quickly and that little unused
inventory is being stored (or could also mean inventory shortage). If the ratio is low, it
suggests overstocking, obsolete inventory or selling issues.
United International University Page 29
2. Total Asset Turnover Ratio =
Total Asset Turnover Ratio is the company's total revenue, the invoice, cash payments and
other revenues. Total Asset Turnover Ratio represents the value of goods and services
provided to customers during a specified time period - usually one year. How efficiently a
business generates sales on each currency of assets. An increasing ratio indicates a company
is using its assets more productively.
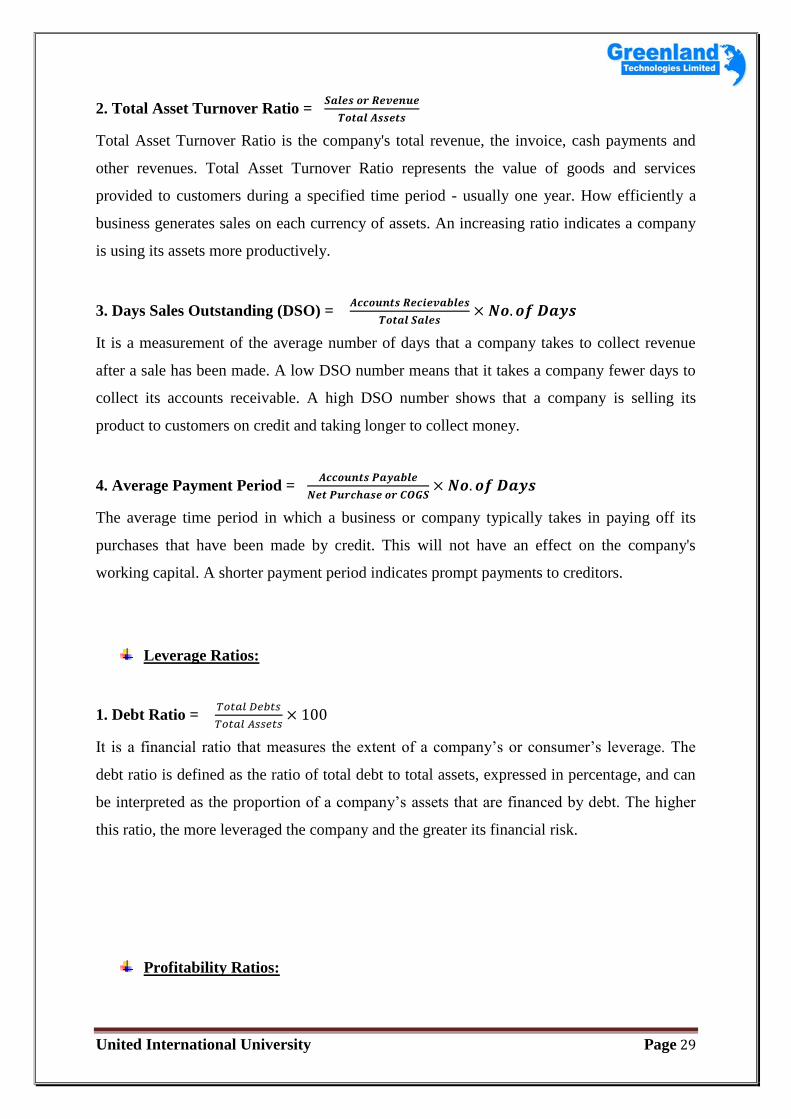
3. Days Sales Outstanding (DSO) =
It is a measurement of the average number of days that a company takes to collect revenue
after a sale has been made. A low DSO number means that it takes a company fewer days to
collect its accounts receivable. A high DSO number shows that a company is selling its
product to customers on credit and taking longer to collect money.
4. Average Payment Period =
The average time period in which a business or company typically takes in paying off its
purchases that have been made by credit. This will not have an effect on the company's
working capital. A shorter payment period indicates prompt payments to creditors.
Leverage Ratios:
1. Debt Ratio =
It is a financial ratio that measures the extent of a company’s or consumer’s leverage. The
debt ratio is defined as the ratio of total debt to total assets, expressed in percentage, and can
be interpreted as the proportion of a company’s assets that are financed by debt. The higher
this ratio, the more leveraged the company and the greater its financial risk.
Profitability Ratios:
United International University Page 30
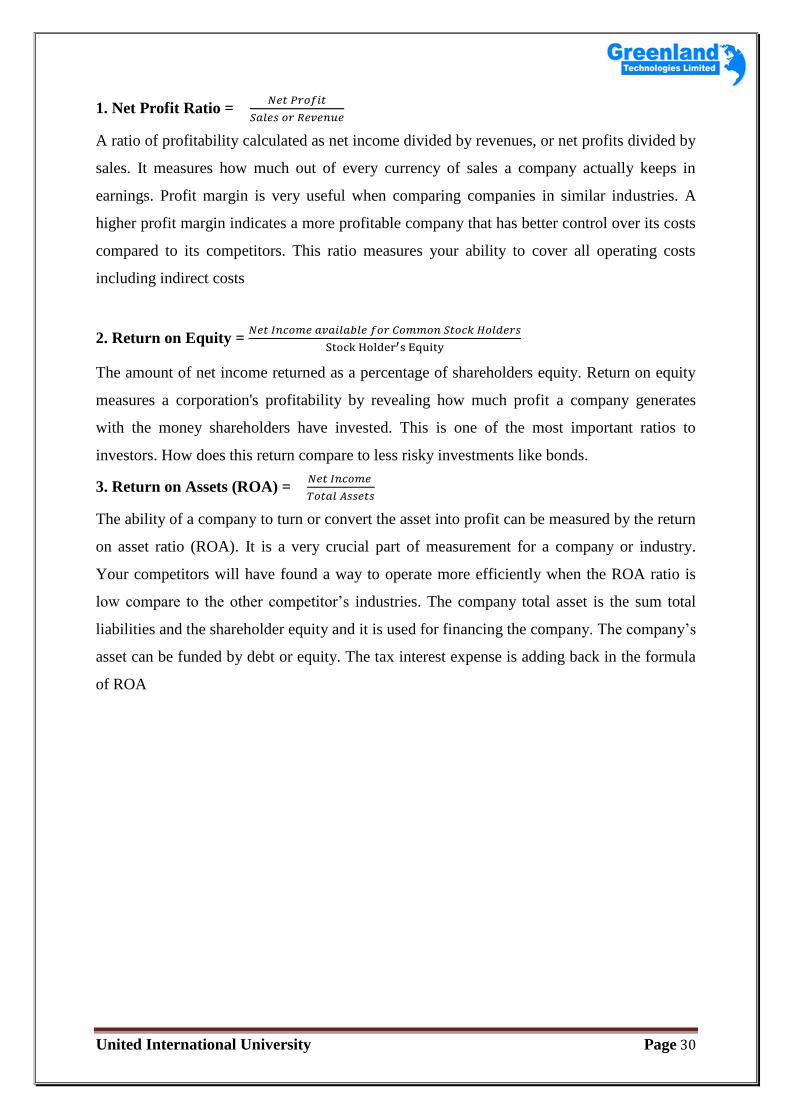
1. Net Profit Ratio =
A ratio of profitability calculated as net income divided by revenues, or net profits divided by
sales. It measures how much out of every currency of sales a company actually keeps in
earnings. Profit margin is very useful when comparing companies in similar industries. A
higher profit margin indicates a more profitable company that has better control over its costs
compared to its competitors. This ratio measures your ability to cover all operating costs
including indirect costs
2. Return on Equity =
The amount of net income returned as a percentage of shareholders equity. Return on equity
measures a corporation's profitability by revealing how much profit a company generates
with the money shareholders have invested. This is one of the most important ratios to
investors. How does this return compare to less risky investments like bonds.
3. Return on Assets (ROA) =
The ability of a company to turn or convert the asset into profit can be measured by the return
on asset ratio (ROA). It is a very crucial part of measurement for a company or industry.
Your competitors will have found a way to operate more efficiently when the ROA ratio is
low compare to the other competitor’s industries. The company total asset is the sum total
liabilities and the shareholder equity and it is used for financing the company. The company’s
asset can be funded by debt or equity. The tax interest expense is adding back in the formula
of ROA
United International University Page 31
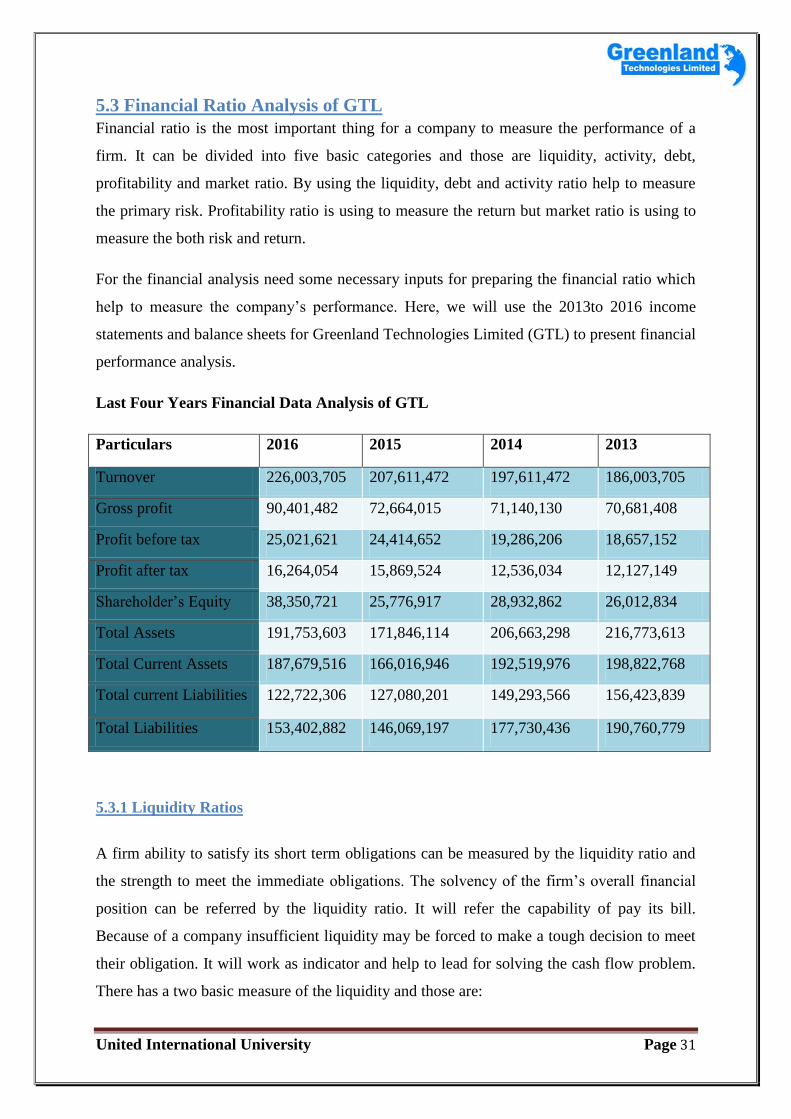
5.3 Financial Ratio Analysis of GTL
Financial ratio is the most important thing for a company to measure the performance of a
firm. It can be divided into five basic categories and those are liquidity, activity, debt,
profitability and market ratio. By using the liquidity, debt and activity ratio help to measure
the primary risk. Profitability ratio is using to measure the return but market ratio is using to
measure the both risk and return.
For the financial analysis need some necessary inputs for preparing the financial ratio which
help to measure the company’s performance. Here, we will use the 2013to 2016 income
statements and balance sheets for Greenland Technologies Limited (GTL) to present financial
performance analysis.
Last Four Years Financial Data Analysis of GTL
Particulars 2016 2015 2014 2013
Turnover 226,003,705 207,611,472 197,611,472 186,003,705
Gross profit 90,401,482 72,664,015 71,140,130 70,681,408
Profit before tax 25,021,621 24,414,652 19,286,206 18,657,152
Profit after tax 16,264,054 15,869,524 12,536,034 12,127,149
Shareholder’s Equity 38,350,721 25,776,917 28,932,862 26,012,834
Total Assets 191,753,603 171,846,114 206,663,298 216,773,613
Total Current Assets 187,679,516 166,016,946 192,519,976 198,822,768
Total current Liabilities 122,722,306 127,080,201 149,293,566 156,423,839
Total Liabilities 153,402,882 146,069,197 177,730,436 190,760,779
5.3.1 Liquidity Ratios
A firm ability to satisfy its short term obligations can be measured by the liquidity ratio and
the strength to meet the immediate obligations. The solvency of the firm’s overall financial
position can be referred by the liquidity ratio. It will refer the capability of pay its bill.
Because of a company insufficient liquidity may be forced to make a tough decision to meet
their obligation. It will work as indicator and help to lead for solving the cash flow problem.
There has a two basic measure of the liquidity and those are:
United International University Page 32
(i) Current ratio
(ii) Quick Ratio (Acid-Test ratio)
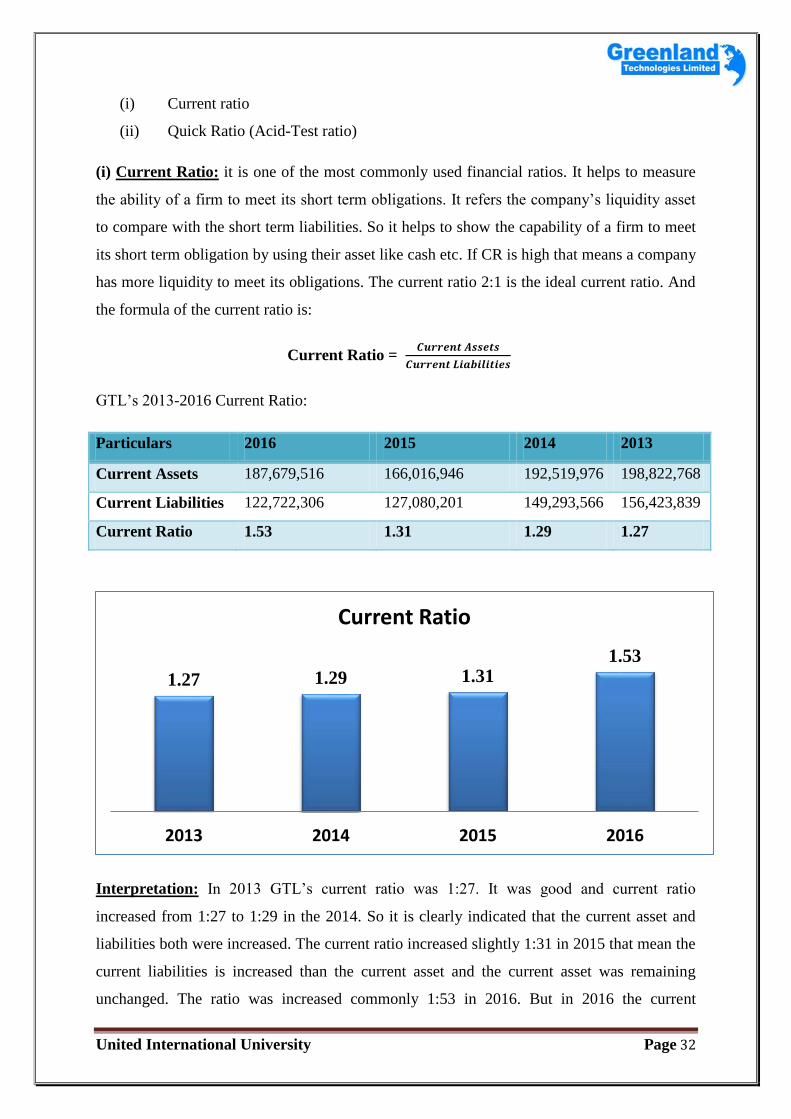
(i) Current Ratio: it is one of the most commonly used financial ratios. It helps to measure
the ability of a firm to meet its short term obligations. It refers the company’s liquidity asset
to compare with the short term liabilities. So it helps to show the capability of a firm to meet
its short term obligation by using their asset like cash etc. If CR is high that means a company
has more liquidity to meet its obligations. The current ratio 2:1 is the ideal current ratio. And
the formula of the current ratio is:
Current Ratio =
GTL’s 2013-2016 Current Ratio:
Particulars 2016 2015 2014 2013
Current Assets 187,679,516 166,016,946 192,519,976 198,822,768
Current Liabilities 122,722,306 127,080,201 149,293,566 156,423,839
Current Ratio 1.53 1.31 1.29 1.27
Interpretation: In 2013 GTL’s current ratio was 1:27. It was good and current ratio
increased from 1:27 to 1:29 in the 2014. So it is clearly indicated that the current asset and
liabilities both were increased. The current ratio increased slightly 1:31 in 2015 that mean the
current liabilities is increased than the current asset and the current asset was remaining
unchanged. The ratio was increased commonly 1:53 in 2016. But in 2016 the current
1.27 1.29 1.31 1.53
2013 2014 2015 2016
Current Ratio
United International University Page 33
liabilities was going down because of the reduction of short term debt and the accounts
payable. After the analysis of current ratio we can say that the GTL didn’t face any problems
to meet or fulfil their obligations.
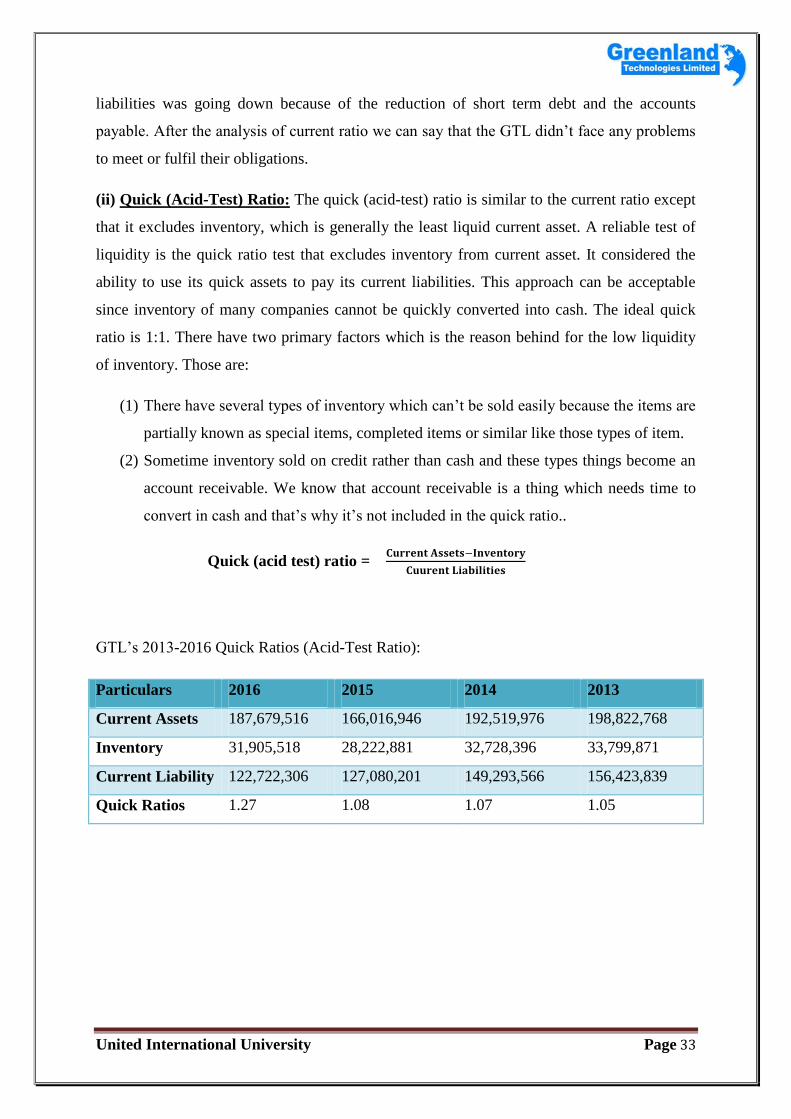
(ii) Quick (Acid-Test) Ratio: The quick (acid-test) ratio is similar to the current ratio except
that it excludes inventory, which is generally the least liquid current asset. A reliable test of
liquidity is the quick ratio test that excludes inventory from current asset. It considered the
ability to use its quick assets to pay its current liabilities. This approach can be acceptable
since inventory of many companies cannot be quickly converted into cash. The ideal quick
ratio is 1:1. There have two primary factors which is the reason behind for the low liquidity
of inventory. Those are:
(1) There have several types of inventory which can’t be sold easily because the items are
partially known as special items, completed items or similar like those types of item.
(2) Sometime inventory sold on credit rather than cash and these types things become an
account receivable. We know that account receivable is a thing which needs time to
convert in cash and that’s why it’s not included in the quick ratio..
Quick (acid test) ratio =
GTL’s 2013-2016 Quick Ratios (Acid-Test Ratio):
Particulars 2016 2015 2014 2013
Current Assets 187,679,516 166,016,946 192,519,976 198,822,768
Inventory 31,905,518 28,222,881 32,728,396 33,799,871
Current Liability 122,722,306 127,080,201 149,293,566 156,423,839
Quick Ratios 1.27 1.08 1.07 1.05
United International University Page 34
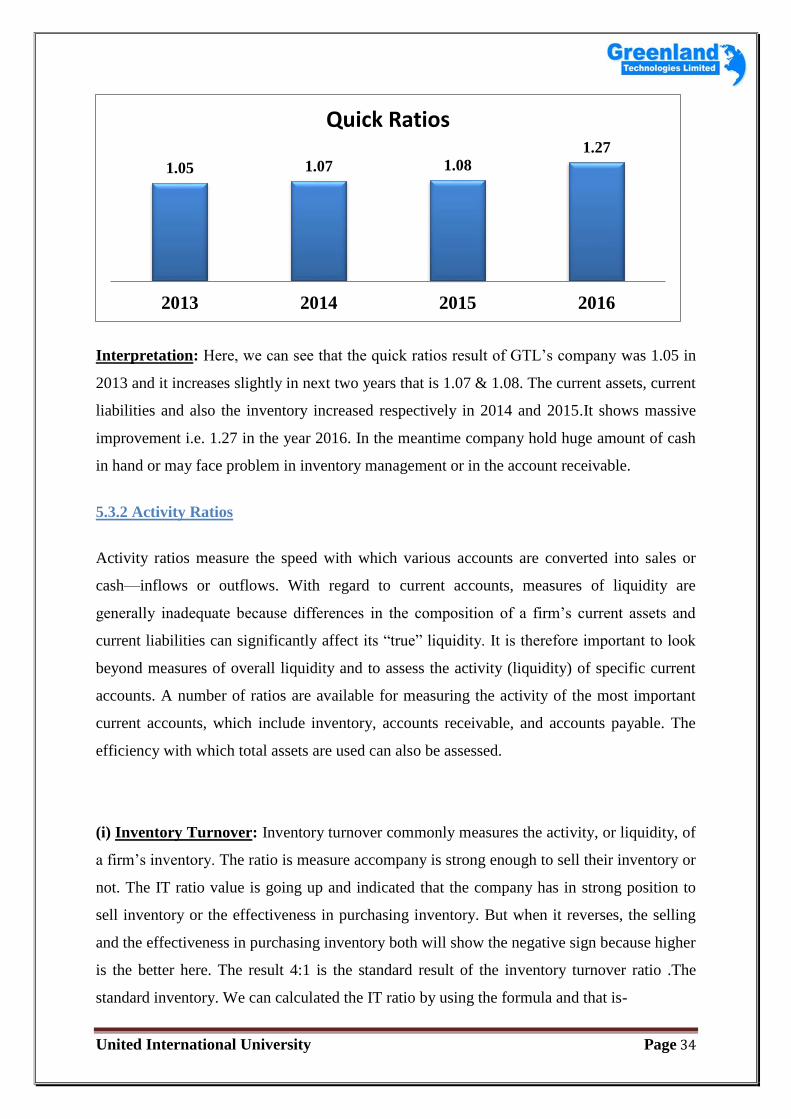
Interpretation: Here, we can see that the quick ratios result of GTL’s company was 1.05 in
2013 and it increases slightly in next two years that is 1.07 & 1.08. The current assets, current
liabilities and also the inventory increased respectively in 2014 and 2015.It shows massive
improvement i.e. 1.27 in the year 2016. In the meantime company hold huge amount of cash
in hand or may face problem in inventory management or in the account receivable.
5.3.2 Activity Ratios
Activity ratios measure the speed with which various accounts are converted into sales or
cash—inflows or outflows. With regard to current accounts, measures of liquidity are
generally inadequate because differences in the composition of a firm’s current assets and
current liabilities can significantly affect its ―true‖ liquidity. It is therefore important to look
beyond measures of overall liquidity and to assess the activity (liquidity) of specific current
accounts. A number of ratios are available for measuring the activity of the most important
current accounts, which include inventory, accounts receivable, and accounts payable. The
efficiency with which total assets are used can also be assessed.
(i) Inventory Turnover: Inventory turnover commonly measures the activity, or liquidity, of
a firm’s inventory. The ratio is measure accompany is strong enough to sell their inventory or
not. The IT ratio value is going up and indicated that the company has in strong position to
sell inventory or the effectiveness in purchasing inventory. But when it reverses, the selling
and the effectiveness in purchasing inventory both will show the negative sign because higher
is the better here. The result 4:1 is the standard result of the inventory turnover ratio .The
standard inventory. We can calculated the IT ratio by using the formula and that is-
1.05 1.07 1.08 1.27
2013 2014 2015 2016
Quick Ratios
United International University Page 35
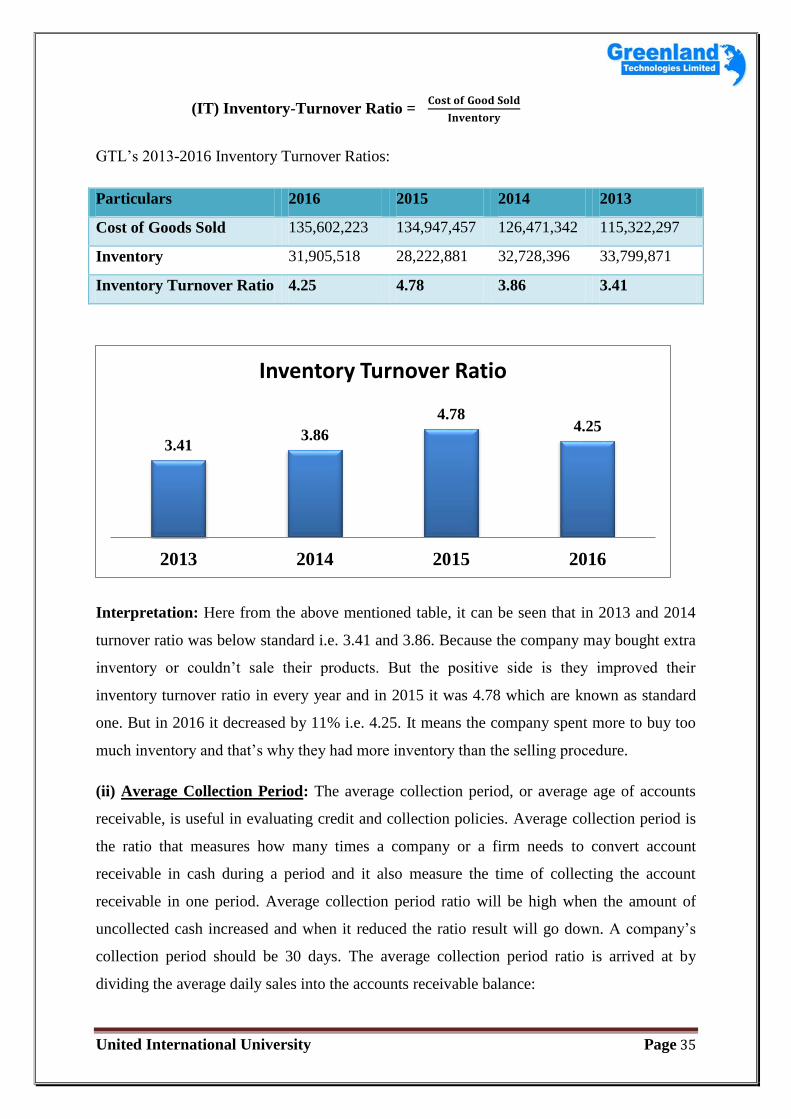
(IT) Inventory-Turnover Ratio =
GTL’s 2013-2016 Inventory Turnover Ratios:
Particulars 2016 2015 2014 2013
Cost of Goods Sold 135,602,223 134,947,457 126,471,342 115,322,297
Inventory 31,905,518 28,222,881 32,728,396 33,799,871
Inventory Turnover Ratio 4.25 4.78 3.86 3.41
Interpretation: Here from the above mentioned table, it can be seen that in 2013 and 2014
turnover ratio was below standard i.e. 3.41 and 3.86. Because the company may bought extra
inventory or couldn’t sale their products. But the positive side is they improved their
inventory turnover ratio in every year and in 2015 it was 4.78 which are known as standard
one. But in 2016 it decreased by 11% i.e. 4.25. It means the company spent more to buy too
much inventory and that’s why they had more inventory than the selling procedure.
(ii) Average Collection Period: The average collection period, or average age of accounts
receivable, is useful in evaluating credit and collection policies. Average collection period is
the ratio that measures how many times a company or a firm needs to convert account
receivable in cash during a period and it also measure the time of collecting the account
receivable in one period. Average collection period ratio will be high when the amount of
uncollected cash increased and when it reduced the ratio result will go down. A company’s
collection period should be 30 days. The average collection period ratio is arrived at by
dividing the average daily sales into the accounts receivable balance:
3.41 3.86
4.78 4.25
2013 2014 2015 2016
Inventory Turnover Ratio
United International University Page 36
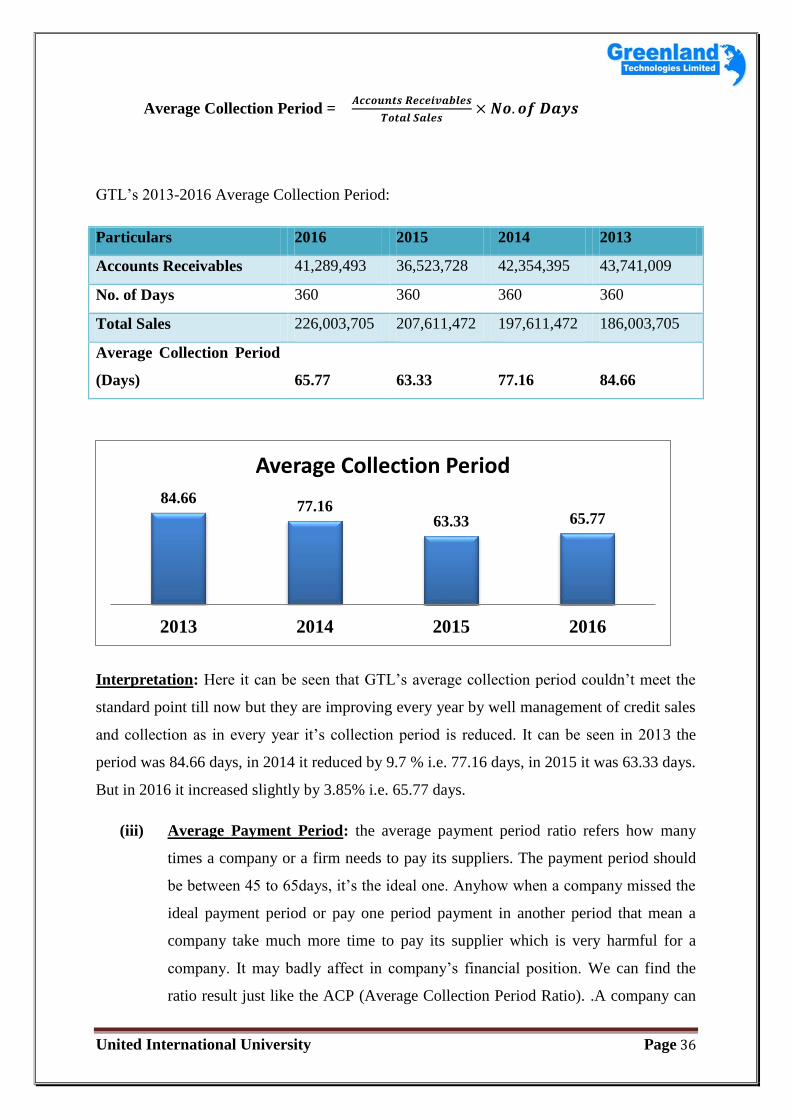
Average Collection Period =
GTL’s 2013-2016 Average Collection Period:
Particulars 2016 2015 2014 2013
Accounts Receivables 41,289,493 36,523,728 42,354,395 43,741,009
No. of Days 360 360 360 360
Total Sales 226,003,705 207,611,472 197,611,472 186,003,705
Average Collection Period
(Days) 65.77 63.33 77.16 84.66
Interpretation: Here it can be seen that GTL’s average collection period couldn’t meet the
standard point till now but they are improving every year by well management of credit sales
and collection as in every year it’s collection period is reduced. It can be seen in 2013 the
period was 84.66 days, in 2014 it reduced by 9.7 % i.e. 77.16 days, in 2015 it was 63.33 days.
But in 2016 it increased slightly by 3.85% i.e. 65.77 days.
(iii) Average Payment Period: the average payment period ratio refers how many
times a company or a firm needs to pay its suppliers. The payment period should
be between 45 to 65days, it’s the ideal one. Anyhow when a company missed the
ideal payment period or pay one period payment in another period that mean a
company take much more time to pay its supplier which is very harmful for a
company. It may badly affect in company’s financial position. We can find the
ratio result just like the ACP (Average Collection Period Ratio). .A company can
84.66 77.16
63.33 65.77
2013 2014 2015 2016
Average Collection Period
United International University Page 37
find the APP ratio by divided accounts payable with the annual purchase and then
multiply it with no of day and the formula is given below-
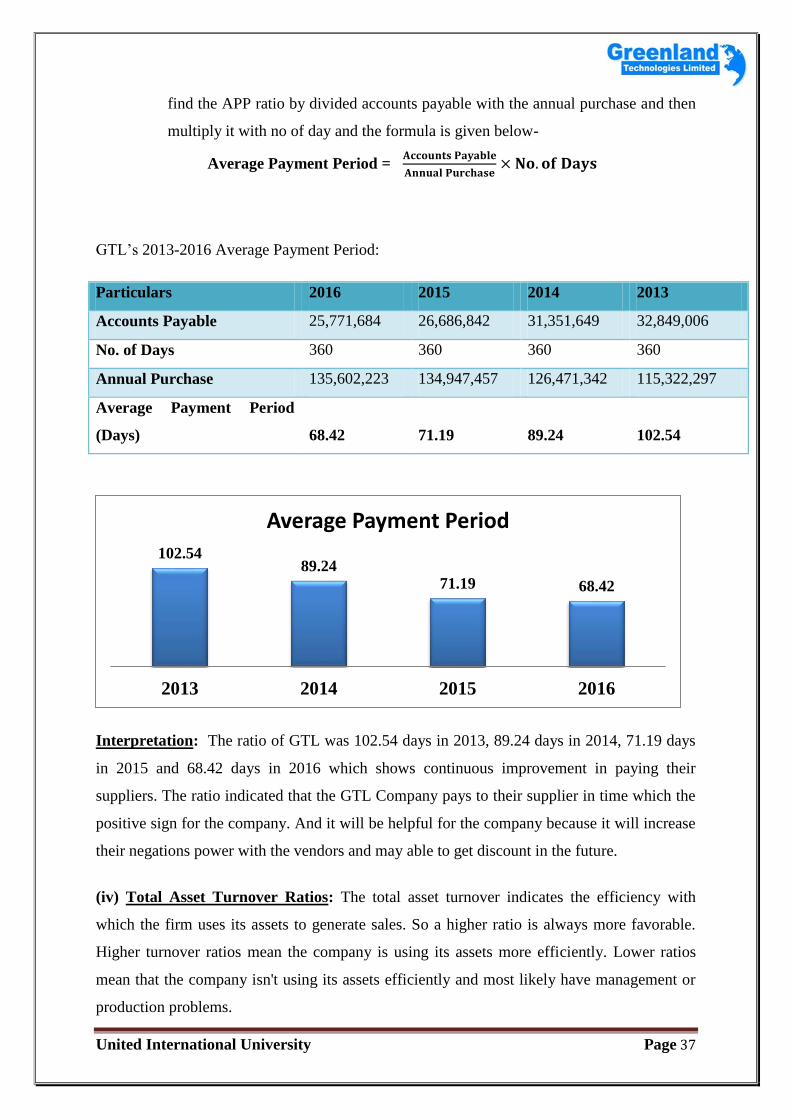
Average Payment Period =
GTL’s 2013-2016 Average Payment Period:
Particulars 2016 2015 2014 2013
Accounts Payable 25,771,684 26,686,842 31,351,649 32,849,006
No. of Days 360 360 360 360
Annual Purchase 135,602,223 134,947,457 126,471,342 115,322,297
Average Payment Period
(Days) 68.42 71.19 89.24 102.54
Interpretation: The ratio of GTL was 102.54 days in 2013, 89.24 days in 2014, 71.19 days
in 2015 and 68.42 days in 2016 which shows continuous improvement in paying their
suppliers. The ratio indicated that the GTL Company pays to their supplier in time which the
positive sign for the company. And it will be helpful for the company because it will increase
their negations power with the vendors and may able to get discount in the future.
(iv) Total Asset Turnover Ratios: The total asset turnover indicates the efficiency with
which the firm uses its assets to generate sales. So a higher ratio is always more favorable.
Higher turnover ratios mean the company is using its assets more efficiently. Lower ratios
mean that the company isn't using its assets efficiently and most likely have management or
production problems.
102.54 89.24
71.19 68.42
2013 2014 2015 2016
Average Payment Period
United International University Page 38
For instance, a ratio of 1 means, the net sales of a company equals the average total assets for
the year. In other words, the company is generating 1 dollar of sales for every dollar invested
in assets.
Total asset turnover is calculated as follows:
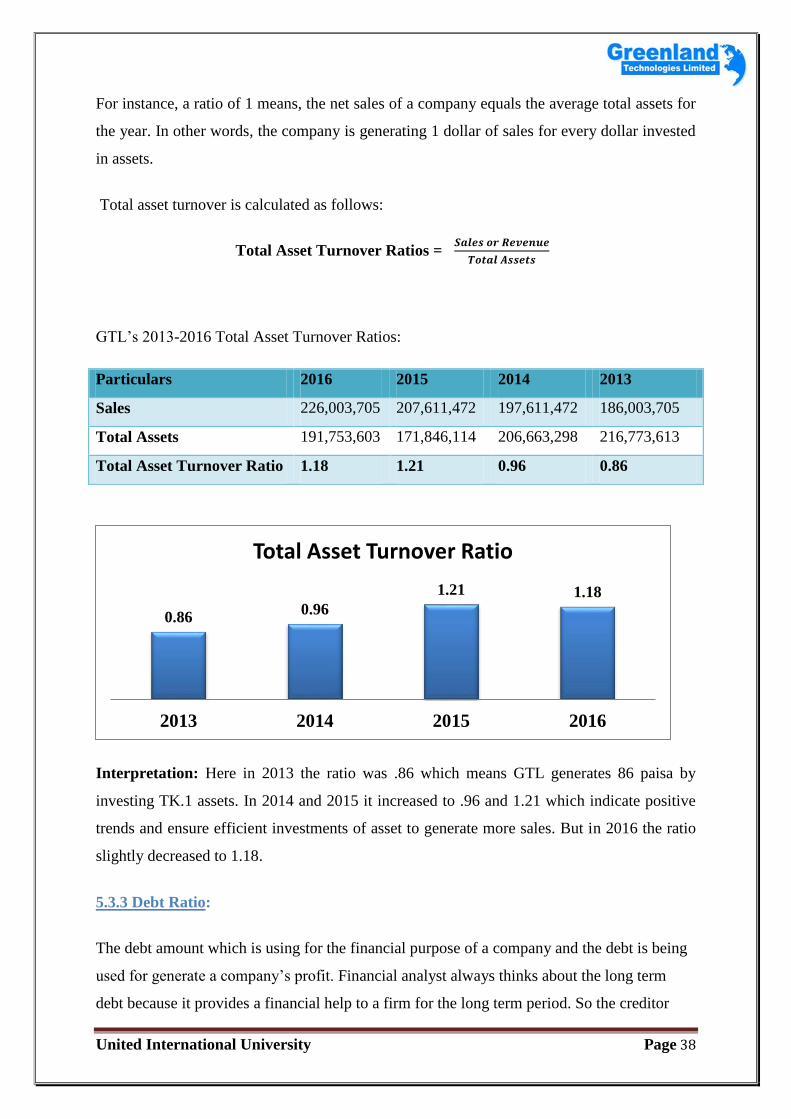
Total Asset Turnover Ratios =
GTL’s 2013-2016 Total Asset Turnover Ratios:
Particulars 2016 2015 2014 2013
Sales 226,003,705 207,611,472 197,611,472 186,003,705
Total Assets 191,753,603 171,846,114 206,663,298 216,773,613
Total Asset Turnover Ratio 1.18 1.21 0.96 0.86
Interpretation: Here in 2013 the ratio was .86 which means GTL generates 86 paisa by
investing TK.1 assets. In 2014 and 2015 it increased to .96 and 1.21 which indicate positive
trends and ensure efficient investments of asset to generate more sales. But in 2016 the ratio
slightly decreased to 1.18.
5.3.3 Debt Ratio:
The debt amount which is using for the financial purpose of a company and the debt is being
used for generate a company’s profit. Financial analyst always thinks about the long term
debt because it provides a financial help to a firm for the long term period. So the creditor
0.86 0.96
1.21 1.18
2013 2014 2015 2016
Total Asset Turnover Ratio
United International University Page 39
claim must be given before distributing the earning profit to the shareholders or owners. The
new shareholder and the future shareholders also concern and give attention to know the
ability of the firm to repay its debt. Not only the shareholders but also the lenders are
concerned about the firm’s debt percentage. That’s why management should be concerned
about the indebtedness of the firm.
The financial leverage will be high of a firm when a firm uses more to increase its total asset
of the firm. The financial leverage is the appreciation of risk and return and it is known as a
preferred stock and debt which is using for the fixed cost financing. The risk and return will
be high when a firm uses more fixed cost debt.
There are two general types of debt measures, one is measures of the degree of
indebtedness and another one is measures of the ability to service debts. The degree of
indebtedness measures the amount of debt relative to other significant balance sheet amounts.
A popular measure of the degree of indebtedness is the debt ratio. The second type of debt
measure, the ability to service debts, reflects a firm’s ability to make the payments required
on a scheduled basis over the life of a debt. The firm’s ability to pay certain fixed charges is
measured using coverage ratios. Typically, higher coverage ratios are preferred, but too high
a ratio (above industry norms) may result in unnecessarily low risk and return. In general, the
lower the firm’s coverage ratios, the less certain it is to be able to pay fixed obligations. If a
firm is unable to pay these obligations, its creditors may seek immediate repayment, which in
most instances would force a firm into bankruptcy. Two popular coverage ratios are the times
interest earned ratio and the fixed payment coverage ratio.
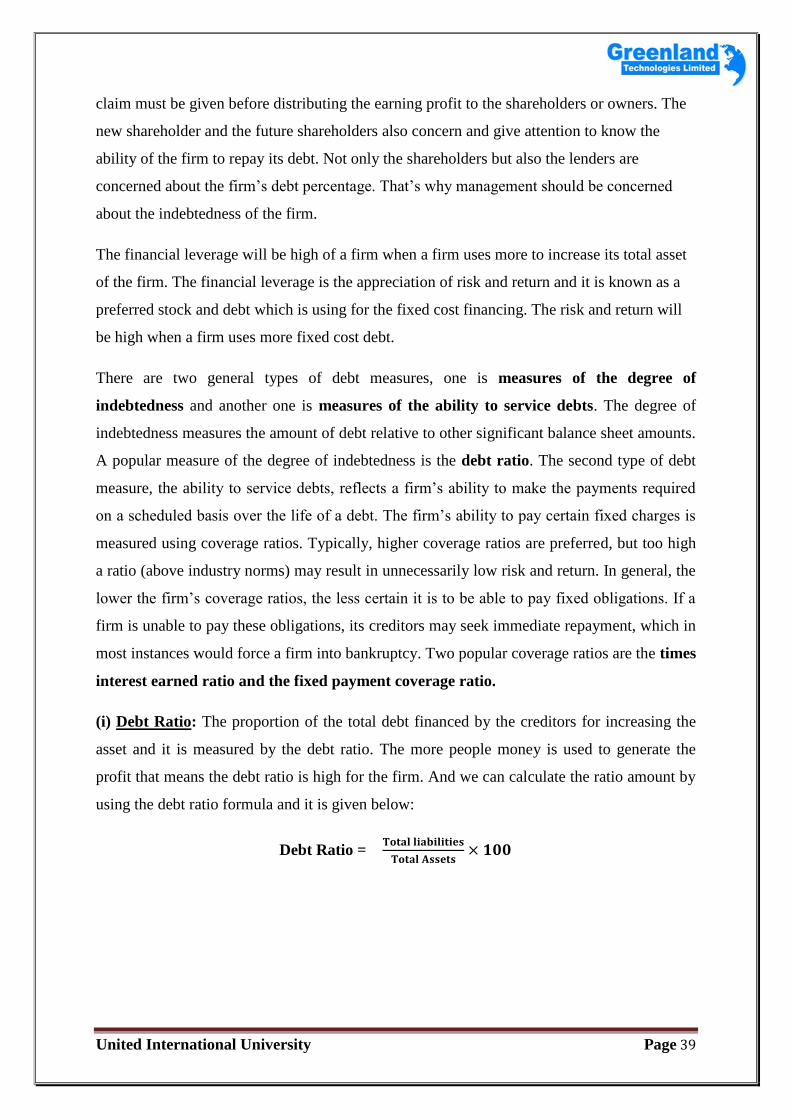
(i) Debt Ratio: The proportion of the total debt financed by the creditors for increasing the
asset and it is measured by the debt ratio. The more people money is used to generate the
profit that means the debt ratio is high for the firm. And we can calculate the ratio amount by
using the debt ratio formula and it is given below:
Debt Ratio =
United International University Page 40
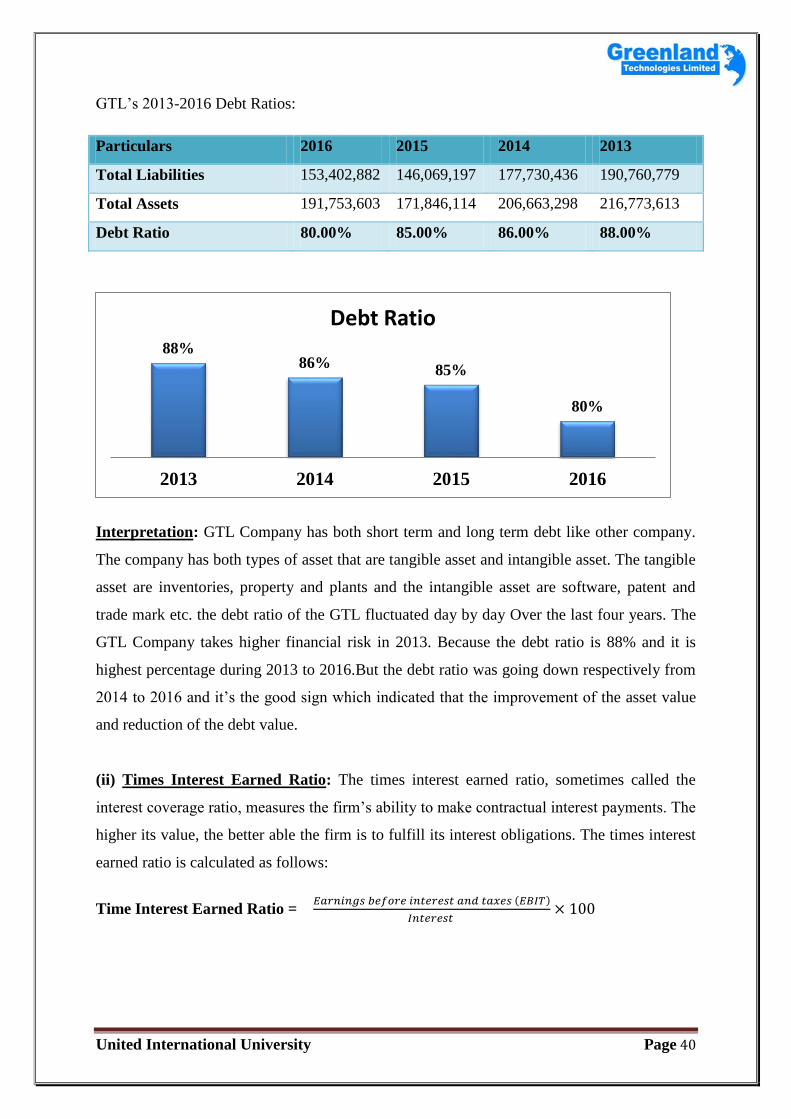
GTL’s 2013-2016 Debt Ratios:
Particulars 2016 2015 2014 2013
Total Liabilities 153,402,882 146,069,197 177,730,436 190,760,779
Total Assets 191,753,603 171,846,114 206,663,298 216,773,613
Debt Ratio 80.00% 85.00% 86.00% 88.00%
Interpretation: GTL Company has both short term and long term debt like other company.
The company has both types of asset that are tangible asset and intangible asset. The tangible
asset are inventories, property and plants and the intangible asset are software, patent and
trade mark etc. the debt ratio of the GTL fluctuated day by day Over the last four years. The
GTL Company takes higher financial risk in 2013. Because the debt ratio is 88% and it is
highest percentage during 2013 to 2016.But the debt ratio was going down respectively from
2014 to 2016 and it’s the good sign which indicated that the improvement of the asset value
and reduction of the debt value.
(ii) Times Interest Earned Ratio: The times interest earned ratio, sometimes called the
interest coverage ratio, measures the firm’s ability to make contractual interest payments. The
higher its value, the better able the firm is to fulfill its interest obligations. The times interest
earned ratio is calculated as follows:
Time Interest Earned Ratio = ( )
88% 86%
85%
80%
2013 2014 2015 2016
Debt Ratio
United International University Page 41
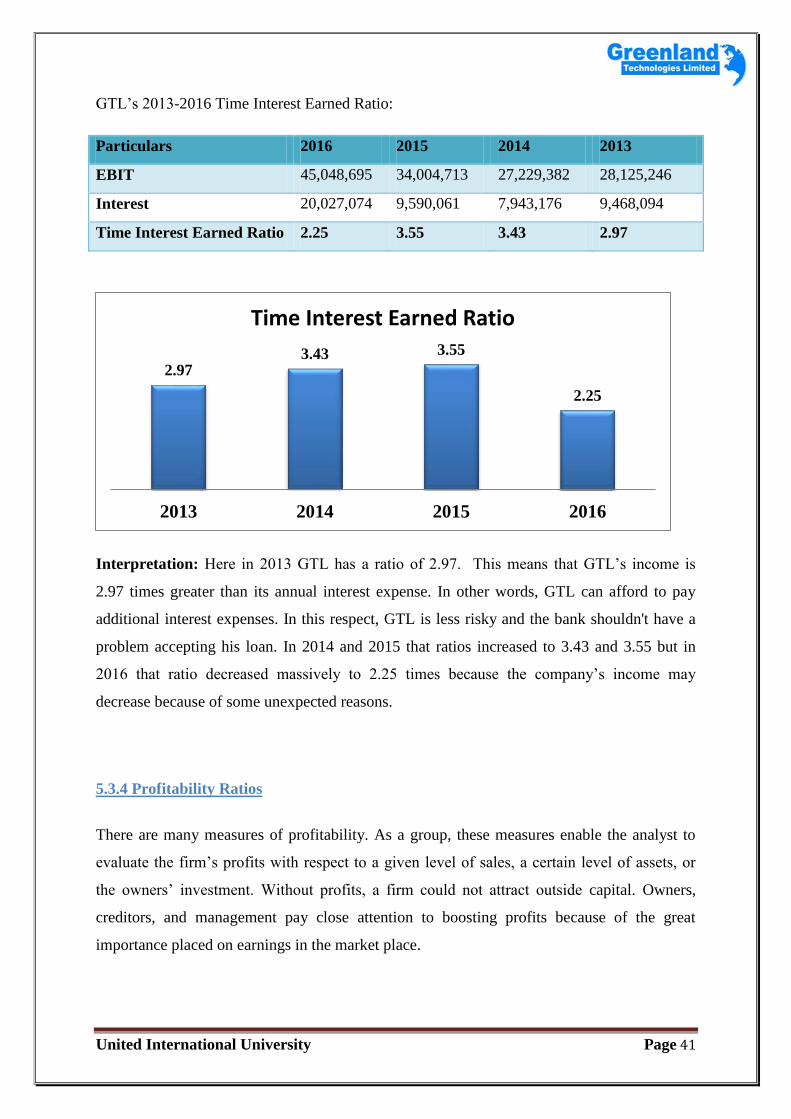
GTL’s 2013-2016 Time Interest Earned Ratio:
Particulars 2016 2015 2014 2013
EBIT 45,048,695 34,004,713 27,229,382 28,125,246
Interest 20,027,074 9,590,061 7,943,176 9,468,094
Time Interest Earned Ratio 2.25 3.55 3.43 2.97
Interpretation: Here in 2013 GTL has a ratio of 2.97. This means that GTL’s income is
2.97 times greater than its annual interest expense. In other words, GTL can afford to pay
additional interest expenses. In this respect, GTL is less risky and the bank shouldn't have a
problem accepting his loan. In 2014 and 2015 that ratios increased to 3.43 and 3.55 but in
2016 that ratio decreased massively to 2.25 times because the company’s income may
decrease because of some unexpected reasons.
5.3.4 Profitability Ratios
There are many measures of profitability. As a group, these measures enable the analyst to
evaluate the firm’s profits with respect to a given level of sales, a certain level of assets, or
the owners’ investment. Without profits, a firm could not attract outside capital. Owners,
creditors, and management pay close attention to boosting profits because of the great
importance placed on earnings in the market place.
2.97 3.43 3.55
2.25
2013 2014 2015 2016
Time Interest Earned Ratio
United International University Page 42
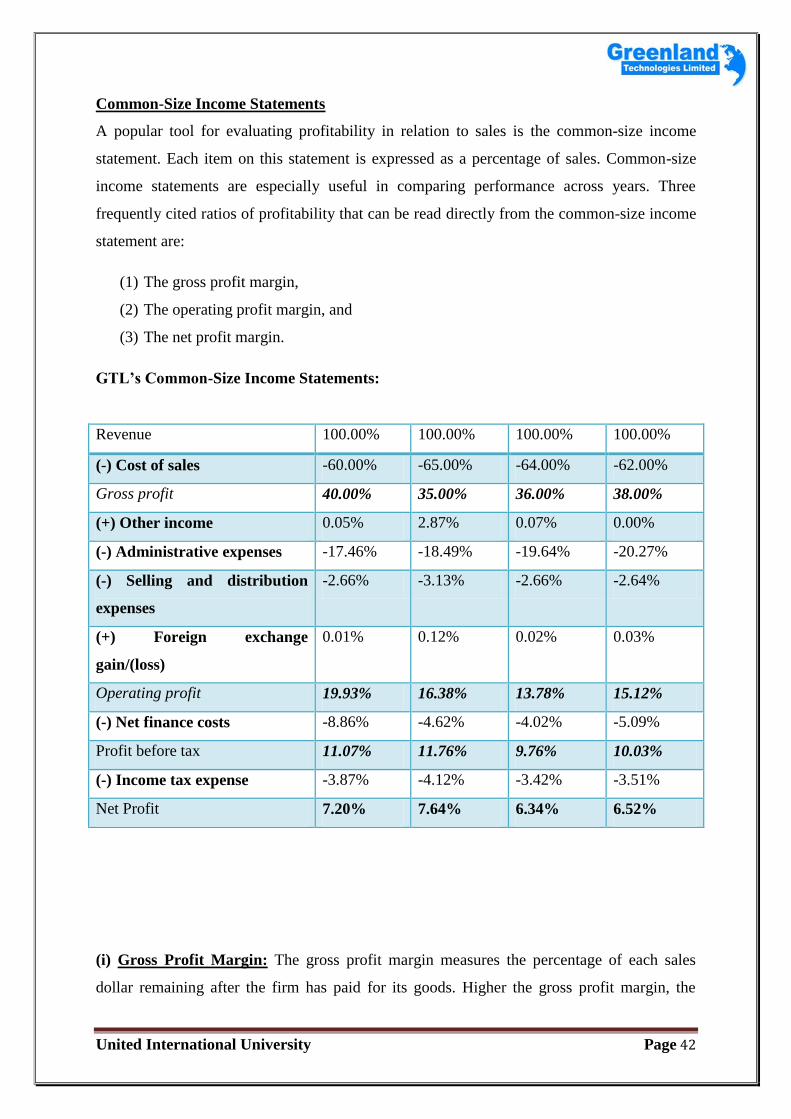
Common-Size Income Statements
A popular tool for evaluating profitability in relation to sales is the common-size income
statement. Each item on this statement is expressed as a percentage of sales. Common-size
income statements are especially useful in comparing performance across years. Three
frequently cited ratios of profitability that can be read directly from the common-size income
statement are:
(1) The gross profit margin,
(2) The operating profit margin, and
(3) The net profit margin.
GTL’s Common-Size Income Statements:
Revenue 100.00% 100.00% 100.00% 100.00%
(-) Cost of sales -60.00% -65.00% -64.00% -62.00%
Gross profit 40.00% 35.00% 36.00% 38.00%
(+) Other income 0.05% 2.87% 0.07% 0.00%
(-) Administrative expenses -17.46% -18.49% -19.64% -20.27%
(-) Selling and distribution
expenses
-2.66% -3.13% -2.66% -2.64%
(+) Foreign exchange
gain/(loss)
0.01% 0.12% 0.02% 0.03%
Operating profit 19.93% 16.38% 13.78% 15.12%
(-) Net finance costs -8.86% -4.62% -4.02% -5.09%
Profit before tax 11.07% 11.76% 9.76% 10.03%
(-) Income tax expense -3.87% -4.12% -3.42% -3.51%
Net Profit 7.20% 7.64% 6.34% 6.52%
(i) Gross Profit Margin: The gross profit margin measures the percentage of each sales
dollar remaining after the firm has paid for its goods. Higher the gross profit margin, the
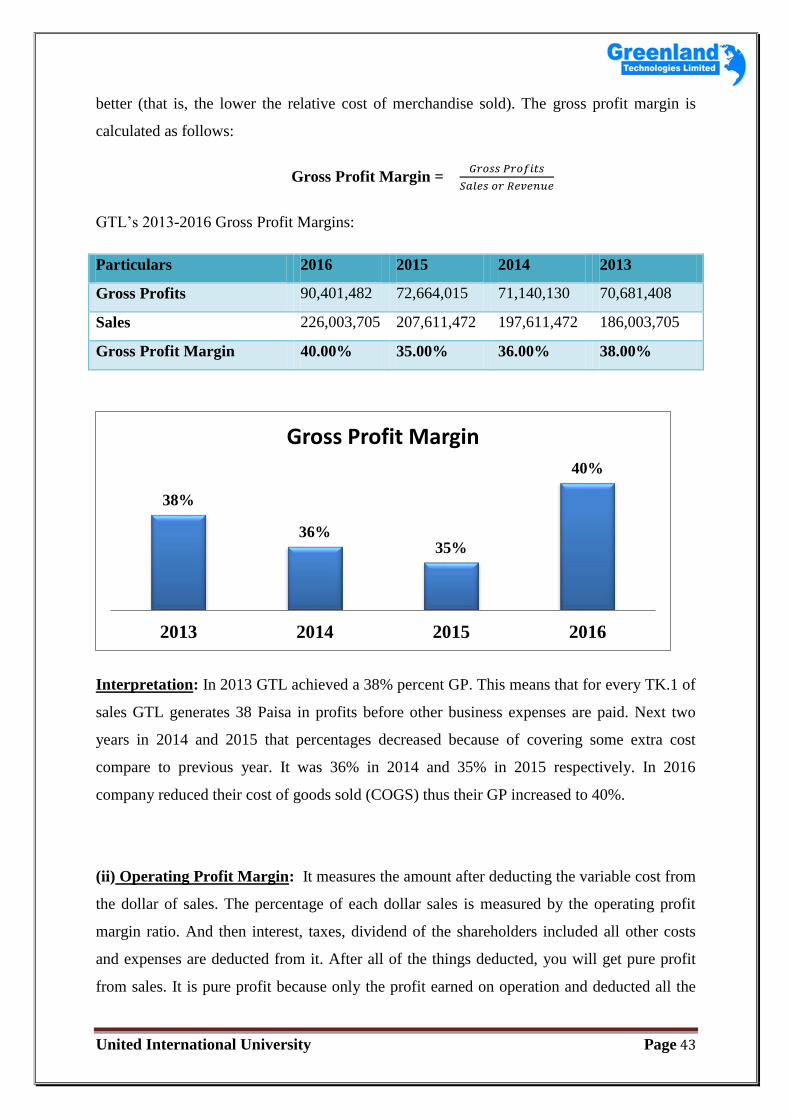
United International University Page 43
better (that is, the lower the relative cost of merchandise sold). The gross profit margin is
calculated as follows:
Gross Profit Margin =
GTL’s 2013-2016 Gross Profit Margins:
Particulars 2016 2015 2014 2013
Gross Profits 90,401,482 72,664,015 71,140,130 70,681,408
Sales 226,003,705 207,611,472 197,611,472 186,003,705
Gross Profit Margin 40.00% 35.00% 36.00% 38.00%
Interpretation: In 2013 GTL achieved a 38% percent GP. This means that for every TK.1 of
sales GTL generates 38 Paisa in profits before other business expenses are paid. Next two
years in 2014 and 2015 that percentages decreased because of covering some extra cost
compare to previous year. It was 36% in 2014 and 35% in 2015 respectively. In 2016
company reduced their cost of goods sold (COGS) thus their GP increased to 40%.
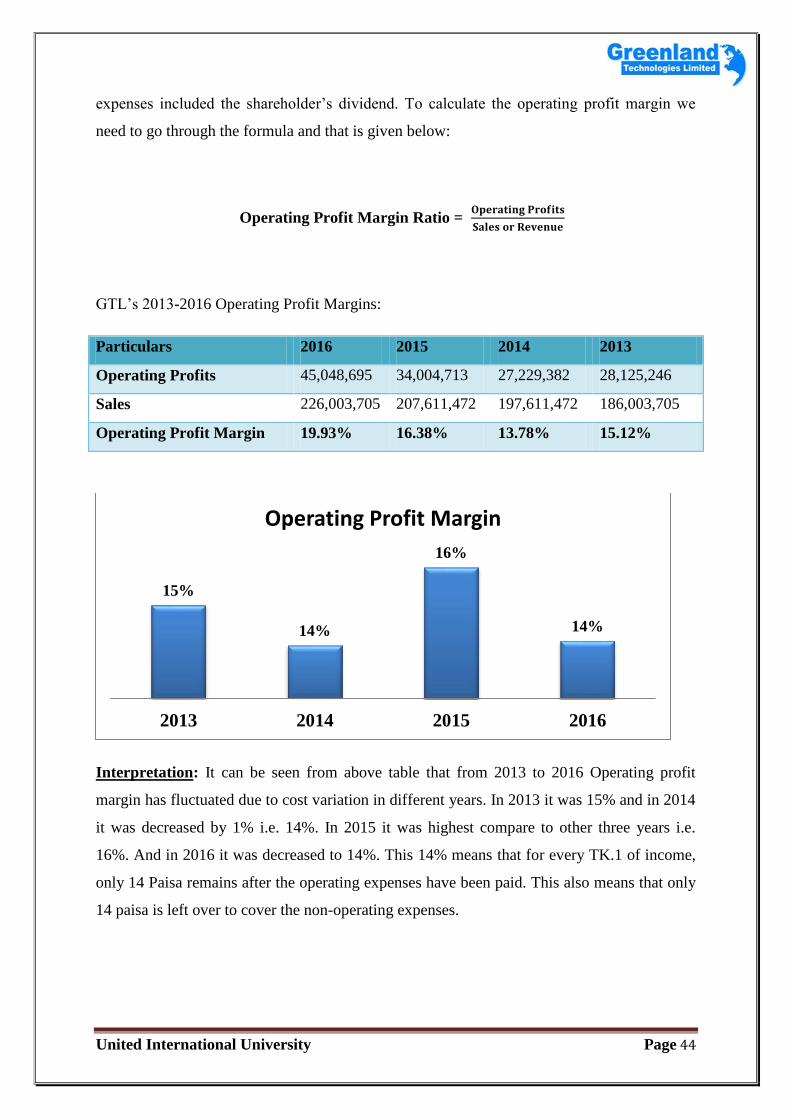
(ii) Operating Profit Margin: It measures the amount after deducting the variable cost from
the dollar of sales. The percentage of each dollar sales is measured by the operating profit
margin ratio. And then interest, taxes, dividend of the shareholders included all other costs
and expenses are deducted from it. After all of the things deducted, you will get pure profit
from sales. It is pure profit because only the profit earned on operation and deducted all the
38%
36% 35%
40%
2013 2014 2015 2016
Gross Profit Margin
United International University Page 44
expenses included the shareholder’s dividend. To calculate the operating profit margin we
need to go through the formula and that is given below:
Operating Profit Margin Ratio =
GTL’s 2013-2016 Operating Profit Margins:
Particulars 2016 2015 2014 2013
Operating Profits 45,048,695 34,004,713 27,229,382 28,125,246
Sales 226,003,705 207,611,472 197,611,472 186,003,705
Operating Profit Margin 19.93% 16.38% 13.78% 15.12%
Interpretation: It can be seen from above table that from 2013 to 2016 Operating profit
margin has fluctuated due to cost variation in different years. In 2013 it was 15% and in 2014
it was decreased by 1% i.e. 14%. In 2015 it was highest compare to other three years i.e.
16%. And in 2016 it was decreased to 14%. This 14% means that for every TK.1 of income,
only 14 Paisa remains after the operating expenses have been paid. This also means that only
14 paisa is left over to cover the non-operating expenses.
15%
14%
16%
14%
2013 2014 2015 2016
Operating Profit Margin
United International University Page 45
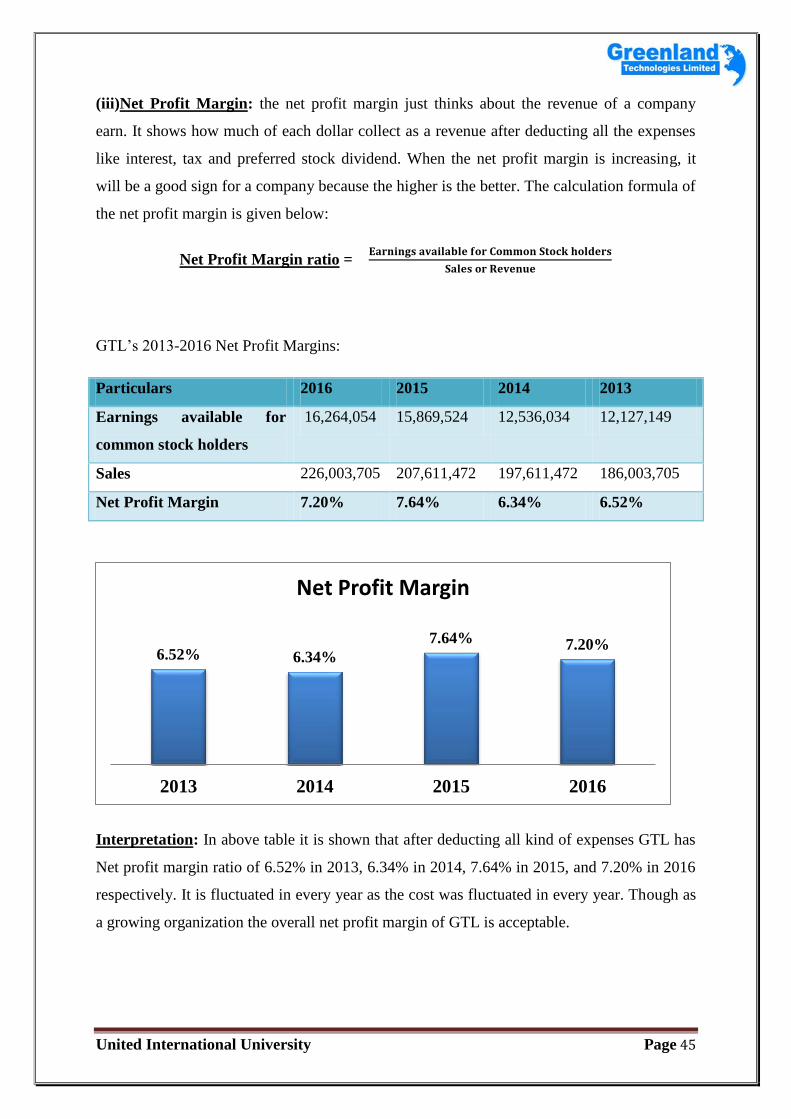
(iii)Net Profit Margin: the net profit margin just thinks about the revenue of a company
earn. It shows how much of each dollar collect as a revenue after deducting all the expenses
like interest, tax and preferred stock dividend. When the net profit margin is increasing, it
will be a good sign for a company because the higher is the better. The calculation formula of
the net profit margin is given below:
Net Profit Margin ratio =
GTL’s 2013-2016 Net Profit Margins:
Particulars 2016 2015 2014 2013
Earnings available for
common stock holders
16,264,054 15,869,524 12,536,034 12,127,149
Sales 226,003,705 207,611,472 197,611,472 186,003,705
Net Profit Margin 7.20% 7.64% 6.34% 6.52%
Interpretation: In above table it is shown that after deducting all kind of expenses GTL has
Net profit margin ratio of 6.52% in 2013, 6.34% in 2014, 7.64% in 2015, and 7.20% in 2016
respectively. It is fluctuated in every year as the cost was fluctuated in every year. Though as
a growing organization the overall net profit margin of GTL is acceptable.
6.52% 6.34%
7.64% 7.20%
2013 2014 2015 2016
Net Profit Margin
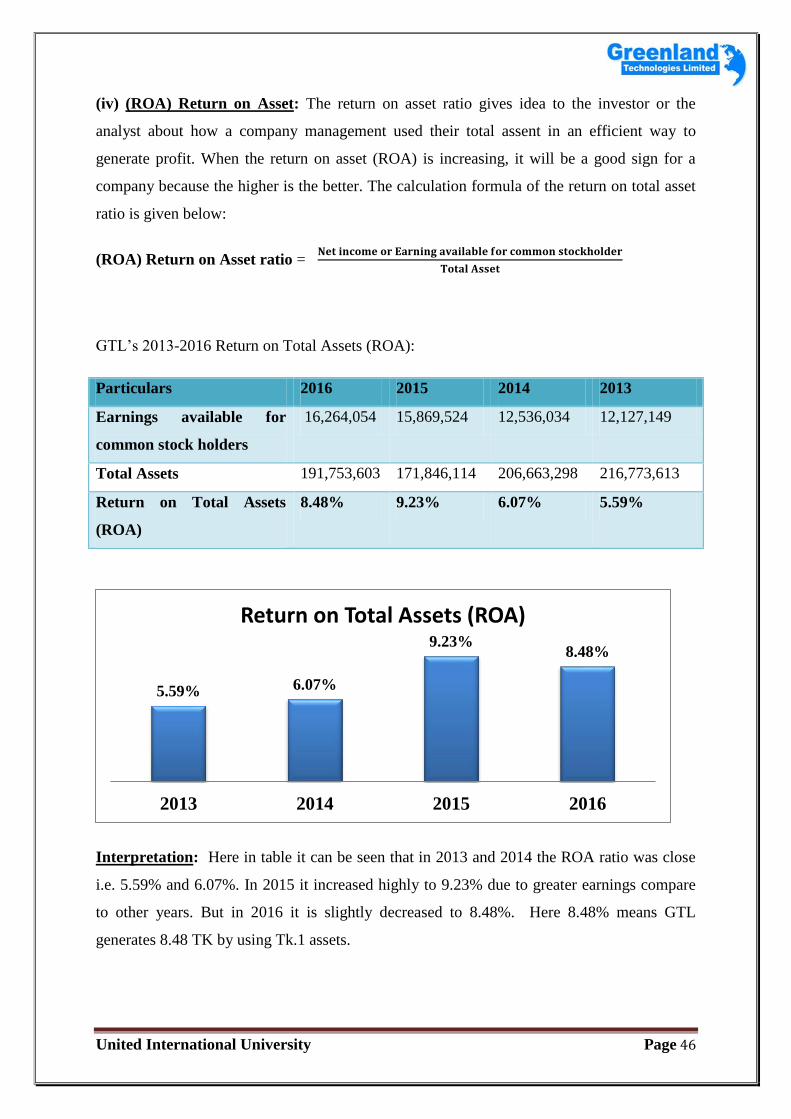
United International University Page 46
(iv) (ROA) Return on Asset: The return on asset ratio gives idea to the investor or the
analyst about how a company management used their total assent in an efficient way to
generate profit. When the return on asset (ROA) is increasing, it will be a good sign for a
company because the higher is the better. The calculation formula of the return on total asset
ratio is given below:
(ROA) Return on Asset ratio =
GTL’s 2013-2016 Return on Total Assets (ROA):
Particulars 2016 2015 2014 2013
Earnings available for
common stock holders
16,264,054 15,869,524 12,536,034 12,127,149
Total Assets 191,753,603 171,846,114 206,663,298 216,773,613
Return on Total Assets
(ROA)
8.48% 9.23% 6.07% 5.59%
Interpretation: Here in table it can be seen that in 2013 and 2014 the ROA ratio was close
i.e. 5.59% and 6.07%. In 2015 it increased highly to 9.23% due to greater earnings compare
to other years. But in 2016 it is slightly decreased to 8.48%. Here 8.48% means GTL
generates 8.48 TK by using Tk.1 assets.
5.59% 6.07%
9.23% 8.48%
2013 2014 2015 2016
Return on Total Assets (ROA)
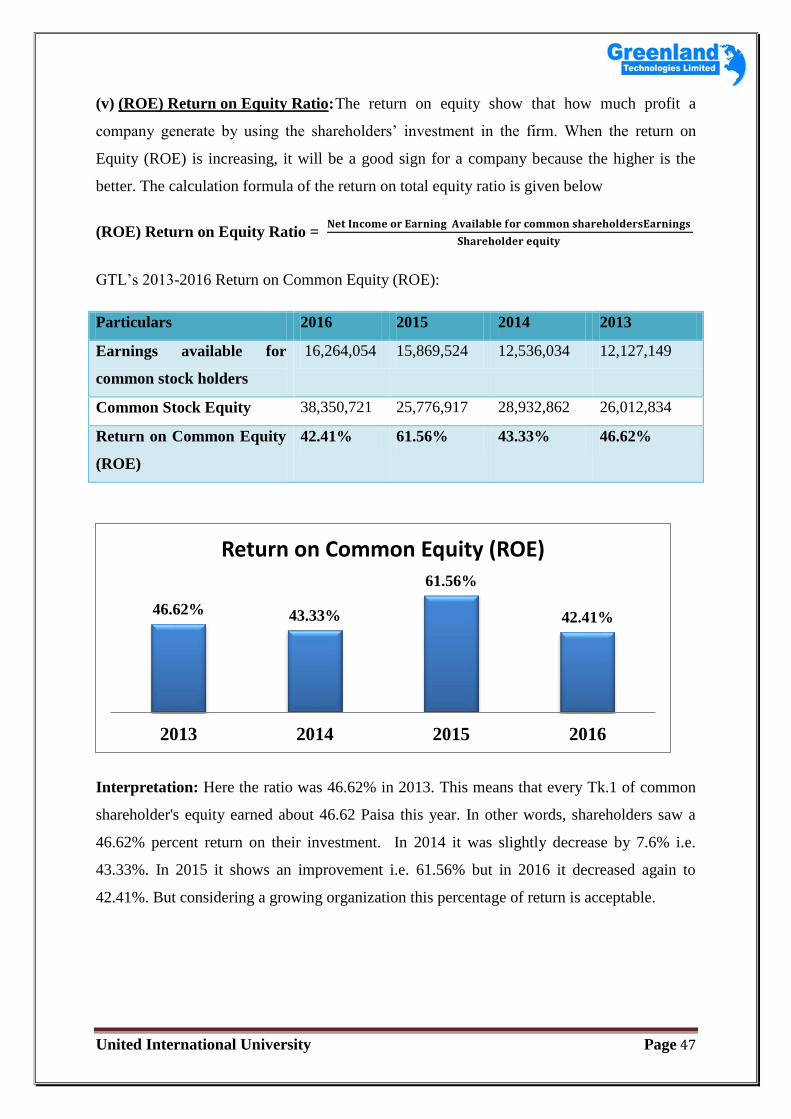
United International University Page 47
(v) (ROE) Return on Equity Ratio: The return on equity show that how much profit a
company generate by using the shareholders’ investment in the firm. When the return on
Equity (ROE) is increasing, it will be a good sign for a company because the higher is the
better. The calculation formula of the return on total equity ratio is given below
(ROE) Return on Equity Ratio =
GTL’s 2013-2016 Return on Common Equity (ROE):
Particulars 2016 2015 2014 2013
Earnings available for
common stock holders
16,264,054 15,869,524 12,536,034 12,127,149
Common Stock Equity 38,350,721 25,776,917 28,932,862 26,012,834
Return on Common Equity
(ROE)
42.41% 61.56% 43.33% 46.62%
Interpretation: Here the ratio was 46.62% in 2013. This means that every Tk.1 of common
shareholder's equity earned about 46.62 Paisa this year. In other words, shareholders saw a
46.62% percent return on their investment. In 2014 it was slightly decrease by 7.6% i.e.
43.33%. In 2015 it shows an improvement i.e. 61.56% but in 2016 it decreased again to
42.41%. But considering a growing organization this percentage of return is acceptable.
46.62% 43.33%
61.56%
42.41%
2013 2014 2015 2016
Return on Common Equity (ROE)
United International University Page 48
Ch-06: Findings
United International University Page 49
There has a lot of ratio but few of them are most important for the company and those are
current ratio, quick ratio, ROA, ROE, inventory turnover and the debt equity ratio. This is the
key ratio of the company. That does not mean other ratios are less important because it also
measure the performance of a company. All the positive and negative finding can be
observed based on the financial performance analysis. Overall finding that we observed from
above ratio analysis of GTL are stated below:
Liquidity:
1. Current ratio couldn’t meet the standard (2:1) but its improving every year. And
lower current ratio doesn’t mean negative all the time. It may prove positive sign. It
depends on organization structure.
2. Quick Ratio meets the standards (1:1). So Company is able to cover current liabilities
by current assets.
Activity Ratios:
1. Inventory Turnover ratio meets the standards in 2016 & 2015. Though it was below
standards in 2014 & 2013. But we can see its improving.
2. Average Collection Period ratio doesn’t meet the standards. This is not desirable.
But every year it’s improving slightly.
3. Average Payment Period ratio is almost close to the standards. Though it was bad in
the beginning. But in 2016 it was close enough to the standards.
4. Total Assets Turnover ratio is good as it is generating more sales than invested
amount of assets.
Debt Ratios:
1. Debt Ratio is not good.
2. Time Interest Earned Ratio is acceptable but it should be improved.
Profitability Ratio:
1. Gross Profit Margin shows increasing trend in last year. It is good.
2. Operating Profit Margin shows fluctuated value. But it can be accepted as every
year it was positive.
3. Net Profit Margin shows increasing trends, which is desirable. Though last year it
was slightly decreased.
United International University Page 50
4. Return on Total Assets shows increasing trends, which is desirable. But in the last
year it was slightly decreased.
5. Return on Common Equity shows fluctuated values but it was positive.
Others:
1. The company should not flexible about the installment payment of agricultural
product.
2. Don’t invest in advertise on the people of the importance of agricultural product.
3. They didn’t give any chance if they missed three installment periods.
United International University Page 51
Ch-07: Recommendations
Though GTL is in profitable situation but they need to concentrate to increase the Net
Profit Ratio and Return on Asset Ratio.
The consistency of the financial department performance should be stable and higher
which will help to get the maximum return for the company. GTL need to organize
the training program with seminar, workshop etc. It will increase the ability of an
employee and motivate them to find a better solution for better outcome.
They must repose or keep the liquidity asset and it can be easily converted into the
cash and security cash which help to face the unpredicted situation. It will help them
to come out from the bad condition without selling any inventory or asset.
They should give the attention in the inventory management system. Because there
has chance to increase the quick ratio from its ideal position (1:1) and it will not be
good for the company. They can face problem when they produce more inventory but
unable to sell and if they produce less than they will unable satisfy the market or
customer demand and customer switching risk will arise. That’s why GTL Company
needs to give focus on inventory management system to avoid the risk or loss.
GTL should give the importance one of the most important parts of current asset. And
it is that they must monitor the borrower’s collection period.
A well training should be given to the finance department to operate the IMAS
(Integrated Management Accounting System) software.
None can earn profit or increasing the total net income without the proper using of the
asset. So the GTL must need to handle the assets properly to earn the maximum return
from investment.
Bring new types technological product and that will be helpful for the agricultural
sector
They always need to examine, how to reduce the expense without losing the product
quality.
Teach the farmer about the importance of new technological product which will
increase the GTL customer and also it will give positive impact on agricultural
economic sector.
United International University Page 52
GTL Company needs to use their money in another sector which will help to
propagate or raise the more revenue for the company. They can invest in purchasing
Treasury bill and bond.
They should improvise the farmer rather snatching the product from them for the
installment payment or the due money. It will increase their customer royalty and they
will more customers for the company. And for this it will create a positive impact on
the agricultural economic growth in Bangladesh.
Ch-08: Conclusion
The company GTL was established in June 2011 aspires to provide farmers with complete
agricultural solutions by emphasizing sufficiency through modernization of agriculture
production, with particular attention on increased production, processing and value addition.
The company is focused on modernizing & bringing efficiency to Plant Nutrition,
Mechanization & Tissue Culture through continuous research & development. Since its
establishment GTL rapidly growing up. The company is operating in a smooth way in terms
of financial activities. They have sustained their business by good management of the assets.
Financial analysis is necessary to know about a business and the performance of its share. All
analysis reveals the financial strength of GTL. Greenland Technologies Limited has immense
opportunity to expand its business in future and contribute more in the economy of
Bangladesh.
The three months internship program helped me to enhance my knowledge beyond the text
books. I have gained practical knowledge regarding the corporate environment which I hope
would support me in the future.
United International University Page 53
Ch-09 Appendix
Abbreviations Elaborations
GTL GREENLAND TECHNOLOGIES LIMITED
TDS TAX DEDUCTED AT SOURCE
TO TURNOVER.
VAT VALUE ADDED TAX
GM GENERAL MANAGER.
PAT PROFIT AFTER TAX.
PBT PROFIT BEFORE TAX
PBIT PROFIT BEFORE INTEREST AND TAX
SE SHAREHOLDE’S EQUITY.
ROA
CA
RETURN ON ASSET.
CURRENT RATIO
ROE
IT
RETURN ON EQUITY.
INVENTORYTURNOVER RATIO
BBA BACHELOR OF BUSINESS ADMINISTRATION
UIU UNITED INTERNATIONAL UNIVERSITY.
BD BANGLADESH
United International University Page 54
CH-10 Bibliography
Books:
Principles of Managerial Finance by Gitman
Financial Ratio Analysis: A Handy Guidebook by Charles K. Vandyck
Financial Management by M Y Khan & P K Jain
Publications:
Annual Report of Greenland Technologies Limited (2013 to 2016)
Various others financial Report
Internet:
http://www.greenland-bd.com
www.investopedia.com
www.myaccountingcourse.com
www.slideshare.com
Related Documents