University of Toronto Scarborough 13 INTERNSHIP PROJECT REPORT PART II: General Report Growth Rate, Survival Rate and Population Distribution of Different Tree Species at Humber Arboretum Author: Sam Zhao Xing Employer Organization: ACER Date of Completion: August 21 st , 2013

Welcome message from author
This document is posted to help you gain knowledge. Please leave a comment to let me know what you think about it! Share it to your friends and learn new things together.
Transcript
University of Toronto Scarborough
13
INTERNSHIP PROJECT REPORT PART II: General Report Growth Rate, Survival Rate and
Population Distribution of Different
Tree Species at Humber Arboretum
Author: Sam Zhao Xing
Employer Organization: ACER
Date of Completion: August 21st, 2013
2
Preface
This project was designed to look at how different species of trees survive and
grow in a typical Southern Ontario forest plot such as the GoGlobal Plot in Humber
Arboretum. The initial idea was to use the data collected to statistically analyze which
species flourished and which species did not in terms of growth and survivorship. The
findings would give a summary on what has happened in the forest in the past decade,
as well as offer a projection for the future. Also, the result of this study can be used to
recommend which species to plant in the region and hopefully set a foundation for
future studies in the same area.
Being part of a bigger project, my role included gathering data to update the
data inventory for two one-hectare plots at Humber Arboretum. Some of the data
gathered was later used for this research study.
I would like to thank ACER and the University of Toronto for providing such a
valuable internship opportunity. A special thanks goes to Alice Casselman for helping to
shape this particular project and providing important insights. Lastly, I would like to
thank my colleagues: Amy Chen, Daniel Kim, Talent Huang and Yafei Deng. Without
their tireless help and support, the data needed for this project would not have been
available.
3
Table of Contents
Title Page ……………………………………………………………………………………………………………1
Preface ……………………………………………………………………………………………………………….2
Table of Contents ……………………..………………………………………………………………………….3
Glossary ………………………………………………………………………………………………………………5
Executive Summary ………………………………………………………………………………………………6
Section 1: Introduction ..……………………………………………………………………………………….8
1.1 ACER Introduction ………………………………………………………………….8
1.2 Projection Introduction ……………………………………………………………8
1.3 Study Site Introduction ………………………………………………….………..9
Section 2: Methodology ………………………………………………………………………………………13
2.1 SI/MAB Protocol ……..………….…………………………………………………13
2.2 Equipment and tools used ………………………………………………………14
2.3 Data sampling and Collection …………………………………………………14
2.31 DBH/CBH ……..………….…………………………………………………..16
2.32 Height ………………………………………………………………………….16
2.32 Species identification ……………………………………………………..17
Section 3: Result ………………………………………………………………………………………………..19
3.1 Species Population Distribution …………………………………………………..19
a) Population Distribution in 2004 …………………………………………..19
b) Population Distribution in 2013 …………………………………………..22
3.3 Species Survivorship ………………………………………………………………….23
3.4 Species Growth …………………………………………………………………………25
a) Growth in Height ………………………………………………………………25
b) Growth in DBH …………………………………………………………………26

4
Section 4: Discussion ………………………………………………………………………………………….27
Section 5: Conclusion & Recommendations …………………………………………………………..30
Section 6: Recommendations ………………………………………………………………………………31
References …………………………………………………………………………………………………………32
Appendix ……………………………………………………………………………………………………………33

5
Glossary
ACER – Association for Canadian Educational Resources
NEBRS – Niagara Escarpment Biosphere Reserve Studies
EMAN – Ecological Monitoring and Assessment Network
SI/MAB – The Smithsonian Institution/Measurement and Assessment of Biodiversity
DBH – Diameter at Breast Height
CBH – Circumference at Breast Height
6
Executive Summary
SI/MAB programs aim to facilitate documented inventory of plant diversity,
provide long-term data on forest dynamic and create information base for research and
education in the area of conversation and biosphere management (SI/MAB Biological
Diversity Program, 1991). Long-term forest inventories are important for studying the
growth, mortality and dynamic of the forest. Inventory data can also provide
environmental managers with important information needed for establishing
conservation policies and set environmental protection priorities. This particular study
takes place in the Go Global Plot located in the Humber Arboretum, that is part of a
SI/MAB program.
This project was interested in analyzing which species were successful and which
were not in terms of mortality and growth. To do so, data on tree height and diameter
at breast height (DBH) of all trees with DBH greater than 4cm are compared between
2004 and 2013 across four major tree species found in the forest plot. The data showed
that in the past decade, the number of trees with 4cm or great DBH experienced a
major decline. Most of the decline was caused by the decrease in Ironwood (Carpinus
caroliniana) numbers. At the same time, Sugar Maple (Acer saccharum) prospered.
American Beech (Fagus grandifolia) and Shagbark Hickory (Carya ovate) stayed
comparatively consistent. The drop in the average height of almost all four species and
the rise in DBH of all four species was likely caused by mechanical damages, either
caused by human or extreme weather conditions, that brought down some of the taller
but skinnier trees. The reason for such drastic decline in mature tree numbers is still up

7
for debate. However, it is evident that future studies are required to further understand
the dynamic of the forest plot and that the continuation in forest inventory is still
required.

8
Section 1: Introduction
1.1 ACER Background
The Association for Canadian Educational Resources (ACER) is a non-profit
organization founded by Alice Casselman in 1987. With members who are leaders from
areas such as education, media and business, ACER is responsible for initiating and
facilitating development, production and promotion of Canadian materials to meet the
needs of today’s learners (ACER - About Us, 2012).
ACER aims to accurately report the effects of climate change using citizen
scientist approach in a scientifically sound manner. ACER develops and supports
programs and that educates the public and raises awareness and understanding on the
topic of climate change. Currently, ACER has ongoing projects such as Planting for
Change (P4C), Tracking for Success and Go Global. These projects focus on ecological
monitoring and tracking environmental changes. The data gathered is then used to
support environmental education and decision-making on various governmental levels
(ACER - About Us, 2012).
1.2 Project Introduction
From oxygen production to carbon sequestration, forests play a significant role in
the environment. They are responsible for housing a large portion of world’s biodiversity
and provide habitats for various trophic levels. With forest covers rapidly decreasing in
9
Southern Ontario, forest monitoring becomes ever important. This project is based on
the monitoring of the Go Global plot at Humber Arboretum. The rationale behind
ecological monitoring is that by measuring what is changing in the forest, we can
quantify the rate of change and further understand the effects of global warming and
human impact on biodiversity. The quantitative data gathered from long-term
monitoring programs can help to study and compare changes in species richness,
abundance and community structure over a long period span, as well as to aid the
identification and planning against future threats against biodiversity (Environment
Canada, 2003). This project was designed to study how different species of trees
survive and grow in a typical Southern Ontario forest. The idea was to use the data
collected at the Humber Arboretum Go Global Plot to statistically analyze which species
flourished and which species did not. The result would show what has happened in the
past decade, while offering projections for the future. The species studied were
Ironwood (Carpinus caroliniana); Sugar Maple (Acer saccharum); American Beech
(Fagus grandifolia) and Shagbark Hickory (Carya ovate).
1.3 Site Introduction
Go Global is a network of one-hectare plots scattered in Southern Ontario that
are used for long term forest biodiversity monitoring and reporting programs. Twelve of
these plots along the Southern Ontario Escarpment were inventoried and measured in
the SI/MAB protocol. This project, called Niagara Escarpment Biosphere Reserve Studies
10
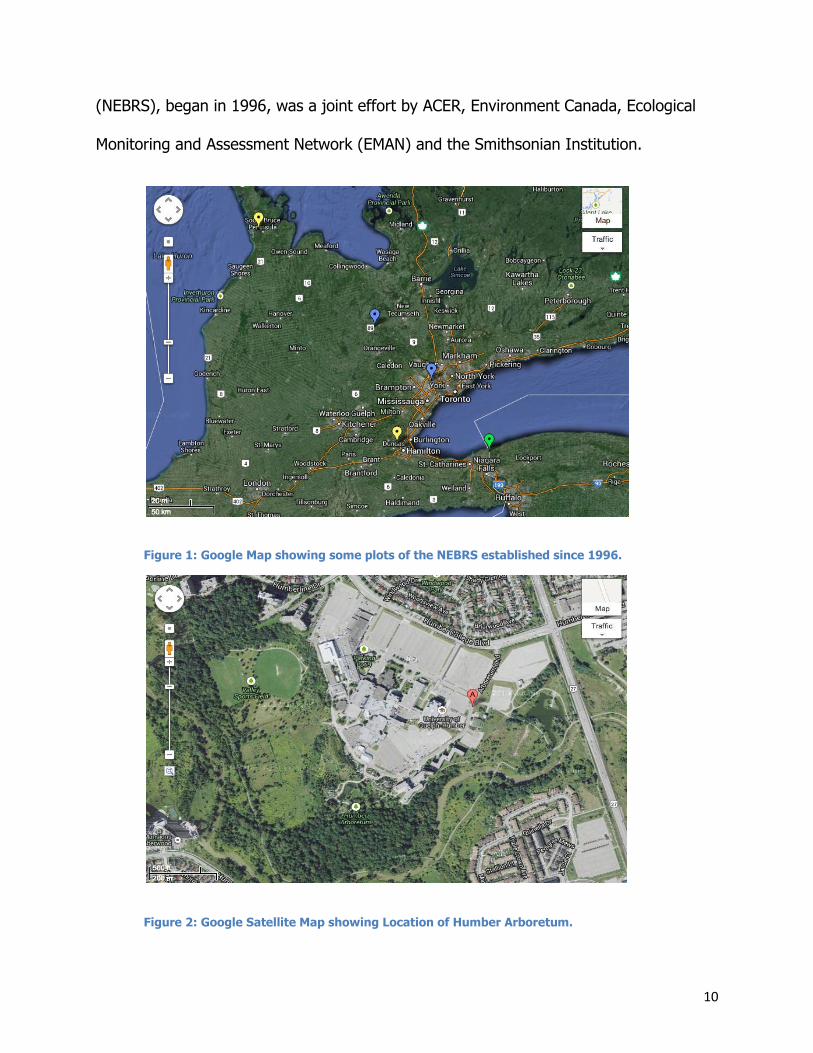
(NEBRS), began in 1996, was a joint effort by ACER, Environment Canada, Ecological
Monitoring and Assessment Network (EMAN) and the Smithsonian Institution.
Figure 1: Google Map showing some plots of the NEBRS established since 1996.
Figure 2: Google Satellite Map showing Location of Humber Arboretum.
11
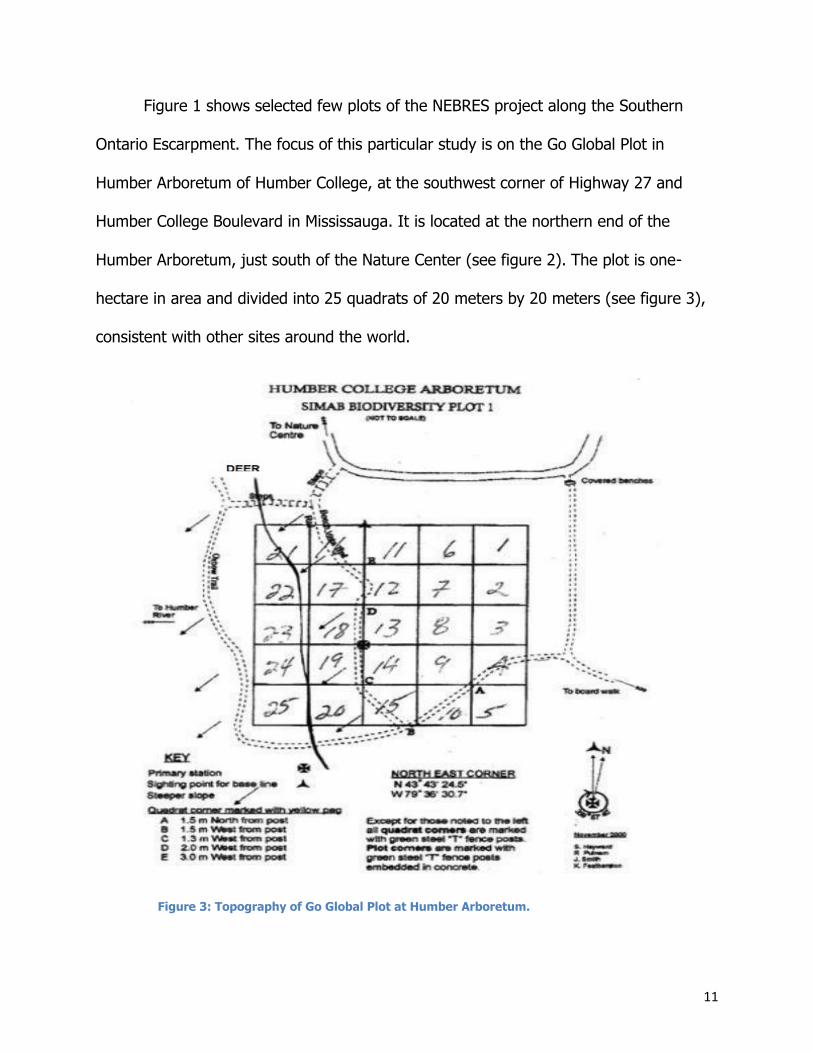
Figure 1 shows selected few plots of the NEBRES project along the Southern
Ontario Escarpment. The focus of this particular study is on the Go Global Plot in
Humber Arboretum of Humber College, at the southwest corner of Highway 27 and
Humber College Boulevard in Mississauga. It is located at the northern end of the
Humber Arboretum, just south of the Nature Center (see figure 2). The plot is one-
hectare in area and divided into 25 quadrats of 20 meters by 20 meters (see figure 3),
consistent with other sites around the world.
Figure 3: Topography of Go Global Plot at Humber Arboretum.
12
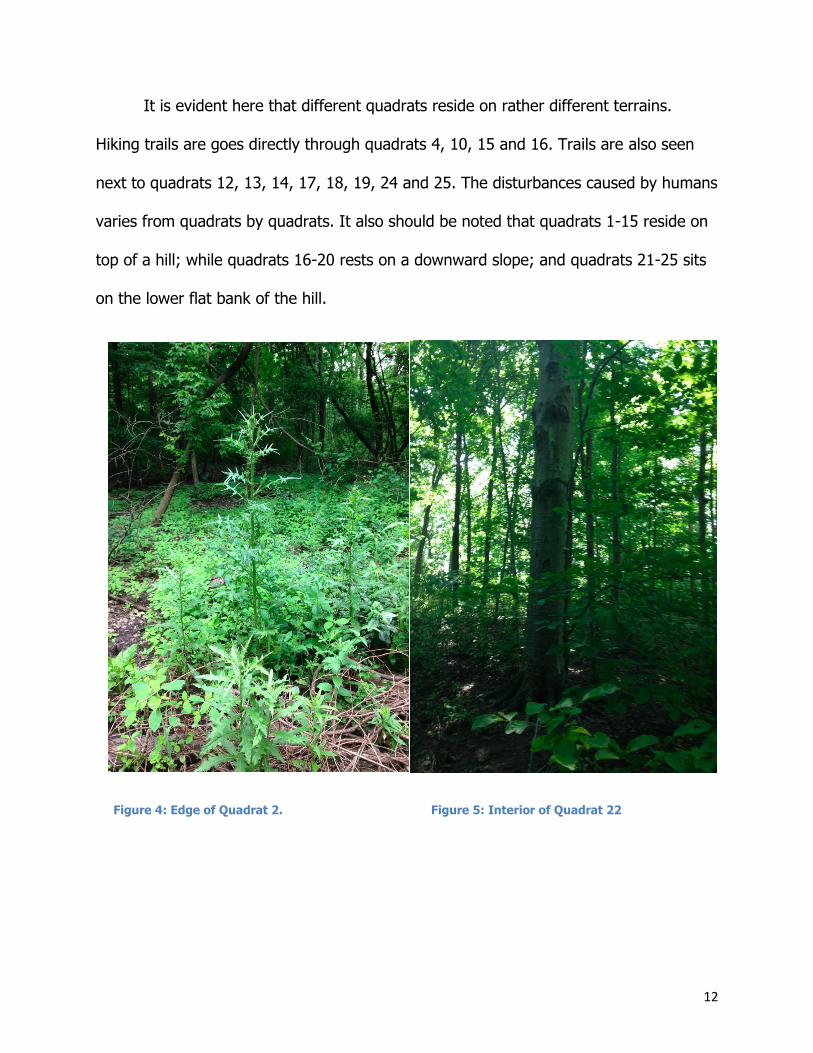
It is evident here that different quadrats reside on rather different terrains.
Hiking trails are goes directly through quadrats 4, 10, 15 and 16. Trails are also seen
next to quadrats 12, 13, 14, 17, 18, 19, 24 and 25. The disturbances caused by humans
varies from quadrats by quadrats. It also should be noted that quadrats 1-15 reside on
top of a hill; while quadrats 16-20 rests on a downward slope; and quadrats 21-25 sits
on the lower flat bank of the hill.
Figure 4: Edge of Quadrat 2. Figure 5: Interior of Quadrat 22

13
Section 2: Methodology
2.1 SI/MAB Protocol
SI/MAB stands for the Smithsonian Institution/Man and the Biosphere protocol.
The Earth Summit in Rio de Janeiro in 1992 triggered a wave of international agencies
to recognize the need to establish ecological monitoring programs to document
environmental changes. In Canada, EMAN was formed in order to response to the need
for establishing a standardized method for long term biodiversity monitoring. The
Smithsonian Institution, in collaboration with the United Nation’s Man and Biosphere
Program, developed a standard method for establishing and recording tree species in
scientific research plots within reserves (Parker, Craig, Mayhew, Wilcox, Griffin, &
Porter-Gibson, 2003). The SI/MAB protocol is the method used to monitor and track the
changes in this particular project as well as other plots in the NEBRS program.
The SI/MAB protocol allows for the unification of tree data gathering. By having
a standardized method of measurement and data collection, information can be shared
and compared not just regionally, but globally, as long as the same protocols are used.
EMAN of Environment Canada endorsed the SI/MAB protocol in the 1990s to allow
consistent and reliable long-term recordings of biodiversity data, including growth,
mortality, regeneration, and dynamic of forest trees across Canada (Dallmeier, 1992).
14
2.2 Equipment and Tools Used
- Measuring & Diameter tape
- Compass
- Clinometer
- Tree gauge
- 2 meter long ruler for swathing
- 20 meter long ropes and tape
- Flagging tape & marker
- Data sheet & pencil
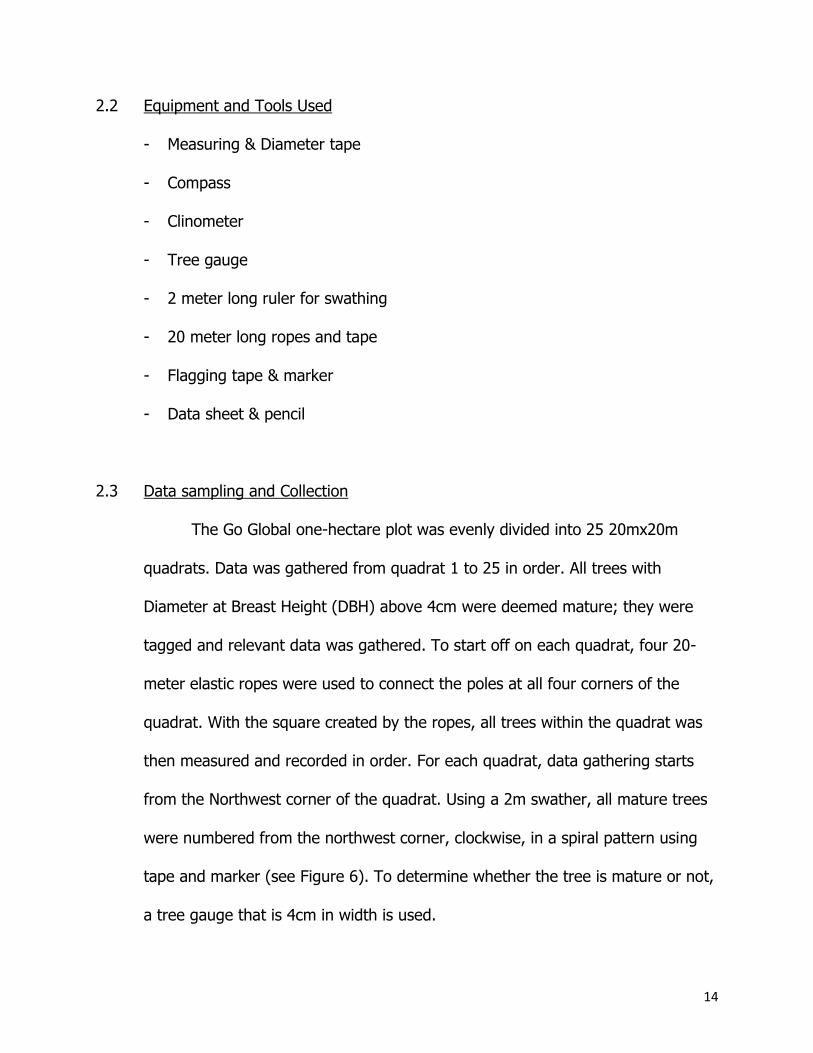
2.3 Data sampling and Collection
The Go Global one-hectare plot was evenly divided into 25 20mx20m
quadrats. Data was gathered from quadrat 1 to 25 in order. All trees with
Diameter at Breast Height (DBH) above 4cm were deemed mature; they were
tagged and relevant data was gathered. To start off on each quadrat, four 20-
meter elastic ropes were used to connect the poles at all four corners of the
quadrat. With the square created by the ropes, all trees within the quadrat was
then measured and recorded in order. For each quadrat, data gathering starts
from the Northwest corner of the quadrat. Using a 2m swather, all mature trees
were numbered from the northwest corner, clockwise, in a spiral pattern using
tape and marker (see Figure 6). To determine whether the tree is mature or not,
a tree gauge that is 4cm in width is used.
15
Figure 6: Numbering sequence of mature trees in each quadrat.
A spreadsheet designed by ACER is used to record relevant data of the mature
trees (see Appendix A). The data gathered include diameter/circumference at breast
height, height and crown depth, compass bearing, species name, crown width, health &
status of the tree and triangulation of the tree with respect to its closest corner. Since
this report is part of a larger project, some of the data gathered were irrelevant for this
particular study. For the purpose of study, only data needed were DBH/CBH, upper and
lower angle (in order to calculate height), and species name. All data are recorded on
site and later transferred onto the online inventory. The acquired data is labeled as
2013 data and compared with the 2004 data in terms to statistically analyze the
growth, survivorship and distribution of the tree species in the past decade. The species
analyzed were Ironwood, Sugar Maple, American Beech and Hickory.
16
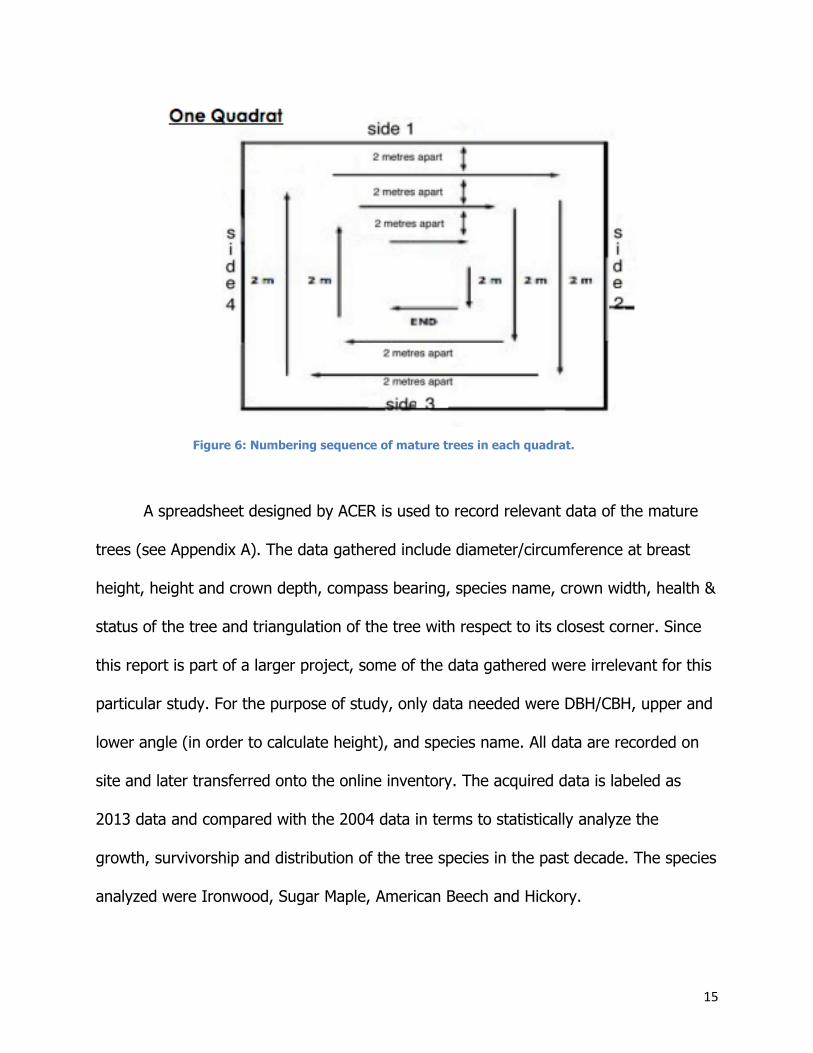
2.3.1 DBH/CBH
Trees with DBH greater than 4cm were considered mature. A tape is used to
measure the circumference of the tree and then divided by π to obtain the DBH. For
this exercise, the CBH was chosen for analysis instead of DBH.
Figure 7: Measuring CBH with tape.
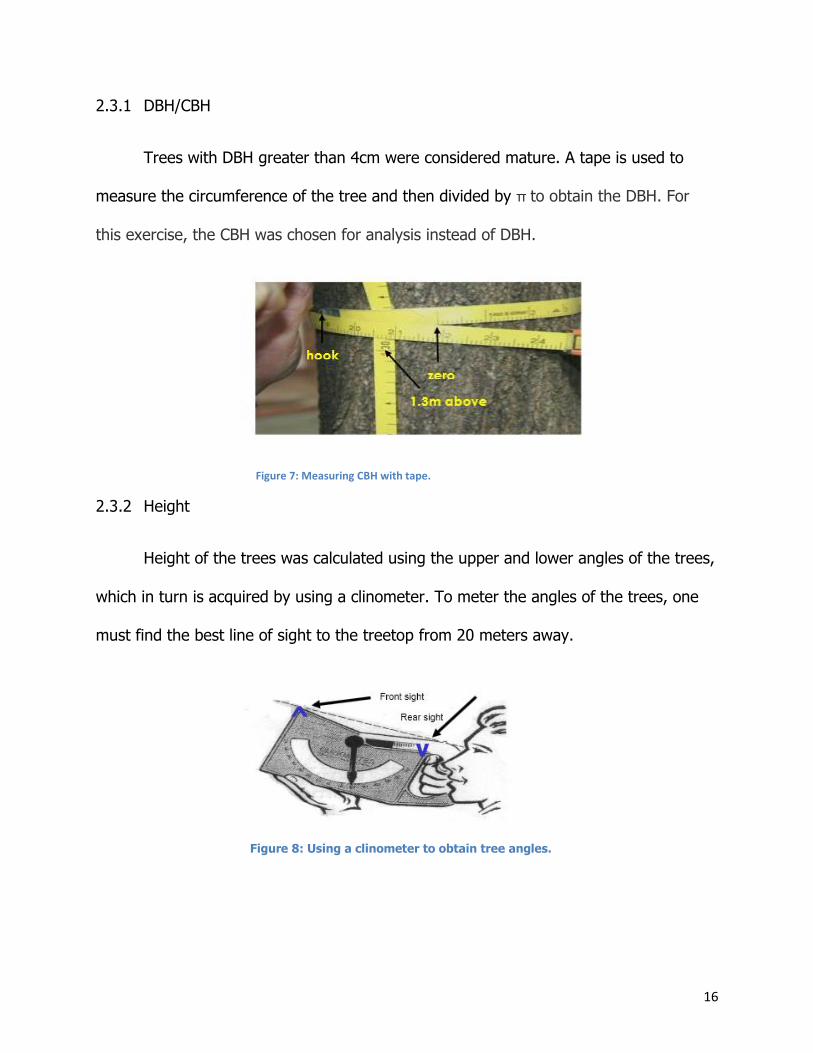
2.3.2 Height
Height of the trees was calculated using the upper and lower angles of the trees,
which in turn is acquired by using a clinometer. To meter the angles of the trees, one
must find the best line of sight to the treetop from 20 meters away.
Figure 8: Using a clinometer to obtain tree angles.
17
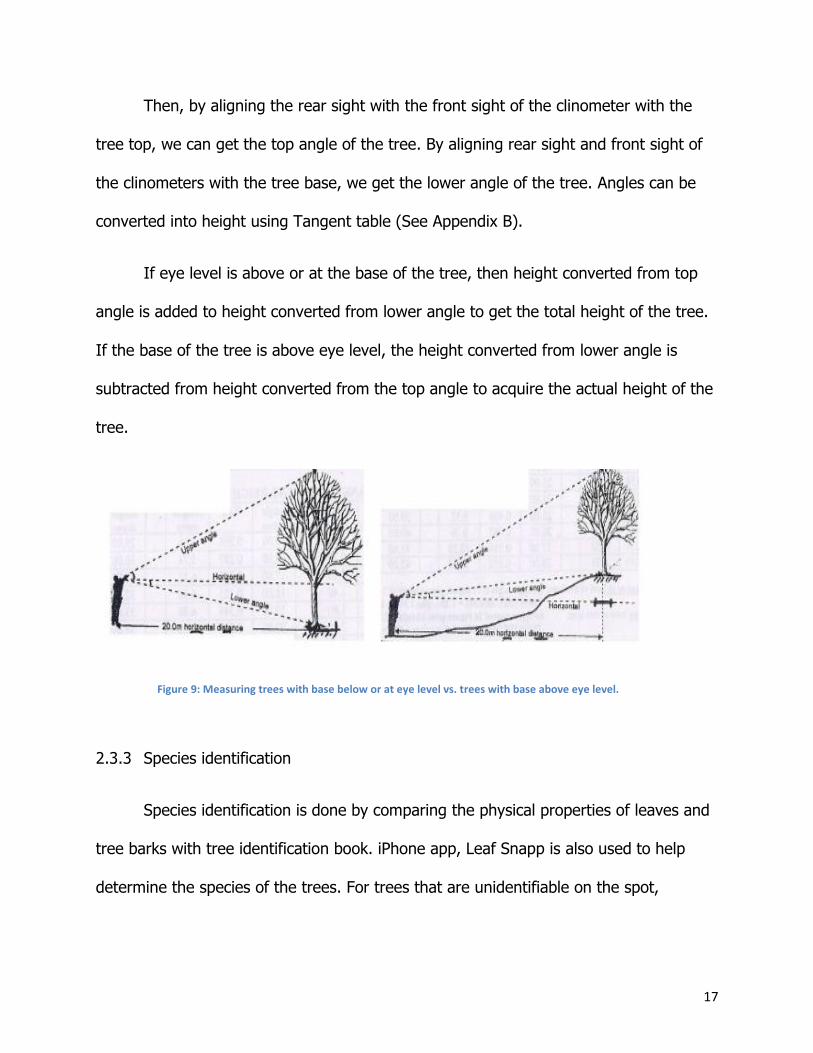
Then, by aligning the rear sight with the front sight of the clinometer with the
tree top, we can get the top angle of the tree. By aligning rear sight and front sight of
the clinometers with the tree base, we get the lower angle of the tree. Angles can be
converted into height using Tangent table (See Appendix B).
If eye level is above or at the base of the tree, then height converted from top
angle is added to height converted from lower angle to get the total height of the tree.
If the base of the tree is above eye level, the height converted from lower angle is
subtracted from height converted from the top angle to acquire the actual height of the
tree.
Figure 9: Measuring trees with base below or at eye level vs. trees with base above eye level.
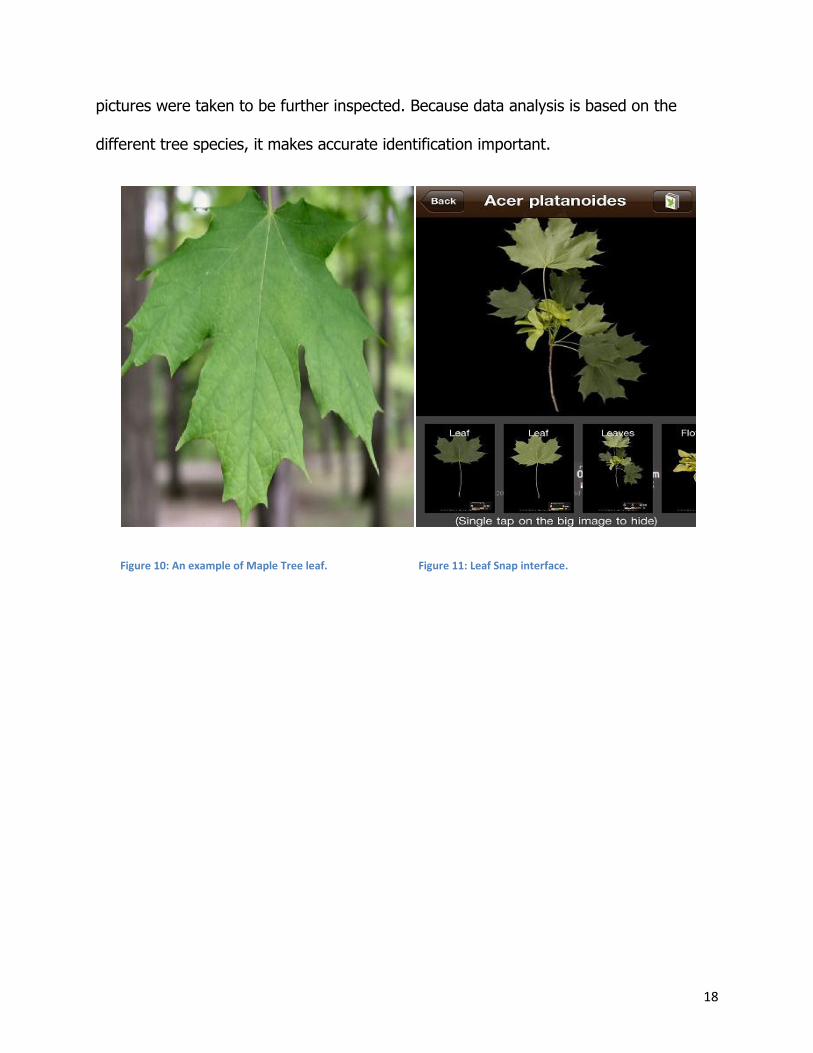
2.3.3 Species identification
Species identification is done by comparing the physical properties of leaves and
tree barks with tree identification book. iPhone app, Leaf Snapp is also used to help
determine the species of the trees. For trees that are unidentifiable on the spot,
18
pictures were taken to be further inspected. Because data analysis is based on the
different tree species, it makes accurate identification important.
Figure 10: An example of Maple Tree leaf. Figure 11: Leaf Snap interface.
19
Section 3: Results
3.1 Species Population Distribution
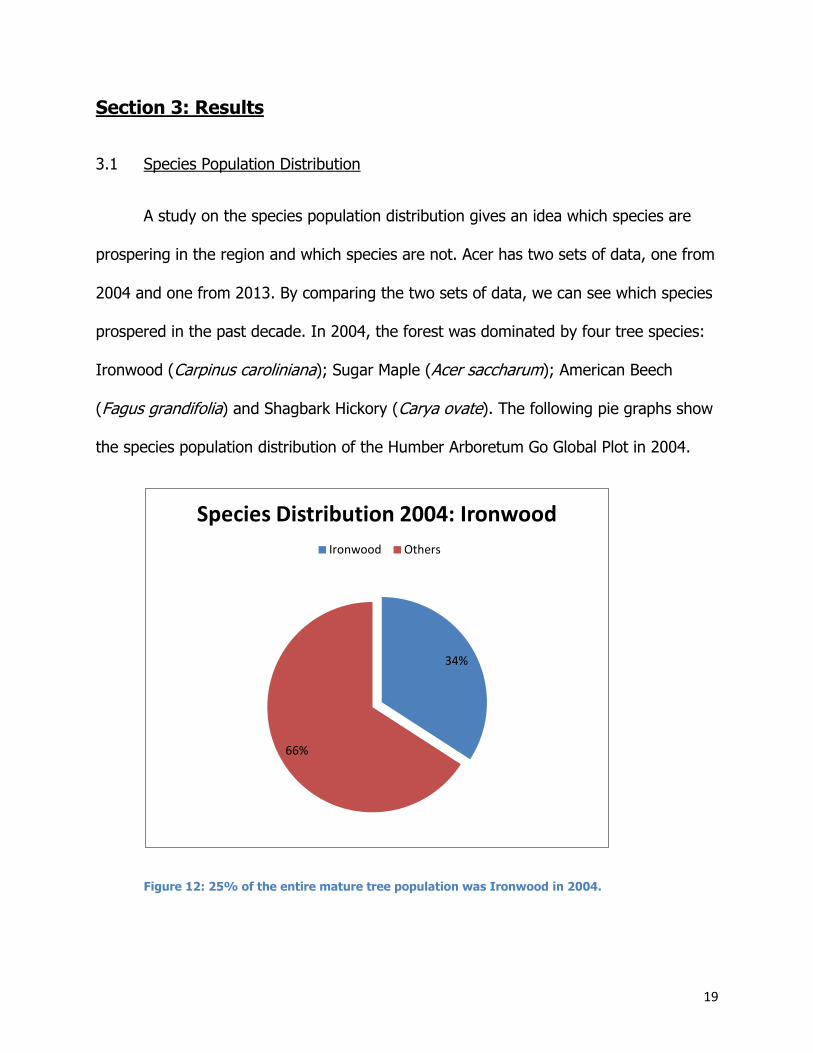
A study on the species population distribution gives an idea which species are
prospering in the region and which species are not. Acer has two sets of data, one from
2004 and one from 2013. By comparing the two sets of data, we can see which species
prospered in the past decade. In 2004, the forest was dominated by four tree species:
Ironwood (Carpinus caroliniana); Sugar Maple (Acer saccharum); American Beech
(Fagus grandifolia) and Shagbark Hickory (Carya ovate). The following pie graphs show
the species population distribution of the Humber Arboretum Go Global Plot in 2004.
Figure 12: 25% of the entire mature tree population was Ironwood in 2004.
34%
66%
Species Distribution 2004: Ironwood
Ironwood Others
20
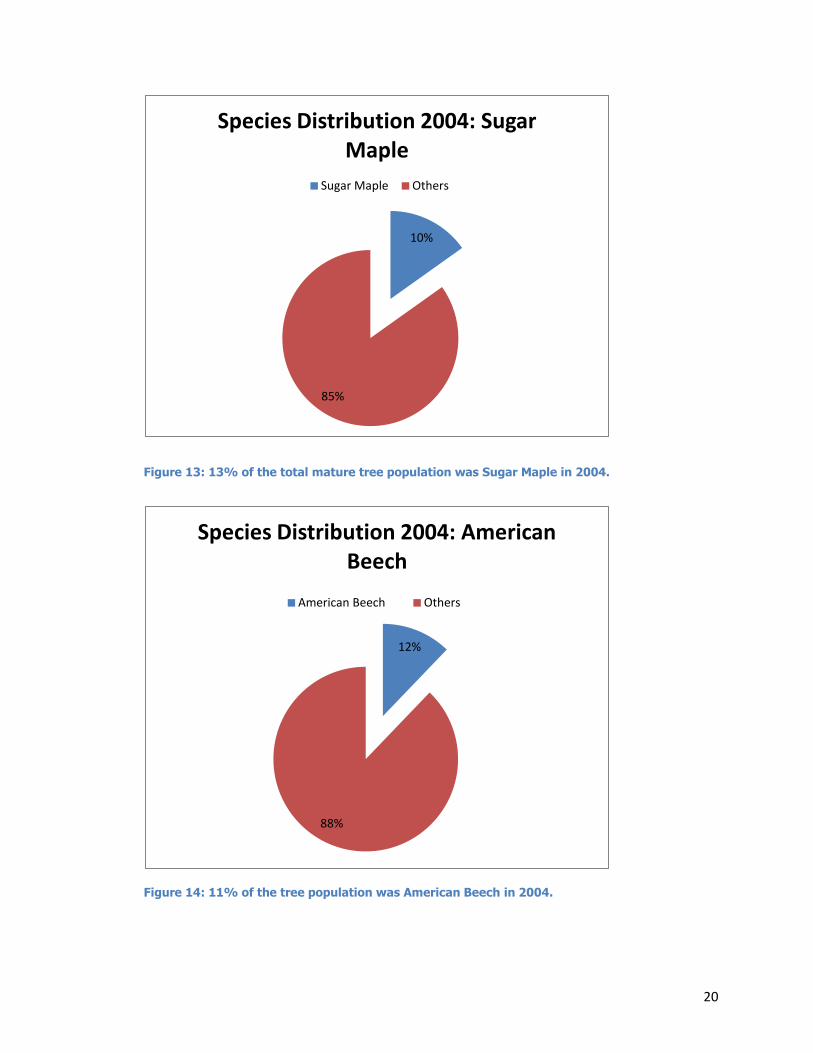
Figure 13: 13% of the total mature tree population was Sugar Maple in 2004.
Figure 14: 11% of the tree population was American Beech in 2004.
10%
85%
Species Distribution 2004: Sugar Maple
Sugar Maple Others
12%
88%
Species Distribution 2004: American Beech
American Beech Others
21
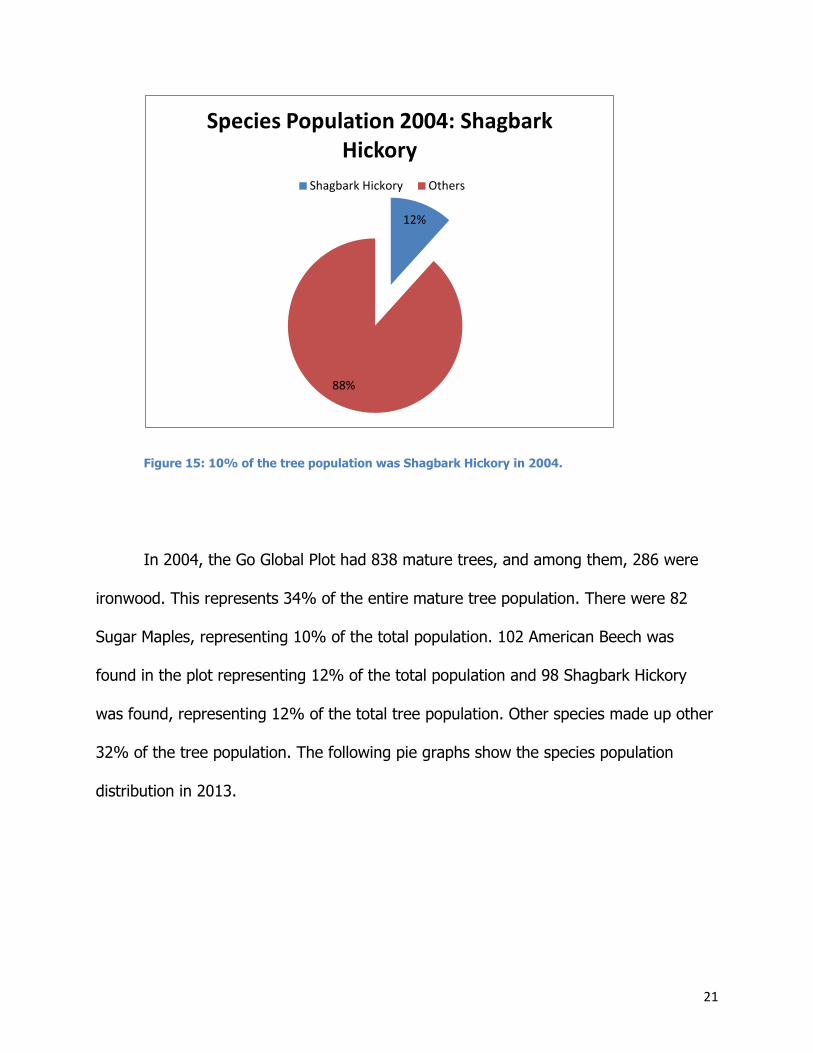
Figure 15: 10% of the tree population was Shagbark Hickory in 2004.
In 2004, the Go Global Plot had 838 mature trees, and among them, 286 were
ironwood. This represents 34% of the entire mature tree population. There were 82
Sugar Maples, representing 10% of the total population. 102 American Beech was
found in the plot representing 12% of the total population and 98 Shagbark Hickory
was found, representing 12% of the total tree population. Other species made up other
32% of the tree population. The following pie graphs show the species population
distribution in 2013.
12%
88%
Species Population 2004: Shagbark Hickory
Shagbark Hickory Others
22
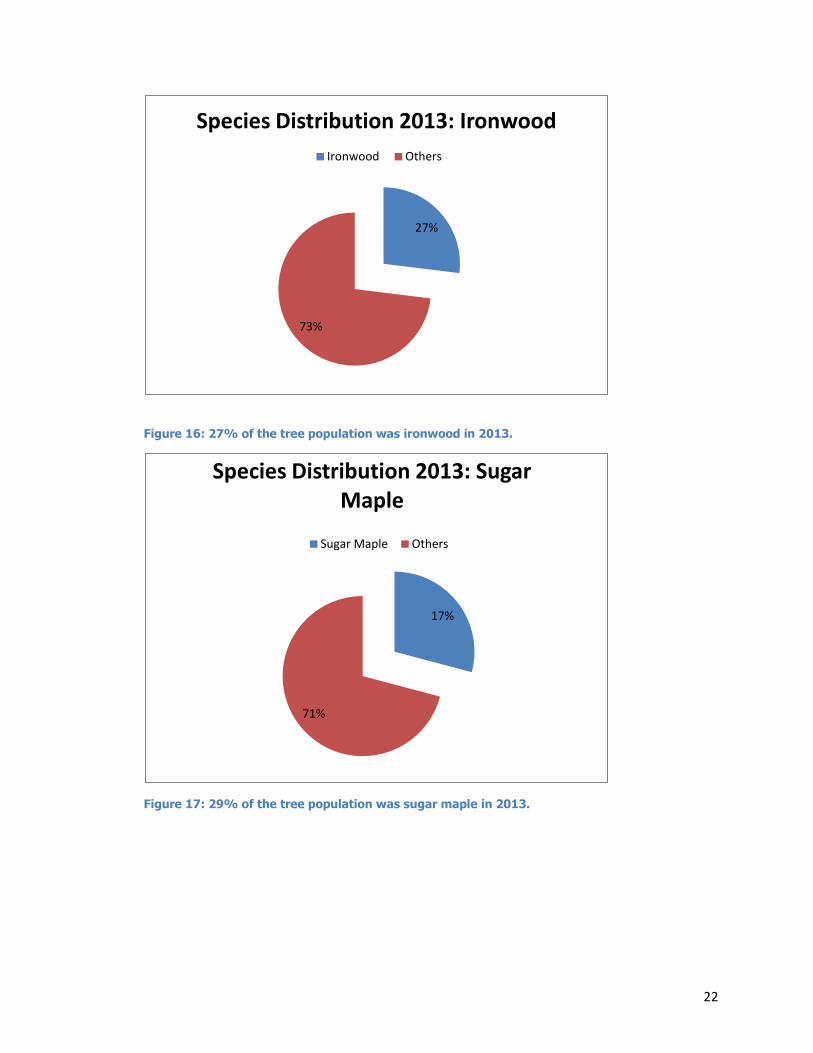
Figure 16: 27% of the tree population was ironwood in 2013.
Figure 17: 29% of the tree population was sugar maple in 2013.
27%
73%
Species Distribution 2013: Ironwood
Ironwood Others
17%
71%
Species Distribution 2013: Sugar Maple
Sugar Maple Others
23
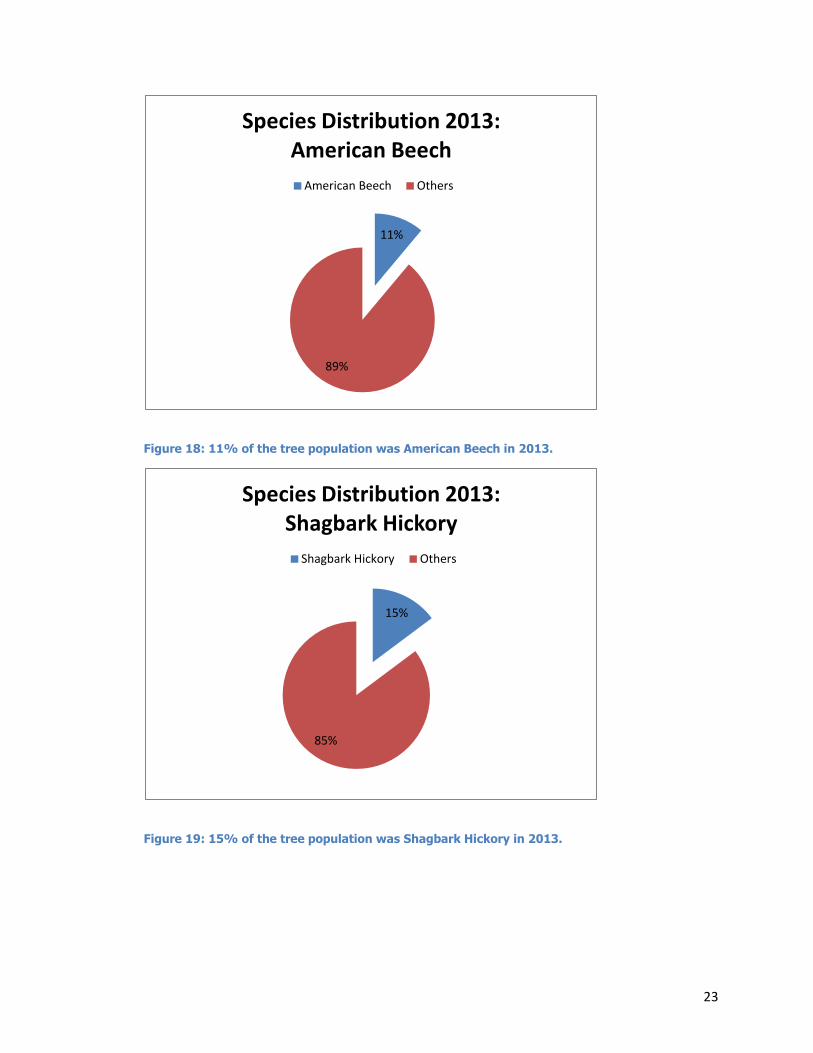
Figure 18: 11% of the tree population was American Beech in 2013.
Figure 19: 15% of the tree population was Shagbark Hickory in 2013.
11%
89%
Species Distribution 2013: American Beech
American Beech Others
15%
85%
Species Distribution 2013: Shagbark Hickory
Shagbark Hickory Others
24
In 2013, 649 matures were found. 173 of them were Ironwood, which took up
27% of the new total population. Sugar maple had 110 individuals in the plot in 2013
and accounted for 17% of the total population. American Beech had 72 individuals and
accounted for 11% of the total population. Lastly, Shagbark Hickory had 98 mature
individuals and was responsible for 12% of the total population.
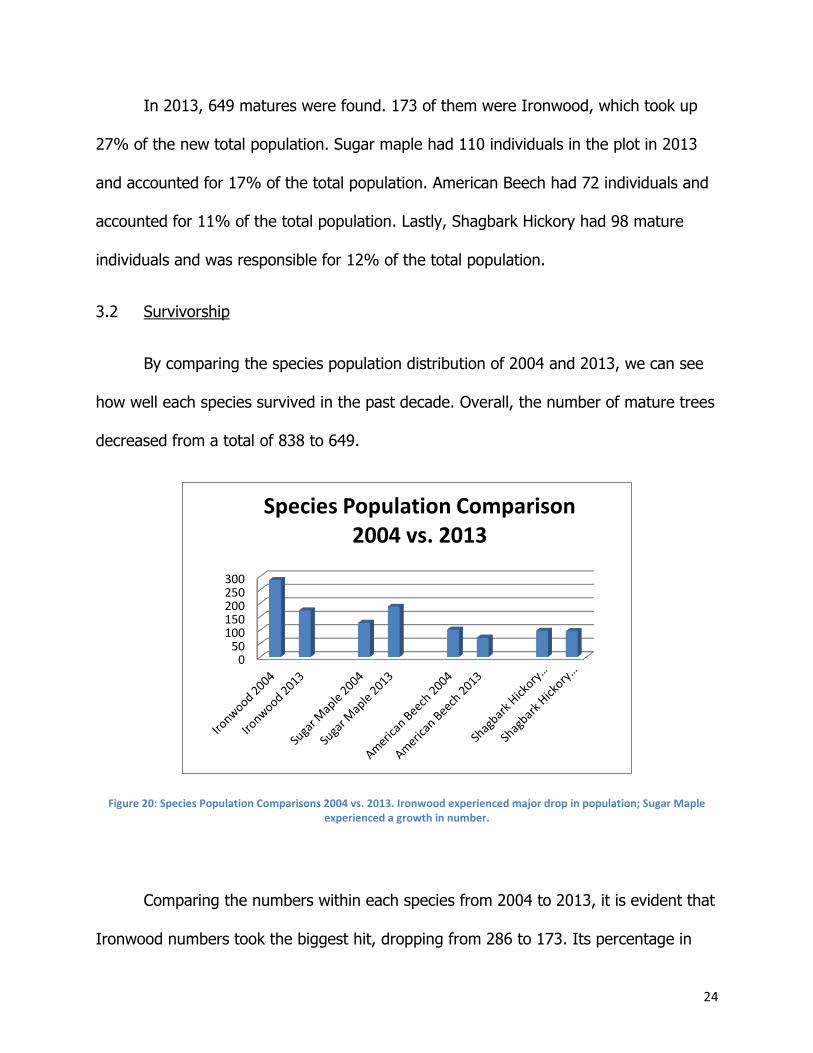
3.2 Survivorship
By comparing the species population distribution of 2004 and 2013, we can see
how well each species survived in the past decade. Overall, the number of mature trees
decreased from a total of 838 to 649.
Figure 20: Species Population Comparisons 2004 vs. 2013. Ironwood experienced major drop in population; Sugar Maple experienced a growth in number.
Comparing the numbers within each species from 2004 to 2013, it is evident that
Ironwood numbers took the biggest hit, dropping from 286 to 173. Its percentage in
0 50
100 150 200 250 300
Species Population Comparison 2004 vs. 2013
25
the total tree population also dropped from 34% to 27%. On the other end of the
spectrum, Sugar Maples are doing very well in this forest, jumping from 82 to 110
individuals, which is an increase from 10% to 17% in the total forest population.
American Beech also dropped in terms of numbers, from 102 to 72. However, its ratio
in the population remains steady around 11% throughout the decade, which shows that
it is surviving at a pace on par with the forest average. Shagbark Hickory’s numbers
stayed constant, but with the forest population on the decline, its ratio increased from
12% to 15%.
3.3 Growth Rate
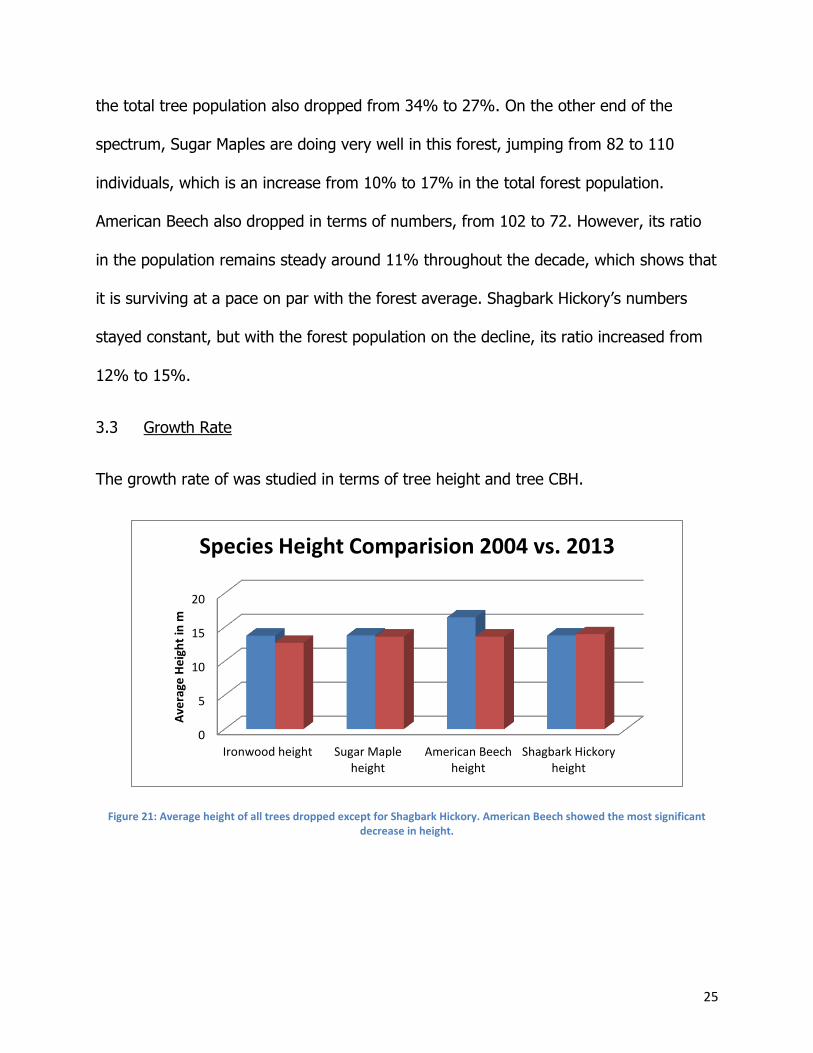
The growth rate of was studied in terms of tree height and tree CBH.
Figure 21: Average height of all trees dropped except for Shagbark Hickory. American Beech showed the most significant decrease in height.
0
5
10
15
20
Ironwood height Sugar Maple height
American Beech height
Shagbark Hickory height
Ave
rage
He
igh
t in
m
Species Height Comparision 2004 vs. 2013
26
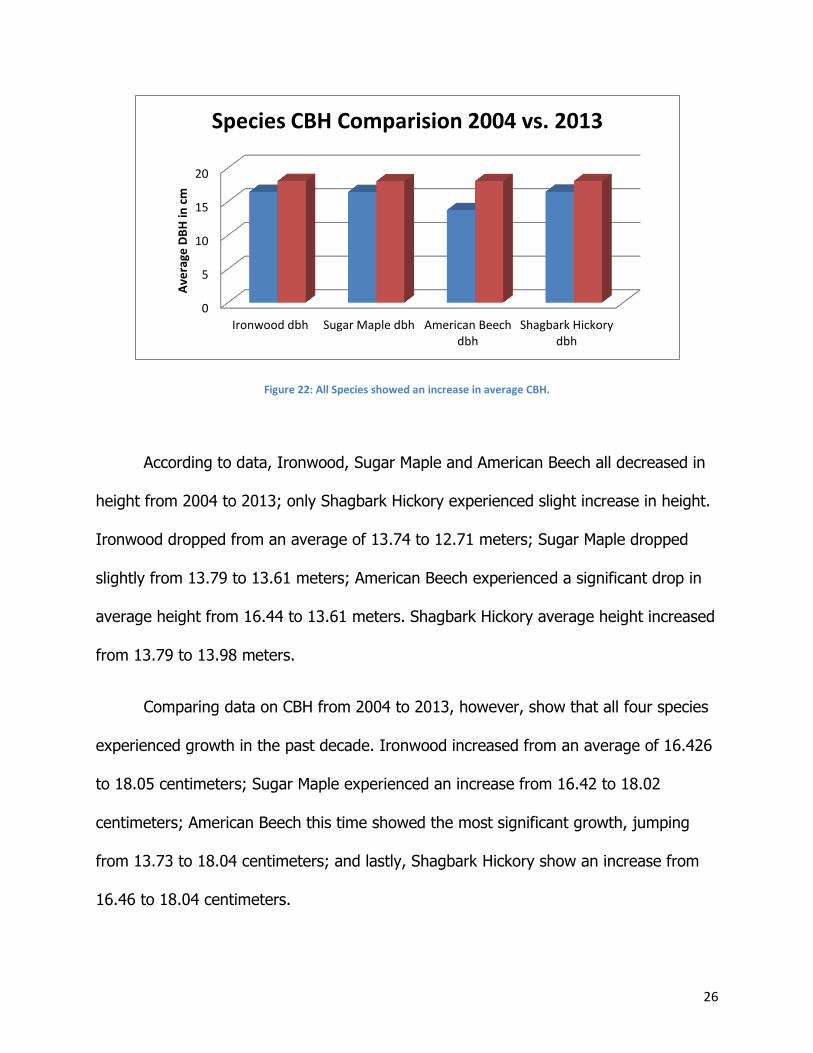
Figure 22: All Species showed an increase in average CBH.
According to data, Ironwood, Sugar Maple and American Beech all decreased in
height from 2004 to 2013; only Shagbark Hickory experienced slight increase in height.
Ironwood dropped from an average of 13.74 to 12.71 meters; Sugar Maple dropped
slightly from 13.79 to 13.61 meters; American Beech experienced a significant drop in
average height from 16.44 to 13.61 meters. Shagbark Hickory average height increased
from 13.79 to 13.98 meters.
Comparing data on CBH from 2004 to 2013, however, show that all four species
experienced growth in the past decade. Ironwood increased from an average of 16.426
to 18.05 centimeters; Sugar Maple experienced an increase from 16.42 to 18.02
centimeters; American Beech this time showed the most significant growth, jumping
from 13.73 to 18.04 centimeters; and lastly, Shagbark Hickory show an increase from
16.46 to 18.04 centimeters.
0
5
10
15
20
Ironwood dbh Sugar Maple dbh American Beech dbh
Shagbark Hickory dbh
Ave
rage
DB
H in
cm
Species CBH Comparision 2004 vs. 2013
27
Section 4: Discussion
Forest inventory plots are an important approach to recording and monitoring
plant diversity. They are also one means for gathering long-term data on mortality,
regeneration, growth and the dynamic of forest trees (Dallmeier, 1992).
A comparison of data from 2004 to 2013 at the Go Global Plot at Humber
Arboretum revealed some facts about the forest. The total number of mature trees
(>4cm DBH) decline from 838 to 649 individuals. This is quite alarming that almost
23% of the mature tree population could not survive the last decade. The tree species
that experienced the biggest decline is Ironwood, which dropped from 286 to 173
individuals. This means that almost 40% of the Ironwood died in the last 10 years.
Since ironwood was such a major part of the total tree population in 2004, at 34%;
Ironwood’s rapid decline alone attributed to 44% of the total decline in mature tree
population. The species that has really flourished in the past decade was Sugar Maple.
Their number increased by 25% in the last ten years. American Beech stayed constant
in terms of their percentage in the total population despite a decline in numbers; and
Shagbark Hickory stayed constant in terms of raw number but increased its percentage
in the total population.
It is important to note that all four species studied here are all native species,
common in the northeast region of US and southeast region of Canada. Therefore their
difference in terms of success is due to regional effects. The reasons behind the
different degree of success of each species are outside of the scope of this study, but
28
some inferences can be made. As seen in figure 3, many hike trails pass by or even
pass through many of the quadrats. This may lead to higher levels of human impact on
the selected few quadrats. Some trees are known to be more sensitive to outside
disturbances. The presence of deer can also be a factor, as fences were observed to
have little effect in preventing them foraging in the forest; their diet habit may have
affected some species more than others. Also, the trails themselves may have damaged
the nearby trees and their roots. The different topographies experienced by different
quadrats may also be a factor. There is no definitive answer as of right now to why and
how the mature tree number is on a decline and is an area that may require further
studies.
The growth of trees was measured in terms of height and CBH. The general
trend was that the height across all four species decline except for the Shagbark
Hickory; the CBH however, showed an increase across all four species. The overall
trend of decrease in height and increase in CBH may be explained by the fact that tall
and skinny (less CBH) are more prone to dying to extreme weather conditions. During
the process of gathering plot data, many dead trees and branches were observed on
the forest floor. Upon closer inspection, most revealed to have suffered mechanical
damage. It is plausible to assume that many of the tall trees died due to major wind
conditions, lessened the average tree height despite the natural growth of trees in the
past decade. It is also worth noting that the frequency of extreme weather conditions is
positively correlated to global warming, although extreme weather events and their
effects on Humber Arboretum forest plot needs to be further studied. At the same time,
29
tall trees more prone to mechanical damage are ones with less CBH, with them dying
and removed from calculation, CBH increased in all four species. Of course, the natural
growth in tree girth must have also attributed to the increase.
It is important to point out some of the potential errors to this study. Human
errors are unavoidable when measuring CBH and upper and lower angles. Tapes,
clinometer and other tools can also potentially give off inaccurate readings. Also,
despite best effort, there may be some trees there were overlooked in a dense forest
populated by countless trees and shrubs.
30
Section 5: Conclusion
The Major conclusions are
- Population in the Humber Arboretum Go Global plot decreased by 23% in the
past decade.
- Sugar maple is the most successful tree species in the plot, increasing its
population from 82 to 110 individuals; occupying 17% of the total population
by 2013, up from 10% in 2004.
- Ironwood experienced the biggest decline in numbers, dropping from 286 to
173 individuals.
- All four species Ironwood, Sugar Maple, American Beech and Shagbark
Hickory experienced growth in average CBH.
- Only Shagbark Hickory showed increase in average height, where other three
species showed decrease in average height.
- Mechanical damage may be the reason behind the decrease in height and
increase in CBH.
- Further studies are needed to fully understand the rapid decline in tree
numbers and reasons for the different degrees of success among different
tree species, despite all being native species.

31
Section 6: Recommendations
- Continuation of forest plot monitoring is needed to enable further studies on
forest ecology.
- More complete annual data can be helpful for studying changes in the forest
on a year-to-year basis.
- Better protection against deer and animal browsing in study plot.
- Monitoring data should be shared with forest managers to help the process of
decision-making in forest management.
- Raise awareness on the importance of forest and biodiversity conservation to
the public and youth.
- Have more helping hands in the forest for inventory update.
32
Bibliography ACER. (n.d.). Retrieved 8 25, 2013, from ACER: http://acer-acre.ca/wp-content/uploads/2012/06/Role-
Cards-Eng-SF.pdf
ACER - About Us. (2012). Retrieved 08 21, 2013, from ACER: http://www.acer-acre.ca/about-us
Botkin, D. B. (1972). Some Ecological Consequences of a Computer Model of Forest Growth. Journal of
Ecology .
Dallmeier, F. (Ed.). (1992). Long-Term Monitoring of Biological Diversity in Trophic Forest Areas. MAB
DIgest .
Environment Canada. (2003). EMAN: Monitoring biodiversity in Canadian forests.
Parker, B., Craig, B., Mayhew, M., Wilcox, K., Griffin, T., & Porter-Gibson, J. (2003). Long Point World
Biosphere Reserve Monitoring Program User Guide -2003. Long Point World Biosphere Reserve.
SI/MA B (Smithsonian Institution/Man and the Biosphere) Biological Diversity Program. 1991. SI/MAB
Biodiversity News Number 1 (Summer 1991). Smithsonian Institution, Washington, D.C .

33
Appendices
Related Documents