Internet Utilization Behaviour of Agricultural Students of Swami Keshwanand Rajasthan Agricultural University, Bikaner Thesis Submitted to the Swami Keshwanand Rajasthan Agricultural University, Bikaner in partial fulfillment of the requirement for the degree of Master of Science in the Faculty of Agriculture (Extension Education) By Suresh Garhwal 2010

Welcome message from author
This document is posted to help you gain knowledge. Please leave a comment to let me know what you think about it! Share it to your friends and learn new things together.
Transcript
Internet Utilization Behaviour of Agricultural Students
of Swami Keshwanand Rajasthan Agricultural
University, Bikaner
Thesis
Submitted to the
Swami Keshwanand Rajasthan Agricultural University, Bikaner
in partial fulfillment of the requirement
for the degree of
Master of Science
in the
Faculty of Agriculture
(Extension Education)
By
Suresh Garhwal
2010
Swami Keshwanand Rajasthan Agricultural University, Bikaner
S.K.N. College of Agriculture, Jobner
CERTIFICATE-I
Dated :------.2010
This is to certify that Mr. Suresh Garhwal has successfully
completed the comprehensive examination held on ----------as required
under the regulation for Master’s degree.
(N.K. Sharma )
Head
Department of Extension Education
S.K.N. College of Agriculture,
Jobner
Swami Keshwanand Rajasthan Agricultural University, Bikaner
S.K.N. College of Agriculture, Jobner
CERTIFICATE-II
Dated :------------2010
This is to certify that the thesis entitled “Internet Utilization
Behaviour of Agricultural Students of Swami Keshwanand Rajasthan
Agricultural University, Bikaner”, submitted for the degree of Master of
Science in the subject of Extension Education embodies bonafide
research work carried out by Mr. Suresh Garhwal under my guidance
and supervision and that no part of this thesis has been submitted for any
other degree. The assistance and help received during the course of
investigation have been fully acknowledged. The draft of the thesis was
also approved by the advisory committee on ...............
(I. M. Khan)
Major Advisor
(G. L. Keshwa) Dean
S.K.N.College of Agriculture, Jobner
(N.K. Sharma)
Head
Department of Extension Education
S.K.N. College of Agriculture,
Jobner
Swami Keshwanand Rajasthan Agricultural University, Bikaner
S.K.N. College of Agriculture, Jobner
CERTIFICATE-III
Dated :----------- 2010
This is to certify that the thesis entitled “Internet Utilization
Behaviour of Agricultural Students of Swami Keshwanand Rajasthan
Agricultural University, Bikaner”, submitted by Mr. Suresh Garhwal to
Rajasthan Agricultural University, Bikaner, in partial fulfilment of the
requirements for the degree of Master of Science in the subject of
Extension Education after recommendation by the external examiner,
was defended by the candidate before the following members of the
examination committee. The performance of the candidate in the oral
examination on his thesis has been found satisfactory. We therefore,
recommend that the thesis be approved.
(I. M. Khan) Major Advisor
(J. P. Yadav) (K.N. Gupta) Advisor Advisor
(N.K. Sharma) (R. C. Kumawat) Head Dean, PGS Nominee Department of Extension Education
(G.L. Keshwa) Approved Dean S.K.N. College of Agriculture, DEAN Jobner POST GRADUATE STUDIES RAJASTHAN AGRICULTURAL UNIVERSITY, BIKANER
Swami Keshwanand Rajasthan Agricultural University, Bikaner
S.K.N. College of Agriculture, Jobner
CERTIFICATE-IV
Dated :----------2010
This is to certify that Mr. Suresh Garhwal of the Department of
Extension Education, S.K.N. College of Agriculture, Jobner has made
all corrections/modifications in the thesis entitled “Internet Utilization
Behaviour of Agricultural Students of Swami Keshwanand Rajasthan
Agricultural University, Bikaner”, which were suggested by the external
examiner and the advisory committee in the oral examination held
on --------------2010. The final copies of the thesis duly bound and
corrected were submitted on ---------------2010 and forwarded herewith for
approval.
(I. M. Khan)
Major Advisor
(N.K. Sharma)
Head Department of Extension Education
(G.L. Keshwa)
Dean S.K.N. College of Agriculture, Jobner
APPROVED DEAN, PGS RAU, Bikaner
CONTENTS
CHAPTER NO.
PARTICULARS PAGE NO.
1. INTRODUCTION ………..
2. REVIEW OF LITERATURE ………..
3. THEORETICAL ORIENTATION ………..
4. RESEARCH METHODOLOGY ………..
5. RESULTS AND DISCUSSION ………..
6. SUMMARY AND CONCLUSION ………..
BIBLIOGRAPHY ………..
ABSTRACT (English) ………..
ABSTRACT (Hindi) ………..
APPENDICES ………..

ACKNOWLEDGEMENT
With great reverence, I express my warmest feeling with deep sense of gratitude to my
advisor and chairman of my advisory committee Dr. I.M. Khan Assistant Professor, Department of
Extension Education, S.K.N. College of Agriculture, Jobner (Swami Keshwanand Rajasthan
Agricultural University, Bikaner). I have no words to express my heartfelt thanks to him for his
illuminating guidance, unfailing encouragement, scholarly suggestions, unique supervision,
constructive criticism, sympathetic attitude and keen interest during the course of this investigation
and preparation of this manuscript.
I am heartly thankful to member of my advisory committee Dr. J.P. Yadav, Assistant
Professor, Department of Extension Education, Dr. K.N. Gupta, Associate Professor, Department
of Statistics, Dr. R.C. Kumawat, Associate Professor and Head (Dean PGS nominee), Department
of Agricultural Economics, for their sincere advice, critical suggestions and kind help during the
period of investigation.
I am thankful to Dr. N.K. Sharma, Associate Professor and Head, Department of
Extension, for their encouragement and full cooperation during the research programme.
I record my sincere thanks to Dr. G.L. Keshwa, Dean, S.K.N. College of Agriculture,
Jobner for his continuous support to academic pursuits and facilities provided for the execution of
the present research work.
I also want to pay my cordial thanks to Dr. G. S. Bangarva, Dr. H. L. Jat, Dr. Sangram
Singh, and Sh. Manish Agarwal and all the staff members of the Department of Extension
Education, S.K.N. College of Agriculture, Jobner for providing all sorts of help and co-operation as
when needed.
I especially indebted to my colleagues Miss Ankita and Mr. Rohitash, Subhash, Badhalaji,
Shripalji, Ganga Ram and Shankar for not only being excellent fellow batch mates but
understanding friends without those help and support things this work have not been smooth.
Direction is not enough to express my gratitude to my Mother Smt. Vimla Devi and
Father Sh. Ram Kumar, My younger brother Rakesh and younger sister Suman, and sangeeta and
other family members, whose selfless love, filial affection, constant encouragement, obstinate
sacrifices, expectation and blessing have always been the most vital source of inspiration and
motivation in my life. Their memories gave me a sense of relief after hours of tedious work during my
research.
I am also greatful to Sh. Suresh Yadav, Vimal Computers, Jobner for typing the
manuscript neatly and efficiently within a very short period.
Last but not least, a million thanks to God, the almighty who made me to do this task and
made every Job a success for me. My heart is budding with ecstasy and bliss at this moment when I
am extending my thanks to all who co-operated me directly or indirectly.
Jobner
Date: (Suresh Garhwal)
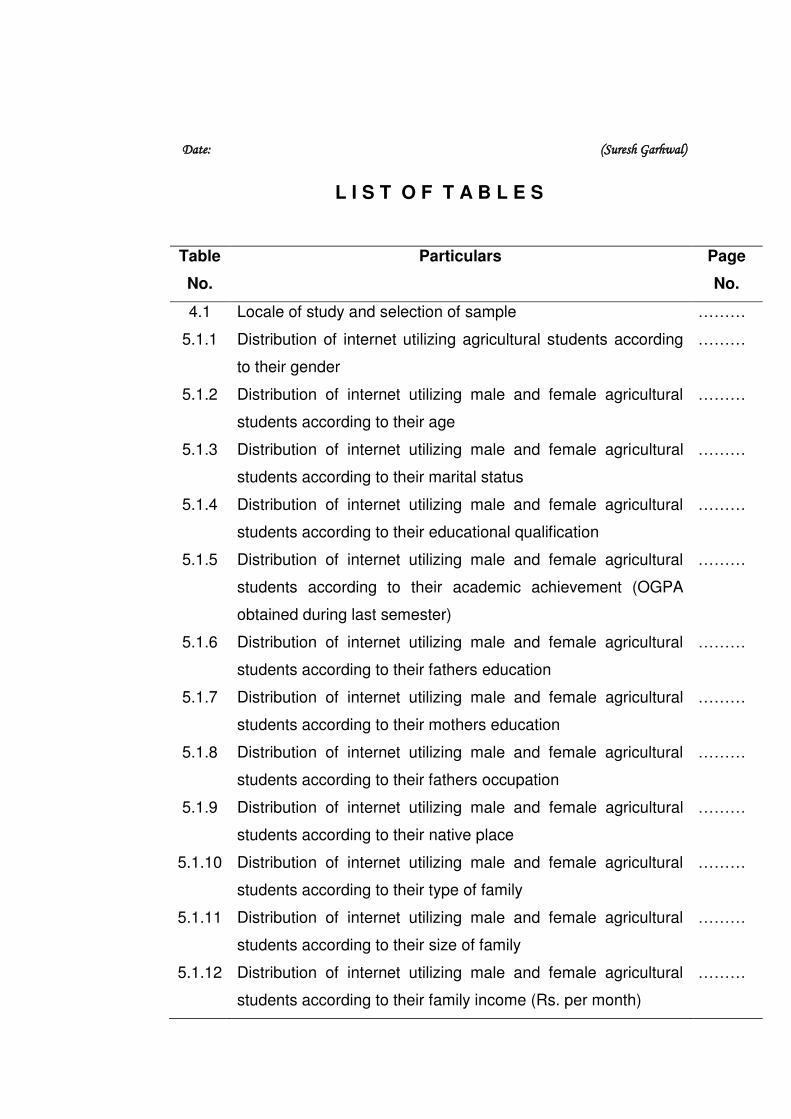
L I S T O F T A B L E S
Table
No.
Particulars
Page
No.
4.1 Locale of study and selection of sample ………
5.1.1 Distribution of internet utilizing agricultural students according
to their gender
………
5.1.2 Distribution of internet utilizing male and female agricultural
students according to their age
………
5.1.3 Distribution of internet utilizing male and female agricultural
students according to their marital status
………
5.1.4 Distribution of internet utilizing male and female agricultural
students according to their educational qualification
………
5.1.5 Distribution of internet utilizing male and female agricultural
students according to their academic achievement (OGPA
obtained during last semester)
………
5.1.6 Distribution of internet utilizing male and female agricultural
students according to their fathers education
………
5.1.7 Distribution of internet utilizing male and female agricultural
students according to their mothers education
………
5.1.8 Distribution of internet utilizing male and female agricultural
students according to their fathers occupation
………
5.1.9 Distribution of internet utilizing male and female agricultural
students according to their native place
………
5.1.10 Distribution of internet utilizing male and female agricultural
students according to their type of family
………
5.1.11 Distribution of internet utilizing male and female agricultural
students according to their size of family
………
5.1.12 Distribution of internet utilizing male and female agricultural
students according to their family income (Rs. per month)
………

Table No.
Particulars
Page
No.
5.1.13 Distribution of internet utilizing male and female agricultural
students according to their medium of instruction during school
days
………
5.1.14 Distribution of internet utilizing male and female agricultural
students according to their exposure to extra – curricular
activities
………
5.1.15 Distribution of internet utilizing male and female agricultural
students according to their training being extended by the
college library as to how to use Internet
………
5.1.16 Distribution of internet utilizing male and female agricultural
students according to their study of any course, to know the
use of Internet
………
5.1.17 Distribution of internet utilizing male and female agricultural
students according to their type of course studied
………
5.1.18 Distribution of internet utilizing male and female agricultural
students according to their expertise in navigating the web
………
5.1.19 Distribution of internet utilizing male and female agricultural
students according to their place of living at the time of
education
………
5.1.20 Distribution of internet utilizing male and female agricultural
students according to their wish to migrate abroad
………
5.1.21 Distribution of internet utilizing male and female agricultural
students according to their wish to get higher academic degree
………
5.1.22 Distribution of internet utilizing male and female agricultural
students according to their frequency of library use
………
5.1.23 Distribution of internet utilizing male and female agricultural
students according to their wish to serve in different areas
………
5.2.1 Experience of internet use of internet utilizing male and female
agricultural students
………
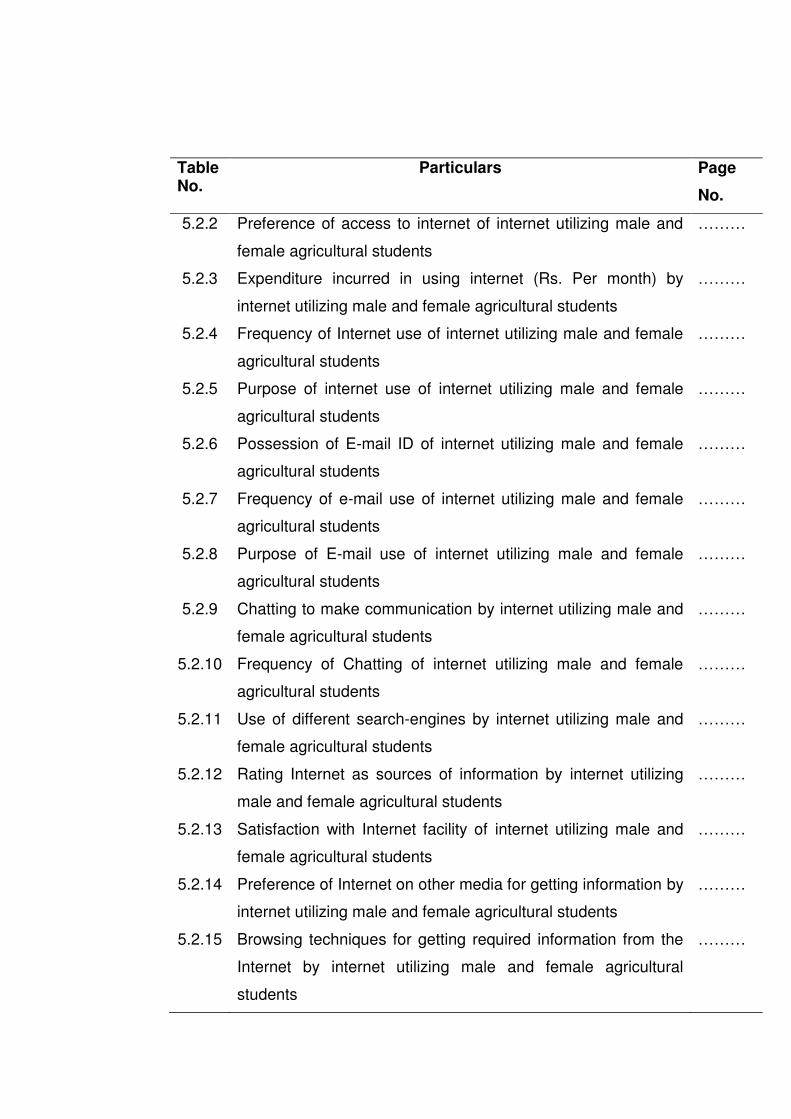
Table No.
Particulars
Page
No.
5.2.2 Preference of access to internet of internet utilizing male and
female agricultural students
………
5.2.3 Expenditure incurred in using internet (Rs. Per month) by
internet utilizing male and female agricultural students
………
5.2.4 Frequency of Internet use of internet utilizing male and female
agricultural students
………
5.2.5 Purpose of internet use of internet utilizing male and female
agricultural students
………
5.2.6 Possession of E-mail ID of internet utilizing male and female
agricultural students
………
5.2.7 Frequency of e-mail use of internet utilizing male and female
agricultural students
………
5.2.8 Purpose of E-mail use of internet utilizing male and female
agricultural students
………
5.2.9 Chatting to make communication by internet utilizing male and
female agricultural students
………
5.2.10 Frequency of Chatting of internet utilizing male and female
agricultural students
………
5.2.11 Use of different search-engines by internet utilizing male and
female agricultural students
………
5.2.12 Rating Internet as sources of information by internet utilizing
male and female agricultural students
………
5.2.13 Satisfaction with Internet facility of internet utilizing male and
female agricultural students
………
5.2.14 Preference of Internet on other media for getting information by
internet utilizing male and female agricultural students
………
5.2.15 Browsing techniques for getting required information from the
Internet by internet utilizing male and female agricultural
students
………
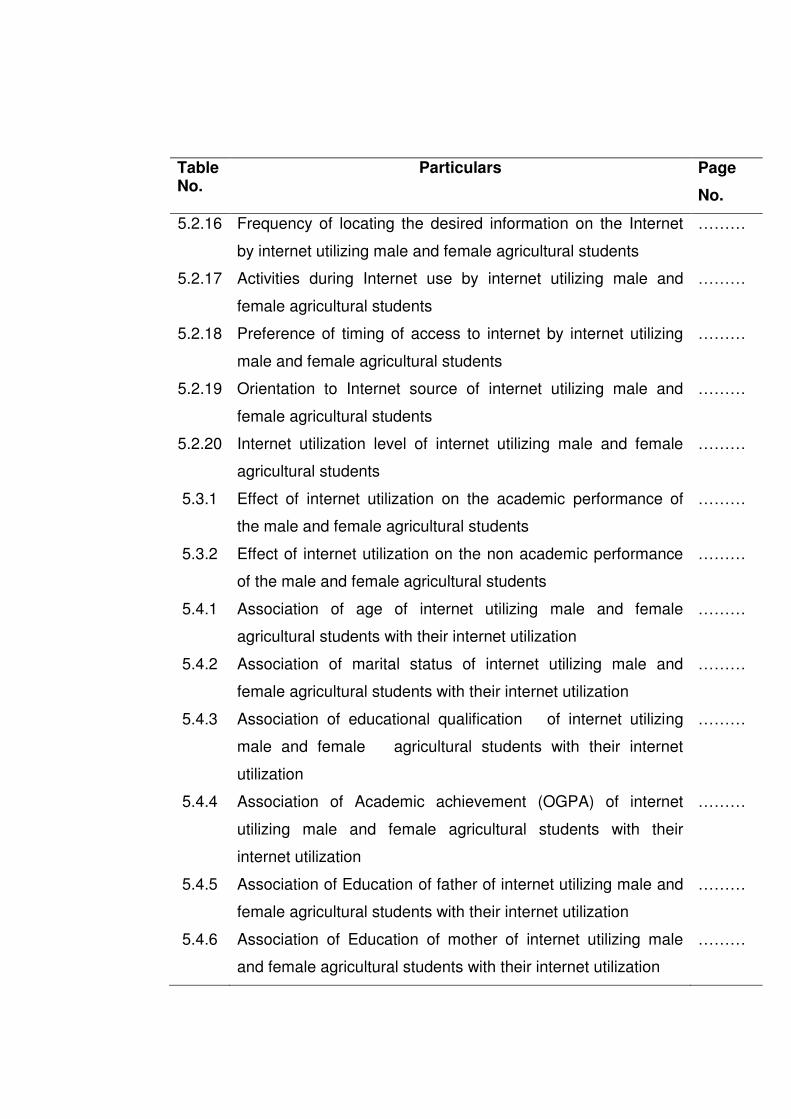
Table No.
Particulars
Page
No.
5.2.16 Frequency of locating the desired information on the Internet
by internet utilizing male and female agricultural students
………
5.2.17 Activities during Internet use by internet utilizing male and
female agricultural students
………
5.2.18 Preference of timing of access to internet by internet utilizing
male and female agricultural students
………
5.2.19 Orientation to Internet source of internet utilizing male and
female agricultural students
………
5.2.20 Internet utilization level of internet utilizing male and female
agricultural students
………
5.3.1 Effect of internet utilization on the academic performance of
the male and female agricultural students
………
5.3.2 Effect of internet utilization on the non academic performance
of the male and female agricultural students
………
5.4.1 Association of age of internet utilizing male and female
agricultural students with their internet utilization
………
5.4.2 Association of marital status of internet utilizing male and
female agricultural students with their internet utilization
………
5.4.3 Association of educational qualification of internet utilizing
male and female agricultural students with their internet
utilization
………
5.4.4 Association of Academic achievement (OGPA) of internet
utilizing male and female agricultural students with their
internet utilization
………
5.4.5 Association of Education of father of internet utilizing male and
female agricultural students with their internet utilization
………
5.4.6 Association of Education of mother of internet utilizing male
and female agricultural students with their internet utilization
………
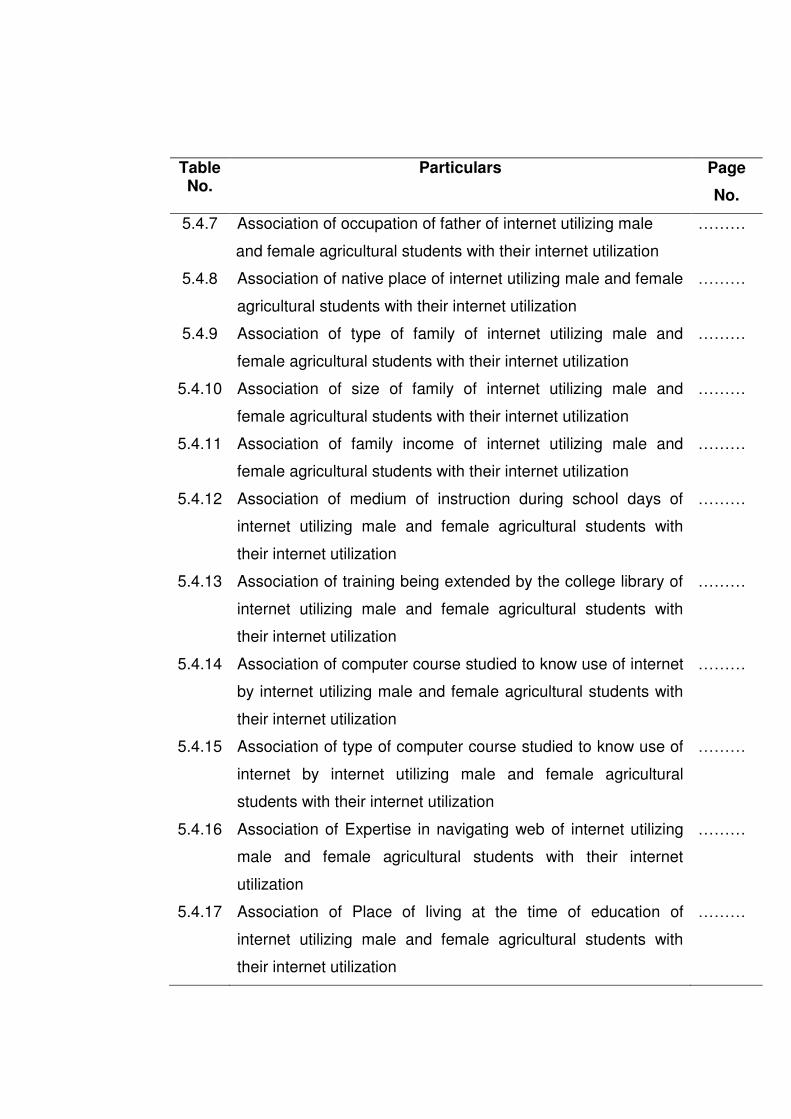
Table No.
Particulars
Page
No.
5.4.7 Association of occupation of father of internet utilizing male
and female agricultural students with their internet utilization
………
5.4.8 Association of native place of internet utilizing male and female
agricultural students with their internet utilization
………
5.4.9 Association of type of family of internet utilizing male and
female agricultural students with their internet utilization
………
5.4.10 Association of size of family of internet utilizing male and
female agricultural students with their internet utilization
………
5.4.11 Association of family income of internet utilizing male and
female agricultural students with their internet utilization
………
5.4.12 Association of medium of instruction during school days of
internet utilizing male and female agricultural students with
their internet utilization
………
5.4.13 Association of training being extended by the college library of
internet utilizing male and female agricultural students with
their internet utilization
………
5.4.14 Association of computer course studied to know use of internet
by internet utilizing male and female agricultural students with
their internet utilization
………
5.4.15 Association of type of computer course studied to know use of
internet by internet utilizing male and female agricultural
students with their internet utilization
………
5.4.16 Association of Expertise in navigating web of internet utilizing
male and female agricultural students with their internet
utilization
………
5.4.17 Association of Place of living at the time of education of
internet utilizing male and female agricultural students with
their internet utilization
………
Table No.
Particulars
Page
No.
5.4.18 Association of wish to migrate abroad of education of internet
utilizing male and female agricultural students with their
internet utilization
………
5.4.19 Association of wish to get higher academic degree of internet
utilizing male and female agricultural students with their
internet utilization
………
5.5.1 Physical constraints faced by the internet utilizing male and
female agricultural students
………
5.5.2 Technical constraints faced by the internet utilizing male and
female agricultural students
………
5.5.3 Economic constraints faced by the internet utilizing male and
female agricultural students
………
5.5.4 Operational constraints faced by the internet utilizing male and
female agricultural students
………
5.5.5 Psychological constraints faced by the internet utilizing male
and female agricultural students
………
L I S T O F F I G U R E S
Figure
No.
Particulars
Page
No.
3.1 Tentative paradigm of the study ………
4.1 Locale of study and selection of sample ………
5.1.1 Distribution of internet utilizing agricultural students according
to their gender
………
5.1.2 Distribution of internet utilizing male and female agricultural
students according to their age
………
5.1.3 Distribution of internet utilizing male and female agricultural
students according to their marital status
………
5.1.4 Distribution of internet utilizing male and female agricultural
students according to their educational qualification
………
5.1.5 Distribution of internet utilizing male and female agricultural
students according to their academic achievement (OGPA
obtained during last semester)
………
5.1.6 Distribution of internet utilizing male and female agricultural
students according to their fathers education
………
5.1.7 Distribution of internet utilizing male and female agricultural
students according to their mothers education
………
5.1.8 Distribution of internet utilizing male and female agricultural
students according to their fathers occupation
………
5.1.9 Distribution of internet utilizing male and female agricultural
students according to their native place
………
5.1.10 Distribution of internet utilizing male and female agricultural
students according to their type of family
………
5.1.11 Distribution of internet utilizing male and female agricultural
students according to their size of family
………
5.1.12 Distribution of internet utilizing male and female agricultural
students according to their family income (Rs. per month)
………
Figure
No.
Particulars
Page
No.
5.1.13 Distribution of internet utilizing male and female agricultural
students according to their medium of instruction during school
days
………
5.1.14 Distribution of internet utilizing male and female agricultural
students according to their exposure to extra – curricular
activities
………
5.1.15 Distribution of internet utilizing male and female agricultural
students according to their training being extended by the
college library as to how to use Internet
………
5.1.16 Distribution of internet utilizing male and female agricultural
students according to their study of any course, to know the
use of Internet
………
5.1.17 Distribution of internet utilizing male and female agricultural
students according to their type of course studied
………
5.1.18 Distribution of internet utilizing male and female agricultural
students according to their expertise in navigating the web
………
5.1.19 Distribution of internet utilizing male and female agricultural
students according to their place of living at the time of
education
………
5.1.20 Distribution of internet utilizing male and female agricultural
students according to their wish to migrate abroad
………
5.1.21 Distribution of internet utilizing male and female agricultural
students according to their wish to get higher academic degree
………
5.1.22 Distribution of internet utilizing male and female agricultural
students according to their frequency of library use
………
5.1.23 Distribution of internet utilizing male and female agricultural
students according to their wish to serve in different areas
………
5.2.1 Experience of internet use of internet utilizing male and female
agricultural students
………
Figure
No.
Particulars
Page
No.
5.2.2 Preference of access to internet of internet utilizing male and
female agricultural students
………
5.2.3 Expenditure incurred in using internet (Rs. Per month) by
internet utilizing male and female agricultural students
………
5.2.4 Frequency of Internet use of internet utilizing male and female
agricultural students
………
5.2.5 Purpose of internet use of internet utilizing male and female
agricultural students
………
5.2.6 Possession of E-mail ID of internet utilizing male and female
agricultural students
………
5.2.7 Frequency of e-mail use of internet utilizing male and female
agricultural students
………
5.2.8 Purpose of E-mail use of internet utilizing male and female
agricultural students
………
5.2.9 Chatting to make communication by internet utilizing male and
female agricultural students
………
5.2.10 Frequency of Chatting of internet utilizing male and female
agricultural students
………
5.2.11 Use of different search-engines by internet utilizing male and
female agricultural students
………
5.2.12 Rating Internet as sources of information by internet utilizing
male and female agricultural students
………
5.2.13 Satisfaction with Internet facility of internet utilizing male and
female agricultural students
………
5.2.14 Preference of Internet on other media for getting information by
internet utilizing male and female agricultural students
………
5.2.15 Browsing techniques for getting required information from the
Internet by internet utilizing male and female agricultural
students
………
Figure
No.
Particulars
Page
No.
5.2.16 Frequency of locating the desired information on the Internet
by internet utilizing male and female agricultural students
………
5.2.17 Activities during Internet use by internet utilizing male and
female agricultural students
………
5.2.18 Preference of timing of access to internet by internet utilizing
male and female agricultural students
………
5.2.19 Orientation to Internet source of internet utilizing male and
female agricultural students
………
5.2.20 Internet utilization level of internet utilizing male and female
agricultural students
………
5.3.1 Effect of internet utilization on the academic performance of
the male and female agricultural students
………
5.3.2 Effect of internet utilization on the non academic performance
of the male and female agricultural students
………
5.4.1 Factors associated with the internet utilization of agricultural
students
………
5.5.1 Physical constraints faced by the internet utilizing male and
female agricultural students
………
5.5.2 Technical constraints faced by the internet utilizing male and
female agricultural students
………
5.5.3 Economic constraints faced by the internet utilizing male and
female agricultural students
………
5.5.4 Operational constraints faced by the internet utilizing male and
female agricultural students
………
5.5.5 Psychological constraints faced by the internet utilizing male
and female agricultural students
………
L I S T O F A P P E N D I C E S
Appendix
No.
Particulars
Page
No.
I Covering letter sent to the experts ………
II Interview schedule
A. Personal and family characteristics of the agricultural
students
………
B. Internet utilization pattern of agricultural students ………
C. Effect of internet utilization on overall performance of
agricultural students
………
D. Constraints faced in internet utilization by agricultural
students
………
1 INTRODUCTION
Communication is crucial for social change by which alteration
occurs in the same structure and function of a social system. The 21st
century is witnessing a communication revolution with information
processing and retrieval which are being reliably done at incredible
speeds.
Encyclopedia Britannica defines communication as "The
exchange of meanings between individuals through a common system
of symbols". The word communication has been originated from the
Latin word "Communis" which means common, sharing of ideas,
information and feelings between individuals, so that a common
understanding is established between the person sending the
information and the person receiving the same. Therefore, a conscious
attempt to establish commonality is communication. Communication is
essential to all human associations. All type of developments be it the
personal development of individual or nation's development in any field
such as agriculture, industry, health, culture etc. depends mainly on the
success of communication. Communication can play a powerful role in
nation building and contributes significantly to bring about social change
in the desired direction.
The role of communication in development is not only to provide
information and create awareness among the public or society but to
implement the new ideas which cause change. Communication plays a
vital role in the diffusion of knowledge and new technologies but this can
be possible only when communication followed by appropriate media.
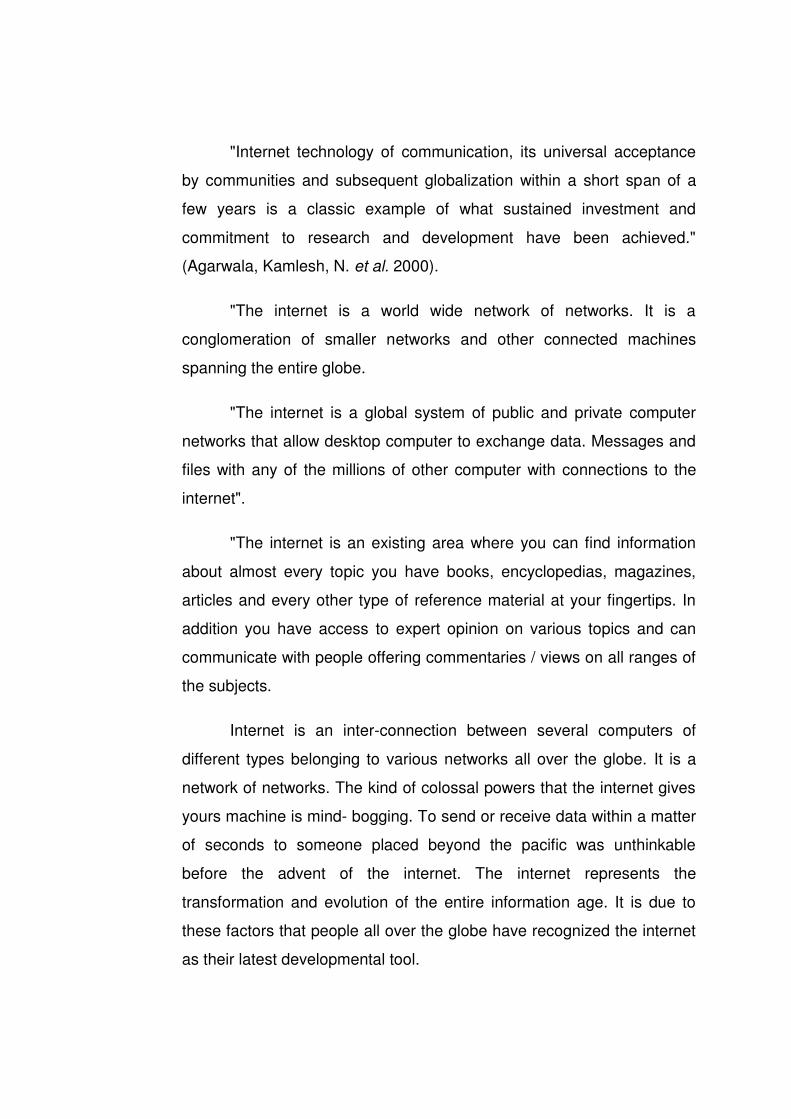
"Internet technology of communication, its universal acceptance
by communities and subsequent globalization within a short span of a
few years is a classic example of what sustained investment and
commitment to research and development have been achieved."
(Agarwala, Kamlesh, N. et al. 2000).
"The internet is a world wide network of networks. It is a
conglomeration of smaller networks and other connected machines
spanning the entire globe.
"The internet is a global system of public and private computer
networks that allow desktop computer to exchange data. Messages and
files with any of the millions of other computer with connections to the
internet".
"The internet is an existing area where you can find information
about almost every topic you have books, encyclopedias, magazines,
articles and every other type of reference material at your fingertips. In
addition you have access to expert opinion on various topics and can
communicate with people offering commentaries / views on all ranges of
the subjects.
Internet is an inter-connection between several computers of
different types belonging to various networks all over the globe. It is a
network of networks. The kind of colossal powers that the internet gives
yours machine is mind- bogging. To send or receive data within a matter
of seconds to someone placed beyond the pacific was unthinkable
before the advent of the internet. The internet represents the
transformation and evolution of the entire information age. It is due to
these factors that people all over the globe have recognized the internet
as their latest developmental tool.
"Internet" is one of the tool of communication. Internet has
changed life as a few things have done. It has added a new dimension
to our existence by placing within easy reach, mind boggling range of
information. It gives each of us the option to be as publisher of our
information and views, and as the number of people on internet multiply
and commerce transforms the internet, the opportunities are getting
larger.
In the era of networked information, Internet, the largest
worldwide network of networks, has emerged as the most powerful tool
for an instant access to information. Information is now just a „finger
touch‟ distance away from the user and it would not be inappropriate to
say that the Internet has become the biggest global digital information
library which provides the fastest access to the right kind of information
in nano-seconds of time to end-user at any time and at any place in the
world. The Internet has become the most extensively used information
source that empowers the average person to get in roaming with the
latest information. Today's users can no longer depend on conventional
information sources to cope with the latest developments in their
respective fields.
The internet offers many options for computer users to
communicate with others like chat, mail, telephone, browse special field
for references and so on. The imperative necessity is to mount intense
national as well as international efforts in the interest of achieving a
bright common future by using the internet technology for all humanity
on our planet. So, for this purpose there is a need to develop human
resources.
In India, the internet services were officially made available to
public from 15th August 1995 onwards through Videsh Sancher Nigam
limited (VSNL). Today there are many service providers offering internet
services. There are many ways by which you can communicate with
people on the internet.
The most common use of internet is electronic mail (e-mail). By
using e-mail a user can send text, pictures, sounds, programmes or
even movies to any other person anywhere in the world. With
introduction of www internet has become so popular in any research and
academic institution that it has billions of users today and the number is
increasing every day. There are a number of news group on the internet.
The messages sent to a news group are simply posted on the electronic
notice board. Anyone can see these messages.
Internet provides a tremendous wealth of information. There are
millions of computer programs and data that have been made available
to the users. These files may be text files, graphics files, sound files, full
motion video files or even program files. There are number of ways in
which you can obtain the desired information. World wide web (www) is
set of interconnected pages that represent specific web sites. These
web pages are rich in illustration, graphics and multimedia contents. File
Transfer Protocol (FTP) enables files to be downloaded from various
computer file servers and archives. Many hardware and software
manufactures, educational organizations and institutions have set up
FTP sites from which you can download software, instruction materials,
updates, etc. Hyper Text Transfer Protocol (HTTP) is the preferred
means of transferring hypertext documents over the internet.
Today in corporation and classroom in the US, Europe and even
Asia, the internet is becoming not just a prerequisite, reinforcement and
remedial learning tool; it is enabling many non-credit and credit course
and even full degree programmes to be offered entirely online. In India
today, institution like IGNOU, BITS Pilani, IIT Delhi and Kanpur have all
initiated new programmes using the internet for education and the
leading private sector computer training institutions like Aptech and NIIT
have demonstrated success in online education not just in India but
worldwide.
According to India broadband forum upto 31st March (2008), the number of
Internet users in Asia is 5,29,701,704. Though Asia has only 16% of populations of the
world, 37.6% of total internet users are Asian which is great. Of them around 60 million
are from India. India is 3rd
in Asia (1st is China (220 million) and 2nd is Japan (87.5
million)) and 4th in world ((1st is China (220 million), 2
nd is USA (216 million) and 3rd is
Japan (87.5 million)) as per as internet users are concerned. India has 13% of internet
users in Asia and 7.36% that of the world. But the sorrowful fact is only 5.3% of people
in India use internet. The reason of this is most of the people in India don‟t know
computer. 70% of people who know computer have used internet which is a healthy
sign.
In India 19-40 years age group is major section (85%) using internet in India.
85% of internet users in India are male which not a very good sign is. Among working
women, only 11% use internet. The ratio is almost half (6%) in case of non-working
women and even worst in case of house-wives (2%). The scenario is much better in
case of young men (33%). Also 15% older men, 14% school going kids and 21%
college students use internet in India. 46% of net users are graduate, 26% are post-
graduate. Among these, 2/3 rd of user use internet 2-3 times a week. 62% uses
internet from office as in most of the offices, it‟s free.
Mumbai has the maximum number of internet users (3.24 million) in India
followed by Delhi (2.66 million). The top ten cities where people use internets are
Mumbai, Delhi, Bangalore, Kolkata, Chennai, Pune, Hydrabad, Ahmedabad, Surat and
Nagpur. The total numbers of internet users of those 10 cities are 37% of the total
numbers of internet users in India.
Now take a look which types of sites majority of users browse. Most of the
users use net for emailing (95%) which is obvious. Next is job searching (73%)
showing crisis of getting job in India followed by chatting sites (62%), social networking
sites (51%) and quite interestingly mathematical sites (48%).
According to India broadband form (2008) The top ten sites internet users
browse in India are Yahoo, Google India, Google, Orkut, Rediff, Youtube, Blogger.com,
Windows Live, Rapid Share, Wikipedia .
Though internet ownership had seen growth of 32% as compared to 2007
which is a delighting fact, whereas, only 5.3% people used internet in India which is
very low. Most of the users were male (85%). The female percentage should increase.
Maximum number of users were from top 10 cities (37%). So, the internet usage in
rural areas is very less. Most of the users were male (85%).
According to the “India Online” study from Juxt Consult (2007).
Internet usage in India continues to grow at a slow but steady pace, both
in breadth and depth, with the overall internet-using population in urban
India reaching 30.32 million - a growth of 28% from April 2006 to April
2007. Of the 30.32 million urban internet users, 25.17 million (83%) log
on at least once a month; the balance of 5.15 million (17%) are
occasional users, according to the study. The penetration of the internet
among urban Indians stands at 9% now, assuming the total urban
population at 336 million, Juxt Consult said.
India as on September 2008, had 45.3 million active internet
users. This is according to the I-Cube [Internet in India] Study released
today and conducted annually by IMRB International and Internet and
Mobile Association of India [IAMAI]. Active internet users are those who
have used the internet at least once in the last one month – this is an
internationally accepted benchmark for enumerating internet users.
Urban users continue to dominate internet use contributing to
42 million of the 45 million odd users. In September last 2007, the
number of active internet users in urban India was 36 million showing
a year on year growth of less than 13 per cent. Commenting on the
study Dr. Subho Ray, president, IAMAI, said, “the growth rate was
alarming compared with the rest in past years as well as with some
other countries notably where the number of internet users are more
than 250 million”
The Internet revolution seems to be in full swing, but is India really plugged into
the global community it represents? Maybe yes, maybe no. As the Internet spins a web
of interconnectivity around the globe, as it grows literally by the hour, India is
struggling, not to catch up but to keep from falling further and further behind.
Inside India, things do seem to be improving. Five years ago there was limited
Internet access but only in a few major cities, all in the hands of the
government. VSNL, the agency responsible for Internet activities, and the DOT
(Department of Telecommunications) provided an agonizingly erratic connectivity, with
miserly bandwidth and far too few phone lines. Connection rates ran as low as 5% (for
every 20 dialups you might get connected once) and users were frequently cut off. And
the rates for this pathetic level of service were among the highest in the
world. Domestic users paid about $2 per hour, and lease lines, for the few companies
that could afford them, ranged over $2000 per month for a 64 Kpbs line. By the end of
1998, after three years of government monopoly, there were barely 150,000 Internet
connections in India.
Today (midyear 2000) the government monopoly is largely over. Dozens of
small to large Internet Service Providers have set up shop, triggering a price war and
an improvement of service. Users are now estimated at over 2 million, with a growth
predicted to reach 50 million in the next five years. Small Internet kiosks have set up
even in small towns, and the governments, both State and Central are pushing for
growth in the Internet sector. Internet is the new buzzword. The many small tutorial
colleges that pushed computer software courses of variable quality are now in a
hardsell scramble to push Net related content. The Internet represents the new wealth
frontier for the middle classes - a good salary and a clean job, and for a few, the
chance to go abroad.
The internet is clearly an ideal medium for delivering true learning
because it is based on an interconnected architecture that allows
communication and collaboration, can be enriched with multimedia
capability that enhances the learning experience. It enables true student
-centered learning by ensuring that:
Students learn the way that suits them best in environment of
anonymity.
Students control the content and pace and share perspectives
with peers and faculty.
Opportunities are provided for exploration.
Students get rehearsal time.
Student-to-student and faculty-to-student interaction is
enhanced.
To explore an enormous scope of using internet facilities in all
research and academic institutions students, research scholars can link
themselves to remote computer via the internet and gain access to the
data, information and programs stored on it and they can do almost
anything like sending and receiving messages, receiving news update
about specific events or topics, reading or copying information stored on
other computers, reading newspapers, magazines and newsletters,
downloading computer software, sharing of expensive hardware,
centralized administration of all computers, posting and reading public
messages to exchange news and information about certain topics or
area of interest.
The adoption of internet facilities into the research, education and
extension is to use the potential of the new information and
communication tools to revolutionize an outmoded NARS, to better
prepare students and scientists for the information age and accelerate
national development efforts.
Statement and problem of study
The Internet has emerged as a powerful educational tool. With
the increasing impact of information and communication technologies on
higher education, all those concerned with higher education are
attempting to grasp how ICT could help in modernizing the process of
teaching, learning and research. With the advent of the Internet,
following dilemma arise in higher educational system:
Learner is not dependent on teacher for interaction; and
Teachers can give lectures virtually to unknown learners.
So, in this era, teachers and students can carry forward their work
on the Internet in ways that are similar to and tightly intertwined with the
traditional ways that they learn, teach and study in libraries, classrooms,
laboratories, seminars, conferences, etc. The Internet can provide
access to essentially unlimited resources of information not
conventionally obtainable through other means.
Today, Agricultural colleges are playing an important role in imparting technical
education. The Agriculturist, who are the outcomes of these colleges, require the latest
and pinpointed information in their respective fields. Due to the high cost of Agricultural
information resources, developing countries cannot provide these resources to their
users. But the Internet with its advantages, make the way for the developing countries
to access information at a very low cost.
The ever increasing number of people accessing Internet coupled
with recent explosion of information resources on the Internet, may have
considerable implications for teaching, learning and research. Teachers
and students are depending more and more on the Internet for their
various educational purposes. The present survey is, therefore, an
attempt to assess the effectiveness of Internet as an educational tool,
and what role it actually plays in the educational system with special
reference to the Agricultural colleges in the state of Rajasthan.
The Internet is an inseparable part of today‟s Agricultural
educational system. Agricultural colleges invest a good deal of amount
on providing this facility to both the teachers and students. It is,
therefore, important to find out up-to what extent they are utilizing this
facility.
Internet use is a staple of college students‟ educational experience. They use
the internet to communicate with professors and classmates, to do research, and to
access library materials. For most college students the internet is a functional tool, one
that has greatly changed the way they interact with others and with information as they
go about their studies. The college experience is not only about learning in the
classroom, it is also about encountering as they do for their education. But just as they
use the internet to supplement the formal parts of their education, they go online to
enhance their social lives.
As Agricultural colleges provide Internet facility to both the
teachers and the students and expect them to utilize it for education
purposes, it is necessary to conduct a study to determine whether
Internet is used for academic activities and how the Internet has
influenced the academic efficiency of the target users. The study also
explores the satisfaction level of the users with the Internet facility
provided by the Agricultural colleges under study. The study has
particularly been taken up to assess the benefits of Internet over
conventional documents.
The study includes only those Agricultural colleges which are
engaged in imparting degree level courses in the field of Agricultural &
technology. The study is primarily concerned with the Agricultural
Looking to the spectacular scope of internet, the students and faculty of the
Swami Keshwanand Rajasthan Agricultural University, (SKRAU) have been providing
internet facility from 2001 onwards to perform triple function of teaching, research and
extension education in effective manner.
This facility for connecting students and faculties with each corner
of world reduce the time lag to a considerable extent. It helps
academicians, research workers and students to get quick solution of
their questions and queries. This facility makes possible to keep a live
contact among the scientists, academicians, research scholars and
students of the university globally.
The value and effectiveness of any communication system can be
judged through the assessment of involvement of its real users in it.
What are the opportunities and limitations of the internet as a tool for
education and how can it make a real difference to the development of
our great nation and how students are living in the future with today's
technology were provided the motivation.
The study of the personal characteristics of the respondents will
be helpful to enumerate the internet utilization pattern of the students.
The analysis of the internet utilization pattern of the agriculture students
will be helpful in providing the base-line for developing internet
technology programmes, whereas the findings related to the effect of
internet utilization on over all performance of the respondents and the
constraints encountered will be helpful for the implementers in selecting
the target group for implementing the programmes related to internet.
The results of this study may act as guidelines to the students,
educationists, policymakers and planners administrators, extension
workers, social scientists, teachers, academic institutions, parents and
other people who are engaged in the communication technology in one
way or the other.
Looking to all these aspects, a research project entitled as
“Internet Utilization Behaviour of Agricultural Students of Swami
Keshwanand Rajasthan Agricultural University, Bikaner”. was
undertaken with following specific objectives:
Objectives of the study
(i) To study the personal and family characteristics of the respondents.
(ii) To analyze the internet utilization pattern of the agricultural students.
(iii) To find out the effect of internet utilization on over all performance of the
agricultural students.
(iv) To study the factors associated with the internet utilization of agricultural
students.
(v) To identify the constraints faced in internet utilization by the agricultural
students.
Scope of the study
Despite the young age of the Internet, it has grown at an extremely rapid pace
due largely to how easily accessible it has become to users. Each day, something new
emerges via the Internet, whether it be a game, a user-created video, or a piece of
music that is shared with the world. Looking forward, it will continue to grow and it is
likely that today's innovations will be obsolete tomorrow. It is important for users and
providers, both of service and content, to be aware of what is happening. While certain
trends are apparent and intelligent speculation can lead to good ideas about where the
Internet is headed, the truth is that the future of the Internet remains unknown. Some
may consider this distressing, but most are probably excited at the thought, and
ultimately, at the possibilities.
Limitations of the study
Any human effort, however earnest it may be, is not devoid of limitations.
This research study is also no exception to this truth.
1. The present study has the usual limitations of the social science research.
2. The present study has obvious limit as regards to time, study area, sample
size, and other limited research facilities usually faced by a single student
investigator.
3. It also suffered from the usual limitation due to lack of precision and
accuracy, which is commonly found in the exploratory type of studies.
4. The present study restricted in selection of respondents from only SKRAU
Bikaner of Rajasthan state. Therefore the findings revealed from the present
study could not be generalized on a larger basis.
Layout of the thesis
Six chapters have been complied from presenting the details of the study. The
first chapter introduction includes the problem statement, objectives, scope and
limitations of the study. The second chapter review of literature helps in understanding
the past studies and experiences. The third chapter deals with theoretical orientation.
The fourth chapter gives the details of methodology. The fifth chapter highlights the
findings of the investigation and discussion on them. A brief summary and conclusion
of the dissertation have been presented in the sixth chapter followed by “bibliography”.
The „appendices‟ appear at the end of the thesis.
2 REVIEW OF LITERATURE
The chapter is devoted to review of literature relevant to the topic
of the study. An endeavor has been mode to present here a review of
studies or pertinent literature, which is likely to have direct learning on
this study. Keeping is view the objectives of the study the review has
been presented under following heads :-
2.1 Personal characteristics of the respondent
Loyd and Grossard (1984) found that females have lower
scores on computer related technology competencies than their
counterparts.
Zidon and Miller (1990) reported that weak relationship
between gender and with perception of computer use.
Singh and Singh (1991) reported that 18.40 per cent of the
women scientists were from villages, 23.32 per cent from towns,
20.86 per cent from small cities, 18.40 per cent from big cities
and 19.02 per cent from metropolitan cities.
Patel (1993) reported that majority (55.00 per cent) of the
research scientists had PhD degree.
Goh (1997) found that friends and family members were
the key influencing factors that encouraged the use of internet.
However, the high cost of computers and computer peripherals
was the main deterrent for non-users.
Goh et al. (1997), Lee (1997) and Pang (1997) identified
several factors that influenced the use of Internet in the Klang
Valley, namely, education, affordability, and the need for
infotainment. Education and a positive attitude toward IT were
necessary prerequisites for IT acculturation. In the three studies,
it was found that largely academicians and professionals used
Internet
Kosambi (1997) found that 48.65, 43.24, 6.10 and 59.45
per cent of girls had participated or membership in NSS and
NCC, extension club, student council respectively.
Lee (1997) found that 26.00 per cent of his respondents
did not have basic computer skills.
Mahipal and Prasad (1997) reflected that majority (66.10
per cent) of the subject matter specialists had rural and 30.90
per cent from urban background.
Pang (1997) noted that knowledge or communication
motivated the use of Internet among respondents.
Shashaani (1997) found that gender differences in internet
access and usage was high and in turn had influenced the
knowledge possession.
Richard C. Sherman et al. (1998) reported that when men
and women were statistically equated in terms of voluntary
activities (MUD, USENET, WWW, Chat Email) their attitudinal
differences were eliminated but their self-perceptions of
familiarity were not. The latter finding may reflect a cultural
stereotype of computer expertise as a male-specific quality. That
is, in judging their level of familiarity with computers, not men
and women may implicitly use a male comparison target.
Sherman et al. (1998) observed that men had significantly
higher levels of participation that women in familiarity and
interne activities.
James et al. (1999) reported that for teachers, Internet
technology can be considered a new form of expertise that is
being imposed upon or at least being integrated into, the
practice of teaching. Teachers, at all levels in their careers, are
encountering the demands of Internet technological expertise in
unique ways.

King and Martin (1999) indicated that internet has been a
male domain since its beginning. The gender gap in internet use
has narrowed in recent years but has not closed entirely.
Christian End (2000) examined gender differences in
internet use and investigated attitudinal correlates of Internet
experience over a year‟s time. The results suggested that the
internet gender gap may be narrowing but is still significant.
Implications are discussed for higher education, where the
curriculum necessitates the use of computers.
David (2000) reported that Edmonton public schools
strives to ensure that students were provided with a safe and
secure learning environment when engaged in educational
assignment importing Internet activities students use computers
for activities that 90 hand in hand with our understanding of what
constitutes a traditional childhood communicate and form
relationship as children always have.
Moreover, Laite (2000) surveyed 406 graduate and undergraduate students
from Shippensburg University. The survey showed that 57.6% of the undergraduate
students used the Internet 1-2 times per week and another 37.1% used it 1-2 times
daily. More than 50% of the graduate students used Internet 1-2 times per week and
37.7% used it 1-2 times daily. The survey showed that the most used Internet service
was e-mail. A hundred percent of the graduates and undergraduate students used e-
mail service.
Ruth (2000) reported that younger generation has sown
much internet towards internet communication and possessed
more knowledge pertaining to internet technology.
Sherif and Khan (2000) found that 53 per cent of the
respondents were males and the rest females. No gross
variation in time spent before the internet among boys and girls
was observed. This was found to be universally true as opposed
to the popular perception that girls spend less time on the
internet.
Sood (2000) reported that local language has a
predominant role in accessing information through internet and
many people use English to access the internet as most of the
websites are in English.
Anonymous (2001*) concluded that family income remains
an indicator of whether a person uses a computer or the
Internet. Individuals who live in high-income households are
more likely to be computer and Internet users than those who
live in low-income households. This relationship has held true in
each successive survey of computer and Internet use.
Anonymous (2001**) reported that in September 2001,
people living in each urban/rural category, non-central city
urban, central city urban, and rural had higher rates of Internet
use.
Anonymous (2001**) reported that rates of Internet use
show a similar pattern. Internet use rates climb steadily as age
increases for children through young adults, level off at relatively
high rates for people between ages 26 and 55, and then fall
among people at higher ages.
Jessic Donn et al. (2001) indicated several possible
explanations for graduate student‟s greater acceptance of
forming relationships on the internet. Graduate students, being
older and therefore closer to the age at which many people
marry, may have greater empathy for the desire to meet people,
and may also have difficulty in doing so through traditional
means, and so are more open to using other methods. A second
possible explanation of their findings in study was that graduate
students may already be somewhat accustomed to using the
internet for other purposes, such as making professional
contacts and doing research.
Anonymous (2002**) reported that college students find
out about the library‟s website from multiple sources, including
from their professors and teaching assistants (49%), by looking
it up themselves (45%), from classes about using the library
(34%) and from librarians (27%).
Bonk (2002) concluded that about 45.00 per cent of the
respondents had concerned with job related skill and computer
programming skill.
Bonk (2002) reported that nearly one fourth of the
participants were under age of 36, half were 36 to 50 years old
and slightly more than one quarter were over age 50 years
Bonk (2002) opined that 3.00 per cent of the Internet users had high school
diplomas, 8.00 per cent obtained some type of professional certification beyond high
school, 35.00 per cent possessed bachelor‟s degrees, 41.00 per cent had master‟s
degrees, 8.00 per cent had advanced degrees and remaining 5.00 per cent had earned
doctoral degree.
Catherine and Banji (2002) reported that 50.00 per cent of the academician
respondents working in university were at „Lecturer‟ grade while only 17.80 per cent
were below this grade. 96.40 per cent of the respondents had at least a Masters
degree, while in addition 32.10 per cent had Doctorates (Ph.D.'s). Those without
Masters degrees are mostly „Tutorial Fellows‟ and a few „Assistant Lecturers‟ 40.70 per
cent obtained their highest qualifications from Kenya and 33.30 per cent from Europe.
Further he reported that higher degree holder academician respondents working in
university tend to use the Internet more intensely because a large number obtained
their postgraduate qualifications in developed countries, where the use of computers
was entrenched within the institutions.
Curtis (2002) reported that the age of Internet user
respondents was quite varied ranges from 35 to 50 years the
most prevalent online skills learned were computer application
and software skills (64.00 per cent) as well as technical skills
(50.00 per cent)
Douglas and Thomas (2002) reported that at first glance,
the activity associated with the Internet project had a little time
giving direction and students were very active. Students were
very eager to help each other and teachers spent most of their
time facilitating student work students had many opportunities to
tell teachers what they had found and it was common to hear
teachers respond with comments such as “I didn‟t know that” But
most of the assignments offered students some degree of
choice, increasing their level of interest and providing the
opportunity to relate to their experiences.
John et al. (2002) revealed that 20 per cent of teachers
consider themselves well prepared to use technology in their
classes.
Krishnatray and Kulshrestha (2002) concluded that among the Internet Uses
College going boys and girls most of them were graduates and three per cent were
post graduates.
Murali (2002) studied that majority of Internet users were
under 35 years old male with a university education and high
income, urban based and English speaking.
Patel (2002) reported that only 17.00 per cent of the
respondents had low gain in knowledge, 65.00 per cent had
medium, while almost 18.00 per cent could gain knowledge by
viewing multimedia.
Sadiq et al. (2002) reported that as far as teachers
themselves are concerned, majority of them think that the
Internet has helped them in collecting updated material for
teaching in their courses, and that the Internet has enhanced
their knowledge as far as teaching and research interests are
concerned. They also believe that the Internet has facilitated in
improving curricula and teaching methods. But nevertheless
they do emphasize on the need for new methods to be
supplemental to traditional classroom teaching and not as a
replacement. Moreover, teachers who are strong with their
Internet usage skills are more likely to use Internet technologies
in course content preparation.
Anonymous (2003a) reported that to succeed in a web-
based course, students should be motivated and self discipline,
self reliance and self direction are the minimum required items to
complete the course work at a distance successfully through
Internet.
Anonymous (2003) suggested that to succeed in Web-
based courses, students should be motivated and self-directed.
The minimum required items to complete the course work at a
distance successfully are (1) Seriousness: Online classes aren't
for goof-offs who seek easy credits. Virtual students should
expect to spend at least as much time on homework as those in
traditional courses. (2) Self-Disciplined: It is up to students to
budget there time and keep up with assignments. They must
create and stick to their own schedules. (3) Self-reliance: The
ability to independently solve problems or research information
is needed. Questions can be answered by e-mail, but that takes
time. (4) Careful Reading Skills: Because classroom lectures are
replaced primarily by written words, students need to be careful
and slow-thoughtful readers and (5) Computer Skills: Students
must be comfortable using computers and the Internet that
includes e-mail, Web browsing, downloading and word
processing.
Patel and Patel (2003) concluded that Internet is a tool
having potential to contribute to agricultural development as one
can access to vast global information.
Ali (2004) reported that majority (89.30 per cent) of
respondents had graduate degree, 2.10 per cent had master
degree and 4.30 per cent had from other qualification.
Chauhan (2004) furnished that slightly more than half of
the Internet user students had small size of family.
Chauhan (2004) indicated that independents factors like
age, education; exposure in extra curricular activities and library
exposure were observed significant with Internet exposure of
college students. He further concluded that majority of the
Internet students had above 23 years of age (51.67 per cent),
first class academic performance (51.67 per cent), above SSC
level of education of their father (83.33 per cent), up to SSC or
more than that level education of their mother (70.00 per cent),
native place in rural area (51.66 per cent), nuclear and small
size of family (51.66 per cent), aspiration to go abroad either for
further study or for permanent settling (66.67 per cent), wish to
get higher academic degree (51.67 per cent), low level of
exposure of extra curricular activity and everyday exposure of
library ( 75.00 per cent).
Kalra (2004) reported that 75% of the internet users were
between the age groups of 15-25 years; among those 79.13%
users were males. And further among those, 68.25% were
students, 21.25% belonged to service class, 10.50% belongs to
business class.
Singh et al. (2004) reported that majority (80.00 per cent)
of them possessed B Sc Agri degree while, 20.00 per cent was
M sc Agri.
Chauhan (2005) concluded that academically less active
students were more active in computer and had less computer
nervousness.
Mishra et al. (2005) reported that the majority of students
(85.71%) use internet. Out of the internet users 67.71% were the
male students and 52.29% were the female students.
Patel and Chauhan (2005) reported that majority of the
internet user postgraduate students of Agriculture College were
studying in M.Sc, (Ag.) (65.00%). Majority of them had above 23
years of age (51.67%), first class (51.67%), above S.S.C. level
of education of their father (83.33%), up to S.S.C. or more than
that level education of their mother (70.00%), native place in
rural area (51.66%), nuclear and small size of family (51.66%),
aspiration to go abroad either for further study or for permanent
settling (66.67%), wish to get higher academic degree (51.67%),
low level of exposure of extra curricular activity and everyday
exposure of library (75.00%).
Patel and Chauhan (2005) reported that all most similar
level of Internet exposure was seen among the students who
wanted to have higher academic degree and those who did not
want higher academic degree.
Patel and Chauhan (2005) reported that the level of
Internet exposure among those postgraduate students was
observed better who had higher level of library exposure.
Parmar (2005) reported that majority (61.67 per cent) of
the agricultural scientists belonged to middle age group.
Shingare (2005) opined that less than half of the teachers
(43.20 per cent) had low participation in extra curricular
activities.
Brown and Baer (2006) examined the use of e-marketing
by small farms (n=300) in twelve states in Northeastern USA,
during April 2005. A majority of the farms surveyed had no
website for their business. Farms with websites generally had
higher levels of gross farm sales than did farms without
websites. A higher percentage of farms with websites earned
more than 75% of their household income from the farm than did
farms without websites. Respondents from farms with websites
generally had higher education levels than those not using a
website for their farm business. Farmers used a variety of
methods and personnel to develop their websites. Most websites
provide a way to email the farmer in addition to information on
products and the farm. A majority provided times of operation,
directions, and prices. More than 40% of the farms with websites
took orders over the internet for their products in 2004.
Luque-Martinez et. al. (2007) Observed modeling of usage
behaviour of new information technologies is of great utility to
managers who need to evaluate the probability of success in the
introduction of these technologies. The present study empirically
contrasts the capacity of Davis' Technology Acceptance Model
(MIS Quarterly (1989) 13(3), 319-340) to help understand the
determinants of the intention to use the Internet to search for
holiday information. Data for this study were obtained from a
questionnaire survey carried out in June 2004-June 2005 among
tourists (n=296) in Andalusia, Spain. The findings show that the
above theory does explain the intention to use the Internet on
the part of the tourist, but it should be expanded to take account
of the tourist's satisfaction with previous experiences of
searching for holiday information.
Taragola and Lierde (2007) presented at a conference in
Glasgow, the UK, from 2-5 July 2007 organized by the European
Federation for Information Technology in Agriculture, Food and
Environment. A survey was carried out in 2005 amongst 208
Flemish enterprises (64 growing greenhouse vegetables, 29
growing field vegetables, 62 growing ornamental crops, and 53
growing perennial crops such as fruit trees). Computers are
used by 189 enterprises (91% of total), and internet and email
by 174 (92%). Data are presented on relationships with personal
use of computers and internet, age, educational level, enterprise
size. Constraints limiting computer use and consequences of
low computer use are also discussed.
Boschetti et al. (2008) observed three-dimensional virtual
globes are radically changing the way geographic information is
perceived by the public. This article describes how NASA World
Wind, an open source virtual globe, is currently being used for
visualization of the MODIS burned area product. The procedures
adopted for converting the product into a format compatible with
World Wind, as well as the spatial generalization of these data at
different scales, are described. Directions to instructions on how
to obtain the MODIS burned area product visualization imagery
and use it in World Wind are included. This article highlights the
potential benefits of integrating the visualization capability of
virtual globes into the next generation of remotely sensed
product internet analysis and distribution systems.
Hunter et al. (2008) observed most weight-loss research
targets obese individuals who desire large weight reductions.
However, evaluation of weight-gain prevention in overweight
individuals is also critical as most Americans become obese as
a result of a gradual gain of 1-2 pounds per year over many
years. Method: This study evaluated the efficacy of an Internet-
based program for weight-loss and weight-gain prevention with a
two-group, prospective, randomized controlled trial. A military
medical research center with a population of 17 000 active-duty
military personnel supplied 446 overweight individuals (222 men;
224 women) with a mean age of 34 years and a mean BMI of
29. Recruitment and study participation occurred 2003-2005 and
data were analyzed in 2006. Participants were randomly
assigned to receive the 6-month behavioral Internet treatment
(BIT, n=227) or usual care (n=224). Change in body weight,
BMI, percent body fat, and waist circumference; presented as
group by time interactions, were measured. Results: After 6
months, completers who received BIT lost 1.3 kg while those
assigned to usual care gained 0.6 kg (F< sub>(df=366)</
sub>=24.17; I<0.001). Results were similar for the intention-to-
treat model. BIT participants also had significant changes in BMI
(-0.5 vs +0.2 kg/m2; F< sub>(df=366)</ sub>=24.58); percent
body fat (-0.4 vs +0.6%; F< sub>(df=366)</ sub>=10.45); and
waist circumference (-2.1 vs -0.4 cm; F< sub>(df=366)</
sub>=17.09); p<0.001 for all. Conclusions: Internet-based
weight-management interventions result in small amounts of
weight loss, prevent weight gain, and have potential for
widespread dissemination as a population health approach.
Masionyte and Zaltauskiene (2008) discussed the
computerization of the rural areas in Lithuania, particularly in the
households and in public services. Statistical information shows
that internet access is available in every fourth household in the
rural area. It is also most often used in the schools, libraries or at
public internet access points. Public services which have already
been automated are social insurance payments, customs
declaration, employment services, public libraries and the like.
Sanjiv-Sharma (2008) observed the challenges and
prospects relevant to the use of ICT [Information Communication
Technology] in the agricultural business sector in India are
discussed. The largest Internet-based initiative (e-choupal) in
rural India, which aims to empower small farmers with readily
accessible on-line knowledge and real-time linkage to world
markets, is highlighted.
2. Internet utilization pattern
Becker (1998) conducted a study on the Internet use by 2250 teachers from
public and private schools in the U.S. The study revealed that 90% of the teachers had
Internet access. More than half of the teachers (59%) had Internet access at home. A
majority of the teachers (68%) used Internet to find information resources for preparing
their lessons.
Dorothy et al. (1998) concluded that primary teachers use
ICT primarily to support classroom practice; secondary teachers
use it as much or more for professional development and
personal use as in the classroom. The teachers recognized a
range of benefits for pupils and for them; the overall perception
of the value of ICT among the teachers was positive. Further he
reported that that Internet was available in the majority of
secondary schools, the level of use of WWW and e-mail was
observed still relatively low. This is likely to be a combination of
lack of knowledge. The talent to use ICT effectively and
appropriately is essential to allow learners to acquire and exploit
information within every sphere of human activity.
Henry (1998) reported that a majority of teachers (68 per
cent) use the Internet in their effort to find information resources
for use in their lessons, and more than one-quarter of all
teachers report doing this on a weekly basis or more often (28
per cent ). Teachers who used the Internet in this way typically
have either home or classroom access. Both home and
classroom access were about equally related to use, and
teachers who have the combination of both home and classroom
access reported the most frequent use, with 46 per cent of such
teachers reporting weekly or more frequent use. It was also
seen that even among teachers with home and classroom
Internet access, more teachers reported only occasional use of
the Internet for lesson preparation than reported use of Internet
on at least a weekly basis. The areas of professional use of the
Internet by teachers were seen in case of e-mail with teachers
from other schools and publishing on the World Wide Web. Far
fewer teachers engaged in these types of communications than
use Internet as an information-gathering tool to obtain resources
for lesson preparation, only 16 per cent of teachers
communicated by e-mail with teachers from other schools as
often as five times during the school year. It was also seen that,
relatively few teachers have begun posting information,
suggestions, opinions or student work on the World Wide Web,
whereas relatively small per cent age of teachers, published
information on the Web.
Henry (1998) concluded that the teachers with less than
four years of teaching experience are slightly less likely than
other teachers to use the Internet with students. However, their
younger age makes them more comfortable with the Internet in
terms of their own use. Teachers under age 30 in their first few
years of teaching were the ones most likely to use the Internet
professionally and overall, teachers under 30 were also more
likely than older teachers to consider the Internet to be essential
teaching tool. Further same author concluded that teachers who
reported that their school provided them with their own computer
were more likely to believe that classroom Internet is essential to
teaching and was more likely to use the Internet as well.
Singh (1998) conducted a research study on the use of Internet by the
librarians in Malaysia. The main findings of the study indicated that 90% of the
respondents used the Internet for work related purposes. Most of the respondents were
recent users.
Becker (1999) reported that 24.00 per cent of teachers used Internet both at
home and classroom followed by 35.00 per cent at home, and 26.00 per cent had not
using Internet at any place. Only 15.00 per cent of them use Internet in the classroom.
Becky et al. (1999) reported that most teachers indicated that
professional development activities were available to them on a number
of topics on Internet. Teachers who spent more time in professional
development on Internet reported feeling better prepared than their
colleagues. The one-third of teachers reported feeling well prepared or
very well prepared to use computers and the Internet for classroom
instruction, with less experienced teachers indicating they felt better
prepared to use technology than their more experienced colleagues.
Bavakutty and Salih (1999) conducted a study at Calicut University, which
showed that students, research scholars, and teachers used the Internet for the
purpose of study, research and teaching respectively. The purposes of Internet use
were: sending and receiving e-mails in connection with academic requirements, making
a search on library catalogues, downloading images and communication with the peer.
Cassandra (1999) reported that when teachers were asked the degree to
which they used computers or the Internet to prepare for and manage their classes.
Thirty-nine per cent of public school teachers with access to computers or the Internet
in their classroom or elsewhere indicated they used computers or the Internet a lot to
create instructional materials, and 34 per cent reported using computers a lot for
administrative record keeping.
George et al. (1999) reported that Teachers were already using Internet
technology in a variety of ways for Internet research and to access current events or
archived information, such as from CNN or other media sites.
Kooganurmath and Jange (1999) conducted a study, which revealed that a
majority of the users used the Internet for communication, followed by the access to
information. More than 70% of the users used it for higher studies and only 39% used it
for discussions with peer groups. The most used services of Internet were e-mail, the
Web, discussion forums, FTP and Telnet.
A study conducted by Mahajan and Patil (1999) revealed that the purpose of
using Internet by research workers at Pune University was to conduct literature search;
for students was to know curriculum based information; for teachers to find supporting
information to write articles.
Neil Marriott et al. (1999) reported that e-mail and internet use
was frequent. International students were found to use the University's
ICT provision more than home students, but this was mainly due to e-
mail and internet uses. One reason was that international students could
keep in touch with friends and family via the e-mail and use the internet
to access 'home' news and current affairs.
Sharma and Chauhan (1999) and Jagdeeshwara (1994) observed significant
relationship between mass media exposure and modernization.
Voorbij (1999) examined the use of the Internet amongst students and
academicians in the Netherlands. A questionnaire was distributed among 1000
members of the academic community and three focus-group interviews were also held
with faculty members. The study revealed that the Web was being used primarily to
search general, factual, ephemeral or very specific information. The study also
revealed that students and academicians faced many problems while searching the
Web.
Williams (1999) reported the use of information technology and the Internet in
his project entitled "Information Technology in Michigan: Adult and Teen Survey
Report." The results indicated that the majority of the respondents (72%) used the
Internet at least once a week and 45% at least once a day.
Amritpal Kaur (2000) conducted a survey regarding the use of Internet facility
at the Guru Nanak Dev University, Amritsar. The study indicated that all respondents
used Internet for sending e-mail and 82% for Web. More than 60% of the respondents
used Internet for primary information. 38% for secondary and only 15% used it for
consulting OPACs. A majority of the respondents i.e. 75.6% faced the problem of slow
Internet connectivity. All respondents used search engines to browse the required
information. More than one third of the respondents typed the web address directly and
only 1.5% used subscription databases. The results of the study further showed that
more than 80% of the respondents felt that in comparison to traditional documents,
Internet was time saving, easy to use, more informative, more useful and more
preferred.
Chandran (2000) conducted a study at S V University, Tirupathi, which showed
that more than 25% of the respondents used the Internet for 2-3 times a week and
more than 56% used it for accessing information. A majority of the respondents used
the Web and e-mail services of Internet. The purposes of using Internet included
communication and information gathering. The sources used for identifying information
about Internet included website itself, journals and magazines, staff and newspapers. A
majority of the respondents used general websites as compared to recreational and
discipline oriented websites.
Naushad Ali (2000) conducted a study at Aligarh Muslim University, Aligarh.
The study showed that more than 50% of the study population was satisfied regarding
the timings of the Internet service, but were not satisfied with staff‟s cooperation, and
reservation facility. Majority of the respondents were not happy with the number of
nodes available.
Kanaujia and Satyanarayana (2003) conducted a study of the Science &
Technology community of Lucknow city to assess the level of awareness and demand
of web based learning environment among Science & Technology information seekers.
The major findings of the study revealed that 49.2% users browsed the Web for more
than 2 to 4 hours and 14% for more than 5 hours a day. The study further showed that
36.6% users consulted e-journals regularly on the Internet, 40.4% used Internet for
consulting technical reports, 24.8% to find online databases and 10.4% for telnet
service.
Chi-Cheng Chang (2001) reported that 57% of the internet users
tend to browse internet for more hours.
Anonymous (2002) reported on the results of a survey of UMass
Amberst freshmen and sophomores about their exposure to course-
based instructional technologies, including e-mail, course websites, the
internet, video, computer- generated displays, and computerized quiz
and response systems. Students were also asked about their interest in
online courses. The survey found e-mail is commonly used for
communication between professors and students, course websites and
required internet research are also fairly common, students tend to be
exposed to course-based interactive technologies less frequently and
student interest in taking online courses is mixed; few have actually
taken such a course.
Anonymous (2002) found that e-mail is by enlarge the most
common internet activity, with 90 per cent of all internet users claiming to
be e-mailers. The most widespread use of the internet today is as an
information search utility for products travel, hobbies, and general
information.
Anonymous (2002**) reported that three further of the internet
user students agree completely that they are successful at finding the
information they need for courses and assignments. The first choice web
resources for most of their assignments are search engines gooogle and
Alta vista (42 per cent), Web portals like Yahoo, Msn (20 per cent),
course specific websites (12 per cent) and campus library website (11
per cent).
Anonymous (2002) reported that information technology has been
one of the most aspired fields in today‟s world integrating IT with
agriculture will help any country to regulate its overall economy and
trade. The different IT technologies like expert system in decision
support system. Remote sensing, Gyandoot etc. have brought revolution
in Indian agriculture, even corporate like ITC MSSL and HLL are now
looking forward to extract huge benefits out of this collaboration of IT
with agriculture.
Anonymous (2002) reported that seven in ten students used the
campus library website for at least some of their assignment and one-in
five used it for most assignments college student find out about the
library‟s website from multiple sources, including from their professors
and teaching assistants (49 percent), by looking it up themselves (45
percent) from classes about using the library (34 percent) and from
libraries (27 percent). Among the students who did not use the campus
library‟s website some (20 percent) did not know the library had a site,
and some (29 percent) said it didn‟t have what they need, but less than
half (43 percent) left other sites have better information, During their
most recent electronic visit, most used full taxes of journal articles (67
percent) databases ad journal indexes (51 percent) and electrum books
(21 percent) Few college students used any “Ask-a-librarian” services.
Nearly 9 out of 10 students (89 percent) also use the campus library‟s
print resources including books journals articles and encyclopedias. In
addition to using the library‟s print resources they made photocopies
from print resources and even print copies of electronic resources.
Bonk (2002) opined that most of the respondents (60.00 per cent) were using
web-based learning as an alternative to instructor led-course.
Catherine and Banji (2002) reported that academician
respondents offered several reasons for using or wanting to use the
computer or Internet. The first reason was the email followed by for
academic research, teaching materials, current Affairs, networking with
peers, publishing work in progress, entertainment (sport) and e-
commerce. Many respondents, especially those who had studied abroad
offered that exposure to the convenience of the Internet for academic
discourse or simply social interactions encouraged them to seek access
though sometimes costly and also though communal means. The need
to keep in touch with colleagues and friends overseas on return also
encourages the use of ICTs. Some have initiated collaborative research
through connections overseas and this has enhanced their use of the
Internet and the new ICTs in general. In Nigeria, 12.90 per cent of
academician computer users had their first experience with computers
abroad, 8.8 per cent in their homes and 19.10 per cent in their
institutions. They observed that 66.90 per cent of the respondents used
computers for e-mail/Internet. In Kenya, 90.70 per cent of the
academician respondents used the Internet for the last 1-5 years
spending on average 1-2 hours per day. He furthers disclosed that
academician respondents using Internet working in university were in the
31-40 age group followed by the 41-50 age group.
Kim Deok (2002) explored that 53.90% of internet users used it
connected in cybercafes, followed by 27.85% at home and 18.25% in
the offices.
Kapoor (2002) stated that e-learning provides-a) a education to everybody, b)
quality education, c) online books/ literature facility, d) online consultation session, e)
online examination and f) admission for all and at any place and g) practice based
learning.
Krishnatray and Kuilshrestha (2002) concluded that the respondents main
reasons for accessing the internet were to search for educational information (both
related to the syllabus and not related to syllabus), look for product information and for
business information. The respondents accessed the internet in a large way to keep a
track of advances in their fields of interest. Among the more personal reasons for
accessing are the e-mail, downloading software and for news. E-mail ws widely
preferred medium for sending messages with nearly 54 per cent of the respondents
listing it as their first choice. Around 40 per cent of the respondents send and receive
between 6-10 emails a week. Nearly 58 per cent of the respondents use the internet for
1 hour in a day. 40 per cent use the Net for anywhere between 1-3 hours in a day.
Krishnatray and Kulshrestha (2002) concluded that among Internet User
College going boys and girls 70.00 per cent of them had experience of three years.
90.00 per cent of the respondents accessed the net at cyber cafes.
Maniar (2002) reported that majority of the internet users had preferred
afternoon hours to access internet, spent about 1-2hours and also said that they were
using internet technology for the last two years and majority of them had changed their
information acquisition habits.
Myriam (2002) reported that among the Internet user academicians, 39.00 per
cent of the Brazilian respondents surfaced the Internet for the first time before 1995,
approximately one-fifth of the respondents began in 1995 and almost the same number
in 1996. Only one reported having started in 2000. A similar result was obtained when
they were asked since when they have started accessing the Internet: 37.00 per cent
stated before 1995, 18.00 per cent in 1995, 16.00 per cent in 1996, 12.00 per cent in
1997 and 13.00 per cent in 1998. In the qualitative section, 11 out of the 25
interviewees have had accessed Internet since 1995 or earlier, a large number which
matches approximately that of the questionnaire. Four started in 1996, only two in
1997, four in 1998 and the rest did not specify.
Sharma (2002) reported that most (37.14%) of the respondents were observed
in the medium level of internet utilization followed by low (35.00%), and high (27.86%)
level of internet utilization from overall college/ universities. Majority (37.14%) of the
respondents from overall college/ university and individual college/ university were
observed under low level of internet utilization pattern index followed by, medium
(33.53%) and high level (29.29%).
World Bank (2002) reported that ICT holds out the opportunity to revolutionize
pedagogical methods, expand access to quality education, and improve the
management of education systems.
Iroha (2003) concluded that slightly more than two fifth (22.50 per cent} of the
teachers attended a workshop/seminar on ICT.
Nicholas et al. (2003) conducted a study in the UK to examine the use of the
web for health information and advice. More than 1300 people were surveyed. The
study showed that 66% of the respondents accessed the Internet from home, 28% from
work place and the remainder (6%) used a combination of both work place and home.
Teresa et al. (2003) indicated that students were responded most comfortable
seeking information from a search engine, with 91.45 per cent selecting “very
comfortable” or comfortable. The search engine receiving the most frequent mention
was www.google.com.
Anonymous (2004*) revealed that two additional areas of professional usages
of the Internet were observed by teachers viz., sending or receiving e-mail to or from
the teachers of other schools and publishing literature on the World Wide Web. Far
fewer teachers engaged used Internet as an information-gathering tool to obtain
resources for lesson preparation, only 16.00 per cent of teachers communicated by e-
mail with teachers from other schools as often as five times during the school year.
However, classroom access to the Internet may make a difference in whether they use
e-mail for professional purposes. Teachers with Internet access at home and in their
classroom were more than three times as likely to e-mail teachers at other schools as
teachers who had only home Internet access (33.00 per cent vs. 9.00 per cent).
Anonymous (2004***) opined that majority (70.00 per cent) of the respondents
had 1-3 years of experiences of using Internet and almost 90.00 per cent were familiar
to excellent level of competences.
Anonymous (2004**) reported that 46.00 per cent of teachers reported weekly
or more frequent use of Internet. Of course, it was observed that teachers who wanted
to use the Internet accessed it either at home or classroom. Despite these findings, it is
also true that even among teachers with home and classroom Internet access, more
teachers reported only "occasional" use of the Internet for lesson preparation than used
it on at least a weekly basis. E-mail was widely preferred medium for sending
messages with nearly 54.00 per cent of the respondents listing it as their first choice.
Around 40.00 per cent of them sent and received 6 to 10 e-mails in a week; nearly
58.00 per cent of the respondents used the Internet for one hour in a day.
Hanauer et al. (2004) surveyed a diverse community college to assess the use
of the Internet by the students for health-related information. The survey showed that
although all the students surveyed had free Internet access through their community
college, yet only 97% of the students reported having access to the Internet. The
survey showed that 83% Internet users had access to the Internet at their home and
51% of the respondents accessed Internet at college or library. Eighty-one percent of
the students reported to access the Internet most for college work
Kalra (2004) reported that 90 per cent users were internet for e-mail purposes.
And 47 per cent of them receive and send e-mail every day. About 3 out of 4 users
were chatting on the net following by surfing, playing games and listening music. And
further, 51.50 per cent of the users were visiting the cybercafé daily and 45.25 per cent
were visiting it weekly and 6.25 per cent only were monthly visitors.
Patel (2004) concluded that little less than half (43.55 per cent) of the
information expecting respondents were having high level of mass media exposure.
However, 33.06 per cent of them had low and medium exposure to mass media,
respectively.
Patel (2004) observed that majority of the students had
everyday exposure of Internet (53.33 per cent) and they were
possessed at least one or more e-mail ID (81.66 per cent). Exactly
half of them (50.00 per cent) had more than three years of exposure
of Internet with everyday to at least once in a month contact of
chatting facility of Internet. More than one third (35.00 per cent)
were using e-mail facility at list twice in a week to receive or send
mails. Major sources of Internet utilized by them were library or
private cyber café, www.google.com and www.yahoo.com were the
main search engines utilized by users to connect themselves with
useful sites.
Chauhan (2005) opined that majority (63.00 per cent) of the interest expecting
respondents expected to use Internet daily, 78.00 per cent of them expected to use
Internet by their own, while 22.00 per cent of them projected to use Internet with the
help of others, if Internet is provided to them at community Internet centre. The major
purposes of Internet use expressed by highest respondents were to exchange
information, to collect information, chatting with relatives and for entertainment.
Mishra, Yadav and Bisht (2005) conducted a study to know Internet utilization
pattern of the undergraduate students of G B Pant University of Agriculture and
Technology, Pantnagar. The findings of the study indicated that a majority of the
students (85.7%) used the Internet. Out of the Internet users 67.7% were male
students and 32.3% female students. The findings of the study also showed that 61.5%
of the males and 51.6% of the females used Internet for preparing assignments. A
majority of the respondents i.e. 83.1% male and 61.3% female respondents indicated
that they faced the problem of slow functioning of Internet connection.
Mishra et al. (2005) reported that majority (36.46%) of the
students used internet once in a week, followed by once in a
fortnight (16.67%), once is a month (16.67%), occasionally (16.67%),
daily (13.45%). Most preferred places for internet access were,
87.69 per cent of the male students used internet in cybercafé,
followed by 6.15 per cent in college and 6.15 per cent at home, on
the other hand 83.87 per cent female students go to cybercafé to
use internet, followed by 9.68 per cent at home and 6.45 per cent in
college.
Patel (2005) reported that nearly two- third (64.00 per cent) of the
respondents were having medium level of media exposure, followed by
20.00 per cent with low and 6.00 per cent with high level of mass media
exposure.
Patel and Chauhan (2005) observed that majority of the
postgraduate students had everyday exposure of internet (53.33%) and
they were possessed at least one or more e-mails ID (81.66%). Exactly
half of them (50.00%) had more than three years of exposure of Internet
with everyday to at list once in a month contact of chatting facility of
internet. More than one third (35%) were using e-mail facility at list twice
in a week to receive or send mails.
Patel and Chauhan (2005) reported that best three uses on Internet made by
research scholars were to collect information for research reference, to send e-mail
and to collect information for class note. In addition to this, they also used Internet to
collect information for carrier development, to collect information to attend seminar, to
develop own web site, to collect information for abroad study, for entertainment, to
send application for job, to send information for publication in journals, to satisfy
curiosity, chatting and just to pass time.
Steve and Comille (2005) concluded that college faculties were active users of
the Internet. Majority (60 per cent) of the respondents used the Internet from 4 to19
hours per week, another 40 per cent reported being online for 20 or more hours,
approximately three hours or more per week or three or more hours per day. College
faculty has logged many years online. Over four–fifths (82 per cent) of college faculty
respondents reported having used e–mail from six to fifteen years. Fewer than five per
cent of the respondents over 55 years of age used e–mail for five years or less. Some
92 per cent reported accessing e–mail at home and 89 per cent access it at work. Yet,
a significant number, one in five, reported using public locations like labs or Internet
cafes for e–mailing. He also reported that age seemed to play a role in faculty
members‟ use and experience of the Internet. Interestingly, age correlated with the
sense of the Internet‟s positive impact: the older the faculty member, the more highly
he or she regarded the Internet‟s impact.
Nogueira Terrones et. al. (2006) showed that training duration seemed to be
the most important feature in determining the level of performance of assessors
remotely trained over the Internet.
Patel (2006) reported that majority (61.67 per cent) of the opinion contributor
teachers towards the use of multimedia in agricultural education had above two years
of experience of Internet exposure, followed by 28.33 per cent with up to two years and
only 10.00 per cent without experience of Internet exposure. She also concluded that
more than half (55.00 per cent) of the opinion contributor teachers towards the use of
multimedia in agricultural education had above four years of experience of computer
exposure, followed by 28.33 per cent with up to 2 years and 16.64 per cent with above
2 to 4 years of experience about exposure of computer.
Kumar et al. (2007) determined the various aspects of internet utilization
patterns of veterinary students from the Acharya N.G Ranga Agricultural University in
Andhra Pradesh, India. Results showed that only a small number of students owned
computers at home and cyber cafes were the most common place to access the
internet. The frequency of use was only once a week, usually in evening, and the cost
is around Rs. 51-100 per month. Results also revealed that majority of the students
preferred Google and Yahoo search engines for class assignments and research work.
Most of the students expressed that e-mailing and the abundance of information
available as major positive aspects, and viruses and hackers as major negative
aspects of internet use. Slow functioning was the major problem faced by the students
during the use of internet and eye pain was the major complaint of majority of the
students.
Wu-Jia Gang et al. (2007) determined internet use and internet addiction
disorder (IAD) in Guangzhou city, China and to analyze the relationship between IAD
and other risky health behaviours. Questionnaires were used to investigate 3800
students in 16 schools. These students were chosen by layered multistage random
sampling from 6 schools. IAD was determined according to a standard established by
specialists. The percentage of IAD was 12.7% in youngsters of Guangzhou city, with
the highest percentage in technical secondary schools (15.6%) and the lowest in key
junior high schools (9.5%). IAD in male (14.4%) was higher than in female (11.1%). In
all kinds of reasons for using the internet, recreational motive was chosen by most
students. The motive of 72.8% students who used the internet was to chat. 71.6%
students used it for multimedia amusement. Practical motives were also considered,
such as to collect information and news. In IAD students, recreational reasons were
predominant. IAD could promote some risky health behaviours, such as smoking,
drinking, unhealthy mentality, suicide, drug abuse, gambling, looking on erotic
publication, sexual behaviour, and so on. All OR< sub>MH</ sub> values were >2 at
P<0.001. Results show that the percentage of youngsters with IAD in Guangzhou city
is similar to other areas of the country. Recreational motive is an important cause of
IAD. IAD can increase health risks among students and something must be done to
supervise the behaviours of using the internet among youngsters.
Ahmed et al. (2008) observed the patterns of use of the Internet by a
questionnaire survey of 102 hospital doctors and 123 medical students in Khartoum,
Sudan, in January 2005. More doctors (84.3%) had used the Internet than had
students (78.9%). Half of consultants (55.0%) used the Internet daily, compared with
only 18.2% of junior doctors. Many consultants and junior doctors rated their abilities as
poor (60.0% and 53.1%). One-third of students (33.3%) used the Internet only for
personal and not for academic purposes. Barriers to greater use of the Internet by
doctors included: time constraints (80.2%), poor skills (54.6%), no access to full texts of
journal articles (53.4%), difficulty in verifying the quality of information (47.6%) and high
costs (41.8%). Students faced similar barriers but also listed poor knowledge of the
English language.
3. Effect of internet use on over all performance
Goldberg (1996) supported that student who were taught using
both traditional method and internet performed better than those who
were only exposed to the traditional methods.
Moore and Kearsley (1996) have acknowledged that most
distance education learners want some kind of interaction with their
instructor and fellow learners during an educational event. This may be
for purely social reasons or for getting feedback on their ideas and
questions. In traditional distance classroom learning environments, e-
mail, fax, telephone and mail all offer methods to connect with the
instructor and other learners.
James (1997) reported that the information age and its supporting
technologies such as the internet and other digital tools, has enabled
work and learning to occur during time periods and in locations based
upon individual needs. With millions of internet subscribers using e-mail
and the world wide web (WWW), the internet is now considered a mass
media. Individuals may soon consider such electronic connectivity as
essential in daily living.
Richard C. Sherman (1997) reported that the world wide web
(WWW) is an exciting new tool for teaching college courses in
psychology. The potential benefits of the WWW stem from the wealth of
information it makes available to instructors and students, the ease of
access to that information, and the “hypermedia” richness of WWW
documents.
Scherer (1997) mentioned that very small (8.25 per cent) of the
internet users perceived their online use to have a negative impact on
their lives.
Hussein and Jefferys (1998) explained that the benefits of internet
included its multi-faceted and collaborative approach to education.
Internet effectively overcomes the barriers of time, location, the linearity
of learning process and communication with the tutors. It can provide a
holistic approach to learning by enabling the students and faculty to
make available their projects, writings and curriculum materials in a
mutually beneficial manner, which is either achieved with difficulty or
unpractical in the traditional style of teaching.
Patnaik and Saravanan (1999) reported that the rapid spread of computer
network flourishing computer software industries, the liberal approach towards the
internet subscribers and government‟s the liberal approach towards the internet
subscribers and government‟s enhanced support for the development of IT and
communication infrastructure in the factors responsible for growth of internet in India.
Anderson (2000) reported that small group of students primarily
men in the hard sciences use the internet to the degree that it has a
negative impact on their academic or social lives
Gagnon and Krovi (2000) investigated that internet related training does have a
dramatically positive influence on the use of the internet along with the larger
departments with greater resources and the presence of faculty within the department
are the factors that can encourage internet usage.
James and Drik (2000) highlighted that triggered by the internet,
continuing adult education may well become the greatest growth
industry in the near future.
Raymond (2000) indicated that the present Hong Kong education
stakeholders were quite familiar with using Internet technology. The skill competency
level, technology infrastructure and social acceptance were quite mature. These have
already laid a good foundation for the growth of Internet learning. Using Internet for
learning creates an impression of state-of-art technology and innovative
learning style. This will have some positive effect in raising the
university‟s status.
Singh (2000) explored that education in India is entering a new
phase with many important institutions exercising the option of offering
information about themselves on net which gives prospective students
the advantage of acquiring the relevant information about universities
and training institutions without spending too much time, energy and
money.
Agnihotri (2001) emphasized that the educational sector and
private schools, big coaching centres have come up as major purchaser
of internet accessibility.
Andrew Trotter (2002) reported that internet access has a
measurable impact on student achievement. The researchers
specifically looked at the impact of the federal Education (E) rate
program, a program designed to help schools acquire
telecommunications services. Though the results do not indicate that
internet investment has made an impact, critics of the study suggest that
not only is it too early to make this kind of assessment, but that internet
connections alone are not likely to improve student test-scores.
Nevertheless, the study serves as a “first crack” at trying to determine if
this link between internet connections and student achievement can be
made and it provide some interesting conclusions.
Jones (2002) reported that nearly four-fifths of college students
(79 per cent) agree that internet use has had a positive impact on their
college academic experience. Almost half (46 per cent) of college
students agree that e-mail enables them to express ideas to a professor
that they would not have expressed in class. Two – thirds (68%) of
college students reported subscribing to one or more academic –
oriented mailing lists that relate to their studies. Nearly three – quarters
(73 per cent) of college students say they use the internet more than the

library, while only 9 per cent said they use the library more than the
internet for information searching.
Jones (2002) explained that 42 per cent of the college students
used internet primarily to communicate socially. And 72 per cent of the
students say most of their online communications is with friends and
considers the internet to be an eary and convenient choice for
communication with friends.
Aryal (2003) reported that ICT has made tremendous impact in all
aspects of socio-economic life of the people because of its multipurpose
advantageous services and provisions.
Chauhan (2004) reported that degree of Internet exposure of the
postgraduate students was not affected by their academic performance.
Hermann et al. (2005) evaluated the Oklahoma Cooperative Extension Service
Nutrition Web Site in terms of Web site characteristics, information sections,
information formats, and uses of the information immediately after and 6 months after
an in-service training on the Web site. Immediately after training, educators appeared
to be most interested in quickly using Web site information in educational programmes.
Six months after training, educators appeared to begin to use the Web site as a source
of current information that could be used to address immediate consumer questions
and be used for news releases.
Ahn-Yun and Kim-KyungWon (2007) investigated utilization status of internet,
health/nutrition websites among children, and to assess the needs for developing
nutrition websites and education programs for children. The survey questionnaire was
administered to 5-6th grade students (n=434) at two elementary schools. About 32%
used the internet every day while 19.5% used it whenever they needed, showing
significant differences in internet usage by gender (p<0.01). Although the subjects used
the internet frequently, those who used health/nutrition websites were 23.3%. The
purpose of using these sites were mainly 'to obtain health/nutrition information' (55%),
'to get information regarding weight control' (17%). Fifty-six percent of the users were
satisfied with the nutrition websites, but only 30% said that they were helpful. The
preferred topics in developing nutrition websites were assessment of obesity, exercise
methods, weight control methods, nutrition information (e.g., diet for stature growth),
dietary assessment and food hygiene. Girls showed more interest in these topics than
boys (p<0.05). For school nutrition education, girls showed more interest than boys in
topics for cooking snacks (p<0.001) and selecting snacks (p<0.05). In nutrition
websites, subjects wanted to have information and game/quiz, as well as getting
information using Flash animation. The favorite colors for screen and text were slightly
different by gender (p<0.01). In school nutrition education, 89.5% of subjects liked to
have activities (e.g., cooking, exercise, game). They also liked materials using
computers, video and internet than printed materials. If nutrition education was done at
schools, subjects wanted to receive 5.7 times of education per semester on average
(mean length: 42.6 min./session). This study suggests that nutrition websites and
education programs for children should include the topics such as assessment of
obesity or diet, weight control and special information (e.g., diet for growth) as well as
general information. In designing nutrition websites and programs, methods including
game, quiz, Flash animation and activities (cooking, exercise) could be appropriately
used to induce the interest and involvement of children.
Blasio (2008) found that by reducing the cost of performing isolated economic
activities in remote areas, information technology might serve as a substitute for urban
agglomeration. The results do not support the argument that the Internet reduces the
role of distance. Internet usage is much more frequent among urban consumers than
among their non-urban counterparts.
4. Factor associated internet utilization
Bennett (1998) examined that web-based chat rooms, stock
portfolio management tools, up-to-the minute sports statistics and virtual
shopping are the communication facilities associated with the internet
usage.
Philip (1998) reported that a key aspect of technology policy in South Africa
was universal access. This sounds like a technological problem, but closer examination
shows there are significant cultural problems. One of the problems in a multi-ethnic
country is language. South Africa has 11 official languages in addition to several others
spoken by sizable minorities. He raised two major questions; does universal access
mean all languages must be accommodated or does globalization imply English must
be forced on everyone?
Gognon and Krovi (2000) highlighted that e-business is
encouraging business processes, enterprise decision-making,
application and organizational structures.
Agnihorti (2001) examines that ISP traffics have fallen sharply
with better economies of scale and lower cost for national and
international leased lines and affecting the usage of internet.
Anonymous (2001) stated that various factors like age, race occupation,
monthly income, accessibility of localite, cosmopolite and mass media sources for
providing information about different sites, ownership of electronic devices for using
internet, access of internet at home, online shopping feature of interent, consumer
interest in various forms of internet, difference in exposure of internet for men and
women and difference of various type of websites in reach by location all are the
factors associated with internet use.
Jessic et al. (2001) reported several possible explanations for graduate
students‟ greater acceptance of forming relationship on the Internet. A possible
explanation of their findings was that graduate students may already be some what
accustomed to using the Internet for other purposes such as a making professional
contacts and doing research.
Gupta (2002) stated that the approach of discovering the root of
problem like problem of bug while working on net by determining where,
why, when and how defects are introduced and devise strategies that
would prevent the introduction of each defect can affect the usage of
internet
Jadhao (2002) observed significant relationship between mass media
exposure and transformation.
Marc (2002) concluded that engineering graduates require an ever-increasing
range of skills to maintain relevance with the global environment of the new millennium.
Communication skills are vital component of this, recognized by academia and industry
alike. English language skills are also important given its widespread status across the
globe as a lingua franca. Indeed, multilingual skills are considered a salient element in
the make-up of the new global engineer. English for specific purposes focuses the
learner‟s attention on the particular terminology and communication skills required in
the international professional field. He further indicated that there is a clear necessity
for effective English communication skills for engineers in the current globalization.
Statistics indicate that the prime language of Internet sites is becoming increasingly
regionalized, with the local dominant language being the first choice in language
options. English is still strong, but it is becoming the second choice in an increasingly
multilingual international community. The Internet, as an instrument of globalization,
contributes to this process of recognizing diversity. This has clear implications for
engineers.
Verma (2002) reported that due to the technological advancement
like modem doubling (way for a user to get fast internet connection with
an analog telephone line, to use two 56 KBPs modems to double the
band width), modem bonding (use of Multilink protocol plus (CM+) to
combine the band width of two modems) and modem teaming (working
of modems as separate connections) using the “Smart download”
capability- are the factors associated for growing internet usage.
Chauhan (2004) reported that level of Internet exposure was higher among the
Ph.D. scholars than M.Sc. scholars.
Chauhan (2004) revealed that slightly more than half of Internet user research
students were more than 23 years of age. He observed that level of Internet exposure
was increased with increased in the age of the research students.
Chauhan (2004) signified that degree of Internet exposure of
postgraduate students was not affected by their degree of father’s
and mother’s education
Patel (2004) revealed that more than half of the information needing
respondents (55.65 per cent) were in the middle age group followed by old age and
young age group.
Patel (2004) revealed that majority (51.67 per cent) of Internet user research
scholar had above 23 years of age. Further she observed that age was significantly
related with Internet exposure of the Internet user research scholar.
Patel (2004) reported that 51.67 per cent of the postgraduate Internet user
scholars had first class in graduation. She further observed that education level of the
Internet user postgraduate students was positively significant with their Internet
exposure.
Patel (2004) reported that that majority of the Internet user postgraduate
students were with first class academic performance (51.67 per cent). Further she
reported that degree of Internet exposure of the postgraduate students was non-
significantly related with their academic performance.
Patel (2004) reported that majority (83.33 per cent) of the Internet user
students‟ fathers‟ level of education was SSC or above that level. She further
concluded that students‟ fathers‟ level of education was non- significantly related with
the level of Internet exposure of the students.
Chauhan (2005) concluded that students having more age had low level of
computer nervousness.
Chauhan (2005) concluded that students with lower level
education of their father were found more active in computer and had
less computer nervousness, but this trend was not up to the level of
significance.
Patel and Chauhan (2005) reported that the college students with higher
academic performance were slightly more active in using Internet than those of lower
academic performance.
Patel and Chauhan (2005) concluded that that slightly more than two fifth of
the Internet user postgraduate students‟ fathers‟ level of education was above
secondary level. They also concluded that Internet exposure observed insignificantly
higher among those students, whose fathers‟ level of education was higher.
Patel (2006) reported that majority of the multimedia opinion provider teachers
had middle age (61.66 per cent). She also stated that age and opinion of the teachers
regarding multimedia application in agricultural education were negatively and
significantly related with each other.
Patel (2006) reported that majority (61.67 per cent) of the opinion
contributor teachers towards the use of multimedia in agricultural
education had earned their Ph.D. degree with distinction, out of such
teachers, 48.34 percent and 10.00 percent had distinction in their M.Sc.
and B.Sc. degree, respectively. She stated that there was negative non-
significant relationship between opinion of the teacher regarding
multimedia application in agricultural education and their academic
performance.
Shah (2006) reported that there was negatively significant relationship between
age of the AAU teachers and their Internet exposure, reflecting that degree of Internet
exposure of the AAU teacher was observed better among young teachers than the old
aged teachers.
Shah (2006) declared that there was positive relationship
between the academic qualification and degree of Internet exposure of
the AAU teachers.
Shah (2006) observed that academic performance of the teachers had
negatively non-significant relationship with their opinion regarding multimedia
application.
Atiso (2007) found that in recent years, higher education in Ghana has been
characterized by an increasing number of students without a corresponding increase in
facilities such as residential and classroom accommodations and the acquisition of
modern books and journals for both students and lecturers. The lack of up-to-date
information for higher education could be offset in part by the Internet, which could be
tapped to enhance academic work. Until recently, many universities in Ghana have
depended primarily on print media (books, journals, newspapers) and grey literature as
the main sources of information for both students and lecturers. This paper discusses
the Internet as a supplementary source of information for tertiary institutions in Ghana,
with particular reference to students of the faculty of agriculture of the University of
Ghana, Legon, where the technology is relatively new and expensive and not easily
accessible to the majority of students. The Internet could serve as a perfect
supplement for lecturers and students and should therefore be viewed as a necessity,
rather than a luxury afforded to the privileged few, as is currently the case because of
the cost involved in accessing the technology.
Yldz-Samur et al. (2008) determined the status of computer and
Internet using and the factors affecting use of internet in nutrition and
dietetics students. Methods: This study was carried out in Hacettepe
University School of Health Technology, Department of Nutrition and
Dietetics, Turkey. Applying questionnaires under observation collected
the data. Results: Out of 256 students, 232 contributed to the study
(90.6%). Only 7.3% of the students were computer illiterate. Two thirds
of the students (65.1%) personally owned a computer. Those students
using computer spend an average of 6.71+or-0.49 hours per week in
front of the screen, spends an average of 5.39+or-0.41 hours per week
in the Internet and they remain online for an average of 1.41+or-0.79
hours. Time spent for the Internet usage for professional
development/learning is significantly higher among senior students.
Students familiar with computer usage spend relatively longer times in
front of the screen and on the Internet in comparison to others (p<0.01).
The students who have a computer and Internet connection, spend
relatively more time using the computer, connecting to the Internet and
visiting nutrition related sites in comparison to both students who have a
computer but no readily available Internet connection and who do not
own a computer at all (p<0.01). CONCLUSIONS: University
administration should aim at increasing the use of computers and the
Internet by students for learning and professional development purposes
by promoting such activities and providing training opportunities for
better computer use.
5. Constraints encountered in internet utilization
A pilot study done by Harris (University of Texas at Austin) and
Grangennett (University of Nebraska at Omaha) made reference to
several well known researchers. "Computer anxiety levels have been
found to be better predictors of success in using computers that is extent
of prior computer experience (Marcoulides, 1988), but computer anxiety
scores are not related to amounts of computer experience (Rosen,
Sears & Weil, 1987; Marcoulides). Computer experience appears to
effect attitudes about computers, rather than computer anxiety
(Gressard and Loyd, 1986, Igbaria & Chakrabarti, 1990).
Birkenholz and Stewart (1991) reported that lack of training in
using computers was a major barrier to using the microcomputer and
computer related technologies.
DeLoughry (1993) reported that encourage students to explore,
"People need the opportunity to play before they gain confidence." He
quoted the words of Weil that schools, colleges and businesses allow
students and employees to experiment with new computers and new
software before they are incorporated into daily activities. This would
allow the user the time to explore, "play", and feel comfortable.
Bill Gates (1995) analysed that the pricing of network access may
be set politically rather than in the marketplace. It is going to be
expensive to enfranchise people in remote locations because the cost of
bringing wiring to far-flung homes and even small communities is very
high.
Tarjanne (1996) stated that the most of problems on internet is
that the information contained on the internet is unstructured, unsorted
and difficult to find to in particular.
Brown and Vician (1997) reported that computer anxiety has been
associated with decreased use and worse, avoidance of information
technology. Avoidance of computer use can seriously affect some
students‟ academic progress, which may cause lower performance in
business settings and ultimately affect career opportunities.
Goh (1997) found that the high cost of computers and computer
peripherals was the main deterrent for non-users of Internet.
Hamizatul (1997) Yeap (1998) and Pang (1997) identified several
factors that learn Internet skills were even stronger because of “a
shortage of teaching staff” as well as equipment in institutions of higher
learning. They further observed that students faced several major
barriers to their successful use of library resources through Internet were
genuine, students perceived that access was denied because of the
inability to access databases remotely due to password requirements
and/or license restrictions, difficulty in searching and justifying within the
library and its websites costs of copying and printing at the library
shortage of knowledge able librarians, lack of the customer orientation
they have come to expect as consumers.
Tseng et al. (1997) reported that feelings of anxiety toward
computers and computer use, is common, affecting 30 to 40% of the
population.
Bennett (1998) stated that there are sites such as E* trade which allow one to
constantly reassess their investments with the ability to usage.
Dorothy et al. (1998) observed that lack of availability of some
ICT resources (1eg Internet, e-mail, computer conferencing, video
conferencing, fax, digital camera, digital scanner and on-line information
sources) was the main problem given by teachers in accessing ICT. This
should not necessarily be taken to mean that there might not be other
inhibitive factors such as lack of knowledge or skills, or lack of support,
but rather that access to the technology tends to over ride all other
factors in determining use.
Yeap‟s (1998) comparative study of the Arts and Science
students at one of the local universities, he found that the lack of
exposure and shortage of equipment influenced to a great extent the
involvement of students in the use of Internet. Yeap‟s found that the
Science students were more likely to use Internet because of their
knowledge in Internet applications compared with the Arts Students.
Patnaik and Saravanan (1999) highlighted that India‟s telephone
density is hardly 1.3 per cent (Telephones per 100 population) against
world average 11 and computer density is around 1.5 (per thousand
population) against world average 2. It indicates that the slow diffusion of
internet in India is due to the improper telecommunications and
computer networks.
Roa (1999) stated that due to insufficient online usage and online spending
(buying power) internet utilization may not be a viable proposition for many developing
nations.
Anonymous (2000) reported that simulataneous access to the internet via a
single modem or using one – connection and one account multiple users can browse
the web, check e-mail or use any internet application are the facilities promiting the use
of intenet.
Anonymous (2000) reported major problem like poor quality of
Internet connectivity, low bandwidths and waiting for years to own a
telephone connection were more very common problems.
Gagnon and Krovi (2000) compiled that the availability and sophistication of
computer resources along with the lack of interent training for the faculty involved
inproviding internet training to students can influence the usage of the internet.
Gagnon and Krovi (2000) found from a study of undergraduate operations
research and management science courses that the availability and sophistication of
computer resources influenced the use of internet/ worldwide web.
Raymond (2000) reported that only 23 per cent respondents
believed that they had no technical hurdles in using Internet for learning.
However, this observation does not preclude general acceptance, as 50
per cent of respondents clearly expressed a liking for Internet learning
regardless of the technical hurdles they had once felt difficult. He further
reported that more than half of the respondents believe that it is
worthwhile going towards using Internet as a teaching media.
Shah, Beena (2000) highlighted that the enquiry- discovery model
used in internet instruction succeeded in creating interest and
enthusiasm among learners to gain the knowledge through self- paced
learning to the extent they want, affect the usage of internet.
Agnihotri (2001) indicated that inadequate penetration of PCs and
the internet in homes as well as limitations in access are main problems
faced in internet utilization.
Agnihotri (2001) reported that while using internet, the logon
screen is sometimes a nuisance for single user computers as every time
the Windows loads, the user has to furnish the password or hit Escape
key to proceed further.
Agnihotri (2001) evaluated that high dial-up charges and low PC
penetration are the major problems in internet usage.
Ardeshana et al. (2001) revealed that major constraints were less
use of A.V. aids, appropriate to the subject in teaching, lack of
appreciation of the teachers for good teaching, poor training facilities to
the teachers and course contents are not revised according to the need
of the time.
Anonymous (2002**) reported that the perceived barriers for their
successful use of internet sources are, difficulty in searching, navigating
the websites, cost of copying and printing the materials etc.
Anonymous (2002**) highlighted that advertising within websites
bother college students. Four-out-of-five students are bothered at least a
little, and one- quarter are more bothered. Most (58%) believe that there
is no difference in the reliability of information on websites with
advertising and only one-in-five believes ad-free websites have more
reliable information.
Catherine and Banji (2002) revealed that academician
respondents using Internet working in university In Nigeria had faced
constraints, from the ranked severity of constraints, costs ranked the
highest in Kenya it was ranked third. The biggest constraint in Kenya
was the availability of Internet connection and this was second in
Nigeria. Reliability of electricity and computer skills in general were not
considered huge constraints and the least was the language of content
since respondents in both.
Gagnon and Krovi (2000) found that the most frequent factor for
not using internet is lack of student access to computer laboratory
resources. Lack of relevant websites, lack of proper computer equipment
for students, lack of incentives to use the internet are the obstacles in
internet utilization.
Panda (2001) reported that the cyber terrorism through computer
virus, hackers, cyber- punks and disrupts the normal functioning of
computer network.
Anonymous (2002) reported that while working on internet several
risks exposed are virus attack, hacking and data threats etc.
Hasnain (2002) stated that the excessive spamming (spam mail)
may disrupt the computer and may even deny access. Kumar (2002)
reported that hard disks crash, communication lines stop working,
browsers take ages to download information, hackers and virus threats
are the constraints faced while using internet.
Noronha (2002) highlighted that some of the problems in internet
utilization are poor infrastructure, lack of sufficiently motivated teachers
to impart training on internet use to students and reluctance of school/
college authorities to open access of internet to students.
Raman Mohan (2002) stated that the biggest nuisance for Net
surfers these days are the pop up windows that open up themselves as
any person take rounds of different websites.
Singh (2002) reported that no-availability of equipments, media
and other basic amentities like electricity are the major problems in the
utilization of internet.
Singh (2002) reported that if anybody download a file (runabled
and containing a virus) – attached to an e-mail or USENET posting (i.e.
binary) and ru nit, there are chances of having viruses in that filed while
using e-mailing.
Verma (2002) stated that while surfing the internet, sudden
stucking of internet explorer, stopping opening the website or hanging
the system (due to specification limits the number of simultaneous
connections any browser can make to a given server) are the constraints
commonly faced.
Singh (2002) reported that while using internet, two common
problems are of Junk mail and spam. Spam is flooding the internet with
many copies of the same message in an attempt to send massage to
people who would not otherwise choose to recipient but spam causes
inconvenience and costs the recipient money to receive it.
Pat et al. (2003) reported that the more aggressive the technology
policy and the stronger the entrepreneurial orientation, the more the firm
uses the Internet to conduct business activities. More important, the
competitive intensity of the business environment moderated these
relationships: Technology policy and entrepreneurial orientation were
associated with the use of Internet-based electronic commerce under
high levels of competitive intensity, but significantly less so under low
levels of competitive intensity.
Anonymous (2004) observed that major constraints areas were
lack of supporting facility and lack of incentives.
Anonymous (2004) reported that more and more, professional
success depends upon reasonable application of computer technology.
However, not all people find easy access. Certainly, two major
hindrances are computer anxiety and lack of computer self-efficacy.
Mishra et al., (2005) observed that the obstacles encountered by
the students in internet use were 83.03 per cent male and 61.29 per cent
females said slow functioning, 35.38 per cent male and 41.94 per cent
females aid lack of skills for using the new medium, 32.31 per cent male
and 29.03 per cent female said costly and 32.31 per cent male nd 16.13
per cent female said poor facilities of internet in college as barriers in
internet use. Some other problems were difficult in finding scientific
materials related to their field (18.46%) male and 29.03% female),
electricity failure (24.62% male and 19.35% female), language (15.38%)
male and 6.45 % female only) and internet oriented education is not
being imparted (1.54% male only).
Misovic (2007) examined two enterprise information system (IS) architectures:
an older application architecture and a more recent service-oriented architecture. The
application architecture is a classical web-based application that can accept a partial or
complex solution of enterprise IS. The first solution has problems with data process
communication integrity, which disturbs IS applications. The second solution is suitable
for large enterprises but not for small and medium enterprises. Classical web-based
applications are too inflexible to adapt to changes in the enterprise's market production
environment. On the other hand, the service-oriented architecture can operate on
enterprise web services. Computerization of such small and flexible units can be
addressed by classical web services. A new web-based application plays a structural
unit role for service-oriented architecture. This application consists of a sequence
formed by enterprise web-service calling. Enterprise web services can easily adapt to
changes in the enterprise's market production environment thus contemporary service-
oriented architecture are preferred by enterprises over the older application
architecture.
Goodwin (2008) found that every user can contribute to Wikipedia, the online-
encyclopedia. Many people use it already and it therefore provides a broad range of knowledge.
The present article is about positive prospects and risks for the forest sector. On the one hand
Wikipedia is an additional channel to reach other scientists, students and the general public. On
the other hand the quality of its content is controversial. For this reason forest scientists should
keep an eye on subject-related articles and enhance them if necessary.
3 THEORETICAL ORIENTATION
This chapter includes the theoretical orientation for the study. The
obtainable literature reviewed in relation to the problem in the preceding chapter
facilitated in devising theoretical orientation and direction for choice of variables for the
study and operationalization of the concepts. The chapter has been divided and
presented in the following sections.
3.1 Conceptual framework of the study
3.1.1 What is the Internet?
3.1.2 The origin of the Internet
3.1.3 Organlzational structure of the internet
3.1.4 History of the internet
3.1.5 SKRAU- A profile
3.1.6 Structure of Internet/Broadband/Mobile Technologies
3.1.7 Future application of internet
3.1.8 Issues Related to Internet/Broadband/Mobile Technologies
3.1.9 Concept of personal characteristics
3.1.10 Concept of utilization pattern
3.1.11 Concept of performance
3.1.12 Concept of constraints
3.2 Operationalization of the terms use in the study
3.3 Abbreviations used in the study
3.4 Theoretical model of the study
3.5 Empirical hypotheses
3.1.1 What is the Internet?
The Internet is “at once a world-wide broadcasting capability, a mechanism for
information dissemination, and a medium for collaboration and interaction between
individuals and their computer without regard for geographic location” (Internet Society,
2008a). While what is known today as the Internet is only approximately twenty-five
years old, decades of small and large technological advances had paved the way for its
development and success.
A working definition
It is understandable that when the question „What is the Internet?‟ is asked, the
answers often vary widely. For example, representative answers may include: a
network of networks based on the TCP/IP protocols a community of people who use
and develop those networks a collection of resources that can be reached from those
networks.
The Internet is a global resource connecting millions of users; it began as an
experiment over 20 years ago by the United States; specifically, its Department of
Defense.
The Internet is an American invention. But its impact is global. Internet is a
glimpse of the future of networked computing, a total network in which a user can glide
seamlessly from network to network as need dictates.
3.1.2 The origin of the Internet
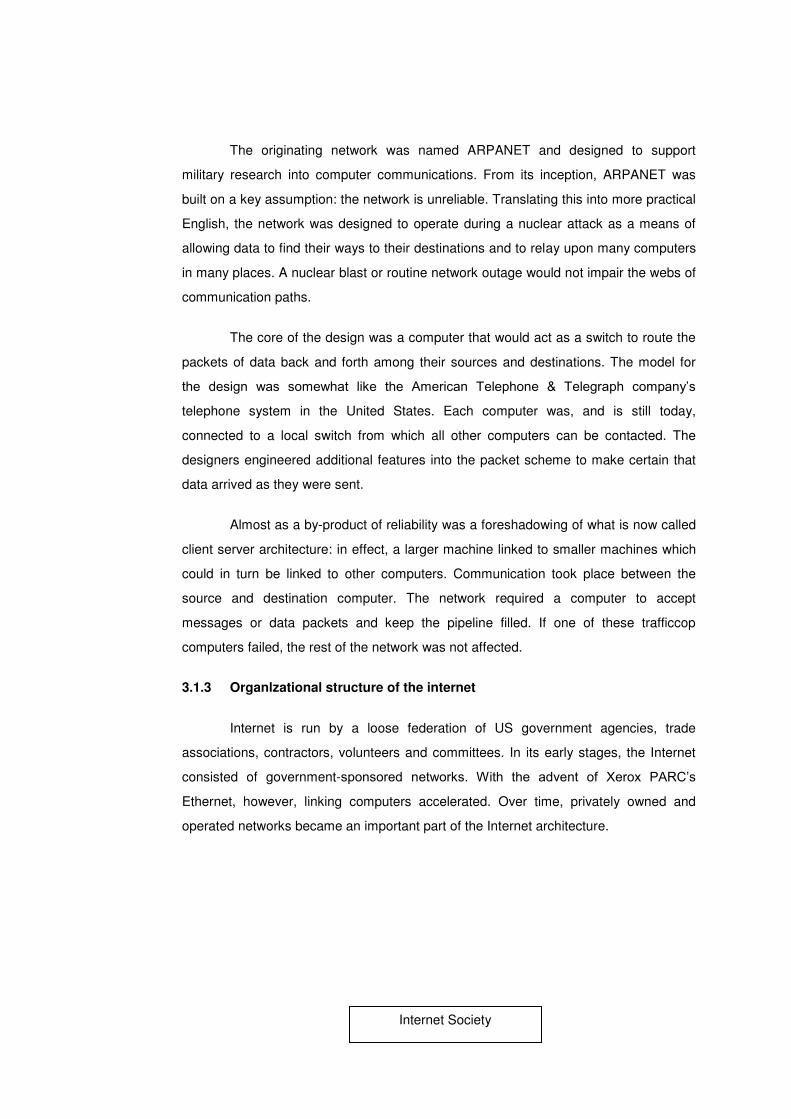
The originating network was named ARPANET and designed to support
military research into computer communications. From its inception, ARPANET was
built on a key assumption: the network is unreliable. Translating this into more practical
English, the network was designed to operate during a nuclear attack as a means of
allowing data to find their ways to their destinations and to relay upon many computers
in many places. A nuclear blast or routine network outage would not impair the webs of
communication paths.
The core of the design was a computer that would act as a switch to route the
packets of data back and forth among their sources and destinations. The model for
the design was somewhat like the American Telephone & Telegraph company‟s
telephone system in the United States. Each computer was, and is still today,
connected to a local switch from which all other computers can be contacted. The
designers engineered additional features into the packet scheme to make certain that
data arrived as they were sent.
Almost as a by-product of reliability was a foreshadowing of what is now called
client server architecture: in effect, a larger machine linked to smaller machines which
could in turn be linked to other computers. Communication took place between the
source and destination computer. The network required a computer to accept
messages or data packets and keep the pipeline filled. If one of these trafficcop
computers failed, the rest of the network was not affected.
3.1.3 Organlzational structure of the internet
Internet is run by a loose federation of US government agencies, trade
associations, contractors, volunteers and committees. In its early stages, the Internet
consisted of government-sponsored networks. With the advent of Xerox PARC‟s
Ethernet, however, linking computers accelerated. Over time, privately owned and
operated networks became an important part of the Internet architecture.
Internet Society
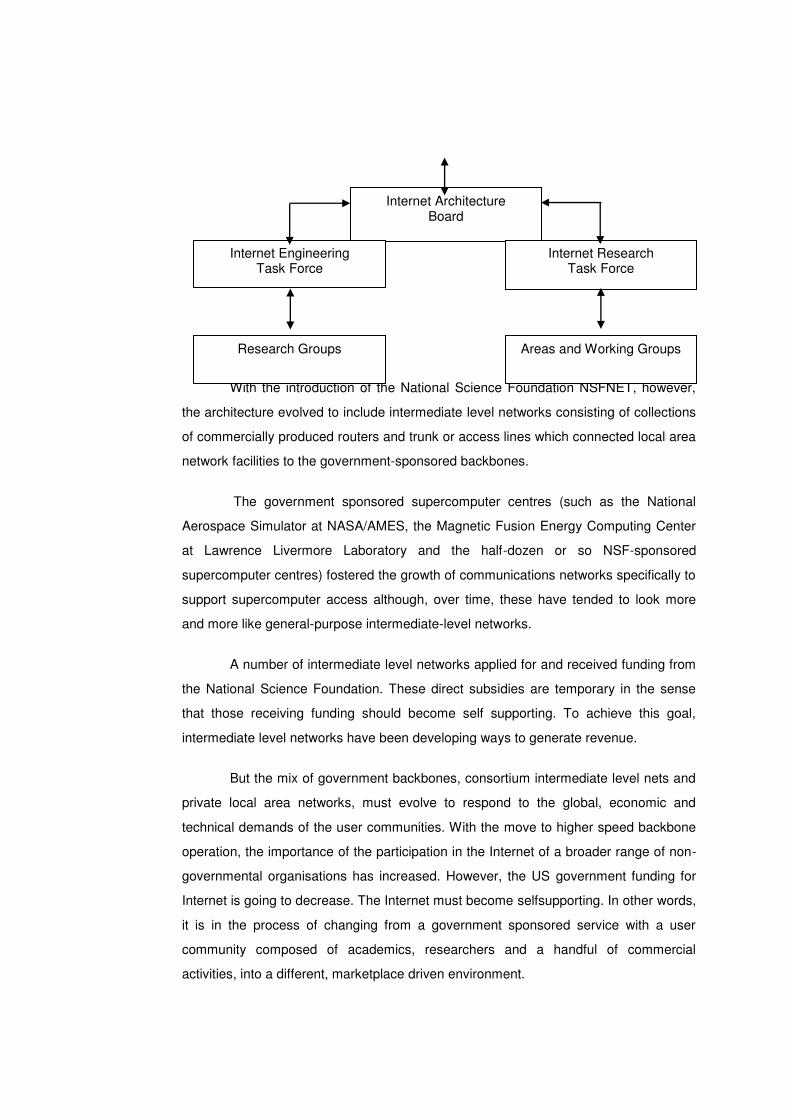
With the introduction of the National Science Foundation NSFNET, however,
the architecture evolved to include intermediate level networks consisting of collections
of commercially produced routers and trunk or access lines which connected local area
network facilities to the government-sponsored backbones.
The government sponsored supercomputer centres (such as the National
Aerospace Simulator at NASA/AMES, the Magnetic Fusion Energy Computing Center
at Lawrence Livermore Laboratory and the half-dozen or so NSF-sponsored
supercomputer centres) fostered the growth of communications networks specifically to
support supercomputer access although, over time, these have tended to look more
and more like general-purpose intermediate-level networks.
A number of intermediate level networks applied for and received funding from
the National Science Foundation. These direct subsidies are temporary in the sense
that those receiving funding should become self supporting. To achieve this goal,
intermediate level networks have been developing ways to generate revenue.
But the mix of government backbones, consortium intermediate level nets and
private local area networks, must evolve to respond to the global, economic and
technical demands of the user communities. With the move to higher speed backbone
operation, the importance of the participation in the Internet of a broader range of non-
governmental organisations has increased. However, the US government funding for
Internet is going to decrease. The Internet must become selfsupporting. In other words,
it is in the process of changing from a government sponsored service with a user
community composed of academics, researchers and a handful of commercial
activities, into a different, marketplace driven environment.
Internet Architecture Board
Internet Research Task Force
Internet Engineering Task Force
Research Groups Areas and Working Groups
3.1.4 History of the internet
However, some claim that the undersea transatlantic cables laid in 1866 were
the first step to developing the Internet. The cables were designed to allow telegraph
signals from continent to continent, and their success allowed for immediate
communication across the ocean (Sherman, 2003, p. 8). Another significant event in
history happened in 1957 when the U.S.S.R. launched Sputnik-I into Earth‟s orbit. In
response, the United States created the Advanced Research Projects Agency (ARPA)
under the Department of Defense. ARPA‟s “mission was to apply state of the art
technology to US defense and to avoid being surprised (again!) by technological
advances of the enemy” (Universiteit Leiden, 2008).
The 1960s and the beginning of the ARPANET.
In 1962, ARPA appointed J. C. R. Licklider of MIT to head its computer
research program. His objective was to design the first electronic network to aid the
United States military (Universiteit Leiden, 2008). In August of that same year,
Licklider published a series of memos describing what he called a “Galactic Network.”
He envisioned the concept of a “Galactic Network” as a globally interconnected set of
computers which people could use to quickly access data and programs from any site
(Internet Society, 2008a). This idea was the precursor to what has evolved into the
Internet and World Wide Web. One year prior to Licklider‟s concept, Leonard Kleinrock
published the first paper on packet switching theory. Packet switching is the
transferring of packages of information over an electronic network (Sherman, 2003, p.
12). Since this electronic network did not exist, the next step was to find a way in
which computers could communicate with one another. In 1965, Kleinrock, Lawrence
G. Roberts, and Thomas Merrill connected a TX-2 computer at Stanford Research
Institute with a Q-32 computer at UCLA over a low speed dial-up telephone line to
create the first ever built wide area computer network. The circuit switched telephone
system was inadequate and thus proved the need for Kleinrock‟s packet switching
(Internet Society, 2008a).
In 1966, Roberts joined the ARPA team and one year later published his plan
for the ARPANET. When his plans were published, it became clear that three teams,
MIT, National Physics Laboratory, and RAND Corporation, had all been independently
working on packet switching theories without knowledge of the other teams.
Collectively, they incorporated their best ideas into the ARPANET (Universiteit Leiden,
2008). By 1969, ARPA realized that the military could be aided by the scientific minds
at universities, so two other schools were added into the network, University of
California at Santa Barbara and the University of Utah (Sherman, 2003, p. 16). Also in
1969, the first Interface Message Processors (IMP‟s) were installed in computers at
both UCLA and Stanford. An IMP is a “processor-controlled switch that is used to route
packets to their proper destination” (Birds-Eye, 2008). With this function, UCLA
students were able to 'login' to Stanford‟s computers, access its databases and try to
send data. The fledging network had come into being when the experiment was
successful (Universiteit Leiden, 2008). The first commercial online service,
Compuserve, appeared in 1969, and later would became the first service to offer mail,
technical support, and online chatting (Compuserve.com, 2008).
The 1980s and the birth of the Internet.
No one really knows who invented the word “Internet,” but by the 1980s it was
clearly here, and here to stay. By 1983 people no longer were using ARPANET,
instead they were logging onto the Internet. In 1984, the Domain Name Servers (DNS)
was introduced. This system introduced tiering into US Internet addresses and
included .edu (educational), .com (commercial), .gov (government), as well as .org
(international organization) and a series of country codes. The 1980's brought the first
subscription based commercial Internet company, UUNET in 1987 (Universiteit Leiden,
2008). The decade was also the beginning of concern for security on the Internet. The
first computer virus was released on November 1, 1988. It was called the Internet
Worm and it briefly disabled about six thousand Internet hosts (Sherman, 2003, p. 27).
One year later, as Sherman (2003) points out, more concern was raised when a group
of international spies were caught using the Internet to spy on the US, and so the term
“cyberspies” was coined.
Towards the end of the 90s there were more than 1.2 million websites
(Universities Leiden, 2008). Google, a new search engine, was launched in 1998.
Over the years Google has grown into one of the top search engines on the Internet,
accounting for more then 65 percent of the market by the end of 2007 (hitwise.com,
2008). In 1999 two other major websites were released, Myspace and Napster
(Infoplease, 2008). These two websites were the first of many social networks and
peer to peer file sharing databases, respectively, to come. Myspace lead the way for
future social networking sites, such as Facebook, which launched in 2004. It redefined
the way in which people could communicate with each other. Instead of talking on the
phone or meeting in person, users log on to the website and send messages to their
friends, blog about their thoughts and ideas, and provide information about themselves,
such as their educational background, favorite music and television shows, and
anything else they can think of. Napster was a music file-sharing website in which
users could easily access and download MP3 files from other users‟ computers.
However, as explained in the next section, Napster quickly saw its own demise
because of legal problems. By the end of this decade, anyone with a computer could
access the Internet and they were using it for all types of information and content.
The Internet has revolutionized the computer and communications world like
nothing before it. In 2006, there were more than 92 million websites, and that number
will continue to rise by the millions every year (Infoplease, 2008). The Internet and the
World Wide Web would not be what they are today without the help of the developers,
businesses, and consumers who have all taken a part in the creation of this worldwide
phenomena.
3.1.5 The Swami Keshwanand Rajasthan Agricultural University (SKRAU)- A
Profile
The Swami Keshwanand Rajasthan Agricultural University, also known as
SKRAU is one of the leading universities in Rajasthan as well as India. Swami
Keshwanand Rajasthan Agriculture University is situated in the city of Bikaner,
Rajasthan.
The Swami Keshwanand Rajasthan Agricultural University has been separated
from the existing Sukhadia University in the year 1987, with aims to provide education
in agriculture and allied branches, facilitate research work in relevant field and
undertake mass educational programmes especially designed for rural people of
Rajasthan.
Faculties/Departments:
Agriculture
Veterinary & Animal Sciences
Home Science
Agri-Business Management
Swami Keshwanand Rajasthan Agriculture University is an Agricultural
University located in Bikaner in the Indian state of Rajasthan. The University consists of
six colleges and teaching is split between two campuses, one 45 km from Jaipur in
Jobner and the other in Bikaner
The constitute colleges include:
The College of Veterinary and Animal Sciences, Bikaner established in 1954
The College of Agriculture, Bikaner
The College of Home Science, Bikaner
Institute of Agribusiness Management, Bikaner
Academic Staff College cum Distance Education Centre, Bikaner
S.K.N. College of Agriculture, Jobner
The university conducts education and training in Agriculture and Allied
Sciences which includes Agriculture, Veterinary and Animal Sciences, Home Science
and Agri-Business Management. The university carries out production oriented
research programs, rural mass education and adoption and propagation of new
technologies throughout the state.
In order to achieve all these predetermined objectives the university system
has been classified into three functional areas such as research, teaching & extension.
To fulfill all the educational needs the university has following constituent colleges
under its jurisdiction
Educational Streams
The study programs at Swami Keshwanand Rajasthan Agriculture University
are aimed to broaden the intellectual potential of the students, faculty and other staff so
as to contribute towards the diverse economy. It provides educational opportunities to
the students through its various curricula and enables them to expand knowledge base,
acquire decision making skills linked to their preferred fields of expertise, and to
express themselves professionally. Instructions are given to the students so that they
can develop ability in their profession.
SKRAU Bikaner carries out research programmes through university faculty
and enrolled students, and confer academic distinctions on persons who bring about
technological interventions of economic importance. It awards medals, prizes,
scholarships, fellowships, distinctions and honorary degrees.
Extension education programme promotes agricultural education in the
masses. Three main functional areas of the Directorate of Extension Education,
SKRAU, are training, advisory and communication. The directorate has a team of multi
disciplinary scientists who work in close co-ordination with the Department of
Agriculture, Animal Husbandry, Horticulture, Forestry, Co-operatives, Panchayat
Samities and other agencies engaged for betterment of rural people.
The Swami Keshwanand Rajasthan Agricultural University is authorized to
provide instruction in Agriculture and Allied Sciences which include Horticulture,
Veterinary & Animal Sciences, Home Science and Agri-Business Management. It has
also been authorized in other fields of agricultural learning, which the university may
deem fit. It is empowered to maintain academic institutions, dealing with agriculture,
veterinary and animal sciences, home science, agri-business management, etc., to
carry out instruction in these faculties, hold examinations, and confer degree, diplomas,
pertaining to professional qualifications.
3.1.6 Structure of Internet/Broadband/Mobile Technologies
After considering the history of the Internet, it is important to understand the
structure of the Internet, including how it works. The Internet developed out of the
telephone networks. Telephone networks use circuit switching, which involves
operators manually connecting telephones to each other through “patch panels” that
accept patch cords from each telephone line and electrically connect them to one
another through the panel, which operates like a switch. Circuit switching is not a
viable option for connecting computers because it makes limited use of the
telecommunication facilities and takes too long to set up a connection. Instead, packet
switching is used in digital communications. Computers send out brief bursts of data
that are relayed from computer to computer until they reach their destination. The
computers that perform this function are sometimes called “packet switches” or
“routers”. Together, these routers and communication links between them form the
foundation of the Internet. (Kahn, 1999).
The Internet gets to users via Internet Service Providers (ISP's). There are
three groups of ISP's: backbone providers, national providers, and local providers.
Backbone providers are nationwide or multinational organization that control Internet
routing and often own pieces of the backbone itself. National providers buy capacity
and routing services from backbone providers. They then run points of presence
(POP's), which are locations of access points to the Internet, across the country, or in
some cases, the world. They are typically described as resellers who are reselling
bandwidth that is purchased from the backbone provider. Local providers operate
within a smaller geographic area, but operate much in the same way as the national
providers. Users pay an ISP for set-up and service and are then able to access the
Internet. (McPhillips, 1999).
In the late 1990s, the United States was buzzing with Internet Service
providers (ISPs), many of whom provided service through dial-up connections. By the
end of 2004, however, most ISPs consolidated or were driven out of business.
(Burgelman, 2005). The major cable and telecom companies are now the direct
connection for consumers to the Internet. Often, service is provided via broadband
technologies.
(i) What Is Broadband
According to the Federal Communications Commission, broadband or high-
speed Internet access allows users to access the Internet and Internet related services
at significantly higher speeds than those available through “dial-up” Internet access
services. Broadband speeds vary significantly depending on the particular type and
level of service ordered and may range from as low as 200 kilobits per second (kbps),
or 200,000 bits per second, to six megabits per second (Mbps), or 6,000,000 bits per
second. Some recent offerings even include 50 to 100 Mbps. Broadband services for
residential consumers typically provide faster downstream speeds (from the Internet to
your computer) than upstream speeds (from your computer to the Internet) (2008).
(ii) How Does Broadband Work
Broadband works by allowing users to access information via the Internet by
using one of the high speed transmission technologies available. The transmission is
digital, so all content is transmitted as “bits” of data. These bits move faster in
broadband transmission technologies than in traditional dial-up Internet connections.
Computers can be attached to a broadband connection by existing electrical or
telephone wiring, coaxial cable, or wireless devices. (FCC, 2008.)
(iii) What types of broadband options are available
Broadband can be provided over the following platforms:
• Digital Subscriber Line (DSL);
• Cable Modem;
• Fiber-Optic Cable (Fiber);
• Wireless;
• Satellite; and
• Broadband over Powerline (BPL).
(a) Digital Subscriber Line (DSL)
DSL is a wireline transmission technology that uses existing copper telephone
lines to transmit data to homes and businesses. Transmission speeds range from
several hundred Kbps to millions of bits per second. The availability and speed of DSL
service depends on the distance of homes or businesses to the closest telephone
company facility.
The following are types of DSL transmission technologies:
Asymmetrical Digital Subscriber Line (ADSL) used primarily by residential
customers who receive a lot of data but do not send much. It typically provides faster
speed in the downstream direction than upstream. It allows faster downstream data
transmission over the same line used to provide voice service, but does not disrupt
phone calls.
Symmetrical Digital Subscriber Line (SDSL) –
Used typically by businesses for services such as video conferencing.
Downstream and upstream traffic speeds are equal. Faster forms of SDSL, usually
available to businesses, include High data rate Digital Subscriber Line (HDSL) and
Very High data rate Digital Subscriber Line (VDSL). (FCC, 2008).
(b) Cable Modem
Cable operators use the same coaxial cables that deliver picture and sound to
television sets to provide broadband via cable modem service. Cable modems are
external devices that have two connections, one to the cable wall outlet and the other
to a computer. Transmission speeds are 1.5 Mbps or more. Speed varies depending
on the type of cable model, cable network, and traffic load, but is comparable to
residential DSL. (FCC, 2008).
(c) Fiber-Optic Cable (Fiber)
Fiber optic technology involves transmission through transparent glass fibers
that are equivalent to the size of the diameter of a human hair. Electrical signals
carrying data are converted to light and sent through the fibers. Transmission speeds
are far faster than DSL or cable modem, but depend on how close your computer is to
the fiber and how much bandwidth is used. Fiber can also be used to provide voice
and video services. Phone companies offer fiber-based broadband in limited areas.
(FCC, 2008).
(d) Wireless
Wireless broadband can be mobile or fixed. Wireless fidelity (WiFi) is an
example of a fixed, short range technology that is used in conjunction with DSL or
cable modem service to connect devices within a home or business to the Internet.
Using a radio link between a customer location and a service provider facility, WiFi
connects a home or business to the Internet. WiFi can often be found in “hotspots”
such as airports, parks and bookstores. Speeds are comparable to DSL and cable
modem. (FCC, 2008).
(e) Satellite
In addition to providing television service, satellites also provide links for
broadband service. It is another form of wireless broadband and is used primarily to
service remote or sparsely populated areas. Issues with satellite service include the
line of sight to the satellite and severe weather, which can disrupt transmission.
Speeds are slower than DSL and cable modem, but are still faster than dial-up
download speeds. (FCC, 2008).
(f) Broadband over Powerline (BPL)
Broadband over powerlines uses the existing power distribution network to
provide broadband to customers via electrical connections and outlets. Speeds are
comparable to DSL and cable modem. BPL is still an emerging technology and is
available only in limited areas. (FCC, 2008).
3.1.7 Future application of internet
As the world moves forward in an era where the Internet, broadband and
wireless technologies are essentially ubiquitous, a number of
opportunities for future applications in these fields are created. Among
these applications are technological innovations. Legal and ethical
concerns are paramount in the growth of these industries. Finally,
business applications and opportunities are essentially limitless.
(A) Technological Applications.
As technology evolves, it presents a number of unique opportunities to
develop future applications that many companies are taking advantage
of. These applications include: broadband over powerlines (BPL),
WiMax, Internet Protocol advancements, and the development of new
web browsers.
(i) Broadband Over Powerlines (BPL).
Broadband over powerlines is sometimes referred to as “high speed Internet
through your electrical outlets” (Ransford, 2008). It is a technology developed with the
intention of sending data over the same lines that transmit electricity to individual
households. The potential reach of BPL was one of the factors that led to its
development because as Burgelman noted, “Powerlines were already in place and
reached more homes than either cable systems or even telephone lines” (2005, p. 5).
(ii) WiMAX.
Another technological innovation in wireless Internet access is WiMAX. It
works by transmitting a wireless signal from a base station to different devices. Unlike
Wifi, which transmits broadband access signals in the range of 300 feet, WiMAX
transmits signals 30 miles (Burgelman, 2005). The potential for WiMAX is virtually
unlimited as base stations could conceivably offer cable or satellite signals, as well as
landline and telephone signals in addition to wireless Internet access. The leading
proponent of WiMAX in the United States is Sprint (Sanders, 2008). They plan to
launch the XOHM WiMAX network in September 2008.
(iii) IPv4 vs. IPv6.
Another future application related to the Internet is the deployment of Internet
Protocol version 6 (IPv6), which is the next generation IP standard. Internet protocol
specifies how communications take place between devices through an addressing
system. The current system, IPv4, is anticipated to run out of address space in 2010 or
2011. In early 2008, only 16% of the space remains unallocated (OECD, 2007). While
IPv4 has a theoretical maximum of about 4 million addresses, IPv6's will be in the
trillions (Internet Society, 2008b).
(iv) Web Browsers.
Other technological advancements in Internet technology include the
development of new web browsers. In early September, Google released a free
browser named Chrome, in part to offer competition to Microsoft's Internet Explorer and
Mozilla's Firefox browser (Lohr, 2008).
(v) Legal and Ethical Issues in
Internet/Broadband/Wireless Technology.
The digital media era has brought with it a number of legal and ethical
concerns including copyright infringement, security, and privacy. A number of these
same issues can be found in Internet, Broadband, and Wireless technology. Security
and privacy will more than likely always be a concern for these technologies. Hopes
for growth in these industries and greater access to these technologies have also led to
government intervention in the form of legislation and inquiries into activities by
telecommunications companies.
(a) Security & Privacy.
Recent advancements in Internet development have brought about security
and privacy concerns. At the center of privacy concerns are activities by both Internet
service providers and e-businesses. Recently, ISP's have been criticized for engaging
in deep packet inspection. Deep packet inspection is a filtering technique that involves
the inspection of packets of information as they are transmitted across the Internet. In
August of 2008, Yahoo! announced, partly in response to Congress' concerns about
consumer privacy, that it would allow users to shut off targeted advertising on its web
sites (Whoriskey, 2008).
(b) Legislation.
A number of pieces of legislation have been introduced to address some of the
concerns of the Internet and Broadband. The first was in the Senate and is the
Broadband Data Improvement Act in May 2007. Among its many provisions, it calls on
the Federal Communications Commission to reevaluate the current definition of
broadband to develop a new “second generation” metric (Horrigan, 2007). The most
recent piece of legislation is currently in draft status and has not been introduced. The
author is Representative Ed Markey of Massachusetts. Markey also authored the 2007
Broadband Census Act. The new act, the Wireless Consumer Protection and
Community Broadband Empowerment Act of 2008, is hoping “To require the Federal
Communications Commission to promulgate new consumer protection regulations for
wireless service subscribers, to restrict state and local regulation of public providers of
advanced communications capability and service, to increase spectrum efficiency by
Federal agencies, and for other purposes” (Public Knowledge, 2008).
(B) Business Applications and Opportunities for Internet/
Broadband/ Wireless Technology.
Along with the technological advancements and legislative efforts made in the
wake of the growth of the Internet, broadband, and wireless technologies, a number of
business opportunities will become available for companies looking to capitalize on the
popularity of these technologies. Among them are the potential uses of the wireless
spectrum that will soon be available, as well as expanded Wi-Fi applications and the
rise of user generated content on the Internet and on mobile phones.
(i) Wireless Spectrum.
On February 17, 2009, television stations must cease broadcasting on analog
channels and switch the broadcasting digital programming. The switch was made in
part to free up parts of the broadcast spectrum for public safety communications such
as police and fire departments. The switch, however, will also free up space that may
be auctioned to telecommunications companies who could provide consumers with
advanced wireless services.
(ii) Wi-Fi Applications.
While widespread Wi-Fi has been around for many years, the future holds
opportunities for new applications and additional usage of the technology. Many of the
city, wide Wi-Fi ventures developed by municipalities around the country have not
panned out as planned. However, some cities are scaling back these ambitious plans
of having “wireless cities” and instead offering targeted W i-Fi in specific parts of cities.
(iii) User-generated content.
The Internet is no stranger to user-generated content as the popularity of sites
like YouTube and Wikipedia can attest to. In fact, one could argue that most content
on the Internet is generated by its primary users and not necessarily by web
companies. Users build their own websites and blogs, and they contribute their own
content including photographs, videos, games, music, written work, and computer
coding to the Internet for all to see.
3.1.8 Issues Related to Internet/Broadband/Mobile Technologies
The rise of the Internet has brought with it a number of important issues. These
issues include convergence, net neutrality, and digital inclusion, among many others.
(i) Convergence.
Convergence essentially exists because of the Internet. It has enabled users
to download a wide variety of digital content including music, video, and games. With
broadband and other high speed Internet capabilities, they can do so at an extremely
rapid pace. Aside from the obvious content that users have access to, the Internet has
enabled convergence through mobile phones, through the services offered by
telecommunications companies, and via the new Voice Over Internet Protocol phone
technology.
From a mobile phone, a user can take digital photographs, download and listen
to music, access the Internet, and even watch television. Certainly, the release and
subsequent popularity of the iPhone, a device which is alluded to in Simon's statement,
speaks to the truth of his words. Along with the Internet, a mobile phone could be
considered the ultimate convergence tool.
(ii) Net Neutrality.
Network Neutrality (Net Neutrality) is the principle that keeps the Internet open
and free. Content is carried over the Internet by carriers and ISP's that run the major
backbones. Net Neutrality refers to the absence of restrictions or priorities placed on
said content (Pcmag.com, 2008). This principle prevents providers from blocking or
altering the speed of content based on its source, ownership, or destination. Many
consumers assume that they can do what they want, when they want on the Internet
and Net Neutrality makes that possible. This idea of non restrictive service has been a
part of the “nation‟s communication networks since the 1930s,” with the implementation
of the Communications Act of 1934 (Save the Internet, 2008).
(iii) The Controversy.
The Internet has had net neutrality since its inception, and this has leveled the
playing field for all participants including users, as well as content and service providers
(Pcmag.com, 2008). However, major carriers, such as AT&T, Comcast, and Time
Warner now want to charge larger sites for the traffic they create. Ultimately, these
companies want to control which sites run at a faster pace or which site will not load at
all (Save the Internet, 2008). They have lobbied the FCC to eliminate network
neutrality.
(iv) Internet Freedom Preservation Act of 2008
On February 12, 2008, Ed Markey and Chip Pickering introduced the Internet
Freedom Preservation Act. This legislation establishes a broadband policy to protect
the Internet from blocking, censorship, and discrimination from service providers, and
requires the FCC to research competition, protection, and other broadband issues
(Save the Internet, 2008). If Congress passes this bill, the Internet will remain open
and free.
(v) Digital Inclusion.
Digital inclusion refers to the ability of providers to penetrate the broadband
market and offer Internet access to as many people as possible. In international terms,
the Organization for Economic Cooperation and Development (OECD) reports that
broadband statistics vary greatly across the globe in terms of pricing and performance.
As far as best speeds for the lowest price, the switch to super high speed fiber based
networks has enabled Finland, Japan, Korea, and Sweden to land at the top of the list.
Japan has 100Mbps connections, which is 10 times greater than the average OECD
offering. They also have the lowest pricing with a broadband per megabit per second
rate of $0.22 USD equivalent. Turkey comes in highest at $81.13 Mbps. The United
States reported a $3.18 Mbps (Smith, 2007).
3.1.9 Concept of personal characteristics
For the present study the personal characteristics operationilized
as the all behaviour characteristics of the internet utilizing male and
female agriculture students which play an important role in utilizing the
internet.
The characteristics or features are used in a particular way to
unravel a tangled evolutionary history, document the rate of evolutionary
change, or as evidence of biodiversity. "Characters" are the "data" of
evolutionary biology and they can be employed differently in research
providing both opportunities and limitations. The Character Concept in
Evolutionary Biology is about characters, their use, how different sorts of
characters are limited, and what are appropriate methods for character
analysis. Leading evolutionary biologists from around the world are
contributors to this authoritative review of the "character concept."
Because characters and the conception of characters are central to all
studies of evolution, and because evolution is the central organizing
principle of biology, this book will appeal to a wide cross section of
biologists. Key features focuses upon "characters" fundamental data for
evolutionary biology, Covers the myriad ways in which characters are
defined, described, and distinguished, Includes historical, morphological,
molecular, behavioral, and philosophical perspectives
3.1.10 Concept of utilization pattern
The concept of proper utilization means maximum utilization,
balanced utilization and progressive utilization of each and everything.
Progressive utilization motivated by consumption and based on human
values will ensure social security.
There are multiple dimensions to the concept of utilization. The
role of evaluation in relation to the D&U process is to help NIDRR
researchers understand how much and how effectively consumers (or
other targeted groups) are using the research outputs that have been
disseminated. Utilization of research outcomes, then, can be considered
in terms of these two basic dimensions.
It refers to the extent utilization of various sources and channels
of information by an individual farmer available for seeking the
information. The utilization pattern includes use of information sources
and channels at different times, i.e. morning, day time, evening, and as
also any time during the day/night. different sites of use of information
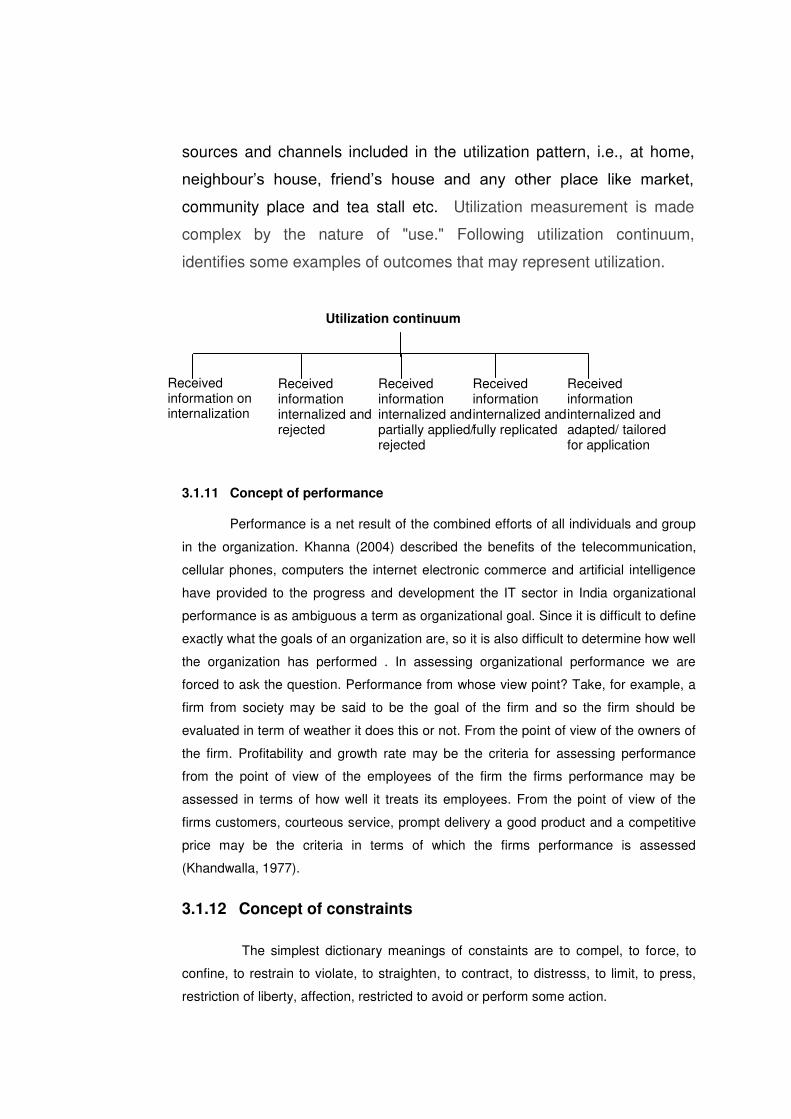
sources and channels included in the utilization pattern, i.e., at home,
neighbour‟s house, friend‟s house and any other place like market,
community place and tea stall etc. Utilization measurement is made
complex by the nature of "use." Following utilization continuum,
identifies some examples of outcomes that may represent utilization.
Utilization continuum
3.1.11 Concept of performance
Performance is a net result of the combined efforts of all individuals and group
in the organization. Khanna (2004) described the benefits of the telecommunication,
cellular phones, computers the internet electronic commerce and artificial intelligence
have provided to the progress and development the IT sector in India organizational
performance is as ambiguous a term as organizational goal. Since it is difficult to define
exactly what the goals of an organization are, so it is also difficult to determine how well
the organization has performed . In assessing organizational performance we are
forced to ask the question. Performance from whose view point? Take, for example, a
firm from society may be said to be the goal of the firm and so the firm should be
evaluated in term of weather it does this or not. From the point of view of the owners of
the firm. Profitability and growth rate may be the criteria for assessing performance
from the point of view of the employees of the firm the firms performance may be
assessed in terms of how well it treats its employees. From the point of view of the
firms customers, courteous service, prompt delivery a good product and a competitive
price may be the criteria in terms of which the firms performance is assessed
(Khandwalla, 1977).
3.1.12 Concept of constraints
The simplest dictionary meanings of constaints are to compel, to force, to
confine, to restrain to violate, to straighten, to contract, to distresss, to limit, to press,
restriction of liberty, affection, restricted to avoid or perform some action.
Received information on internalization
Received information internalized and rejected
Received information internalized and partially applied/ rejected
Received information internalized and fully replicated
Received information internalized and adapted/ tailored for application
In behavioural research, there were difficulties in conceptualizing the
constraints as variable because they did not tend themselves easily to abstractions.
Such notions as adoption behaviour and acceptance of practices innovations suffered
from vagul and contradictory formulation to such an extent that there was little
concerning the adoption and acceptance of such segments of technologies, their
degress, directionality and the problem of their measurement (Bhatnagar, 1974).
Constraints exist primarly in terms of they are defined and conceived in organization
(Bhople and Agrawal, 1987 how and Tawade et al., 1987). Constraints are projections
of collective sentiments rather than simple mirror of objective conditions (Bora, 1990).
According to some auther, there exists interaction among the different
constraints (Hashim, 1989). It is argued that many constraints exist simultaneously in
several stages of development and patterns of progression from one stage to another
depending upon the time, place and other sets of conditions (Bhatnagar, 1974).
Bhople and Agarwal (1987) defined constraints as “The state or quality of
sense being restricted to a given course of action or constraints are nothing but the
problems that come in the way of adoption of technology”.
Singh (2009) identified that constraints implied forcible restrictions and
confinement of action.
3.2 Operationalization of the terms used in the study
3.2.1 Communication :
“Communication” is an act which answers the following questions who says
what, in what channel, to whom, with what effect. So, communication is a
term which means that sender and receiver are tuned together for a
meassage (Lasweell, 1960).
3.2.2 Utilization pattern : It refers to extent of utilization, different sites of use and
different time of use of different sources and channels in seeking information.
3.2.3 Internet utilization pattern :
It refers to the uses of internet in communication incorporating ways,
frequency, during, basis impertinence, purposes and benefits derived from
the internet usage in combination.
3.2.4 Constraints perceived in intent utilization
The constraints perceived in internet utilization pattern refer to the problems
faced / perceived by the respondents in the course of internet utilization
pattern.
3.2.5 Age: number of chronological years completed by the respondents on the
date of interview.
3.2.6 Education: It is formal education level of respondent.
3.2.7 Academic performance: It is performance of the respondents in terms of
the intellectual category or class in which they passed their last academic
degree.
3.2.8 Knowledge of different languages: It is number of languages known by the
research scholars.
3.2.9 Father’s education: It is level of formal education of respondent‟s father.
3.2.10 Mother’s education: It is level of formal education of respondent‟s mother.
3.2.11 Native place: It is birth place with background of the respondents where
they have passes their childhood in terms or rural or urban.
3.2.12 Type of family: It refers to type of family of respondents in terms of nuclear
or joint type of family.
3.2.13 Family size: It refers to number of family members in the family of
respondents.
3.2.14 Wish to migrate abroad: It is aspiration of the respondents to go abroad for
study or for settling or as inhabitant.
3.2.15 Exposure in extracurricular activity: It is involvement, participation, or
association of the respondents in other than academic activities of college.
3.2.16 Library exposure: It is frequency of use and time spent by respondents in
library.
3.2.17 Computer training: It refers to number of training received by the
respondents about computer and its features.
3.2.18 Wish to get higher academic degree: It is aspiration of the respondents to
earn higher academic degree.
3.2.19 Orientation: It is degree to which respondents are oriented to place themselves
in competitive situation in relation to other for projecting their excellence in
any professions.
3.3 Abbreviations used in the study
ARIS = Agricultural Research Information System
ARPA = Advance research project Ajency
BPL = Broadband Over powerline
.com = Commercial
d.f. = Degree of freedom
DNS = Domein name servers
et al. = (et alibi) and else where
Ext. Edu. = Extension Education
FTP = File transfer protocol
.gov = Government
H0 = Null Hypothesis
H1 = Alternate Hypothesis
HTTP = Hyper Text transfer protocol
i.e. = That is
IMP = Interface massage prosser
ISP’s = Internet service providers
IT = Information Technology
J. = Journal
Kbps = Kilobits per second
M.P.S. = Mean per cent score
M.S. = Mean Score
Mbps = Megabits
NARS = National Agricultural Research System
NGOs = Non governmental organizations
No. = Number of Respondent
NS = Non-Significant
.org = International organization
DSL = Digital subscriber line
rs = Rank order correlation
S.D. = Standard Deviation
S.No. = Serial Number
SKRAU = Swami Keshwanad Rajasthan Agricultural University
% = Per cent
Viz. = (Videlicet) namely
VSNL = Videsh Sanchar Nigam Limited
Wifi = Wireless fidelity
WWW = World wide web
3.4 Theoretical model of the study
For the successful completion of the present research work a theoretical model
of the study has been developed in the form of a tentative paradigm (Fig. 3.1) to show
the influence of selected independent variables over the internet utilization level of the
agricultural students of Swami Keshwanand Agricultural University, Bikaner the entire
study is based on the model. On the basis of the findings of the study the final form of
the paradigm has been presented at the and of this dissertation in the chapter
“Findings and Discussion”.
As shown in the paradigm there are 19 independent variables that might be
associated with the internet utilization level of the agricultural students. The variables
tentatively included in the model are :
1. Age
2. Marital status
3. Educational qualification
4. academic achievement
5. Education of father
6. Education of mother
7. Occupation of father
8. Native place
9. Type of family
10. Size of family
11. Family income
12. Medium of instruction
13. Training being extended by the college library
14. Computer course studied
15. Type of computer course studied
16. Expertise in navigating web
17. Place of living
18. Wish to migrate abroad
19. Wish to get higher academic degree
3.5 Derived hypotheses
A hypothesis is a tentative generalization, the validity of which remains to be
tested. In its most elementary stage the hypothesis may be any hunch, guess,
imaginative idea, which becomes the basis for action and investigation.
Keeping in view the specific objectives of the study, the following hypotheses
have been formulated. These general hypotheses are to be tested in the study.
H1.1 There is a significant agreement between the internet utilizing male and female
agricultural students with respect to their Gender, Age, Marital status,
Educational qualification, Academic achievement, Education of father,
Education of mother, Occupation of father, Native place, Type of family, Size of
family, Family income, Medium of instruction, Exposure to extra – curricular
activities, Training being extended by the college library as to how to use
Internet, Studied of any course to know use of Internet, Type of course
studied, Expertise in navigating the web, Place of living at the time of
education, Wish to migrate abroad, Wish to get higher academic degree,
Frequency of library use and Wish to serve in different areas.
H1.2 There is a significant agreement between in the internet utilizing male and
female agricultural students with reference to their Experience of internet use,
Preference of place of access to Internet, Expenditure incurred to use Internet,
use of Internet use, Purpose of Internet use, Possession of E-mail ID,
Frequency of E-mail use, Purpose of E-mail use, Frequency of chatting to
make communication, Frequency of chatting, Use of different search-engines,
Ratting the internet as sources of information, Satisfaction with internet facility,
Preference of internet on other media for getting information, Browsing
techniques required for getting information from the internet, Locating the
desired information on the Internet, Activities during Internet use, Preference of
timing of access to Internet and Orientation to Internet source.
H1.3 There is significant effect of internet utilization on the over all performance of
the male and female agricultural students with reference to their academic
performance and non academic performance.
H1.4 There is a significant association between the internet utilization of male and female agricultural
students and their Age, Marital status, Educational qualification, Academic achievement, Education
of father, Education of mother, Occupation of father, Native place, Type of family, Size of family,
Family income, Medium of instruction, Training being extended by the college library as to how to
use Internet, Studied of any course to know use of Internet, Type of course studied, Expertise in
navigating the web, Place of living at the time of education, Wish to migrate abroad and, Wish to
get higher academic degree.
H1.5 There is a significant agreement in perceiving the physical constraints, technical constraints,
economical constraints, operational constraint and psychological constraints faced by the internet
utilizing male and female agricultural students.
4 RESEARCH METHODOLOGY
In social sciences, the term research methodology is
concerned with the description of methods and procedures used during
research programme. It is considered as the „blue print‟ of the research
architect.
This chapter deals with research design, tools and technique
of a scientific investigation used for data collection in light of objectives
of the study. The selection of universe and sampling technique for
investigation as well as devices used for data analysis are also
explained in this chapter under following sub heads.
4.1 Locale of the study
4.2 Selection of sample
4.2.1 Selection of Agricultural colleges:
4.2.2 Selection of the respondents
4.3 Variables and their empirical measures
4.3.1 Measurement of dependent variables
4.3.2 Measurement of independent variables
4.4 Tools and techniques of data collection
4.5 Statistical measures used for analysis of data
4.6 Derivation of hypothesis in null form
4.1 Locale of the study
The present study was conducted in Swami
Keshwanand Rajasthan Agricultural University, Bikaner, which
was purposively selected due to the following reasons:-
1. SKRAU, Bikaner is the sole agricultural university in
Rajasthan which has maximum number of
agricultural colleges (3) as compared to another
agricultural university in Rajasthan i.e. Maharana
Pratap University of Agricultural and Technology
(MPUAT), Udaipur.
2. SKRAU, Bikaner is the only University which provides
admission to more number of agricultural students in
an academic session as compared to other
agricultural universities in Rajasthan.
4.2 Selection of sample
The sampling plan for the study was as follows:
4.2.1 Selection of Agricultural colleges:
Swami Keshwanand Rajasthan Agricultural University,
Bikaner has three constituent Colleges, i.e SKNCOA, Jobner,
COA, Bikaner and COA, Lalsot; out of which two agricultural
colleges namely SKNCOA, Jobner and COA, Bikaner were
selected purposively due to the reason that all the students of
these colleges have been provided internet facility at free of cost
for UG students in college library and for PG and Ph.D. students
in their concerned departments.
4.2.3 Selection of respondents :
From the two selected agricultural colleges separate
lists of male and female students from B.Sc. (Ag.) Hons,
M.Sc. (Ag.) Hons. and Ph.D. degree, registered in 2008-09
and using the internet were prepared with the help of records
of student sections, from this list a separate lists of internet
utilizing male and female agricultural students from different
degree courses i.e. B.Sc. (Ag.) Hons., M.Sc. (Ag.) Hons and
Ph.D. Degree were prepared from internet cell registers of the
respective colleges and 25 per cent male and female internet
utilizing students from each degree course i.e. B.Sc. (Ag.)
Hons, M.Sc. (Ag.) Hons. and Ph.D. degree, were selected by
using simple random sampling with proportionate allocation
method. Hence a total sample of 113 agricultural students (85
male agricultural students and 28 female agricultural students)
were selected from the study purpose.
In this way a total sample comprised of 113 students (85 male and 28 female
students) from B.Sc (Ag.) Hons., M.Sc. (Ag.) Hons. and Ph.D. degrees were selected
for study purpose. (Table 4.1)
4.3 Variables and their empirical measures
The variables under study were selected on the basis of extensive review of
literature related to the subject and consultation with experts and finally the variables
that are found to be most relevant to the present study are selected. The measurement
procedure of the variables used in the study are presented in the following sections :
4.3.1 Measurement of dependent variables
There were three dependent variables in the study. The measurement
procedure of these variables has been presented as under:
4.3.1.1 Measurement of internet utilization pattern of the agriculture students
4.3.1.2 Measurement of effect of internet utilization on over all performance of the
agricultural students.
4.3.1.3 Measurement of the constraints faced in internet utilization by the agricultural
students.
4.3.1.1 Measurement of internet utilization pattern of the agriculture students
The Internet utilization pattern was operationally defined as the pattern of use
of internet in communication, incorporating ways, frequency, duration, places, purpose,
use of internet components and benefits derived from the internet usage in
combination.
To measure the level of Internet exposure of respondents different indicators of
Internet utilization pattern were identified on the basis of review of literature and
discussion with subject experts of the internet and department of extension education
of SKNCOA, Jobner. In this way total 19 indicators viz.; (1) Experience of internet use,
(2) Preference of place of access to Internet, (3) Expenditure incurred to use Internet,
(4) Frequency of Internet use, (5) Purpose of Internet use, (6) Possession of E-mail ID,
(7) Frequency of E-mail use, (8) Purpose of E-mail use, (9) Frequency of chatting to
make communication, (10) Extent of chatting, (11) Use of different search-engines, (12)
Rating the internet as sources of information, (13) Satisfaction with internet facility, (14)
Preference of internet on other media for getting information, (15) Browsing techniques
required for getting information from the internet, (16) Locating the desired information
on the Internet, (17) Activities during Internet use, (18) Preference of timing of access
to Internet and (19) Orientation to Internet source.
The scoring procedure of each of these indicators is explained as under was
identified.
4.3.1.1.1 Experience of internet use
The experience of Internet use of the respondents were measured in total
number of years of their association with Internet and its use. The respondents were
categorized in to three groups viz., from 1 year, from 1-2 years and from more than 3
years of use and scoring was done by assigning 1, 2 and 3 score, respectively
(Appendix-III).
4.3.1.1.2 Preference of place of access to internet
The preference of places of internet access by the respondents were
measured by a structured schedule developed by the investigator in light of the
suggestions of the experts and the responses of the respondents were collected on a
three point continuum namely Mostly, Some time and Never with a score of 2, 1 and 0,
respectively (Appendix-III).
4.3.1.1.3 Expenditure spent for internet use
The expenditure in rupees spent per month by the respondents for internet
use was measured by a structured schedule developed by the investigator by getting
experts opinion and the responses of the respondents were collected in five classes
namely Nil, Rupees 50-100, Rupees 101-200, Rupees 201-300 and Rupees 301-400
per month with a score of 0, 1, 2, 3 and 4 respectively (Appendix-III).
4.3.1.1.4 Frequency of internet use
Frequency of internet use of the respondents were measured by a structured
schedule developed by the investigator in light of the suggestions of the experts and
the responses of the respondents were collected on three point continuum namely
Upto 1 hours, 2 to 3 hours and above 3 hours with a score of 1, 2 and 3, respectively
(Appendix-III).
4.3.1.1.5 Purpose of internet use
The purpose of Internet use of the respondents were measured by a
structured schedule developed by the investigator in light of the suggestions of the
experts and the responses of the respondents were collected on three point continuum
namely Mostly, Some times and Never with a score of 2, 1 and 0, respectively
(Appendix-III).
4.3.1.1.6 Possession of E-mail ID
The respondents were asked to give information regarding possession of e-
mail ID and were measured by a structured schedule developed by the investigator in
light of the suggestions of the experts and the responses of the respondents were
collected in to four groups viz. No Mail ID, One mail ID, Two Mail ID and More than two
Mail ID and the scores of „0‟, „1‟, „2‟ and „3‟ were assigned respectively (Appendix-III).
4.3.1.1.7 Frequency of E-mail use
In this part of internet utilization pattern the frequency of e-mail use of the
internet utilization male and female students was measured i.e. for how much time and
with how much duration the respondents are using E-mail. These were measured by a
structured schedule developed by the investigator in light of the suggestions of the
experts and the responses of the respondents were collected on three point continuum
namely Upto 1 hour, 2 to 3 hours and above 3 hours with a score of 1, 2 and 3,
respectively (Appendix-III).
4.3.1.1.8 Purpose of E-mail use
The purpose of E-mail use of the respondents were measured by a structured
schedule developed by the investigator by getting experts opinion and the responses of
the respondents were collected in five classes namely Pleasure purpose, Personal
purpose, Academic purpose, Advertisement purpose and Others purpose and a score
of 1 was given to “Yes” response and zero score to “No” responses (Appendix-III).
4.3.1.1.9 Frequency of chatting to make communication
Chatting to make communication of the respondents were measured by a
structured schedule developed by the investigator by getting experts opinion and the
responses of the respondents were collected in yes and No categories and a of 1 was
given 1 to “Yes” response and zero score to “No” response respectively (Appendix-III).
4.3.1.1.10 Extent of Chatting
Frequency of chatting of the respondents were measured by a structured
schedule developed by the investigator in light of the suggestions of the experts and
the responses of the respondents were collected on three point continuum namely
Upto 1 hours, 2 to 3 hours and above 3 hours with a score of 1, 2 and 3, respectively
(Appendix-III).
4.3.1.1.11 Use of different search engines
Use of different search engines by the respondents were measured by a
structured schedule developed by the investigator in light of the suggestions of the
experts and the responses of the respondents were collected on three point continuum
namely Mostly, Some times and Never with a score of 2, 1 and 0, respectively
(Appendix-III).
4.3.1.1.12 Rating of internet as a source of information
The rating of internet as a source of information by the respondents were
measured by a structured schedule developed by the investigator by getting experts
opinion and the responses of the respondents were collected on four point continuum
viz., Unsatisfactory, Satisfactory, Good and Excellent and a scores of 1, 2, 3 and 4
were given, respectively (Appendix-III).
4.3.1.1.13 Satisfaction with internet facility
Satisfaction with internet facility by the respondents were measured by a
structured schedule developed by the investigator in light of the suggestions of the
experts and the responses of the respondents were collected on four point continuum
viz., Not satisfied, Least satisfied, Partially satisfied and Fully satisfied and a scores of
1, 2, 3 and 4 were given, respectively (Appendix-III).
4.3.1.1.14 Preference of internet on other media for getting information
Preference of internet on other media for getting information by the
respondents were measured by a structured schedule developed by the investigator in
light of the suggestion of the experts and the responses of the respondents were
collected on four point continuum viz., Most preferred, Preferred, Less preferred, and
Not preferred with a scores of 3, 2, 1 and 0 respectively (Appendix-III).
4.3.1.1.15 Browsing techniques required for getting information from the internet
Browsing techniques required for getting information from the internet by the
respondents were measured by a structured schedule developed by the investigator in
light of the suggestions of the experts and the responses of the respondents were
collected on three point continuum namely Mostly, Some times and Never with a score
of 2, 1 and 0, respectively (Appendix-III).
4.3.1.1.16 Locating the desired information on the internet
The locating the desired information on the internet of the respondents were
measured by a structured schedule developed by the investigator by getting experts
opinion and the responses of the respondents were classified in to four groups viz.,
Never, Rarely, Sometime and Frequently and a scores of 0, 1, 2 and 3 were given,
respectively (Appendix-III).
4.3.1.1.17 Activities during Internet use
Activities during Internet use by the respondents were measured by a
structured schedule developed by the investigator by getting experts opinion and the
responses of the respondents were collected in to two categories viz., Just watching
internet and Write useful information on separate pages with a score of 1 and 2
respectively (Appendix-III).
4.3.1.1.18 Preference of timing of access to internet
Preference of timing of access to internet by the respondents were measured
by a structured schedule developed by the investigator in light of the suggestions of the
experts and the responses of the respondents were collected in four categories namely
Morning, Noon, Evening and Night (Appendix-III).
4.3.1.1.19 Orientation of internet sources
Orientation of internet sources of the respondents were measured by a
structured schedule developed by the investigator by getting experts opinion and the
responses of the respondents were collected in to four categories namely From my
classmates, On my own by surfing around the internet, Library staff guidance and
Others (Appendix-III).
4.3.1.1.20 Internet utilization level
To know internet utilization level of all the respondents, the score of all the
above mentioned nineteen indicators were worked out and summed up for each
respondent to find out the internet utilization pattern of each of the respondent. On the
basis of mean and standard deviation the respondents were categorised in to three
levels namely Low, Medium and High.
Low = (Mean – standard deviation)
Medium = (Mean – standard deviation) to (Mean + standard deviation)
High = (Above mean + standard deviation)
4.3.1.2 Measurement of effect of internet utilization on over all performance
of the agricultural students
Effect of internet utilization on over all performance of the agricultural students
a list of two indicators was developed namely Academic performance and Non
academic performance of the respondents were measured as the extent to which the
internet usage has influenced their academic and non academic activities in both the
positive and negative aspects. To study the effect of internet utilization on overall
performance of the respondents the following guides were developed and used on a
five point likert type scale. The scoring was done as follows: Strongly agree (5), Agree
(4), Neutral (3), Disagree (2) And strongly disagree (1).
4.3.1.2.1 Measurement of effect of internet utilization on academic performance
of the agricultural students
The academic performance of the respondents was measured by a
structured schedule developed by the investigator by getting experts opinion. The
schedule consists of a list of 10 indicators related to academic performance. The
academic performance score of a particular statement was worked out by totaling the
scores obtained by that particular statement by all the respondents. Then, the mean
percentage score of each statement was worked out and these were arranged in rank
order according to their severity (Appendix-IV).
4.3.1.2.2 Measurement of effect of internet utilization on non academic
performance of the agricultural students
The non academic performance of the respondents was measured by a
structured schedule developed by the investigator by getting experts opinion. The
schedule consist of a list of 6 indicators related to non academic performance. The non
academic performance score of a particular statement was worked out by totaling the
scores obtained by that particular statement by all the respondents. Then, the mean
percentage score of each statement was worked out and these were arranged in rank
order according to their severity ((Appendix-IV)).
4.3.1.3 Measurement of the constraints faced in internet utilization by the
agricultural students
The constraints faced by the respondents in Internet use offered by them to
effectively utilize the internet services are elicited through a structured interview –
schedule developed by investigators by gating experts opinion and the responses of
the respondents were divided in to five major categories i.e. Physical constraints,
Technical constraints, Economical constraints, Operational constraints and
Psychological constraints. The responses were tabulated based on frequency,
percentage, MPS, rank and rank correlation order were given (Appendix-V).
4.3.2 Measurement of independent variables
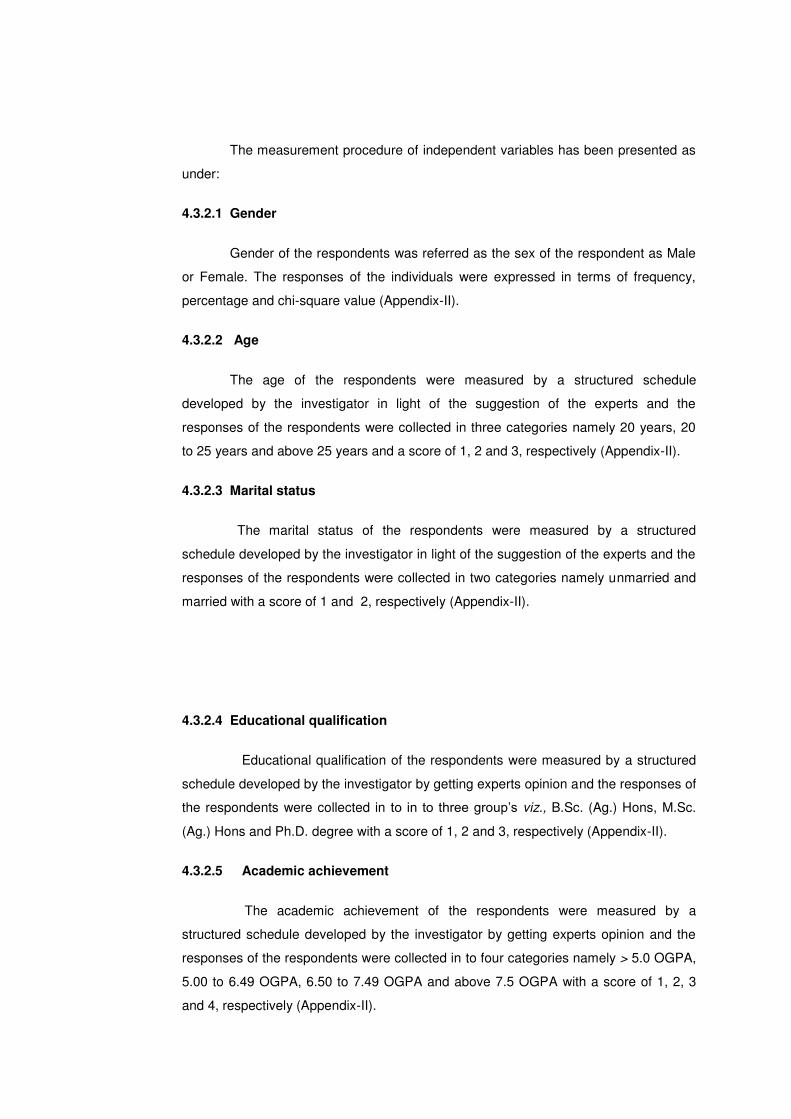
The measurement procedure of independent variables has been presented as
under:
4.3.2.1 Gender
Gender of the respondents was referred as the sex of the respondent as Male
or Female. The responses of the individuals were expressed in terms of frequency,
percentage and chi-square value (Appendix-II).
4.3.2.2 Age
The age of the respondents were measured by a structured schedule
developed by the investigator in light of the suggestion of the experts and the
responses of the respondents were collected in three categories namely 20 years, 20
to 25 years and above 25 years and a score of 1, 2 and 3, respectively (Appendix-II).
4.3.2.3 Marital status
The marital status of the respondents were measured by a structured
schedule developed by the investigator in light of the suggestion of the experts and the
responses of the respondents were collected in two categories namely unmarried and
married with a score of 1 and 2, respectively (Appendix-II).
4.3.2.4 Educational qualification
Educational qualification of the respondents were measured by a structured
schedule developed by the investigator by getting experts opinion and the responses of
the respondents were collected in to in to three group‟s viz., B.Sc. (Ag.) Hons, M.Sc.
(Ag.) Hons and Ph.D. degree with a score of 1, 2 and 3, respectively (Appendix-II).
4.3.2.5 Academic achievement
The academic achievement of the respondents were measured by a
structured schedule developed by the investigator by getting experts opinion and the
responses of the respondents were collected in to four categories namely > 5.0 OGPA,
5.00 to 6.49 OGPA, 6.50 to 7.49 OGPA and above 7.5 OGPA with a score of 1, 2, 3
and 4, respectively (Appendix-II).
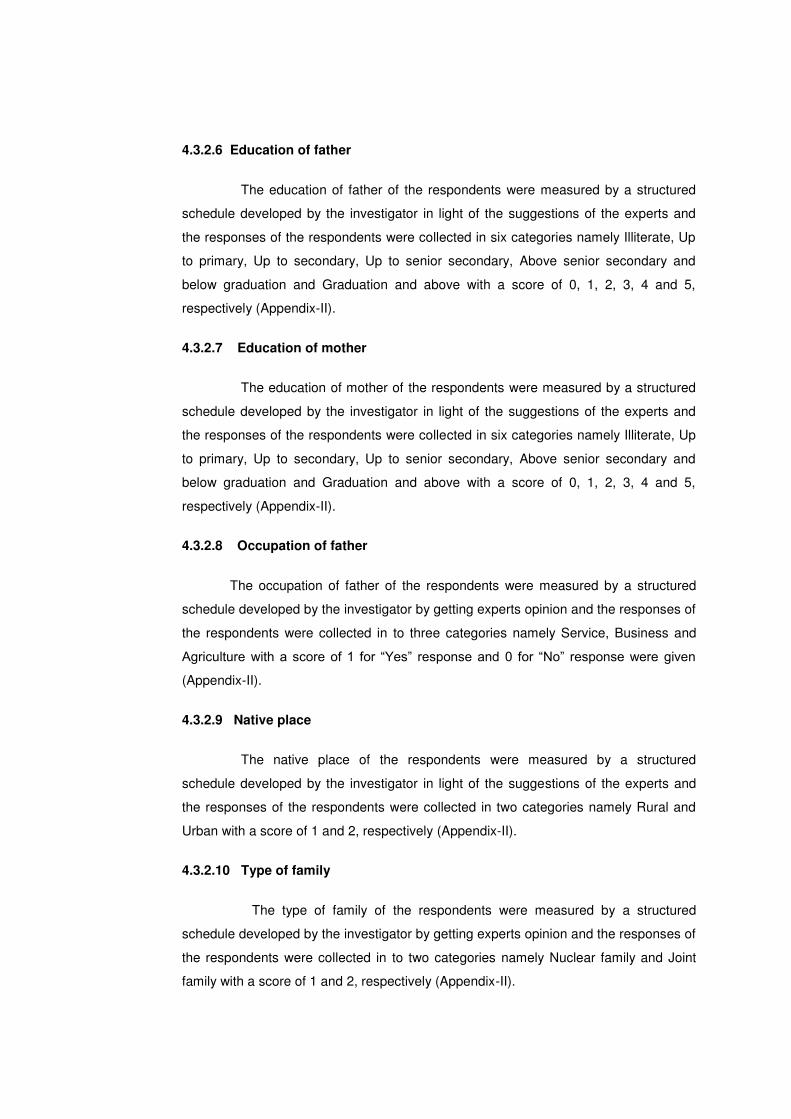
4.3.2.6 Education of father
The education of father of the respondents were measured by a structured
schedule developed by the investigator in light of the suggestions of the experts and
the responses of the respondents were collected in six categories namely Illiterate, Up
to primary, Up to secondary, Up to senior secondary, Above senior secondary and
below graduation and Graduation and above with a score of 0, 1, 2, 3, 4 and 5,
respectively (Appendix-II).
4.3.2.7 Education of mother
The education of mother of the respondents were measured by a structured
schedule developed by the investigator in light of the suggestions of the experts and
the responses of the respondents were collected in six categories namely Illiterate, Up
to primary, Up to secondary, Up to senior secondary, Above senior secondary and
below graduation and Graduation and above with a score of 0, 1, 2, 3, 4 and 5,
respectively (Appendix-II).
4.3.2.8 Occupation of father
The occupation of father of the respondents were measured by a structured
schedule developed by the investigator by getting experts opinion and the responses of
the respondents were collected in to three categories namely Service, Business and
Agriculture with a score of 1 for “Yes” response and 0 for “No” response were given
(Appendix-II).
4.3.2.9 Native place
The native place of the respondents were measured by a structured
schedule developed by the investigator in light of the suggestions of the experts and
the responses of the respondents were collected in two categories namely Rural and
Urban with a score of 1 and 2, respectively (Appendix-II).
4.3.2.10 Type of family
The type of family of the respondents were measured by a structured
schedule developed by the investigator by getting experts opinion and the responses of
the respondents were collected in to two categories namely Nuclear family and Joint
family with a score of 1 and 2, respectively (Appendix-II).
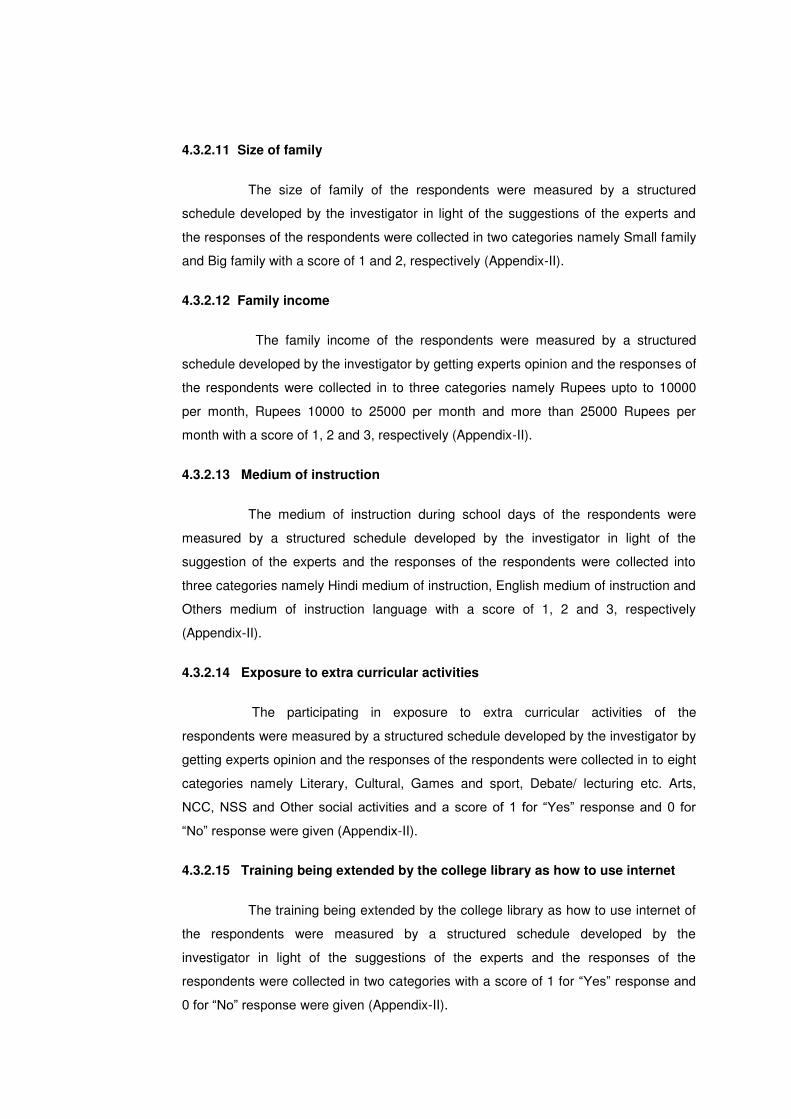
4.3.2.11 Size of family
The size of family of the respondents were measured by a structured
schedule developed by the investigator in light of the suggestions of the experts and
the responses of the respondents were collected in two categories namely Small family
and Big family with a score of 1 and 2, respectively (Appendix-II).
4.3.2.12 Family income
The family income of the respondents were measured by a structured
schedule developed by the investigator by getting experts opinion and the responses of
the respondents were collected in to three categories namely Rupees upto to 10000
per month, Rupees 10000 to 25000 per month and more than 25000 Rupees per
month with a score of 1, 2 and 3, respectively (Appendix-II).
4.3.2.13 Medium of instruction
The medium of instruction during school days of the respondents were
measured by a structured schedule developed by the investigator in light of the
suggestion of the experts and the responses of the respondents were collected into
three categories namely Hindi medium of instruction, English medium of instruction and
Others medium of instruction language with a score of 1, 2 and 3, respectively
(Appendix-II).
4.3.2.14 Exposure to extra curricular activities
The participating in exposure to extra curricular activities of the
respondents were measured by a structured schedule developed by the investigator by
getting experts opinion and the responses of the respondents were collected in to eight
categories namely Literary, Cultural, Games and sport, Debate/ lecturing etc. Arts,
NCC, NSS and Other social activities and a score of 1 for “Yes” response and 0 for
“No” response were given (Appendix-II).
4.3.2.15 Training being extended by the college library as how to use internet
The training being extended by the college library as how to use internet of
the respondents were measured by a structured schedule developed by the
investigator in light of the suggestions of the experts and the responses of the
respondents were collected in two categories with a score of 1 for “Yes” response and
0 for “No” response were given (Appendix-II).
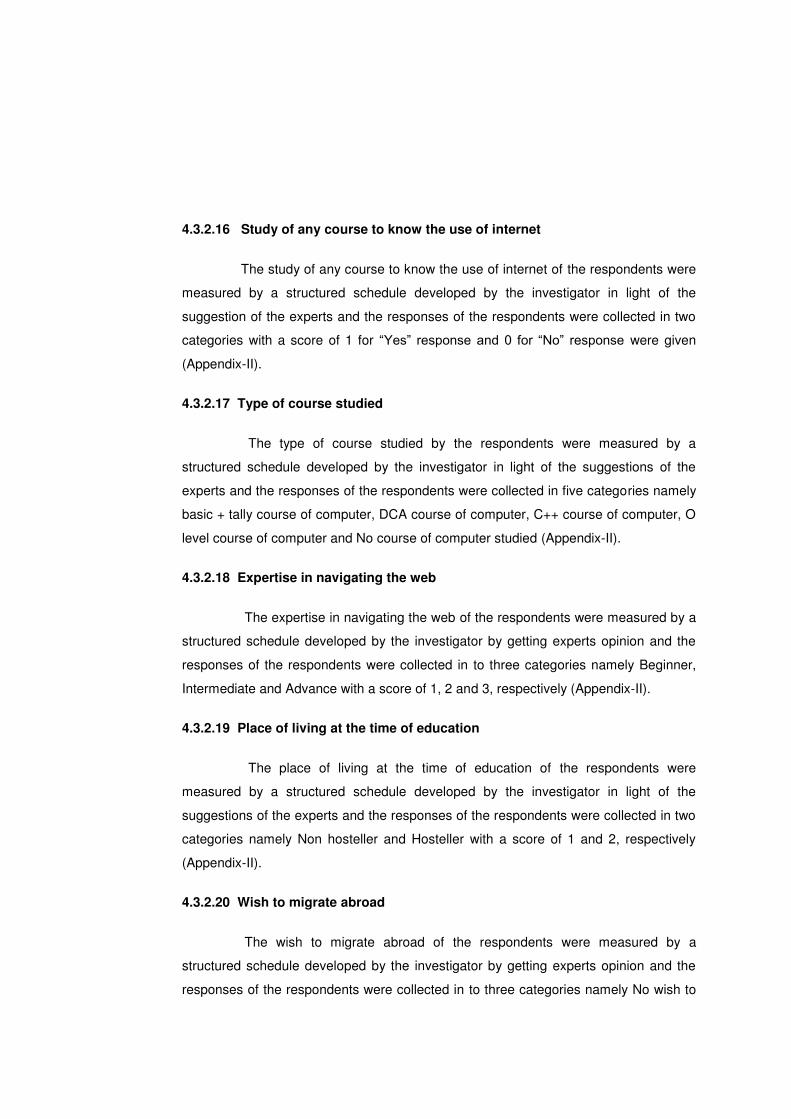
4.3.2.16 Study of any course to know the use of internet
The study of any course to know the use of internet of the respondents were
measured by a structured schedule developed by the investigator in light of the
suggestion of the experts and the responses of the respondents were collected in two
categories with a score of 1 for “Yes” response and 0 for “No” response were given
(Appendix-II).
4.3.2.17 Type of course studied
The type of course studied by the respondents were measured by a
structured schedule developed by the investigator in light of the suggestions of the
experts and the responses of the respondents were collected in five categories namely
basic + tally course of computer, DCA course of computer, C++ course of computer, O
level course of computer and No course of computer studied (Appendix-II).
4.3.2.18 Expertise in navigating the web
The expertise in navigating the web of the respondents were measured by a
structured schedule developed by the investigator by getting experts opinion and the
responses of the respondents were collected in to three categories namely Beginner,
Intermediate and Advance with a score of 1, 2 and 3, respectively (Appendix-II).
4.3.2.19 Place of living at the time of education
The place of living at the time of education of the respondents were
measured by a structured schedule developed by the investigator in light of the
suggestions of the experts and the responses of the respondents were collected in two
categories namely Non hosteller and Hosteller with a score of 1 and 2, respectively
(Appendix-II).
4.3.2.20 Wish to migrate abroad
The wish to migrate abroad of the respondents were measured by a
structured schedule developed by the investigator by getting experts opinion and the
responses of the respondents were collected in to three categories namely No wish to
go abroad, Wish to go abroad for study and Wish to go abroad for settling with a score
of 1, 2 and 3, respectively (Appendix-II).
4.3.2.21 Wish to get higher academic degree
The wish to get higher academic degree of the respondents were measured
by a structured schedule developed by the investigator in light of the suggestions of the
experts and the responses of the respondents were collected in two categories namely
Willing to have next degree and Not willing to have next degree with a score of 1 and
0, respectively (Appendix-II).
4.3.2.22 Frequency of library use
The frequency of library use of the respondents were measured by a
structured schedule developed by the investigator in light of the suggestions of the
experts and the responses of the respondents were collected in three point continuum
namely Upto 1 hours, 2 to 3 hours and above 3 hours with a score of 1, 2 and 3,
respectively (Appendix-II).
4.3.2.23 Wish to serve in different areas
The wish to serve in different areas of the respondents were measured by a
structured schedule developed by the investigator by getting experts opinion and the
responses of the respondents were collected in to ten categories namely Banking,
Management, Government agricultural sector, Private agricultural sector, Own
business, Military service, Administrative services, Railway services, Marketing and
NGO with a score of 1 for “yes” response and 0 for “No‟ response were given
(Appendix-II).
4.4 Tools and techniques of data collection
The data were collected with the help of an interview schedule. The interview
schedule was prepared in consultation with the available literatures, experts in the field
of extension and information technology and keeping in view the objectives of the study
the schedule was prepared in a simple language. The interview schedule consists of
four parts. The first part of the schedule consisted of questions pertaining to personal
and family characteristics of the agricultural students, while the second part was used
for measuring internet utilization pattern of the respondents. The third part pertains to
effect of internet utilization on overall performance of the respondents and fourth part
consists of constraints faced in effective use of internet services being provided to
respondents. The data were collected with the help of the interview –schedule. Data
collection was done by personally interviewing the respondents with the help of
interview-schedule.
4.5 Statistical measures used for analysis of data
After collecting the data from 113 respondents (85 Male agricultural students
and 28 female agricultural students) they were transferred to the work tables and tally
sheets were prepared. They were processed, classified, analized and subjected to
statistical analysis. The cross tables were prepared and the data were interpreted in
the light of the objectives of the study.
Statistical measured used
To analyze the collected information‟s several statistical tools and methods
were used. The following statistical methods were used for interpreting the data and
testing the hypotheses.
4.5.1 Percentage and frequency: Simple comparison was made on the basis of
percentage and frequency
4.5.2 Arithmetic mean : It was used to find out the mean (average) value of the
dependent and independent variables
4.5.3 Mean score (MS) : MS was obtained by total scores of each statement divided
by total number of respondents.
Total score of a practice Mean Score = Total No. of respondents
4.5.4 Mean percent score (MPS) : MPS was obtained by multiplying total obtained
score of the respondents by hundred and dividing by the maximum obtainable
score under each practices.
Total score obtained by the respondents MPS = x 100
Maximum obtainable score
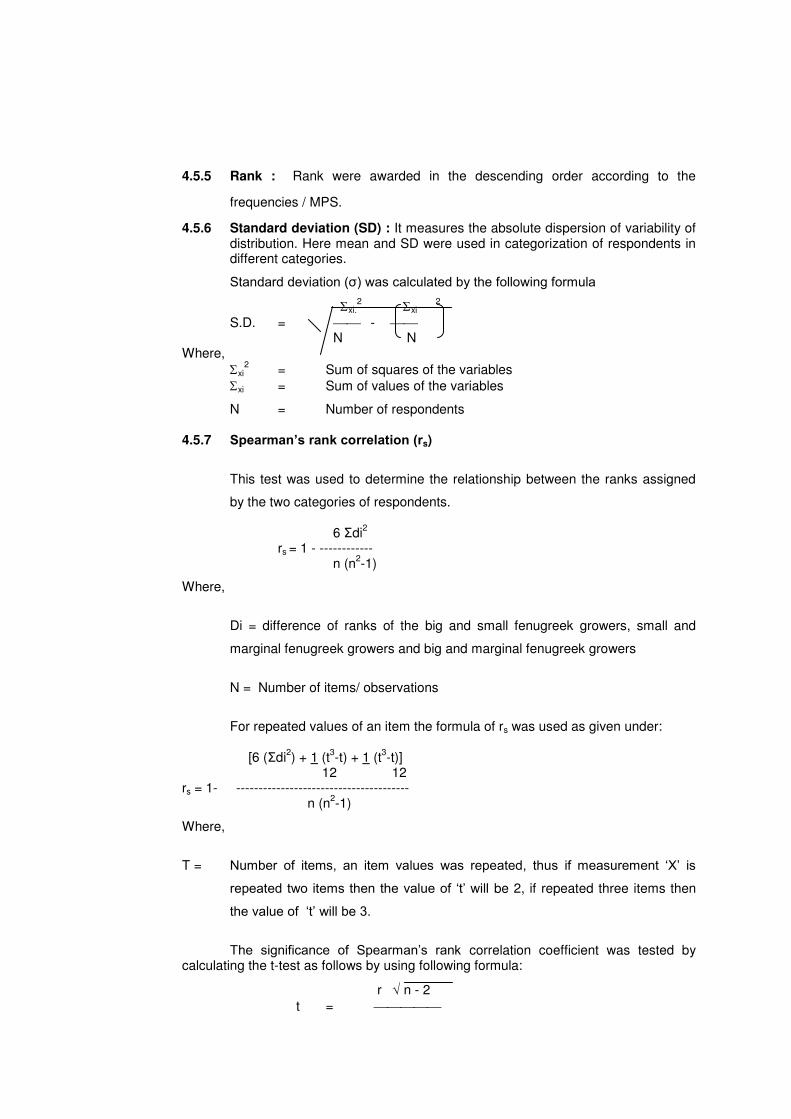
4.5.5 Rank : Rank were awarded in the descending order according to the
frequencies / MPS.
4.5.6 Standard deviation (SD) : It measures the absolute dispersion of variability of distribution. Here mean and SD were used in categorization of respondents in different categories.
Standard deviation (σ) was calculated by the following formula
xi.2 xi
2
S.D. = - N N
Where,
xi2 = Sum of squares of the variables
xi = Sum of values of the variables
N = Number of respondents
4.5.7 Spearman’s rank correlation (rs)
This test was used to determine the relationship between the ranks assigned
by the two categories of respondents.
6 Σdi2
rs = 1 - ------------ n (n
2-1)
Where,
Di = difference of ranks of the big and small fenugreek growers, small and
marginal fenugreek growers and big and marginal fenugreek growers
N = Number of items/ observations
For repeated values of an item the formula of rs was used as given under:
[6 (Σdi2) + 1 (t
3-t) + 1 (t
3-t)]
12 12 rs = 1- --------------------------------------- n (n
2-1)
Where,
T = Number of items, an item values was repeated, thus if measurement „X‟ is
repeated two items then the value of „t‟ will be 2, if repeated three items then
the value of „t‟ will be 3.
The significance of Spearman‟s rank correlation coefficient was tested by calculating the t-test as follows by using following formula:
r n - 2 t =
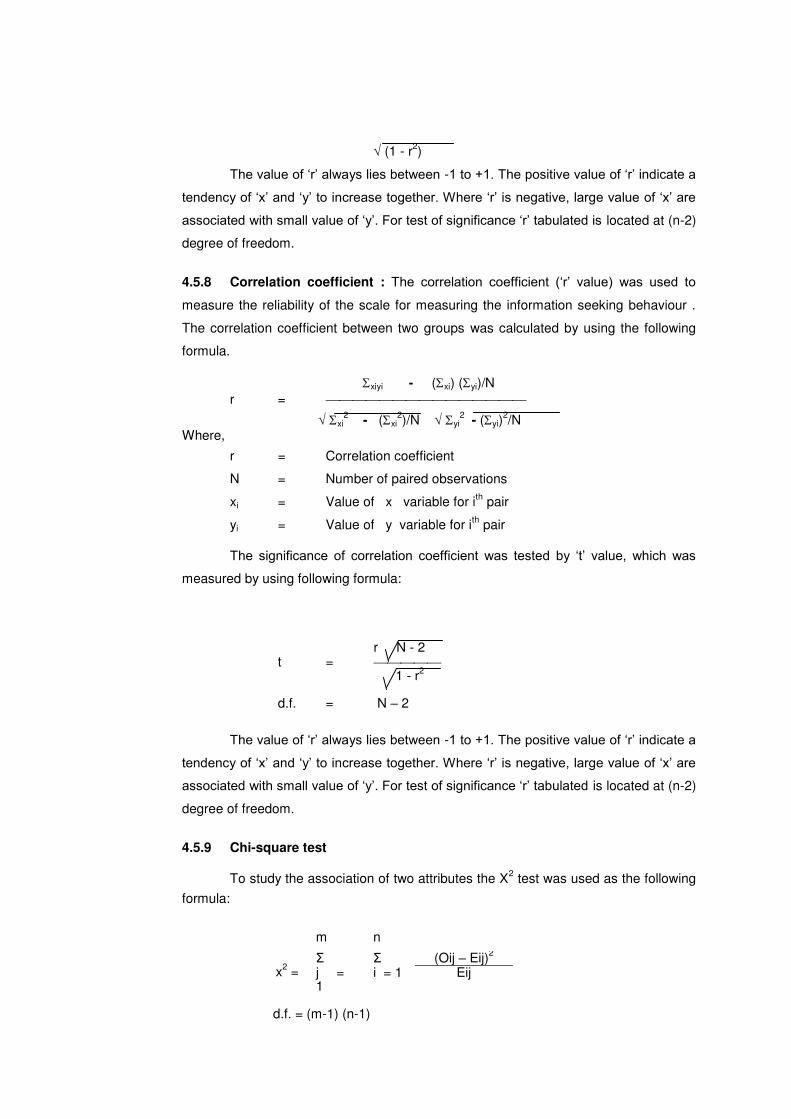
(1 - r2)
The value of „r‟ always lies between -1 to +1. The positive value of „r‟ indicate a
tendency of „x‟ and „y‟ to increase together. Where „r‟ is negative, large value of „x‟ are
associated with small value of „y‟. For test of significance „r‟ tabulated is located at (n-2)
degree of freedom.
4.5.8 Correlation coefficient : The correlation coefficient („r‟ value) was used to
measure the reliability of the scale for measuring the information seeking behaviour .
The correlation coefficient between two groups was calculated by using the following
formula.
xiyi - (xi) (yi)/N
r = xi
2 - (xi
2)/N yi
2 - (yi)
2/N
Where,
r = Correlation coefficient
N = Number of paired observations
xi = Value of x variable for ith pair
yi = Value of y variable for ith pair
The significance of correlation coefficient was tested by „t‟ value, which was
measured by using following formula:
r N - 2 t = 1 - r
2
d.f. = N – 2
The value of „r‟ always lies between -1 to +1. The positive value of „r‟ indicate a
tendency of „x‟ and „y‟ to increase together. Where „r‟ is negative, large value of „x‟ are
associated with small value of „y‟. For test of significance „r‟ tabulated is located at (n-2)
degree of freedom.
4.5.9 Chi-square test
To study the association of two attributes the X2 test was used as the following
formula:
m n
x
2 =
Σ Σ (Oij – Eij)2
j = 1
i = 1 Eij
d.f. = (m-1) (n-1)
Where
Oij = Observed frequency of (i.j)th cell
Eij = Expected frequency of (i.j)th cell
4.5.10 Contingency of coefficient
To find out the high and low association between independent and dependent
(Internet utilization pattern) variables, following formula was used:
C – root X2\ X2 plus n
Where,
C Contingency coefficient
X2 Chi-square value
N Sample size
4.5.11 Coefficient of variance
cv = σ / μ,
Where:
4.6.1 Derivation of hypotheses in null form
Considering the importance of the factors selected to be studied with reference
to the objectives of the present study, the hypotheses for this study were framed in null
form as follows:
H01 There is no significant agreement between the internet utilizing male and
female agricultural students with reference to their Gender, Age, Marital status,
Educational qualification, Academic achievement, Education of father,
Education of mother, Occupation of father, Native place, Type of family, Size of
family, Family income, Medium of instruction, Exposure to extra – curricular
activities, Training being extended by the college library as to how to use
Internet, Studied of any course to know use of Internet, Type of course
studied, Expertise in navigating the web, Place of living at the time of
education, Wish to migrate abroad, Wish to get higher academic degree,
Frequency of library use and Wish to serve in different areas.
H02.1 There is no significant agreement between the internet utilizing male and
female agricultural students with the reference of their Experience of internet
use, Preference of place of access to Internet, Expenditure incurred to use
Internet, Frequency of Internet use, Purpose of Internet use, Possession of E-
mail ID, Frequency of E-mail use, Purpose of E-mail use, use of chatting to
make communication, Frequency of chatting, Use of different search-engines,
Rating the internet as sources of information, Satisfaction with internet facility,
Preference of internet on other media for getting information, Browsing
techniques required for getting information from the internet, Locating the
desired information on the Internet, Activities during Internet use, Preference of
timing of access to Internet and Orientation to Internet source.
H02.2 There is no significant agreement between internet utilizing male and female
agricultural students with reference to their internet utilization level.
H03.1 There is no significant effect of internet utilization on the over all performance
of the male and female agricultural students with reference to their academic
performance.
H03.2 There is no significant effect of internet utilization on the over all performance
of the male and female agricultural students with reference to their non
academic performance.
H04.1 There is no significant association between the internet utilization of male and
female agricultural students and their age.
H04.2 There is no significant association between the internet utilization of male and
female agricultural students and their Marital status.
H04.3 There is no significant association between the internet utilization of male and
female agricultural students and their educational qualification.
H04.4 There is no significant association between the internet utilization of male and
female agricultural students and their academic achievement.
H04.5 There is no significant association between the internet utilization of male and
female agricultural students and their education of father.
H04.6 There is no significant association between the internet utilization of male and
female agricultural students and their education of mother.
H04.7 There is no significant association between the internet utilization of male and
female agricultural students and their occupation of father.
H04.8 There is no significant association between the internet utilization of male and
female agricultural students and their native place.
H04.9 There is no significant association between the internet utilization of male and
female agricultural students and their type of family.
H04.10 There is no significant association between the internet utilization of male and
female agricultural students and their size of family.
H04.11 There is no significant association between the internet utilization of male and
female agricultural students and their family income.
H04.12 There is no significant association between the internet utilization of male and
female agricultural students and their medium of instruction.
H04.13 There is no significant association between the internet utilization of male and
female agricultural students and their training being extended by the college
library as to how to use Internet.
H04.14 There is no significant association between the internet utilization of male and
female agricultural students and their studied of any course to know the use of
Internet.
H04.15 There is no significant association between the internet utilization of male and
female agricultural students and their type of course studied.
H04.16 There is no significant association between the internet utilization of male and
female agricultural students and their expertise in navigating the web.
H04.17 There is no significant association between the internet utilization of male and
female agricultural students and their place of living at the time of education.
H04.18 There is no significant association between the internet utilization of male and
female agricultural students and their wish to migrate abroad.
H04.19 There is no significant association between the internet utilization of male and
female agricultural students and wish to get higher academic degree.
H05.1 There is no significant agreement in perceiving the physical constraints faced
by the internet utilizing male and female agricultural students.
H05.2 There is no significant agreement in perceiving the technical constraints faced
by the internet utilizing male and female agricultural students.
H05.3 There is no significant agreement in perceiving the economical constraints
faced by the internet utilizing male and female agricultural students.
H05.4 There is no significant agreement in perceiving the operational constraints
faced by the internet utilizing male and female agricultural students.
H05.5 There is no significant agreement in perceiving the psychological constraints
faced by the internet utilizing male and female agricultural students.
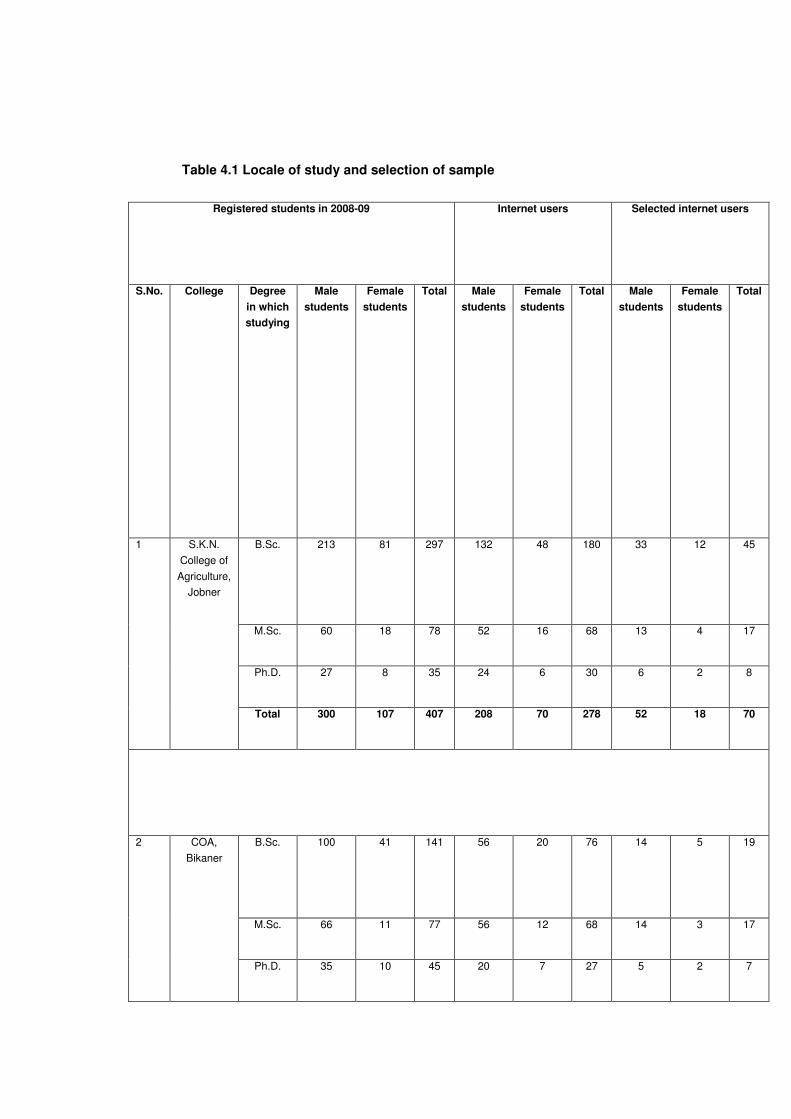
Table 4.1 Locale of study and selection of sample
Registered students in 2008-09 Internet users Selected internet users
S.No. College Degree
in which
studying
Male
students
Female
students
Total Male
students
Female
students
Total Male
students
Female
students
Total
1 S.K.N.
College of
Agriculture,
Jobner
B.Sc. 213 81 297 132 48 180 33 12 45
M.Sc. 60 18 78 52 16 68 13 4 17
Ph.D. 27 8 35 24 6 30 6 2 8
Total 300 107 407 208 70 278 52 18 70
2 COA,
Bikaner
B.Sc. 100 41 141 56 20 76 14 5 19
M.Sc. 66 11 77 56 12 68 14 3 17
Ph.D. 35 10 45 20 7 27 5 2 7
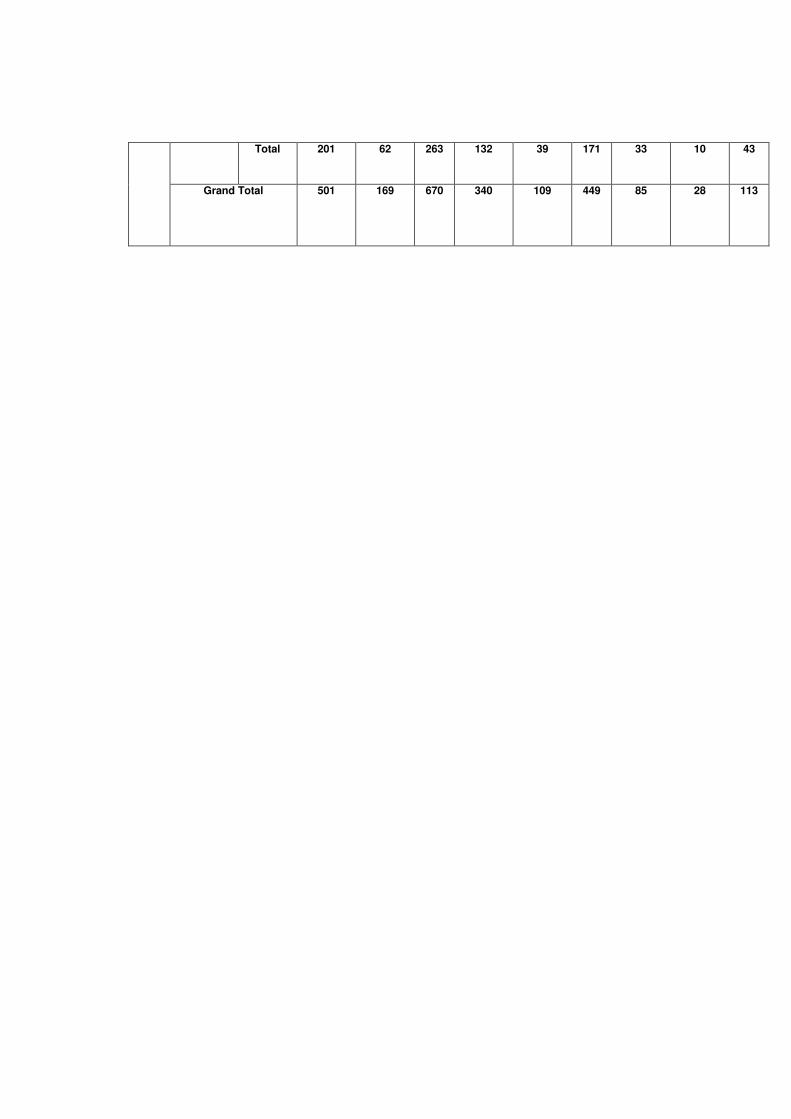
Total 201 62 263 132 39 171 33 10 43
Grand Total 501 169 670 340 109 449 85 28 113
5 RESULT AND DISCUSSION
This chapter deals with findings of the present study that have been derived
subjecting data to statistical analysis and their interpretation. The results and their
interpretation have been presented under following heads :
5.1 Personal and family characteristics of the Agricultural Students
5.2 Internet utilization pattern of Agricultural Students
5.3 Effect of internet utilization on overall performance of Agricultural students
5.4 Factors associated with the internet utilization of agricultural students.
5.5 Constraints faced in Internet utilization by Agricultural Students
5.1 Personal and family characteristics of the Agricultural
Students
The internet utilizing male and female agricultural students personal
characteristics like Gender, Age, Marital status, Educational qualification, Academic
achievement, Education of father, Education of mother, Occupation of father, Native place,
Type of family, Size of family, Family income, Medium of instruction, Exposure to extra –
curricular activities, Training being extended by the college library as to how to use
Internet, Study of any course to know the use of Internet, Type of course studied,
Expertise in navigating the web, Place of living at the time of education, Wish to migrate
abroad, Wish to get higher academic degree, Frequency of library use and wish to serve in
different areas included. The data regarding the aspects has been presented in following
heads:
5.1.1 Gender
It is evident from the table 5.1.1 that majority (75.22%) of the respondents were
male, and the female comprised of only 24.78 per cent of the total respondents (Fig.
5.1.1).
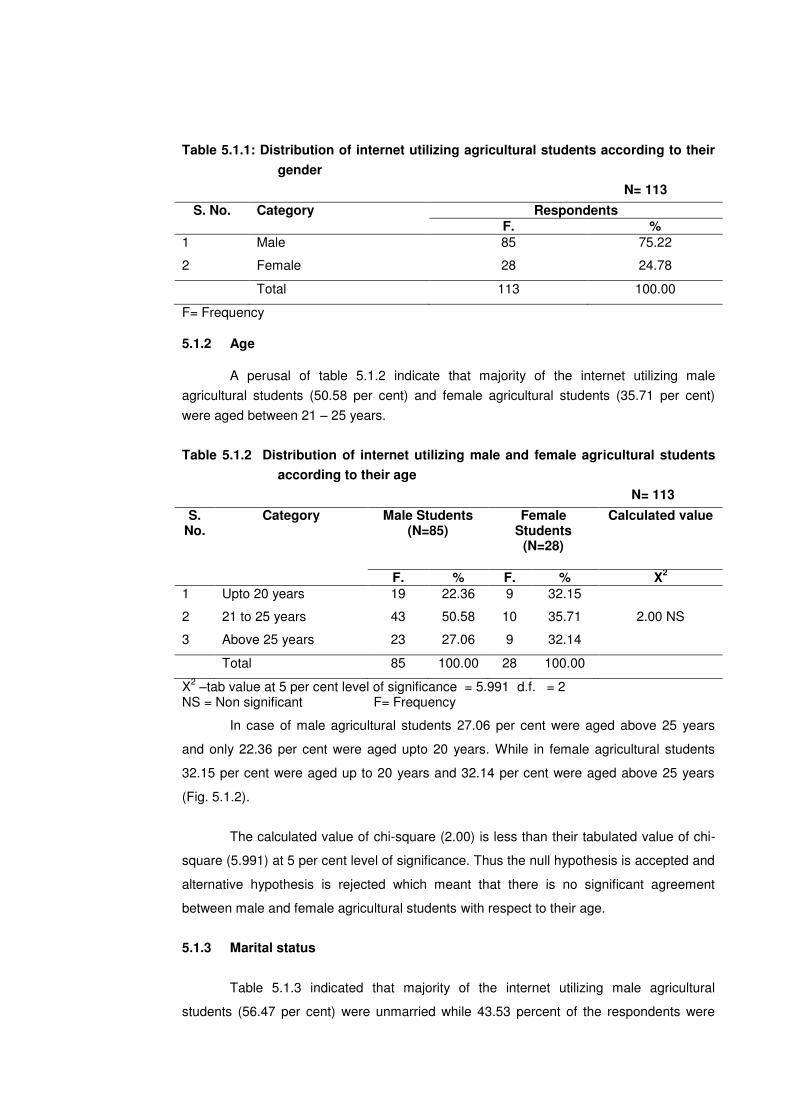
Table 5.1.1: Distribution of internet utilizing agricultural students according to their
gender
N= 113
S. No. Category Respondents F. %
1 Male 85 75.22
2 Female 28 24.78
Total 113 100.00
F= Frequency
5.1.2 Age
A perusal of table 5.1.2 indicate that majority of the internet utilizing male
agricultural students (50.58 per cent) and female agricultural students (35.71 per cent)
were aged between 21 – 25 years.
Table 5.1.2 Distribution of internet utilizing male and female agricultural students
according to their age
N= 113
S. No.
Category Male Students (N=85)
Female Students
(N=28)
Calculated value
F. % F. % X2
1 Upto 20 years 19 22.36 9 32.15
2 21 to 25 years 43 50.58 10 35.71 2.00 NS
3 Above 25 years 23 27.06 9 32.14
Total 85 100.00 28 100.00
X2 –tab value at 5 per cent level of significance = 5.991 d.f. = 2
NS = Non significant F= Frequency
In case of male agricultural students 27.06 per cent were aged above 25 years
and only 22.36 per cent were aged upto 20 years. While in female agricultural students
32.15 per cent were aged up to 20 years and 32.14 per cent were aged above 25 years
(Fig. 5.1.2).
The calculated value of chi-square (2.00) is less than their tabulated value of chi-
square (5.991) at 5 per cent level of significance. Thus the null hypothesis is accepted and
alternative hypothesis is rejected which meant that there is no significant agreement
between male and female agricultural students with respect to their age.
5.1.3 Marital status
Table 5.1.3 indicated that majority of the internet utilizing male agricultural
students (56.47 per cent) were unmarried while 43.53 percent of the respondents were
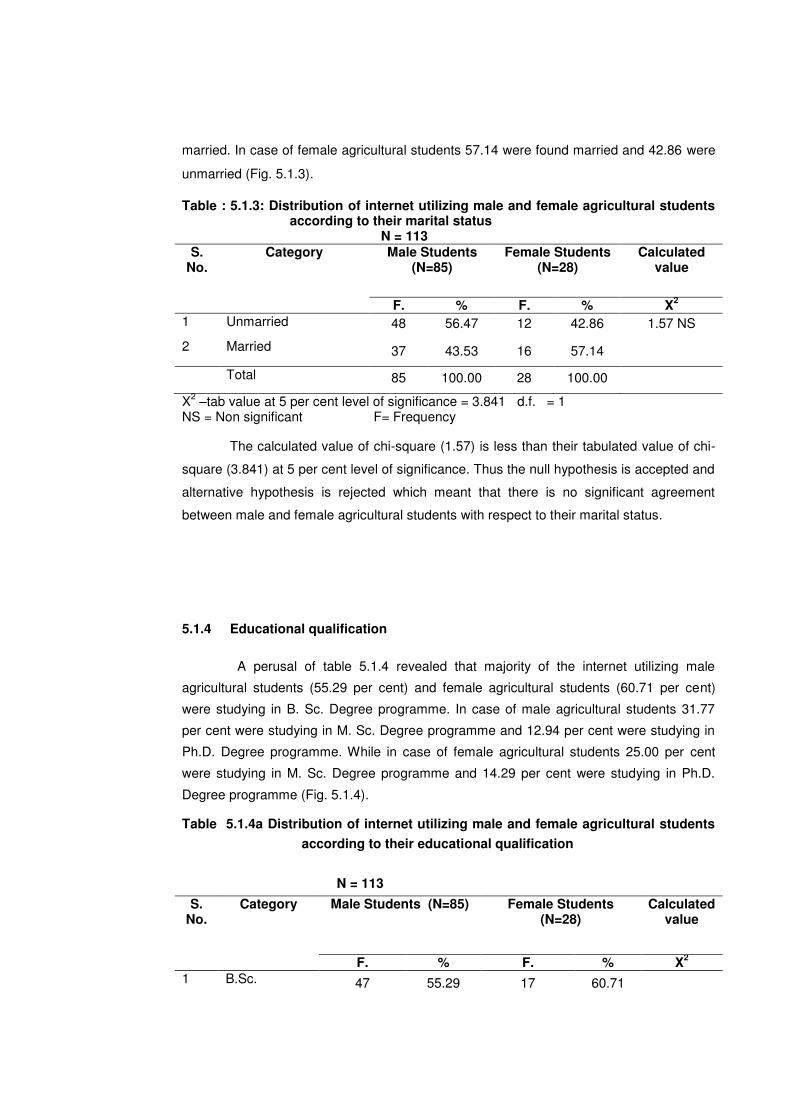
married. In case of female agricultural students 57.14 were found married and 42.86 were
unmarried (Fig. 5.1.3).
Table : 5.1.3: Distribution of internet utilizing male and female agricultural students according to their marital status N = 113
S. No.
Category Male Students (N=85)
Female Students (N=28)
Calculated value
F. % F. % X2
1 Unmarried 48 56.47 12 42.86 1.57 NS
2 Married 37 43.53 16 57.14
Total 85 100.00 28 100.00
X2 –tab value at 5 per cent level of significance = 3.841 d.f. = 1
NS = Non significant F= Frequency
The calculated value of chi-square (1.57) is less than their tabulated value of chi-
square (3.841) at 5 per cent level of significance. Thus the null hypothesis is accepted and
alternative hypothesis is rejected which meant that there is no significant agreement
between male and female agricultural students with respect to their marital status.
5.1.4 Educational qualification
A perusal of table 5.1.4 revealed that majority of the internet utilizing male
agricultural students (55.29 per cent) and female agricultural students (60.71 per cent)
were studying in B. Sc. Degree programme. In case of male agricultural students 31.77
per cent were studying in M. Sc. Degree programme and 12.94 per cent were studying in
Ph.D. Degree programme. While in case of female agricultural students 25.00 per cent
were studying in M. Sc. Degree programme and 14.29 per cent were studying in Ph.D.
Degree programme (Fig. 5.1.4).
Table 5.1.4a Distribution of internet utilizing male and female agricultural students
according to their educational qualification
N = 113
S. No.
Category Male Students (N=85) Female Students (N=28)
Calculated value
F. % F. % X2
1 B.Sc. 47 55.29 17 60.71
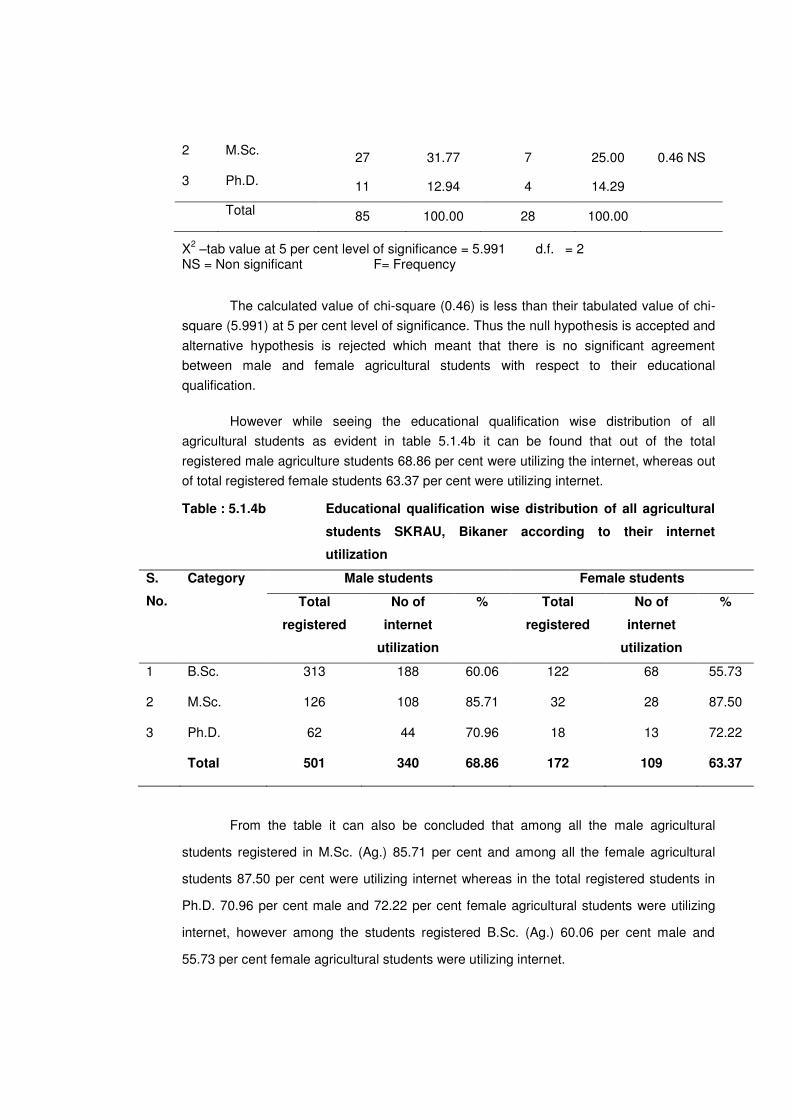
2 M.Sc. 27 31.77 7 25.00 0.46 NS
3 Ph.D. 11 12.94 4 14.29
Total 85 100.00 28 100.00
X2 –tab value at 5 per cent level of significance = 5.991 d.f. = 2
NS = Non significant F= Frequency
The calculated value of chi-square (0.46) is less than their tabulated value of chi-
square (5.991) at 5 per cent level of significance. Thus the null hypothesis is accepted and
alternative hypothesis is rejected which meant that there is no significant agreement
between male and female agricultural students with respect to their educational
qualification.
However while seeing the educational qualification wise distribution of all
agricultural students as evident in table 5.1.4b it can be found that out of the total
registered male agriculture students 68.86 per cent were utilizing the internet, whereas out
of total registered female students 63.37 per cent were utilizing internet.
Table : 5.1.4b Educational qualification wise distribution of all agricultural
students SKRAU, Bikaner according to their internet
utilization
S.
No.
Category Male students Female students
Total
registered
No of
internet
utilization
% Total
registered
No of
internet
utilization
%
1 B.Sc. 313 188 60.06 122 68 55.73
2 M.Sc. 126 108 85.71 32 28 87.50
3 Ph.D. 62 44 70.96 18 13 72.22
Total 501 340 68.86 172 109 63.37
From the table it can also be concluded that among all the male agricultural
students registered in M.Sc. (Ag.) 85.71 per cent and among all the female agricultural
students 87.50 per cent were utilizing internet whereas in the total registered students in
Ph.D. 70.96 per cent male and 72.22 per cent female agricultural students were utilizing
internet, however among the students registered B.Sc. (Ag.) 60.06 per cent male and
55.73 per cent female agricultural students were utilizing internet.
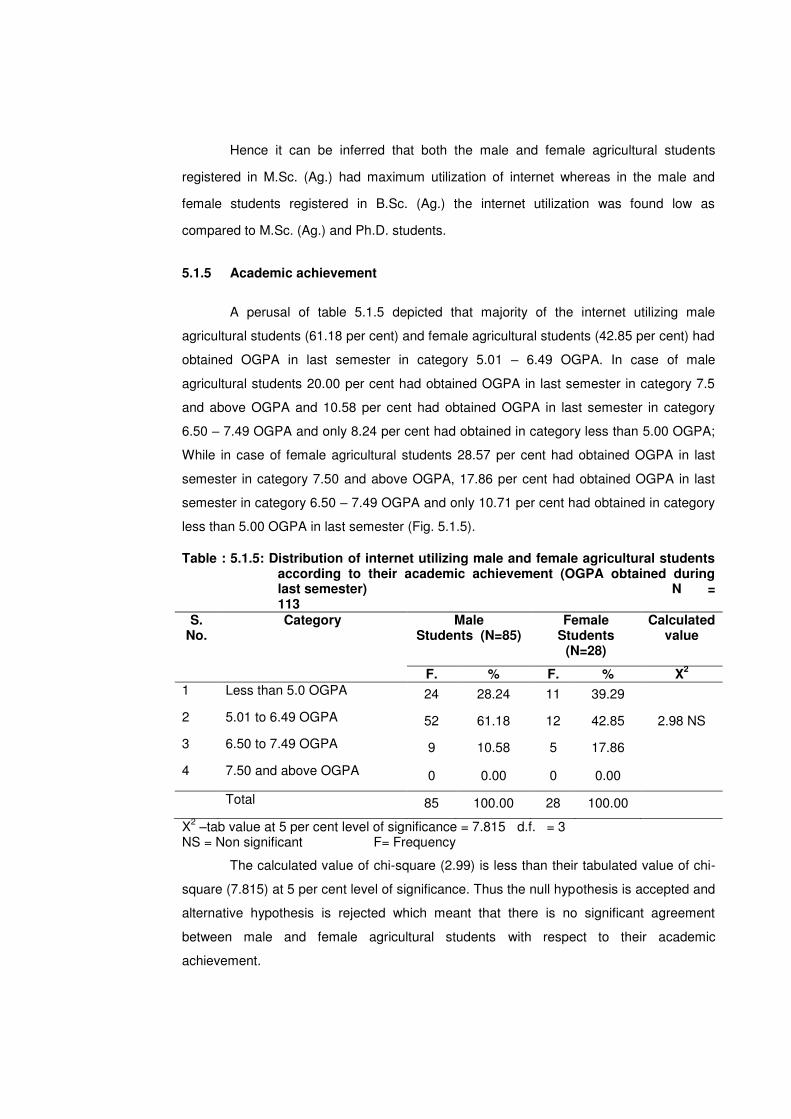
Hence it can be inferred that both the male and female agricultural students
registered in M.Sc. (Ag.) had maximum utilization of internet whereas in the male and
female students registered in B.Sc. (Ag.) the internet utilization was found low as
compared to M.Sc. (Ag.) and Ph.D. students.
5.1.5 Academic achievement
A perusal of table 5.1.5 depicted that majority of the internet utilizing male
agricultural students (61.18 per cent) and female agricultural students (42.85 per cent) had
obtained OGPA in last semester in category 5.01 – 6.49 OGPA. In case of male
agricultural students 20.00 per cent had obtained OGPA in last semester in category 7.5
and above OGPA and 10.58 per cent had obtained OGPA in last semester in category
6.50 – 7.49 OGPA and only 8.24 per cent had obtained in category less than 5.00 OGPA;
While in case of female agricultural students 28.57 per cent had obtained OGPA in last
semester in category 7.50 and above OGPA, 17.86 per cent had obtained OGPA in last
semester in category 6.50 – 7.49 OGPA and only 10.71 per cent had obtained in category
less than 5.00 OGPA in last semester (Fig. 5.1.5).
Table : 5.1.5: Distribution of internet utilizing male and female agricultural students according to their academic achievement (OGPA obtained during last semester) N = 113
S. No.
Category Male Students (N=85)
Female Students
(N=28)
Calculated value
F. % F. % X2
1 Less than 5.0 OGPA 24 28.24 11 39.29
2 5.01 to 6.49 OGPA 52 61.18 12 42.85 2.98 NS
3 6.50 to 7.49 OGPA 9 10.58 5 17.86
4 7.50 and above OGPA 0 0.00 0 0.00
Total 85 100.00 28 100.00
X2 –tab value at 5 per cent level of significance = 7.815 d.f. = 3
NS = Non significant F= Frequency
The calculated value of chi-square (2.99) is less than their tabulated value of chi-
square (7.815) at 5 per cent level of significance. Thus the null hypothesis is accepted and
alternative hypothesis is rejected which meant that there is no significant agreement
between male and female agricultural students with respect to their academic
achievement.
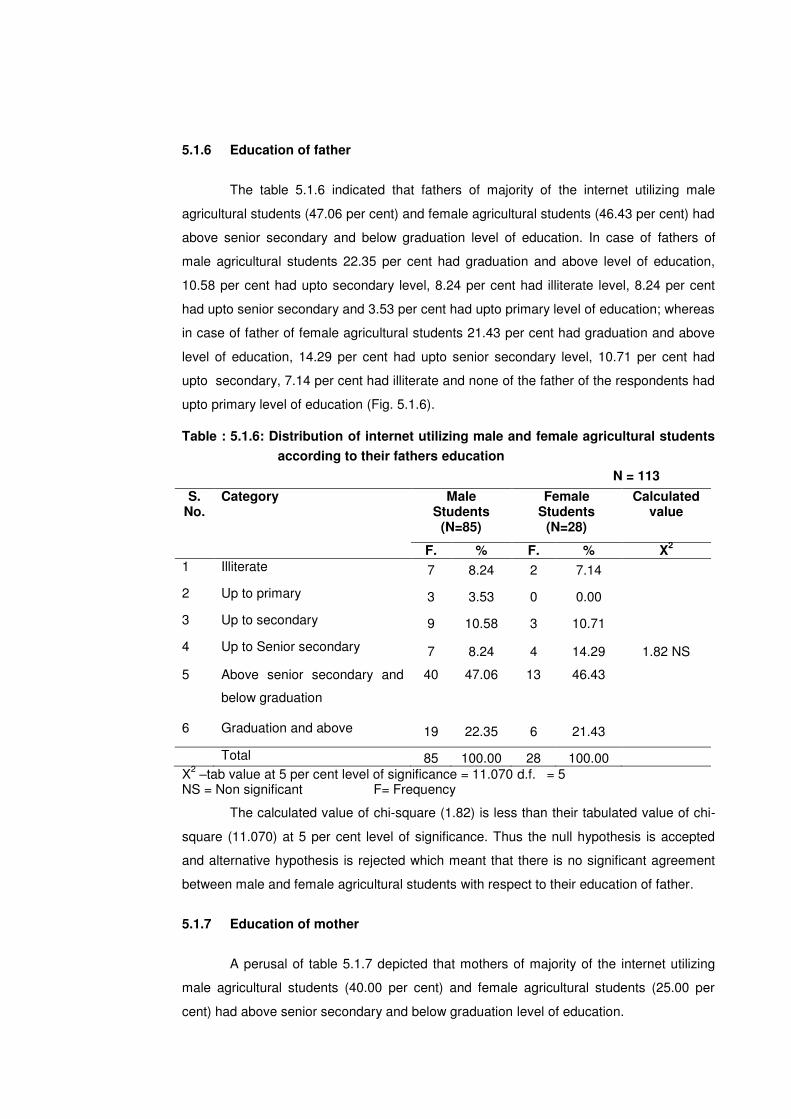
5.1.6 Education of father
The table 5.1.6 indicated that fathers of majority of the internet utilizing male
agricultural students (47.06 per cent) and female agricultural students (46.43 per cent) had
above senior secondary and below graduation level of education. In case of fathers of
male agricultural students 22.35 per cent had graduation and above level of education,
10.58 per cent had upto secondary level, 8.24 per cent had illiterate level, 8.24 per cent
had upto senior secondary and 3.53 per cent had upto primary level of education; whereas
in case of father of female agricultural students 21.43 per cent had graduation and above
level of education, 14.29 per cent had upto senior secondary level, 10.71 per cent had
upto secondary, 7.14 per cent had illiterate and none of the father of the respondents had
upto primary level of education (Fig. 5.1.6).
Table : 5.1.6: Distribution of internet utilizing male and female agricultural students
according to their fathers education
N = 113
S. No.
Category Male Students
(N=85)
Female Students
(N=28)
Calculated value
F. % F. % X2
1 Illiterate 7 8.24 2 7.14
2 Up to primary 3 3.53 0 0.00
3 Up to secondary 9 10.58 3 10.71
4 Up to Senior secondary 7 8.24 4 14.29 1.82 NS
5 Above senior secondary and
below graduation
40 47.06 13 46.43
6 Graduation and above 19 22.35 6 21.43
Total 85 100.00 28 100.00 X
2 –tab value at 5 per cent level of significance = 11.070 d.f. = 5
NS = Non significant F= Frequency
The calculated value of chi-square (1.82) is less than their tabulated value of chi-
square (11.070) at 5 per cent level of significance. Thus the null hypothesis is accepted
and alternative hypothesis is rejected which meant that there is no significant agreement
between male and female agricultural students with respect to their education of father.
5.1.7 Education of mother
A perusal of table 5.1.7 depicted that mothers of majority of the internet utilizing
male agricultural students (40.00 per cent) and female agricultural students (25.00 per
cent) had above senior secondary and below graduation level of education.
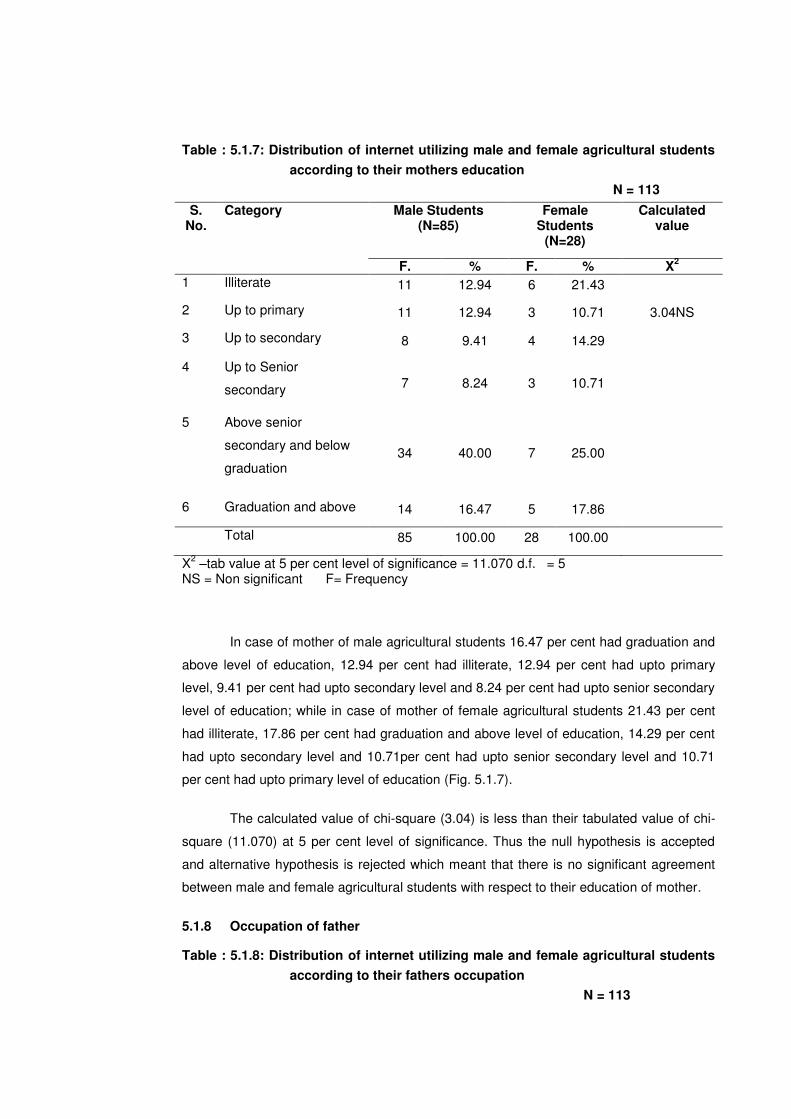
Table : 5.1.7: Distribution of internet utilizing male and female agricultural students
according to their mothers education
N = 113
S. No.
Category Male Students (N=85)
Female Students
(N=28)
Calculated value
F. % F. % X2
1 Illiterate 11 12.94 6 21.43
2 Up to primary 11 12.94 3 10.71 3.04NS
3 Up to secondary 8 9.41 4 14.29
4 Up to Senior
secondary 7 8.24 3 10.71
5 Above senior
secondary and below
graduation 34 40.00 7 25.00
6 Graduation and above 14 16.47 5 17.86
Total 85 100.00 28 100.00
X2 –tab value at 5 per cent level of significance = 11.070 d.f. = 5
NS = Non significant F= Frequency
In case of mother of male agricultural students 16.47 per cent had graduation and
above level of education, 12.94 per cent had illiterate, 12.94 per cent had upto primary
level, 9.41 per cent had upto secondary level and 8.24 per cent had upto senior secondary
level of education; while in case of mother of female agricultural students 21.43 per cent
had illiterate, 17.86 per cent had graduation and above level of education, 14.29 per cent
had upto secondary level and 10.71per cent had upto senior secondary level and 10.71
per cent had upto primary level of education (Fig. 5.1.7).
The calculated value of chi-square (3.04) is less than their tabulated value of chi-
square (11.070) at 5 per cent level of significance. Thus the null hypothesis is accepted
and alternative hypothesis is rejected which meant that there is no significant agreement
between male and female agricultural students with respect to their education of mother.
5.1.8 Occupation of father
Table : 5.1.8: Distribution of internet utilizing male and female agricultural students
according to their fathers occupation
N = 113
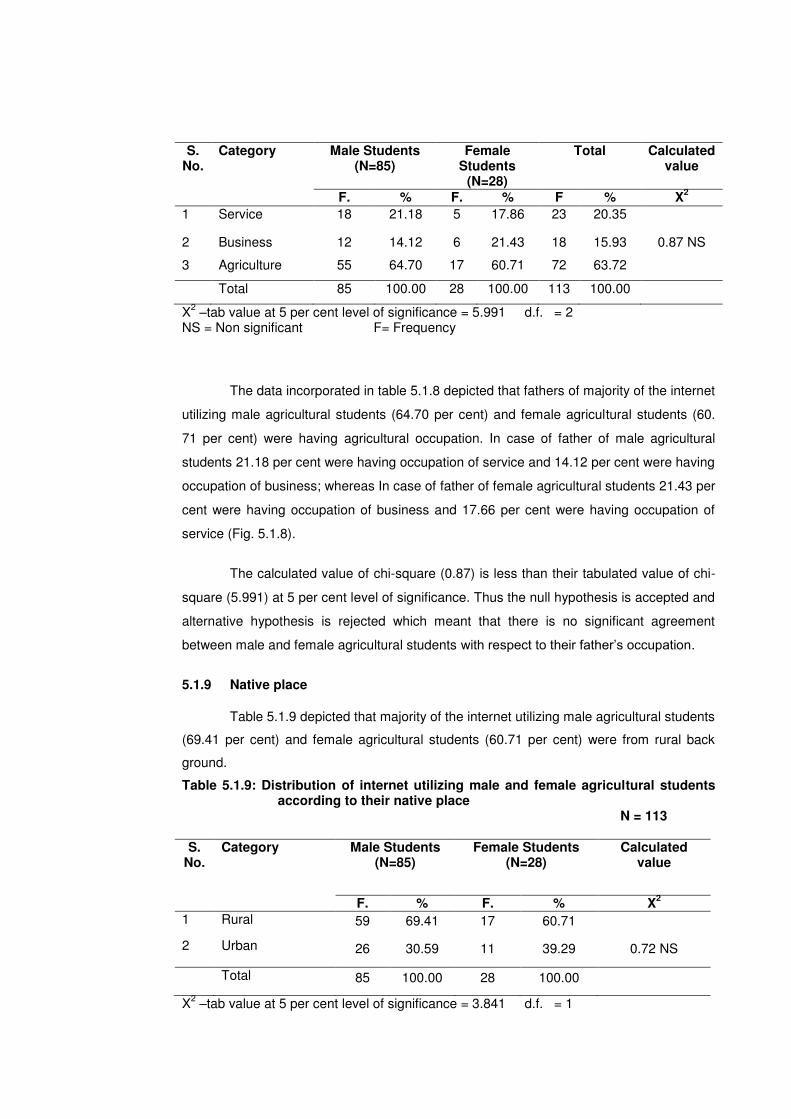
S. No.
Category Male Students (N=85)
Female Students
(N=28)
Total Calculated value
F. % F. % F % X2
1 Service 18 21.18 5 17.86 23 20.35
2 Business 12 14.12 6 21.43 18 15.93 0.87 NS
3 Agriculture 55 64.70 17 60.71 72 63.72
Total 85 100.00 28 100.00 113 100.00
X2 –tab value at 5 per cent level of significance = 5.991 d.f. = 2
NS = Non significant F= Frequency
The data incorporated in table 5.1.8 depicted that fathers of majority of the internet
utilizing male agricultural students (64.70 per cent) and female agricultural students (60.
71 per cent) were having agricultural occupation. In case of father of male agricultural
students 21.18 per cent were having occupation of service and 14.12 per cent were having
occupation of business; whereas In case of father of female agricultural students 21.43 per
cent were having occupation of business and 17.66 per cent were having occupation of
service (Fig. 5.1.8).
The calculated value of chi-square (0.87) is less than their tabulated value of chi-
square (5.991) at 5 per cent level of significance. Thus the null hypothesis is accepted and
alternative hypothesis is rejected which meant that there is no significant agreement
between male and female agricultural students with respect to their father‟s occupation.
5.1.9 Native place
Table 5.1.9 depicted that majority of the internet utilizing male agricultural students
(69.41 per cent) and female agricultural students (60.71 per cent) were from rural back
ground.
Table 5.1.9: Distribution of internet utilizing male and female agricultural students according to their native place
N = 113 S.
No. Category Male Students
(N=85) Female Students
(N=28) Calculated
value
F. % F. % X2
1 Rural 59 69.41 17 60.71
2 Urban 26 30.59 11 39.29 0.72 NS
Total 85 100.00 28 100.00
X2 –tab value at 5 per cent level of significance = 3.841 d.f. = 1
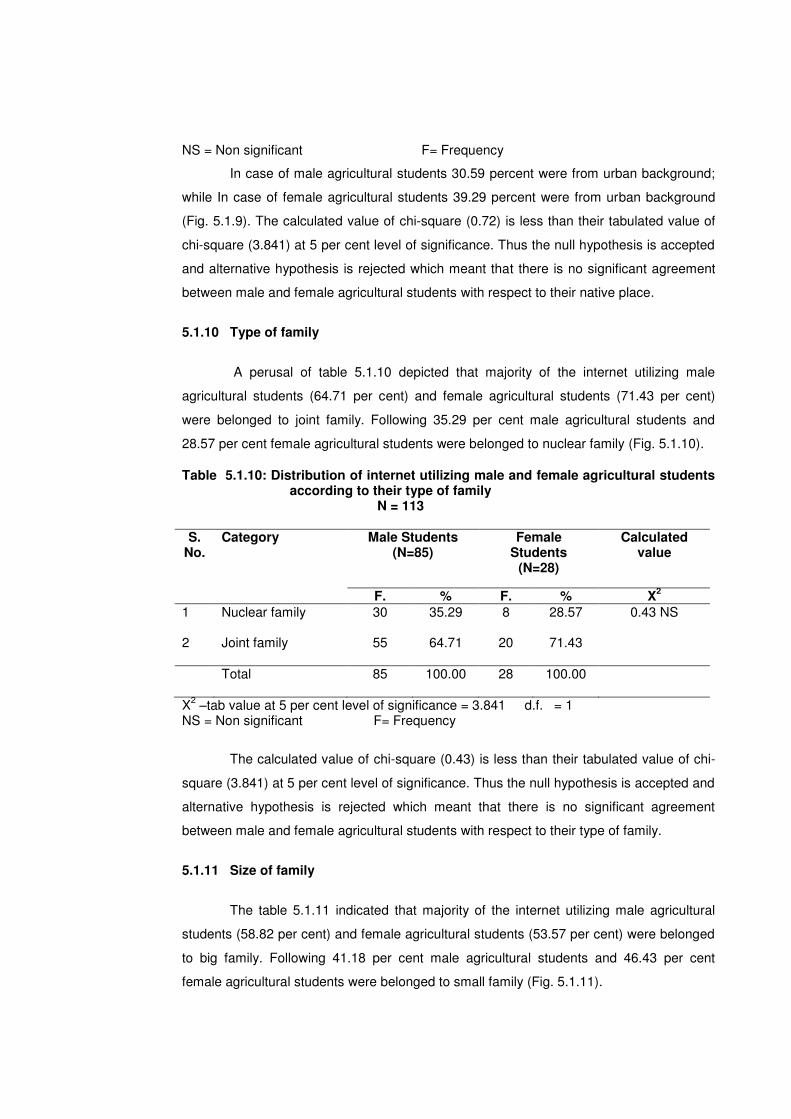
NS = Non significant F= Frequency
In case of male agricultural students 30.59 percent were from urban background;
while In case of female agricultural students 39.29 percent were from urban background
(Fig. 5.1.9). The calculated value of chi-square (0.72) is less than their tabulated value of
chi-square (3.841) at 5 per cent level of significance. Thus the null hypothesis is accepted
and alternative hypothesis is rejected which meant that there is no significant agreement
between male and female agricultural students with respect to their native place.
5.1.10 Type of family
A perusal of table 5.1.10 depicted that majority of the internet utilizing male
agricultural students (64.71 per cent) and female agricultural students (71.43 per cent)
were belonged to joint family. Following 35.29 per cent male agricultural students and
28.57 per cent female agricultural students were belonged to nuclear family (Fig. 5.1.10).
Table 5.1.10: Distribution of internet utilizing male and female agricultural students according to their type of family N = 113
S.
No. Category Male Students
(N=85) Female
Students (N=28)
Calculated value
F. % F. % X2
1 Nuclear family 30 35.29 8 28.57 0.43 NS
2 Joint family 55 64.71 20 71.43
Total 85 100.00 28 100.00
X2 –tab value at 5 per cent level of significance = 3.841 d.f. = 1
NS = Non significant F= Frequency
The calculated value of chi-square (0.43) is less than their tabulated value of chi-
square (3.841) at 5 per cent level of significance. Thus the null hypothesis is accepted and
alternative hypothesis is rejected which meant that there is no significant agreement
between male and female agricultural students with respect to their type of family.
5.1.11 Size of family
The table 5.1.11 indicated that majority of the internet utilizing male agricultural
students (58.82 per cent) and female agricultural students (53.57 per cent) were belonged
to big family. Following 41.18 per cent male agricultural students and 46.43 per cent
female agricultural students were belonged to small family (Fig. 5.1.11).
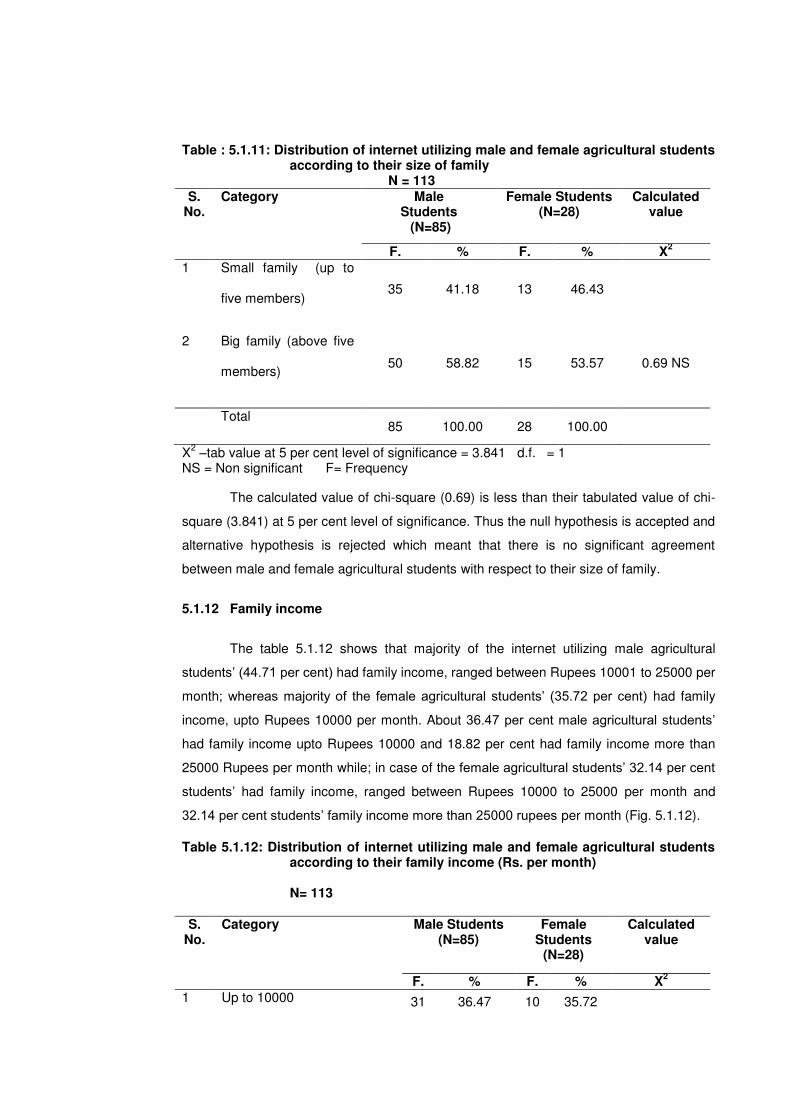
Table : 5.1.11: Distribution of internet utilizing male and female agricultural students according to their size of family N = 113
S. No.
Category Male Students (N=85)
Female Students (N=28)
Calculated value
F. % F. % X2
1 Small family (up to
five members) 35 41.18 13 46.43
2 Big family (above five
members) 50 58.82 15 53.57 0.69 NS
Total 85 100.00 28 100.00
X2 –tab value at 5 per cent level of significance = 3.841 d.f. = 1
NS = Non significant F= Frequency
The calculated value of chi-square (0.69) is less than their tabulated value of chi-
square (3.841) at 5 per cent level of significance. Thus the null hypothesis is accepted and
alternative hypothesis is rejected which meant that there is no significant agreement
between male and female agricultural students with respect to their size of family.
5.1.12 Family income
The table 5.1.12 shows that majority of the internet utilizing male agricultural
students‟ (44.71 per cent) had family income, ranged between Rupees 10001 to 25000 per
month; whereas majority of the female agricultural students‟ (35.72 per cent) had family
income, upto Rupees 10000 per month. About 36.47 per cent male agricultural students‟
had family income upto Rupees 10000 and 18.82 per cent had family income more than
25000 Rupees per month while; in case of the female agricultural students‟ 32.14 per cent
students‟ had family income, ranged between Rupees 10000 to 25000 per month and
32.14 per cent students‟ family income more than 25000 rupees per month (Fig. 5.1.12).
Table 5.1.12: Distribution of internet utilizing male and female agricultural students according to their family income (Rs. per month) N= 113
S.
No. Category Male Students
(N=85) Female
Students (N=28)
Calculated value
F. % F. % X2
1 Up to 10000 31 36.47 10 35.72
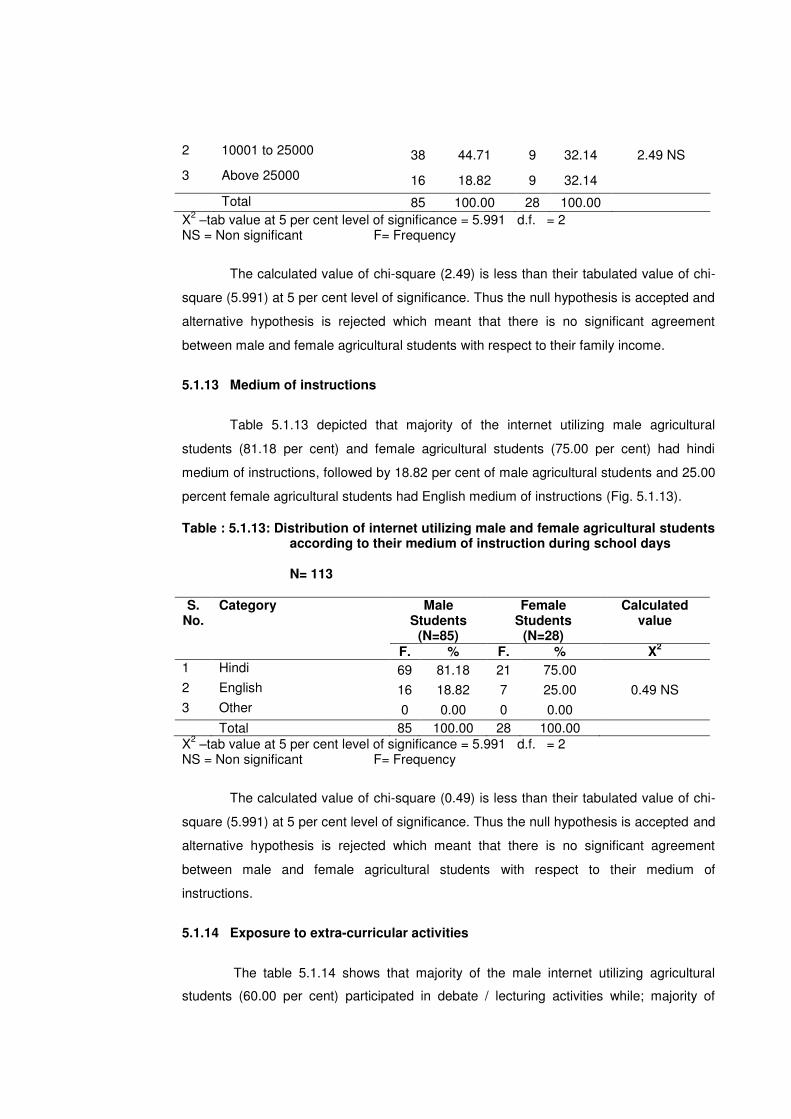
2 10001 to 25000 38 44.71 9 32.14 2.49 NS
3 Above 25000 16 18.82 9 32.14
Total 85 100.00 28 100.00
X2 –tab value at 5 per cent level of significance = 5.991 d.f. = 2
NS = Non significant F= Frequency
The calculated value of chi-square (2.49) is less than their tabulated value of chi-
square (5.991) at 5 per cent level of significance. Thus the null hypothesis is accepted and
alternative hypothesis is rejected which meant that there is no significant agreement
between male and female agricultural students with respect to their family income.
5.1.13 Medium of instructions
Table 5.1.13 depicted that majority of the internet utilizing male agricultural
students (81.18 per cent) and female agricultural students (75.00 per cent) had hindi
medium of instructions, followed by 18.82 per cent of male agricultural students and 25.00
percent female agricultural students had English medium of instructions (Fig. 5.1.13).
Table : 5.1.13: Distribution of internet utilizing male and female agricultural students according to their medium of instruction during school days N= 113
S.
No. Category Male
Students (N=85)
Female Students
(N=28)
Calculated value
F. % F. % X2
1 Hindi 69 81.18 21 75.00
2 English 16 18.82 7 25.00 0.49 NS
3 Other 0 0.00 0 0.00
Total 85 100.00 28 100.00 X
2 –tab value at 5 per cent level of significance = 5.991 d.f. = 2
NS = Non significant F= Frequency
The calculated value of chi-square (0.49) is less than their tabulated value of chi-
square (5.991) at 5 per cent level of significance. Thus the null hypothesis is accepted and
alternative hypothesis is rejected which meant that there is no significant agreement
between male and female agricultural students with respect to their medium of
instructions.
5.1.14 Exposure to extra-curricular activities
The table 5.1.14 shows that majority of the male internet utilizing agricultural
students (60.00 per cent) participated in debate / lecturing activities while; majority of
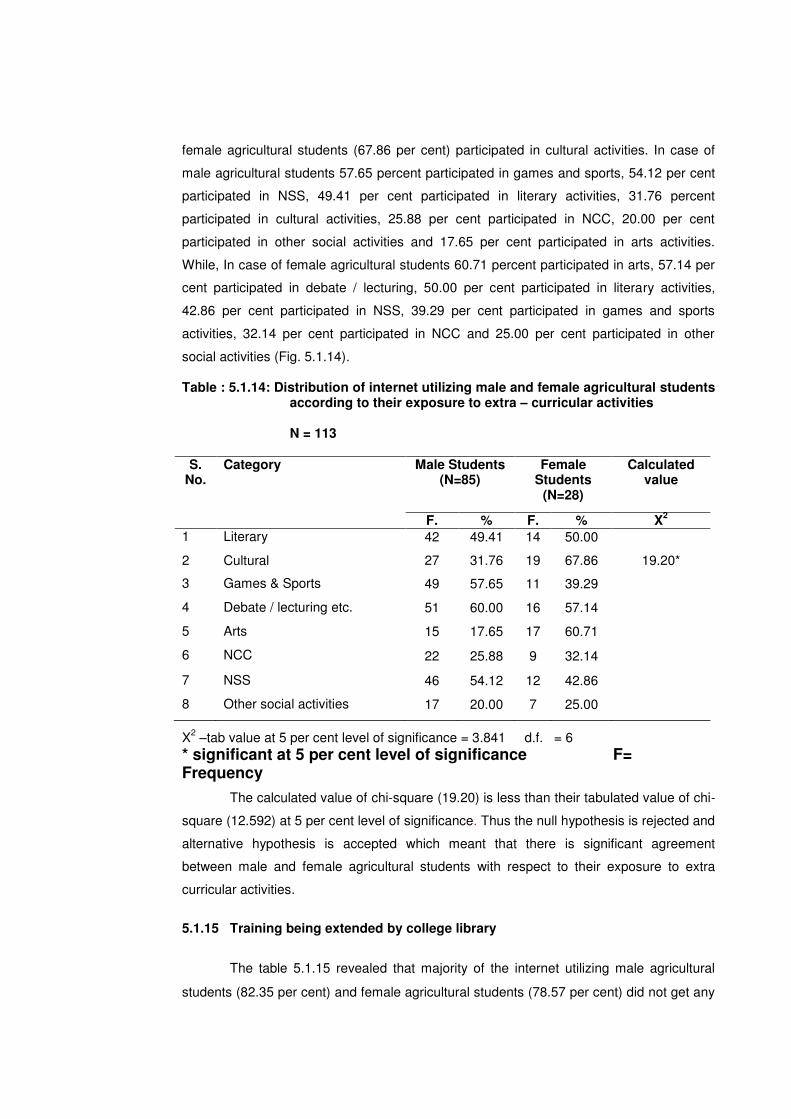
female agricultural students (67.86 per cent) participated in cultural activities. In case of
male agricultural students 57.65 percent participated in games and sports, 54.12 per cent
participated in NSS, 49.41 per cent participated in literary activities, 31.76 percent
participated in cultural activities, 25.88 per cent participated in NCC, 20.00 per cent
participated in other social activities and 17.65 per cent participated in arts activities.
While, In case of female agricultural students 60.71 percent participated in arts, 57.14 per
cent participated in debate / lecturing, 50.00 per cent participated in literary activities,
42.86 per cent participated in NSS, 39.29 per cent participated in games and sports
activities, 32.14 per cent participated in NCC and 25.00 per cent participated in other
social activities (Fig. 5.1.14).
Table : 5.1.14: Distribution of internet utilizing male and female agricultural students according to their exposure to extra – curricular activities N = 113
S.
No. Category Male Students
(N=85) Female
Students (N=28)
Calculated value
F. % F. % X2
1 Literary 42 49.41 14 50.00
2 Cultural 27 31.76 19 67.86 19.20*
3 Games & Sports 49 57.65 11 39.29
4 Debate / lecturing etc. 51 60.00 16 57.14
5 Arts 15 17.65 17 60.71
6 NCC 22 25.88 9 32.14
7 NSS 46 54.12 12 42.86
8 Other social activities 17 20.00 7 25.00
X2 –tab value at 5 per cent level of significance = 3.841 d.f. = 6
* significant at 5 per cent level of significance F= Frequency
The calculated value of chi-square (19.20) is less than their tabulated value of chi-
square (12.592) at 5 per cent level of significance. Thus the null hypothesis is rejected and
alternative hypothesis is accepted which meant that there is significant agreement
between male and female agricultural students with respect to their exposure to extra
curricular activities.
5.1.15 Training being extended by college library
The table 5.1.15 revealed that majority of the internet utilizing male agricultural
students (82.35 per cent) and female agricultural students (78.57 per cent) did not get any
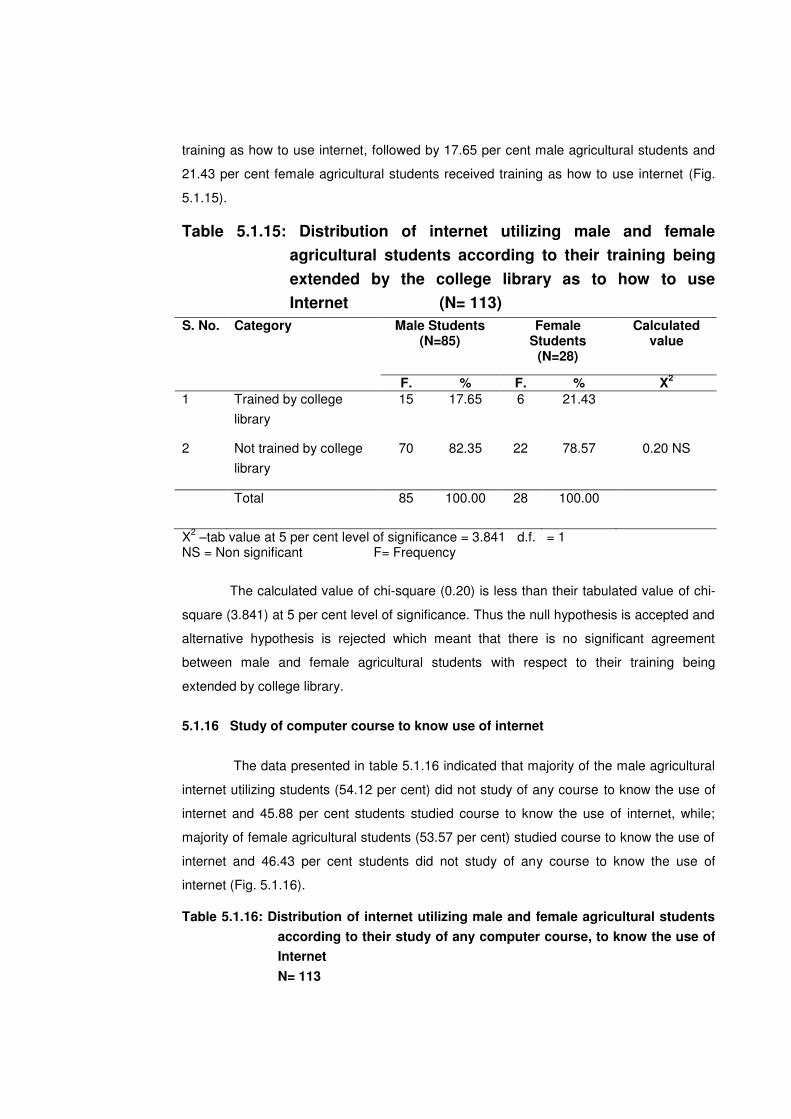
training as how to use internet, followed by 17.65 per cent male agricultural students and
21.43 per cent female agricultural students received training as how to use internet (Fig.
5.1.15).
Table 5.1.15: Distribution of internet utilizing male and female
agricultural students according to their training being
extended by the college library as to how to use
Internet (N= 113)
S. No. Category Male Students (N=85)
Female Students
(N=28)
Calculated value
F. % F. % X2
1 Trained by college
library
15 17.65 6 21.43
2 Not trained by college
library
70 82.35 22 78.57 0.20 NS
Total 85 100.00 28 100.00
X2 –tab value at 5 per cent level of significance = 3.841 d.f. = 1
NS = Non significant F= Frequency
The calculated value of chi-square (0.20) is less than their tabulated value of chi-
square (3.841) at 5 per cent level of significance. Thus the null hypothesis is accepted and
alternative hypothesis is rejected which meant that there is no significant agreement
between male and female agricultural students with respect to their training being
extended by college library.
5.1.16 Study of computer course to know use of internet
The data presented in table 5.1.16 indicated that majority of the male agricultural
internet utilizing students (54.12 per cent) did not study of any course to know the use of
internet and 45.88 per cent students studied course to know the use of internet, while;
majority of female agricultural students (53.57 per cent) studied course to know the use of
internet and 46.43 per cent students did not study of any course to know the use of
internet (Fig. 5.1.16).
Table 5.1.16: Distribution of internet utilizing male and female agricultural students
according to their study of any computer course, to know the use of
Internet
N= 113
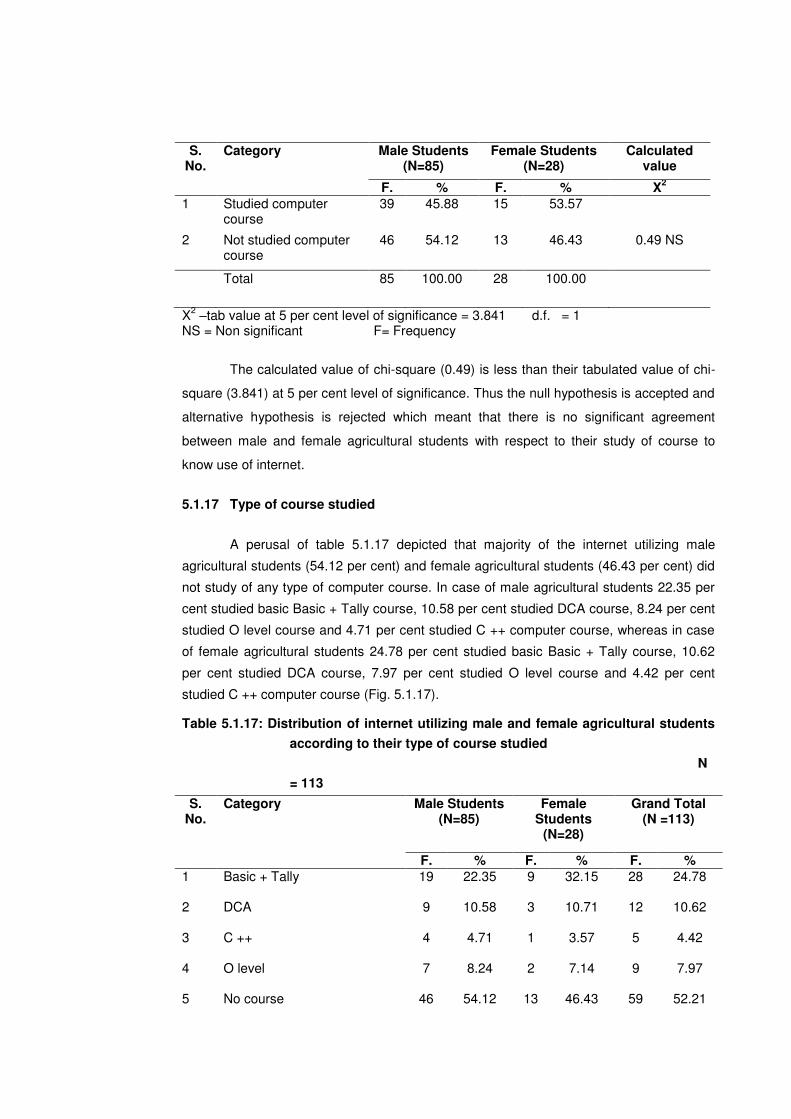
S. No.
Category Male Students (N=85)
Female Students (N=28)
Calculated value
F. % F. % X2
1 Studied computer course
39 45.88 15 53.57
2 Not studied computer course
46 54.12 13 46.43 0.49 NS
Total 85 100.00 28 100.00
X2 –tab value at 5 per cent level of significance = 3.841 d.f. = 1
NS = Non significant F= Frequency
The calculated value of chi-square (0.49) is less than their tabulated value of chi-
square (3.841) at 5 per cent level of significance. Thus the null hypothesis is accepted and
alternative hypothesis is rejected which meant that there is no significant agreement
between male and female agricultural students with respect to their study of course to
know use of internet.
5.1.17 Type of course studied
A perusal of table 5.1.17 depicted that majority of the internet utilizing male
agricultural students (54.12 per cent) and female agricultural students (46.43 per cent) did
not study of any type of computer course. In case of male agricultural students 22.35 per
cent studied basic Basic + Tally course, 10.58 per cent studied DCA course, 8.24 per cent
studied O level course and 4.71 per cent studied C ++ computer course, whereas in case
of female agricultural students 24.78 per cent studied basic Basic + Tally course, 10.62
per cent studied DCA course, 7.97 per cent studied O level course and 4.42 per cent
studied C ++ computer course (Fig. 5.1.17).
Table 5.1.17: Distribution of internet utilizing male and female agricultural students
according to their type of course studied
N
= 113
S. No.
Category Male Students (N=85)
Female Students
(N=28)
Grand Total (N =113)
F. % F. % F. % 1 Basic + Tally 19 22.35 9 32.15 28 24.78
2 DCA 9 10.58 3 10.71 12 10.62
3 C ++ 4 4.71 1 3.57 5 4.42
4 O level 7 8.24 2 7.14 9 7.97
5 No course 46 54.12 13 46.43 59 52.21
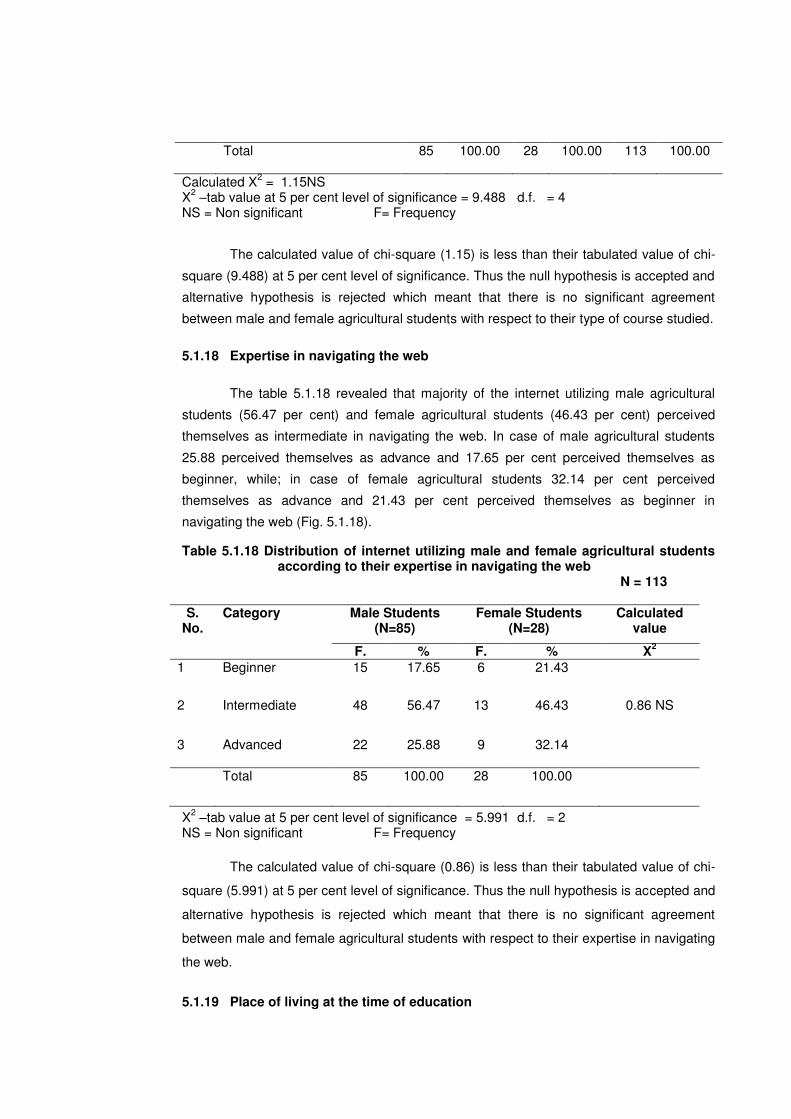
Total 85 100.00 28 100.00 113 100.00
Calculated X2 = 1.15NS
X2 –tab value at 5 per cent level of significance = 9.488 d.f. = 4
NS = Non significant F= Frequency
The calculated value of chi-square (1.15) is less than their tabulated value of chi-
square (9.488) at 5 per cent level of significance. Thus the null hypothesis is accepted and
alternative hypothesis is rejected which meant that there is no significant agreement
between male and female agricultural students with respect to their type of course studied.
5.1.18 Expertise in navigating the web
The table 5.1.18 revealed that majority of the internet utilizing male agricultural
students (56.47 per cent) and female agricultural students (46.43 per cent) perceived
themselves as intermediate in navigating the web. In case of male agricultural students
25.88 perceived themselves as advance and 17.65 per cent perceived themselves as
beginner, while; in case of female agricultural students 32.14 per cent perceived
themselves as advance and 21.43 per cent perceived themselves as beginner in
navigating the web (Fig. 5.1.18).
Table 5.1.18 Distribution of internet utilizing male and female agricultural students according to their expertise in navigating the web
N = 113 S.
No. Category Male Students
(N=85) Female Students
(N=28) Calculated
value
F. % F. % X2
1 Beginner 15 17.65 6 21.43
2 Intermediate 48 56.47 13 46.43 0.86 NS
3 Advanced 22 25.88 9 32.14
Total 85 100.00 28 100.00
X2 –tab value at 5 per cent level of significance = 5.991 d.f. = 2
NS = Non significant F= Frequency
The calculated value of chi-square (0.86) is less than their tabulated value of chi-
square (5.991) at 5 per cent level of significance. Thus the null hypothesis is accepted and
alternative hypothesis is rejected which meant that there is no significant agreement
between male and female agricultural students with respect to their expertise in navigating
the web.
5.1.19 Place of living at the time of education
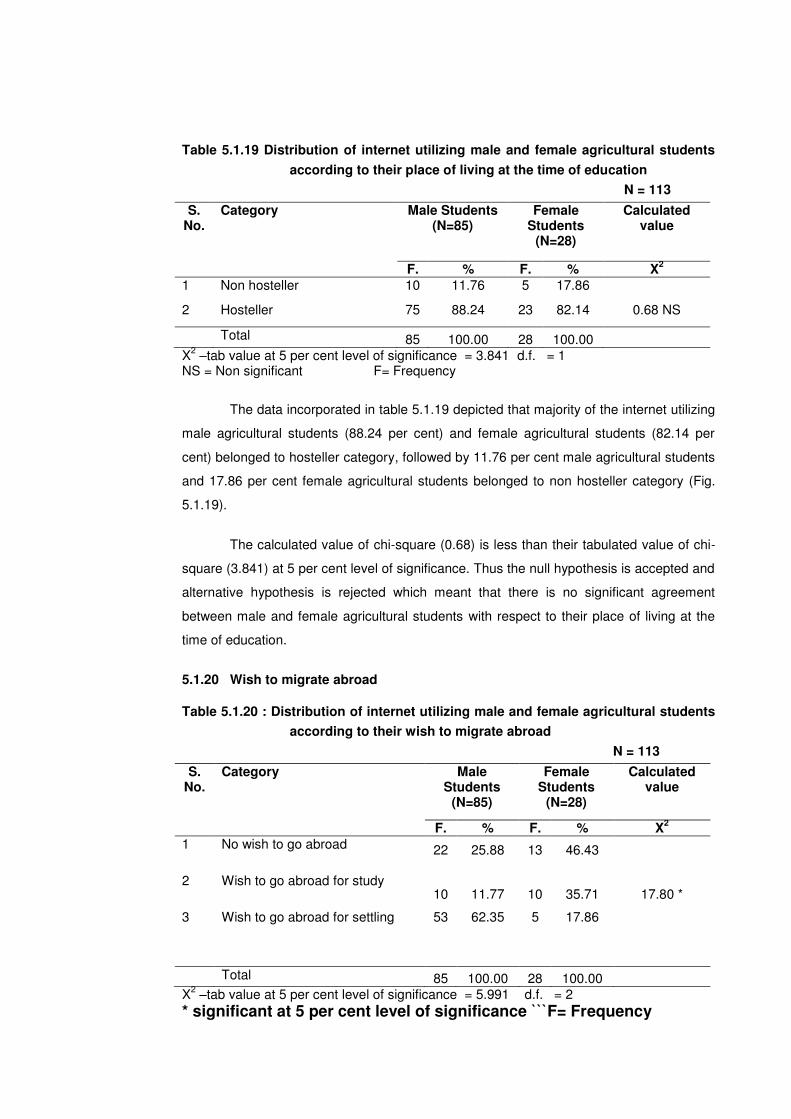
Table 5.1.19 Distribution of internet utilizing male and female agricultural students
according to their place of living at the time of education
N = 113
S. No.
Category Male Students (N=85)
Female Students
(N=28)
Calculated value
F. % F. % X2
1 Non hosteller 10 11.76 5 17.86
2 Hosteller 75 88.24 23 82.14 0.68 NS
Total 85 100.00 28 100.00 X
2 –tab value at 5 per cent level of significance = 3.841 d.f. = 1
NS = Non significant F= Frequency
The data incorporated in table 5.1.19 depicted that majority of the internet utilizing
male agricultural students (88.24 per cent) and female agricultural students (82.14 per
cent) belonged to hosteller category, followed by 11.76 per cent male agricultural students
and 17.86 per cent female agricultural students belonged to non hosteller category (Fig.
5.1.19).
The calculated value of chi-square (0.68) is less than their tabulated value of chi-
square (3.841) at 5 per cent level of significance. Thus the null hypothesis is accepted and
alternative hypothesis is rejected which meant that there is no significant agreement
between male and female agricultural students with respect to their place of living at the
time of education.
5.1.20 Wish to migrate abroad
Table 5.1.20 : Distribution of internet utilizing male and female agricultural students
according to their wish to migrate abroad
N = 113
S. No.
Category Male Students
(N=85)
Female Students
(N=28)
Calculated value
F. % F. % X2
1 No wish to go abroad 22 25.88 13 46.43
2 Wish to go abroad for study 10 11.77 10 35.71 17.80 *
3 Wish to go abroad for settling 53 62.35 5 17.86
Total 85 100.00 28 100.00 X
2 –tab value at 5 per cent level of significance = 5.991 d.f. = 2
* significant at 5 per cent level of significance ```F= Frequency
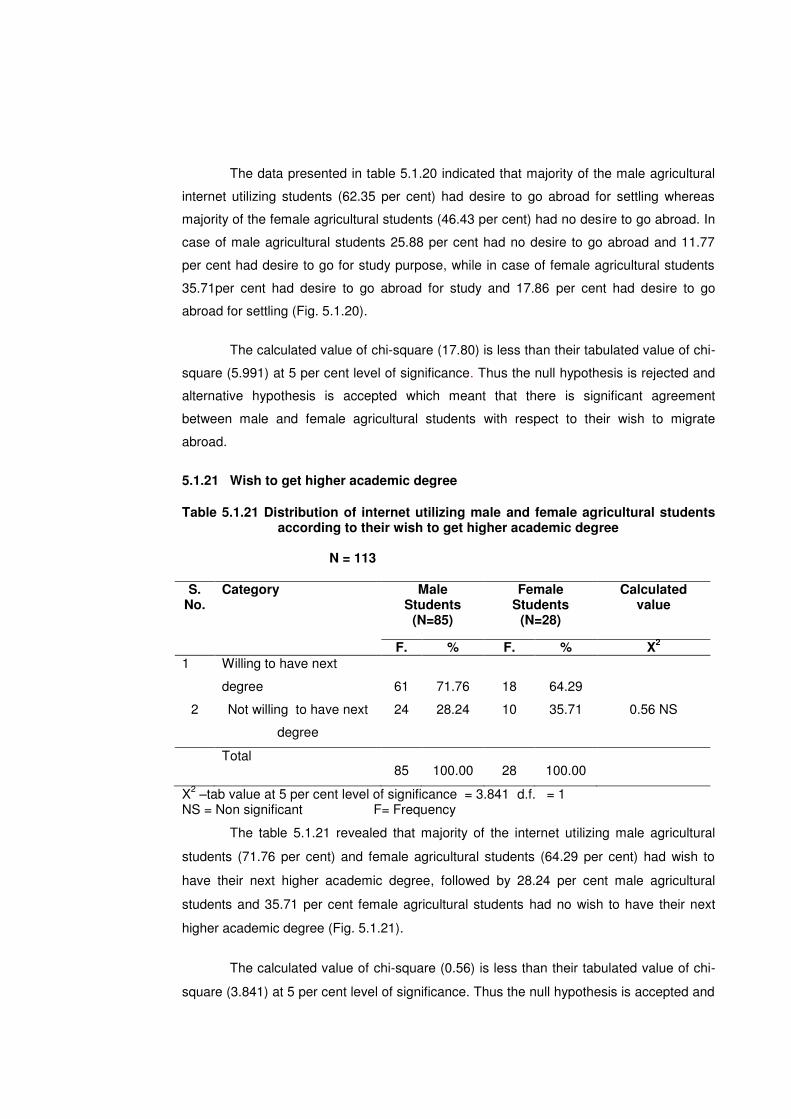
The data presented in table 5.1.20 indicated that majority of the male agricultural
internet utilizing students (62.35 per cent) had desire to go abroad for settling whereas
majority of the female agricultural students (46.43 per cent) had no desire to go abroad. In
case of male agricultural students 25.88 per cent had no desire to go abroad and 11.77
per cent had desire to go for study purpose, while in case of female agricultural students
35.71per cent had desire to go abroad for study and 17.86 per cent had desire to go
abroad for settling (Fig. 5.1.20).
The calculated value of chi-square (17.80) is less than their tabulated value of chi-
square (5.991) at 5 per cent level of significance. Thus the null hypothesis is rejected and
alternative hypothesis is accepted which meant that there is significant agreement
between male and female agricultural students with respect to their wish to migrate
abroad.
5.1.21 Wish to get higher academic degree
Table 5.1.21 Distribution of internet utilizing male and female agricultural students according to their wish to get higher academic degree N = 113
S.
No. Category Male
Students (N=85)
Female Students
(N=28)
Calculated value
F. % F. % X2
1 Willing to have next
degree 61 71.76 18 64.29
2 Not willing to have next
degree
24 28.24 10 35.71 0.56 NS
Total 85 100.00 28 100.00
X2 –tab value at 5 per cent level of significance = 3.841 d.f. = 1
NS = Non significant F= Frequency
The table 5.1.21 revealed that majority of the internet utilizing male agricultural
students (71.76 per cent) and female agricultural students (64.29 per cent) had wish to
have their next higher academic degree, followed by 28.24 per cent male agricultural
students and 35.71 per cent female agricultural students had no wish to have their next
higher academic degree (Fig. 5.1.21).
The calculated value of chi-square (0.56) is less than their tabulated value of chi-
square (3.841) at 5 per cent level of significance. Thus the null hypothesis is accepted and
alternative hypothesis is rejected which meant that there is no significant agreement
between male and female agricultural students with respect to their wish to get higher
academic degree.
5.1.22 Frequency of library use
The table 5.1.22 depicted that majority of the internet utilizing male agriculture
students (68.24%) and female agricultural students (60.72%) were utilized library every
day. In case of male agricultural students 23.53 percent students utilized library twice in
week, 5.88 percent students utilized library once in a week and 2.35 per cent students
utilized library once in month, while; in case of female agricultural students 25.00 per cent
students utilized library twice in week, 10.71 percent students utilized library once in a
week and 3.57 per cent students utilized library once in month (Fig. 5.1.22).
The calculated value of chi-square (1.01) is less than their tabulated value of chi-
square (7.815) at 5 per cent level of significance. Thus the null hypothesis is accepted and
alternative hypothesis is rejected which meant that there is no significant agreement
between male and female agricultural students with respect to their frequency of library
use.
5.1.23 Wish to serve in different areas
The data presented in table 5.1.23 indicated that majority of the male internet
utilizing agricultural students (61.18 per cent) had wish to serve in banking, whereas;
majority of the female agricultural students (67.86 per cent) had wish to serve in
government agricultural sector. In case of male agricultural students 49.41 per cent had
wish to serve in government agricultural sector, 44.71 per cent had wish to serve in
management sector, 34.12 per cent had wish to serve in own business, 30.59 percent
students had wish to serve in administrative service, 21.18 per cent students had wish to
serve in private agricultural sector, 18.82 per cent students had wish to serve in
military,18.82 per cent students had wish to serve in marketing and 14.12 per cent had
wish to serve in railway service, while; in case of female agricultural students 64.29 per
cent had wish to serve in banking sector, 53.57 per cent had wish to serve in management
sector, 28.57 per cent had wish to serve in military services, 21.43 per cent students had
wish to serve in own business, 17.86 per cent students had wish to serve in private
agricultural sector, 17.86 per cent students had wish to serve in marketing, 14.29 per cent
students had wish to serve in administrative services and 10.71 per cent had wish to serve
in railway services (Fig 5.1.23).
The calculated value of chi-square (31.60) is less than their tabulated value of chi-
square (16.919) at 5 per cent level of significance. Thus the null hypothesis is rejected and
alternative hypothesis is accepted which meant that there is significant agreement
between male and female agricultural students with respect to their wish to serve in
different areas.
From the data presented in table 5.1.1 to 5.1.23 it can be concluded that majority
of the internet utilizing agricultural students were male, were aged between 20 to 25 years,
were studying in B.Sc. degree programme, had obtained OGPA in last semester in
category 5.00-6.49 OGPA, had father‟s and mother‟s education above senior secondary
and below graduation level, were having occupation of agriculture of their father‟s, were
from rural back ground, were belonged to joint family, were belonged to big family, had
hindi medium of instructions, did not get any training as how to use internet, studied basic
+ tally course of computer, perceived themselves as intermediate in navigating the web,
belonged to hostller category, had wish to have their next higher academic degree, were
utilized library every day upto one hour. Majority of male agricultural students were
unmarried whereas majority of female agricultural students were married, male agricultural
student‟s family income per month ranged between rupees 10001 to 25000 had family
income upto rupees 10000 per month, participated in debate/ lecturing participated in
cultural activities, did not study any course to know use of internet studied course to know
use of internet, had desire to go abroad for settling and had no desire to go abroad, male
students had wish to serve in banking and wish to serve in government agricultural sector.
The findings are in conformity with the findings of (Goh 1997; Lee 1997; King and
Martin 1999; Sherif and Khan 2000; Anonymous 2001; Bonk 2002; Curtis 2002 and Ali
2004).
5.2 Internet Utilization Pattern of Agricultural Students
For measuring the internet utilization pattern of the agricultural students 19
indicators were identified on the basis of review of literature and discussion with the
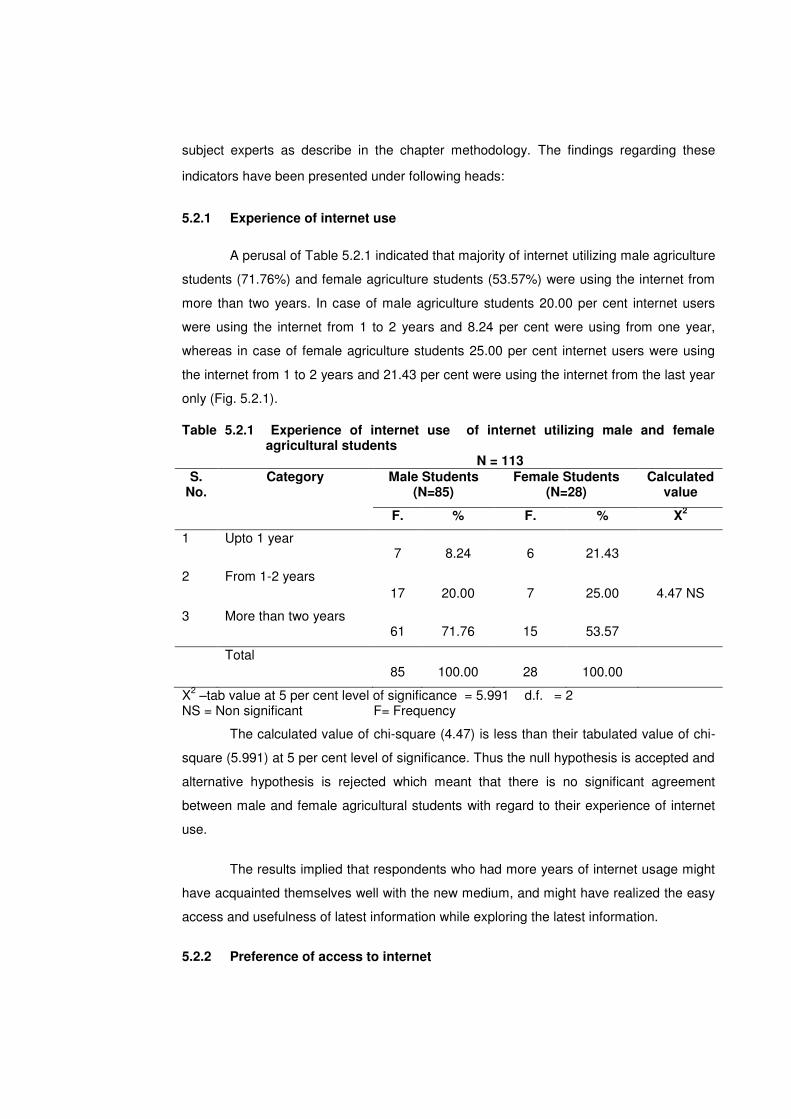
subject experts as describe in the chapter methodology. The findings regarding these
indicators have been presented under following heads:
5.2.1 Experience of internet use
A perusal of Table 5.2.1 indicated that majority of internet utilizing male agriculture
students (71.76%) and female agriculture students (53.57%) were using the internet from
more than two years. In case of male agriculture students 20.00 per cent internet users
were using the internet from 1 to 2 years and 8.24 per cent were using from one year,
whereas in case of female agriculture students 25.00 per cent internet users were using
the internet from 1 to 2 years and 21.43 per cent were using the internet from the last year
only (Fig. 5.2.1).
Table 5.2.1 Experience of internet use of internet utilizing male and female agricultural students N = 113
S. No.
Category Male Students (N=85)
Female Students (N=28)
Calculated value
F. % F. % X2
1 Upto 1 year 7 8.24 6 21.43
2 From 1-2 years
17 20.00 7 25.00 4.47 NS
3 More than two years 61 71.76 15 53.57
Total
85 100.00 28 100.00
X2 –tab value at 5 per cent level of significance = 5.991 d.f. = 2
NS = Non significant F= Frequency
The calculated value of chi-square (4.47) is less than their tabulated value of chi-
square (5.991) at 5 per cent level of significance. Thus the null hypothesis is accepted and
alternative hypothesis is rejected which meant that there is no significant agreement
between male and female agricultural students with regard to their experience of internet
use.
The results implied that respondents who had more years of internet usage might
have acquainted themselves well with the new medium, and might have realized the easy
access and usefulness of latest information while exploring the latest information.
5.2.2 Preference of access to internet
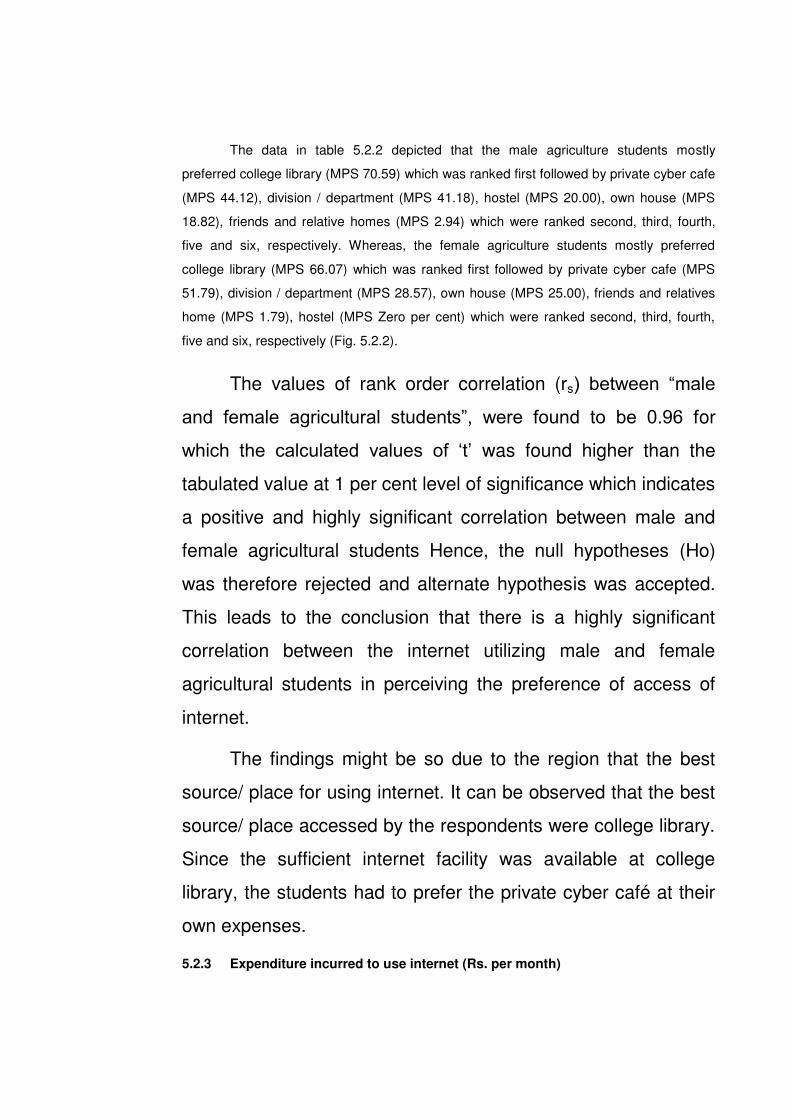
The data in table 5.2.2 depicted that the male agriculture students mostly
preferred college library (MPS 70.59) which was ranked first followed by private cyber cafe
(MPS 44.12), division / department (MPS 41.18), hostel (MPS 20.00), own house (MPS
18.82), friends and relative homes (MPS 2.94) which were ranked second, third, fourth,
five and six, respectively. Whereas, the female agriculture students mostly preferred
college library (MPS 66.07) which was ranked first followed by private cyber cafe (MPS
51.79), division / department (MPS 28.57), own house (MPS 25.00), friends and relatives
home (MPS 1.79), hostel (MPS Zero per cent) which were ranked second, third, fourth,
five and six, respectively (Fig. 5.2.2).
The values of rank order correlation (rs) between “male
and female agricultural students”, were found to be 0.96 for
which the calculated values of „t‟ was found higher than the
tabulated value at 1 per cent level of significance which indicates
a positive and highly significant correlation between male and
female agricultural students Hence, the null hypotheses (Ho)
was therefore rejected and alternate hypothesis was accepted.
This leads to the conclusion that there is a highly significant
correlation between the internet utilizing male and female
agricultural students in perceiving the preference of access of
internet.
The findings might be so due to the region that the best
source/ place for using internet. It can be observed that the best
source/ place accessed by the respondents were college library.
Since the sufficient internet facility was available at college
library, the students had to prefer the private cyber café at their
own expenses.
5.2.3 Expenditure incurred to use internet (Rs. per month)
The table 5.2.3 indicated that majority of internet utilizing male agriculture students
(38.82 per cent) and female agriculture students (35.72 per cent) had spent Rs. 50 to 100
Rs. per month to use internet. In case of male agriculture students 27.06 per cent internet
users not spending any amount, 14.12 per cent spending 101 to 200 Rs. per month and
10.59 per cent spending 201 to 300 Rs. per month and 9.41 per cent spending around 301
to 400 Rs. per month, whereas female agriculture students 28.57 per cent internet users
not spending any amount, 17.86 per cent spending 101 to 200 Rs. Per month,10.71 per
cent spending201 to 300 Rs. Per month and 7.14 spending 301 to 400 Rs. Per month (Fig.
5.2.3).
Table 5.2.3 : Expenditure incurred in using internet (Rs. Per month) by internet utilizing male and female agricultural students
N=113 S.
No. Category Male Students
(N=85) Female Students
(N=28) Calculated
value
F. % F. % X2
1 Nil 23 27.06 8 28.57
2 Rs 50-100 33 38.83 10 35.72 0.39 NS
3 Rs 101-200 12 14.12 5 17.86
4 Rs 201-300 9 10.59 3 10.71
5 Rs 301-400 8 9.41 2 7.14
Total 85 100.00 28 100.00
X2 –tab value at 5 per cent level of significance = 9.488 d.f. = 4
NS = Non significant F= Frequency
The calculated value of chi-square (0.39) is less than their tabulated value of chi-
square (9.488) at 5 per cent level of significance. Thus the null hypothesis is accepted and
alternative hypothesis is rejected which meant that there is no significant agreement
between male and female agricultural students.
Majority of the respondents spent around Rs. 50-100 per month. It may be
because of the reason that, most of the students had access to internet at the private
cyber café after the college library because of flexibility in timing, high speed and
availability of varied tariff plans.
5.2.4 Frequency of Internet use
The table 5.2.4 indicated that majority of internet utilizing male agriculture students
(51.76%) had used internet facility every day out of which 56.82 per cent, 34.09 per cent
and 9.09 per cent used internet for upto 1 hours, 2-3 hours and above 3 hours,
respectively whereas about (53.57 per cent) female agriculture students had used internet
facility every day out of which 60.00 per cent, 26.67 per cent and 13.33 per cent use
internet upto 1 hours, 2-3 hours and above 3 hours. In case of male agriculture students
(25.88 per cent) had used internet facility once in a week out of which 50.00 per cent,
36.36 per cent and 13.64 per cent use internet for upto 1 hours, 2-3 hours and above 3
hours, respectively, (7.06%) students had used internet facility on occasions out of which
half of students used upto 1 hours and 50.00 per cent used upto 2-3 hours, (7.06 %)
students had used internet facility once in month, 7.06 per cent had used internet facility
once in a month out of which 83.33 per cent used upto 1 hours and 16.67 per cent used
above 3 hours (4.71%) had used internet facility twice in a week out of which 75.00 per
cent, 25.00 per cent and no students used internet for upto 1 hours, 2-3 hours and above
3 hours and (3.53%) had used internet facility once in fortnight out of which whole students
used internet facility upto 2-3 hours,. In case of female agriculture students (21.43%) had
used internet facility once in a week out of which 50.00 per cent, 33.33 per cent and 16.67
per cent used upto 1 hours, 2-3 hours and above 3 hours, (7.14%) had used internet
facility twice in a week out of which whole students used upto 1 hours, (7.14%) used
internet facility once in fortnight out of which whole students used internet upto 2-3 hours,
(7.14%) had used internet facility on occasions out of which whole students used internet
upto 1 hours and (3.57%) had used internet facility once in a month out of which whole
student used upto 1 hours (Fig. 5.2.4).
The calculated value of chi-square (0.418) is less than their tabulated value of chi-
square (12.592) at 5 per cent level of significance. Thus the null hypothesis is accepted
and alternative hypothesis is rejected which meant that there is no significant agreement
between male and female agricultural students with respect to their frequency of internet
use.
The findings might be so due to reason that the internet provided variety of
information at low cost and have updated information very short period of time, thus more
hours spent at internet may be attributed to browsing of latest information among
respondents.
5.2.5 Purpose of internet use
The data in presented in table 5.2.5 indicated that majority of the internet utilizing
male agriculture students preferred the best purpose on internet use were “e-mail to
friends and relatives” (MPS 87.65) while female agriculture students (MPS 83.93) and was
ranked first. In case of male agriculture students “searching useful sites for career
development” (MPS 87.06), was ranked second followed by “to send or receive e-mails”
(MPS 80.00), “to collect information for class assignments” (MPS 78.24), “For sending
message” (MPS 72.35), “to collect information for higher studies” (MPS 70.59), “for
entertainment” (MPS 61.76), “for preparation of competitive exams” (MPS 58.82), “to
collect information for research references” (MPS 57.65), “to send application for job”
(MPS 54.71), “to send research articles for publication in research journals” (MPS 41.76),
“to collect information‟s to class notes” (MPS 40.00), “chatting” (MPS 38.24), “to collect
information for abroad studies” (MPS 32.94), “for generating self employment” (MPS
29.41), “to collect information to attend seminar/ conferences etc. (25.88), “to satisfy
curiosity” (MPS 24.12), “just for time pass” (MPS 21.76), “for matrimonial purpose” (MPS
20.00), “for telephony communication” (MPS 12.94) and “to develop own website” (1.76)
which were ranked third, fourth, five, six, seven, eight, nine, ten, eleven, twelve, thirteen,
fourteen, fifteen, sixteen, seventeen, eighteen, nineteen, twenty and twenty one,
respectively. In case of female agriculture students, “searching useful sites for career
development” (MPS 80.36), was ranked second followed by “to collect information for
class assignments” (MPS 71.43), “to send application for job” (MPS 67.86), “to collect
information for higher studies” (MPS 64.29), “to collect information for research
references” (MPS 64.29), “to send or receive e-mails” (MPS 64.29), “for sending message”
(MPS 62.50), “for entertainment” (MPS 53.57), “to send research articles for publication in
research journals” (MPS 46.43), “for preparation for competitive exams” (MPS 44.64), “to
collect information‟s to class notes” (MPS 44.64), “to collect information to attend seminar/
conferences etc.” (MPS 33.93), “to collect information for abroad studies” (MPS 32.14),
“for generating self employment” (MPS 28.57), “to satisfy curiosity” (MPS 17.86), “chatting”
(MPS 14.29), “just for time pass” (MPS 10.71), “for matrimonial purpose” (7.14), “for
telephony communication” (MPS 5.36) and “to develop own website” (MPS 0.00) to which
were ranked third, fourth, five, six, seven, eight, nine, ten, eleven, twelve, thirteen,
fourteen, fifteen, sixteen, seventeen, eighteen, nineteen, twenty and twenty one,
respectively (Fig. 5.2.5).
The values of rank order correlation (rs) between “male
and female agricultural students” were calculated and tested.
The calculated values of „t‟ were found less than their tabulated
values which leads to the conclusion that there is a non
significant correlation between the internet utilizing male and
female agricultural students in perceiving the purpose of internet

use. There is no correlation between internet utilizing male and
female agricultural students with respect to their purpose of
internet use.
Thus, by carefully analyzing the purposes, it is quite
obvious that majority of the students required to communicate
with each other at least once in a day by e-mail, and of course,
every student was found to be very much interested regarding
their career development.
5.2.6 Possession of E-mail ID
The data in table 5.2.6 revealed that in case of male agriculture students, 40.00
per cent internet users possessed more than two E-mail ID and followed by 36.47 per cent
were having two E-mail ID and 15.29 per cent were having one E-mail ID and 8.24 per
cent internet users did not possess any E-mail ID in case of female agriculture students
(46.43%) were having two E-mail ID, followed by 17.86 per cent were having more than
two E-mail ID and 25.00 per cent were having one E-mail ID and 10.71 per cent internet
users did not possess any E-mail ID (Fig. 5.2.6).
Table 5.2.6 : Possession of E-mail ID of internet utilizing male and female agricultural students N=113
S. No.
Category Male Students (N=85)
Female Students (N=28)
Calculated value
F. % F. % X2
1 Nil 7 8.24 3 10.71
2 One E-mail ID 13 15.29 7 25.00 4.80 NS
3 Two E-mail ID 31 36.47 13 46.43
4 More than two E-
mail ID 34 40.00 5 17.86
Total 85 100.00 28 100.00
X2 –tab value at 5 per cent level of significance = 7.815 d.f. = 3
NS = Non significant F= Frequency
The calculated value of chi-square (4.80) is less than their tabulated value of chi-
square (7.815) at 5 per cent level of significance. Thus the null hypothesis is accepted and
alternative hypothesis is rejected which meant that there is no significant agreement
between male and female agricultural students with respect to their possession of e-mail
ID.
This might be due to the fact that e-mail ID is available free of cost and, users may
also require more storage space to save their mails for longer period. This could be the
motivational force among the respondents to have two or more than two e-mail IDs.
5.2.7 Frequency of e-mail use
The table 5.2.7 revealed that majority internet utilizing male agriculture students
(42.35%) were utilizing e-mail facility every day, out of which 36.11 per cent, 44.44 per
cent and 19.44 per cent male agriculture students used one, 2-3 and more than 3 e-mails
at a time, respectively and female agriculture students (42.86%) were utilizing e-mail
facility every day, out of which 16.67 per cent, 50.00 per cent and 33.33 per cent used
one, 2-3 and more than 3 e-mails at a time, respectively. In case of male agriculture
students 25.88 per cent, 4.71 per cent, 3.53 per cent, 5.88 per cent and 17.65 per cent
students utilized e-mail facility once in a week, twice in a week, once in fortnight, once in a
month and on occasions, respectively. In case of female agriculture students 39.29 per
cent, 10.71 per cent and 7.14 per cent of the students utilized e-mail facility once in a
week, once in a fortnight and once in a month, respectively. On the whole there were not
found any student which was never utilized e-mail facility once in a week and on
occasions, any time (Fig. 5.2.7).
The calculated value of chi-square (9.66) is less than their tabulated value of chi-
square (12.592) at 5 per cent level of significance. Thus the null hypothesis is accepted
and alternative hypothesis is rejected which meant that there is no significant agreement
between male and female agricultural students with respect to their frequency of e-mail
use.
The result showed that majority of the respondents utilized e-mail facility either
every day or once in a week. It means that majority of the respondents might have well
acquainted with the new medium of communication and might have realized its
effectiveness in terms of time and cost.
5.2.8 Purpose of E-mail use
The table 5.2.8 indicated that majority of internet utilizing male agriculture students
(49.41%) and female agriculture students (46.43%) used e-mail for personal purpose. In
case of male agriculture students 27.06 per cent internet users used e-mail for academic
purpose, 11.76 per cent for pleasure purpose, 8.24 per cent for other purpose and 3.53
per cent for advertisement purpose; whereas among female agriculture students 35.72 per
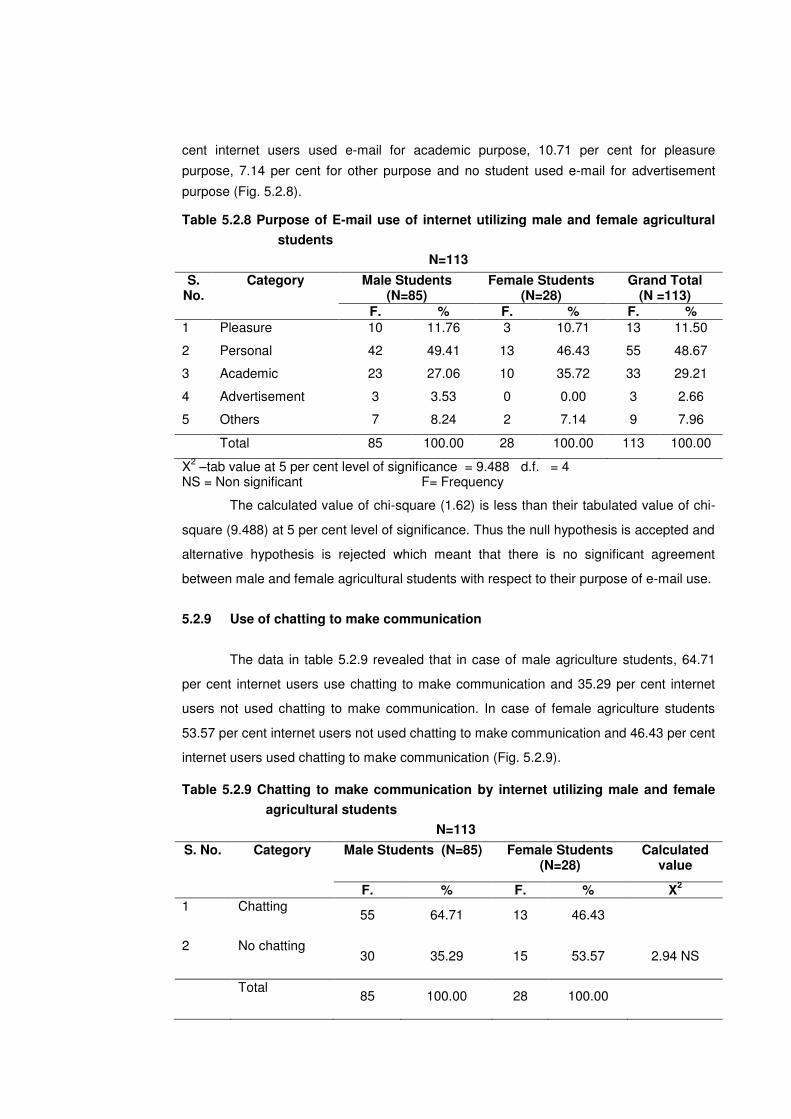
cent internet users used e-mail for academic purpose, 10.71 per cent for pleasure
purpose, 7.14 per cent for other purpose and no student used e-mail for advertisement
purpose (Fig. 5.2.8).
Table 5.2.8 Purpose of E-mail use of internet utilizing male and female agricultural
students
N=113
S. No.
Category Male Students (N=85)
Female Students (N=28)
Grand Total (N =113)
F. % F. % F. % 1 Pleasure 10 11.76 3 10.71 13 11.50
2 Personal 42 49.41 13 46.43 55 48.67
3 Academic 23 27.06 10 35.72 33 29.21
4 Advertisement 3 3.53 0 0.00 3 2.66
5 Others 7 8.24 2 7.14 9 7.96
Total 85 100.00 28 100.00 113 100.00
X2 –tab value at 5 per cent level of significance = 9.488 d.f. = 4
NS = Non significant F= Frequency
The calculated value of chi-square (1.62) is less than their tabulated value of chi-
square (9.488) at 5 per cent level of significance. Thus the null hypothesis is accepted and
alternative hypothesis is rejected which meant that there is no significant agreement
between male and female agricultural students with respect to their purpose of e-mail use.
5.2.9 Use of chatting to make communication
The data in table 5.2.9 revealed that in case of male agriculture students, 64.71
per cent internet users use chatting to make communication and 35.29 per cent internet
users not used chatting to make communication. In case of female agriculture students
53.57 per cent internet users not used chatting to make communication and 46.43 per cent
internet users used chatting to make communication (Fig. 5.2.9).
Table 5.2.9 Chatting to make communication by internet utilizing male and female
agricultural students
N=113
S. No. Category Male Students (N=85) Female Students (N=28)
Calculated value
F. % F. % X2
1 Chatting 55 64.71 13 46.43
2 No chatting 30 35.29 15 53.57 2.94 NS
Total 85 100.00 28 100.00
X2 –tab value at 5 per cent level of significance = 3.841 d.f. = 1
NS = Non significant F= Frequency
The calculated value of chi-square (2.94) is less than their tabulated value of chi-
square (3.841) at 5 per cent level of significance. Thus the null hypothesis is accepted and
alternative hypothesis is rejected which meant that there is no significant agreement
between male and female agricultural students with respect to their use of chatting to
make communication.
5.2.10 Frequency of chatting
The data in table 5.2.10 indicated that majority of the male agriculture students
(25.88%) were utilizing chatting facility once in a week out of which 50.00 per cent, 36.36
per cent and 13.64 per cent used upto 1 hour, 2-3 hour and more than 3 hours, while;
majority of the female agriculture students (17.86%) were utilizing chatting facility once in
a week out of which 80.00 per cent and 20.00 per cent used upto 1 hour and 2-3 hour. In
case of male agriculture students 18.82 per cent, 4.71 per cent, 4.71 per cent, 3.53 per
cent and 7.06 per cent students were utilizing chatting facility every day, twice in a week,
once in a fortnight, once in a month and on occasion, respectively and 35.29 per cent of
the students never utilized chatting facility. In case of female agriculture students 10.71
per cent, 7.14 per cent and 10.71 per cent were utilizing chatting facility every day, once in
a week and on occasion, respectively and 53.57 per cent female agricultural students
never utilized chatting facility (Fig. 5.2.10).
The calculated value of chi-square (6.05) is less than their tabulated value of chi-
square (12.592) at 5 per cent level of significance. Thus the null hypothesis is accepted
and alternative hypothesis is rejected which meant that there is no significant agreement
between male and female agricultural students with respect to their frequency of chatting.
The findings might be so due to the reason that instant massages are extremely
fast in exchanging messages at a time, than the e-mail service. This is the best way
available on internet to establish line contact between friends, relative, professors and
others.
5.2.11 Use of different search-engines
The data in table 5.2.11 depicted that majority of the internet utilizing male
agricultural students (MPS 91.18) and female agricultural students (MPS 91.07) used
google and was accorded it first rank, followed by Rediff (MPS 85.29), Yahoo (MPS
84.12), Live (MPS 61.76), India times (MPS 55.29), MSN (MPS 47.65), Khoj (MPS 35.88),
Ask jeeves (MPS 33.53), Alta vista (MPS 24.12),Info seek (MPS 18.24), Bing (MPS
15.88), Lycos (MPS 15.88), Netscape (MPS 10.59) and Vibisimo (MPS 7.65) which were
ranked second, third, fourth, five, six, seven, eight, nine, ten, eleven, twelve thirteen and
fourteen, respectively. Whereas, the female agriculture students used yahoo (MPS 85.71),
Rediff (MPS 83.93), Live (MPS 64.29), MSN (MPS 51.79), India times (MPS 51.79), Ask
jeeves (MPS 41.07), Khoj (MPS 41.07), Info seek (MPS 30.36), Bing (MPS 25.00), Alta
vista (MPS 25.00) Lycos (MPS 17.86), Netscape (MPS 12.50) and Vibisimo (MPS 10.71),
which were ranked second, third, fourth, five, six, seven, eight, nine, ten, eleven, twelve
thirteen and fourteen, respectively (Fig. 5.2.11).
The values of rank order correlation (rs) between male and
female agricultural students, were found to be 0.95 for which the
calculated values of „t‟ was found higher than their tabulated
values at 1 per cent level of significance which indicates a
positive and highly significant correlation between male and
female agricultural students Hence, the null hypotheses (Ho)
was, therefore rejected and alternate hypothesis was accepted.
This leads to the conclusion that there is a highly significant
correlation between the internet utilizing male and female
agricultural students in perceiving the use of different search
engines.
This might be due to the reason that the Yahoo and Google
search engines are oldest search engines have been made available from
very beginning and they are easy to assess and speedy as compared to
others. This might be the reason to prefer Google and Yahoo more as
compared to other search engines by the research scholars.
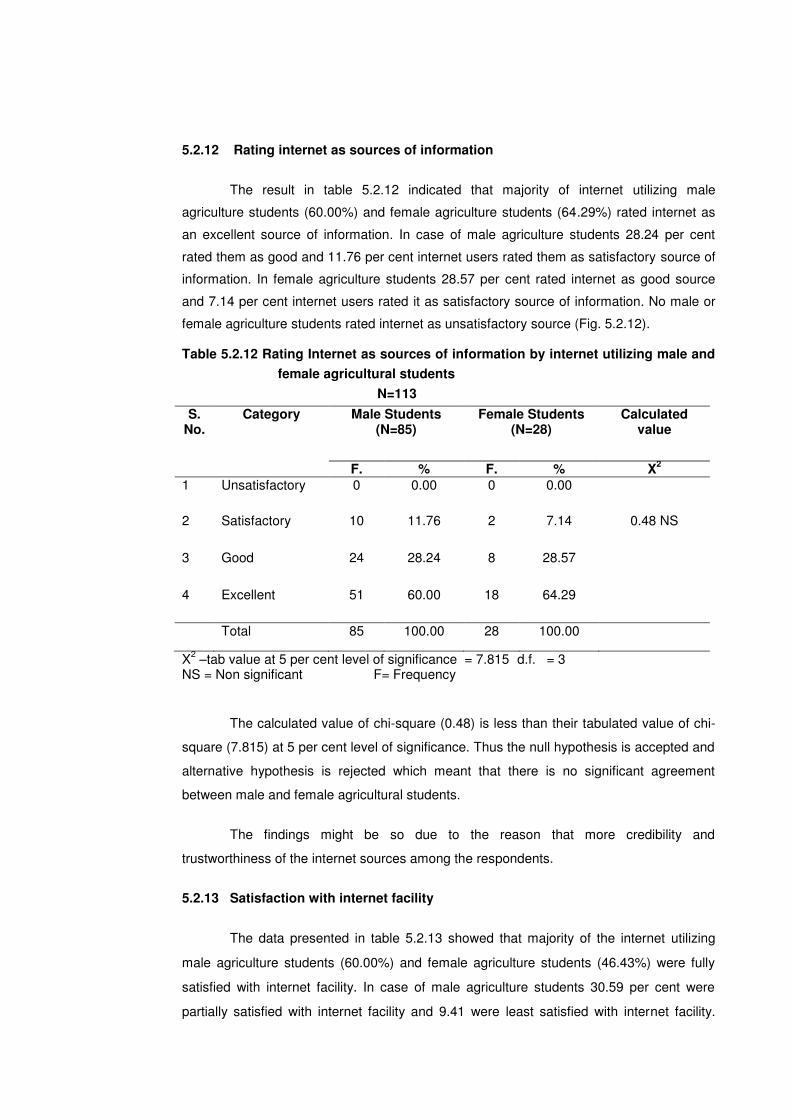
5.2.12 Rating internet as sources of information
The result in table 5.2.12 indicated that majority of internet utilizing male
agriculture students (60.00%) and female agriculture students (64.29%) rated internet as
an excellent source of information. In case of male agriculture students 28.24 per cent
rated them as good and 11.76 per cent internet users rated them as satisfactory source of
information. In female agriculture students 28.57 per cent rated internet as good source
and 7.14 per cent internet users rated it as satisfactory source of information. No male or
female agriculture students rated internet as unsatisfactory source (Fig. 5.2.12).
Table 5.2.12 Rating Internet as sources of information by internet utilizing male and
female agricultural students
N=113
S. No.
Category Male Students (N=85)
Female Students (N=28)
Calculated value
F. % F. % X2
1 Unsatisfactory 0 0.00 0 0.00
2 Satisfactory 10 11.76 2 7.14 0.48 NS
3 Good 24 28.24 8 28.57
4 Excellent 51 60.00 18 64.29
Total 85 100.00 28 100.00
X2 –tab value at 5 per cent level of significance = 7.815 d.f. = 3
NS = Non significant F= Frequency
The calculated value of chi-square (0.48) is less than their tabulated value of chi-
square (7.815) at 5 per cent level of significance. Thus the null hypothesis is accepted and
alternative hypothesis is rejected which meant that there is no significant agreement
between male and female agricultural students.
The findings might be so due to the reason that more credibility and
trustworthiness of the internet sources among the respondents.
5.2.13 Satisfaction with internet facility
The data presented in table 5.2.13 showed that majority of the internet utilizing
male agriculture students (60.00%) and female agriculture students (46.43%) were fully
satisfied with internet facility. In case of male agriculture students 30.59 per cent were
partially satisfied with internet facility and 9.41 were least satisfied with internet facility.
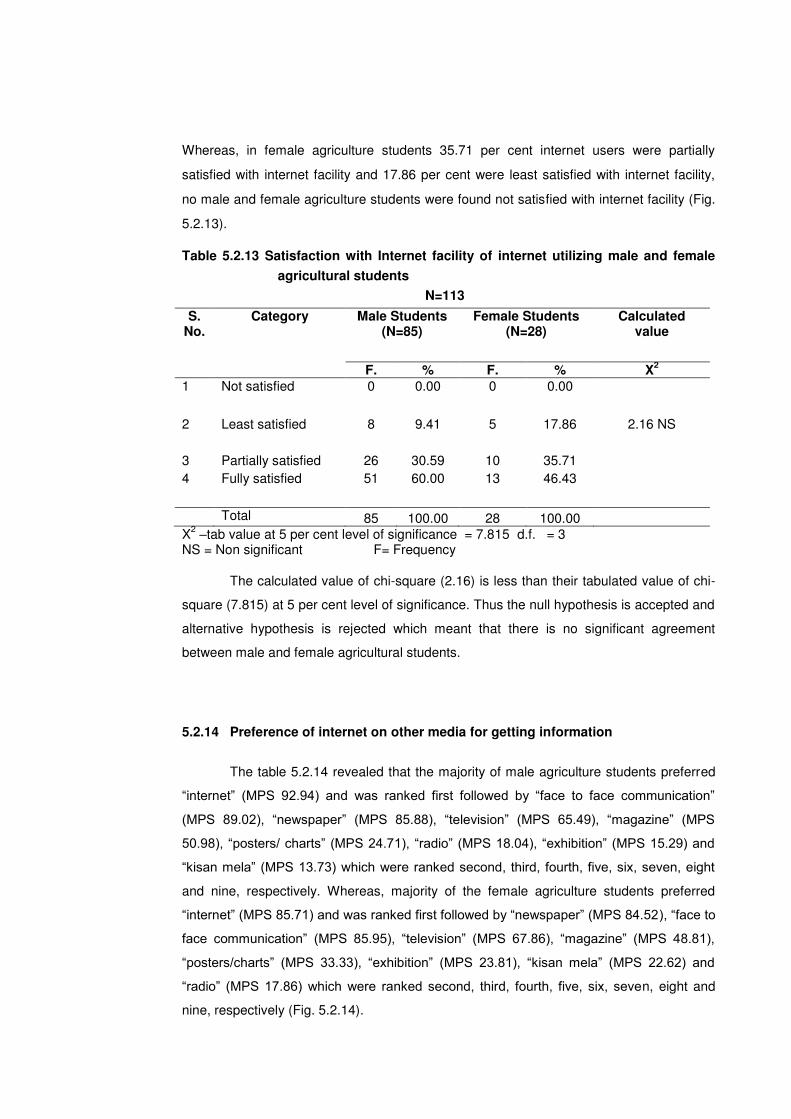
Whereas, in female agriculture students 35.71 per cent internet users were partially
satisfied with internet facility and 17.86 per cent were least satisfied with internet facility,
no male and female agriculture students were found not satisfied with internet facility (Fig.
5.2.13).
Table 5.2.13 Satisfaction with Internet facility of internet utilizing male and female
agricultural students
N=113
S. No.
Category Male Students (N=85)
Female Students (N=28)
Calculated value
F. % F. % X2
1 Not satisfied 0 0.00 0 0.00
2 Least satisfied 8 9.41 5 17.86 2.16 NS
3 Partially satisfied 26 30.59 10 35.71
4 Fully satisfied 51 60.00 13 46.43
Total 85 100.00 28 100.00 X
2 –tab value at 5 per cent level of significance = 7.815 d.f. = 3
NS = Non significant F= Frequency
The calculated value of chi-square (2.16) is less than their tabulated value of chi-
square (7.815) at 5 per cent level of significance. Thus the null hypothesis is accepted and
alternative hypothesis is rejected which meant that there is no significant agreement
between male and female agricultural students.
5.2.14 Preference of internet on other media for getting information
The table 5.2.14 revealed that the majority of male agriculture students preferred
“internet” (MPS 92.94) and was ranked first followed by “face to face communication”
(MPS 89.02), “newspaper” (MPS 85.88), “television” (MPS 65.49), “magazine” (MPS
50.98), “posters/ charts” (MPS 24.71), “radio” (MPS 18.04), “exhibition” (MPS 15.29) and
“kisan mela” (MPS 13.73) which were ranked second, third, fourth, five, six, seven, eight
and nine, respectively. Whereas, majority of the female agriculture students preferred
“internet” (MPS 85.71) and was ranked first followed by “newspaper” (MPS 84.52), “face to
face communication” (MPS 85.95), “television” (MPS 67.86), “magazine” (MPS 48.81),
“posters/charts” (MPS 33.33), “exhibition” (MPS 23.81), “kisan mela” (MPS 22.62) and
“radio” (MPS 17.86) which were ranked second, third, fourth, five, six, seven, eight and
nine, respectively (Fig. 5.2.14).
The values of rank order correlation (rs) between male and
female agricultural students, were found to be 0.94 for which the
calculated values of „t‟ were found higher than their tabulated
values at 1 per cent level of significance which indicates a
positive and highly significant correlation between male and
female agricultural students Hence, the null hypotheses Ho
were, therefore rejected and alternate hypotheses were
accepted. This leads to the conclusion that there is a highly
significant correlation between the internet utilizing male and
female agricultural students in perceiving the preference of
internet on other media for getting information.
5.2.15 Browsing technique for getting required information
The table 5.2.15 indicated that the majority of the male agriculture students
browse the required information from the internet through “use search engines” (MPS
87.06) and was ranked first followed by “typing the web address directly” (MPS 79.41),
“printed ads. Newspapers magazines etc”. (MPS 51.76) and “use subscription database”
(MPS 25.88) which were ranked second, third and fourth, respectively. Whereas majority
of the female agriculture students browse the required information from the internet
through “use search engines” (MPS 87.50) and was ranked first followed by followed “type
the web address directly” (MPS 64.29), “use subscription database” (MPS 50.00) and
“printed ads. Newspapers magazines etc.” (MPS 37.50) which were ranked second, third
and fourth, respectively (Fig. 5.2.15).
The values of rank order correlation (rs) between male and female agricultural
students, were found to be 0.98 for which the calculated value of „t‟ was found higher than
the tabulated value at 1 per cent level of significance which indicates a positive and highly
significant correlation between male and female agricultural students Hence, the null
hypotheses Ho were, therefore rejected and alternate hypotheses were accepted. This
leads to the conclusion that there is a highly significant correlation between the internet
utilizing male and female agricultural students in perceiving the browsing technique.
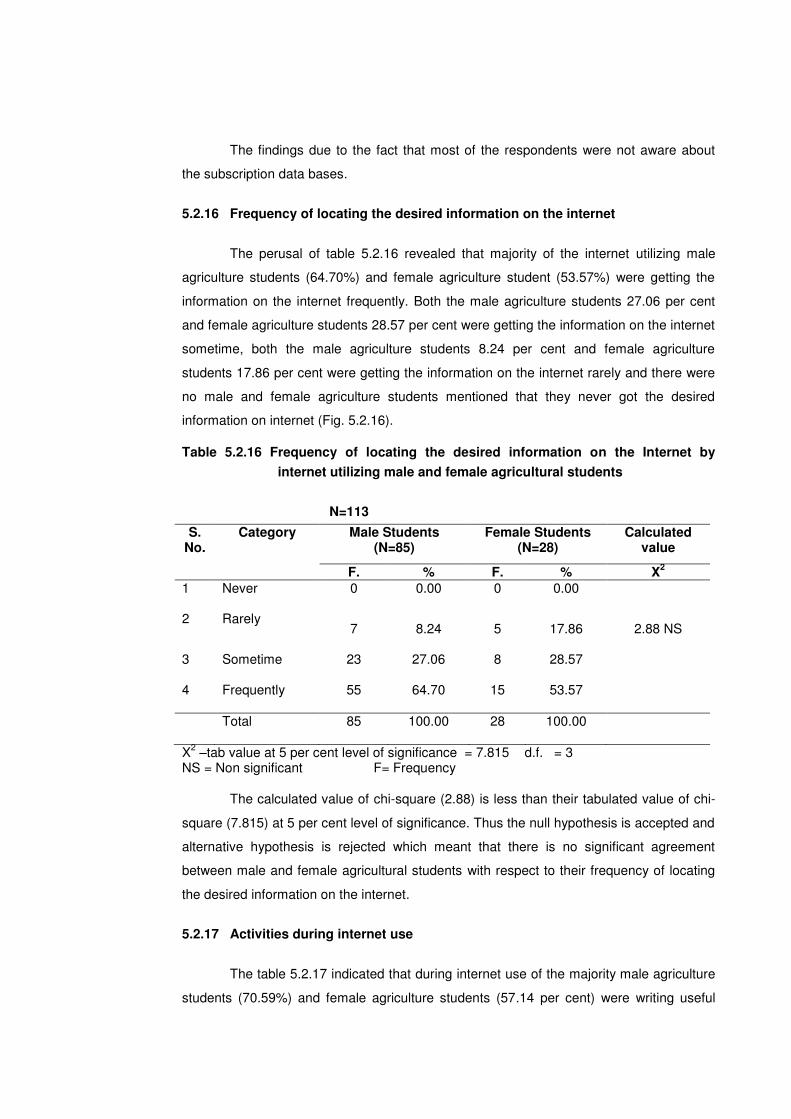
The findings due to the fact that most of the respondents were not aware about
the subscription data bases.
5.2.16 Frequency of locating the desired information on the internet
The perusal of table 5.2.16 revealed that majority of the internet utilizing male
agriculture students (64.70%) and female agriculture student (53.57%) were getting the
information on the internet frequently. Both the male agriculture students 27.06 per cent
and female agriculture students 28.57 per cent were getting the information on the internet
sometime, both the male agriculture students 8.24 per cent and female agriculture
students 17.86 per cent were getting the information on the internet rarely and there were
no male and female agriculture students mentioned that they never got the desired
information on internet (Fig. 5.2.16).
Table 5.2.16 Frequency of locating the desired information on the Internet by
internet utilizing male and female agricultural students
N=113
S. No.
Category Male Students (N=85)
Female Students (N=28)
Calculated value
F. % F. % X2
1 Never 0 0.00 0 0.00
2 Rarely 7 8.24 5 17.86 2.88 NS
3 Sometime 23 27.06 8 28.57
4 Frequently 55 64.70 15 53.57
Total 85 100.00 28 100.00
X2 –tab value at 5 per cent level of significance = 7.815 d.f. = 3
NS = Non significant F= Frequency
The calculated value of chi-square (2.88) is less than their tabulated value of chi-
square (7.815) at 5 per cent level of significance. Thus the null hypothesis is accepted and
alternative hypothesis is rejected which meant that there is no significant agreement
between male and female agricultural students with respect to their frequency of locating
the desired information on the internet.
5.2.17 Activities during internet use
The table 5.2.17 indicated that during internet use of the majority male agriculture
students (70.59%) and female agriculture students (57.14 per cent) were writing useful
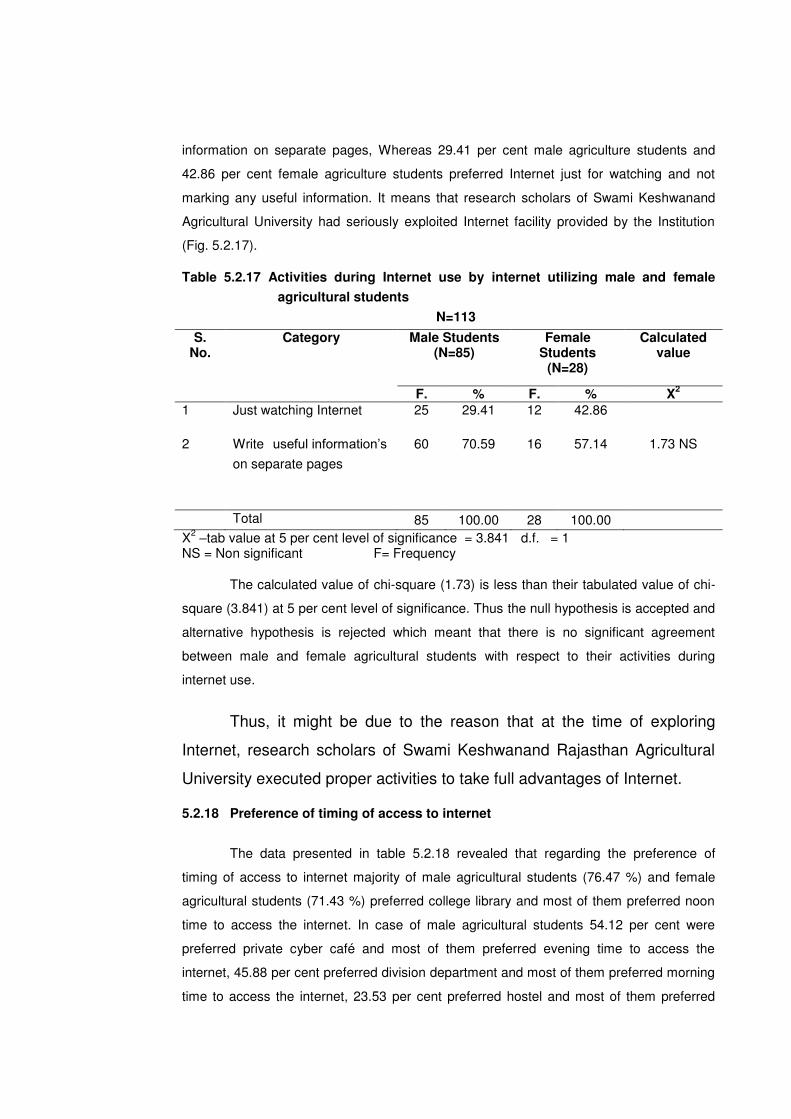
information on separate pages, Whereas 29.41 per cent male agriculture students and
42.86 per cent female agriculture students preferred Internet just for watching and not
marking any useful information. It means that research scholars of Swami Keshwanand
Agricultural University had seriously exploited Internet facility provided by the Institution
(Fig. 5.2.17).
Table 5.2.17 Activities during Internet use by internet utilizing male and female
agricultural students
N=113
S. No.
Category Male Students (N=85)
Female Students
(N=28)
Calculated value
F. % F. % X2
1 Just watching Internet 25 29.41 12 42.86
2 Write--useful information‟s on separate pages
60 70.59 16 57.14 1.73 NS
Total 85 100.00 28 100.00
X2 –tab value at 5 per cent level of significance = 3.841 d.f. = 1
NS = Non significant F= Frequency
The calculated value of chi-square (1.73) is less than their tabulated value of chi-
square (3.841) at 5 per cent level of significance. Thus the null hypothesis is accepted and
alternative hypothesis is rejected which meant that there is no significant agreement
between male and female agricultural students with respect to their activities during
internet use.
Thus, it might be due to the reason that at the time of exploring
Internet, research scholars of Swami Keshwanand Rajasthan Agricultural
University executed proper activities to take full advantages of Internet.
5.2.18 Preference of timing of access to internet
The data presented in table 5.2.18 revealed that regarding the preference of
timing of access to internet majority of male agricultural students (76.47 %) and female
agricultural students (71.43 %) preferred college library and most of them preferred noon
time to access the internet. In case of male agricultural students 54.12 per cent were
preferred private cyber café and most of them preferred evening time to access the
internet, 45.88 per cent preferred division department and most of them preferred morning
time to access the internet, 23.53 per cent preferred hostel and most of them preferred
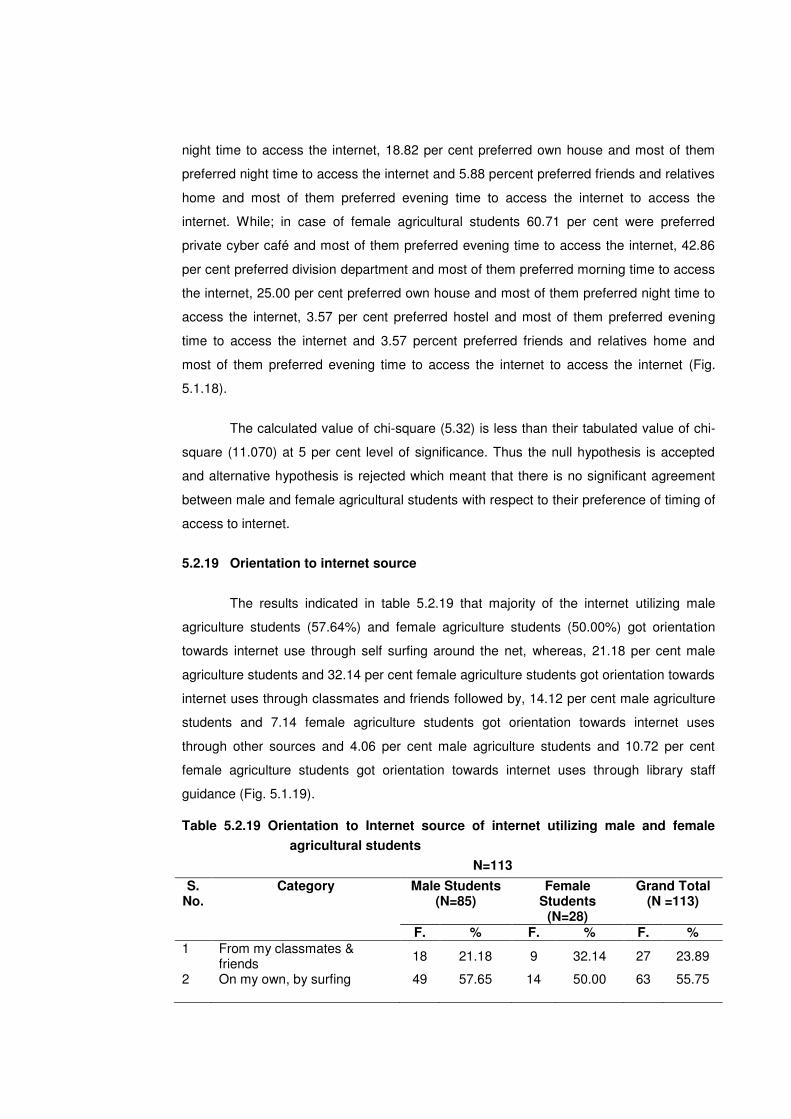
night time to access the internet, 18.82 per cent preferred own house and most of them
preferred night time to access the internet and 5.88 percent preferred friends and relatives
home and most of them preferred evening time to access the internet to access the
internet. While; in case of female agricultural students 60.71 per cent were preferred
private cyber café and most of them preferred evening time to access the internet, 42.86
per cent preferred division department and most of them preferred morning time to access
the internet, 25.00 per cent preferred own house and most of them preferred night time to
access the internet, 3.57 per cent preferred hostel and most of them preferred evening
time to access the internet and 3.57 percent preferred friends and relatives home and
most of them preferred evening time to access the internet to access the internet (Fig.
5.1.18).
The calculated value of chi-square (5.32) is less than their tabulated value of chi-
square (11.070) at 5 per cent level of significance. Thus the null hypothesis is accepted
and alternative hypothesis is rejected which meant that there is no significant agreement
between male and female agricultural students with respect to their preference of timing of
access to internet.
5.2.19 Orientation to internet source
The results indicated in table 5.2.19 that majority of the internet utilizing male
agriculture students (57.64%) and female agriculture students (50.00%) got orientation
towards internet use through self surfing around the net, whereas, 21.18 per cent male
agriculture students and 32.14 per cent female agriculture students got orientation towards
internet uses through classmates and friends followed by, 14.12 per cent male agriculture
students and 7.14 female agriculture students got orientation towards internet uses
through other sources and 4.06 per cent male agriculture students and 10.72 per cent
female agriculture students got orientation towards internet uses through library staff
guidance (Fig. 5.1.19).
Table 5.2.19 Orientation to Internet source of internet utilizing male and female
agricultural students
N=113
S. No.
Category Male Students (N=85)
Female Students
(N=28)
Grand Total (N =113)
F. % F. % F. % 1 From my classmates &
friends 18 21.18 9 32.14 27 23.89
2 On my own, by surfing 49 57.65 14 50.00 63 55.75
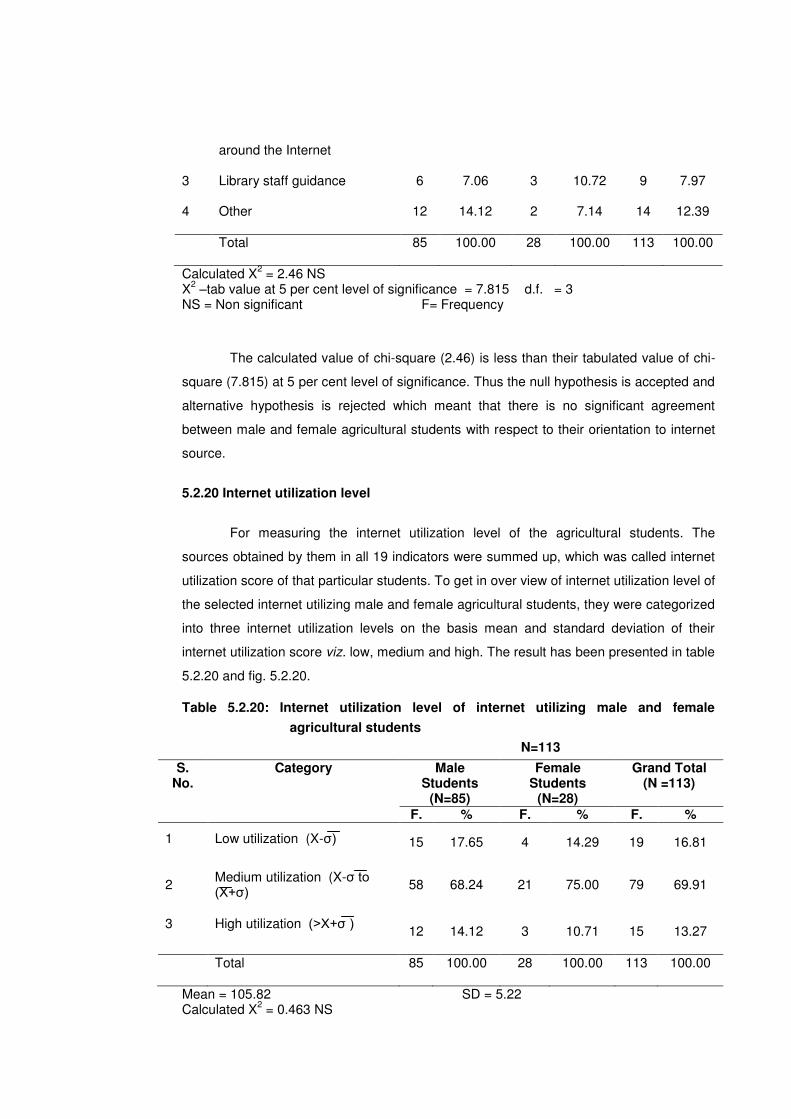
around the Internet
3 Library staff guidance 6 7.06 3 10.72 9 7.97
4 Other 12 14.12 2 7.14 14 12.39
Total 85 100.00 28 100.00 113 100.00
Calculated X2 = 2.46 NS
X2 –tab value at 5 per cent level of significance = 7.815 d.f. = 3
NS = Non significant F= Frequency
The calculated value of chi-square (2.46) is less than their tabulated value of chi-
square (7.815) at 5 per cent level of significance. Thus the null hypothesis is accepted and
alternative hypothesis is rejected which meant that there is no significant agreement
between male and female agricultural students with respect to their orientation to internet
source.
5.2.20 Internet utilization level
For measuring the internet utilization level of the agricultural students. The
sources obtained by them in all 19 indicators were summed up, which was called internet
utilization score of that particular students. To get in over view of internet utilization level of
the selected internet utilizing male and female agricultural students, they were categorized
into three internet utilization levels on the basis mean and standard deviation of their
internet utilization score viz. low, medium and high. The result has been presented in table
5.2.20 and fig. 5.2.20.
Table 5.2.20: Internet utilization level of internet utilizing male and female
agricultural students
N=113
S. No.
Category Male Students
(N=85)
Female Students
(N=28)
Grand Total (N =113)
F. % F. % F. %
1 Low utilization (X-σ) 15 17.65 4 14.29 19 16.81
2 Medium utilization (X-σ to (X+σ) 58 68.24 21 75.00 79 69.91
3 High utilization (>X+σ ) 12 14.12 3 10.71 15 13.27
Total 85 100.00 28 100.00 113 100.00
Mean = 105.82 SD = 5.22 Calculated X
2 = 0.463 NS
X2 –tab value at 5 per cent level of significance = 5.919 d.f. = 2
NS = Non significant F= Frequency
A perusal of data presented in the table visualizes that majority of the male (68.24
per cent) and female (75.00 per cent) agricultural students had medium internet utilization
level followed by 17.65 per cent male and 14.29 per cent female agricultural students were
having low internet utilization level, whereas only 14.12 per cent male and 10.71 per cent
female agricultural students were having level of internet utilization.
It is also clear that majority of the total respondents were belonged to medium
level of internet utilization, which indicates that still there is more scope to achieve the
effective utilization of the internet facilities.
The calculated value of chi-square (0.463) is less than tabulated value of chi-
square (5.919) at 5 per cent level of significance. The null hypothesis accepted and
alternate hypothesis rejected which meant that there is no significant agreement between
the internet utilization male of female agricultural students with reference to their internet
utilization level. Hence it can be concluded that the male and female agricultural students
differ in their internet utilization level.
From the data presented in table 5.2.1 to 5.2.20 it can be concluded that majority
of the internet utilizing male and female agricultural students were using internet from
more than two years, mostly preferred college library, had spent Rs. 50 to 100 per month
to use internet, used internet facility every day, considered the best purpose of internet
use as “e-mail to friends and relatives”, having more than two e-mails ID, were utilizing e-
mail every day upto two to three e-mails, preferred to do the e-mail use for personal use,
were utilizing chatting facility once in a week upto one hour, used google as search
engine, rated internet as an excellent source of information, were fully satisfied with
internet facility, preferred “internet” on other media for getting information, browse the
required information from the internet through using search engines, getting the
information on the internet frequently, were writing useful information on separate pages
during internet use, preferred college library in noon to access the internet, got orientation
towards internet use through self surfing around the net and had medium level of internet
utilization. Majority of the male agricultural students used chatting to make communication
whereas the female agricultural students not used chatting to make communication.
The findings are in conformity with the findings of (Patil 1999; Voorbij 1999;
Amritpal Kaur 2000; Chi-Cheng Chang 2001; Anonymous 2002; Kim Deok 2002; Maniar
2002; Teresa et al. 2003; Kalra 2004; Patel 2004; Chouhan 2005 and Patel and Chouhan
2005).
5.3 Effect of internet utilization on overall performance of
Agricultural students
In the present investigation an attempt has been made to find out the effect of
internet use on academic performances and non academic performances. This was
studied by asking simple questions, as how the students perceive the effect of internet
services in their academic and non academic performances. The data collected in this
respect is presented under the following heads:
5.3.1 Effect of internet use on academic performance of the agricultural students
The data presented in table 5.3.1 indicated that among the different academic
performances the „Internet services facilitate improvement in systems of communication‟
was perceived as the most important effect on the academic performance of the male
agricultural students (MPS 90.35) and female agricultural students (MPS 87.86) and was
accorded first rank. The „Internet facilitates to retrieve latest information through number of
sources found‟ was perceived as the second most important effect on the academic
performance of the male agricultural students (MPS 89.18) and female agricultural
students (MPS 85.71) and was accorded second rank and third rank, respectively (Fig.
5.3.1).
On the other hand „Due to Internet usage, there is a decrease in actual study-
hours and live discussions with friends‟ was the least perceived effect on the academic
performance of the male agricultural students (MPS 59.06) as well as female agricultural
students (MPS 59.29) and was accorded last rank by both male and female agricultural
students.
The value of rank order correlation (rs) between male and female agricultural
students, was found to be 0.93 for which the calculated value of „t‟ were found higher than
the tabulated value at 1 per cent level of significance which indicates a positive and highly
significant correlation between the effect internet on the academic performance the male
and female agricultural students Hence, the null hypothesis (Ho3.1) was therefore rejected
and alternate hypothesis was accepted. This leads to the conclusion that there is a highly
significant correlation between the effect of internet on the academic performance of the
agricultural students.
5.3.2 Effect of internet use on non academic performance of the agricultural
students
The data presented in table 5.3.2 revealed that among the different non academic
performances the „Internet services facilitate to maintain a wide circle of friends‟ was
perceived as the most important effect on the non-academic performance of the male
agricultural students (MPS 82.59) and female agricultural students (MPS 79.29) and was
accorded first rank. The „Internet use has increased dependency on Internet‟ was
perceived as the second most important effect on the non-academic performance of the
male agricultural students (MPS 64.71) and female agricultural students (MPS 61.43) and
was accorded second and third rank, respectively (Fig. 5.3.2).
On the other hand „Due to Internet use, there is a decrease in participation in the
extra curricular activities at the college/ university level‟ was the least perceived non
academic performance by the male agricultural students (MPS 47.76) as well as by the
female agricultural students (MPS 49.29) and was accorded last rank by both categories
of respondents.
The value of rank order correlation (rs) between male and female agricultural
students, was found to be 0.98 for which the calculated value of „t‟ was found higher than
the tabulated value at 1 per cent level of significance which indicates a positive and highly
significant correlation between male and female agricultural students Hence, the null
hypotheses (Ho3.2) were, therefore rejected and alternate hypotheses were accepted. This
leads to the conclusion that there is a highly significant correlation between the internet
utilizing male and female agricultural students in perceiving the effect of non academic
performances.
From the data presented in table 5.1.1 to 5.3.2 it can be concluded that Majority of the
internet utilizing male and female agricultural students perceived that the “internet services
facilitate improvement in systems of communication” as the most important effect on the
academic performance and the “internet services facilitate to maintain a wide circle of
friends” as the most important effect on the non-academic performance.
The findings are in conformity with the findings of (Richard C. Sharman 1997; Singh
2000; Gagnon and Krovi 2000; Jones 2002 and Chauhan 2004).
5.4 Factors associated with the internet utilization of
agricultural students.
The association between the internet utilization pattern (dependent
variable) of male and female agricultural students and the selected independent
variables of the male and female agricultural students was worked out by
calculating the chi-square between them. On the basis of operational measures
used for the variables, research hypotheses in null form were tested for their
significance of association on the basis of the values of chi-square and co-efficient
of contingency (strength of association), as described below (Fig. 5.4.1 and 5.4.2).
5.4.1 Association of age of internet utilizing male and female agricultural students
with their internet utilization
The study of table 5.4.1.reveals that calculated chi-square value between the age
and internet utilization for male agricultural student was 1.57 and 3.38 for female
agricultural students which were less than their tabulated value at 5 per cent level of
significance. Thus the null hypothesis (Ho4.1) which asserts that there is no significant
association between their age and internet utilization pattern was accepted. Thus reveals
that there is no association between age and internet utilization pattern of the male and
female agricultural students.
The result was not in confirmatory with the result of Patel (2004),
Shah (2006) and Patel (2006).
5.4.2 Association of marital status of internet utilizing male and female agricultural
students with their internet utilization
The study of table 5.4.2 indicates that calculated chi-square value between marital
status and internet utilization for male agricultural student was 5.79 and 2.08 for female
agricultural students which were less than their tabulated value at 5 per cent level of
significance. Thus the null hypothesis (Ho4.2) which asserts that there is no significant
association between their marital status and internet utilization pattern was accepted. Thus
reveals that there is no association between marital status and internet utilization pattern
of the male and female agricultural students.
5.4.3 Association of educational qualification of internet utilizing male and female
agricultural students with their internet utilization
The data incorporated in table 5.4.3 shows that the calculated chi-square value
between educational qualification and internet utilization was 14.62 for male agricultural
student and 14.68 for female agricultural students which were significant at 1 per cent
level of significance. Thus the null hypothesis (Ho4.3) which asserts that there is no
significant association between their educational qualification and internet utilization was
rejected and alternative hypothesis was accepted. Further coefficient of contingency was
worked out in order to see the strength of association and it was found to be 0.3830 for
male and 0.5864 for female agricultural students which can be interpreted that the strength
of relationship between the internet utilization pattern and student‟s educational
qualification variable exerted highly significant effect on internet utilization pattern of
agricultural students.
The result was confirmatory with the result of Jessic et al. (2001),
Patel (2004) and Shah (2006). The result was not in line with the result
reported by Patel (2006).
5.4.4 Association of academic achievement (OGPA) of internet utilizing male and
female agricultural students with their internet utilization
The study of table 5.4.4 indicates that calculated chi-square value between their
academic achievement and internet utilization was 10.80 for male agricultural student and
7.27 for female agricultural students which were less than their tabulated value at 5 per
cent level of significance. Thus the null hypothesis (Ho4.4) which asserts that there is no
significant association between their academic achievement and internet utilization pattern
was accepted. Thus reveals that there is no association between academic achievement
and internet utilization pattern of the male and female agriculture students.
5.4.5 Association of education of father of internet utilizing male and female
agricultural students with their internet utilization
The study of table 5.4.5.shows that calculated chi-square value between their
fathers education and internet utilization was 9.43 for male agricultural student and 8.66
for female agricultural students which were less than their tabulated value at 5 per cent
level of significance. Thus the null hypothesis (Ho4.5) which asserts that there is no
significant association between their fathers education and internet utilization pattern was
accepted. Thus reveals that there is no association between education of father and
internet utilization pattern of the male and female agricultural students.
The result was in line with the result of Chauhan (2004), Patel and Chauhan
(2005) and Chauhan (2005).
5.4.6 Association of education of mother of internet utilizing male and female
agricultural students with their internet utilization
The data incorporate in table 5.4.6 indicates that calculated chi-square value
between their mothers education and internet utilization was 3.26 for male agricultural
student and 8.66 for female agricultural students which were less than their tabulated
value at 5 per cent level of significance. Thus the null hypothesis (Ho4.6) which asserts that
there is no significant association between their mothers education and internet utilization
pattern was accepted. Thus reveals that there is no association between education mother
of and internet utilization pattern of the male and female agricultural students.
The result was in line with the result of Patel (2004) and Patel and Chauhan
(2005).
5.4.7 Association of occupation of father of internet utilizing male and female
agricultural students with their internet utilization
The study of table 5.4.7 reveals that calculated chi-square value between their
fathers occupation and internet utilization was 4.72 for male agricultural student and 1.51
for female agricultural students which were less than their tabulated value at 5 per cent
level of significance. Thus the null hypothesis (Ho4.7) which asserts that there is no
significant association between their fathers occupation and internet utilization pattern was
accepted. Thus reveals that there is no association between occupation of father and
internet utilization pattern of the respondents.
5.4.8 Association of native place of internet utilizing male and female agricultural
students with their internet utilization
The study of table 5.4.8 shows that the calculated chi-square value was 9.71 for
male agricultural student and 9.23 for female agricultural students which were significant
at 1 per cent level of significance. Thus the null hypothesis (Ho4.8) which asserts that there
is no significant association between the native place of internet utilization was rejected
and alternative hypothesis was accepted. Further coefficient of contingency was worked
out in order to see the strength of association and it was found to be 0.3201 for male and
0.4979 for female agricultural students which can be interpreted that the strength of
relationship between the internet utilization pattern and student‟s native place variable
exerted highly significant effect on internet utilization pattern of agricultural students.
The result was not in line with the result of Anonymous
(2001**), Patel and Chauhan (2005), Patel (2004), Chauhan (2004),
Chauhan (2005) Patel (2006) and Shah (2006).
5.4.9 Association of type of family of internet utilizing male and female agricultural
students with their internet utilization
The data incorporate in table 5.4.9 indicates that calculated chi-square value
between their family type and internet utilization was 0.96 for male agricultural student and
0.49 for female agricultural students which were less than their tabulated value at 5 per
cent level of significance. Thus the null hypothesis (Ho4.9) which asserts that there is no
significant association between their family type and internet utilization pattern was
accepted. Thus reveals that there is no association between type of family and internet
utilization pattern of the male and female agriculture students.
The result was in line with the result of Patel and Chauhan (2005) and Chauhan
(2005).
5.4.10 Association of size of family of internet utilizing male and female agricultural
students with their internet utilization
The study of table 5.4.10 reveals that calculated chi-square value between their
size of family and internet utilization was 1.57 for male agricultural student and 1.24 for
female agricultural students which were less than their tabulated value at 5 per cent level
of significance. Thus the null hypothesis (Ho4.10) which asserts that there is no significant
association between their size of family and internet utilization pattern was accepted. Thus
reveals that there is no association between size of family and internet utilization pattern of
the male and female agricultural students.
It means that the research scholars either from small or big size family or say
research scholars either from such family with more number or small number of the
members in family had approximately one and the same degree of encouragement from
their family members to craft hopeful and creative use of Internet.
The result was in line with the result of in line with the result of
Patel and Chauhan (2005) and Patel (2004).
5.4.11 Association of family income of internet utilizing male and female
agricultural students with their internet utilization
The data incorporate in table 5.4.11 indicates that the calculate chi-square
value was 10.62 for male agricultural student and 10.23 for female agricultural students
were significant at 5 per cent level of significance. Thus the null hypothesis (Ho4.11) which
asserts that there is no significant association between their family income and internet
utilization was rejected and alternative hypothesis was accepted. Further coefficient of
contingency was worked out in order to see the strength of association and it was found to
be 0.3333 for male and 0.5173 for female agricultural students which can be interpreted
that the strength of relationship between the internet utilization pattern and student‟s family
income variable exerted highly significant effect on internet utilization pattern of agricultural
students.
5.4.12 Association of medium of instruction during school days of internet utilizing
male and female agricultural students with their internet utilization
Table 5.4.12 depicts that calculated chi-square value between their medium of
instruction and internet utilization was 0.73 for male agricultural student and 3.17 for
female agricultural students which were less than their tabulated value at 5 per cent level
of significance. Thus the null hypothesis (Ho4.12) which asserts that there is no significant
association between their medium of instruction and internet utilization pattern was
accepted. Thus reveals that there is no association between medium of instruction during
school days and internet utilization pattern of the male and female agriculture students.
5.4.13 Association of training being extended by the college library to internet
utilizing male and female agricultural students with their internet utilization
Table 5.4.13 indicates that the calculated chi-square value between training being
extended by the college library and internet utilization was 6.70 for male agricultural
student and 7.35 for female agricultural students were significant at 5 per cent level of
significance. Thus the null hypothesis (Ho) which asserts that there is no significant
association between their training being extended by the college library and internet
utilization was rejected and alternative hypothesis was accepted. Further coefficient of
contingency was worked out in order to see the strength of association and it was found to
be 0.2702 for male and 0.4560 for female agricultural students which can be interpreted
that the strength of relationship between the internet utilization pattern and student‟s
training being extended by the college library variable exerted highly significant effect on
internet utilization pattern of agricultural students
The result reported was in agreement with the result reported
by Veena (2001).
5.4.14 Association of computer course studied to know use of internet by internet
utilizing male and female agricultural students with their internet
utilization
The data incorporate in table 5.4.14 reveals that the calculated chi-square
value between their course to know use of internet and internet utilization was 6.82 for
male agricultural student and 7.32 for female agricultural students were significant at 5 per
cent level of significance. Thus the null hypothesis (Ho4.14) which asserts that there is no
significant association between their course to know use of internet and internet utilization
was rejected and alternative hypothesis was accepted. Further coefficient of contingency
was worked out in order to see the strength of association and it was found to be 0.2726
for male and 0.4553 for female agricultural students which can be interpreted that the
strength of relationship between the internet utilization pattern and students course to
know use of internet variable exerted highly significant effect on internet utilization pattern
of agricultural students.
The result of findings was not in line with the finding reported by Shah (2006).
5.4.15 Association of study of type of computer course studied to know use of
internet by internet utilizing male and female agricultural students with
their internet utilization
Table 5.4.15 shows that the calculated chi-square value between their study of
type of computer course of know use of internet and internet utilization was 17.30 for male
agricultural student and 16.48 for female agricultural students were significant at 5 per
cent level of significance. Thus the null hypothesis (Ho4.15) which asserts that there is no
significant association between their study of course to know use of internet and internet
utilization was rejected and alternative hypothesis was accepted. Further coefficient of
contingency was worked out in order to see the strength of association and it was found to
be 0.4112 for male and 0.6087 for female agricultural students which can be interpreted
that the strength of relationship between the internet utilization pattern and student‟s study
of course to know use of internet variable exerted highly significant effect on internet
utilization pattern of agricultural students.
5.4.16 Association of expertise in navigating web of internet utilizing male and
female agricultural students with their internet utilization
The study of table 5.4.16 reveals that the calculated chi-square value between
their expertise in navigating and internet utilization was 10.46 for male agricultural student
and 10.46 for female agricultural students were significant at 5 per cent level of
significance. Thus the null hypothesis (Ho4.16) which asserts that there is no significant
association between their expertise in navigating web and internet utilization was rejected
and alternative hypothesis was accepted. Further coefficient of contingency was worked
out in order to see the strength of association and it was found to be 0.3309 for male and
0.5215 for female agricultural students which can be interpreted that the strength of
relationship between the internet utilization pattern and student‟s expertise in navigating
web variable exerted highly significant effect on internet utilization pattern of agricultural
students.
5.4.17 Association of place of living at the time of education of internet utilizing
male and female agricultural students with their internet utilization
The data incorporate in table 5.4.17 depicts that the calculated chi-square value
between their place of living and internet utilization was 6.74 for male agricultural student
and 6.00 for female agricultural students which were significant at 5 per cent level of
significance. Thus the null hypothesis (Ho4.17) which asserts that there is no significant
association between their place of living at the time of education and internet utilization
was rejected and alternative hypothesis was accepted. Further coefficient of contingency
was worked out in order to see the strength of association and it was found to be 0.2710
for male and 0.4202 for female agricultural students which can be interpreted that the
strength of relationship between the internet utilization pattern and student‟s place of living
at the time of education variable exerted highly significant effect on internet utilization
pattern of agricultural students.
The result reported was in agreement with the result reported
by Veena (2001).
5.4.18 Association of wish to migrate abroad of internet utilizing male and female
agricultural students with their internet utilization
Table 5.4.18 indicates that the calculated chi-square value between their wish
to migrate abroad and internet utilization was 14.44 for male agricultural student and 10.81
for female agricultural students which were significant at 1 and 5 per cent level of
significance. Thus the null hypothesis (Ho4.18) which asserts that there is no significant
association between their wish to migrate abroad and internet utilization was rejected and
alternative hypothesis was accepted. Further coefficient of contingency was worked out in
order to see the strength of association and it was found to be 0.3810 for male and 0.5277
for female agricultural students which can be interpreted that the strength of relationship
between the internet utilization pattern and students wish to migrate abroad variable
exerted highly significant effect on internet utilization pattern of agricultural students.
The result was not in line with the result of Chauhan (2004) and
Patel and Chauhan (2005).
5.4.19 : Association of wish to get higher academic degree of internet utilizing male
and female agricultural students with their internet utilization
Table 5.4.19 depicts that calculated chi-square value between their wish to get
higher academic degree and internet utilization was 3.46 for male agricultural student and
1.50 for female agricultural students which were less than their tabulated value at 5 per
cent level of significance. Thus the null hypothesis (Ho4.19) which asserts that there is no
significant association between their wish to get higher academic degree and internet
utilization pattern was accepted. Thus reveals that there is no association between wish to
get higher academic degree and internet utilization pattern of the male and female
agriculture students.
The result reported was in agreement with the result reported
by Patel (2004) Chauhan (2004), Chauhan (2005) and Shah (2006).
5.5 Constraints faced in Internet utilization by Agricultural
Students
In this section, it was tried to find out the constraints in
utilization of internet by the agricultural students in the study
area. All the possible constraints, faced by the respondents were
grouped in to five major categories viz. Physical constraints,
Technical constraints, Economic constraints, Operational
constraints and Psychological constraints and the data regarding
the constraints faced by internet utilizing male and female
agricultural students has been presented into following sub
heads.
5.5.1 Physical constraints faced in Internet utilization by Agricultural Students
5.5.2 Technical constraints faced in Internet utilization by Agricultural Students
5.5.3 Economic constraints faced in Internet utilization by Agricultural Students
5.5.4 Operational constraints faced in Internet utilization by Agricultural Students
5.5.5 Psychological Constraints faced in Internet utilization by Agricultural Students
5.5.1 Physical constraints faced in Internet utilization by Agricultural Students
The data presented in table 5.5.1 revealed that among the different physical
constraints the „Inadequate availability of computer and Internet facilities‟ was perceived
as the most severe constraint at top priority by the male agricultural students (MPS 76.86)
and was accorded first rank. Whereas the female agricultural students (MPS 77.38) were
perceived it as the third most severe constraint and accorded it third rank. The „Lack of
adequate infrastructure facilities‟ was perceived as the most severe constraint by the
female agricultural students (MPS 83.33) and was accorded first rank, whereas it was
perceived as the second most severe constraint by the male agricultural students (MPS
70.59).
On the other hand the „Lack of knowledge about
availability of Internet source‟ was the least perceived physical
constraint by the male agricultural students (MPS 61.18) as well
as by the female agricultural students (MPS 67.86) and was
assigned last rank.
The value of rank order correlation (rs) between male and
female agricultural students, was found to be 0.97 for which the
calculated value of „t‟ was found higher than the tabulated value
at 5 per cent level of significance which indicates a positive and
highly significant correlation between male and female
agricultural students Hence, the null hypothesis (Ho5.1) was
therefore rejected and alternate hypothesis was accepted. This
leads to the conclusion that there is a highly significant
correlation agreement between the internet utilizing male and
female agricultural students in perceiving the severity of different
physical constraints (Fig. 5.5.1).
The constraint of inadequate availability of computer and
internet facility might be due to the reason that the agriculture
college has no sufficient number of computers according to the
students strengths and thus the agricultural students face
difficulty in access to the internet. The constraint of Lack of
adequate infrastructure facilities might be due to the reason that
the agriculture colleges had in sufficient sitting arrangement and
few computers reserved for girls and thus the students had less
access to the internet. The constraint of inadequate accessibility
to internet service might be due to lack of the different
infrastructural facility and due to the technical problems.
The reason behind the constraint Lack of knowledge
about availability of internet source might be due to lack of
awareness among the students about the availability of internet
source.
5.5.2 Technical constraints faced in Internet utilization by Agricultural Students
The data presented in table 5.5.2 indicated that among the different technical
constraints the „Slow access speed‟ was perceived as the most severe constraint at top
priority by both the male agricultural students (MPS 74.51) and female agricultural
students (MPS 86.90) and was accorded first rank. The constraints „Takes more time to
download/ view pages‟ was perceived as the second most severe constraint by the male
agricultural students (MPS 65.49) and was accorded second rank, whereas it was
perceived as the third most severe constraint by the female agricultural students (MPS
66.67).
On the other hand the „Privacy problem‟ was the least perceived technical
constraint by the male agricultural students (MPS 41.96) as well as by the female
agricultural students (MPS 42.86) and was assigned last rank.
The value of rank order correlation (rs) between male and
female agricultural students, was found to be 0.94 for which the
calculated value of „t‟ was found higher than the tabulated value
at 1 per cent level of significance which indicates a positive and
highly significant correlation between male and female
agricultural students Hence, the null hypothesis (Ho5.2) was
therefore rejected and alternate hypothesis was accepted. This
leads to the conclusion that there is a highly significant
agreement between the internet utilizing male and female
agricultural students in perceiving the severity of different
technical constraints (Fig. 5.5.2).
The constraint of slow access speed might be due to lack
of adequate internet connection and frequency. The constraint of
taking more time to download / view page might be due to the
slow speed of internet. The reason behind constraint of virus
threats might be due to lack of technical staff and availability of
adequate anti virus softwares. The constraint of Electricity failure
might be due to lack of availability of generator and battery
system in college library and departments. The constraints of
opening of Pop-up mails and Online advertisements distract
attention might be due to lack of adequate knowledge about
blocked the pop-up mails and lack of training as how to use the
internet among the students. The constraint of Server break
down might be due lack of suitable channel of connection,
overloading of information on server and lack of receiving the
frequency.
The reason behind the constraint of Privacy problem
might be due to lack of knowledge about use the internet
because recently, some websites allow users to stuff off targeted
advertising on its web sites.
5.5.3 Economic constraints faced in Internet utilization by Agricultural Students
The data presented in table 5.5.3 revealed that among the different economic
constraints the „Variations in charges demanded at different cyber cafes‟ was perceived as
the most severe constraint at top priority by the male agricultural students (MPS 52.16)
and was accorded first rank. Whereas the female agricultural students (MPS 48.81)
perceived it as the second most severe constraint and accorded it second rank. The
„Availability of Internet facility at higher price‟ was perceived as the most severe constraint
by the female agricultural students (MPS 57.14) and was accorded first rank, whereas it
was perceived as the second most severe constraint by the male agricultural students
(MPS 49.41).
On the other hand the „High cost of Internet training‟ was the least perceived
economics constraints by the male agricultural students (MPS 47.06) as well as by the
female agricultural students (MPS 44.05) and was accorded last rank.
The value of rank order correlation (rs) between male and
female agricultural students, was calculated and tested. The
calculated value of „t‟ was found less than the tabulated value
hence the null hypothesis (Ho5.3) was accepted which leads to
the conclusion that there is no significant agreement between
the internet utilizing male and female agricultural students in
perceiving the severity of different economical constraints. Thus
there is no correlation between male and female agricultural
students (Fig. 5.5.3).
The constraints of Variation in charges at different cyber
cafes and Availability of internet facility at higher price might be
due to the reason that the cyber cafes had variation in charges
of internet facility according to its location and number of
customers. In rural and semi-urban areas cyber cafes had high
price of internet facility.
The reason behind the constraint of High cost of
internet training might be due to the lack of internet training
provided by the colleges to the students and the computer
training institutes had not provided a particular course of internet
training.
5.5.4 Operational constraints faced in Internet utilization by Agricultural Students
The data presented in table 5.5.4 indicated that among the different operational
constraints the „Lack of Internet oriented education and training‟ was perceived as the
most severe constraint at top priority by the male agricultural students (MPS 75.69) and
female agricultural students (MPS 72.62) was accorded first rank. The „Lack of adequate
knowledge about hard wares, softwares and Internet explorer‟ was perceived as the
second most severe constraint by the male agricultural students (MPS 59.22) and female
agricultural students (MPS 60.71) and was accorded second rank.
On the other hand the „Overload of information on Internet‟ was the least
perceived operational constraint by the male agricultural students (MPS 41.96) as well as
by the female agricultural students (MPS 41.67) and was accorded last rank.
The value of rank order correlation (rs) between male and
female agricultural students, was found to be 0.98 for which the
calculated value of „t‟ was found higher than the tabulated value
at 1 per cent level of significance which indicates a positive and
highly significant correlation between male and female
agricultural students Hence, the null hypothesis (Ho5.4) were,
therefore rejected and alternate hypothesis were accepted. This
leads to the conclusion that there is a highly significant
agreement between the internet utilizing male and female
agricultural students in perceiving the severity of different
operational constraints (Fig. 5.5.4).
The constraints of Lack of internet oriented education and
training and lack of adequate knowledge about hardware
software‟s and internet explorer might be due to the reason that
the computer training centers and institutes had not provided the
particular course of internet and half of the total agricultural
students did not study of any course to know the use of internet.
The constraint of Difficulty in finding out relevant information
might be due to lack of adequate knowledge about the exact key
words related to the information and research study. The
constraint of Lack of knowledge about paid and un-paid sites
might be due to lack of knowledge about the use of internet
which might be due to the lack of internet oriented courses.
The reason behind the constraint of Overload of
information on internet might be due to the reason that recently,
internet had provided every information to the peoples and thus
the web sites had a problem of overloading.
5.5.5 Psychological Constraints faced in Internet utilization by Agricultural
Students
The data presented in table 5.5.5 indicated that among the different psychological
constraints the „Lack of free time to use Internet‟ was perceived as the most severe
constraint at top priority by the male agricultural students (MPS 43.92) and female
agricultural students (MPS 44.50) was accorded first rank. The „Lack of interest to use
Internet‟ was perceived as the second most severe constraint by the female agricultural
students (MPS 42.86) and was accorded second rank, whereas it was perceived as the
third most severe constraint by the male agricultural students (MPS 37.65). The
„Unfavorable attitude of seniors and family members‟ was perceived as the third most
severe constraint by the female agricultural students (MPS 35.71) and was accorded third
rank, whereas it was perceived as the second most severe constraint by the male
agricultural students (MPS 43.14) and was accorded second rank.
The value of rank order correlation (rs) between male and
female agricultural students was calculated and tested. The
calculated value of „t‟ was found less than the tabulated value
hence the null hypothesis (Ho5.5) which leads to the conclusion
that there is a non significant agreement between the internet
utilizing male and female agricultural students in perceiving the
severity of different psychological constraints. Thus there is no
correlation between male and female agricultural students (Fig.
5.5.5).
The constraint of Lack of free time to use internet might be
de to the reason that the agricultural students had spent
maximum time in attending their classes and research work and
they had less time to use the internet. The constraint of
Unfavourable attitude of seniors and family members might be
due to the lack of sufficient number of computers in college
library and department and thus the seniors had not provided
the chance to their junior students to use the internet.
The reason behind the constraint of Lack of interest
might be due to lack of awareness among the students about
the internet.
6 SUMMARY AND CONCLUSIONS
"The internet is a global system of public and private computer
networks that allow desktop computer to exchange data. Messages and
files with any of the millions of other computer with connections to the
internet". The internet is an existing area where you can find information
about almost every topic you have books, encyclopedias, magazines,
articles and every other type of reference material at your fingertips.
The internet offers many options for computer users to communicate
with others like chat, mail, telephone, browse special field for references
and so on. The imperative necessity is to mount intense national as well as
international efforts in the interest of achieving a bright common future by
using the internet technology for all humanity on our planet. So, for this
purpose there is a need to develop human resources.
In India, the internet services were officially made available to public
from 15th August 1995 onwards through Videsh Sancher Nigam limited
(VSNL). Today there are many service providers offering internet services.
The most common use of internet is electronic mail (e-mail). By
using e-mail a user can send text, pictures, sounds, programmes or even
movies to any other person anywhere in the world. There are a number of
news group on the internet. The messages sent to a news group are simply
posted on the electronic notice board. Anyone can see these messages.
According to India broadband forum upto 31st March (2008), the
number of Internet users in Asia is 5,29,701,704. Though Asia has only
16% of populations of the world, 37.6% of total internet users are Asian
which is great. Of them around 60 million are from India. India is 3rd in Asia
(1st is China (220 million) and 2nd is Japan (87.5 million)) and 4th in world
((1st is China (220 million), 2nd is USA (216 million) and 3rd is Japan (87.5
million)) as per as internet users are concerned. India has 13% of internet
users in Asia and 7.36% that of the world. But the sorrowful fact is only
5.3% of people in India use internet. The reason of this is most of the
people in India don‟t know computer. 70% of people who know computer
have used internet which is a healthy sign.
Today, Agricultural colleges are playing an important role in
imparting technical education. The Agriculturist, who are the outcomes of
these colleges, require the latest and pinpointed information in their
respective fields. Due to the high cost of Agricultural information resources,
developing countries cannot provide these resources to their users. But the
Internet with its advantages, make the way for the developing countries to
access information at a very low cost.
The Internet is an inseparable part of today‟s Agricultural
educational system. Agricultural colleges invest a good deal of amount on
providing this facility to both the teachers and students. Despite the young
age of the Internet, it has grown at an extremely rapid pace due largely to
how easily accessible it has become to users. Each day, something new
emerges via the Internet, whether it be a game, a user-created video, or a
piece of music that is shared with the world.
Keeping all these facts in mind the present investigation “Internet
Utilization Behaviour of Agricultural Students of Swami Keshwanand
Rajasthan Agricultural University, Bikaner”. was undertaken with following
specific objectives:
(vi) To study the personal and family characteristics of the
respondents.
(vii) To analyze the internet utilization pattern of the agricultural
students.
(viii) To find out the effect of internet utilization on over all
performance of the agricultural students.
(ix) To study the factors associated with the internet utilization of
agricultural students.
(x) To identify the constraints faced in internet utilization by the
agricultural students.
The present study was conducted in Rajasthan Agricultural
University, Bikaner, which was purposively selected due to the reasons
that SKRAU, Bikaner is only the sole agricultural university in Rajasthan
which has maximum number of agricultural colleges (3) as compared to
another Agricultural University i.e. Maharana Pratap University of
Agricultural and Technology (MPUAT), Udaipur. SKRAU, Bikaner is the
University which provides admission to more number of agricultural
Students in an academic session as compared to other Agricultural
Universities in Rajasthan. Swami Keshwanand Rajasthan Agricultural
University, Bikaner has three constituent Colleges, i.e SKNCOA, Jobner,
COA, Bikaner and COA, Lalsot; out of which two agricultural colleges namely
SKNCOA, Jobner and COA, Bikaner was selected purposively due to the
reason that all the students of these colleges have been provided internet
facility at free of cost for UG students in college library and for PG and Ph.D.
students in their concerned departments. From the two selected agricultural
colleges separate lists of male and female students from B.Sc. (Ag.) Hons,
M.Sc. (Ag.) Hons. and Ph.D. degree, registered in 2008-09 and using the
internet were prepared with the help of records of student sections and
internet cell registers of the respective colleges and a sample of 25 per
cent male and female students from B.Sc. (Ag.) Hons, M.Sc. (Ag.) Hons.
and Ph.D. degree, was selected by using simple random sampling with
proportionate allocation method. In this way a total sample comprised of
113 students (85 male and 28 female students) from B.Sc (Ag.) Hons.,
M.Sc. (Ag.) Hons. and Ph.D. degrees were selected for the present
investigation.
An interview schedule consisting the measuring devices of
dependent and independent variables along with the face data of the
internet utilizing agricultural students was used for collecting responses of
the internet utilizers. For measuring the personal and family characteristics,
internet utilization pattern, effect of internet utilization on over all
performance and constraints faced by the agricultural students a schedule
was developed by the investigator in light of the suggestion of the experts.
The data were collected by personal interview method. The data
collected were classified, tabulated and inferences were drawn after
subjecting the data to appropriate statistical analysis which led to the
following major findings.
SALIENT FINDINGS
6.1 Personal and family characteristics of the respondents
6.1.1 Majority of the internet utilizing agricultural students (75.22%) were
male, whereas the female comprised of only 24.78 per cent of the
total respondents.
6.1.2 Majority of the internet utilizing students in both male agricultural
students (50.58 per cent) and female agricultural students (35.71 per
cent) fell in 20 – 25 years age group.
6.1.3 Majority of the internet utilizing male agricultural students (56.47 per
cent) were unmarried and 43.53 percent of the respondents were
married. In case of female agricultural students 57.14 per cent were
found married and 42.86 per cent were unmarried.
6.1.4 Majority of the internet utilizing students in both male agricultural
students (55.29 per cent) and female agricultural students (60.71 per
cent) were studying in B. Sc. Degree programme.
6.1.5 Majority of the internet utilizing male agricultural students (61.18 per
cent) and female agricultural students (42.85 per cent) had obtained
OGPA 5.01 – 6.49 OGPA in last semester.
6.1.6 Fathers of majority of the internet utilizing male agricultural students
(47.06 per cent) and female agricultural students (46.43 per cent)
had above senior secondary and below graduation level of
education.
6.1.7 Mothers of majority of the internet utilizing male agricultural students
(40.00 per cent) and female agricultural students (25.00 per cent)
had above senior secondary and below graduation level of
education.
6.1.8 Fathers of majority of the internet utilizing male agricultural students
(64.70 per cent) and female agricultural students (60. 71 per cent)
were having agricultural occupation.
6.1.9 Majority of the internet utilizing male agricultural students (69.41 per
cent) and female agricultural students (60.71 per cent) were from
rural back ground.
6.1.10 Majority of the internet utilizing male agricultural students (64.71 per
cent) and female agricultural students (71.43 per cent) were
belonged to joint family.
6.1.11 Majority of the internet utilizing male agricultural students (58.82 per
cent) and female agricultural students (53.57 per cent) belonged to
big family.
6.1.12 Majority of the internet utilizing male agricultural students‟ (44.71 per
cent) had family income, ranging between 10001 to 25000 per
month whereas majority of the female agricultural students‟ (35.72
per cent) had family income ranging between upto Rs 10000.
6.1.13 Majority of the internet utilizing male agricultural students (81.18 per
cent) and female agricultural students (75.00 per cent) had Hindi
medium of instructions.
6.1.14 Majority of the internet utilizing male agricultural students (60.00 per
cent) participated in debate / lecturing activities while; majority of
female agricultural students (67.86 per cent) participated in cultural
activities.
6.1.15 Majority of the internet utilizing male agricultural students (82.35 per
cent) and female agricultural students (78.57 per cent) did not get
any training to use internet.
6.1.16 Majority of the internet utilizing male agricultural students (54.12 per
cent) had not studied any course to know the use of internet while;
majority of female agricultural students (53.57 per cent) studied
course to know the use of internet.
6.1.17 About 22.35 per cent internet utilizing male agricultural students and
24.78 per cent of female agricultural students studied basic Basic +
Tally computer course.
6.1.18 Majority of the internet utilizing male agricultural students (56.47 per
cent) and female agricultural students (46.43 per cent) were
intermediate in navigating the web.
6.1.19 Majority of the internet utilizing male agricultural students (88.24 per
cent) and female agricultural students (82.14 per cent) belonged to
hosteller category.
6.1.20 Majority of the internet utilizing male agricultural students (62.35 per
cent) had desire to go abroad for settling whereas majority of the
female agricultural students (46.43 per cent) had no desire to go
abroad.
6.1.21 Majority of the internet utilizing male agricultural students (71.76 per
cent) and female agricultural students (64.29 per cent) had wish to
have their next higher academic degree.
6.1.22 Majority of the internet utilizing male agriculture students (68.24%)
and female agricultural students (60.72%) were utilized library every
day.
6.1.23 Majority of the internet utilizing male agricultural students (61.18 per
cent) had wish to serve in banking, whereas; majority of the female
agricultural students (67.86 per cent) had wish to serve in
government agricultural sector.
6.2 internet utilization pattern of the agricultural students
6.2.1 Majority of internet utilizing male agriculture students (71.76%) and
female agriculture students (53.57%) had more than two years
experience of internet use age group.
6.2.2 Majority of the internet utilizing male agriculture students (MPS
70.59) and female agriculture students (MPS 66.07) preferred
college library for internet use.
6.2.3 Majority of internet utilizing male agriculture students (38.83%) and
female agriculture students (75.71%) fell in the category of Rs. 50 to
100 per month expenditure incurred to use internet.
6.2.4 Majority of internet utilizing male agriculture students (51.76%) and
(53.57%) female agriculture students had used internet facility every
day.
6.2.5 Majority of the internet utilizing male (MPS 87.65) and female (MPS
83.93) agricultural students preferred the best purpose of internet
use as “e-mail to friends and relatives”.
6.2.6 About 40.00 per cent internet utilizing male agriculture students were
having more than two E-mail ID, while; 38.94 per cent female
agriculture students were having two E-mail ID.
6.2.7 Majority of internet utilizing male agriculture students (42.35%) and
female agriculture students (42.86%) were utilizing e-mail facility
every day.
6.2.8 Majority of the internet utilizing male agriculture students (49.41%)
and female agriculture students (46.43%) used e-mail for personal
purpose.
6.2.9 Majority of internet utilizing male agriculture students (64.71%) used
chatting to make communication, whereas; majority of female
agriculture students (53.57%) not used chatting to make
communication.
6.2.10 about 25.88 per cent internet utilizing male agriculture students and
17.86 per cent female agriculture students were utilizing chatting
facility once in a week.
6.2.11 Majority of the internet utilizing male agricultural students (MPS
91.18) and female agricultural students (MPS 91.07) used google as
search engine.
6.2.12 Majority of internet utilizing male agriculture students (60.00%) and
female agriculture students (64.29%) considered internet as the
excellent source of information.
6.2.13 Majority of the internet utilizing male agriculture students (60.00%)
and female agriculture students (46.43%) were fully satisfied with
internet facility.
6.2.14 Majority of the internet utilizing male agriculture students (MPS
92.94) and female agriculture students (MPS 85.71) preferred
“internet” on other media for getting information.
6.2.15 Majority of the internet utilizing male agriculture students (MPS
27.06) and female agriculture students (MPS 87.50) browse the
required information from the internet through using search engines.
6.2.16 Majority of the internet utilizing male agriculture students (64.70%)
and female agriculture student (53.57%) were frequently locating the
desired information on the internet.
6.2.17 Majority of the internet utilizing male agriculture students (70.59%)
and female agriculture students (57.14%) were writing useful
information on separate pages during internet use.
6.2.18 Majority of the internet utilizing male agricultural students (76.47 %)
and female agricultural students (71.43 %) preferred college library
to use internet in noon.
6.2.19 Majority of the internet utilizing male agriculture students 57.65 per
cent and female agriculture students 50.00 per cent got orientation
towards internet use through self surfing around the net.
6.2.20 Majority of the internet utilizing male (68.24 per cent) and female
(75.00 per cent) agricultural students had medium level of internet
utilization where as 17.65 per cent male and 14.29 per cent female
agricultural students had low internet utilization and only 14.12 per
cent male and 10.71 per cent female agricultural students had high
level of internet utilization.
6.3 Effect of internet utilization on over all performance of the
agricultural students
6.3.1 Among the different academic performances the „Internet services
facilitate improvement in systems of communication‟ was perceived
as the most important effect on the academic performance at top
priority by both male (MPS 90.35) and female agricultural students
(MPS 87.86).
There is a highly significant correlation between the internet utilizing
male and female agricultural students in perceiving the effect of
academic performances.
6.3.2 Among the different non academic performances the „Internet
services facilitate to maintain a wide circle of friends‟ was perceived
as the most important effect non-academic performance at top
priority by both male (MPS 82.59) and female agricultural students
(MPS 79.29).
There is a highly significant correlation between the internet utilizing
male and female agricultural students in perceiving the effect of non
academic performances.
6.4 Factors associated with the internet utilization of
agricultural students.
6.4.1 There was a significant association between the internet utilization
level of the male and female agricultural students. Educational
qualification, native place, family income, training being extended by
the college library, course offered to know use of internet, course
studied, expertise in navigating web, place of living at the time of
education and wish to migrate abroad.
6.4.2 Personal and family characteristics of the respondents like age,
marital status, academic achievement, education of father,
education of mother, occupation of father, type of family, size of
family, medium of instruction during school days and wish to get
higher academic degree were found non associated with internet
utilization level of the male and female agricultural students.
6.5 Constraints faced in Internet utilization by Agricultural
Students
6.5.1 Among the different physical constraints the „Inadequate availability
of computer and Internet facilities‟ was perceived as the most severe
constraint at top priority by the male agricultural students (MPS
76.86). Whereas; the „Lack of adequate infrastructure facilities‟ was
perceived as the most severe constraint by the female agricultural
students (MPS 83.33). There is a highly significant correlation
between the internet utilizing male and female agricultural students
in perceiving the severity of different physical constraints.
6.5.2 Among the different technical constraints the „Slow access speed‟
was perceived as the most severe constraint at top priority by both
the male agricultural students (MPS 74.51) and female agricultural
students (MPS 86.90). There is a highly significant correlation
between the internet utilizing male and female agricultural students
in perceiving the severity of different technical constraints.
6.5.3 Among the different economic constraints the „Variations in charges
demanded at different cyber cafes‟ was perceived as the most
severe constraint at top priority by the male agricultural students
(MPS 52.16), while; the „Availability of Internet facility at higher price‟
was perceived as the most severe constraint by the female
agricultural students (MPS 57.14). There is a non significant
correlation between the internet utilizing male and female
agricultural students in perceiving the severity of different economics
constraints. Thus there is no correlation between male and female
agricultural students.
6.5.4 Among the different operational constraints the „Lack of Internet
oriented education and training‟ was perceived as the most severe
constraint at top priority by both male agricultural students (MPS
75.69) and female agricultural students (MPS 72.62). There is a
highly significant correlation between the internet utilizing male and
female agricultural students in perceiving the severity of different
operational constraints.
6.5.5 Among the different psychological constraints the „Lack of free time
to use Internet‟ was perceived as the most severe constraint at top
priority by both male agricultural students (MPS 43.92) and female
agricultural students (MPS 44.50). There is a non significant
correlation between the internet utilizing male and female
agricultural students in perceiving the severity of different
psychological constraints. Thus there is no correlation between male
and female agricultural students.
Conclusion
1. Majority of the internet utilizing agricultural students were male, were
aged between 20 to 25 years, were studying in B.Sc. degree
programme, had obtained OGPA in last semester in category 5.00-
6.49 OGPA, had father‟s and mother‟s education above senior
secondary and below graduation level, were having occupation of
agriculture of their father‟s, were from rural back ground, were
belonged to joint family, were belonged to big family, had hindi
medium of instructions, did not get any training as how to use
internet, studied basic + tally course of computer, perceived
themselves as intermediate in navigating the web, belonged to
hestller category, had wish to have their next higher academic
degree, were utilized library every day upto one hour. Majority of
male agricultural students were unmarried whereas majority of
female agricultural students were married, male agricultural
student‟s family income per month ranged between rupees 10001 to
25000 had family income upto rupees 10000 per month, participated
in debate/ lecturing participated in cultural activities, did not study
any course to know use of internet studied course to know use of
internet, had desire to go abroad for settling and had no desire to go
abroad, male students had wish to serve in banking and wish to
serve in government agricultural sector.
2. Majority of the internet utilizing male and female agricultural students
were using internet from more than two years, mostly preferred
college library, had spent Rs. 50 to 100 per month to use internet,
used internet facility every day, considered the best purpose of
internet use as “e-mail to friends and relatives”, having more than
two e-mails ID, were utilizing e-mail every day upto two to three e-
mails, preferred to do the e-mail use for personal use, were utilizing
chatting facility once in a week upto one hour, used google as
search engine, rated internet as an excellent source of information,
were fully satisfied with internet facility, preferred “internet” on other
media for getting information, browse the required information from
the internet through using search engines, getting the information on
the internet frequently, were writing useful information on separate
pages during internet use, preferred college library in noon to access
the internet, got orientation towards internet use through self surfing
around the net and had medium level of internet utilization. Majority
of the male agricultural students used chatting to make
communication whereas the female agricultural students not used
chatting to make communication.
3. Majority of the internet utilizing male and female agricultural students
perceived that the “internet services facilitate improvement in
systems of communication” as the most important effect on the
academic performance and the “internet services facilitate to
maintain a wide circle of friends” as the most important effect on the
non-academic performance.
4. There was a significant association between the internet utilization
level of the male and female agricultural students and their
educational qualification, native place, family income, training being
extended by the college library, course offered to know use of
internet, course studied, expertise in navigating web, place of living
at the time of education and wish to migrate abroad.
5. Majority of the internet utilizing male agricultural students perceived
the constraints about “inadequate availability of computer and
internet facilities”, “lack of adequate infrastructure facilities”, “slow
access speed”, “variation in charges demanded at different cyber
cafes”, “availability of internet facility at higher price”, “lack of internet
oriented education and training” and “lack of free time to use
internet”.
Recommendation
1. It is evident from the present study that only moderate level of
internet utilization pattern prevailed among respondents. Hence
efforts should be made to improve their internet utilization level
by improving good internet facility in the college and by
motivating students for academic and scholastic uses of internet.
2. Since majority of the internet utilizing students felt the problem of
“inadequate availability of computer and internet facility” so
efforts should be made to increase the number of computers in
college library.
3. Since, majority of the internet utilizing students felt the problem of
“slow access speed”, so efforts should be made for providing
adequate connection of the internet.
4. Since, majority of the internet utilizing students felt the problem of
“lack of internet oriented education and training” so efforts should
be made to provide training related to internet orientation. There
should be provision of appropriate training for agricultural
students on educational use of internet.
5. The students should be motivated for computer education and
proper use of internet.
6. Since majority of the internet utilizing students felt the problem of
“inadequate availability of computer and internet facilities” so
adequate infrastructure facility should be provided by college
library.
7. Since majority of the internet utilizing students felt the problem of
“takes more time to download / view pages” so more computers
with latest specifications and multimedia kit should be installed in
college library.
8. Since majority of the internet utilizing students felt the problem of
“lack of adequate knowledge about hardwires, software‟s and
internet explorer” so technical assistant should be appointed in
the internet section of the colleges.
Suggestions for future research
The present investigation was confined to a particular institution i.e.
SKRAU, Bikaner. The study needs to be replicated on large samples
covering large area, so that the inferences drawn can be generalized to a
greater extent and explore various theoretical explanations. One can study
comparative analysis of SKRAU, Bikaner and MPUAT, Udaipur regarding
internet utilization pattern, among students or among teachers. A study of
internet utilization behaviour of the farmers may prove worthwhile. Another
study could be devoted towards the content analysis of information
pertaining to agriculture and allied fields, available on the internet.
Internet Utilization Behaviour of Agricultural Students of Swami Keshwanand Rajasthan Agricultural University, Bikaner
Suresh Garhwal* Dr. Ishaq Mohammed Khan
**
(Research Scholar) (Major Advisor)
ABSTRACT
Internet as a substantial communication tool is
characterized by information, versatility and interactivity. Use of
internet has become a part of college students daily routine.
Considering the importance of the internet utilization the present
investigation “Internet Utilization Behaviour of Agricultural
Students of Swami Keshwanand Rajasthan Agricultural
University, Bikaner”. was undertaken with following specific
objectives:
(xi) To study the personal and family characteristics of the respondents.
(xii) To analyze the internet utilization pattern of the agricultural students.
(xiii) To find out the effect of internet utilization on over all performance of the
agricultural students.
(xiv) To study the factors associated with the internet utilization of agricultural
students.
(xv) To identify the constraints faced in internet utilization by the agricultural
students.
The present study was undertaken in the purposively selected
two agricultural colleges namely SKNCOA, Jobner and COA,
* Post Graduate Student, Department of Extension Education SKN COA, Jobner
(Raj.).
** Assistant Professor, Department of Extension Education, S.K.N. College of
Agriculture, Jobner (Rajasthan).
Bikaner due to the reason that all the UG and PG students of
these colleges have been provided internet facility at free of cost.
From the two selected agricultural colleges a total sample
comprised of 113 agricultural students (85 male and 28 female
students) from B.Sc (Ag.) Hons., M.Sc. (Ag.) Hons. and Ph.D.
degrees were selected proportionately by using simple random
sampling. An interview schedule consisting the measuring
devices of dependent and independent variables along with the
face data of the internet utilizing agricultural students was used
for collecting responses of the internet utilizers.
The data were collected by personal interview method. The
data collected were classified, tabulated and inferences were
drawn after subjecting the data to appropriate statistical analysis
which led to the following major findings.
1. The present study revealed that majority of the internet
utilizing male and female agricultural students were in the
middle age group, having medium level of fathers and
mothers education, having agriculture as a occupation of
father, having joint and big family and were having rural
background. Majority of the respondents perceived
themselves as intermediate in navigating the web, were
hosteller, willing to have their next higher academic degree
and used the library every day.
2. The result clearly indicated that the majority of the internet
utilizing male and female agricultural students were having
more than two years experience of internet use, mostly
preferred college library, low expenditure incurred to use
internet, had used internet facility every day, utilizing e-mail
facility every day, used e-mail for personal use, mostly used
google as search engine, considered internet as excellent
source of information, preferred “internet” on other media for
getting information, browse the required information from the
internet through using search engines, were frequently
locating the desired information on the internet, preferred
college library in noon, got orientation towards internet use
through self surfing around the net and were belonged to
medium level of internet utilization.
3. It was observed that the “Internet services facilitate
improvement in systems of communication” was perceived as
the most important effect on the academic performance and
the “Internet services facilitate to maintain a wide circle of
friends” was perceived as the most important effect on the
non-academic performance of the male and female
agricultural students.
4. There was a significant association between the internet
utilization pattern of the male and female agricultural students
and their educational qualification, native place, family
income, training being extended by the college library, course
offered to know use of internet, course studied, expertise in
navigating web, place of living at the time of education and
wish to migrate abroad.
5. Majority of the internet utilizing agricultural students faced
serious constraints about “inadequate availability of computer
and internet facilities”, “lack of adequate infrastructure
facilities”, “slow access speed”, “variation in charges
demanded at different cyber cafes”, “availability of internet
facility at higher price”, “lack of internet oriented education
and training” and “lack of free time to use internet”.
Based on the study, it is recommended that for improving
the internet utilization behaviour and over all performance of the
male and female agricultural students, the factors having
significant agreement in male and female agricultural students
should be taken care of and the constraints faced by the internet
utilizing students should be solved by the administrators,
planners and policy makers of academic institutions in future by
formulating effective strategies on exploitation of internet
services.
BIBLIOGRAPHY
Agarwala, Kamlesh, N., Lal, Amit and Agarwala, Deeksha (2000). "Business on the net-
An introduction to the what's and how of e-commerce". Machillan India
Limited pp. 1-5.
Agnihotri, P. (2001). "Net access- cheaper, not better, Log in... Tribute". The Tribune
October, 22, pp. 1-4.
Agnihotri, P. (2001). Net access-cheaper, not better, Log in … Tribute, The
Tribune, October, 22.-1-4.
Ahmed, A. M., Yousif, E. and Abdalla, M. E. (2008). "Use of the Internet by Sudanese
doctors and medical students. Eastern Mediterranean Health Journal, 14(1):
134-141.
Ahn-Yun and Kim-KyungWon (2007). "Study on utilization status of internet and needs
assessment for developing nutrition education programs among elementary
school children". Nutrition Research and Practice. 1(4): 341-348
Ali, A. and Aziz, A. E. (2004). Examining student performance and attitudes
towards the use of information technology in a virtual and
conventional setting. J. of Interactive Online Learning,. 2, Nov.
3, ISSN: 1541-4914 net.
Anderson, K.J. (2000). Internet use among college students: An exploratory
study.
Available:http://www.gseis.ucla.edn/heri/test/executive.htm.
Andrew, T. 2002. Internet access has no impact on test scores, study says.
Available : http://Isc-net.tere.edu/do.cfm/paper/
8509/show/useset-techint.
Anonymous (2000). What do users do on the Internet?
http://www.stanford.edu /group/siqss/Press Release/press
detail.html.
Anonymous (2001*) INSTANMESSAGING http:// www.realtor.org
/webintell.nsf/0/9d9b6f0d9a364b7886256aa900510d4d? Open
Document
Anonymous (2001). Computer and internet use, http://www.ntia. doc. gov/
ntia home /dn /html/Chapter2.htm#_ftn2.
Anonymous (2002). Use of information technology in agriculture, http://
www. indiainfoline.com/bisc/itin.pdf.
Anonymous (2003) Interactive Education: Impact of the Internet on
Learning
Teaching.http://aftnn.org/blanket/site/http://UBMAIL.ubalt.edu/~
harsham/software/INDEX.HTM
Anonymous (2004) e-Commerce Sector Impact Study – Conclusions
(2004)
http://strategis.ic.gc.ca/epic/internet/ineeef.nsf/vwGeneratedInt
erE/ee00464e.html
Anonymous (2004). National seminar on ICTS for agricultural development, 9-10th
September. Paper presented on Internet use by teacher and their students
at NARM Rajendranagar, Hyderabad-500030.
Anonymous (2004). Workshop on SATCOM based patent awareness organized by Govt.
of Gujarat council on science and technology (Gujcost). On 30th January at
Gandhinagar.
Anonymous, (2002). How academic librarians can influence students. Web-
based information choices. vailable : http://www.5.oclc.
org/downloads/ community/informationhabits.pdf.
Anonymous, (2002). What do users do on the internet?
Available:http://www.stanford.edu/group.siqss/Press Release/
press detail.html.
Anonymous, (2002). Use of instructional technology in courses : A survey
of student views and experiences, http://
www.umass.edu/oapa/assess-ment/instruct_tech_in _courses.
pdf.
Ardeshana, V. R. (1990). Teacher‟s attitude toward teaching at the college
of Agriculture, Junagadh. Unpublished M.Sc. (Agri.) Thesis.
GAU, S. K. Nagar.
Aryal, (2003). "ICT initiatives in agri-business and marketing system in Nepal". Seminar
paper presented in Dhaka, October, 22-23.
Asemi, A. (2005). Information searching habits of Internet users: A case study on the
Medical Sciences University of Isfahan, Iran. Webology, 2(1). Retrieved
August 9, 2005, from http://www.webology.ir/2005/ v2n1/a10.html.
Atiso, K. E. (2007). "The Internet as a source of information for academic work: a study of
Internet users of the Balme Library Annex and the Tyme Out Internet cafes,
University of Ghana". Quarterly Bulletin of IAALD, 52(1/2): 22-27.
Bavakutty, M., & Salih Muhamad, T. K. (1999). Internet services in Calicut University.
National Convention Academic Libraries in the Internet Era. Organized by
INFLIBNET, 18-20 February 1999, Ahemdabad, p.37-44.
Becker, H.J. (1998). Internet use by teachers. Retrieved June 26, 2004,
fromhttp://www.crito.uci.edu/TLC/findings/Internet-Use/ startpage. html
Becky, S., Stephanie C., Lawrence L., Jennifer A., Nicholas I., and January
A. (1999). Teachers‟ Tools for the 21st Century: A report on
teachers‟ use of technology, Educational Statistics Quarterly, 2,
(4), http://nces.ed.gov/ programs/ quarterly/vol_
2/2_4/e_section5.asp.
Bennett, Valerie, (1998). "e-NOTES. Information Overload : Are you a Dataholic?
Georgeton University, University Information Services". (downloaded from
www.etrade.com).
Birkenholz, R.J. and stewart, B.R. (1991). The use of instructional
technologies in agricultural education, J. Agril Edn., 32 (2) : 40-
48.
Blasio, G-de. (2008). "Urban-rural differences in Internet usage, e-commerce, and e-
banking: evidence from Italy". Growth and Change, 39(2): 341-367.
Bonk, Curtis J. (2002). Online Training in an Online World, http: // aftnn.
org/blanket/site/http://www.usdla.org/html/journal/MAR02_Issue
/article02.html.
Boschetti, L., Roy, D. P and Justice, C. O. (2008). "Using NASA's World Wind virtual globe
for interactive internet visualization of the global MODIS burned area
product" International Journal of Remote Sensing, 29(11/12): 3067-3072.
Brown, C. and Baer, A. (2006). "An examination of the use of E-marketing by small farms
in the Northeast". Journal of Food Distribution Research, 37(1): 40-47.
Brown, S.E. and Vician, C. (1997) “An Examination of the Relationship
between Computer Anxiety. Communication Apprehension and
Student Experiences with Electronic Mail. http:
//WWW.Usm.Maine. Edu/~com/l indap~htm.
Cassandra Rowand (1999). Teachers and Computers: Teacher use of
computers and the internet in public schools, Educational
Statistics Quarterly, 2,(2), http://nces.ed.gov/programs
/quarterly/ vol_2 /2_2/q3-2.asp.
Catherine Nyaki Adeya and Banji Oyelaran-Oyeyinka (2002). The Internet
in African Universities: Case studies from Kenya and Nigeria,
http://www.Globalequality.info/reports/ IDEaf. pdf.
Chandran, D. (2000). Use of Internet resources and services in S. V. University, Tirupathi
environment. Conference on Information Services in a Networked
Environment in India. Organized by INFLIBNET, 18-20 December 2000,
Ahemdabad, p.3.124-3.127.
Chauhan, N.B. (2004). Use of internet by research scholars of Agriculture
College, Anand. Times of India, Anand Plus: 2.
Chi-cheng chang, (2001). "A study on evaluation and effectiveness analysis of web-based
learning portfolio". British Journal of Education Technology, 32 (4) : 40-48.
Curtis J. Bonk (2002) Online Training in an Online World, http://
aftnn.org/blanket/site/http://www.usdla.org/html/journal/
MAR02_Issue/article02.html
David Piercey (2000) Students‟ psychological well-being and the Internet -
A Review and Discussion of Current Research
http://dtp.epsb.net /projects/wwwise2.htm#6
Deloughry, T.J. (1993). Researchers Say “ Technolophobia May Affict Millons of Students”, The Chronicle Of Higher Education (28 April): A25-A26.
Dorothy Williams, Kay Wilson, Amanda Richardson, Jennifier Tuson and
Louisa Coles (1998). Teachers‟ ICT skills and knowledge
needs, Final Report to SOEID, The school of information and
media, faculty of management, The Robert Gordon University,
http://www.scotland. gov.uk/ library /ict/append-exec.htm.
Douglas W. Green and Thomas O‟Brien, (2002) The Internet‟s Impact
on Teacher Practice and Classroom Culture, http://www.
thejournal.com/magazine/vault/A4081.cfm
Gagnon, R. and Krovi, R. (2000). "Internet use : Are instructors upto speed? ORMS Today
: A publication of INFORMS. Innovative Education". Liobneart Publishing,
Inc. October, 27 (3) : 32-34.
Gagnon, R. and Krovi, R. (2000). Internet use : Are instructors upto speed?
ORMS Today : A publication of Informs. Innovative Education,
Lionheart Publishing, Inc. October, 27 (3) : 32-34.
George, Brandenburg, Arlene Ackerman, Iris Mets, Dan Domenech, Robert
Smith, Sister Eymard Gallagher, Patricia McGuire, Belle
Wheelan, Larry Herman, Mindy Finfer, and Cathy Lange
(1999). Citizenship in the digital age, http://
www.knowledgeway.org /works/citizenship / teacher group.
html.
Goh, C. W (1997). Use and acceptance of internet as a modern communication tool: A
study in the city of Kuala Lumpur]. A Baccalaureate Degree Project Paper.
Department of Communication, Universiti Kebangsaan Malaysia.
(Unpublished). Referred from the article on “Internet in Malaysia” by
Rahmah Hashim and Arfah Yusof, http:// www. interasia.
org/malaysia/hashim-yusof.html.
Goh, C.W. (1997). A Use and acceptance of internet as a modern
communication tool : a study in the city of Kuala Lumpur. A
baccalaureate Degree Project Paper. Department of
Communication, University Kebangsaan Malaysia
(Unpublished). Referred from the article on “Internet in Malysia”
by Rahmah Hashim and Arfah Yusof. Available : http://
Intarsia.org/Malaysia/hashim-yusof.html.
Golbderg, M.W. (1996). "Student Participation and Progress Tracking for Web-Based
Courses Using WebCT". Proceeding of the Second International N.A. WEB
Conference, October 5-8, Frederiction, NB, Canada.
Goldberg, M.W. (1996). Student participation and progress Tracking for
web-based courses using web CT. Proceeding of the second
international N.A. WEB Confererence, October 5-8,
Frederiction, NB, Canada.
Goodwin, B. (2008). "How to use the online-encyclopedia "Wikipedia" in academic
research and teaching". Forst-und-Holz, 63(5): 34-37.
Gressard, C.P. and Loyd, B.H. (1986). The Nature and Correlates of Computer
Anxiety in College Students. Journal of Human Behaviour and
learning, 3:28-33.
Gupta, Ankur, (2002). "Bitten by the programmers' bug Log in Tribune". The Tribune,
Monday, May 27 : 1-4.
Hakkinen, P. (1994). Changes in computer anxiety in a required computer
course. Journal of Research on Computing in Education,27 (2)
141-153.
Hamizatul M. (1998) Yeap (1998) and Vijaya (1998) Kefahaman
mahasiswa tentang teknologi maklumat: satu kajian di
University Kebangsaan Malaysia. [Undergraduates „
understanding of information technology: a study at University
Kebangsaan Malaysia]. A Baccalaureate Degree Project
Paper. Department of Communication, University Kebangsaan
Malaysia. (Unpublished). Referred from the article on “Internet
in Malaysia” by Rahmah Hashim and Arfah Yusof,
http://www.interasia.org/malaysia/ hashim-yusof.html
Hanauer D., Dibble E., Fortin, J., & Col, NF. (2004). Internet use among community
college students: Implications in designing healthcare interventions. Journal
of American College Healt, 52(5), 197-202.
Hasnain, Ali (2002). "Spammers beware! Log in ... Tribune". The Tribune, Monday,
January, 21 :1-4.
Henry, Jay Becker (1998). Internet use by teachers, http:// www. crito. uci. Edu / TLC
/FINDINGS/Internet-use/ startpage. htm.
Hermann, J., Carson, A., Muske, G. and Keim, K. (2005). "Using a nutrition Web site as a
resource for county educators: evaluating Oklahoma Cooperative Extension
Service's experience". Journal of Extension, 43(4): 4RIB4.
Hunter, C. M., Peterson, A. L., Alvarez, L. M., Poston, W. C., Brundige, A. R., Haddock, C.
K., Brunt, D. L-van and Foreyt, J. P. (2008). "Weight management using the
Internet a randomized controlled trial". American Journal of Preventive
Medicine, 34(2): 119-126.
Hussain, F. and Jefferies, P. (1998). Using the internet as a teaching
resource. Education + Training, 40, 9, 359-375. Retrieved
March 13, 2003. from Emerald full text data base.
Igbaria, M. and Chakrabarti, A. (1990). Computer Anxiety and Attitudes
towards Microcomputer Use, Behaviour and Information
Technology, 9229-241.
Iroha, Kalu and Ekwueme, C.O. (2003). Assessment of teachers‟ level of literacy and
attitude towards information and communication technology application in
science, technology and mathematics education, Department of Curriculum
and Teaching, University of Calabar, Nigeria, http: // www. usq. edu. au
/electpub/e-jist/docs/Vol.7_No1/ Melting Pot / teach_lev_lit.htm.
Jadhao, D. L. (2002). Modernization of agriculture among the farmers of Mehsana district
of Gujarat State. Unpublished M. Sc. (Agri.) Thesis, Sardar Krushinagar.
James, (1997). Opportunities for cooperative extension and local communities in
information age. J. Extn., 35(5).
James, A. Levin, Matthew J. Stove and Michael J. Jacobson (1999).
Teachers‟ conceptions of the Internet and the World Wide Web,
A representational Toolkit as a model of expertise,
http://faculty.ed.uiuc. edu/j-levin/Rep-Toolkit-1.10.html.
James, W. Michaels and Dirk, S. (2000). "Webeducation Alert". The Times of India
Wednesday, June 21, pp.1-6.
Jesic Donn, Richard, S., Christian, E., Egon, K., Zacharary, J.C., Jaime, K.
and Mick, R. (2001). Attitudes and practices regarding
relationship foundation on the internet, Availablle :
http://www.users.muonio.edu/shermarc/apa01.htm.
Jessic Donn, Richard S, Christian E, Geon K, J. C, Zacharary B, Jaime K, & Mick R (2001)
Attitudes and Practices Regarding Relationship Formation on the Internet,
http://www.users. muohio.edu/shermarc/apa01.htm
Johansson, K. E; Pringle, M. and Tamm, S. (2007). "VetBakt - a useful public database on
the Internet". Svensk-Veterinartidning, 59(5): 19-23.
John, Cradler, Molly Freeman, Ruthmary Cradler and Mary McNabb (2002). Research
implications for preparing teachers to use technology, http:// caret. iste. Org
/ caretadmin/ resources_ documents/30_1.pdf.
Jones, S. (2002). The internet goes to college : how students are living in
the future with today‟s technology. Pew Research Center.
Washington, D.C. Available : http://www.pewinternet.org.
Kalra, R.K. (2004). "Cultural artificiality : A study on cyber cafes in Punjab". Journal
Research Punjab Agriculture University, 41 (3) : 406-12.
Kanaujia, S., & Satyanararayana, N.R. (2003). Status of awareness and demand of web-
Based learning environment among the S&T information seekers.
International Conference on Mapping Technology on Libraries and People,
Organized by INFLIBNET, 13-15 February 2003, Ahemdabad, p.587-593.
Kapoor, R. (2002). Self-paced and explorative e-learning is here to stay,
Log in … Tribune, The Tribune, Monday, May 27, pp. 1-4.
Kaur, A. (2000). Internet facility at GNDU: A survey. National Seminar on Academic
Libraries in the Modern Era, Organized by IASLIC, 4-6 December 2000,
Bhopal, p. 119-124.
Kim Deok, (2002). "Internet Gender gap in Asia". Korean Times. Available :
http://www.hankooki.com.
King, J.L. and Martin, M.J. (1999). "The saga of cyberspace construction boomtown in the
great divide. Culture of the Internet". San Diego, Academic Press, pp. 3-33.
Kooganurmath, M. M., & Jange, S. (1999). Use of Internet by social science research
scholars: A study in academic libraries in the Internet era. National
Convention Academic Libraries in the Internet Era. Organized by
INFLIBNET, 18-20 February 1999, Ahemdabad, p.478-483.
Kosambi, S.R and Trivedi, M.S. (1998). Academic performance of Agricultural students.
Guj. J. Ext. Edn., VIII (8) & IX (9):53.
Krishnatray, P. and Kulshrestha, A. 2002. Internet use among youth.
Available : http://www.mica-india.net.OUTPUT/Pk.pdf.
Krishnatray, Pradeep and Kulshrestha, Abhijita (2002) Internet use among
youth, http://www.mica-india.net/Output/PK.pdf.
Kumar, D. (2002). With poor infrastructure, online tests stil a distant dream.
Long in Tribune. The tribune, Monday, January, 21, pp. 4.
Kumar, S. R; Jagadeeswary, V; Savitha, B and Reddy, M.S. (2007). "Internet utilization
pattern of veterinary students-a critical analysis". IndianJournal of Animal
Research, 41(3): 167-173
Laite, B. (2000). Internet use survey: analysis. Retrieved May 21, 2004, from
http://www.ship.edu/~bhl/survey/
Lee, P. L. (1997). Penggunaan Internet di Lembah Kelang: satu kajian di Subang Jaya.
[Use of Internet in the Klang Valley: a study in Subang Jaya]. A
Baccalaureate Degree Project Paper. Department of Communication,
University Kebangsaan Malaysia. (Unpublished). Referred from the article
on “ Internet in Malaysia” by Rahmah Hashim and Arfah Yusof,
http://www.interasia.org/malaysia/hashim-yusof.html
Loyd, B.H. and Gressard, C. (1984). "The effects of sex, age and computer experience on
computer attitudes". AEDS, Journal, 18 (2) : 67-77.
Mahajan, S.G., & Patil, S.K. (1999). Internet: Its use in university libraries in India. National
Convention Academic Libraries in the Internet Era. Organized by
INFLIBNET, 18-20 February 1999, Ahemdabad, p.483-488.
Mahipal, S. and Prasad, M. (1997). Impact of training programmes on extension
personnel. Mah. J.Ext.Edn. 16:111.
Maniar, A. (2002). A study on internet usage for education purpose by the
students of the maharaja sayajirao University of Baroda,
Vadodara. J. Extn. Res. & Extn., 39 (4) : 1.
Marc, Riemer, J. (2002). English and communication skills for the global
engineer. Global Journal. of Engineering. Education. Vol.6,
No.1 .UICEE, Australia, http://home.planet.nl/~
kluijven/7WeihuaLuo.htm.
Marcoulides, G.A. (1988). The Relationship between Computer Anxiety &
Computer Achievement, Journal of Educational Computing
Research, 4: 151-158.
Masionyte, G. and Zaltauskiene, N. (2008). "Usage of information technologies and
development of electronic public service in Lithuania". Applied information
and communication technologies Proceedings of the International Scientific
Conference, Jelgava, Latvia, pp.72-77.
Mishra, O.P., Yadava, N. and Bhist, K. (2005). "Internet utilization pattern of
undergraduate students". University News, 43 (13) : 8.
Moore, M. and Kearsley, G. (1996). Distance education : A system view.
Belmont, C.A. Wadsworth.
Murali, Shanmugarelan (2002). The Hindu Media Resource Center for Eco-technology
and Sustainable Development. J. of INTERMEDIA, 28; UK.
Myriam, Diocaretz (2002). An Exploratory study of internet usage at higher
education institutions in Latin America, Case Studies from
Brazil and Chile, http://www.infonomics.nl/ globalequality
/reports /IDEla. pdf.
Naushad Ali, P.M. (2000). Internet and its use in Aligarh Muslim University: A survey.
Conference on Information Services in a Networked Environment in India.
Organized by INFLIBNET, 18-20 December 2000, Ahemdabad, p.1.78-1.82.
Necessary, J.R. and Parish, T.H. (1997). The Relationship between Computer Usage and
Computer- Related Attitudes and Behaviours, Education, spring 1996, v116
n3: 384-387, http: // WWW .usm. maine. Edu/~Com/lindap~1 htm.
Neil, M., Neil, S. and Pru, M. (1999). "Accounting students; use of information and
communications technology in two UK Universities". Available:
http:www.Business.Itsn.ac.uk /cti/ conference
/proceedings%201999/Marriott.pdf.
Nicholas, D, Huntington, P., Gunter, B., Russell, C., & Withey, R. (2003). The British and
their use of the web for health information and advice: A survey. Aslib
Proceedings, 55 (5-6), 258-260.
Njagi, K., Smith, R. and Isbell Clint (2003). Assessing Students' Attitudes TowardsWeb-
basedLearningResources, http://naweb.unb.ca/proceedings/2003/ Poster
NjagiIsbell. html
Nogueira-Terrones, H; Tinet, C; Curt, C; Trystram, G. and Hossenlopp, J. (2006). "Using
the Internet for descriptive sensory analysis: formation, training and follow-
up of a taste-test panel over the Web". Journal of Sensory Studies, 21(2):
180-202.
Noronha, R. (2002). Low rural purchasing power a bane for regional
software, Long in tribune, The tribune, Monday, January, 21,
pp. 1-4.
Panda and Surya Narayan (2001). "Beware of cyber terrorists. Log in ..... Trubune". The
Tribune, Monday, November 5 :1-4.
Pang, W. L. (1997). Use of Internet in the Klang Valley: a case study in Petaling Jaya. A
Baccalaureate Degree Project Paper. Department of Communication,
Universiti Kebangsaan Malaysia. (Unpublished). Referred from the article on
“ Internet in Malaysia” by Rahmah Hashim and Arfah Yusof,
http://www.interasia.org/ malaysia/hashim-yusof. html.
Parmar, S.D. (2005) Publication behaviour of the Agricultural scientists of Anand
Agricultural University, Anand. Unpublished M.Sc. (Agri.) Thesis, A.A.U.
Anand.
Pat Auger, Anat BarNir and John M. Gallaugher (2003),Strategic Orientation, Competition,
and Internet-Based Electronic Commerce,
http://www.springerlink.com/(0ahhwhja4b1hvd
454g2cdnre)/app/home/contribution.asp?referrer=parent&backto=issue,2,11
;journal,9,20;linkingpublicationresults,1:101768,1.
Patel, A.A. (1993). A study on research management ability of research
scientists working as head of the department / station /project /
scheme in Gujarat Agricultural University. Unpublished M.Sc.
(Agri.) Thesis, GAU, Anand.
Patel, A.A. and Patel, D.D. (2002). Effectiveness of multimedia in
educational system. Guj.J.Ext. Edn., 12 & 13 :1-5.
Patel, M. C. (2004). A study on “effectiveness of various messages
transferred through different training method" School of Baking
in Gujarat Agricultural University, Anand, district of Gujarat
State", Special problem (An assignment) for the degree of
M.Sc. in Agricultural Communication submitted to the YCMOU,
Nasik, Maharashtra.
Patel, M. C. (2004). A study on Event management in Agriculture and
Evaluation of Agricultural Exhibition. Special problem (An
assignment) for the degree of M.Sc. in Agricultural
Communication submitted to the YCMOU, Nasik, and
Maharashtra.
Patel, M. C. (2004). A study on Internet exposure of postgraduate students
of Agriculture College, Anand of Gujarat agricultural university,
Special problem (An assignment) for the degree of M.Sc. in
Agricultural Communication submitted to the YCMOU, Nasik,
and Maharashtra.
Patel, M.C (2006). A study on opinion of the teachers of Agriculture College
about the use of multimedia for agricultural education, special
problem (An assignment)for Ph. D. submitted to the YCMOU,
Nasik, Maharashtra.
Patel, M.C. and Chauhan, N.B. (2005). "Pattern of internet use of the agricultural
students". Agriculture Extension Review, 17 (1) : 7.
Philip, M. (1998). Socio-Cultural Challenges for the Internet in South Africa,
Department of Computer Science, University of the
Witwatersrand, Private Bag 3 2050 Wits, South Africa, http://
www. itee.uq.edu.au/~philip/Publications/_Crossroads/socio-
cultSA.pdf#search=%22Philip%20Machanick%20(1998)%20tec
hnology%20policy%20in%20South%20Africa%22.
Raman, M. (2002). Pop Up stopper Download of the week as in. Long in …
Tribune, The Tribune Monday, January, 21, pp. 3.
Rao, Madanmohan. (1999). How real is the internet market in developing
nations (downloaded from www.planetasia.com).
Raymond S. (2000). Towards a model of Internet learning, Education at a
Distance, 14: 6.
Raymond S. (2000). Towards a model of Internet learning, Education at a Distance, 14: 6.
Richard, C.S. (1997). Social psychology in cyberspace : using the world
wide web to teach applications of social principles to everybody
life. Available : http:// www.users.muohio.
edu/shermarc/scip97.htm.
Richard, C.S., Christian, E., Egon, K., Julie, M., Alison, C. and Jeff, G.
(1998). Sex differences in internet use: attiudinal and
experiential correlates. Available: http:// www. Users.
muohio.edu/shermarc/ aps98.htm.
Ruth, S.R. (2000). "Measuring long term effects of technology transfer in developing
nations the case of internet training at the Romanian academy of Science".
Information Technology Development, 9 : 105-121.
Ruth, S.R. (2000). Measuring long term effects of technology transfer in
developing nations the case of internet training at the
Romanian academy of science. Information Tech. Devp., 9 :
105-121.
Sadiq M. Sait, Khalid M. Al-Tawil, Syed Hussain Ali and Salman A. Khan (2002). The Use
and Effect of Internet on Teachers and Students in Saudi Arabia, http://
64.233.179.104 /search?q =cache: www. hiceducation.org
/Edu_Proceedings/ Salman percent 2520A.per cent 2520 Khan.
pdf+An+Exploratory+ Study+ of+ Internet+ Usage+ at+ Higher+ Education,
Case+ Studies+ from+ Brazil+ and+ Chile &hl = en &gl =in & ct= clnk & cd=
3.
Sanjiv Sharma (2008). "Use of ICT in agriculture extension, research, development &
management: prospects and challenges". Fertiliser Marketing News. 39(1):
1-5.
Shah, U. B. (2006) A study on level of internet exposure of Teachers of Anand Agricultural
University, Anand.Unpublished Ph. D. thesis, A.A.U. Anand, Gujarat.
Shah, U. B. (2006) A study on level of internet exposure of Teachers of Anand Agricultural
University, Anand.Unpublished Ph. D. thesis, A.A.U. Anand, Gujarat.
Sharma, M. L., Chauhan, M. S. and Jagdeeeshwara (1999). Impact of Krishi Vigyan
Kendra on peasantry modernization on Southern Rajasthan. Raj. J. Ext.
Edn, 7: 56-59.
Sharma, S. (2002). Internet utilization pattern of satellite communication by
post graduate girl students. M.Sc. Thesis (Unpublished),
Haryana Agriculture University, Hisar (Haryana), India.
Shashaani, L. (1997). "Gender differences in computer attitudes and use among college
students". Journal of Education Computer Research, 16 (1) : 37-51.
Sherer, K. (1997). College life online : Healthy and unhealthy internet use.
J. College Students Dev., 38 (6) : 655-665.
Sherif, J. and Khan R. (2000). Internet use omani college students – An
academic perspective. Available : http: scholar.lib.vtedu/
ejournals/jte-v7nl.html.
Sherman, R.C., End, C. and Gardner, J. (1998). Sex differences in internet
use: Attitudinal and experimental correlates. Presented to the
American Psychological Society Convention, Washington.
Shingare R. (2005). Study of attitude and occupational aspiration of undergraduate
Veterinary Science and Animal Husbandry college students of Gujarat.
Unpublished M.Sc. (Agri.) Thesis, GAU, Anand.
Singh, D. (1998). The use of Internet among Malaysian librarians. Malaysian Journal of
Library and Information Sciences, 3(2), p.1-10.
Singh, P. and Singh, R.P. (1995). Women scientists of ICAR: the co-partners in
agricultural research. Mah. J .Ext. Edn., 14.
Singh, R. (2000). Net Mart. HT careers, February, 10, pp. 1-6.
Singh, R. (2002). You‟ve got junk mail. Log in … Tribune, The Tribune,
Monday, January, 21 pp. 1-4.
Singh, R. (2002). You‟ve got virus! Long in Tribune, The Tribune, June, 24,
pp. 1-4.
Singh, S.P., Malik, R.S. and Narwal, R.S. (2004). Mass media exposure among the
horticultural officer in Hariyana, Rural India, 67(5):90-94.
Smith, Njagi K, (2002). Successfully incorporating Internet content and advanced
presentation technology into collegiate courses: Unpublished manuscript,
Mas sachusetts Maritime, Academy.
Sood, R. (2002). A social investor‟s Guide of ICTs for development. The
communication initiative. Center for knowledge societies.
December (3), Bangalore.
Steve, Jones and Comille, Johnson (2005). Professors on line, http: //www.
first monday. org/issues/issue10_9/jones/#j9.
Taragola, N. and Lierde, D-van, (2007). "The use of the computer in Flemish horticultural
enterprises". Fruitteelt nieuws, 20(21/22): 6-9.
Tarjanne, (1996). "The internet and the infrastructure : What is the difference". World
Science News. 33 : 18-21.
Teresa Y. N, Jessame F, Michael Romary, Simmona Simmons-Hodo and Katy
Sullivan (2003) Literacy Survey – 2003 ,Executive Summaryhttp:
//aok.lib.umbc.edu/reference/informationliteracy/ESinfolit2003.pdf
Tseng. H.M.; Tiplady, B.:Macleod,H.: Wright, P.(1997). Computer Anxiety
and the Mood and Cognitive Function, htt://www .york.ac.UK.
Verma, V. 2002. Making networking a hassle-free affair, Log in Tribune, the
Tribuine, Monday, May, 20, pp. 1-4.
Voorbij, H. (1999). Searching for scientific information on the Internet: A Dutch academic
user survey. Journal of the American Society for Information Science, 50(7),
598-615.
Wang, Y.C., Hwang-YeongHyeon and Fesenmaier, D. R. (2006). "Futuring Internet
marketing activities using change propensity analysis". Journal of Travel
Research, 45(2): 158-166.
Williams, J. (1999). Information technology in Michigan: Adult and teen survey report.
Retrieved May 21, 2004, from http://www. pscinc .com
/documents/cyberstate/finalreport.pdf
Wlodkowski, R.J. (1993). Enhancing adult motivation to learn: Aguide to
improving instruction and increasing learner achievement. San
Francisco: Jossey-Bass.
World Bank (2002). ICTs – A World Bank Group Strategy. Washington,
D.C.: The World Bank Group, http: //www.usq.edu.au
/electpub/e-jist/docs/Vol7_No1/MeltingPot/teach _lev_lit.htm.
Yeap S. L. (1998) Kegunaan Internet di kalangan pelajar: satu kajian di
Universiti Kebangsaan Malaysia. [Use of Internet among
students: a study at UniversityKebangsaan Malaysia]. A
Baccalaureate Degree Project Paper. Department of
Communication, University Kebangsaan Malaysia.
(Unpublished). Referred from the article on “Internet in
Malaysia” by Rahmah Hashim and Arfah Yusof,
http://www.interasia.org/malaysia/hashim-yusof.html.
Yldz, E, Samur, G, Yldz, A.N. and Mercanlgil, S. (2008). "The evaluation of the Internet
and computer utilization by nutrition and dietetic students". Turk Silahl
Kuvvetleri, Koruyucu Hekimlik Bulteni, 7(3): 217-222.
Zidon, M. and Miller, W.W. (1990). "The perceived value of computer use in secondary
agriculture programs : A national study proceedings of the central Region
Annual Research Conference (44th)". Cicago, IL. ELRIC Document
Reproduction No. ED319903.
APPENDIX-I
(Covering letter sent to the experts)
From : Dr. I.M. Khan No. ………………. Asstt. Professor Dated : …...…/2009
Deptt. of Extension Education
S.K.N. College of Agriculture
Jobner (Jaipur) Rajasthan
To,
-------------------------------------
-------------------------------------
-------------------------------------
Dear Sir
One of my M.Sc. (Ag.) student Mr. Suresh Garhwal, has undertaken a
research study entitled, “Internet Utilization Behaviour of Agricultural Students of
Rajasthan Agricultural University, Bikaner” for completion of M.Sc. (Ag.) degree in
Department of Extension Education. We are trying to develop a comprehensive
schedule for measuring following objectives of the said study. (i) To study the
personal and family characteristics of the respondents. (ii) To analyze the internet
utilization pattern of the agricultural students. (iii) To find out the effect of internet utilization
on over all performance of the agricultural students. (iv) To study the factors associated
with the internet utilization of agricultural students. (v) To identify the constraints faced in
internet utilization by the agricultural students.
The statements in the schedule have been developed on the basis of
relevant literature, reviewed, personal experience, discussions held with subject
matter specialists and extension personnel. In this context, we want to take
advantage of your vast experience and knowledge. Kindly spare some time and
go through the schedule very critically and feel free to comment upon / add /
delete and or modify the statements, if necessary, so that the final schedule can
be developed prior to undertake the study.
Kindly mail the schedule to the undersigned after your necessary
comments in the self addressed stamped envelop attached with schedule.
Thanking you for kind co-operation.
Encl: As above
Your’s faithfully
(I.M. Khan)
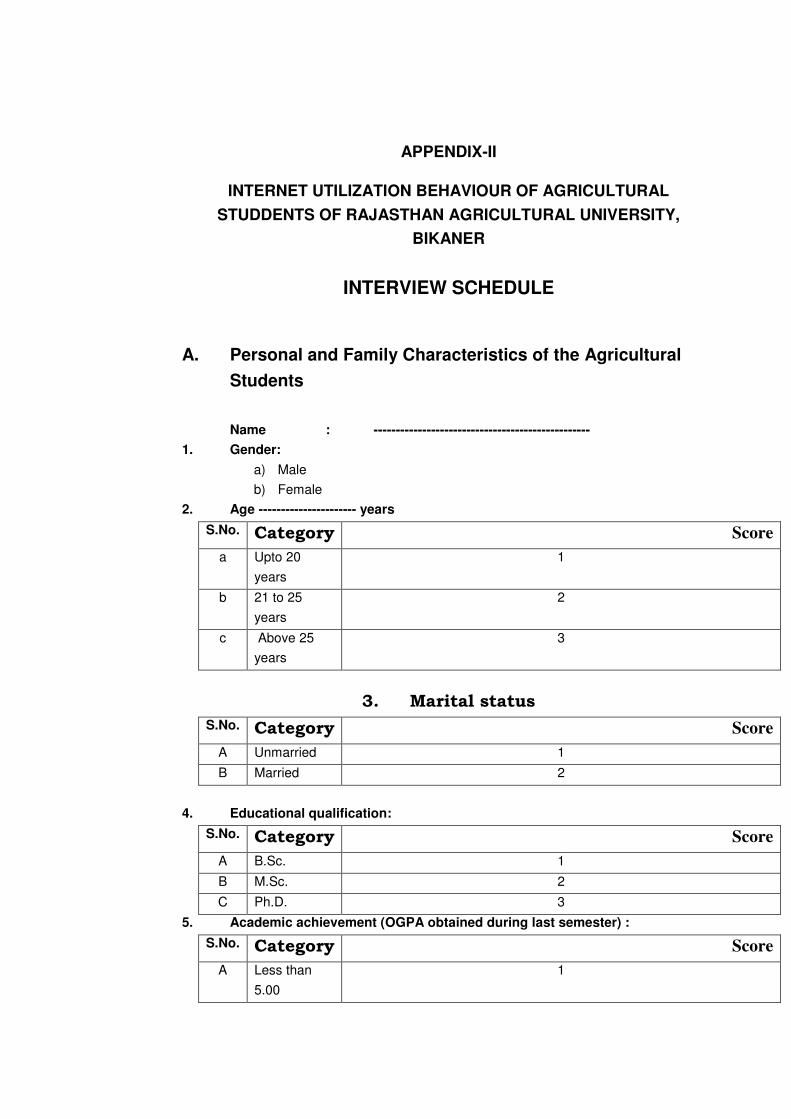
APPENDIX-II
INTERNET UTILIZATION BEHAVIOUR OF AGRICULTURAL
STUDDENTS OF RAJASTHAN AGRICULTURAL UNIVERSITY,
BIKANER
INTERVIEW SCHEDULE
A. Personal and Family Characteristics of the Agricultural
Students
Name : -------------------------------------------------
1. Gender:
a) Male
b) Female
2. Age ---------------------- years
S.No. Category Score
a Upto 20
years
1
b 21 to 25
years
2
c Above 25
years
3
3. Marital status
S.No. Category Score
A Unmarried 1
B Married 2
4. Educational qualification:
S.No. Category Score
A B.Sc. 1
B M.Sc. 2
C Ph.D. 3
5. Academic achievement (OGPA obtained during last semester) :
S.No. Category Score
A Less than
5.00
1
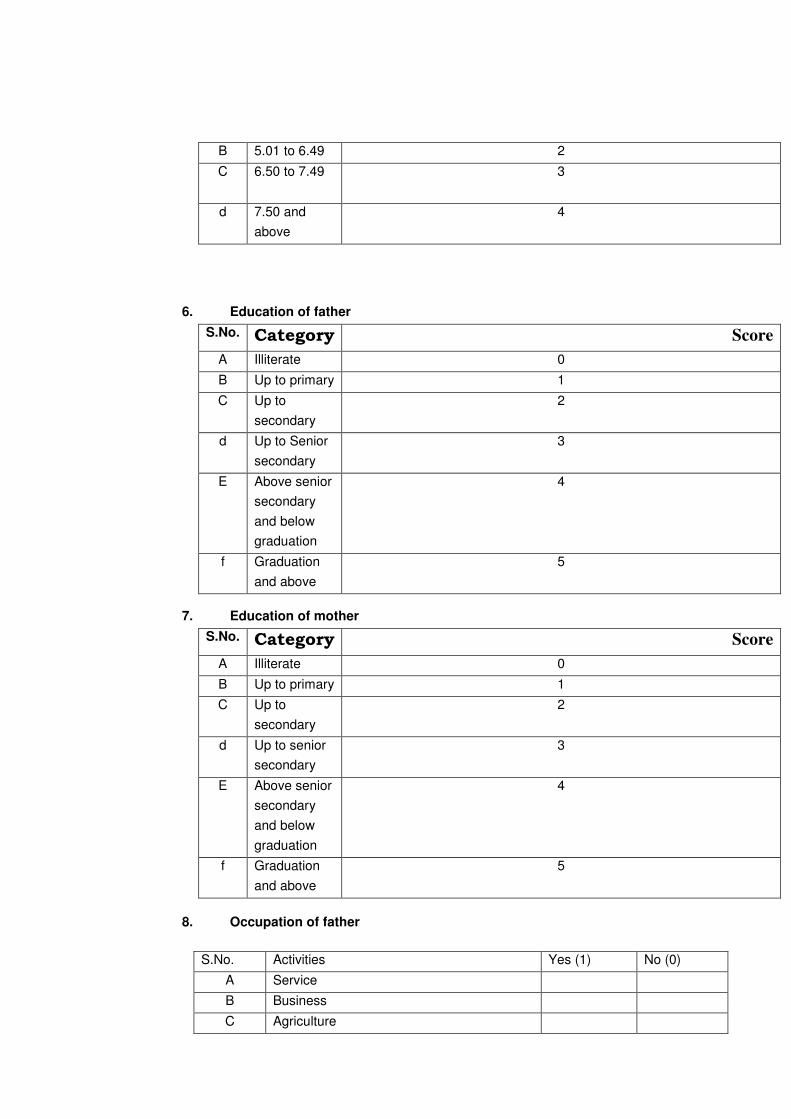
B 5.01 to 6.49 2
C 6.50 to 7.49
3
d 7.50 and
above
4
6. Education of father
S.No. Category Score
A Illiterate 0
B Up to primary 1
C Up to
secondary
2
d Up to Senior
secondary
3
E Above senior
secondary
and below
graduation
4
f Graduation
and above
5
7. Education of mother
S.No. Category Score
A Illiterate 0
B Up to primary 1
C Up to
secondary
2
d Up to senior
secondary
3
E Above senior
secondary
and below
graduation
4
f Graduation
and above
5
8. Occupation of father
S.No. Activities Yes (1) No (0)
A Service
B Business
C Agriculture
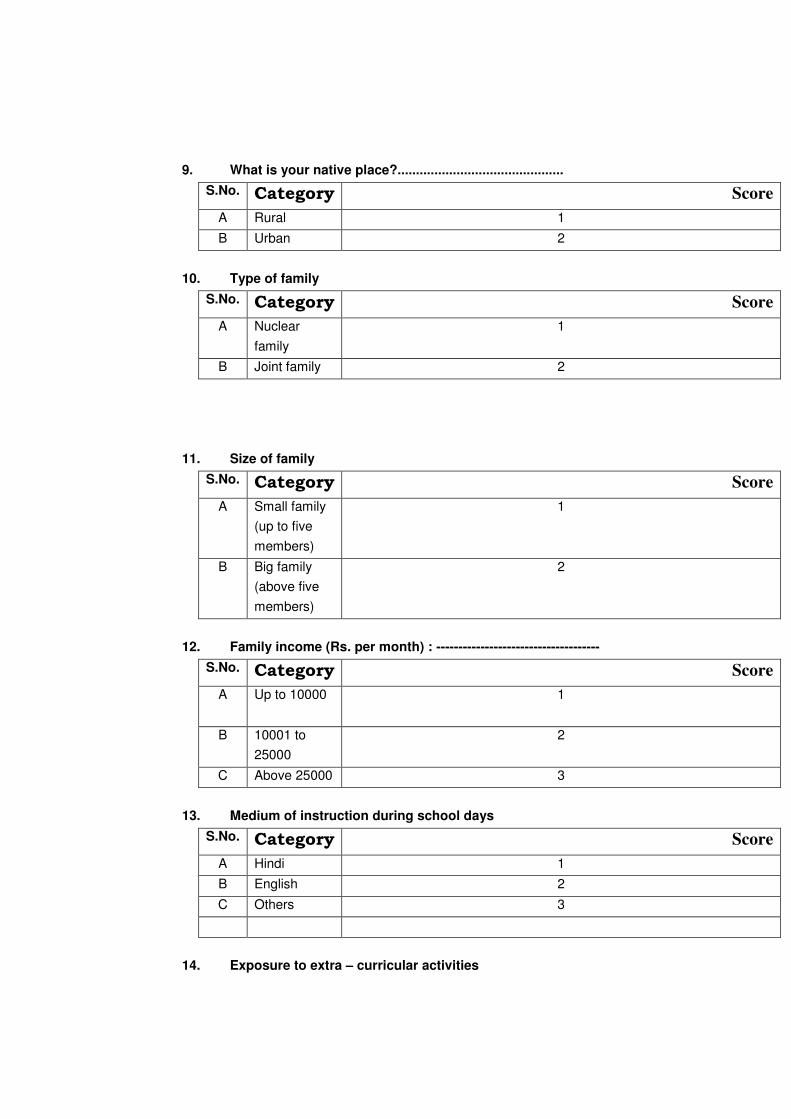
9. What is your native place?.............................................
S.No. Category Score
A Rural 1
B Urban 2
10. Type of family
S.No. Category Score
A Nuclear
family
1
B Joint family 2
11. Size of family
S.No. Category Score
A Small family
(up to five
members)
1
B Big family
(above five
members)
2
12. Family income (Rs. per month) : -------------------------------------
S.No. Category Score
A Up to 10000
1
B 10001 to
25000
2
C Above 25000 3
13. Medium of instruction during school days
S.No. Category Score
A Hindi 1
B English 2
C Others 3
14. Exposure to extra – curricular activities
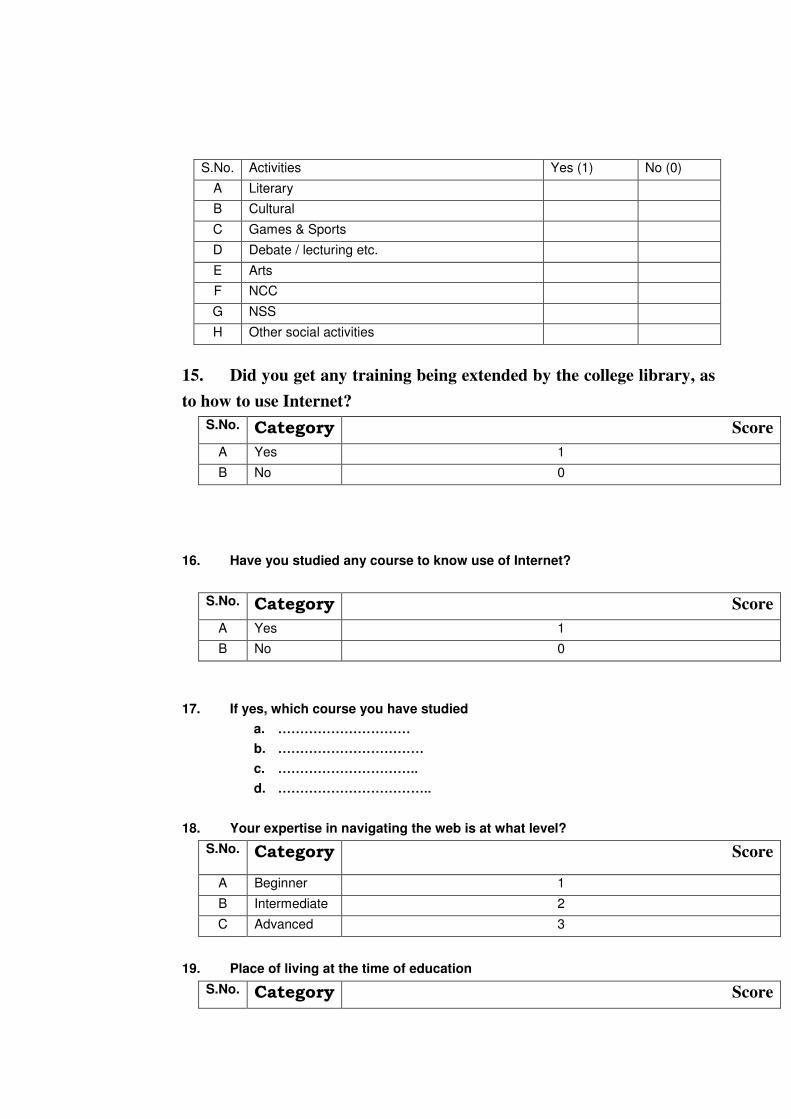
15. Did you get any training being extended by the college library, as
to how to use Internet?
S.No. Category Score
A Yes 1
B No 0
16. Have you studied any course to know use of Internet?
S.No. Category Score
A Yes 1
B No 0
17. If yes, which course you have studied
a. …………………………
b. ……………………………
c. ………………………….. d. ……………………………..
18. Your expertise in navigating the web is at what level?
S.No. Category Score
A Beginner 1
B Intermediate 2
C Advanced 3
19. Place of living at the time of education
S.No. Category Score
S.No. Activities Yes (1) No (0)
A Literary
B Cultural
C Games & Sports
D Debate / lecturing etc.
E Arts
F NCC
G NSS
H Other social activities
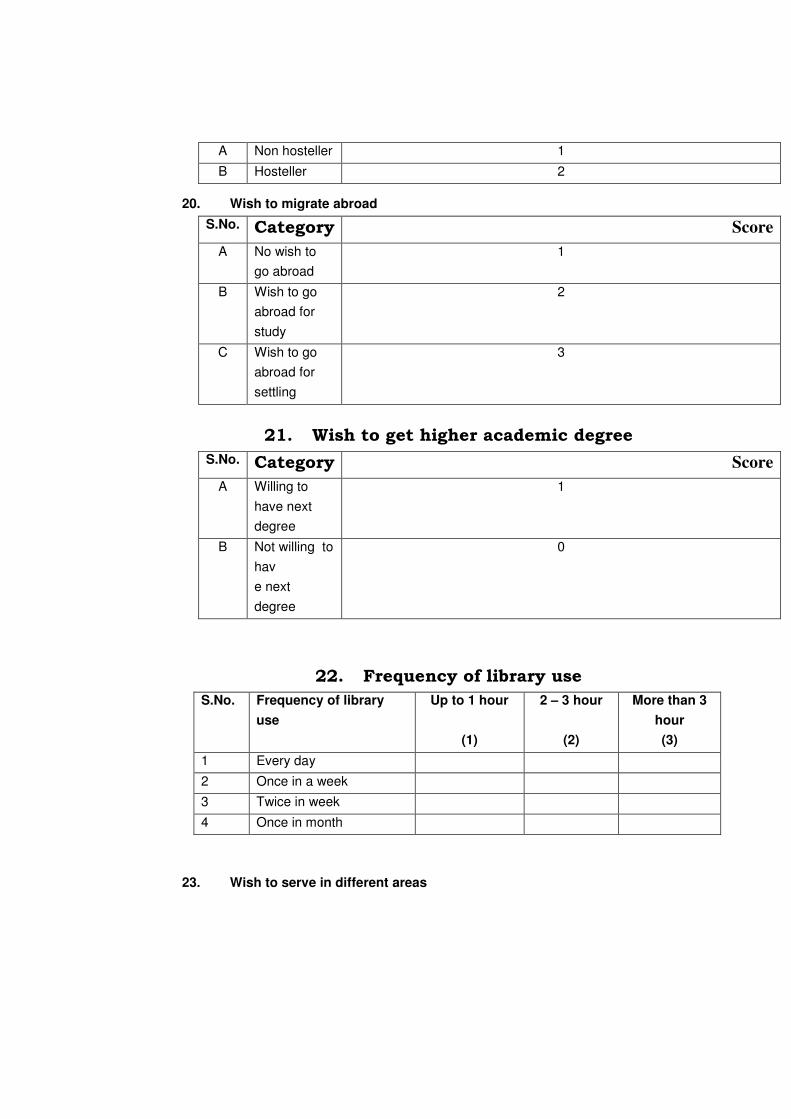
A Non hosteller 1
B Hosteller 2
20. Wish to migrate abroad
S.No. Category Score
A No wish to
go abroad
1
B Wish to go
abroad for
study
2
C Wish to go
abroad for
settling
3
21. Wish to get higher academic degree
S.No. Category Score
A Willing to
have next
degree
1
B Not willing to
hav
e next
degree
0
22. Frequency of library use
S.No. Frequency of library
use
Up to 1 hour
(1)
2 – 3 hour
(2)
More than 3
hour
(3)
1 Every day
2 Once in a week
3 Twice in week
4 Once in month
23. Wish to serve in different areas
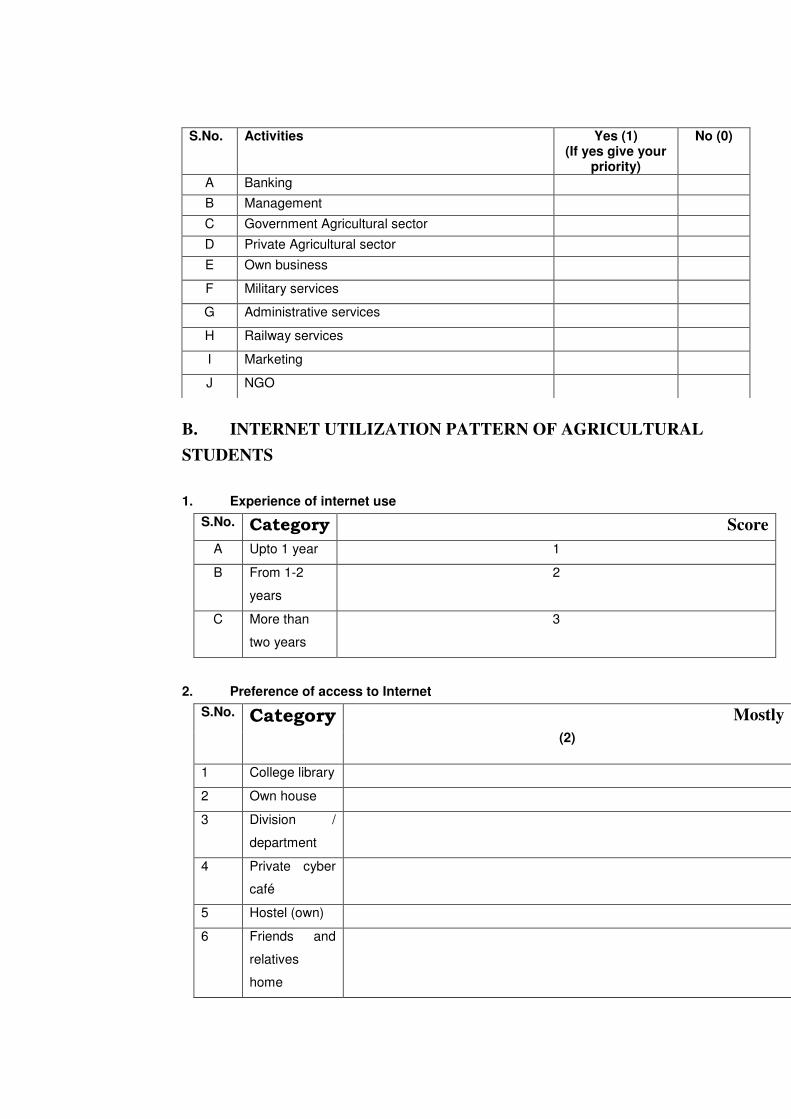
B. INTERNET UTILIZATION PATTERN OF AGRICULTURAL
STUDENTS
1. Experience of internet use
S.No. Category Score
A Upto 1 year 1
B From 1-2
years
2
C More than
two years
3
2. Preference of access to Internet
S.No. Category Mostly
(2)
1 College library
2 Own house
3 Division /
department
4 Private cyber
café
5 Hostel (own)
6 Friends and
relatives
home
S.No. Activities Yes (1) (If yes give your
priority)
No (0)
A Banking
B Management
C Government Agricultural sector
D Private Agricultural sector
E Own business
F Military services
G Administrative services
H Railway services
I Marketing
J NGO
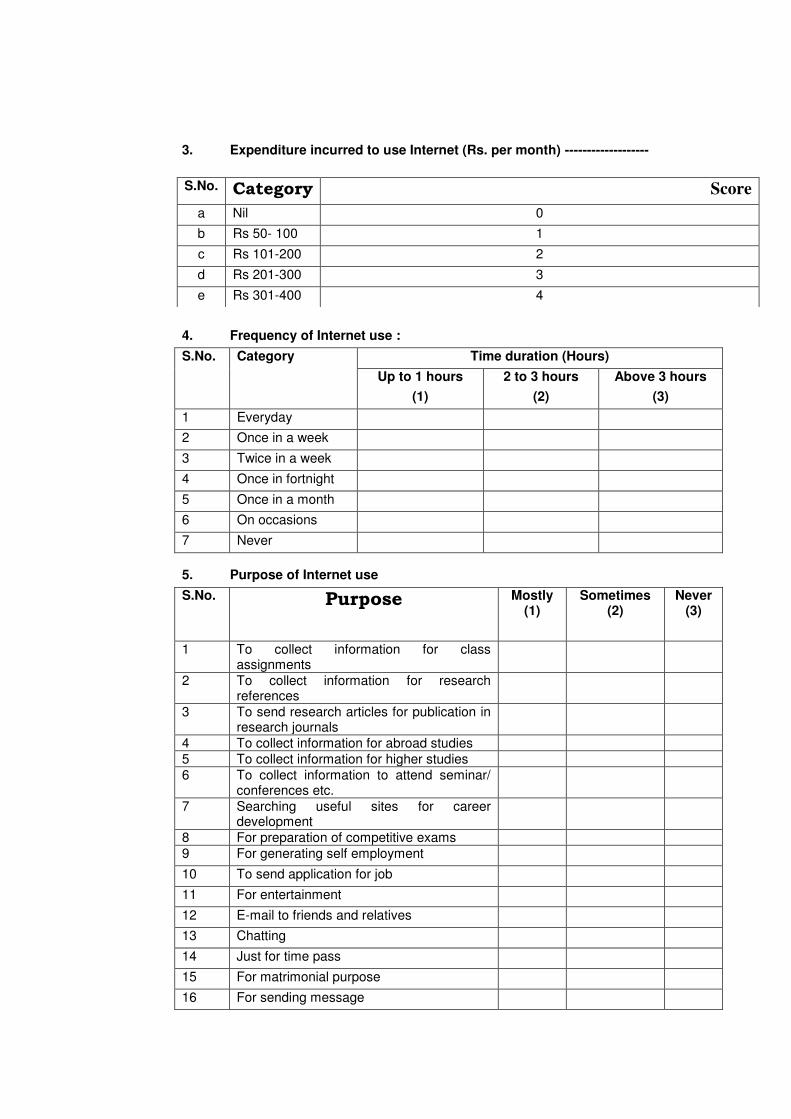
3. Expenditure incurred to use Internet (Rs. per month) -------------------
4. Frequency of Internet use :
S.No. Category Time duration (Hours)
Up to 1 hours
(1)
2 to 3 hours
(2)
Above 3 hours
(3)
1 Everyday
2 Once in a week
3 Twice in a week
4 Once in fortnight
5 Once in a month
6 On occasions
7 Never
5. Purpose of Internet use
S.No. Purpose Mostly (1)
Sometimes (2)
Never (3)
1 To collect information for class assignments
2 To collect information for research references
3 To send research articles for publication in research journals
4 To collect information for abroad studies 5 To collect information for higher studies 6 To collect information to attend seminar/
conferences etc.
7 Searching useful sites for career development
8 For preparation of competitive exams 9 For generating self employment
10 To send application for job
11 For entertainment
12 E-mail to friends and relatives
13 Chatting
14 Just for time pass
15 For matrimonial purpose
16 For sending message
S.No. Category Score
a Nil 0
b Rs 50- 100 1
c Rs 101-200 2
d Rs 201-300 3
e Rs 301-400 4
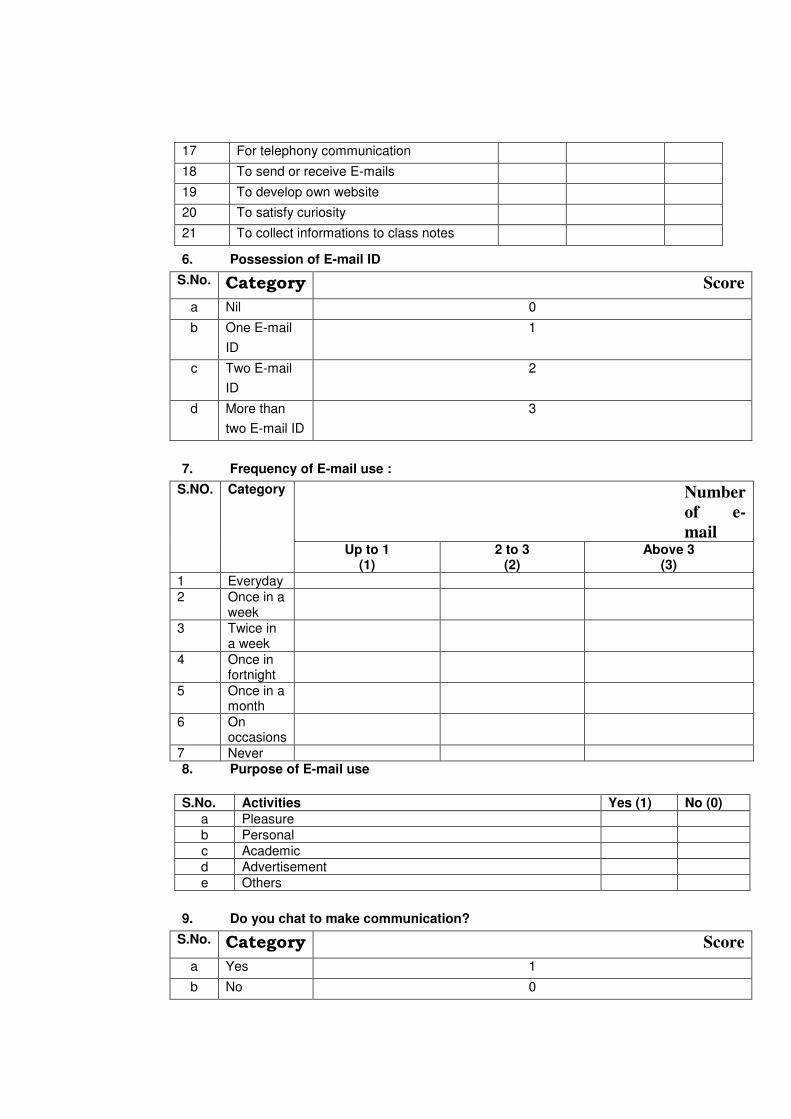
17 For telephony communication
18 To send or receive E-mails
19 To develop own website
20 To satisfy curiosity
21 To collect informations to class notes
6. Possession of E-mail ID
S.No. Category Score
a Nil 0
b One E-mail
ID
1
c Two E-mail
ID
2
d More than
two E-mail ID
3
7. Frequency of E-mail use :
S.NO. Category Number
of e-
mail Up to 1
(1) 2 to 3
(2) Above 3
(3) 1 Everyday 2 Once in a
week
3 Twice in a week
4 Once in fortnight
5 Once in a month
6 On occasions
7 Never 8. Purpose of E-mail use
9. Do you chat to make communication?
S.No. Category Score
a Yes 1
b No 0
S.No. Activities Yes (1) No (0) a Pleasure b Personal c Academic d Advertisement e Others
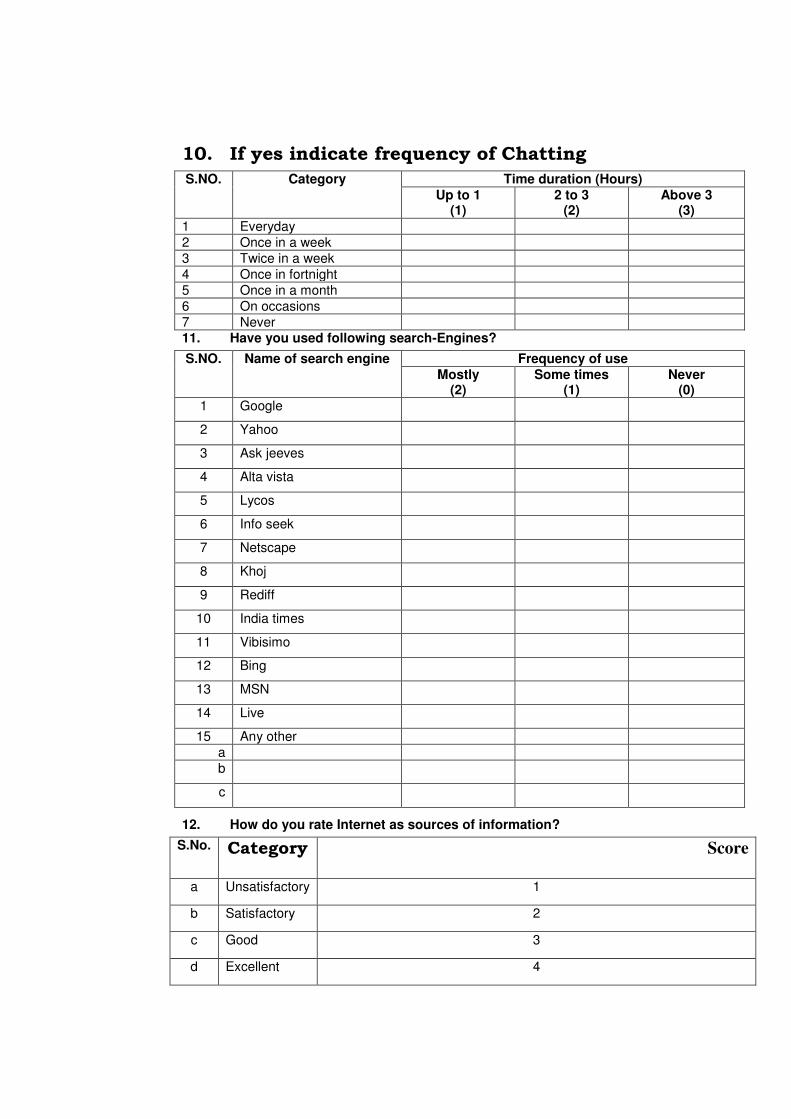
10. If yes indicate frequency of Chatting
S.NO. Category Time duration (Hours) Up to 1
(1) 2 to 3
(2) Above 3
(3) 1 Everyday 2 Once in a week 3 Twice in a week 4 Once in fortnight 5 Once in a month 6 On occasions 7 Never 11. Have you used following search-Engines?
S.NO. Name of search engine Frequency of use Mostly
(2) Some times
(1) Never
(0) 1 Google
2 Yahoo
3 Ask jeeves
4 Alta vista
5 Lycos
6 Info seek
7 Netscape
8 Khoj
9 Rediff
10 India times
11 Vibisimo
12 Bing
13 MSN
14 Live
15 Any other a b
c
12. How do you rate Internet as sources of information?
S.No. Category Score
a Unsatisfactory 1
b Satisfactory 2
c Good 3
d Excellent 4
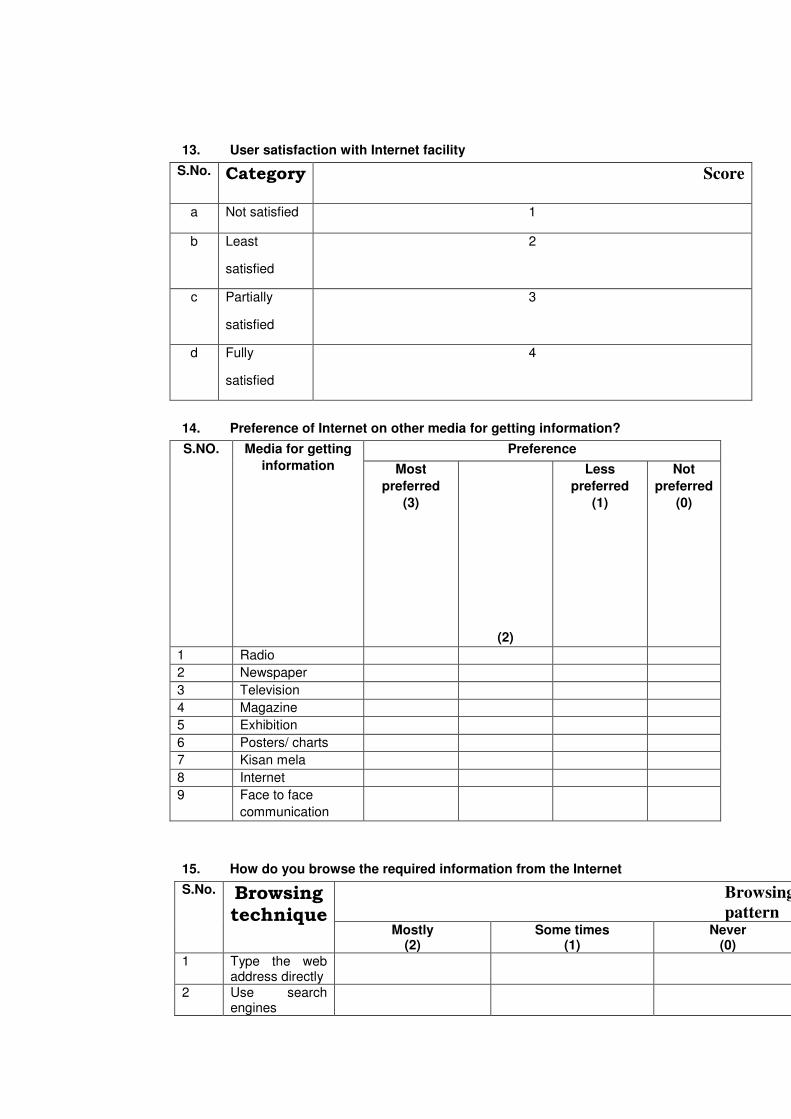
13. User satisfaction with Internet facility
S.No. Category Score
a Not satisfied 1
b Least
satisfied
2
c Partially
satisfied
3
d Fully
satisfied
4
14. Preference of Internet on other media for getting information?
S.NO.
Media for getting
information
Preference
Most
preferred
(3)
(2)
Less
preferred
(1)
Not
preferred
(0)
1 Radio
2 Newspaper
3 Television
4 Magazine
5 Exhibition
6 Posters/ charts
7 Kisan mela
8 Internet
9 Face to face
communication
15. How do you browse the required information from the Internet
S.No. Browsing technique
Browsing
pattern Mostly
(2) Some times
(1) Never
(0) 1 Type the web
address directly
2 Use search engines
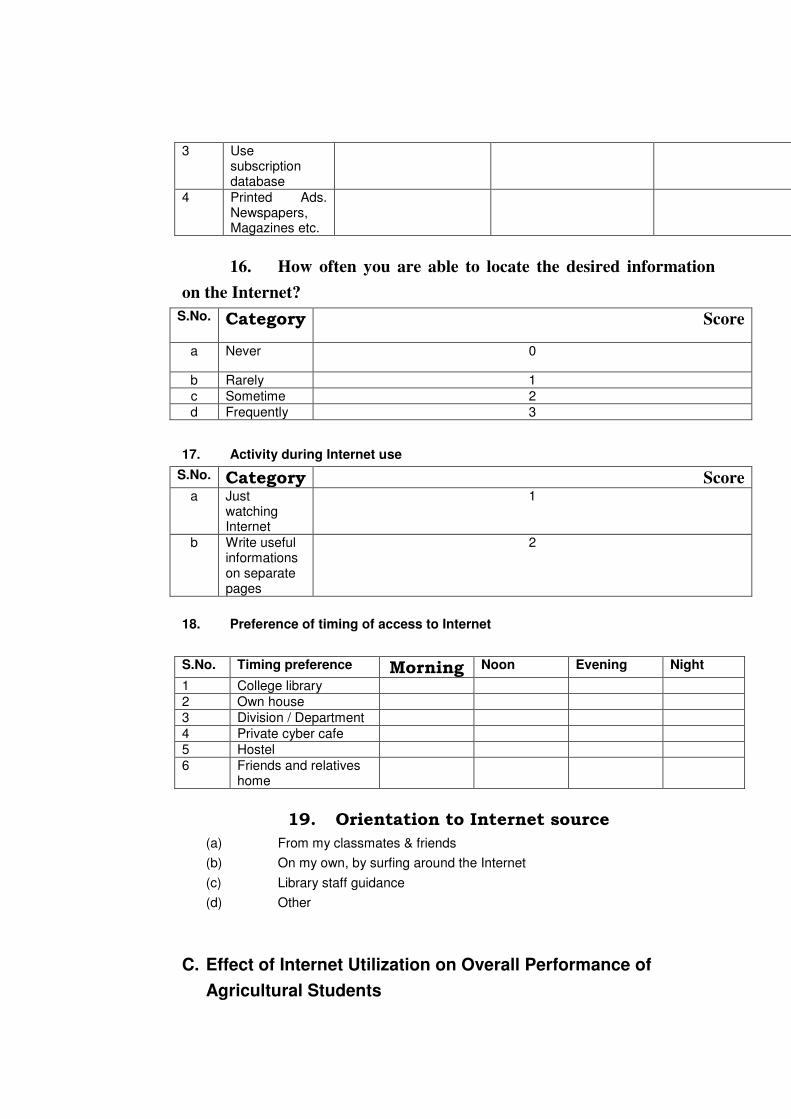
3 Use subscription database
4 Printed Ads. Newspapers, Magazines etc.
16. How often you are able to locate the desired information
on the Internet?
S.No. Category Score
a Never 0
b Rarely 1 c Sometime 2 d Frequently 3
17. Activity during Internet use
S.No. Category Score a Just
watching Internet
1
b Write useful informations on separate pages
2
18. Preference of timing of access to Internet
S.No. Timing preference Morning Noon Evening Night
1 College library 2 Own house 3 Division / Department 4 Private cyber cafe 5 Hostel 6 Friends and relatives
home
19. Orientation to Internet source
(a) From my classmates & friends
(b) On my own, by surfing around the Internet
(c) Library staff guidance
(d) Other
C. Effect of Internet Utilization on Overall Performance of
Agricultural Students
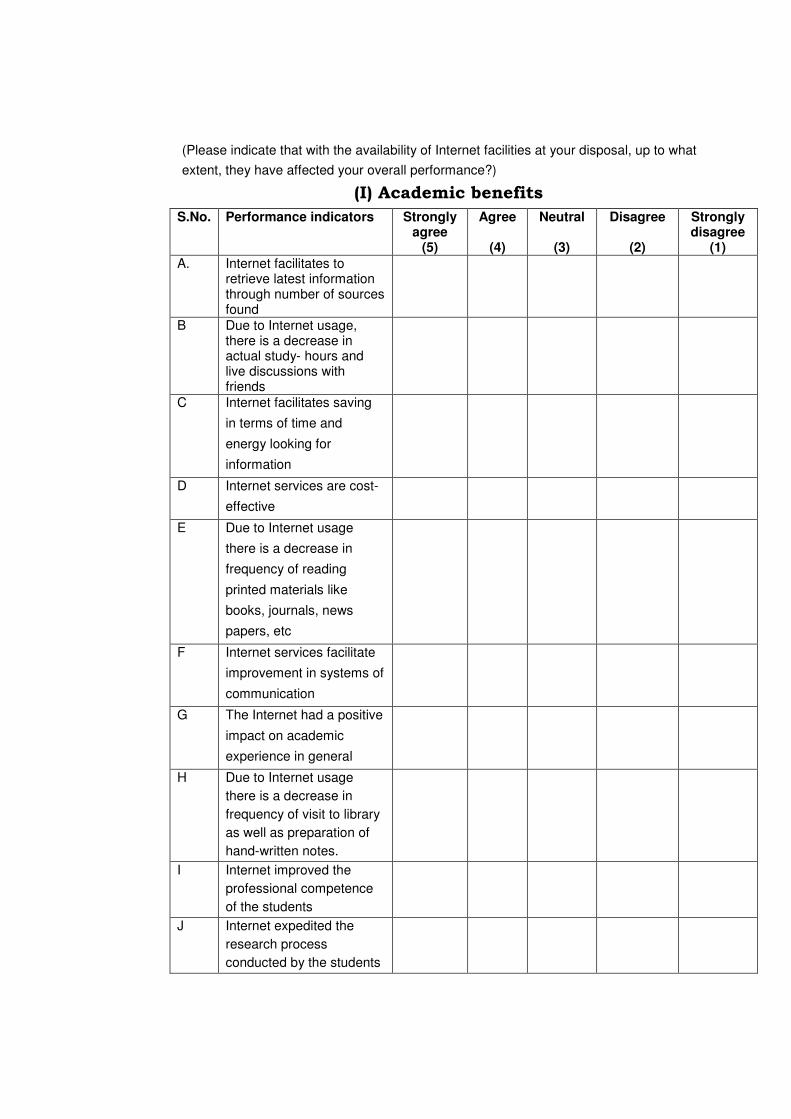
(Please indicate that with the availability of Internet facilities at your disposal, up to what
extent, they have affected your overall performance?)
(I) Academic benefits
S.No. Performance indicators Strongly agree
(5)
Agree
(4)
Neutral
(3)
Disagree
(2)
Strongly disagree
(1) A. Internet facilitates to
retrieve latest information through number of sources found
B Due to Internet usage, there is a decrease in actual study- hours and live discussions with friends
C Internet facilitates saving
in terms of time and
energy looking for
information
D Internet services are cost-
effective
E Due to Internet usage
there is a decrease in
frequency of reading
printed materials like
books, journals, news
papers, etc
F Internet services facilitate
improvement in systems of
communication
G The Internet had a positive
impact on academic
experience in general
H Due to Internet usage
there is a decrease in
frequency of visit to library
as well as preparation of
hand-written notes.
I Internet improved the
professional competence
of the students
J Internet expedited the
research process
conducted by the students
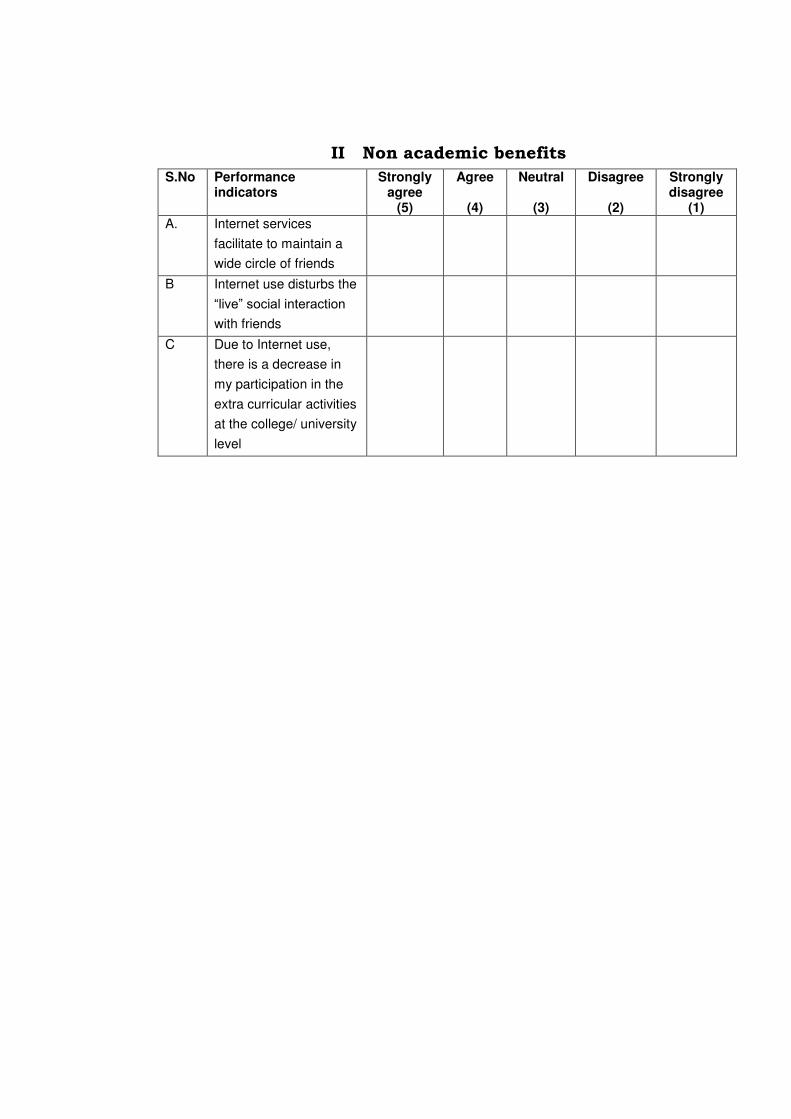
II Non academic benefits
S.No Performance indicators
Strongly agree
(5)
Agree
(4)
Neutral
(3)
Disagree
(2)
Strongly disagree
(1) A. Internet services
facilitate to maintain a
wide circle of friends
B Internet use disturbs the
“live” social interaction with friends
C Due to Internet use,
there is a decrease in
my participation in the
extra curricular activities
at the college/ university
level
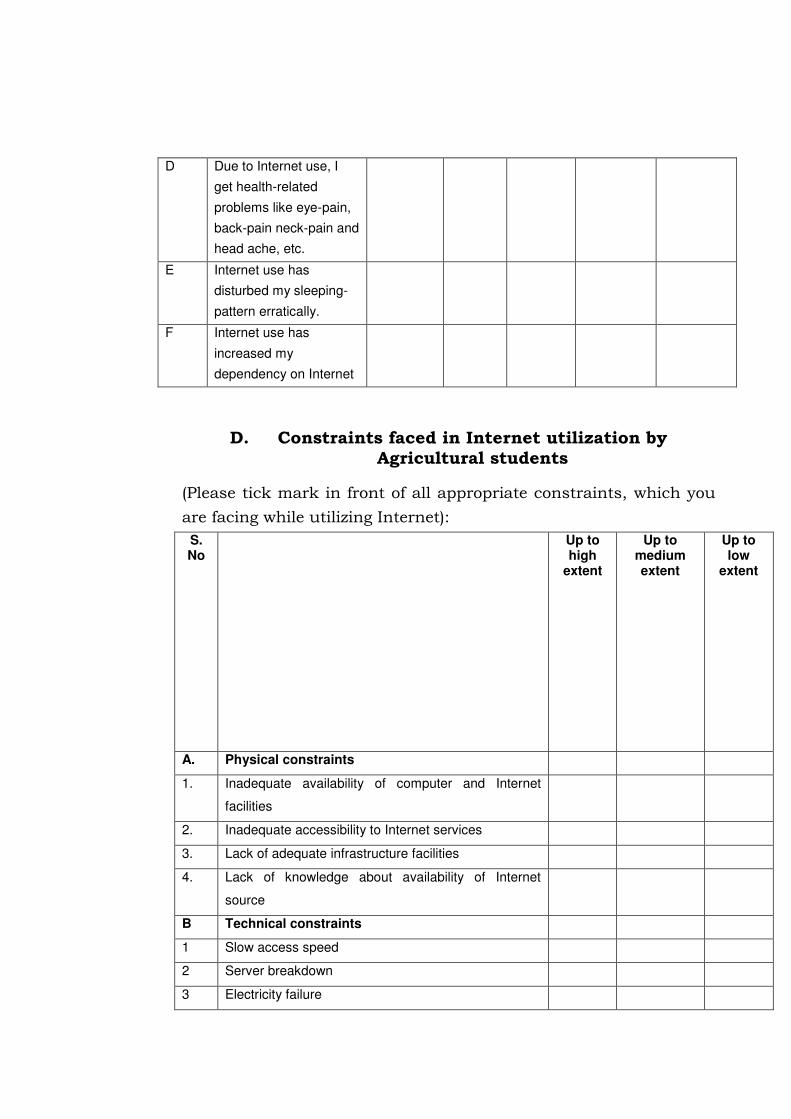
D Due to Internet use, I
get health-related
problems like eye-pain,
back-pain neck-pain and
head ache, etc.
E Internet use has
disturbed my sleeping-
pattern erratically.
F Internet use has
increased my
dependency on Internet
D. Constraints faced in Internet utilization by Agricultural students
(Please tick mark in front of all appropriate constraints, which you
are facing while utilizing Internet):
S. No
Up to high
extent
Up to medium extent
Up to low
extent
A. Physical constraints
1. Inadequate availability of computer and Internet
facilities
2. Inadequate accessibility to Internet services
3. Lack of adequate infrastructure facilities
4. Lack of knowledge about availability of Internet
source
B Technical constraints
1 Slow access speed
2 Server breakdown
3 Electricity failure
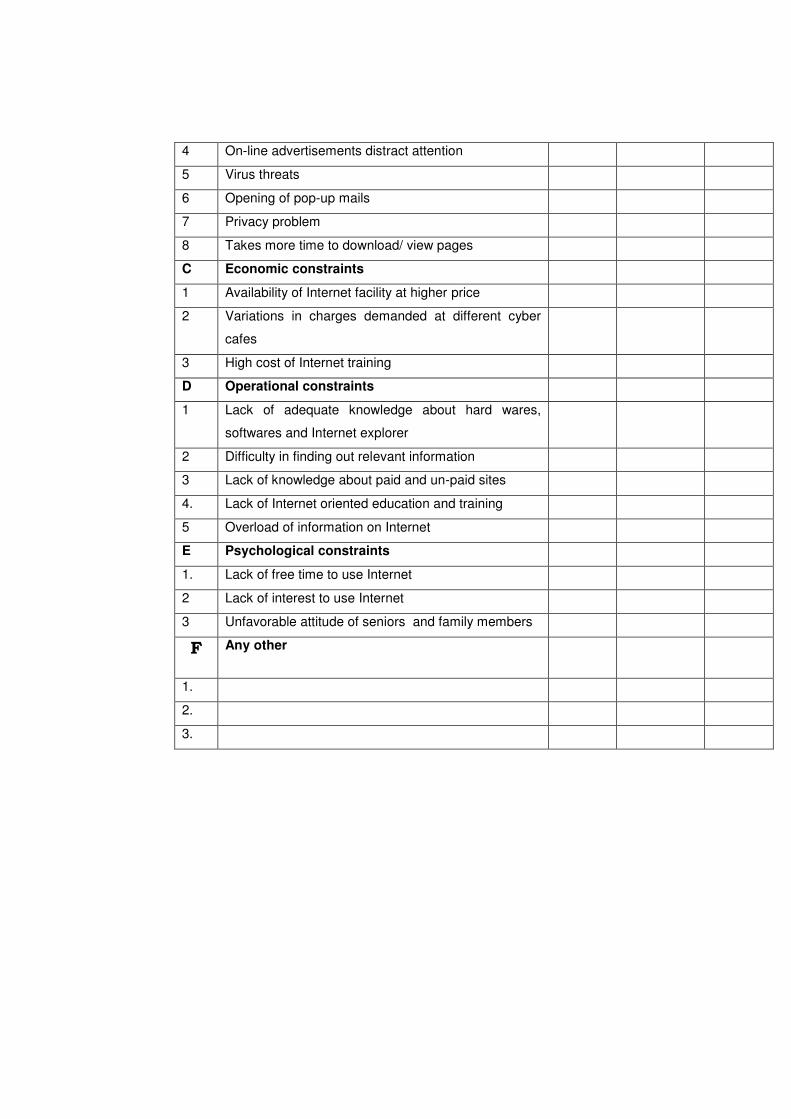
4 On-line advertisements distract attention
5 Virus threats
6 Opening of pop-up mails
7 Privacy problem
8 Takes more time to download/ view pages
C Economic constraints
1 Availability of Internet facility at higher price
2 Variations in charges demanded at different cyber
cafes
3 High cost of Internet training
D Operational constraints
1 Lack of adequate knowledge about hard wares,
softwares and Internet explorer
2 Difficulty in finding out relevant information
3 Lack of knowledge about paid and un-paid sites
4. Lack of Internet oriented education and training
5 Overload of information on Internet
E Psychological constraints
1. Lack of free time to use Internet
2 Lack of interest to use Internet
3 Unfavorable attitude of seniors and family members
F Any other
1.
2.
3.
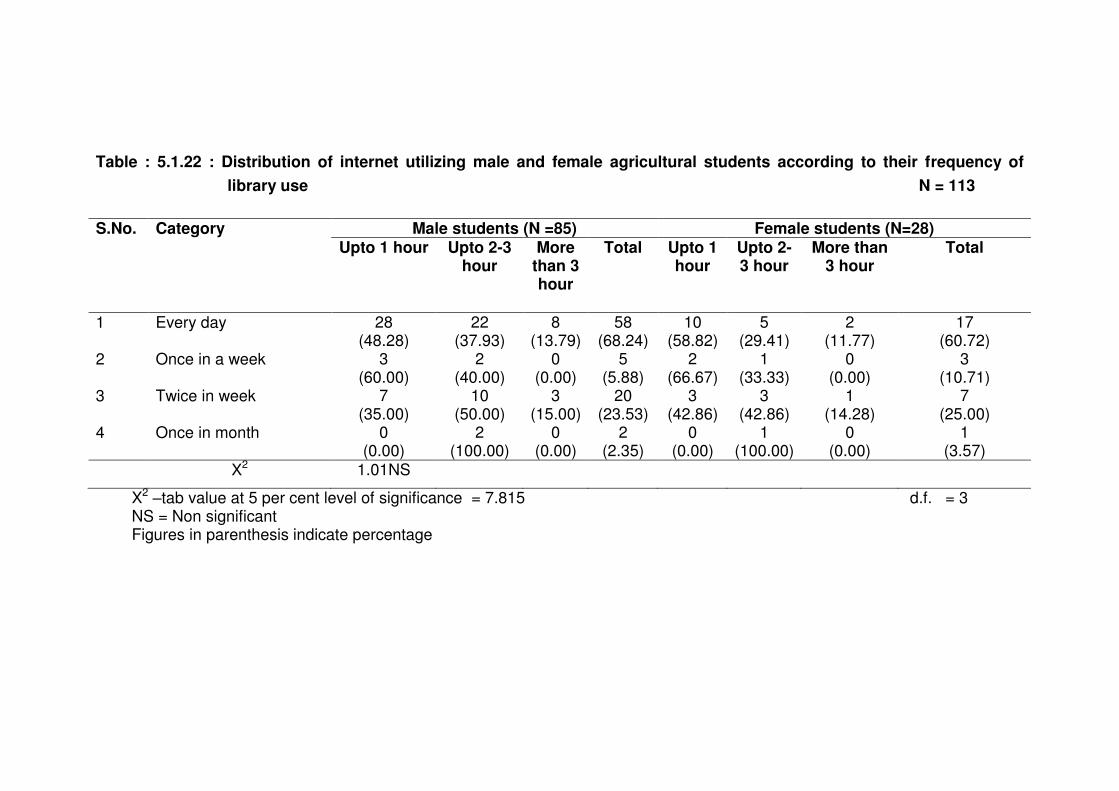
Table : 5.1.22 : Distribution of internet utilizing male and female agricultural students according to their frequency of
library use N = 113
S.No. Category Male students (N =85) Female students (N=28)
Upto 1 hour Upto 2-3 hour
More than 3 hour
Total Upto 1 hour
Upto 2-3 hour
More than 3 hour
Total
1 Every day 28 (48.28)
22 (37.93)
8 (13.79)
58 (68.24)
10 (58.82)
5 (29.41)
2 (11.77)
17 (60.72)
2 Once in a week 3 (60.00)
2 (40.00)
0 (0.00)
5 (5.88)
2 (66.67)
1 (33.33)
0 (0.00)
3 (10.71)
3 Twice in week 7 (35.00)
10 (50.00)
3 (15.00)
20 (23.53)
3 (42.86)
3 (42.86)
1 (14.28)
7 (25.00)
4 Once in month 0 (0.00)
2 (100.00)
0 (0.00)
2 (2.35)
0 (0.00)
1 (100.00)
0 (0.00)
1 (3.57)
X2 1.01NS
X2 –tab value at 5 per cent level of significance = 7.815 d.f. = 3 NS = Non significant Figures in parenthesis indicate percentage
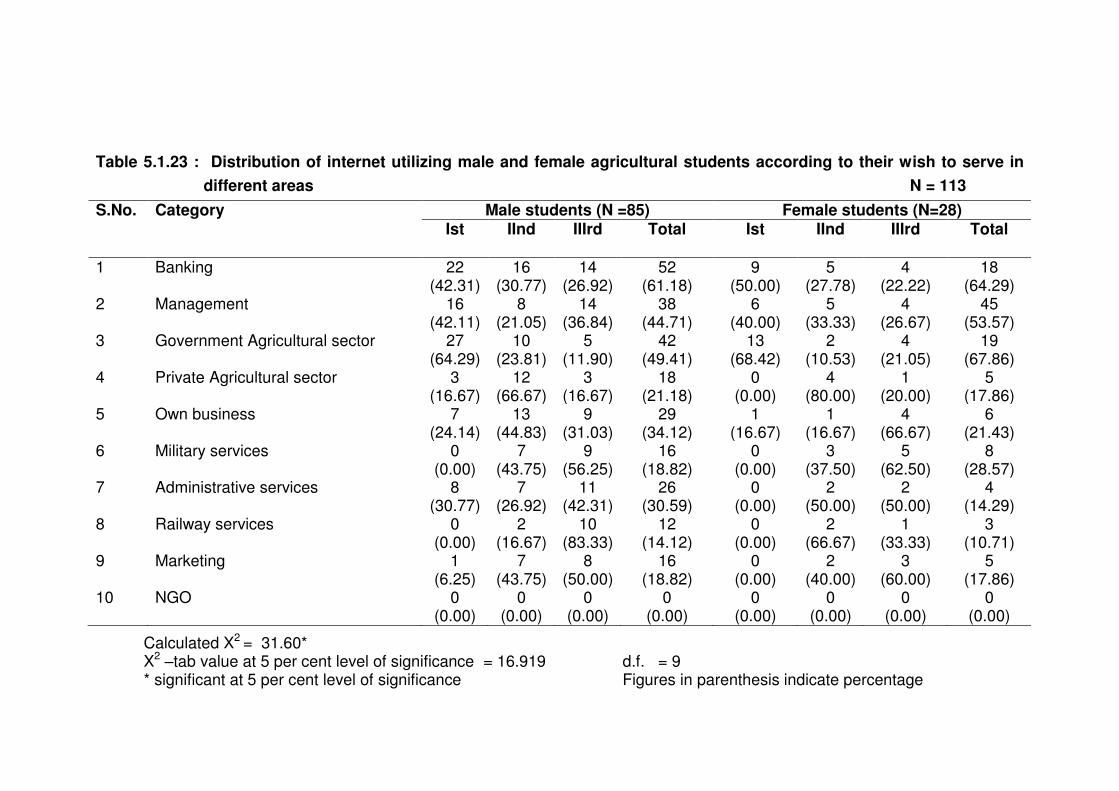
Table 5.1.23 : Distribution of internet utilizing male and female agricultural students according to their wish to serve in
different areas N = 113
S.No. Category Male students (N =85) Female students (N=28) Ist IInd IIIrd Total Ist IInd IIIrd Total
1 Banking 22 (42.31)
16 (30.77)
14 (26.92)
52 (61.18)
9 (50.00)
5 (27.78)
4 (22.22)
18 (64.29)
2 Management 16 (42.11)
8 (21.05)
14 (36.84)
38 (44.71)
6 (40.00)
5 (33.33)
4 (26.67)
45 (53.57)
3 Government Agricultural sector 27 (64.29)
10 (23.81)
5 (11.90)
42 (49.41)
13 (68.42)
2 (10.53)
4 (21.05)
19 (67.86)
4 Private Agricultural sector 3 (16.67)
12 (66.67)
3 (16.67)
18 (21.18)
0 (0.00)
4 (80.00)
1 (20.00)
5 (17.86)
5 Own business 7 (24.14)
13 (44.83)
9 (31.03)
29 (34.12)
1 (16.67)
1 (16.67)
4 (66.67)
6 (21.43)
6 Military services 0 (0.00)
7 (43.75)
9 (56.25)
16 (18.82)
0 (0.00)
3 (37.50)
5 (62.50)
8 (28.57)
7 Administrative services 8 (30.77)
7 (26.92)
11 (42.31)
26 (30.59)
0 (0.00)
2 (50.00)
2 (50.00)
4 (14.29)
8 Railway services 0 (0.00)
2 (16.67)
10 (83.33)
12 (14.12)
0 (0.00)
2 (66.67)
1 (33.33)
3 (10.71)
9 Marketing 1 (6.25)
7 (43.75)
8 (50.00)
16 (18.82)
0 (0.00)
2 (40.00)
3 (60.00)
5 (17.86)
10 NGO 0 (0.00)
0 (0.00)
0 (0.00)
0 (0.00)
0 (0.00)
0 (0.00)
0 (0.00)
0 (0.00)
Calculated X2 = 31.60* X2 –tab value at 5 per cent level of significance = 16.919 d.f. = 9 * significant at 5 per cent level of significance Figures in parenthesis indicate percentage
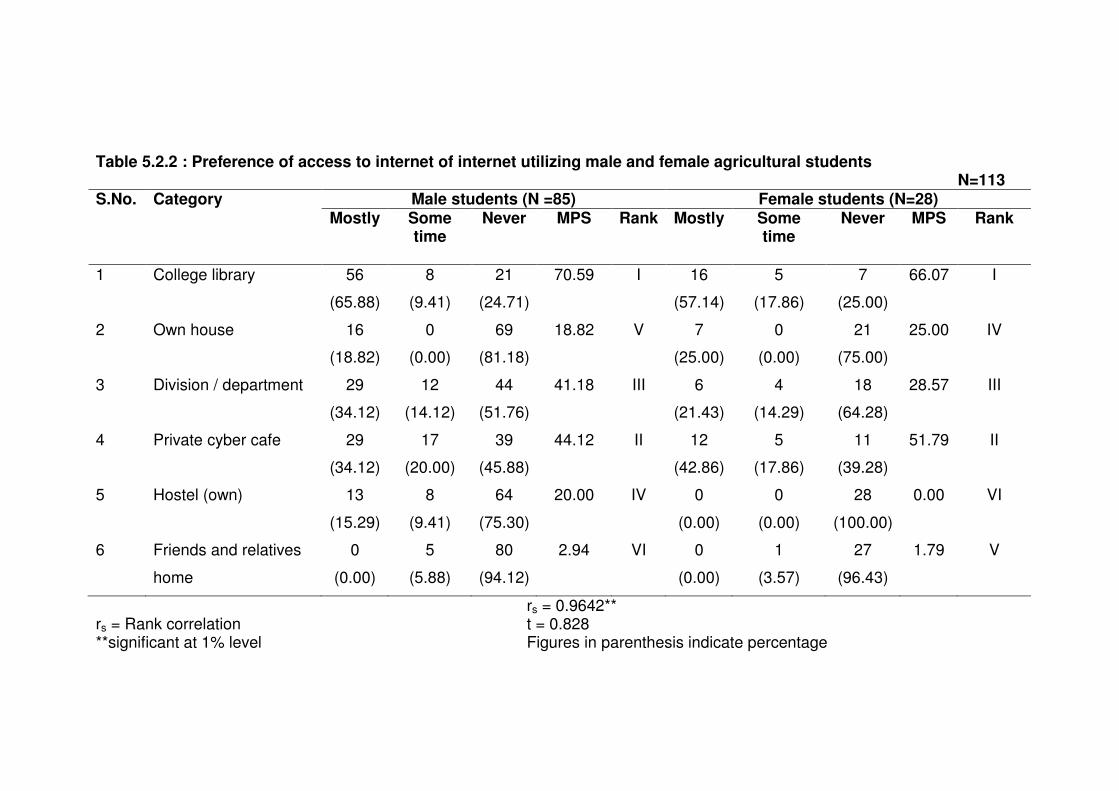
Table 5.2.2 : Preference of access to internet of internet utilizing male and female agricultural students N=113 S.No. Category Male students (N =85) Female students (N=28)
Mostly Some time
Never MPS Rank Mostly Some time
Never MPS Rank
1 College library 56
(65.88)
8
(9.41)
21
(24.71)
70.59 I 16
(57.14)
5
(17.86)
7
(25.00)
66.07 I
2 Own house 16
(18.82)
0
(0.00)
69
(81.18)
18.82 V 7
(25.00)
0
(0.00)
21
(75.00)
25.00 IV
3 Division / department 29
(34.12)
12
(14.12)
44
(51.76)
41.18 III 6
(21.43)
4
(14.29)
18
(64.28)
28.57 III
4 Private cyber cafe 29
(34.12)
17
(20.00)
39
(45.88)
44.12 II 12
(42.86)
5
(17.86)
11
(39.28)
51.79 II
5 Hostel (own) 13
(15.29)
8
(9.41)
64
(75.30)
20.00 IV 0
(0.00)
0
(0.00)
28
(100.00)
0.00 VI
6 Friends and relatives
home
0
(0.00)
5
(5.88)
80
(94.12)
2.94 VI 0
(0.00)
1
(3.57)
27
(96.43)
1.79 V
rs = 0.9642** rs = Rank correlation t = 0.828 **significant at 1% level Figures in parenthesis indicate percentage
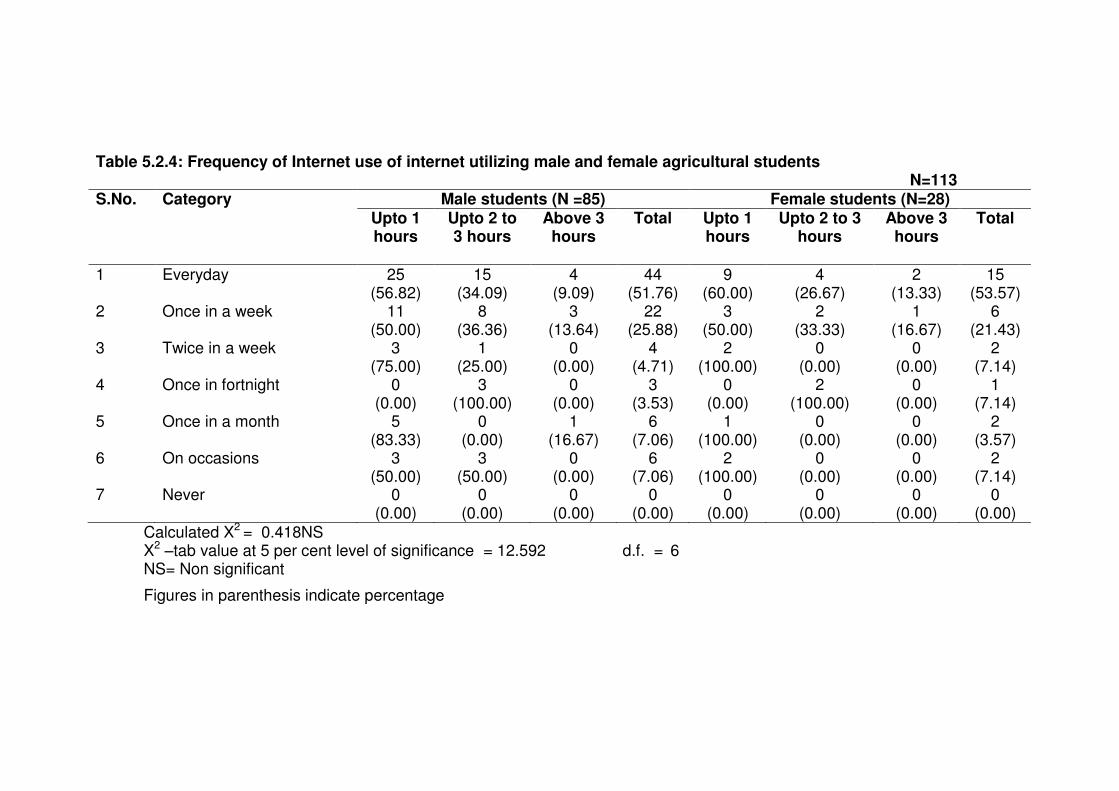
Table 5.2.4: Frequency of Internet use of internet utilizing male and female agricultural students N=113 S.No. Category Male students (N =85) Female students (N=28)
Upto 1 hours
Upto 2 to 3 hours
Above 3 hours
Total Upto 1 hours
Upto 2 to 3 hours
Above 3 hours
Total
1 Everyday 25 (56.82)
15 (34.09)
4 (9.09)
44 (51.76)
9 (60.00)
4 (26.67)
2 (13.33)
15 (53.57)
2 Once in a week 11 (50.00)
8 (36.36)
3 (13.64)
22 (25.88)
3 (50.00)
2 (33.33)
1 (16.67)
6 (21.43)
3 Twice in a week 3 (75.00)
1 (25.00)
0 (0.00)
4 (4.71)
2 (100.00)
0 (0.00)
0 (0.00)
2 (7.14)
4 Once in fortnight 0 (0.00)
3 (100.00)
0 (0.00)
3 (3.53)
0 (0.00)
2 (100.00)
0 (0.00)
1 (7.14)
5 Once in a month 5 (83.33)
0 (0.00)
1 (16.67)
6 (7.06)
1 (100.00)
0 (0.00)
0 (0.00)
2 (3.57)
6 On occasions 3 (50.00)
3 (50.00)
0 (0.00)
6 (7.06)
2 (100.00)
0 (0.00)
0 (0.00)
2 (7.14)
7 Never 0 (0.00)
0 (0.00)
0 (0.00)
0 (0.00)
0 (0.00)
0 (0.00)
0 (0.00)
0 (0.00)
Calculated X2 = 0.418NS X2 –tab value at 5 per cent level of significance = 12.592 d.f. = 6 NS= Non significant
Figures in parenthesis indicate percentage
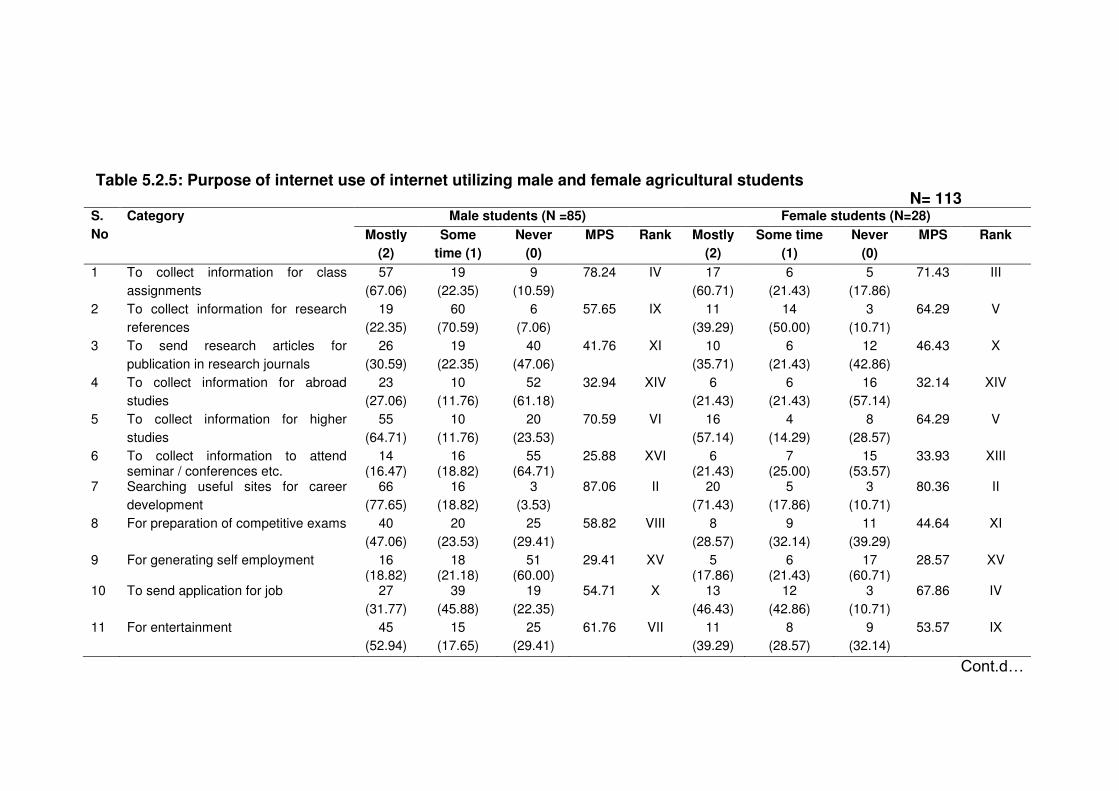
Table 5.2.5: Purpose of internet use of internet utilizing male and female agricultural students N= 113
S.
No
Category Male students (N =85) Female students (N=28)
Mostly
(2)
Some
time (1)
Never
(0)
MPS Rank Mostly
(2)
Some time
(1)
Never
(0)
MPS Rank
1 To collect information for class
assignments
57
(67.06)
19
(22.35)
9
(10.59)
78.24 IV 17
(60.71)
6
(21.43)
5
(17.86)
71.43 III
2 To collect information for research
references
19
(22.35)
60
(70.59)
6
(7.06)
57.65 IX 11
(39.29)
14
(50.00)
3
(10.71)
64.29 V
3 To send research articles for
publication in research journals
26
(30.59)
19
(22.35)
40
(47.06)
41.76 XI 10
(35.71)
6
(21.43)
12
(42.86)
46.43 X
4 To collect information for abroad
studies
23
(27.06)
10
(11.76)
52
(61.18)
32.94 XIV 6
(21.43)
6
(21.43)
16
(57.14)
32.14 XIV
5 To collect information for higher
studies
55
(64.71)
10
(11.76)
20
(23.53)
70.59 VI 16
(57.14)
4
(14.29)
8
(28.57)
64.29 V
6 To collect information to attend seminar / conferences etc.
14 (16.47)
16 (18.82)
55 (64.71)
25.88 XVI 6 (21.43)
7 (25.00)
15 (53.57)
33.93 XIII
7 Searching useful sites for career
development
66
(77.65)
16
(18.82)
3
(3.53)
87.06 II 20
(71.43)
5
(17.86)
3
(10.71)
80.36 II
8 For preparation of competitive exams 40
(47.06)
20
(23.53)
25
(29.41)
58.82 VIII 8
(28.57)
9
(32.14)
11
(39.29)
44.64 XI
9 For generating self employment 16 (18.82)
18 (21.18)
51 (60.00)
29.41 XV 5 (17.86)
6 (21.43)
17 (60.71)
28.57 XV
10 To send application for job 27
(31.77)
39
(45.88)
19
(22.35)
54.71 X 13
(46.43)
12
(42.86)
3
(10.71)
67.86 IV
11 For entertainment 45
(52.94)
15
(17.65)
25
(29.41)
61.76 VII 11
(39.29)
8
(28.57)
9
(32.14)
53.57 IX
Cont.d…
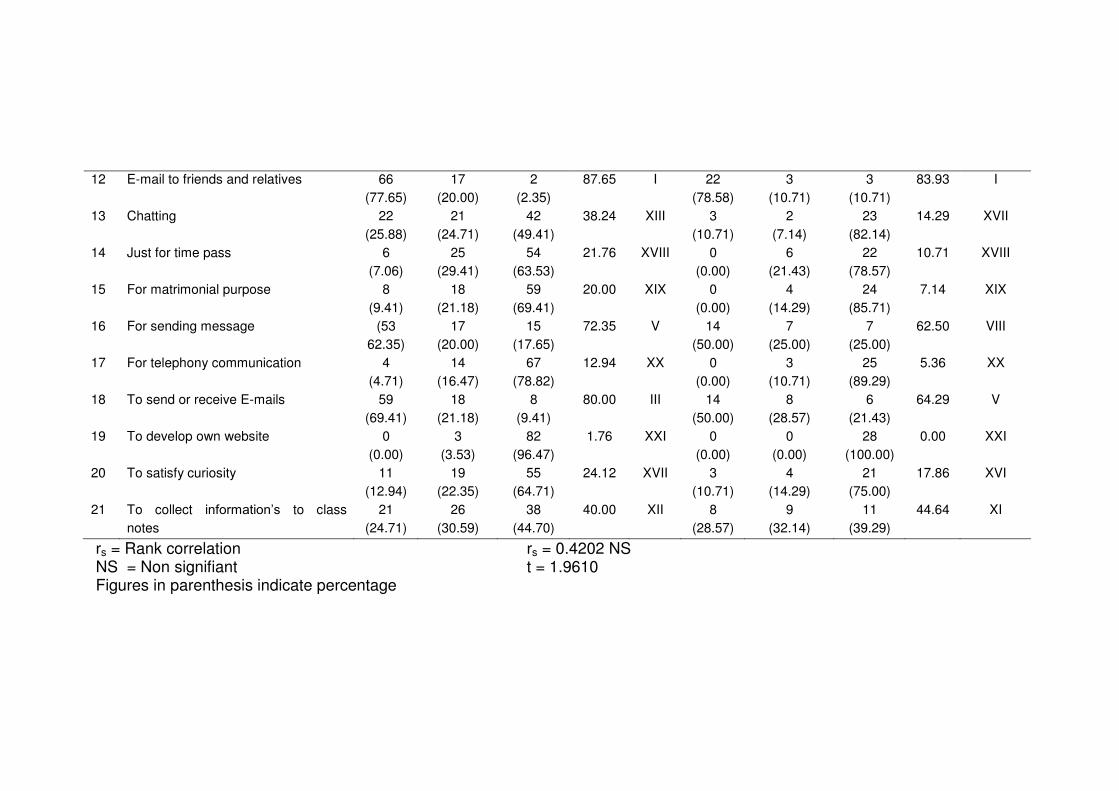
12 E-mail to friends and relatives 66
(77.65)
17
(20.00)
2
(2.35)
87.65 I 22
(78.58)
3
(10.71)
3
(10.71)
83.93 I
13 Chatting 22
(25.88)
21
(24.71)
42
(49.41)
38.24 XIII 3
(10.71)
2
(7.14)
23
(82.14)
14.29 XVII
14 Just for time pass 6
(7.06)
25
(29.41)
54
(63.53)
21.76 XVIII 0
(0.00)
6
(21.43)
22
(78.57)
10.71 XVIII
15 For matrimonial purpose 8
(9.41)
18
(21.18)
59
(69.41)
20.00 XIX 0
(0.00)
4
(14.29)
24
(85.71)
7.14 XIX
16 For sending message (53
62.35)
17
(20.00)
15
(17.65)
72.35 V 14
(50.00)
7
(25.00)
7
(25.00)
62.50 VIII
17 For telephony communication 4
(4.71)
14
(16.47)
67
(78.82)
12.94 XX 0
(0.00)
3
(10.71)
25
(89.29)
5.36 XX
18 To send or receive E-mails 59
(69.41)
18
(21.18)
8
(9.41)
80.00 III 14
(50.00)
8
(28.57)
6
(21.43)
64.29 V
19 To develop own website 0
(0.00)
3
(3.53)
82
(96.47)
1.76 XXI 0
(0.00)
0
(0.00)
28
(100.00)
0.00 XXI
20 To satisfy curiosity 11
(12.94)
19
(22.35)
55
(64.71)
24.12 XVII 3
(10.71)
4
(14.29)
21
(75.00)
17.86 XVI
21 To collect information’s to class
notes
21
(24.71)
26
(30.59)
38
(44.70)
40.00 XII 8
(28.57)
9
(32.14)
11
(39.29)
44.64 XI
rs = Rank correlation rs = 0.4202 NS NS = Non signifiant t = 1.9610 Figures in parenthesis indicate percentage
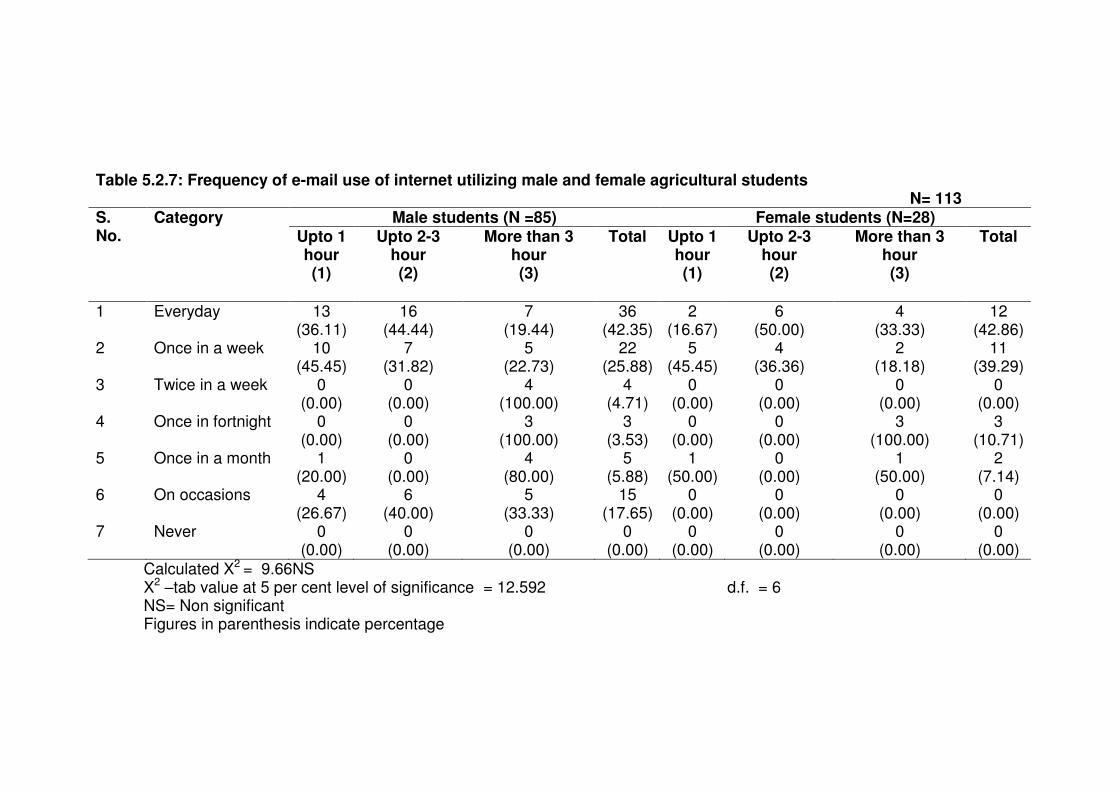
Table 5.2.7: Frequency of e-mail use of internet utilizing male and female agricultural students N= 113 S. No.
Category Male students (N =85) Female students (N=28) Upto 1 hour (1)
Upto 2-3 hour (2)
More than 3 hour (3)
Total Upto 1 hour (1)
Upto 2-3 hour (2)
More than 3 hour (3)
Total
1 Everyday 13 (36.11)
16 (44.44)
7 (19.44)
36 (42.35)
2 (16.67)
6 (50.00)
4 (33.33)
12 (42.86)
2 Once in a week 10 (45.45)
7 (31.82)
5 (22.73)
22 (25.88)
5 (45.45)
4 (36.36)
2 (18.18)
11 (39.29)
3 Twice in a week 0 (0.00)
0 (0.00)
4 (100.00)
4 (4.71)
0 (0.00)
0 (0.00)
0 (0.00)
0 (0.00)
4 Once in fortnight 0 (0.00)
0 (0.00)
3 (100.00)
3 (3.53)
0 (0.00)
0 (0.00)
3 (100.00)
3 (10.71)
5 Once in a month 1 (20.00)
0 (0.00)
4 (80.00)
5 (5.88)
1 (50.00)
0 (0.00)
1 (50.00)
2 (7.14)
6 On occasions 4 (26.67)
6 (40.00)
5 (33.33)
15 (17.65)
0 (0.00)
0 (0.00)
0 (0.00)
0 (0.00)
7 Never 0 (0.00)
0 (0.00)
0 (0.00)
0 (0.00)
0 (0.00)
0 (0.00)
0 (0.00)
0 (0.00)
Calculated X2 = 9.66NS X2 –tab value at 5 per cent level of significance = 12.592 d.f. = 6 NS= Non significant Figures in parenthesis indicate percentage
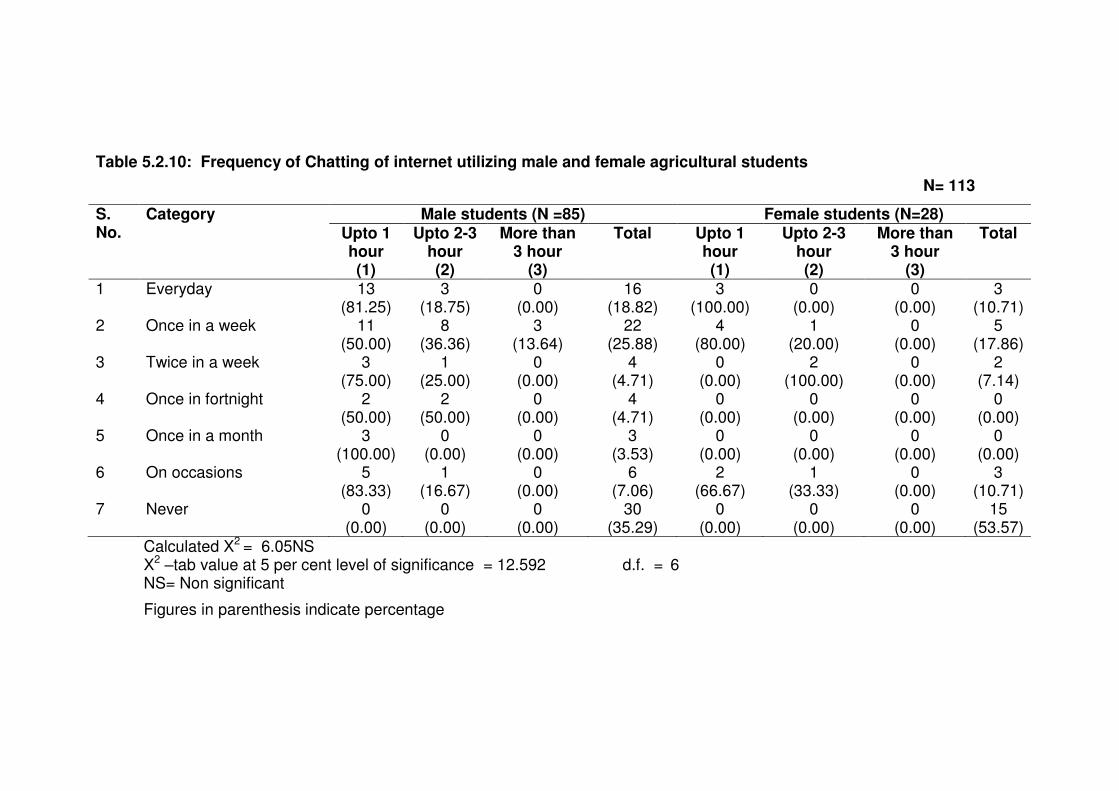
Table 5.2.10: Frequency of Chatting of internet utilizing male and female agricultural students
N= 113
S. No.
Category Male students (N =85) Female students (N=28) Upto 1 hour (1)
Upto 2-3 hour (2)
More than 3 hour
(3)
Total Upto 1 hour (1)
Upto 2-3 hour (2)
More than 3 hour
(3)
Total
1 Everyday 13 (81.25)
3 (18.75)
0 (0.00)
16 (18.82)
3 (100.00)
0 (0.00)
0 (0.00)
3 (10.71)
2 Once in a week 11 (50.00)
8 (36.36)
3 (13.64)
22 (25.88)
4 (80.00)
1 (20.00)
0 (0.00)
5 (17.86)
3 Twice in a week 3 (75.00)
1 (25.00)
0 (0.00)
4 (4.71)
0 (0.00)
2 (100.00)
0 (0.00)
2 (7.14)
4 Once in fortnight 2 (50.00)
2 (50.00)
0 (0.00)
4 (4.71)
0 (0.00)
0 (0.00)
0 (0.00)
0 (0.00)
5 Once in a month 3 (100.00)
0 (0.00)
0 (0.00)
3 (3.53)
0 (0.00)
0 (0.00)
0 (0.00)
0 (0.00)
6 On occasions 5 (83.33)
1 (16.67)
0 (0.00)
6 (7.06)
2 (66.67)
1 (33.33)
0 (0.00)
3 (10.71)
7 Never 0 (0.00)
0 (0.00)
0 (0.00)
30 (35.29)
0 (0.00)
0 (0.00)
0 (0.00)
15 (53.57)
Calculated X2 = 6.05NS X2 –tab value at 5 per cent level of significance = 12.592 d.f. = 6 NS= Non significant
Figures in parenthesis indicate percentage
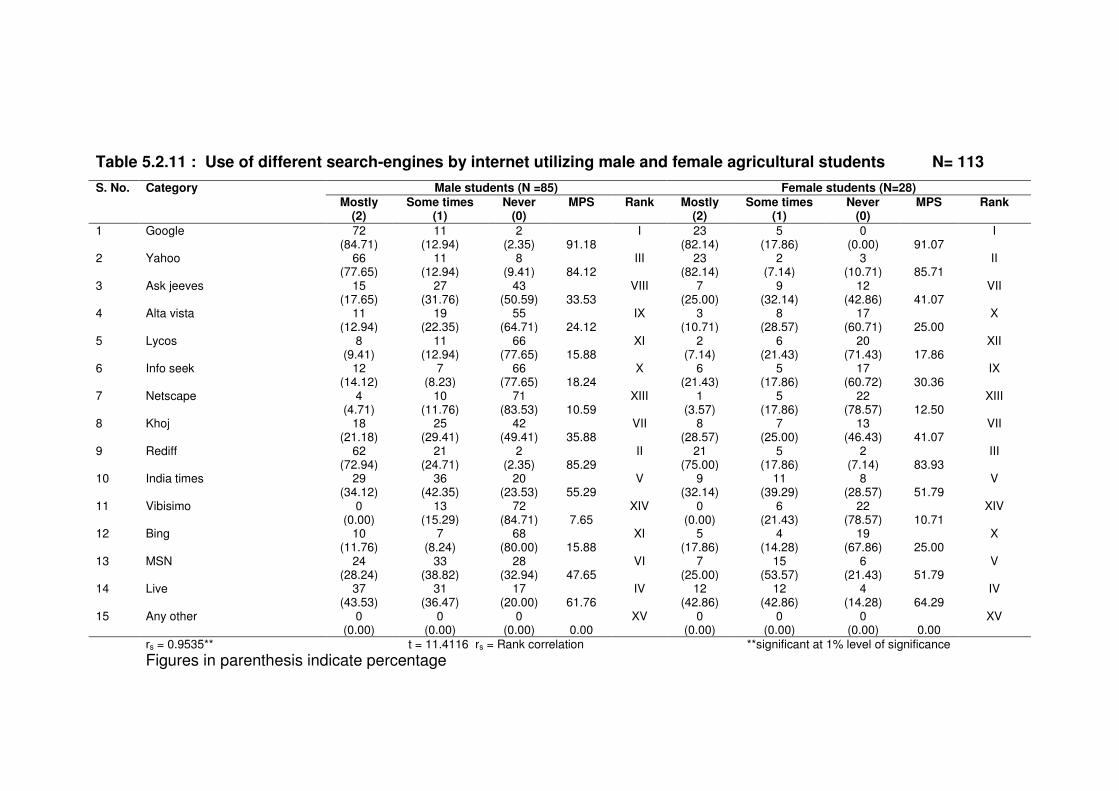
Table 5.2.11 : Use of different search-engines by internet utilizing male and female agricultural students N= 113
S. No. Category Male students (N =85) Female students (N=28)
Mostly (2)
Some times (1)
Never (0)
MPS Rank Mostly (2)
Some times (1)
Never (0)
MPS Rank
1 Google 72 (84.71)
11 (12.94)
2 (2.35) 91.18
I 23 (82.14)
5 (17.86)
0 (0.00) 91.07
I
2 Yahoo 66 (77.65)
11 (12.94)
8 (9.41) 84.12
III 23 (82.14)
2 (7.14)
3 (10.71) 85.71
II
3 Ask jeeves 15 (17.65)
27 (31.76)
43 (50.59) 33.53
VIII 7 (25.00)
9 (32.14)
12 (42.86) 41.07
VII
4 Alta vista 11 (12.94)
19 (22.35)
55 (64.71) 24.12
IX 3 (10.71)
8 (28.57)
17 (60.71) 25.00
X
5 Lycos 8 (9.41)
11 (12.94)
66 (77.65) 15.88
XI 2 (7.14)
6 (21.43)
20 (71.43) 17.86
XII
6 Info seek 12 (14.12)
7 (8.23)
66 (77.65) 18.24
X 6 (21.43)
5 (17.86)
17 (60.72) 30.36
IX
7 Netscape 4 (4.71)
10 (11.76)
71 (83.53) 10.59
XIII 1 (3.57)
5 (17.86)
22 (78.57) 12.50
XIII
8 Khoj 18 (21.18)
25 (29.41)
42 (49.41) 35.88
VII 8 (28.57)
7 (25.00)
13 (46.43) 41.07
VII
9 Rediff 62 (72.94)
21 (24.71)
2 (2.35) 85.29
II 21 (75.00)
5 (17.86)
2 (7.14) 83.93
III
10 India times 29 (34.12)
36 (42.35)
20 (23.53) 55.29
V 9 (32.14)
11 (39.29)
8 (28.57) 51.79
V
11 Vibisimo 0 (0.00)
13 (15.29)
72 (84.71) 7.65
XIV 0 (0.00)
6 (21.43)
22 (78.57) 10.71
XIV
12 Bing 10 (11.76)
7 (8.24)
68 (80.00) 15.88
XI 5 (17.86)
4 (14.28)
19 (67.86) 25.00
X
13 MSN 24 (28.24)
33 (38.82)
28 (32.94) 47.65
VI 7 (25.00)
15 (53.57)
6 (21.43) 51.79
V
14 Live 37 (43.53)
31 (36.47)
17 (20.00) 61.76
IV 12 (42.86)
12 (42.86)
4 (14.28) 64.29
IV
15 Any other 0 (0.00)
0 (0.00)
0 (0.00) 0.00
XV 0 (0.00)
0 (0.00)
0 (0.00) 0.00
XV
rs = 0.9535** t = 11.4116 rs = Rank correlation **significant at 1% level of significance Figures in parenthesis indicate percentage
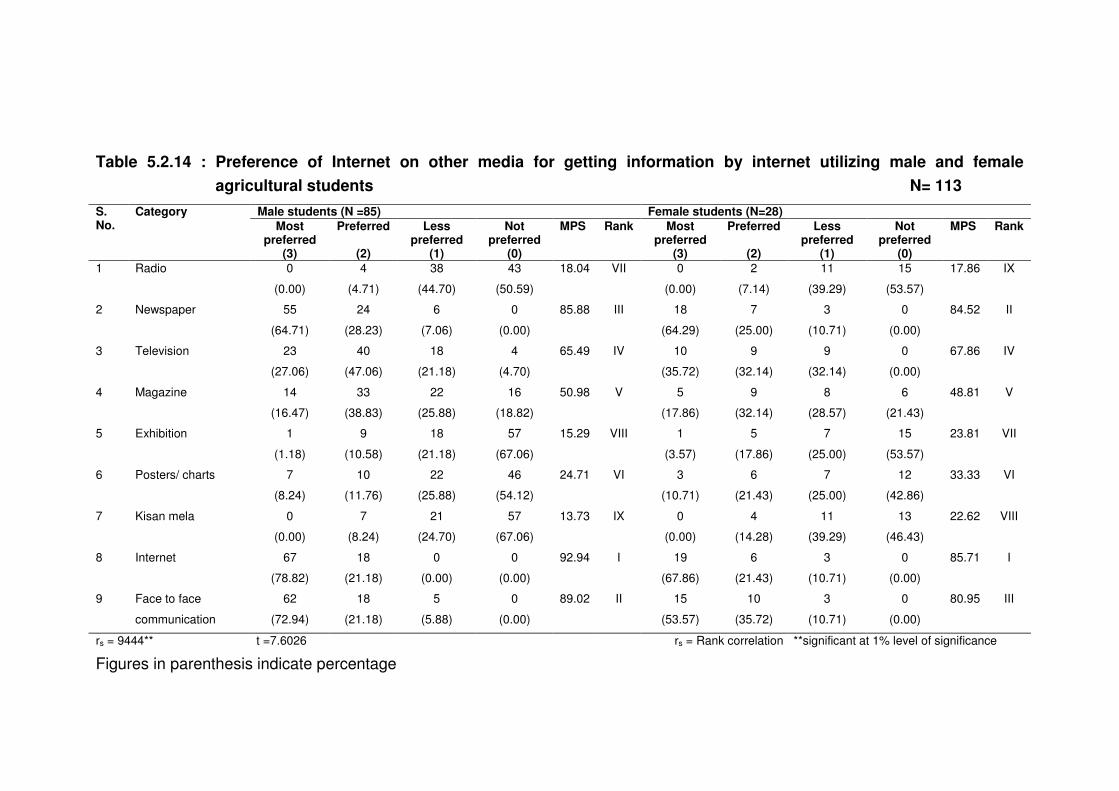
Table 5.2.14 : Preference of Internet on other media for getting information by internet utilizing male and female
agricultural students N= 113
S. No.
Category Male students (N =85) Female students (N=28)
Most preferred
(3)
Preferred
(2)
Less preferred
(1)
Not preferred
(0)
MPS Rank Most preferred
(3)
Preferred
(2)
Less preferred
(1)
Not preferred
(0)
MPS Rank
1 Radio 0
(0.00)
4
(4.71)
38
(44.70)
43
(50.59)
18.04 VII 0
(0.00)
2
(7.14)
11
(39.29)
15
(53.57)
17.86 IX
2 Newspaper 55
(64.71)
24
(28.23)
6
(7.06)
0
(0.00)
85.88 III 18
(64.29)
7
(25.00)
3
(10.71)
0
(0.00)
84.52 II
3 Television 23
(27.06)
40
(47.06)
18
(21.18)
4
(4.70)
65.49 IV 10
(35.72)
9
(32.14)
9
(32.14)
0
(0.00)
67.86 IV
4 Magazine 14
(16.47)
33
(38.83)
22
(25.88)
16
(18.82)
50.98 V 5
(17.86)
9
(32.14)
8
(28.57)
6
(21.43)
48.81 V
5 Exhibition 1
(1.18)
9
(10.58)
18
(21.18)
57
(67.06)
15.29 VIII 1
(3.57)
5
(17.86)
7
(25.00)
15
(53.57)
23.81 VII
6 Posters/ charts 7
(8.24)
10
(11.76)
22
(25.88)
46
(54.12)
24.71 VI 3
(10.71)
6
(21.43)
7
(25.00)
12
(42.86)
33.33 VI
7 Kisan mela 0
(0.00)
7
(8.24)
21
(24.70)
57
(67.06)
13.73 IX 0
(0.00)
4
(14.28)
11
(39.29)
13
(46.43)
22.62 VIII
8 Internet 67
(78.82)
18
(21.18)
0
(0.00)
0
(0.00)
92.94 I 19
(67.86)
6
(21.43)
3
(10.71)
0
(0.00)
85.71 I
9 Face to face
communication
62
(72.94)
18
(21.18)
5
(5.88)
0
(0.00)
89.02 II 15
(53.57)
10
(35.72)
3
(10.71)
0
(0.00)
80.95 III
rs = 9444** t =7.6026 rs = Rank correlation **significant at 1% level of significance
Figures in parenthesis indicate percentage
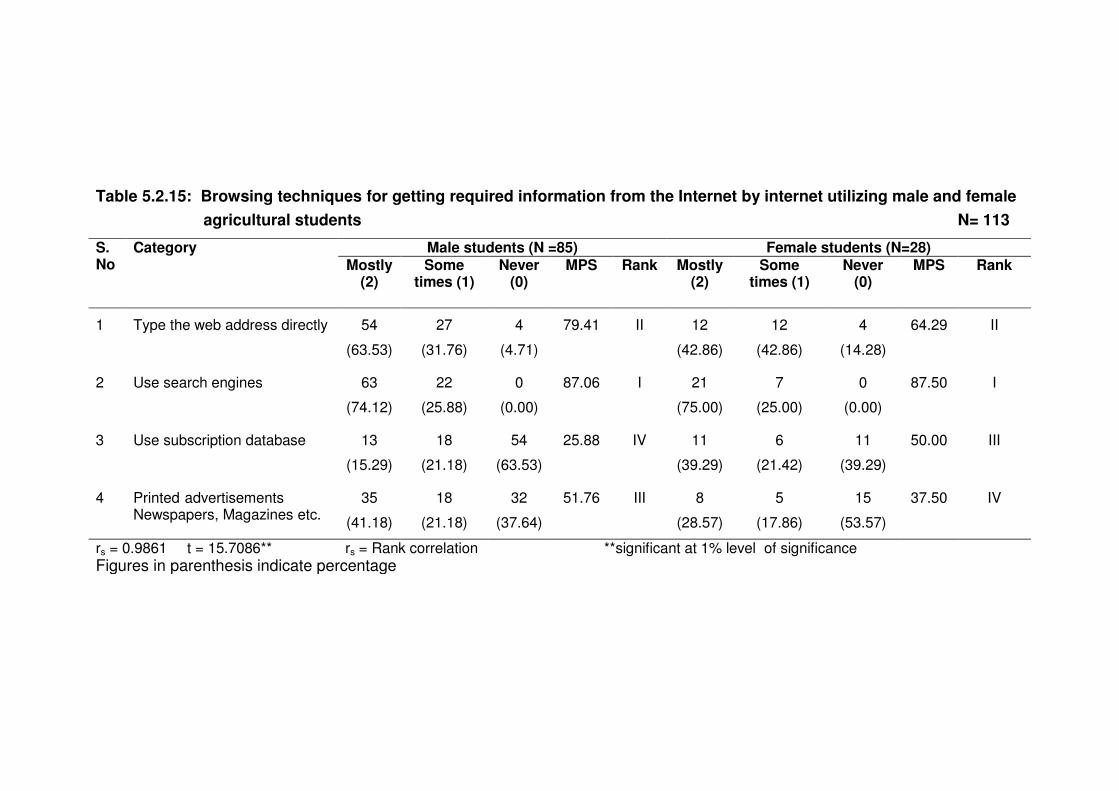
Table 5.2.15: Browsing techniques for getting required information from the Internet by internet utilizing male and female
agricultural students N= 113
S. No
Category Male students (N =85) Female students (N=28) Mostly
(2) Some
times (1) Never
(0) MPS Rank Mostly
(2) Some
times (1) Never
(0) MPS Rank
1 Type the web address directly 54
(63.53)
27
(31.76)
4
(4.71)
79.41 II 12
(42.86)
12
(42.86)
4
(14.28)
64.29 II
2 Use search engines 63
(74.12)
22
(25.88)
0
(0.00)
87.06 I 21
(75.00)
7
(25.00)
0
(0.00)
87.50 I
3 Use subscription database 13
(15.29)
18
(21.18)
54
(63.53)
25.88 IV 11
(39.29)
6
(21.42)
11
(39.29)
50.00 III
4 Printed-advertisements Newspapers, Magazines etc.
35
(41.18)
18
(21.18)
32
(37.64)
51.76 III 8
(28.57)
5
(17.86)
15
(53.57)
37.50 IV
rs = 0.9861 t = 15.7086** rs = Rank correlation **significant at 1% level of significance
Figures in parenthesis indicate percentage
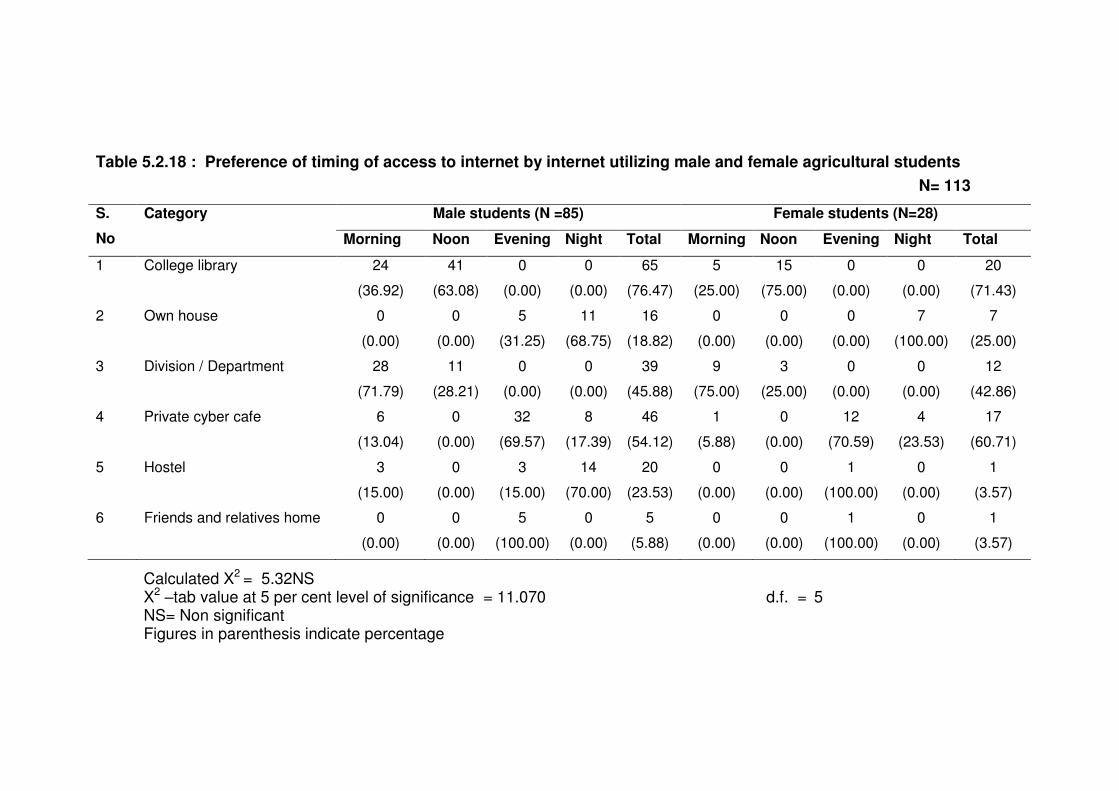
Table 5.2.18 : Preference of timing of access to internet by internet utilizing male and female agricultural students
N= 113
S.
No
Category Male students (N =85) Female students (N=28)
Morning Noon Evening Night Total Morning Noon Evening Night Total
1 College library 24
(36.92)
41
(63.08)
0
(0.00)
0
(0.00)
65
(76.47)
5
(25.00)
15
(75.00)
0
(0.00)
0
(0.00)
20
(71.43)
2 Own house 0
(0.00)
0
(0.00)
5
(31.25)
11
(68.75)
16
(18.82)
0
(0.00)
0
(0.00)
0
(0.00)
7
(100.00)
7
(25.00)
3 Division / Department 28
(71.79)
11
(28.21)
0
(0.00)
0
(0.00)
39
(45.88)
9
(75.00)
3
(25.00)
0
(0.00)
0
(0.00)
12
(42.86)
4 Private cyber cafe 6
(13.04)
0
(0.00)
32
(69.57)
8
(17.39)
46
(54.12)
1
(5.88)
0
(0.00)
12
(70.59)
4
(23.53)
17
(60.71)
5 Hostel 3
(15.00)
0
(0.00)
3
(15.00)
14
(70.00)
20
(23.53)
0
(0.00)
0
(0.00)
1
(100.00)
0
(0.00)
1
(3.57)
6 Friends and relatives home 0
(0.00)
0
(0.00)
5
(100.00)
0
(0.00)
5
(5.88)
0
(0.00)
0
(0.00)
1
(100.00)
0
(0.00)
1
(3.57)
Calculated X2 = 5.32NS X2 –tab value at 5 per cent level of significance = 11.070 d.f. = 5 NS= Non significant Figures in parenthesis indicate percentage
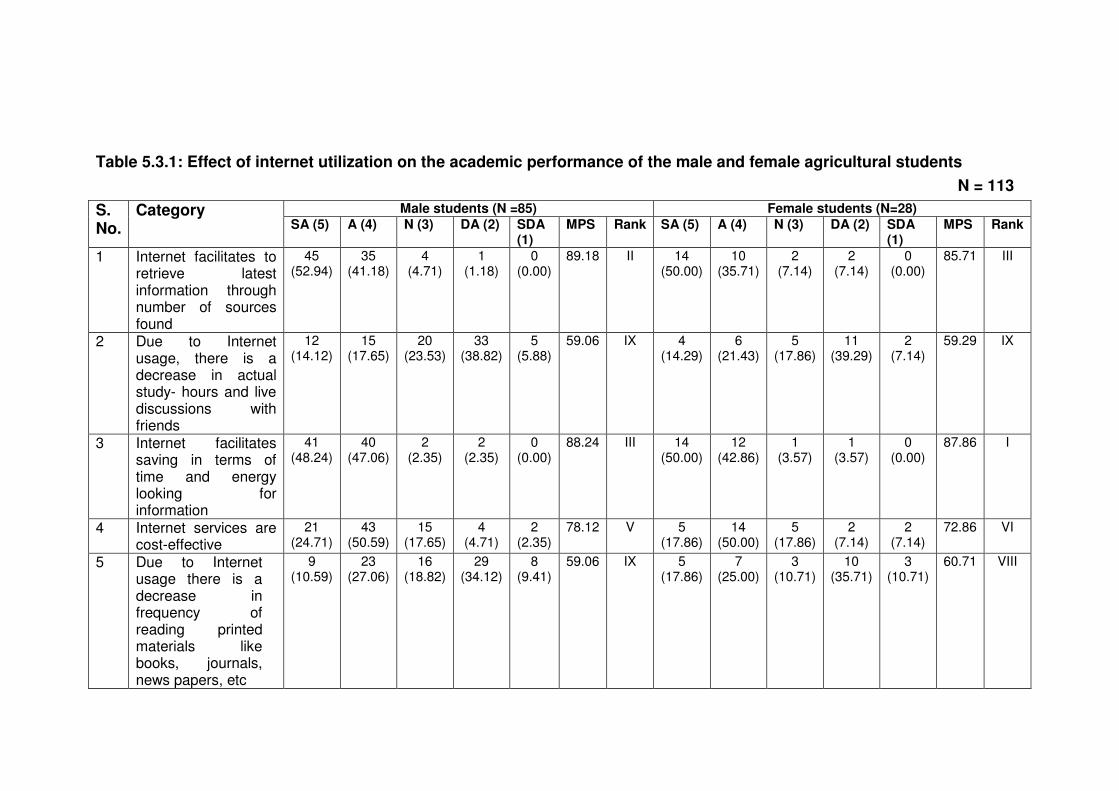
Table 5.3.1: Effect of internet utilization on the academic performance of the male and female agricultural students
N = 113
S. No.
Category Male students (N =85) Female students (N=28)
SA (5) A (4) N (3) DA (2) SDA (1)
MPS Rank SA (5) A (4) N (3) DA (2) SDA (1)
MPS Rank
1 Internet facilitates to retrieve latest information through number of sources found
45 (52.94)
35 (41.18)
4 (4.71)
1 (1.18)
0 (0.00)
89.18 II 14 (50.00)
10 (35.71)
2 (7.14)
2 (7.14)
0 (0.00)
85.71 III
2 Due to Internet usage, there is a decrease in actual study- hours and live discussions with friends
12 (14.12)
15 (17.65)
20 (23.53)
33 (38.82)
5 (5.88)
59.06 IX 4 (14.29)
6 (21.43)
5 (17.86)
11 (39.29)
2 (7.14)
59.29 IX
3 Internet facilitates saving in terms of time and energy looking for information
41 (48.24)
40 (47.06)
2 (2.35)
2 (2.35)
0 (0.00)
88.24 III 14 (50.00)
12 (42.86)
1 (3.57)
1 (3.57)
0 (0.00)
87.86 I
4 Internet services are cost-effective
21 (24.71)
43 (50.59)
15 (17.65)
4 (4.71)
2 (2.35)
78.12 V 5 (17.86)
14 (50.00)
5 (17.86)
2 (7.14)
2 (7.14)
72.86 VI
5 Due to Internet usage there is a decrease in frequency of reading printed materials like books, journals, news papers, etc
9 (10.59)
23 (27.06)
16 (18.82)
29 (34.12)
8 (9.41)
59.06 IX 5 (17.86)
7 (25.00)
3 (10.71)
10 (35.71)
3 (10.71)
60.71 VIII
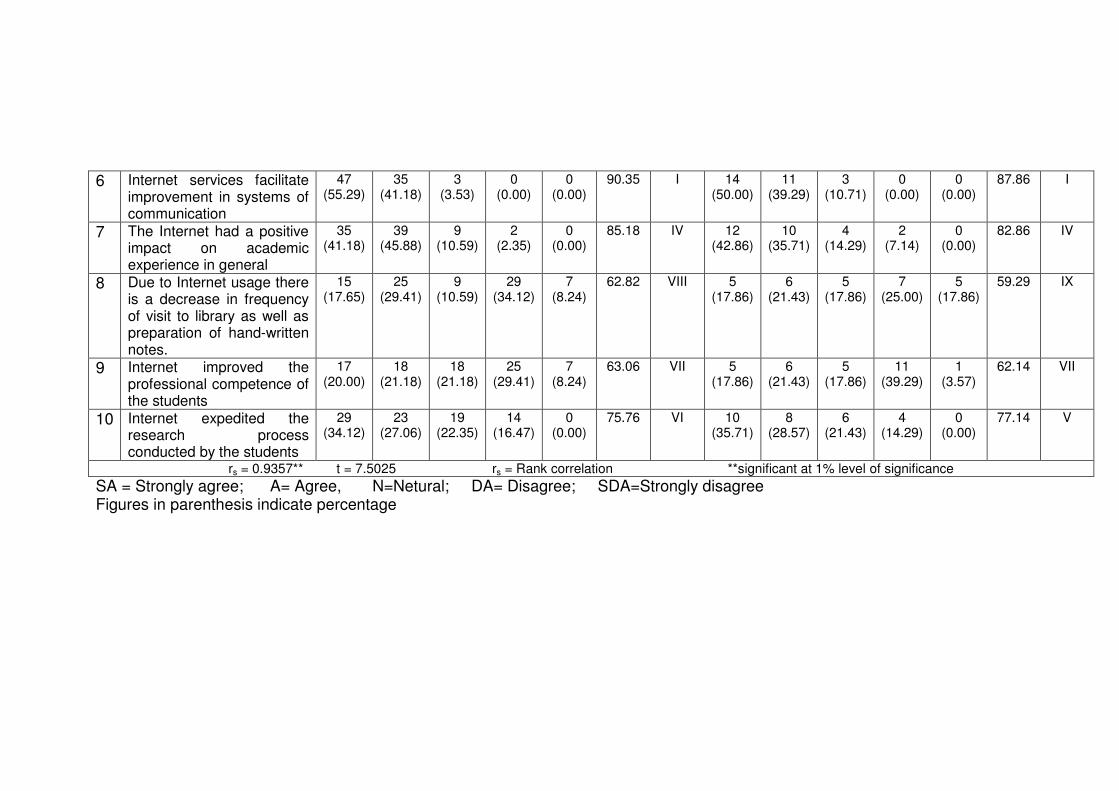
6 Internet services facilitate
improvement in systems of communication
47 (55.29)
35 (41.18)
3 (3.53)
0 (0.00)
0 (0.00)
90.35 I 14 (50.00)
11 (39.29)
3 (10.71)
0 (0.00)
0 (0.00)
87.86 I
7 The Internet had a positive impact on academic experience in general
35 (41.18)
39 (45.88)
9 (10.59)
2 (2.35)
0 (0.00)
85.18 IV 12 (42.86)
10 (35.71)
4 (14.29)
2 (7.14)
0 (0.00)
82.86 IV
8 Due to Internet usage there is a decrease in frequency of visit to library as well as preparation of hand-written notes.
15 (17.65)
25 (29.41)
9 (10.59)
29 (34.12)
7 (8.24)
62.82 VIII 5 (17.86)
6 (21.43)
5 (17.86)
7 (25.00)
5 (17.86)
59.29 IX
9 Internet improved the professional competence of the students
17 (20.00)
18 (21.18)
18 (21.18)
25 (29.41)
7 (8.24)
63.06 VII 5 (17.86)
6 (21.43)
5 (17.86)
11 (39.29)
1 (3.57)
62.14 VII
10 Internet expedited the research process conducted by the students
29 (34.12)
23 (27.06)
19 (22.35)
14 (16.47)
0 (0.00)
75.76 VI 10 (35.71)
8 (28.57)
6 (21.43)
4 (14.29)
0 (0.00)
77.14 V
rs = 0.9357** t = 7.5025 rs = Rank correlation **significant at 1% level of significance
SA = Strongly agree; A= Agree, N=Netural; DA= Disagree; SDA=Strongly disagree Figures in parenthesis indicate percentage
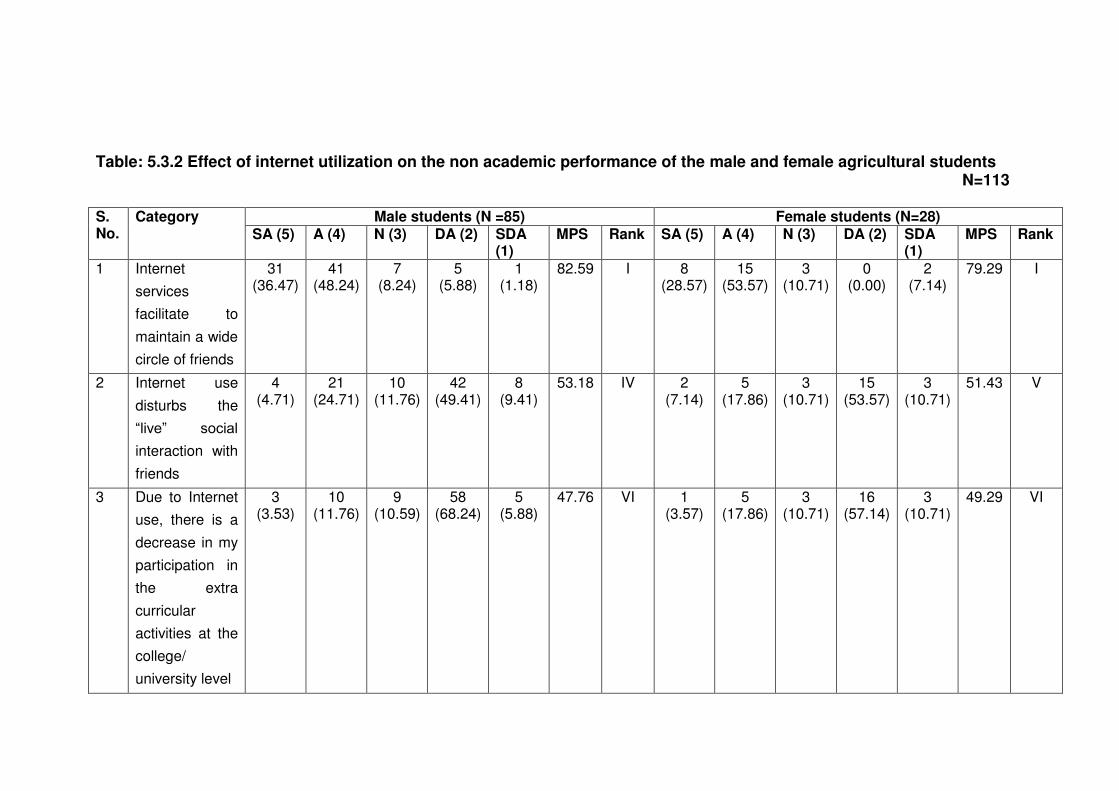
Table: 5.3.2 Effect of internet utilization on the non academic performance of the male and female agricultural students N=113 S. No.
Category Male students (N =85) Female students (N=28) SA (5) A (4) N (3) DA (2) SDA
(1) MPS Rank SA (5) A (4) N (3) DA (2) SDA
(1) MPS Rank
1 Internet
services
facilitate to
maintain a wide
circle of friends
31 (36.47)
41 (48.24)
7 (8.24)
5 (5.88)
1 (1.18)
82.59 I 8 (28.57)
15 (53.57)
3 (10.71)
0 (0.00)
2 (7.14)
79.29 I
2 Internet use
disturbs the
“live” social interaction with
friends
4 (4.71)
21 (24.71)
10 (11.76)
42 (49.41)
8 (9.41)
53.18 IV 2 (7.14)
5 (17.86)
3 (10.71)
15 (53.57)
3 (10.71)
51.43 V
3 Due to Internet
use, there is a
decrease in my
participation in
the extra
curricular
activities at the
college/
university level
3 (3.53)
10 (11.76)
9 (10.59)
58 (68.24)
5 (5.88)
47.76 VI 1 (3.57)
5 (17.86)
3 (10.71)
16 (57.14)
3 (10.71)
49.29 VI
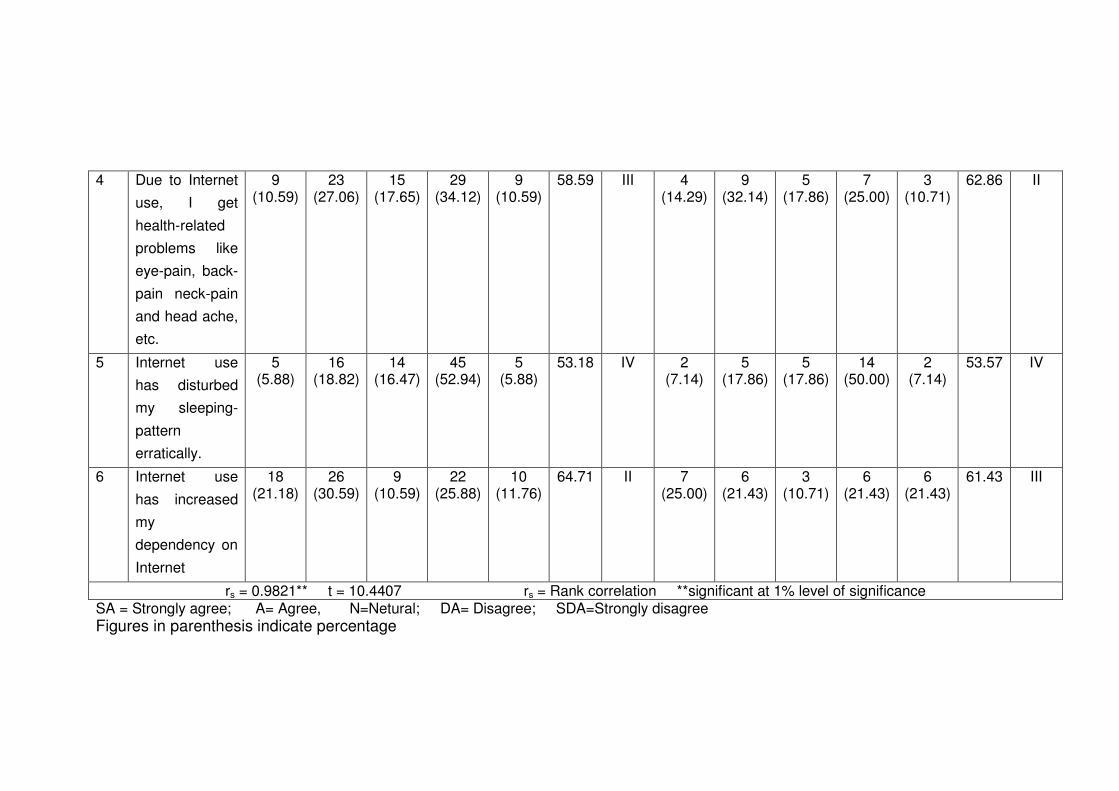
4 Due to Internet
use, I get
health-related
problems like
eye-pain, back-
pain neck-pain
and head ache,
etc.
9 (10.59)
23 (27.06)
15 (17.65)
29 (34.12)
9 (10.59)
58.59 III 4 (14.29)
9 (32.14)
5 (17.86)
7 (25.00)
3 (10.71)
62.86 II
5 Internet use
has disturbed
my sleeping-
pattern
erratically.
5 (5.88)
16 (18.82)
14 (16.47)
45 (52.94)
5 (5.88)
53.18 IV 2 (7.14)
5 (17.86)
5 (17.86)
14 (50.00)
2 (7.14)
53.57 IV
6 Internet use
has increased
my
dependency on
Internet
18 (21.18)
26 (30.59)
9 (10.59)
22 (25.88)
10 (11.76)
64.71 II 7 (25.00)
6 (21.43)
3 (10.71)
6 (21.43)
6 (21.43)
61.43 III
rs = 0.9821** t = 10.4407 rs = Rank correlation **significant at 1% level of significance SA = Strongly agree; A= Agree, N=Netural; DA= Disagree; SDA=Strongly disagree
Figures in parenthesis indicate percentage

Table -5.5.1: Physical constraints faced by the internet utilizing male and female agricultural students N=113 S.No. Category Male students (N =85) Female students (N=28)
Upto high
extent (2)
Upto medium extent
(1)
Upto low
extent (0)
MPS Rank Upto high
extent (2)
Upto medium extent
(1)
Upto low
extent (0)
MPS Rank
A. Physical constraints 1. Inadequate availability of computer
and Internet facilities
40
(47.06)
31
(36.47)
14
(16.47)
76.86 I 14
(50.00)
9
(32.14)
5
(17.86)
77.38 III
2. Inadequate accessibility to Internet
services
21
(24.70)
35
(41.18)
29
(34.12)
63.53 III 13
(46.43)
12
(42.86)
3
(10.71)
78.57 II
3. Lack of adequate infrastructure
facilities
30
(35.29)
35
(41.18)
20
(23.53)
70.59 II 17
(60.72)
8
(28.57)
3
(10.71)
83.33 I
4. Lack of knowledge about
availability of Internet source
16
(18.82)
39
(45.88)
30
(35.30)
61.18 IV 8
(28.57)
13
(46.43)
7
(25.00)
67.86 IV
rs = 0.9732* t = 5.9866 rs = Rank correlation *Significant at 5% level of significance Figures in parenthesis indicate percentage
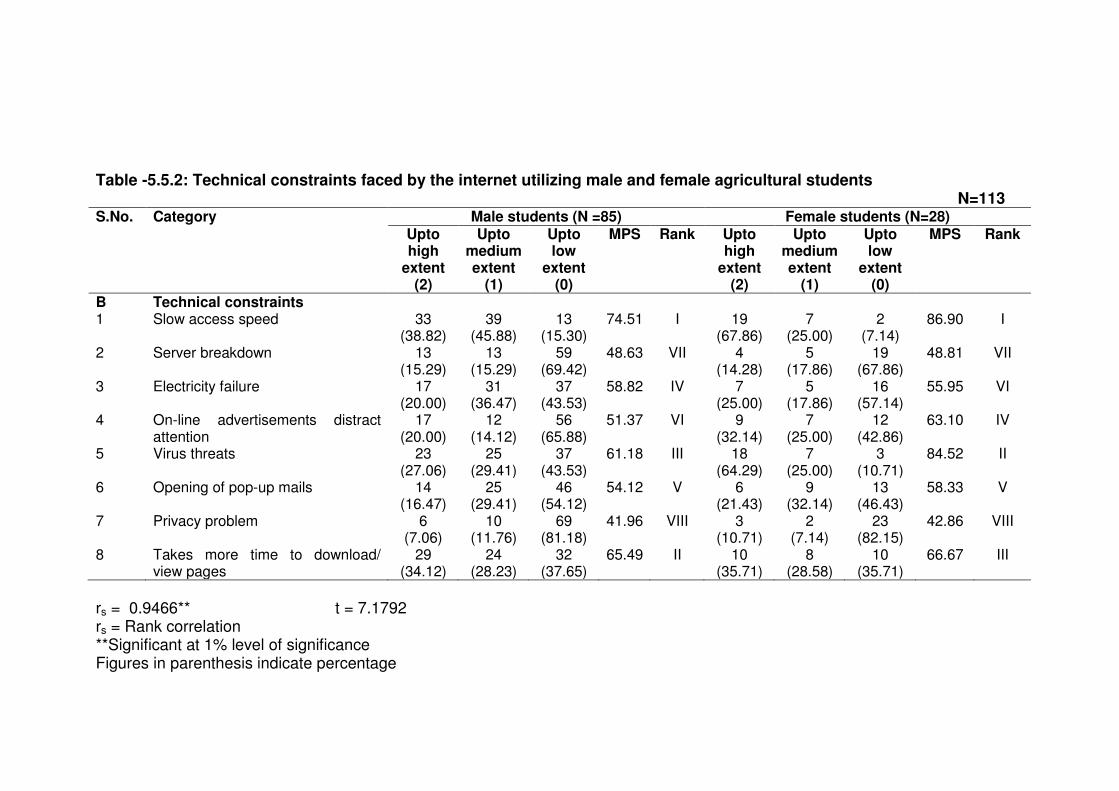
Table -5.5.2: Technical constraints faced by the internet utilizing male and female agricultural students N=113 S.No. Category Male students (N =85) Female students (N=28)
Upto high
extent (2)
Upto medium extent
(1)
Upto low
extent (0)
MPS Rank Upto high
extent (2)
Upto medium extent
(1)
Upto low
extent (0)
MPS Rank
B Technical constraints 1 Slow access speed 33
(38.82) 39
(45.88) 13
(15.30) 74.51 I 19
(67.86) 7
(25.00) 2
(7.14) 86.90 I
2 Server breakdown 13 (15.29)
13 (15.29)
59 (69.42)
48.63 VII 4 (14.28)
5 (17.86)
19 (67.86)
48.81 VII
3 Electricity failure 17 (20.00)
31 (36.47)
37 (43.53)
58.82 IV 7 (25.00)
5 (17.86)
16 (57.14)
55.95 VI
4 On-line advertisements distract attention
17 (20.00)
12 (14.12)
56 (65.88)
51.37 VI 9 (32.14)
7 (25.00)
12 (42.86)
63.10 IV
5 Virus threats 23 (27.06)
25 (29.41)
37 (43.53)
61.18 III 18 (64.29)
7 (25.00)
3 (10.71)
84.52 II
6 Opening of pop-up mails 14 (16.47)
25 (29.41)
46 (54.12)
54.12 V 6 (21.43)
9 (32.14)
13 (46.43)
58.33 V
7 Privacy problem 6 (7.06)
10 (11.76)
69 (81.18)
41.96 VIII 3 (10.71)
2 (7.14)
23 (82.15)
42.86 VIII
8 Takes more time to download/ view pages
29 (34.12)
24 (28.23)
32 (37.65)
65.49 II 10 (35.71)
8 (28.58)
10 (35.71)
66.67 III
rs = 0.9466** t = 7.1792 rs = Rank correlation **Significant at 1% level of significance Figures in parenthesis indicate percentage
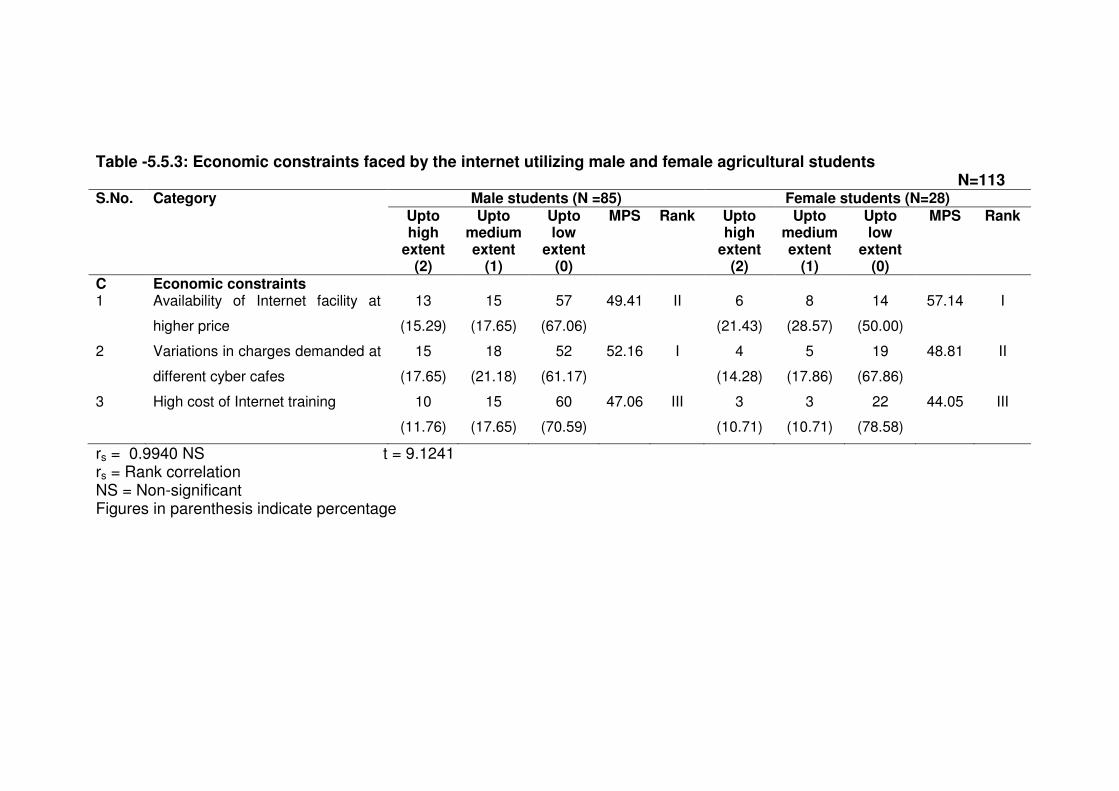
Table -5.5.3: Economic constraints faced by the internet utilizing male and female agricultural students N=113 S.No. Category Male students (N =85) Female students (N=28)
Upto high
extent (2)
Upto medium extent
(1)
Upto low
extent (0)
MPS Rank Upto high
extent (2)
Upto medium extent
(1)
Upto low
extent (0)
MPS Rank
C Economic constraints 1 Availability of Internet facility at
higher price
13
(15.29)
15
(17.65)
57
(67.06)
49.41 II 6
(21.43)
8
(28.57)
14
(50.00)
57.14 I
2 Variations in charges demanded at
different cyber cafes
15
(17.65)
18
(21.18)
52
(61.17)
52.16 I 4
(14.28)
5
(17.86)
19
(67.86)
48.81 II
3 High cost of Internet training 10
(11.76)
15
(17.65)
60
(70.59)
47.06 III 3
(10.71)
3
(10.71)
22
(78.58)
44.05 III
rs = 0.9940 NS t = 9.1241 rs = Rank correlation NS = Non-significant Figures in parenthesis indicate percentage
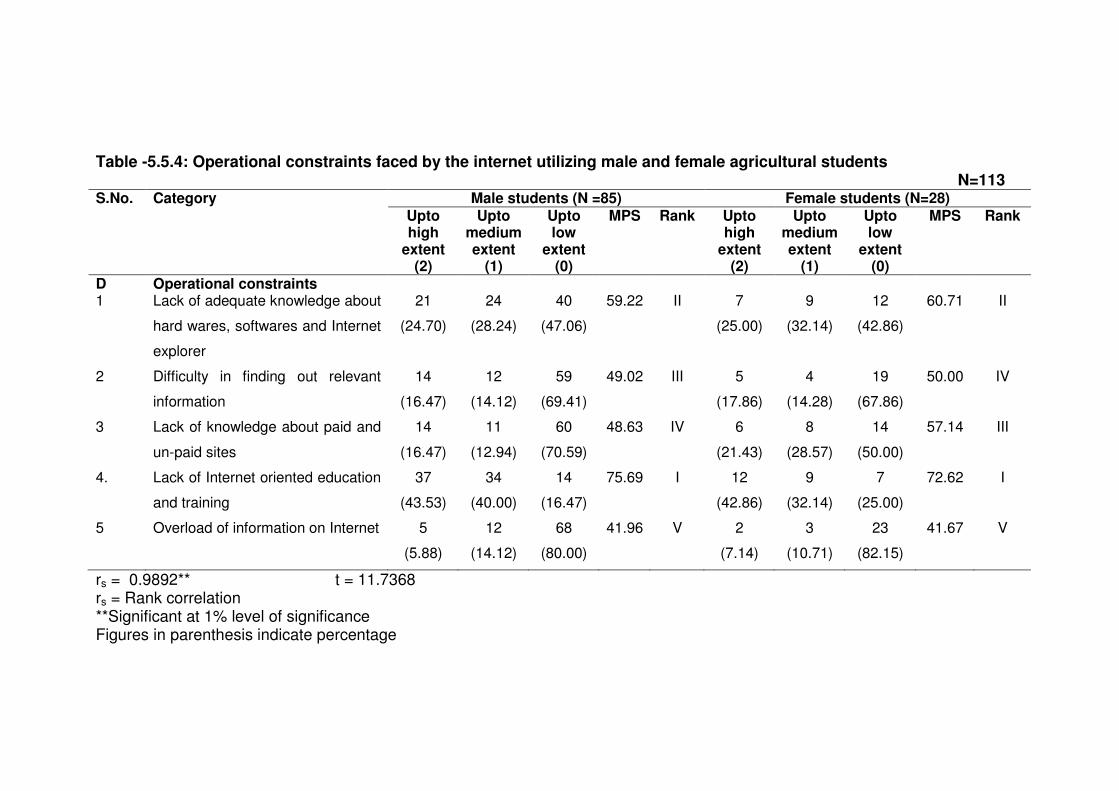
Table -5.5.4: Operational constraints faced by the internet utilizing male and female agricultural students N=113 S.No. Category Male students (N =85) Female students (N=28)
Upto high
extent (2)
Upto medium extent
(1)
Upto low
extent (0)
MPS Rank Upto high
extent (2)
Upto medium extent
(1)
Upto low
extent (0)
MPS Rank
D Operational constraints 1 Lack of adequate knowledge about
hard wares, softwares and Internet
explorer
21
(24.70)
24
(28.24)
40
(47.06)
59.22 II 7
(25.00)
9
(32.14)
12
(42.86)
60.71 II
2 Difficulty in finding out relevant
information
14
(16.47)
12
(14.12)
59
(69.41)
49.02 III 5
(17.86)
4
(14.28)
19
(67.86)
50.00 IV
3 Lack of knowledge about paid and
un-paid sites
14
(16.47)
11
(12.94)
60
(70.59)
48.63 IV 6
(21.43)
8
(28.57)
14
(50.00)
57.14 III
4. Lack of Internet oriented education
and training
37
(43.53)
34
(40.00)
14
(16.47)
75.69 I 12
(42.86)
9
(32.14)
7
(25.00)
72.62 I
5 Overload of information on Internet 5
(5.88)
12
(14.12)
68
(80.00)
41.96 V 2
(7.14)
3
(10.71)
23
(82.15)
41.67 V
rs = 0.9892** t = 11.7368 rs = Rank correlation **Significant at 1% level of significance Figures in parenthesis indicate percentage
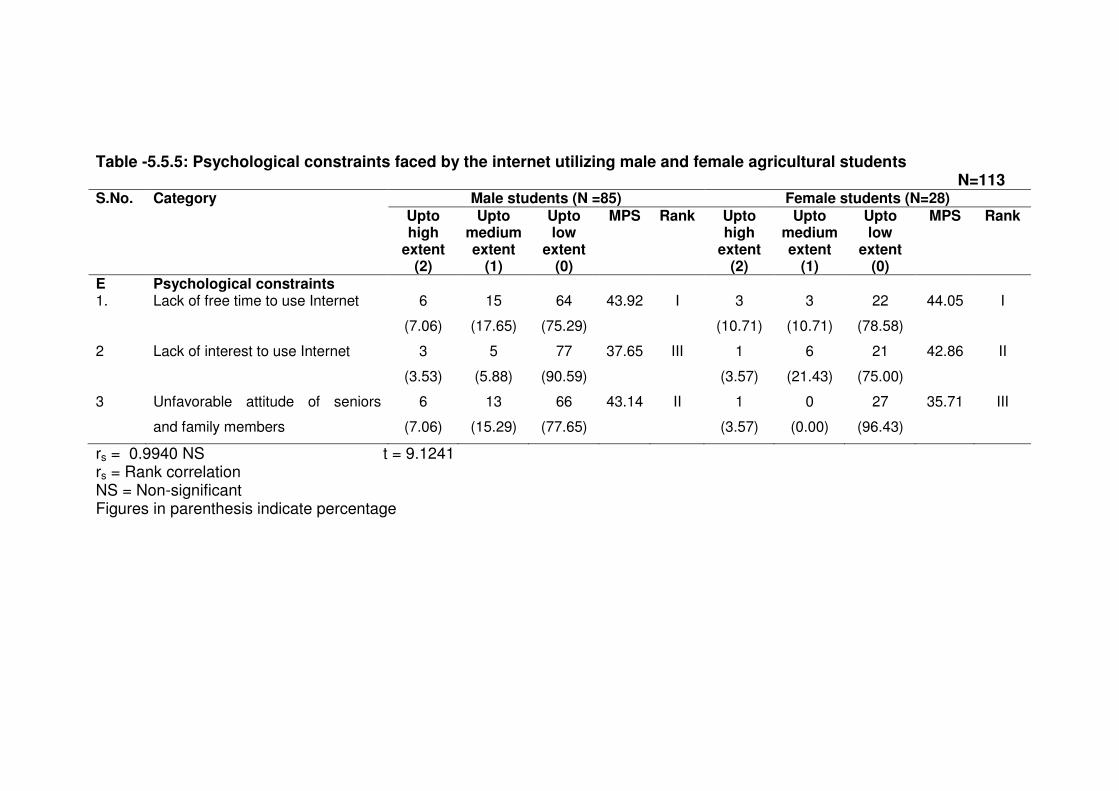
Table -5.5.5: Psychological constraints faced by the internet utilizing male and female agricultural students N=113 S.No. Category Male students (N =85) Female students (N=28)
Upto high
extent (2)
Upto medium extent
(1)
Upto low
extent (0)
MPS Rank Upto high
extent (2)
Upto medium extent
(1)
Upto low
extent (0)
MPS Rank
E Psychological constraints 1. Lack of free time to use Internet 6
(7.06)
15
(17.65)
64
(75.29)
43.92 I 3
(10.71)
3
(10.71)
22
(78.58)
44.05 I
2 Lack of interest to use Internet 3
(3.53)
5
(5.88)
77
(90.59)
37.65 III 1
(3.57)
6
(21.43)
21
(75.00)
42.86 II
3 Unfavorable attitude of seniors
and family members
6
(7.06)
13
(15.29)
66
(77.65)
43.14 II 1
(3.57)
0
(0.00)
27
(96.43)
35.71 III
rs = 0.9940 NS t = 9.1241 rs = Rank correlation NS = Non-significant Figures in parenthesis indicate percentage
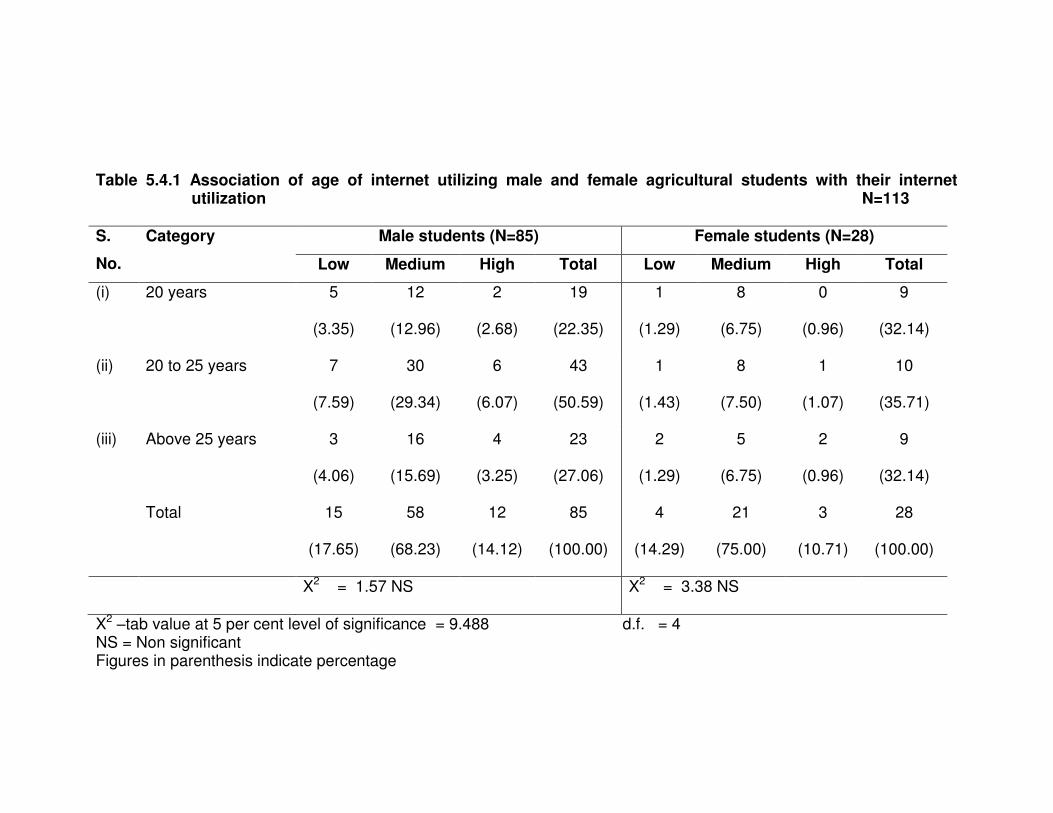
Table 5.4.1 Association of age of internet utilizing male and female agricultural students with their internet
utilization N=113
S.
No.
Category Male students (N=85) Female students (N=28)
Low Medium High Total Low Medium High Total
(i) 20 years 5
(3.35)
12
(12.96)
2
(2.68)
19
(22.35)
1
(1.29)
8
(6.75)
0
(0.96)
9
(32.14)
(ii) 20 to 25 years 7
(7.59)
30
(29.34)
6
(6.07)
43
(50.59)
1
(1.43)
8
(7.50)
1
(1.07)
10
(35.71)
(iii) Above 25 years 3
(4.06)
16
(15.69)
4
(3.25)
23
(27.06)
2
(1.29)
5
(6.75)
2
(0.96)
9
(32.14)
Total 15
(17.65)
58
(68.23)
12
(14.12)
85
(100.00)
4
(14.29)
21
(75.00)
3
(10.71)
28
(100.00)
X2 = 1.57 NS X2 = 3.38 NS
X2 –tab value at 5 per cent level of significance = 9.488 d.f. = 4 NS = Non significant Figures in parenthesis indicate percentage
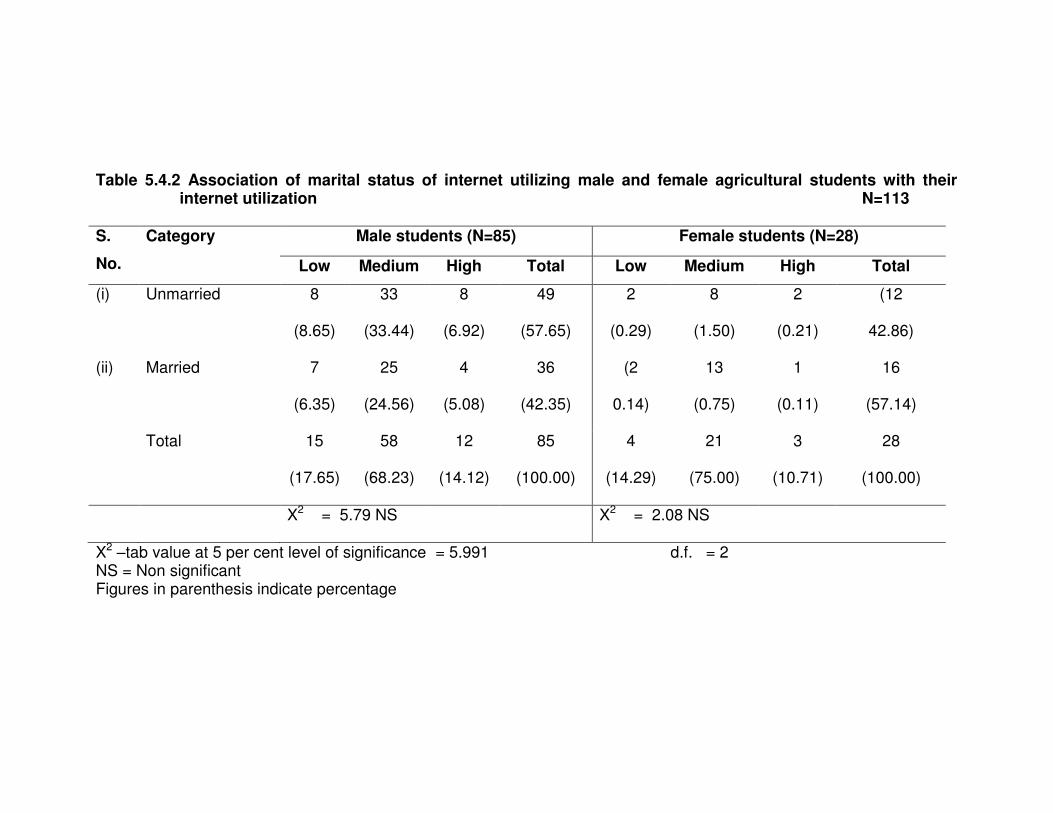
Table 5.4.2 Association of marital status of internet utilizing male and female agricultural students with their
internet utilization N=113
S.
No.
Category Male students (N=85) Female students (N=28)
Low Medium High Total Low Medium High Total
(i) Unmarried 8
(8.65)
33
(33.44)
8
(6.92)
49
(57.65)
2
(0.29)
8
(1.50)
2
(0.21)
(12
42.86)
(ii) Married 7
(6.35)
25
(24.56)
4
(5.08)
36
(42.35)
(2
0.14)
13
(0.75)
1
(0.11)
16
(57.14)
Total 15
(17.65)
58
(68.23)
12
(14.12)
85
(100.00)
4
(14.29)
21
(75.00)
3
(10.71)
28
(100.00)
X2 = 5.79 NS X2 = 2.08 NS
X2 –tab value at 5 per cent level of significance = 5.991 d.f. = 2 NS = Non significant Figures in parenthesis indicate percentage
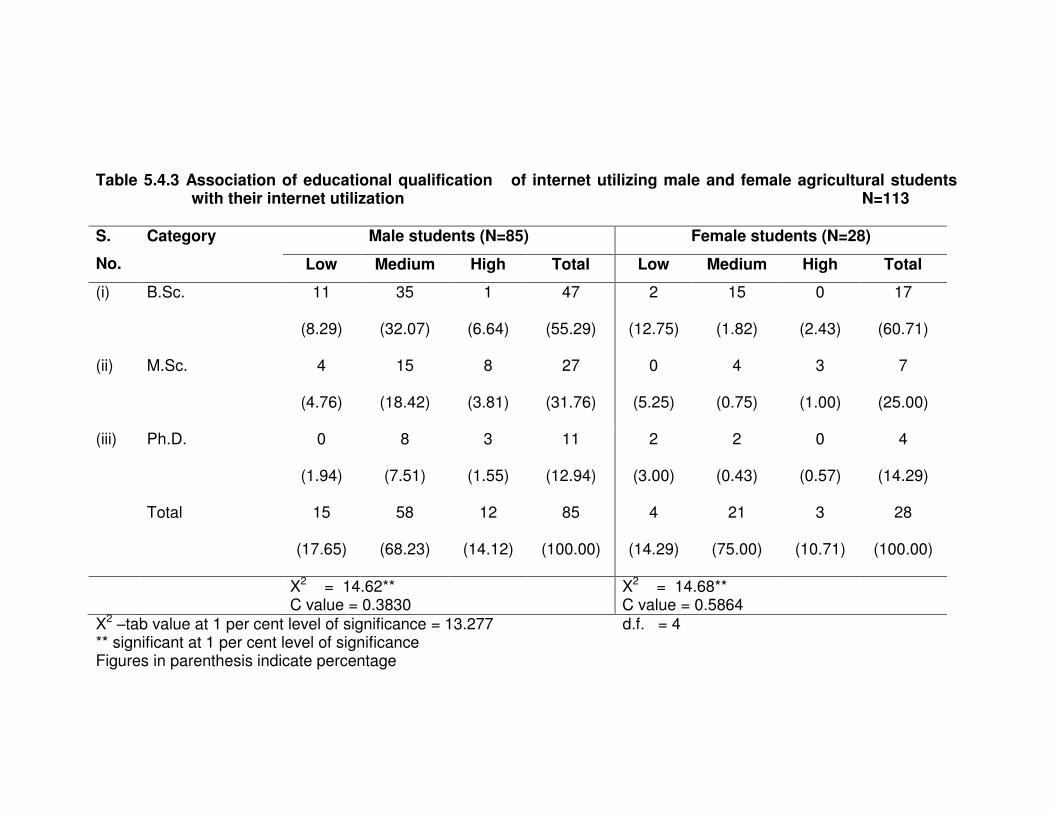
Table 5.4.3 Association of educational qualification of internet utilizing male and female agricultural students
with their internet utilization N=113
S.
No.
Category Male students (N=85) Female students (N=28)
Low Medium High Total Low Medium High Total
(i) B.Sc. 11
(8.29)
35
(32.07)
1
(6.64)
47
(55.29)
2
(12.75)
15
(1.82)
0
(2.43)
17
(60.71)
(ii) M.Sc. 4
(4.76)
15
(18.42)
8
(3.81)
27
(31.76)
0
(5.25)
4
(0.75)
3
(1.00)
7
(25.00)
(iii) Ph.D. 0
(1.94)
8
(7.51)
3
(1.55)
11
(12.94)
2
(3.00)
2
(0.43)
0
(0.57)
4
(14.29)
Total 15
(17.65)
58
(68.23)
12
(14.12)
85
(100.00)
4
(14.29)
21
(75.00)
3
(10.71)
28
(100.00)
X2 = 14.62** C value = 0.3830
X2 = 14.68** C value = 0.5864
X2 –tab value at 1 per cent level of significance = 13.277 d.f. = 4 ** significant at 1 per cent level of significance Figures in parenthesis indicate percentage
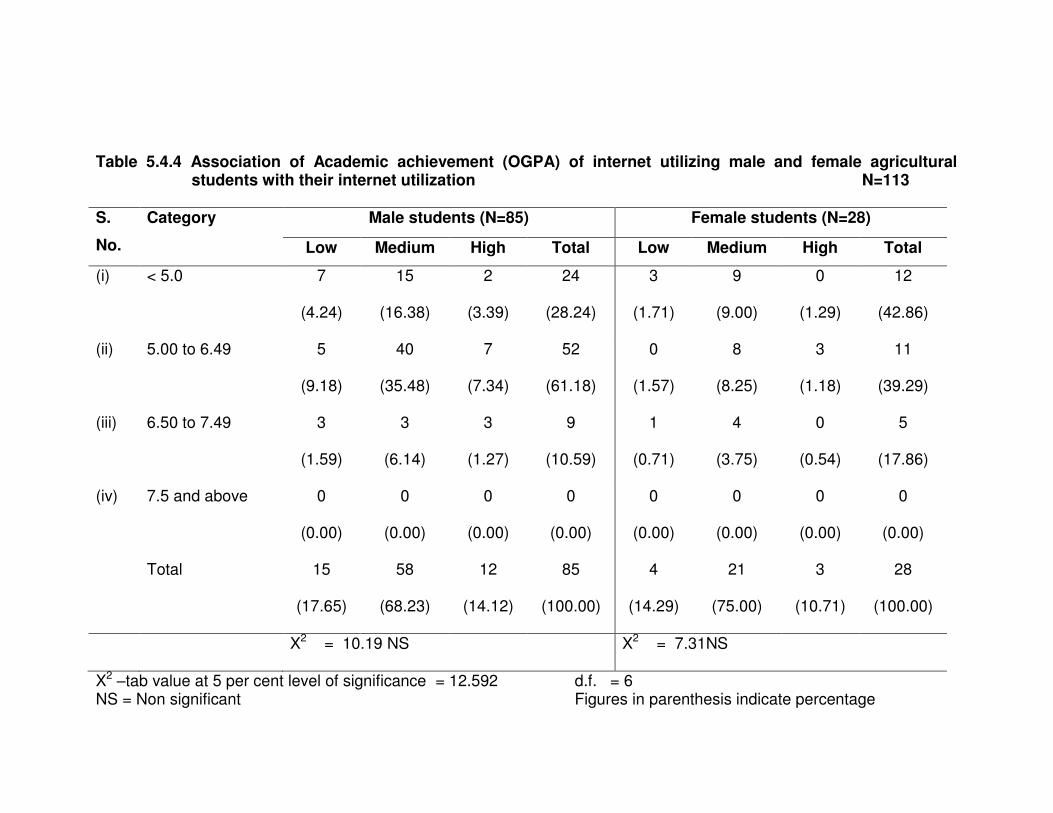
Table 5.4.4 Association of Academic achievement (OGPA) of internet utilizing male and female agricultural students with their internet utilization N=113
S.
No.
Category Male students (N=85) Female students (N=28)
Low Medium High Total Low Medium High Total
(i) < 5.0 7
(4.24)
15
(16.38)
2
(3.39)
24
(28.24)
3
(1.71)
9
(9.00)
0
(1.29)
12
(42.86)
(ii) 5.00 to 6.49 5
(9.18)
40
(35.48)
7
(7.34)
52
(61.18)
0
(1.57)
8
(8.25)
3
(1.18)
11
(39.29)
(iii) 6.50 to 7.49 3
(1.59)
3
(6.14)
3
(1.27)
9
(10.59)
1
(0.71)
4
(3.75)
0
(0.54)
5
(17.86)
(iv) 7.5 and above 0
(0.00)
0
(0.00)
0
(0.00)
0
(0.00)
0
(0.00)
0
(0.00)
0
(0.00)
0
(0.00)
Total 15
(17.65)
58
(68.23)
12
(14.12)
85
(100.00)
4
(14.29)
21
(75.00)
3
(10.71)
28
(100.00)
X2 = 10.19 NS X2 = 7.31NS
X2 –tab value at 5 per cent level of significance = 12.592 d.f. = 6 NS = Non significant Figures in parenthesis indicate percentage
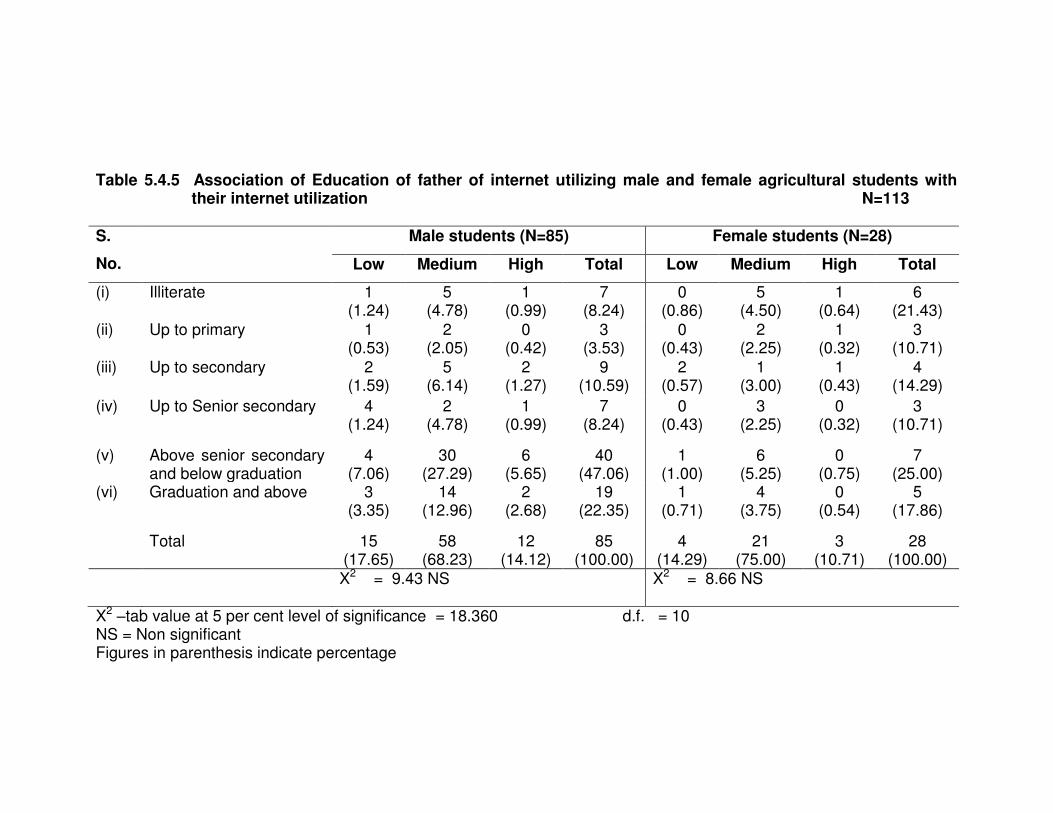
Table 5.4.5 Association of Education of father of internet utilizing male and female agricultural students with
their internet utilization N=113
S.
No.
Male students (N=85) Female students (N=28)
Low Medium High Total Low Medium High Total
(i) Illiterate 1 (1.24)
5 (4.78)
1 (0.99)
7 (8.24)
0 (0.86)
5 (4.50)
1 (0.64)
6 (21.43)
(ii) Up to primary 1 (0.53)
2 (2.05)
0 (0.42)
3 (3.53)
0 (0.43)
2 (2.25)
1 (0.32)
3 (10.71)
(iii) Up to secondary 2 (1.59)
5 (6.14)
2 (1.27)
9 (10.59)
2 (0.57)
1 (3.00)
1 (0.43)
4 (14.29)
(iv) Up to Senior secondary 4 (1.24)
2 (4.78)
1 (0.99)
7 (8.24)
0 (0.43)
3 (2.25)
0 (0.32)
3 (10.71)
(v) Above senior secondary and below graduation
4 (7.06)
30 (27.29)
6 (5.65)
40 (47.06)
1 (1.00)
6 (5.25)
0 (0.75)
7 (25.00)
(vi) Graduation and above 3 (3.35)
14 (12.96)
2 (2.68)
19 (22.35)
1 (0.71)
4 (3.75)
0 (0.54)
5 (17.86)
Total 15 (17.65)
58 (68.23)
12 (14.12)
85 (100.00)
4 (14.29)
21 (75.00)
3 (10.71)
28 (100.00)
X2 = 9.43 NS X2 = 8.66 NS
X2 –tab value at 5 per cent level of significance = 18.360 d.f. = 10 NS = Non significant Figures in parenthesis indicate percentage
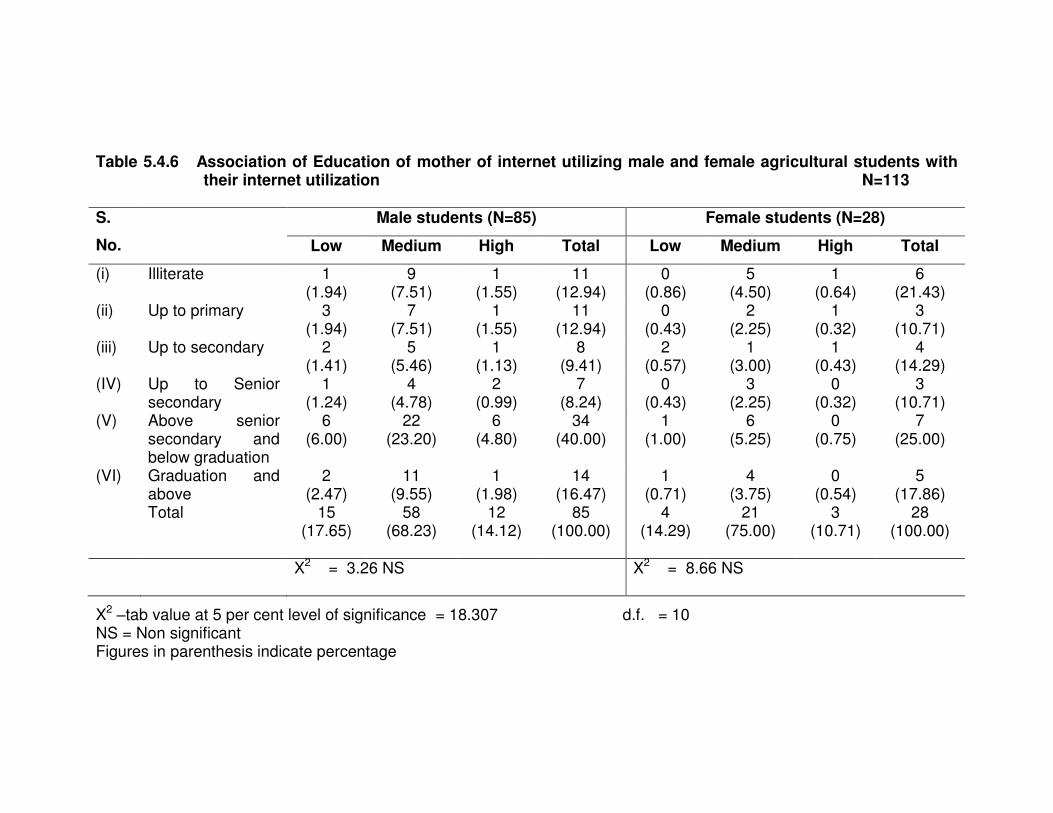
Table 5.4.6 Association of Education of mother of internet utilizing male and female agricultural students with their internet utilization N=113
S.
No.
Male students (N=85) Female students (N=28)
Low Medium High Total Low Medium High Total
(i) Illiterate 1 (1.94)
9 (7.51)
1 (1.55)
11 (12.94)
0 (0.86)
5 (4.50)
1 (0.64)
6 (21.43)
(ii) Up to primary 3 (1.94)
7 (7.51)
1 (1.55)
11 (12.94)
0 (0.43)
2 (2.25)
1 (0.32)
3 (10.71)
(iii) Up to secondary 2 (1.41)
5 (5.46)
1 (1.13)
8 (9.41)
2 (0.57)
1 (3.00)
1 (0.43)
4 (14.29)
(IV) Up to Senior secondary
1 (1.24)
4 (4.78)
2 (0.99)
7 (8.24)
0 (0.43)
3 (2.25)
0 (0.32)
3 (10.71)
(V) Above senior secondary and below graduation
6 (6.00)
22 (23.20)
6 (4.80)
34 (40.00)
1 (1.00)
6 (5.25)
0 (0.75)
7 (25.00)
(VI) Graduation and above
2 (2.47)
11 (9.55)
1 (1.98)
14 (16.47)
1 (0.71)
4 (3.75)
0 (0.54)
5 (17.86)
Total 15 (17.65)
58 (68.23)
12 (14.12)
85 (100.00)
4 (14.29)
21 (75.00)
3 (10.71)
28 (100.00)
X2 = 3.26 NS X2 = 8.66 NS
X2 –tab value at 5 per cent level of significance = 18.307 d.f. = 10 NS = Non significant Figures in parenthesis indicate percentage
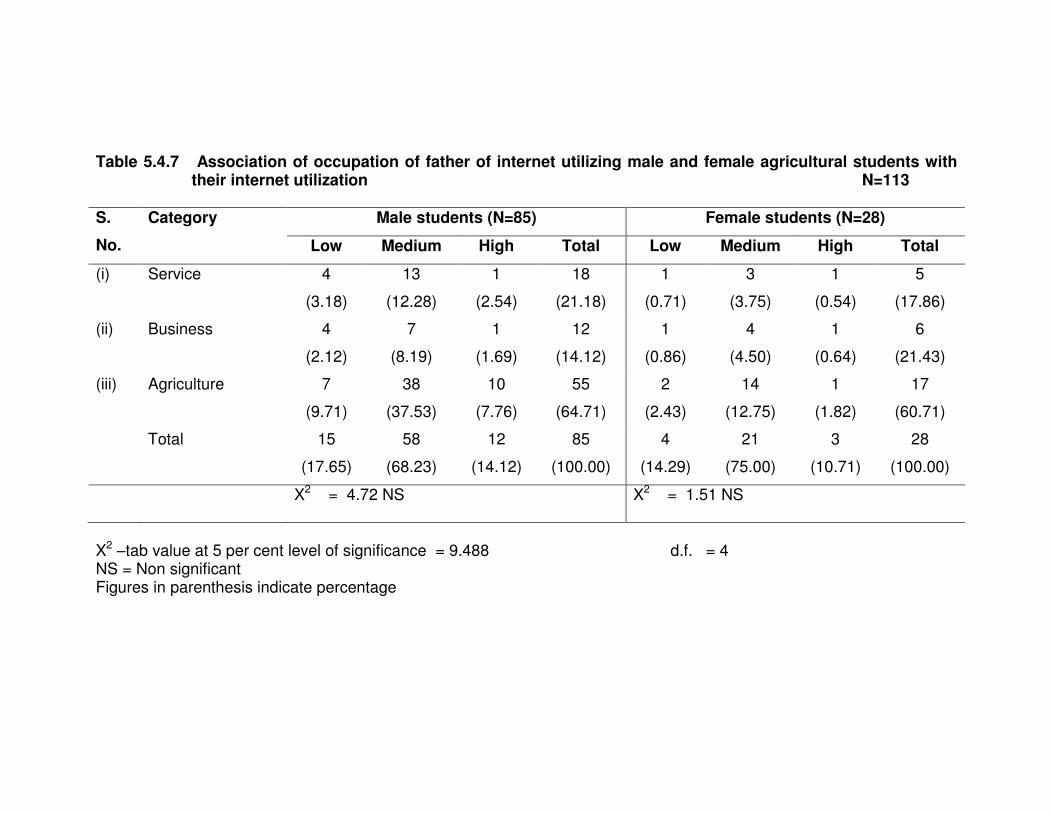
Table 5.4.7 Association of occupation of father of internet utilizing male and female agricultural students with their internet utilization N=113
S.
No.
Category Male students (N=85) Female students (N=28)
Low Medium High Total Low Medium High Total
(i) Service 4
(3.18)
13
(12.28)
1
(2.54)
18
(21.18)
1
(0.71)
3
(3.75)
1
(0.54)
5
(17.86)
(ii) Business 4
(2.12)
7
(8.19)
1
(1.69)
12
(14.12)
1
(0.86)
4
(4.50)
1
(0.64)
6
(21.43)
(iii) Agriculture 7
(9.71)
38
(37.53)
10
(7.76)
55
(64.71)
2
(2.43)
14
(12.75)
1
(1.82)
17
(60.71)
Total 15
(17.65)
58
(68.23)
12
(14.12)
85
(100.00)
4
(14.29)
21
(75.00)
3
(10.71)
28
(100.00)
X2 = 4.72 NS X2 = 1.51 NS
X2 –tab value at 5 per cent level of significance = 9.488 d.f. = 4 NS = Non significant Figures in parenthesis indicate percentage
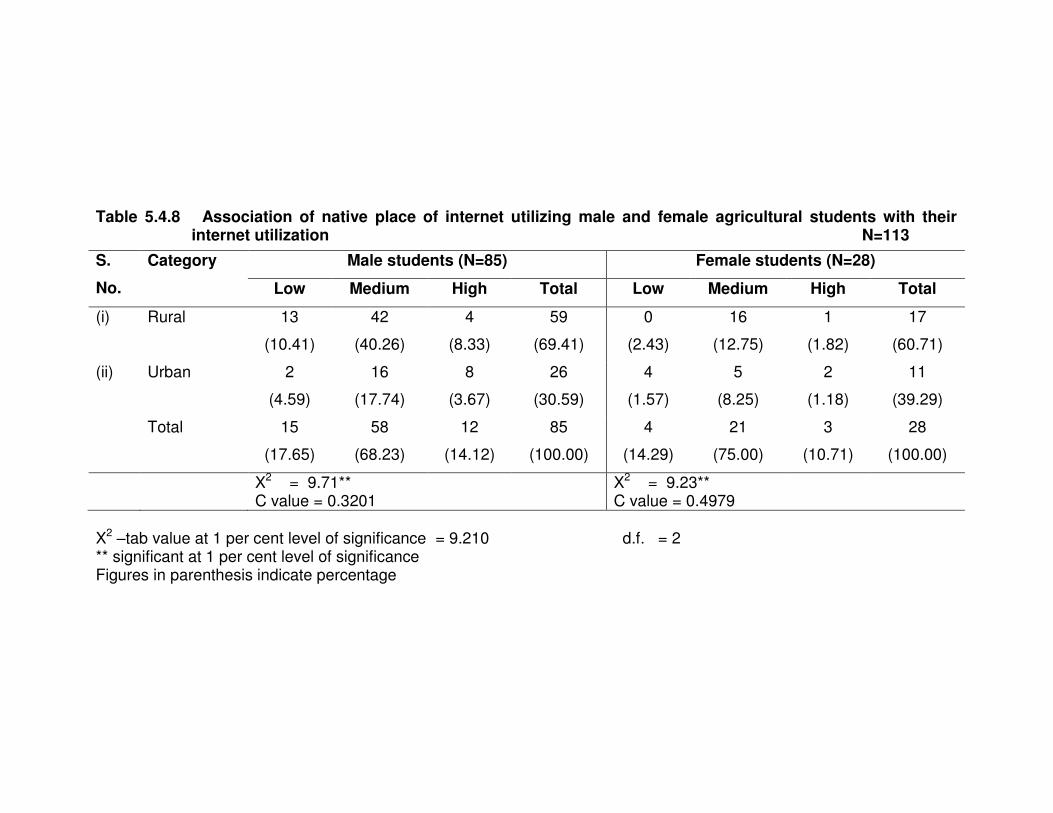
Table 5.4.8 Association of native place of internet utilizing male and female agricultural students with their
internet utilization N=113
S.
No.
Category Male students (N=85) Female students (N=28)
Low Medium High Total Low Medium High Total
(i) Rural 13
(10.41)
42
(40.26)
4
(8.33)
59
(69.41)
0
(2.43)
16
(12.75)
1
(1.82)
17
(60.71)
(ii) Urban 2
(4.59)
16
(17.74)
8
(3.67)
26
(30.59)
4
(1.57)
5
(8.25)
2
(1.18)
11
(39.29)
Total 15
(17.65)
58
(68.23)
12
(14.12)
85
(100.00)
4
(14.29)
21
(75.00)
3
(10.71)
28
(100.00)
X2 = 9.71** C value = 0.3201
X2 = 9.23** C value = 0.4979
X2 –tab value at 1 per cent level of significance = 9.210 d.f. = 2 ** significant at 1 per cent level of significance Figures in parenthesis indicate percentage
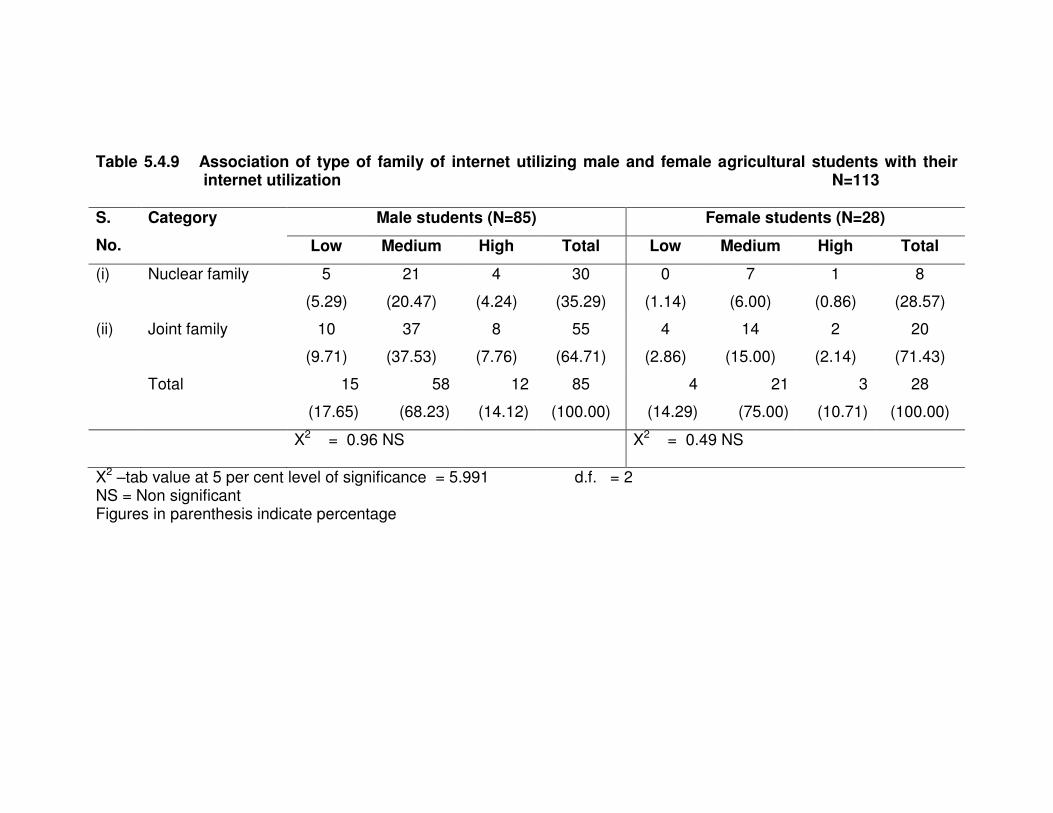
Table 5.4.9 Association of type of family of internet utilizing male and female agricultural students with their internet utilization N=113
S.
No.
Category Male students (N=85) Female students (N=28)
Low Medium High Total Low Medium High Total
(i) Nuclear family 5
(5.29)
21
(20.47)
4
(4.24)
30
(35.29)
0
(1.14)
7
(6.00)
1
(0.86)
8
(28.57)
(ii) Joint family 10
(9.71)
37
(37.53)
8
(7.76)
55
(64.71)
4
(2.86)
14
(15.00)
2
(2.14)
20
(71.43)
Total 15
(17.65)
58
(68.23)
12
(14.12)
85
(100.00)
4
(14.29)
21
(75.00)
3
(10.71)
28
(100.00)
X2 = 0.96 NS X2 = 0.49 NS
X2 –tab value at 5 per cent level of significance = 5.991 d.f. = 2 NS = Non significant Figures in parenthesis indicate percentage
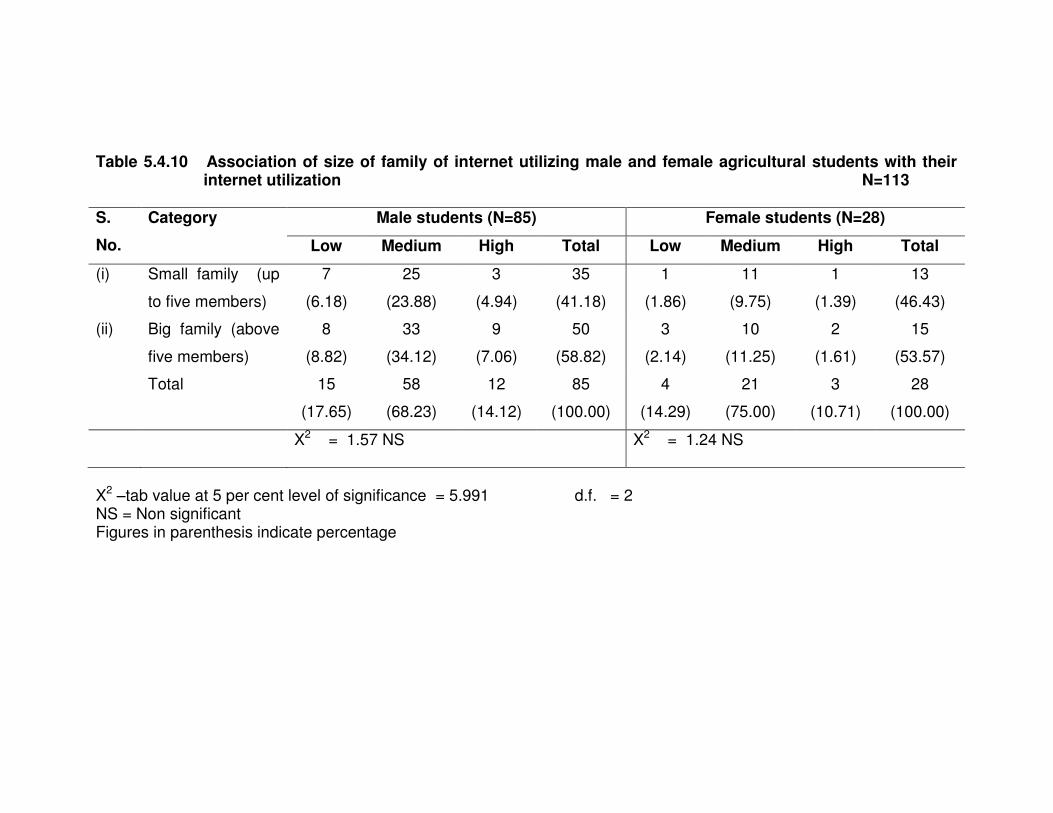
Table 5.4.10 Association of size of family of internet utilizing male and female agricultural students with their internet utilization N=113
S.
No.
Category Male students (N=85) Female students (N=28)
Low Medium High Total Low Medium High Total
(i) Small family (up
to five members)
7
(6.18)
25
(23.88)
3
(4.94)
35
(41.18)
1
(1.86)
11
(9.75)
1
(1.39)
13
(46.43)
(ii) Big family (above
five members)
8
(8.82)
33
(34.12)
9
(7.06)
50
(58.82)
3
(2.14)
10
(11.25)
2
(1.61)
15
(53.57)
Total 15
(17.65)
58
(68.23)
12
(14.12)
85
(100.00)
4
(14.29)
21
(75.00)
3
(10.71)
28
(100.00)
X2 = 1.57 NS X2 = 1.24 NS
X2 –tab value at 5 per cent level of significance = 5.991 d.f. = 2 NS = Non significant Figures in parenthesis indicate percentage
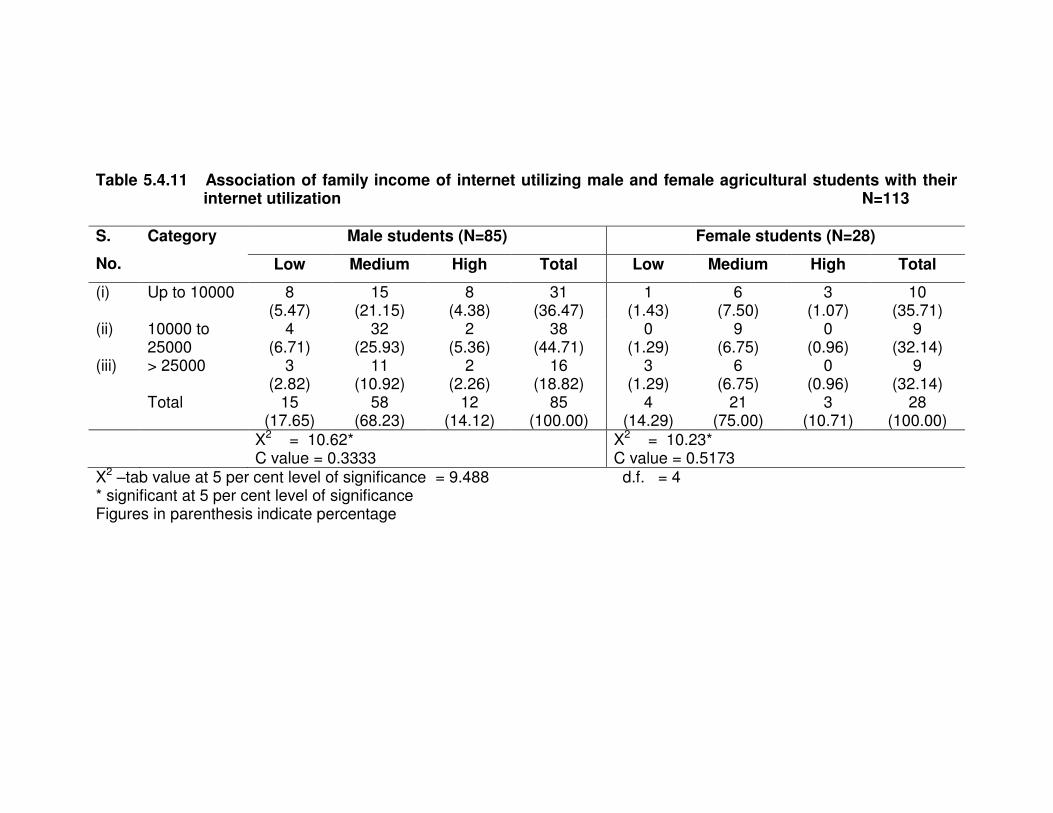
Table 5.4.11 Association of family income of internet utilizing male and female agricultural students with their
internet utilization N=113
S.
No.
Category Male students (N=85) Female students (N=28)
Low Medium High Total Low Medium High Total
(i) Up to 10000
8 (5.47)
15 (21.15)
8 (4.38)
31 (36.47)
1 (1.43)
6 (7.50)
3 (1.07)
10 (35.71)
(ii) 10000 to 25000
4 (6.71)
32 (25.93)
2 (5.36)
38 (44.71)
0 (1.29)
9 (6.75)
0 (0.96)
9 (32.14)
(iii) > 25000 3 (2.82)
11 (10.92)
2 (2.26)
16 (18.82)
3 (1.29)
6 (6.75)
0 (0.96)
9 (32.14)
Total 15 (17.65)
58 (68.23)
12 (14.12)
85 (100.00)
4 (14.29)
21 (75.00)
3 (10.71)
28 (100.00)
X2 = 10.62* C value = 0.3333
X2 = 10.23* C value = 0.5173
X2 –tab value at 5 per cent level of significance = 9.488 d.f. = 4 * significant at 5 per cent level of significance Figures in parenthesis indicate percentage
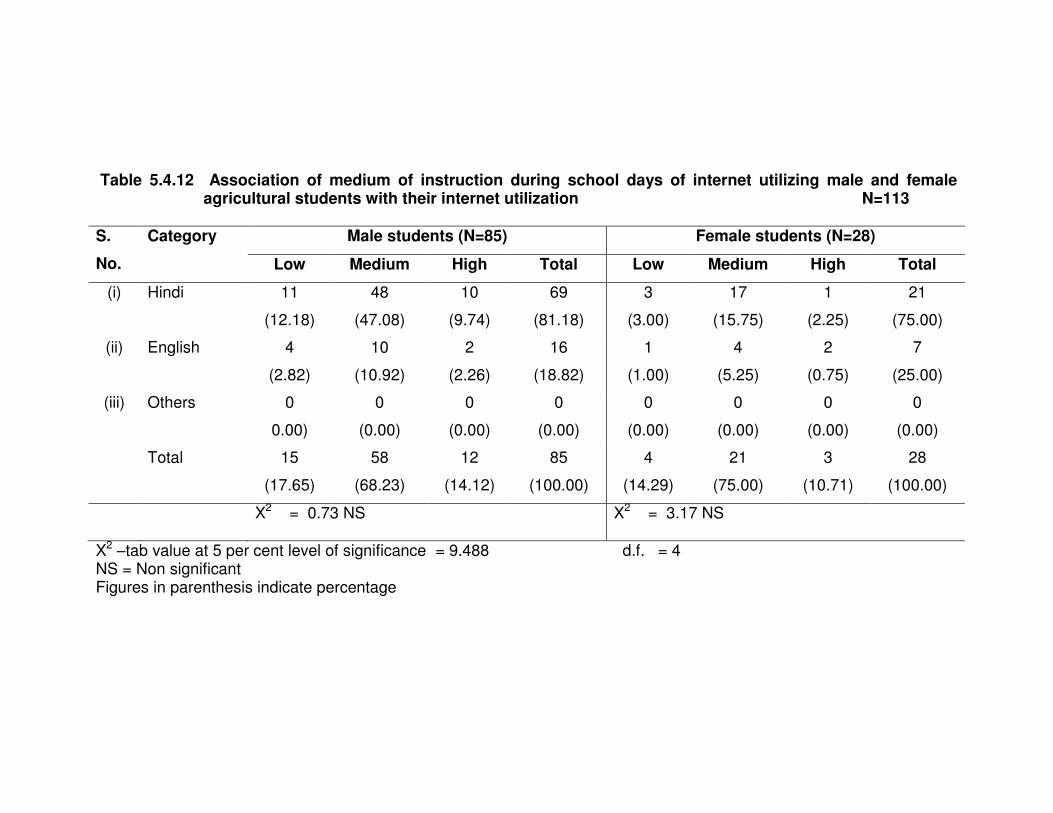
Table 5.4.12 Association of medium of instruction during school days of internet utilizing male and female
agricultural students with their internet utilization N=113
S.
No.
Category Male students (N=85) Female students (N=28)
Low Medium High Total Low Medium High Total
(i) Hindi 11
(12.18)
48
(47.08)
10
(9.74)
69
(81.18)
3
(3.00)
17
(15.75)
1
(2.25)
21
(75.00)
(ii) English 4
(2.82)
10
(10.92)
2
(2.26)
16
(18.82)
1
(1.00)
4
(5.25)
2
(0.75)
7
(25.00)
(iii) Others 0
0.00)
0
(0.00)
0
(0.00)
0
(0.00)
0
(0.00)
0
(0.00)
0
(0.00)
0
(0.00)
Total 15
(17.65)
58
(68.23)
12
(14.12)
85
(100.00)
4
(14.29)
21
(75.00)
3
(10.71)
28
(100.00)
X2 = 0.73 NS X2 = 3.17 NS
X2 –tab value at 5 per cent level of significance = 9.488 d.f. = 4 NS = Non significant Figures in parenthesis indicate percentage
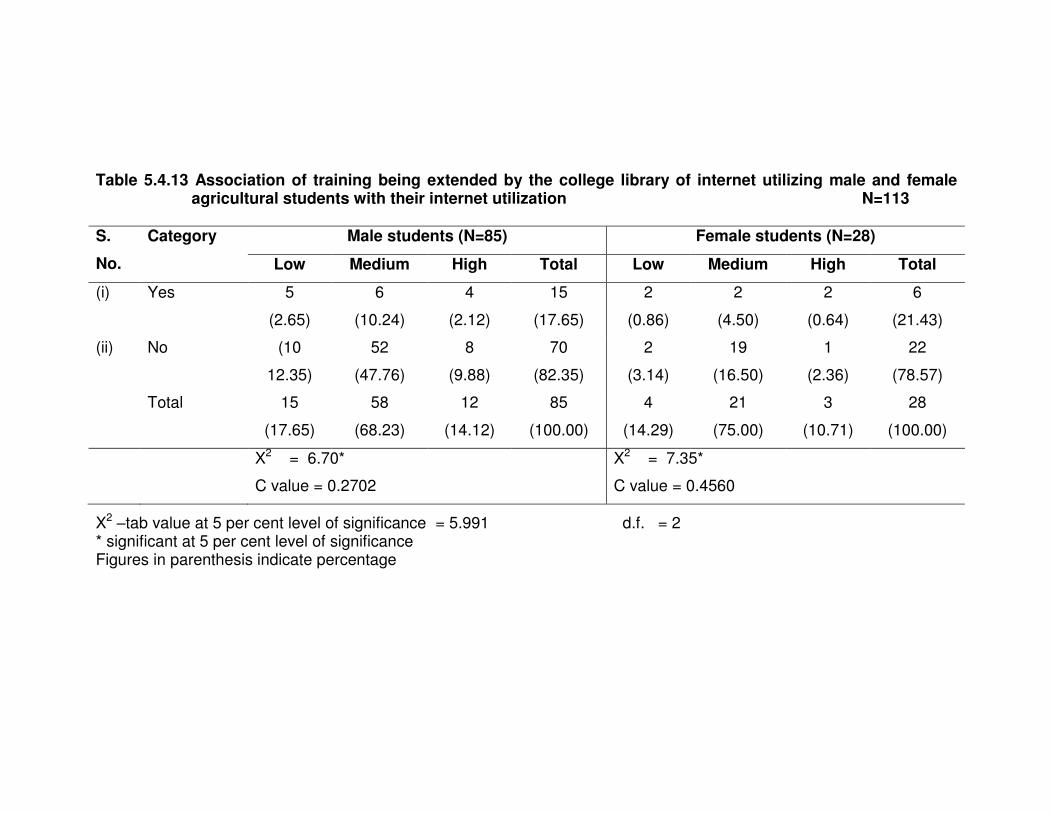
Table 5.4.13 Association of training being extended by the college library of internet utilizing male and female
agricultural students with their internet utilization N=113
S.
No.
Category Male students (N=85) Female students (N=28)
Low Medium High Total Low Medium High Total
(i) Yes 5
(2.65)
6
(10.24)
4
(2.12)
15
(17.65)
2
(0.86)
2
(4.50)
2
(0.64)
6
(21.43)
(ii) No (10
12.35)
52
(47.76)
8
(9.88)
70
(82.35)
2
(3.14)
19
(16.50)
1
(2.36)
22
(78.57)
Total 15
(17.65)
58
(68.23)
12
(14.12)
85
(100.00)
4
(14.29)
21
(75.00)
3
(10.71)
28
(100.00)
X2 = 6.70*
C value = 0.2702
X2 = 7.35*
C value = 0.4560
X2 –tab value at 5 per cent level of significance = 5.991 d.f. = 2 * significant at 5 per cent level of significance Figures in parenthesis indicate percentage
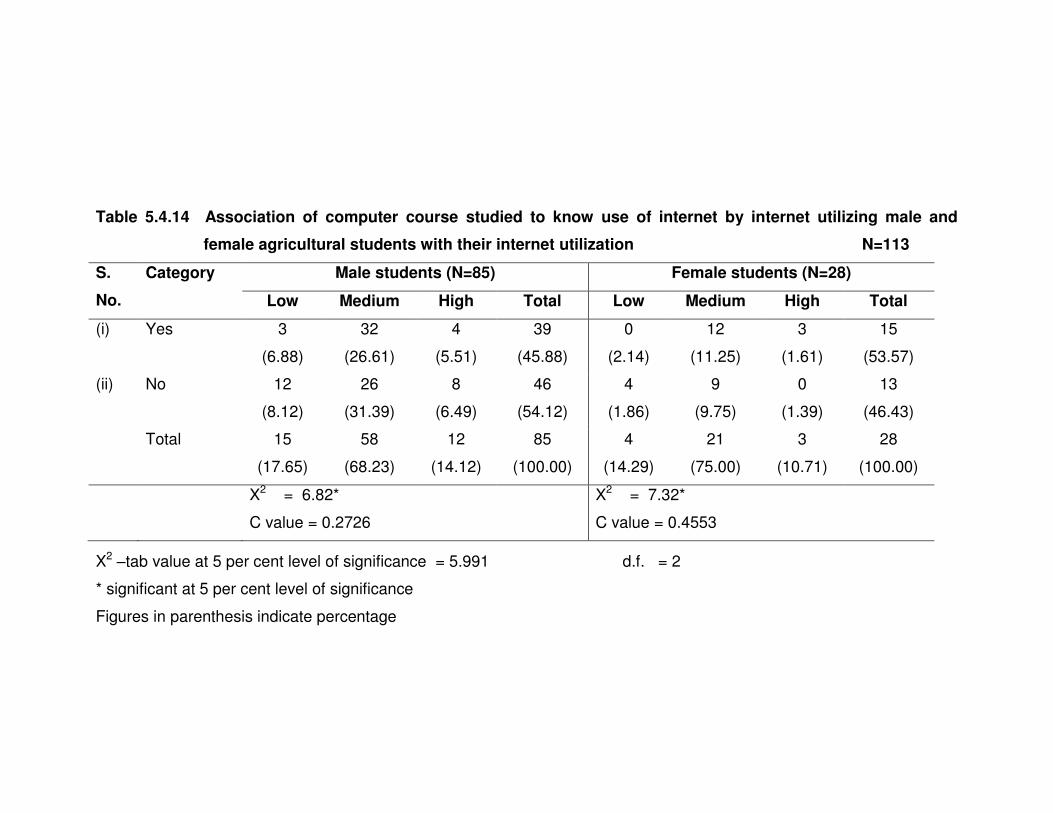
Table 5.4.14 Association of computer course studied to know use of internet by internet utilizing male and
female agricultural students with their internet utilization N=113
S.
No.
Category Male students (N=85) Female students (N=28)
Low Medium High Total Low Medium High Total
(i) Yes 3
(6.88)
32
(26.61)
4
(5.51)
39
(45.88)
0
(2.14)
12
(11.25)
3
(1.61)
15
(53.57)
(ii) No 12
(8.12)
26
(31.39)
8
(6.49)
46
(54.12)
4
(1.86)
9
(9.75)
0
(1.39)
13
(46.43)
Total 15
(17.65)
58
(68.23)
12
(14.12)
85
(100.00)
4
(14.29)
21
(75.00)
3
(10.71)
28
(100.00)
X2 = 6.82*
C value = 0.2726
X2 = 7.32*
C value = 0.4553
X2 –tab value at 5 per cent level of significance = 5.991 d.f. = 2
* significant at 5 per cent level of significance
Figures in parenthesis indicate percentage
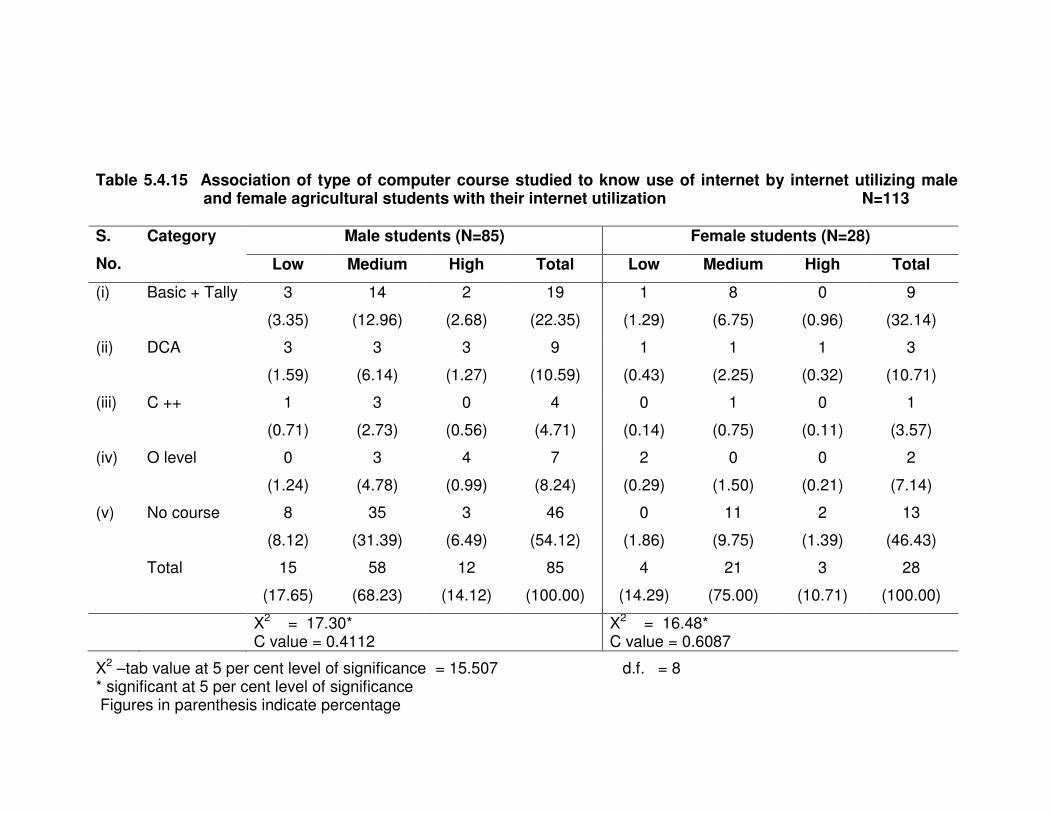
Table 5.4.15 Association of type of computer course studied to know use of internet by internet utilizing male
and female agricultural students with their internet utilization N=113
S.
No.
Category Male students (N=85) Female students (N=28)
Low Medium High Total Low Medium High Total
(i) Basic + Tally 3
(3.35)
14
(12.96)
2
(2.68)
19
(22.35)
1
(1.29)
8
(6.75)
0
(0.96)
9
(32.14)
(ii) DCA 3
(1.59)
3
(6.14)
3
(1.27)
9
(10.59)
1
(0.43)
1
(2.25)
1
(0.32)
3
(10.71)
(iii) C ++ 1
(0.71)
3
(2.73)
0
(0.56)
4
(4.71)
0
(0.14)
1
(0.75)
0
(0.11)
1
(3.57)
(iv) O level 0
(1.24)
3
(4.78)
4
(0.99)
7
(8.24)
2
(0.29)
0
(1.50)
0
(0.21)
2
(7.14)
(v) No course 8
(8.12)
35
(31.39)
3
(6.49)
46
(54.12)
0
(1.86)
11
(9.75)
2
(1.39)
13
(46.43)
Total 15
(17.65)
58
(68.23)
12
(14.12)
85
(100.00)
4
(14.29)
21
(75.00)
3
(10.71)
28
(100.00)
X2 = 17.30* C value = 0.4112
X2 = 16.48* C value = 0.6087
X2 –tab value at 5 per cent level of significance = 15.507 d.f. = 8 * significant at 5 per cent level of significance Figures in parenthesis indicate percentage
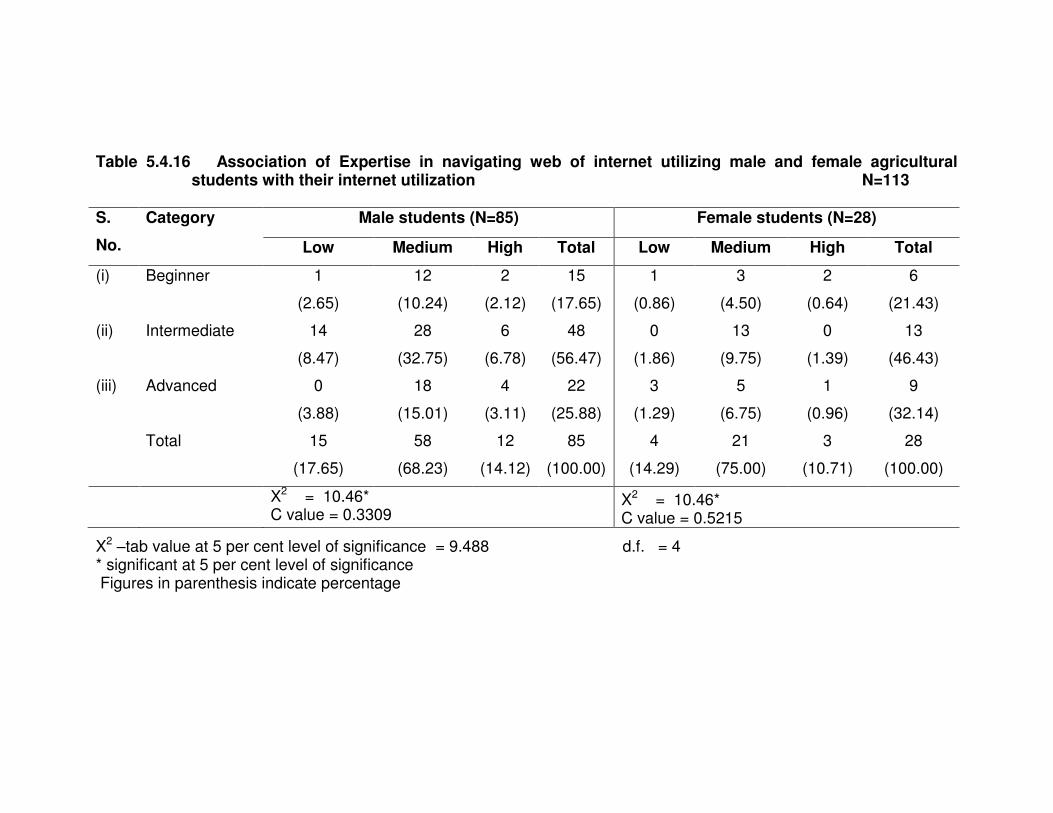
Table 5.4.16 Association of Expertise in navigating web of internet utilizing male and female agricultural students with their internet utilization N=113
S.
No.
Category Male students (N=85) Female students (N=28)
Low Medium High Total Low Medium High Total
(i) Beginner 1
(2.65)
12
(10.24)
2
(2.12)
15
(17.65)
1
(0.86)
3
(4.50)
2
(0.64)
6
(21.43)
(ii) Intermediate 14
(8.47)
28
(32.75)
6
(6.78)
48
(56.47)
0
(1.86)
13
(9.75)
0
(1.39)
13
(46.43)
(iii) Advanced 0
(3.88)
18
(15.01)
4
(3.11)
22
(25.88)
3
(1.29)
5
(6.75)
1
(0.96)
9
(32.14)
Total 15
(17.65)
58
(68.23)
12
(14.12)
85
(100.00)
4
(14.29)
21
(75.00)
3
(10.71)
28
(100.00)
X2 = 10.46* C value = 0.3309
X2 = 10.46* C value = 0.5215
X2 –tab value at 5 per cent level of significance = 9.488 d.f. = 4 * significant at 5 per cent level of significance Figures in parenthesis indicate percentage
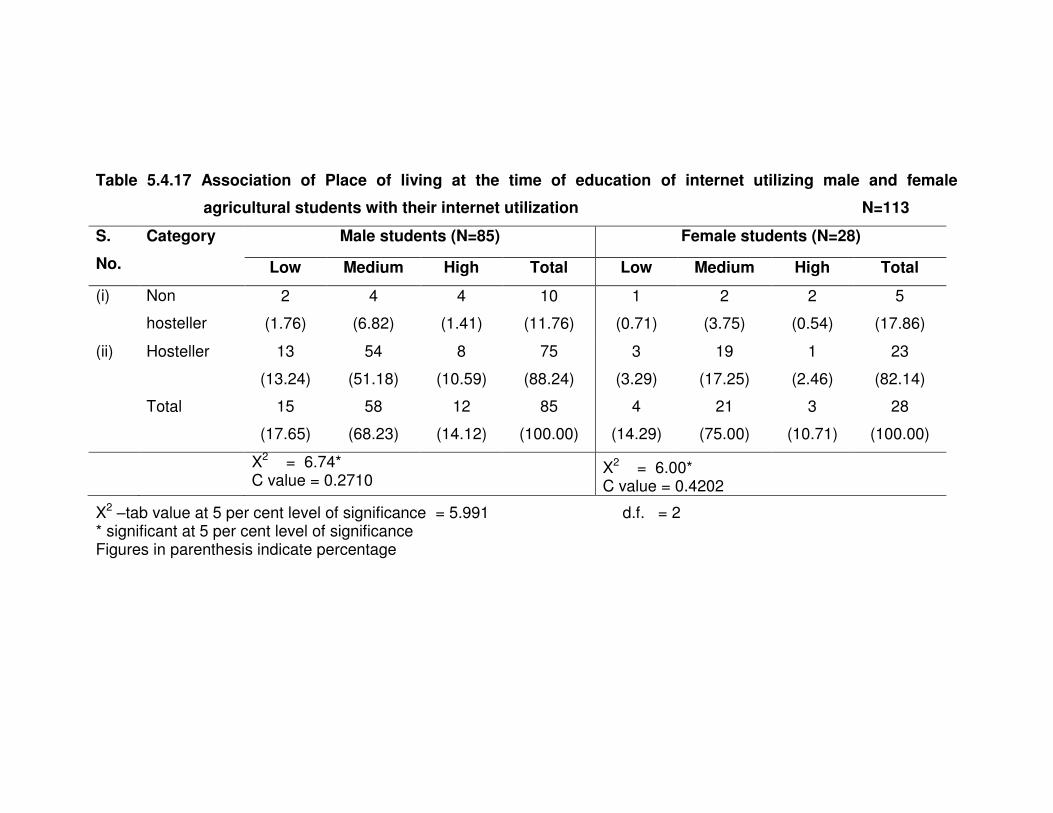
Table 5.4.17 Association of Place of living at the time of education of internet utilizing male and female
agricultural students with their internet utilization N=113
S.
No.
Category Male students (N=85) Female students (N=28)
Low Medium High Total Low Medium High Total
(i) Non
hosteller
2
(1.76)
4
(6.82)
4
(1.41)
10
(11.76)
1
(0.71)
2
(3.75)
2
(0.54)
5
(17.86)
(ii) Hosteller 13
(13.24)
54
(51.18)
8
(10.59)
75
(88.24)
3
(3.29)
19
(17.25)
1
(2.46)
23
(82.14)
Total 15
(17.65)
58
(68.23)
12
(14.12)
85
(100.00)
4
(14.29)
21
(75.00)
3
(10.71)
28
(100.00)
X2 = 6.74* C value = 0.2710
X2 = 6.00* C value = 0.4202
X2 –tab value at 5 per cent level of significance = 5.991 d.f. = 2 * significant at 5 per cent level of significance Figures in parenthesis indicate percentage
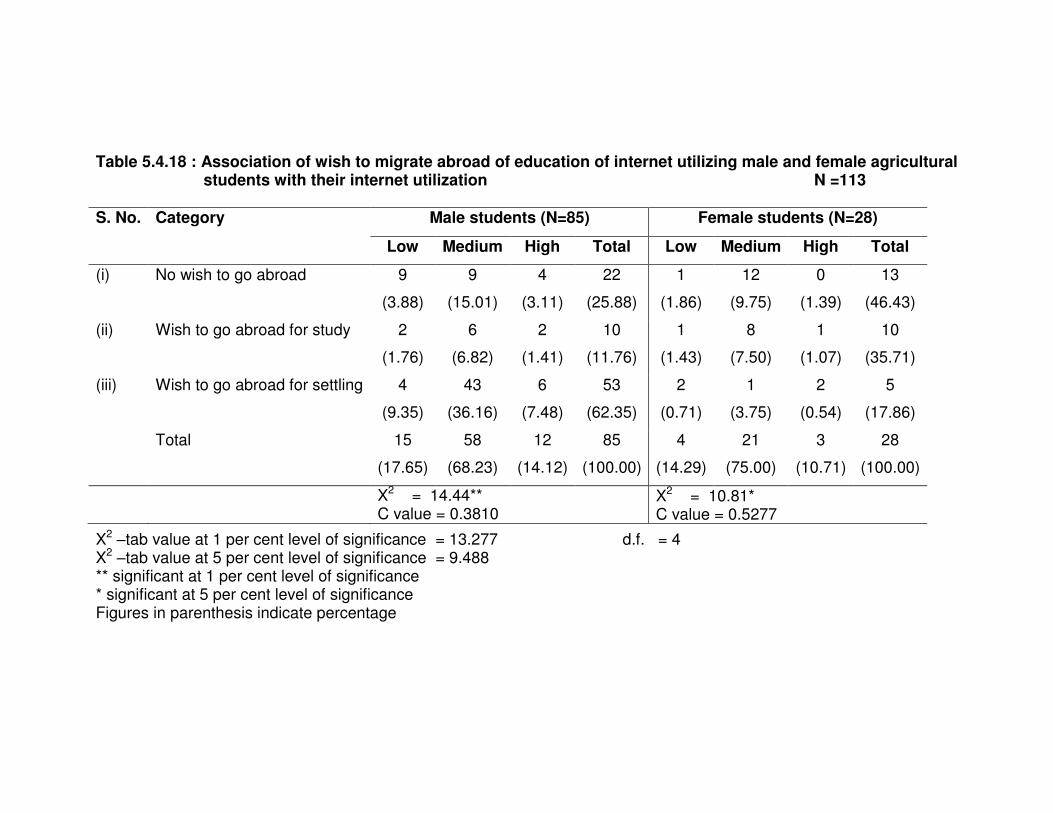
Table 5.4.18 : Association of wish to migrate abroad of education of internet utilizing male and female agricultural students with their internet utilization N =113
S. No. Category Male students (N=85) Female students (N=28)
Low Medium High Total Low Medium High Total
(i) No wish to go abroad 9
(3.88)
9
(15.01)
4
(3.11)
22
(25.88)
1
(1.86)
12
(9.75)
0
(1.39)
13
(46.43)
(ii) Wish to go abroad for study 2
(1.76)
6
(6.82)
2
(1.41)
10
(11.76)
1
(1.43)
8
(7.50)
1
(1.07)
10
(35.71)
(iii) Wish to go abroad for settling 4
(9.35)
43
(36.16)
6
(7.48)
53
(62.35)
2
(0.71)
1
(3.75)
2
(0.54)
5
(17.86)
Total 15
(17.65)
58
(68.23)
12
(14.12)
85
(100.00)
4
(14.29)
21
(75.00)
3
(10.71)
28
(100.00)
X2 = 14.44** C value = 0.3810
X2 = 10.81* C value = 0.5277
X2 –tab value at 1 per cent level of significance = 13.277 d.f. = 4 X2 –tab value at 5 per cent level of significance = 9.488 ** significant at 1 per cent level of significance * significant at 5 per cent level of significance Figures in parenthesis indicate percentage
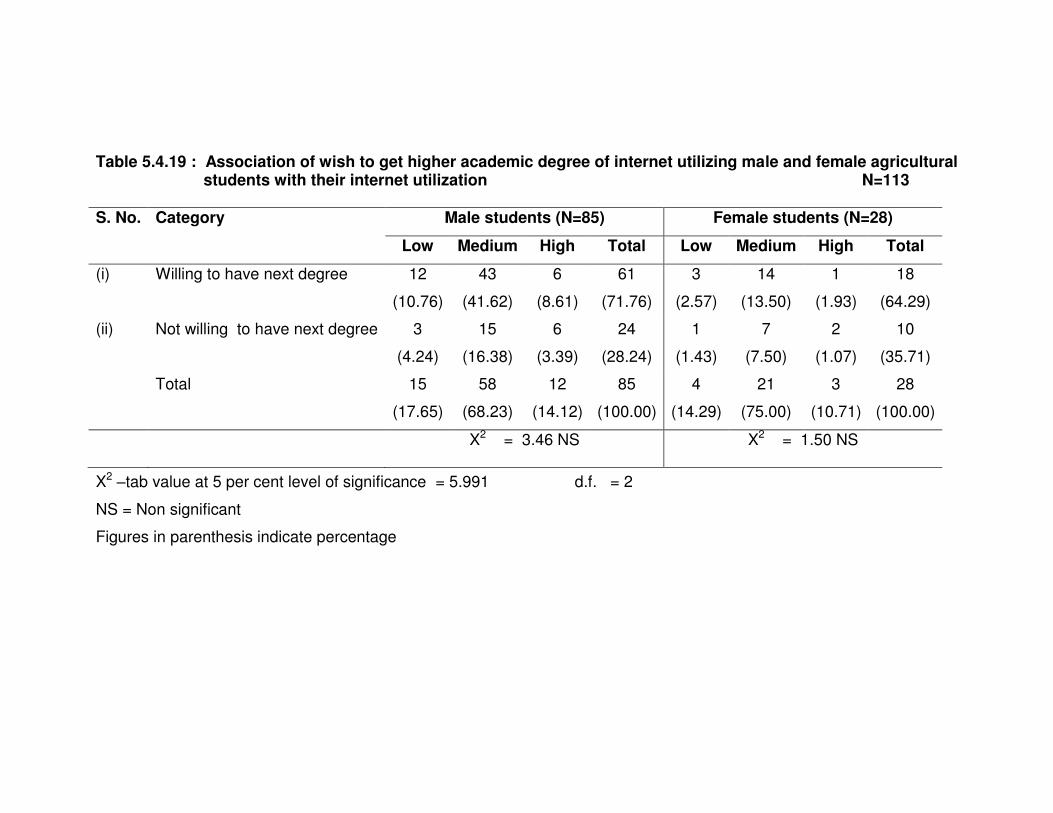
Table 5.4.19 : Association of wish to get higher academic degree of internet utilizing male and female agricultural students with their internet utilization N=113
S. No. Category Male students (N=85) Female students (N=28)
Low Medium High Total Low Medium High Total
(i) Willing to have next degree 12
(10.76)
43
(41.62)
6
(8.61)
61
(71.76)
3
(2.57)
14
(13.50)
1
(1.93)
18
(64.29)
(ii) Not willing to have next degree 3
(4.24)
15
(16.38)
6
(3.39)
24
(28.24)
1
(1.43)
7
(7.50)
2
(1.07)
10
(35.71)
Total 15
(17.65)
58
(68.23)
12
(14.12)
85
(100.00)
4
(14.29)
21
(75.00)
3
(10.71)
28
(100.00)
X2 = 3.46 NS X2 = 1.50 NS
X2 –tab value at 5 per cent level of significance = 5.991 d.f. = 2
NS = Non significant
Figures in parenthesis indicate percentage
Related Documents