TECHNOLOGY AND INTERNET-RELATED INFORMATION BEHAVIORS OF PRINT JOURNALISTS IN KUWAIT by Abdulnasir Taleb Mansoor Abdulla B.S., Kansas State University, 1997 MLIS, Kuwait University, 2001 Submitted to the Graduate Faculty of The School of Information Sciences in partial fulfillment of the requirements for the degree of Doctor of Philosophy University of Pittsburgh December, 2006

Welcome message from author
This document is posted to help you gain knowledge. Please leave a comment to let me know what you think about it! Share it to your friends and learn new things together.
Transcript
TECHNOLOGY AND INTERNET-RELATED INFORMATION BEHAVIORS OF PRINT JOURNALISTS IN KUWAIT
by
Abdulnasir Taleb Mansoor Abdulla
B.S., Kansas State University, 1997
MLIS, Kuwait University, 2001
Submitted to the Graduate Faculty of
The School of Information Sciences in partial fulfillment
of the requirements for the degree of Doctor of Philosophy
University of Pittsburgh
December, 2006
UNIVERSITY OF PITTSBURGH
SCHOOL OF INFORMATION SCIENCE
This dissertation was presented
by
Abdulnasir Taleb Mansoor Abdulla
It was defended on
December 11, 2006
and approved by
Stuart Shulman, Ph.D., Department of Library & Information Science
Sherry Koshman, Ph.D., Department of Library & Information Science
Laurence Glasco, Ph.D., Department of History
Dissertation Director: Ellen Detlefsen, Ph.D., Department of Library & Information Science
ii

Copyright © by Abdulnasir Taleb Mansoor Abdulla 2006
iii
TECHNOLOGY AND INTERNET-RELATED INFORMATION BEHAVIORS OF PRINT JOURNALISTS IN KUWAIT
Abdulnasir Taleb Mansoor Abdulla, Ph.D.
University of Pittsburgh, 2006
Dissertation Director: Dr. Ellen Detlefsen, Department of Library and Information Science This study focused on journalists, who are constantly seeking, processing, evaluating and
packaging information, in order to shed light on their information behaviors, and contribute to
the development of efficient information behaviors. The examination focused on the information
behaviors of journalists as they relate to the Internet and information technologies.
The population included all print journalists in Kuwait, and was examined using a self-
administered questionnaire and interviews by E-mail. Information behaviors were examined
from three perspectives: Access and Internet usage, evaluation and purpose, and information
technology skills. Access and Internet usage was related to obstacles preventing Internet use, and
usage patterns of popular Internet applications such as E-mail. Evaluation and purpose was
related to information evaluation criteria, the Internet for conducting journalistic tasks, and the
use of the Internet to seek specific types of information. In terms of skills, the examination
focused on the skills of journalists in using 21 information technology tools and applications, and
their usage patterns of information technology devices.
iv
Results showed that print journalists in Kuwait were lacking efficient information
behaviors in relations to the Internet and information technology. Their usage of the Internet was
limited to the most popular applications such as E-mail, search engines, and the World Wide
Web. Female journalists were found to be more skilled, and more utilizing, of the Internet than
males. Data revealed a large gap in terms of information behaviors between the youngest
journalists and the rest of the population. The youngest journalists were found to be more skilled
in using the Internet, and relied more heavily on the medium than others. Other results showed
that graduates from educational institutions in Kuwait, and Kuwaiti citizens, relied more heavily
on the Internet for conducting journalistic tasks than others.
Further, results identified age, educational level, journalism experience and Internet
experience as important factors that affected information behaviors. Improved behaviors for
journalists in Kuwait require interventions on three fronts: education and curricula, training, and
workplace practices. These interventions can pave the way for an efficient journalism industry in
Kuwait which utilizes the Internet and information technology to its benefit.
v
TABLE OF CONTENTS
TABLE OF CONTENTS_______________________________________________________ vi
1.0 INTRODUCTION _________________________________________________________ 1 1.1 STATEMENT OF THE PROBLEM ______________________________________________ 3 1.2 STUDY FOCUS _______________________________________________________________ 5 1.3 IMPORTANCE AND SIGNIFICANCE ___________________________________________ 6 1.4 OBJECTIVES_________________________________________________________________ 7 1.5 RESEARCH QUESTIONS ______________________________________________________ 7 1.6 LIMITATIONS________________________________________________________________ 9 1.7 INFORMATION ABOUT KUWAIT _____________________________________________ 12
2.0 LITERATURE REVIEW___________________________________________________ 15 2.1 HUMAN INFORMATION BEHAVIOR __________________________________________ 15 2.2 INFORMATION BEHAVIORS OF JOURNALISTS _______________________________ 19
2.2.1 Source Preferences__________________________________________________________________19 2.2.2 Information Needs & Uses____________________________________________________________24 2.2.3 Information Technology & Internet _____________________________________________________26 2.2.4 Skills, Training, and Evaluation________________________________________________________34
2.3 THEORETICAL FRAMEWORK _______________________________________________ 38 3.0 METHODOLOGY ________________________________________________________ 41
3.1 DESIGN OF RESEARCH INSTRUMENT ________________________________________ 44 3.1.1 Access & Internet Usage _____________________________________________________________44 3.1.2 Evaluation & Purpose _______________________________________________________________46 3.1.3 Skills ____________________________________________________________________________47 3.1.4 Demographics _____________________________________________________________________48 3.1.5 Comments ________________________________________________________________________48
3.2 FOLLOW-UP INTERVIEWS BY E-MAIL _______________________________________ 49 3.2.1 Methodological Findings for Interviews by E-mail _________________________________________51
3.3 POPULATION OF STUDY ____________________________________________________ 53 3.4 PRE-TESTING QUESTIONNAIRE _____________________________________________ 53 3.5 ADMINISTRATION OF QUESTIONNAIRE _____________________________________ 55 3.6 CODING AND DATA ANALYSIS_______________________________________________ 57
vi

3.6.1 Questionnaire ______________________________________________________________________57 3.6.2 Age______________________________________________________________________________59 3.6.3 Primary Journalistic Beat _____________________________________________________________60 3.6.4 Citizenship ________________________________________________________________________62 3.6.5 Level of Education __________________________________________________________________63 3.6.6 Primary Field of Study_______________________________________________________________64 3.6.7 Location of Educational Institution _____________________________________________________66 3.6.8 Languages Known __________________________________________________________________66
3.7 MISSING VALUES ___________________________________________________________ 67 3.8 RELIABILITY AND VALIDITY________________________________________________ 68 3.9 TIMELINE __________________________________________________________________ 68
4.0 DATA ANALYSIS AND RESULTS __________________________________________ 70 4.1 DEMOGRAPHICS____________________________________________________________ 71
4.1.1 Response Rate _____________________________________________________________________71 4.1.2 General Characteristics of Population ___________________________________________________73 4.1.3 Characteristics of Female Population____________________________________________________76 4.1.4 Characteristics of Male Population _____________________________________________________78 4.1.5 Significant Demographic Differences ___________________________________________________80
4.2 RQ1- INTERNET ACCESS, NATURE & BARRIERS ______________________________ 82 4.3 RQ2- INTERNET APPLICATIONS USE AND NATURE ___________________________ 87
4.3.1 By Gender ________________________________________________________________________88 4.3.2 By Age ___________________________________________________________________________91 4.3.3 By Journalistic Beat _________________________________________________________________93 4.3.4 By Length of Internet Experience ______________________________________________________94 4.3.5 By Level of Education _______________________________________________________________96 4.3.6 By Primary Field of Study ____________________________________________________________98 4.3.7 By Location of Educational Institution _________________________________________________100 4.3.8 By Languages Known ______________________________________________________________102 4.3.9 By-Email provided_________________________________________________________________102 4.3.10 By Other Variables________________________________________________________________104
4.4 EXPERIENCE USING INTERNET ____________________________________________ 104 4.4.1 Use of E-mail _____________________________________________________________________105 4.4.2 E-mail Attractions _________________________________________________________________106 4.4.3 E-mail Shortcomings _______________________________________________________________107 4.4.4 WWW __________________________________________________________________________108 4.4.5 Importance of WWW Resources ______________________________________________________109
4.5 RQ3- INFORMATION EVALUATION CRITERIA _______________________________ 118 4.5.1 By Gender _______________________________________________________________________119 4.5.2 By Primary Journalistic Beat _________________________________________________________120 4.5.3 By Internet Experience______________________________________________________________122 4.5.4 By Other Variables_________________________________________________________________123
4.6 RQ4- INTERNET AND JOURNALISTIC TASKS ________________________________ 123 4.6.1 By Gender _______________________________________________________________________124 4.6.2 By Age __________________________________________________________________________126 4.6.3 By Length of Experience as Journalist__________________________________________________127 4.6.4 By Internet Experience______________________________________________________________129 4.6.5 By Citizenship ____________________________________________________________________130 4.6.6 By Location of Educational Institution _________________________________________________131 4.6.7 By Languages Known ______________________________________________________________133 4.6.8 By Other Variables_________________________________________________________________134
vii
4.7 RQ5- INTERNET FOR INFORMATION________________________________________ 135 4.7.1 By Gender _______________________________________________________________________136 4.7.4 By Primary Field of Study ___________________________________________________________140 4.7.5 By Languages Known ______________________________________________________________141 4.7.6 By Other Variables_________________________________________________________________142
4.8 RQ6- SKILLS AND USAGE___________________________________________________ 143 4.8.1 By Gender _______________________________________________________________________144 4.8.2 By Age __________________________________________________________________________146 4.8.3 By Length of Experience as Journalist__________________________________________________148 4.8.4 By Internet Experience______________________________________________________________150 4.8.5 By E-mail Provided ________________________________________________________________152 4.8.6 By Languages Known ______________________________________________________________153 4.8.7 By Primary Field of Study ___________________________________________________________155 4.8.8 By Other Variables_________________________________________________________________157 4.8.9 Use of Information Technology Devices ________________________________________________157 4.8.10 By Gender ______________________________________________________________________160 4.8.11 By Age _________________________________________________________________________164 4.8.12 By Length of Experience as Journalist_________________________________________________166 4.8.13 By Citizenship ___________________________________________________________________167 4.8.14 By Level of Education _____________________________________________________________168 4.8.15 By Primary Field of Study __________________________________________________________169 4.8.16 By Number of Languages Known ____________________________________________________171 4.8.17 By Internet Experience_____________________________________________________________172 4.8.18 By E-mail Provided _______________________________________________________________174
4.9 RQ7- COMPARISON OF INFORMATION BEHAVIORS _________________________ 176 4.10 FOLLOW-UP INTERVIEWS BY E-MAIL _____________________________________ 182
4.10.1 Question 1 ______________________________________________________________________183 4.10.2 Question 2 ______________________________________________________________________185 4.10.3 Question 3 ______________________________________________________________________186 4.10.4 Question 4 ______________________________________________________________________188 4.10.5 Question 5 ______________________________________________________________________190
5.0 DISCUSSION __________________________________________________________ 192 5.1 INTERNET ACCESS, NATURE, AND BARRIERS _______________________________ 192
5.1.1 Barriers__________________________________________________________________________194 5.1.2 Findings _________________________________________________________________________196
5.2 INTERNET APPLICATIONS USE AND NATURE _______________________________ 197 5.2.1 Nature of E-mail___________________________________________________________________198 5.2.2 Nature of WWW __________________________________________________________________200 5.2.3 Findings _________________________________________________________________________202
5.3 INFORMATION EVALUATION CRITERIA ____________________________________ 203 5.3.1 Findings _________________________________________________________________________206
5.4 INTERNET AND JOURNALISTIC TASKS _____________________________________ 206 5.4.1 Findings _________________________________________________________________________210
5.5 INTERNET FOR INFORMATION _____________________________________________ 210 5.5.1 Findings _________________________________________________________________________212
5.6 SKILLS AND USAGE ________________________________________________________ 213 5.6.1 Skill-level for Applications/Tools/Software _____________________________________________213 5.6.2 Usage of Information Technology Devices ______________________________________________216 5.6.3 Findings _________________________________________________________________________220
viii
5.7 SUMMARY OF DISCUSSION_________________________________________________ 222 6.0 CONCLUSION AND RECOMMENDATIONS________________________________ 224
6.1 SUMMARY_________________________________________________________________ 224 6.2 CONCLUSIONS_____________________________________________________________ 226 6.3 RECOMMENDATIONS ______________________________________________________ 228
6.3.1 General__________________________________________________________________________228 6.3.2 Education and Curricula_____________________________________________________________229 6.3.3 Journalism-related Recommendations __________________________________________________231 6.3.4 Training _________________________________________________________________________232 6.3.5 Workplace Practices________________________________________________________________233 6.3.7 System-design ____________________________________________________________________235
6.4 FUTURE RESEARCH _______________________________________________________ 236 6.4.1 Considerations for Future Researchers__________________________________________________238
APPENDIX A______________________________________________________________ 241
APPENDIX B______________________________________________________________ 242
APPENDIX C______________________________________________________________ 263
APPENDIX D _____________________________________________________________ 269
APPENDIX E______________________________________________________________ 271
APPENDIX F______________________________________________________________ 285
BIBLIOGRAPHY___________________________________________________________ 287
ix

LIST OF TABLES
Table 1 Map of Research Questions in Questionnaire ................................................................................................43 Table 2 Age Categories According to Initial Coding ..................................................................................................59 Table 3 Age Categories According to Modified Categories ........................................................................................60 Table 4 Primary Journalistic Beats .............................................................................................................................60 Table 5 Modified Primary Journalistic Beats..............................................................................................................61 Table 6 Citizenship ......................................................................................................................................................62 Table 7 Modified Citizenship Categories ....................................................................................................................63 Table 8 Level of Education ..........................................................................................................................................63 Table 9 Modified Level of Education...........................................................................................................................64 Table 10 Primary Field of Study (Majors) ..................................................................................................................64 Table 11 Modified Primary Field of Study ..................................................................................................................65 Table 12 Location of Educational Institution Issuing Degree .....................................................................................66 Table 13 Languages Known ........................................................................................................................................66 Table 14 Timeline for conducting study ......................................................................................................................69 Table 15 Response rates by newspaper .......................................................................................................................72 Table 16 Population gender according to newspaper .................................................................................................72 Table 17 Demographic characteristics of population .................................................................................................75 Table 18 Demographic characteristics of females ......................................................................................................77 Table 19 Demographic characteristics of males .........................................................................................................79 Table 20 Independent-Samples T-test for demographic variables according to gender .............................................80 Table 21 Quantitative statistics comparing males and females...................................................................................81 Table 22 Non-users of the Internet according to gender and age. ..............................................................................82 Table 23 Internet users according to gender and age .................................................................................................82 Table 24 Barriers preventing Internet use...................................................................................................................83 Table 25 Internet access according to location...........................................................................................................84 Table 26 Satisfaction towards the Internet access provided by Institution..................................................................84 Table 27 Satisfaction towards the Internet access provided by Institution by gender.................................................85 Table 28 Quantitative data for length of experience in using Internet by gender .......................................................85 Table 29 Obstacles faced online..................................................................................................................................86 Table 30 Rank of obstacles faced online according to gender ....................................................................................86 Table 31 Time spent using Internet applications.........................................................................................................88 Table 32 Time spent using applications by males and females ...................................................................................90 Table 33 Time spent using applications according to age group ................................................................................92 Table 34 Time spent using applications according to primary journalistic beat ........................................................94 Table 35 Time spent using applications according to Internet experience..................................................................95 Table 36 Time spent using applications according to level of education ....................................................................97 Table 37 Time spent using applications according to primary field of study ..............................................................99 Table 38 ANOVA results for time using applications by location of edu. institution ................................................100 Table 39 Time spent using applications by location of last educational institution ..................................................101 Table 40 Time spent using applications according to E-mail provided ....................................................................103
x
Table 41 Experience in using the Internet by gender ................................................................................................105 Table 42 Quantitative data for work-related E-mails sent and received...................................................................105 Table 43 Attractive features of E-mail.......................................................................................................................106 Table 44 Attractive features of E-mail according to gender .....................................................................................107 Table 45 E-mail worries/shortcomings......................................................................................................................107 Table 46 E-mail worries/shortcomings by gender.....................................................................................................108 Table 47 Importance of WWW resources ..................................................................................................................110 Table 48 Importance of WWW resources by gender..................................................................................................111 Table 49 Importance of WWW resources by primary journalistic beat.....................................................................113 Table 50 Importance of WWW resources by Internet experience..............................................................................114 Table 51 Importance of WWW resources by primary field of study ..........................................................................117 Table 52 Importance of evaluation criteria by population ........................................................................................119 Table 53 Importance of evaluation criteria by gender ..............................................................................................120 Table 54 Importance of evaluation criteria by primary journalistic beat .................................................................121 Table 55 Importance of evaluation criteria by Internet experience ..........................................................................122 Table 56 Importance of Internet use for conducting tasks by population..................................................................124 Table 57 Importance of Internet use for conducting tasks by gender........................................................................125 Table 58 Importance of Internet use for conducting tasks by age .............................................................................127 Table 59 Importance of Internet use by length of experience as journalist...............................................................128 Table 60 Importance of Internet use by Internet experience .....................................................................................129 Table 61 Importance of Internet use by citizenship ...................................................................................................131 Table 62 Importance of Internet use by location of educational institution ..............................................................132 Table 63 Importance of Internet use by number of languages...................................................................................134 Table 64 Likeliness of using Internet for information by population.........................................................................136 Table 65 Likeliness of using Internet by gender ........................................................................................................137 Table 66 Likeliness of using Internet by Internet experience ....................................................................................138 Table 67 Likeliness of using Internet by level of education.......................................................................................140 Table 68 Likeliness of using Internet by languages known .......................................................................................142 Table 69 Ranking of applications according to journalists’ skill-levels....................................................................144 Table 70 Skill-level of journalists by gender .............................................................................................................145 Table 71 Skill-level of journalists by age...................................................................................................................147 Table 72 Skill-level of journalists by experience as journalists.................................................................................149 Table 73 Skill-level of journalists by length of experience in using Internet.............................................................151 Table 74 Skill-level of journalists by E-mail provided or not....................................................................................152 Table 75 Skill-level of journalists by languages known.............................................................................................154 Table 76 Skill-level of journalists by primary field of study ......................................................................................156 Table 77 Traditional and recent information technology devices .............................................................................157 Table 78 Use of information technology devices by population................................................................................159 Table 79 Use of information technology devices according gender..........................................................................161 Table 80 Future use of information technology devices according to gender...........................................................162 Table 81 No use and no intention of using information technology devices by gender.............................................164 Table 82 Use of IT devices according to age category..............................................................................................165 Table 83 Use of IT devices according to length of experience as a journalist ..........................................................166 Table 84 Use of IT devices according to citizenship .................................................................................................167 Table 85 Use of IT devices according to level of education ......................................................................................169 Table 86 Use of IT devices according to primary field of study ................................................................................170 Table 87 Use of IT devices according to number of languages known......................................................................172 Table 88 Use of IT devices according to length of Internet experience.....................................................................174 Table 89 Use of IT devices according to E-mail provided ........................................................................................175 Table 90 Use of Internet information for conducting journalistic tasks ....................................................................178 Table 91 Types of information obtained from the Internet ........................................................................................179 Table 92 Importance of evaluation criteria ...............................................................................................................180 Table 93 Work-related E-mails sent and received by mean ......................................................................................181
xi

LIST OF FIGURES
Figure 1 Front-page of Al-Seyassah newspaper for 10/14/2006 (Arabic) ................................................................276
xii
ACKNOWLEDGMENTS First and foremost, I would like to thank God Almighty for giving me so many opportunities to
fulfill my dreams and more. Also, I would like to thank my committee members for their
unrestricted support and guidance that resulted in this final manuscript.
I would like to thank Dr. Ellen Detlefsen, doctoral committee chair, for her constant
support and guidance towards achieving this final outcome. Further, I would like to thank Dr.
Laurence Glasco, Dr. Sherry Koshman, and Dr. Stuart Shulman, for their invaluable time,
support, and guidance.
I would like to extend my gratitude to Dr. Mumtaz Anwar for being supportive of my
educational endeavors, for caring, and for being an outstanding father-figure to me. Also, I
would like to extend my gratitude to my professors in Kuwait including Dr. Taghreed Alqudsi-
ghabra, Dr. Husain Al-Ansari, Dr. Sajjad ur Rehman, and Dr. Charlene Al-Qallaf, for their
encouragement and support over the years.
On a personal level, my thanks go to my relatives and friends in Pittsburgh and Kuwait
especially Hassan Al-Abdullah and Mohammed Jamal, for being true friends. I would like to
thank all of my family members, and my wife's family members, including her brother Ali, and
uncle Najeeb, for their support and understanding.
Other individuals I would like to thank include Dr. Hussain Dashti, Dr. Imad Dashti,
Rasheed Al-Shimmari, Hakeem Al-Refaee, Essam Al-Ghanim, Amer Fardan, and Yousif Al-Ali.
xiii

Finally, I would like to thank His Highness the Amir of Kuwait Sheikh Sabah Al-Ahmad
Al-Jaber Al-Sabah and the late Amir His Highness Sheikh Jaber Al-Ahmad Al-Jaber Al-Sabah
peace be upon him, for supporting students and education in Kuwait, and for giving me and all
Kuwait citizens a chance to make our dreams a reality.
xiv

DEDICATION
To my grandmothers and grandfathers God Bless their souls… …I seek your understanding, forgiveness, and guidance
To my parents Taleb and Noria… …Thank you for being the best parents in the world
To Alia, Mansoor, Mohammed, Manaf, and Ali… …Thank you for being the best sister and brothers
To Hussain Al-Shatti and to all the ones who left before us… …We shall be united, with God's Will
To my wife Dalia Al-Shatti… …You are the past, the present, and the future
To everyone who prayed for my success… …Thank you and May God Bless you all
To Liverpool Football Club… …You Will Never Walk Alone
xv
1.0 INTRODUCTION
The 1990s witnessed the commercial introduction of a new communications medium in the form
of the Internet. Unlike its predecessors, this medium was embraced rapidly around the globe due
to its nature, availability, cost, and its potential to deliver information across boundaries and
geographic locations. Since its arrival in the public domain, the Internet rapidly gained
popularity and acceptance. As the Internet grew and penetrated societies around the globe,
researchers were busy examining the new medium. The first phase of research tended to point to
the limitless possibilities of the Internet such as communication across the globe, information at
the press of a button, video and audio of events occurring a continent away, etc. Once the
Internet became a well-known medium, and started pushing towards creating information
societies, the first phase merged with the second where researchers started examining the effects
of the Internet on humans in many different contexts. Researchers were moving from system-
centered research to user-centered research.
Despite the popularity of the new medium amongst the different research fields, there
remains a large area to be explored and examined systematically in terms of how humans use the
Internet, purpose and efficiency of use, evaluation of online information, barriers to access, and
others. These human information behaviors represent an area of great importance to Library and
Information Science (LIS) professionals, who seek to provide theoretical and applied
recommendations that enhance human behaviors through understanding the complex processes
1
and interactions with information systems and sources. The sought enhancements include areas
of fulfilling information needs, seeking, and use, through systems design, educational techniques,
time-efficient delivery of information, packaging of information, and an improved human
information behavior overall.
One of the groups previously examined by researchers was journalists. The previous
studies focused on source preferences, library use, information technologies and uses, effects of
the Internet, skills, and training. The popularity of the Internet is reflected on research interests,
as a review of the literature revealed a shift towards examining the Internet and information
technologies. The increased adoption of the new medium by almost all professions (Gralla,
2004) facilitated the previously mentioned shift in research interests across disciplines, especially
in LIS.
Journalists, important as they are as information consumers as well as producers at the
same time, were not investigated in the LIS field until the mid-1980s (Herron, 1986). Since that
time, a small number of studies were conducted to understand journalists’ information behaviors
and its various aspects. As the Internet gained increasing popularity and was being integrated
into different sectors of society including business and education, it became important to gain a
better understanding of the medium, its uses, its benefits, and its weaknesses.
This understanding assisted in recommending and implementing policies, best-practices,
educational programs, and expanded the field of knowledge in this area. In regards to journalists
and the Internet, a number of studies were conducted in Europe and the United States (e.g.,
Garrison, 1999; Ketterer, 2003; Lüge, 2003; Nicholas, William, Cole & Martin, 2000) to explore
and understand how this professional group used the technology, and what improvements were
necessary. No known studies conducted in the Middle East, and specifically Kuwait, targeted in-
2

depth the information behaviors of journalists in relations to the Internet and information
technologies. Therefore, this study was designed as an extension of a previous one conducted in
Kuwait to examine the information behaviors of print journalists (Anwar, Al-Ansari & Abdullah,
2004).
However, unlike the previous study that focused on libraries and information centers, and
briefly examined the Internet, this study focused on the Internet-related information behaviors
including behaviors related to information technology, skills, evaluation, and other issues. The
main goal was to explore and examine the behaviors of journalists in the context of what
applications, i.e. E-mail, FTP, search engines, etc., they use heavily and view as important,
barriers to access, use and evaluation of online information, and skill-levels.
Also, the study compared results yielded from this examination to those of similar studies
conducted in Europe and the US, with the aim of providing a better understanding of the current
situation in Kuwait. This extensive and systematic study was the first of its kind in Kuwait, and
would provide baseline data that could encourage further studies targeting journalists, or other
professions, in the region.
1.1 STATEMENT OF THE PROBLEM
Kuwait is currently undergoing massive reforms in all sectors of society, including a
governmental push towards creating an information society that is capable of effectively using
information technologies to its benefit (Al-Shimmari, 2005). This comes as a result of years of
human development efforts. In 1975, Kuwait's Human Development Index (HDI) value was at
3
0.763 out of 1. Over the years, the HDI value for Kuwait had increased steadily to reach 0.777 in
1980, .780 in 1985, .813 in 1995, .837 in 2000, and .844 in 2003 (Watkins, 2005). Kuwait is
ranked 44 out of 177 countries in the HDI for 2003. Along with this gradual development,
technology was being widely integrated in all sectors of society, including the media. However,
due to lack of guidance, media organizations in Kuwait adopted new technologies, and adjusted
behaviors, through means of trial-and-error. This process can be time consuming, and a burden
on resources. Many media organizations were creating their own rules and guidelines for dealing
with new technologies without prior knowledge of how to do that. This resulted in a lot of lost
resources in terms of manpower, capital, and time. Further, employees were changing their
behaviors to accommodate new technologies, instead of making their behaviors, and work
processes, more efficient. With a systematic study of journalists and the Internet-related
behaviors, recommendations were made to guide, even if partially, the process of adopting and
interacting with information technologies.
As processors of information, it is important to gain an understanding of journalists'
behaviors to assist them in conducting their daily routines more efficiently. With the adoption of
new technologies in its early stages in Kuwait, it was important to study information behaviors in
relation to these new technologies. Technology can be an effective means of improving, and
evolving, the journalism profession in Kuwait. Eickelman and Anderson (1999) emphasized the
importance of technology as it can "create new forms of community and transform authority and
social boundaries."
Therefore, this study explored Internet-related behaviors of journalists by examining
Internet access, application use, use and evaluation of online information, and skills. The goal
was to assist journalists in understanding their Internet-related behaviors, provide data that could
4
assist media librarians in their interactions with journalists, and aid reforms in Kuwait by
providing a sketch of the current situation along with data that would drive recommendations for
the overall benefit of print journalists.
1.2 STUDY FOCUS
This study explored the Internet-related information behaviors of journalists in Kuwait in terms
of application use, access, use and evaluation of online information, and skills. This provided
data highlighting areas where a lack of use of certain Internet applications existed, and a need to
improve awareness. Further, this examination identified the applications that were viewed by
journalists as most important, which can be incorporated into future educational curricula and
system design. Examining the use and evaluation of information obtained online was important
for identifying areas of strength and others where improvement was needed.
The final part of the study focused on comparing results with similar studies conducted in
Europe and the US. This was important in terms of identifying similarities and differences, and
whether any improvements were needed.
5
1.3 IMPORTANCE AND SIGNIFICANCE
This study has several beneficial findings and recommendations that could assist researchers,
journalists, and reformers in gaining a better understanding of the information behaviors of print
journalists, and as a consequence, lead to enhanced information behaviors and work practices in
newspapers. Also, the study provides findings related to improving educational curricula, work-
practices, training, and system design.
Further, as a future educator at Kuwait University, the researcher can use data from this study
to directly recommend and influence curriculum design and education in the field of journalism,
in addition to stimulating a new path of research in Kuwait. Also, the findings from this study
could be used to draw comparisons of Internet-related behaviors of journalists in Kuwait and
elsewhere. These comparisons can be effective in highlighting areas that need more examination.
Finally, the study could be replicated over a period of time, and in different regions in the
developing world, to provide an accurate and timely reflection of the situation, with the goal of
improving overall human information behaviors.
In addition to the benefits mentioned, this study is important for expanding the field of
knowledge regarding print journalists in general, and Kuwait specifically, by providing baseline
data that can be used as building blocks for future studies, social reforms, and technology
adoption initiatives in Kuwait.
6
1.4 OBJECTIVES
The objectives of this study include analyzing the current situation in Kuwait to provide a
reflection of the state of Internet-related behaviors of journalists, identifying and proposing
changes to enhance the current situation, and provide recommendations that could assist the
reform movement in Kuwait in the process of enhancing newspapers and the related work-
processes. In addition, the study aims to provide recommendations useful for improving
information behaviors of journalists, and enhance the interaction between journalists and library
professionals.
Other objectives include recommending improvements to curriculum design, especially for
the journalism and mass communications and library and information science departments at
Kuwait University, and recommending improvements for system designers in terms of
incorporating useful applications and information evaluation tools, into the development of new
systems, or software, that target journalists.
1.5 RESEARCH QUESTIONS
The researcher will explore answers to seven research questions using survey research
methodology utilizing self-administered questionnaires and follow-up interviews by E-mail. The
questions cover several areas including the nature of Internet access, applications use, use and
evaluation of online information, skill-levels, information technology device usage patterns, and
comparing the developing world to Europe and the United States.
7
1. How do print-journalists in Kuwait access the Internet and what is the nature of that
access? Are there any barriers prohibiting access?
This question was designed to explore Internet access in terms of location, satisfaction, barriers
preventing Internet use and barriers faced online.
2. What common Internet applications, such as E-mail, the WWW, etc., are most heavily
used, by print journalists in Kuwait? What is the nature of that use?
The purpose of this question was to gain an understating of the current situation in terms of
which applications are most heavily used. Disregarded, or slightly used applications, would be
identified to assist in correcting the situation. Further, the question was designed to explore the
usage of E-mail and the World Wide Web, the two most popular Internet applications, in terms
of purpose of attractions and worries, and importance.
3. What is the importance of information evaluation criteria for print journalists in Kuwait?
The purpose of this question was to identify the amount of importance placed by journalists on
each information evaluation criteria, and whether improvement is needed.
4. What level of importance do journalists place on the Internet for conducting different
types of journalistic tasks?
This question was designed to identify tasks that are more dependent on the Internet for their
execution than others, as perceived by journalists. This ranking of tasks could be helpful in
recommending improved practices in the workplace.
5. How likely are journalists in Kuwait to use the Internet to find information useful in
covering different types of news stories such as politics, sports, etc.?
8
This question was intended to examine the feelings of journalists towards using the Internet as a
source of information. Further, the question implicitly examined the degree of adoption of the
Internet by journalists, and their openness towards the medium.
6. What is the skill-level and usage pattern of print-journalists in Kuwait in relationship to
information technology applications and devices?
This question was designed to examine and reflect the skill-levels of journalists in using different
information technologies in order to gauge the level of expertise of journalists in general, and to
identify areas that need improvement. Examining usage patterns of information technology
devices was intended to gauge the degree of technology adoption by the journalists.
7. How do findings from this study in Kuwait compare to similar studies conducted in
Europe and the US?
The purpose of this question was to identify similarities and differences, and whether steps can
be implemented to improve the situation in Kuwait.
1.6 LIMITATIONS
This study focused on daily newspapers in Kuwait. Print journalists are targeted as the
population for examination since a number of previous studies focused on media employees in
general and treated them as a homogenous group without distinguishing between different types
of journalists, such as print, broadcast, electronic, etc. Job functions and processes differ for each
type of journalist due to his/her own unique characteristics and job requirements. For example,
deadlines differ between print journalists and broadcast journalists. It is important to differentiate
9
between the different types to gain a true reflection of information behaviors. Also, print
journalists were chosen as the focus of the study due to the researcher's past experience as a print
journalist allowing better access to newspapers, and the utilization of past experience in
conducting research targeting print journalists in Kuwait.
Focusing on print journalists could be viewed as a limitation to the study yet it would
assist in producing practical recommendations that can be used in curriculum design, training
courses, reform initiatives, and improving information behaviors. The lack of a vigorous research
community in Kuwait can be a limitation, since the targeted population might not be interested in
participating due to a lack of awareness of the importance of research studies.
Another potential limitation was the utilization of liaisons to be able to conduct this
study. Due to numerous factors affecting the environment in Kuwait, including the difficulty of
accessing journalists due to busy schedules, and security measures, it was necessary to use
liaisons. A liaison was identified for each newspaper, and that person was responsible for the
dissemination, and collection, of questionnaires. Also, each liaison facilitated communication
between the researcher and the participants. Reminder letters, questionnaires, and any other
communication, were delivered to the participants through the liaisons. This made it possible to
conduct this study in an efficient and timely manner. Therefore, the success, or failure, of the
study depended on the success, or failure, of each liaison in executing his/her responsibilities.
However, it was found that liaisons were cooperative and supportive of the processes that were
part of this study.
Other limitations included the timing of conducting the study. The initial plan was to
launch the study in May of 2006. However, due to the dissolution of Parliament in Kuwait during
that month, and the call for new elections on the 29th of June, 2006, the study’s launch was
10
delayed since most journalists were overloaded with work, and were less likely to participate in
the study. Another time-related limitation which was unforeseen in the planning of this study
was the war between Israel and Lebanon. The study was launched less than two weeks before the
start of the war which could have affected the response rate, since newspapers were again
overloaded with work. Further, some journalists expressed their offence at participating in the
study while they were busy covering a war.
Finally, summer in Kuwait was not an efficient period for conducting a research study.
During the hot summer months, most newspaper employees who are not Kuwaiti left the country
to go back to their countries on vacation. Also, many Kuwaiti citizens prefer to take their
vacation from work during the summer time. Potentially, this is the most important limitation
that affected the total response-rate. Despite that, the population of the study included a Kuwaiti
majority, a mark not achieved by previous studies targeting journalists or others in Kuwait,
where expatriates formed the majority. Therefore, this limitation could be a positive one as the
data is more reflective of Kuwaiti citizens, giving it more leverage in terms of findings and
recommendations.
11
1.7 INFORMATION ABOUT KUWAIT
Kuwait is a small country located in the Middle East. It is bordered by Iraq to its North, Saudi
Arabia to its South, and the Persian Gulf to its East. With a size of 17, 820 square kilometers,
Kuwait is slightly smaller than New Jersey. It is a member of the Gulf Cooperation Council
which is similar to the European Union, and includes, in addition to Kuwait, six other countries.
These countries share many characteristics including language, religion, ethnicities, economic
status, and heritage.
According to the census report published by Kuwait’s Ministry of Planning in July, 2005,
the population of Kuwait was 2.457 million people, of which 964, 000 were Kuwaiti citizens. Of
the total population, 59.9 percent were males. 85 percent of the population are Muslims (70
percent Sunni, and 30 percent Shi’a), while Christians, Hindu, and others account for the
remaining 15 percent. Arabic is the official language, with English being widely spoken.
Kuwait is a constitutional monarchy, governed by the Al-Sabah family. The country was
a British protectorate until gaining full independence on the 19th of June, 1961. Residing over
nearly 10 percent of the known world crude oil reserves, Kuwait’s economy depends heavily on
petroleum. First drilled in 1938, petroleum playing a great role in Kuwait’s early development as
it went from an arid desert to one of the highly developed countries in the Middle East. Millions
of dollars were spent by the Kuwaiti government to build and develop schools, hospitals,
infrastructure, and more, as its oil reserves continued to be explored and expanded (New York
Times, 1952).
Oil also brought negative effects as Kuwait was intimidated by its bigger, more powerful
neighbor, Iraq on more than one occasion over the past century. The Iraqi intimidation continued
12
over the years, resulting in blackmailing billions of dollars from Kuwait to fuel the Iraq-Iran war.
This intimidation peaked in 1990, resulting in a military invasion of Kuwait by Iraqi forces. In
February of 1991, Kuwait was liberated from its Iraqi invaders by a coalition headed by the
United States and the United Kingdom. Since then, Kuwait engaged in a rebuilding process that
is still going on today. Despite the great damage inflicted on Kuwait by Iraq, the country
managed to rebuild large parts of its infrastructure. Further, Kuwait provided liberties nearly
unheard of previously in the Middle East as it provided a free press, an elected parliament, and
an open economy. This assisted in developing the country further, and placing it amongst the
more developed countries in the region. Also, Kuwait recently granted women the right to vote
in parliamentary elections, a right not yet recognized by many countries in the Middle East.
Recently, Kuwait experienced a constitutional, and democratic, change of its leadership
in January, 2006, after the passing away of His Highness Sheikh Jaber Al-Sabah. His successor,
ailing Crown Prince Sheikh Saad Al-Sabah, was removed from office using constitutional
means. He was replaced by the current Amir, His Highness Sheikh Sabah Al-Sabah. The new
government has called for massive reforms covering all aspects of the Kuwaiti society (Al-
Wawan, Yousif, Al-Hajri, & Al-Omran, 2006). This reform movement includes the media, as
addressed by newly appointed prime minister His Highness Sheikh Mohammed Al-Ahmad Al-
Sabah in his first speech to the Kuwaiti Parliament. The prime minister said that the new
government encourages creating and developing mechanisms leading to a better media that is
capable of carrying out its responsibilities effectively and truthfully (Al-Wawan et al., 2006).
The first step towards achieving that goal was made when the new government agreed to review
the press and publications law of 1961, and made it one of its top priorities (Al-Wawan et al.,
2006).
13
This government step materialized when a new press and publications law was passed
after a unanimous vote by Parliament in March, 2006 (Jomaa & Al-Saeedi, 2006). The highlight
of the new law is the government’s agreement to allow the publication of new daily newspapers
(Kuwait News Agency [KUNA], 2006). Further, the new changes included adding Prophet
Mohammed’s (Peace and Prayers Be Upon Him) daughter, cousin, and grandsons (Peace Be
Upon Them), who are highly revered by the Shi'a minority, to the list of religious figures who
cannot be criticized by the media (KUNA, 2006). Despite it being a symbolic addition to the law,
it reflects the government’s expanding acceptance of minorities, and its serious intentions of
reforming the country and creating a more democratic state.
This new dedication to reforms, especially in the media sector, reflects the importance of
systematic research at this critical period. Research can provide important recommendations that
could guide future reforms and improve the current conditions.
14
2.0 LITERATURE REVIEW
The literature review aims to provide a complete and accurate image of the state of research in
the field of information seeking behaviors with a focus on journalists. The review will start with
human information behavior, and then focus on studies that specifically targeted journalists.
Also, studies from other fields are used to provide the necessary background for the study.
2.1 HUMAN INFORMATION BEHAVIOR
Over the past century, human information behaviors have been examined by researchers in
different fields in an attempt to gain an understanding of these behaviors, and the ramifications
that come with them. Researchers in sociology, psychology, library and information science
(LIS), computer science, and others, have conducted many studies to understand human
information behaviors according to many different factors identified by researchers.
Over the years, LIS research reflected a shift in interest from system-centered studies,
such as library usage (e.g., Broadus, 1980; Drone, 1984), information retrieval systems (e.g.,
Bookstein & Cooper, 1976; Cawkell, 1975), to user-centered studies, such as the roles of
professionals (e.g., Leckie, Pettigrew & Sylvain, 1996), and how these affect information
15
behaviors. User-oriented studies did not gain popularity until the 1960s, when researchers started
examining information needs and uses of scientists (Menzel, 1966). Menzel (1966) identified the
year 1963 as a "take-off point" for user-oriented studies, and identified 23 studies in the three
years following 1963 that dealt with human information behaviors. These studies examined
scientists' preferences and evaluations of information sources and channels, information use, and
information dissemination. Also, the American Psychological Association (APA) contributed in
stimulating user-oriented information behavior studies in the 1960s as part of its Project on
Scientific Information Exchange in Psychology (Menzel, 1966).
A few years following Menzel's (1966) initial review of the state of information behavior
research, Lipetz (1970) conducted a similar review and identified 114 studies, up from 23 studies
in 1966. The number of studies in both years did not reflect the total amount of studies that
examined human information behavior during that period, but only the number of studies that
were seen as useful by the authors.
However, the large increase in the number of human information behavior studies, from
23 in 1966 to 114 in 1970, clearly indicated an increased interest in the area.
Lipetz's (1966) review identified areas of research that included information channel
preferences, information processing and dissemination, information needs and uses of users,
readership and circulation studies, technology transfer, research methodology, and theory
development. Clearly, the review demonstrated the increased interest in the area of human
information behavior. As Lipetz (1966) stated, "as a scientific discipline, the study of
information needs and uses is still in its infancy, yet it exhibits considerable vigor."
Twenty years after Lipetz's review, Dervin and Nilan (1986) conducted another review to
examine the state of the research in human information behavior. Again, the latest review
16
demonstrated a continuous growth in the number of studies from 114 cited by Lipetz in 1970 to
more than 125 in 1986. The authors indicated that 300 potentially useful citations were found for
the period from 1978 to 1986 (Dervin & Nilan, 1986). In their review, Dervin and Nilan (1986)
focus on the state of research in human information behavior, and the need for new approaches
to research. The review included a discussion of three alternative approaches towards research-
user-values approach, sense-making approach, anomalous states-of-knowledge approach (Dervin
& Nilan, 1986). The different approaches were presented to guide future research in human
information behavior using alternative paradigmatic assumptions. Further, the researchers stated
that the three approaches examined information behaviors on a macro-level rather than the
traditional micro-examination of users (Dervin & Nilan, 1986).
In 1990, Hewins conducted another review of the state of research in human information
behavior. The author again noted the large amount of studies found, indicating the continued
growth of research in the area of human information behavior (Hewins, 1990). However, in this
review, it was noticed that cognitive studies were growing vigorously and becoming the center of
attention of researchers in this area. This clearly confirmed the shift from system-oriented studies
to user-oriented studies. Hewins (1990) also found that the three alternative approaches
presented by Dervin and Nilan (1986) were embraced by researchers and "have come fully into
the mainstream of research, as shown by the number of studies pursuing cognitive processes with
respect to the user and to systems design."
Clearly, research in human information behavior shifted to the user. Researchers were
attempting to understand information behaviors from the perspective of the user. This included
research in information seeking and retrieving behavior (e.g., Saracevic, 1975; Schutz, 1970;
Spink & Greisdorf, 2001), uncertainty (e.g., Spink, Wilson, Ford, Foster & Ellis, 2002),
17
searching (Kuhlthau, 1991; Spink & Saracevic, 1997), multitasking (e.g., Spink, 2004; Spink,
Ozmutlu & Ozmutlu, 2002), serendipity (e.g., Foster & Ford, 2003), and human-learning (Logan,
1988).
Other cognitive processes examined by researchers included personality types (e.g.
Clarke & James, 1967; Deutsch, Fleming, Brooks-Gunn, Ruble & Stangor, 1988), motivation
(Bradley, 1980), memory (Case, 1991; Neill, 1984), categorization techniques (Dumais &
Landauer, 1984; Iyer, 1982), and other semantic factors such as vocabulary of users and search
terms (Spink, 1997; Van Pulis & Ludy, 1988).
The literature reflected a change towards examining user behaviors rather than focus on
systems. This shift from a system orientation to a user orientation stimulated several attempts to
model human information behavior in a step towards generating theory that would explain
human information behavior in-depth and stimulate further research. However, researchers faced
difficulty in modeling human information behavior due to the complex nature of behaviors, and
the difficulty of generalizing a single model to encompass all human information behavior. Also,
the short life of information behaviors research is a factor in the formulation of an encompassing
human information behaviors model.
18
2.2 INFORMATION BEHAVIORS OF JOURNALISTS
2.2.1 Source Preferences In one of the first known studies of its kind in LIS, Herron (1986) investigated, using
questionnaires, the information seeking behavior of 113 print-journalists located in the Pittsburgh
area. Herron was interested in examining the preferences of print-journalists towards sources of
information, and the frequency of use of these sources. The study found that journalists used
informal channels of information twice as often as formal ones in their daily work. Informal
channels were slightly easier to use than formal channels and were more accessible. However,
formal channels were perceived to be more reliable than informal ones. As for frequency of use,
Herron (1986) found that personal collections and the institution's library were the most highly
used formal sources. Communication with peers and non-peers were the two most frequently
used types of informal sources. Overall, the study found that the most preferred form of
communication amongst journalists "was the use of informal, oral channels of personal
communication employing face to face contact or the use of the telephone." These findings were
confirmed by other studies (e.g., Anwar, Al-Ansari & Abdullah, 2004; Campbell, 1997; Edem,
1993; Joseph, 1993; Vreekamp, 1995).
Herron's study (1986) was successful in examining the preferences of journalists towards
sources and channels of communications. However, the study failed to examine, or identify, the
factors that shaped the preferences of the journalists studied. Therefore, this study will benefit
from previous studies by examining factors that shape journalists preferences, such as gender,
age, length of experience, journalistic beat, level of education, and others.
19
In another study that focused on source preferences, Edem (1993) found that 65 percent
of the respondents relied on informal sources whereas 35 percent depended on formal ones.
Further, Edem found that 76 percent of the respondents did not utilize the library. This was
attributed to the lack of financial resources, lack of modern communications equipment, and
poor library and archival centers. Although Edem's study was successful in providing data that
reflected the status of source preferences, it was not as successful in identifying and expanding
on the reasons causing the mentioned preferences. This shortcoming was a direct result of
depending solely on quantitative data, which was not a flexible method for providing in-depth
examining and explaining the preferences found. Using a qualitative method to complement the
one used by Edem would have produced results that could have shed more light on the
preference of journalists, and the factors behind the lack of use of libraries.
In Kuwait, researchers conducted an in-depth study to examine several information
behaviors of print journalists (Anwar, Al-Ansari & Abdullah, 2004). The study's goal was to
examine the source preferences of journalists and the amount of satisfaction they had with these
sources, how information is used, the amount of use of electronic sources of information, the
information-related skills of journalists, and to identify the obstacles that journalists encountered
while seeking information. The study found that journalists used information for fact-checking,
background information, and to obtain angles for future articles. Writing a news item was also
regarded as a major use of gathered information. As in Herron’s (1986) study, the study in
Kuwait found that conversations and telephone calls were very important informal sources of
information (Anwar, Al-Ansari & Abdullah, 2004). As for formal sources, press releases and the
library were regarded as very important. Satisfactions towards formal, and informal, sources of
information were approximately the same as the degree of importance of the source (Anwar, Al-
20
Ansari & Abdullah, 2004). Further, the study found that the electronic library of the institution
was used to gain story ideas (53.3 percent), avoid duplication (56.7 percent), and to compare
current and historical coverage (56.7 percent). Using the electronic library was regarded as
positive in terms of reducing the amount of time to gather information, reducing errors, and
increasing the overall quality of the news item being processed (Anwar, Al-Ansari & Abdullah,
2004).
The study also examined library usage and found that 53.1 percent of respondents used
the library to search an electronic database, with library staff regarded as not important in terms
of finding information. Overall, it was found that searching skills were deficient, and that
journalists needed professional training in order to be able to conduct their daily work in an
efficient manner. The researchers also recommended curriculum-integrated instruction of
information literacy at the undergraduate level as a potential solution to the deficiencies
uncovered by this study. The role of the librarian, or information professional, was lacking and
needed further examination (Anwar, Al-Ansari & Abdullah, 2004).
The findings of this study confirmed previous findings regarding information sources,
and that journalists preferred informal sources of information over formal ones. It also provided
baseline data about the information behaviors of print-journalists in Kuwait enabling future
studies to further examine this area. However, the study was not successful in providing a
complete reflection of the information behaviors of journalists as it did not examine, in-depth,
the information behaviors related to the Internet and information technology.
Further, the study's data was quantitative in nature, and the researchers did not
supplement their findings with qualitative data. Qualitative data could have been useful for
expanding on findings, rather than restricting the study to validating previous findings. In this
21
study, the researcher aimed to avoid previous shortcomings by using both quantitative and
qualitative data to gain a better understanding of the information behaviors of journalists.
Further, the researcher attempted to introduce an examination that is unique for Kuwait and the
region by focusing on the Internet and information technologies, with the goal of exploring and
describing the current status of information behaviors.
Joseph (1993), in a study that examined library usage by Indian journalists, found that
they used libraries mainly for checking background materials and for specific items of
information, and that only a small proportion of them were fully satisfied with their library’s
collection. The researcher concluded that respondents “seem to prefer informal sources, personal
document collections and consultation with journalists," (Joseph, 1993). Similar to previous
studies, Joseph restricted the study to a simple questionnaire, and based her findings on the
quantitative data gathered. Although the study was the first of its kind in India, it did not provide
extensive data, and was restricted to validating concepts that were validated numerous times in
the past. Also, the study does not provide data that explains findings, or areas that require further
examination.
In another study of the information behaviors of journalists, Ibrahim and Al-Ansari
(1996) found that information centers were used to find latest information (53.3 %), check
accuracy of information (50.6 %), locate photographs (38.7 %), and prepare news analysis (30.7
%). Major problems faced by journalists using information centers included a scarcity of
retrospective information (17.3 %), a general lack of needed information (16.0 %), and lack of
current information and photographs (Ibrahim & Al-Ansari, 1996). This study also depended on
a single-method of using a questionnaire to collect quantitative data. Although the data is useful
in reflecting the behaviors of journalists as they relate to information centers, the researchers fail
22
to examine, or explain, the reasons that shape and affect these behaviors. Further, examining the
use of information obtained from information centers to conduct journalistic tasks is not
examined effectively by this study. This shortcoming is avoided in this study by collecting data
that reflects the use of information found online to conduct journalistic tasks.
Source preferences were at the heart of research targeting journalists. Research in
different areas of the world concluded that journalists preferred informal sources over formal
ones. Vreekamp (1995) examined a community in Western Europe, and another in the
Caribbean, and confirmed that informal sources were the main sources of free and unbiased
information in both the communities. The study also found that journalists never visited an
outside library.
Library usage was also examined by Campbell (1997) who reported that many of her
respondents made little or no use of the library facilities. Campbell found that the information
sources used included both personal contacts and electronic databases. However, these
journalists placed more emphasis on human as opposed to impersonal sources of information.
Despite these findings, the researcher did not attempt to explain the reasons that shaped the
behaviors of journalists. A major issue that was not examined in-depth related to the favoring of
human sources over other types, and whether this finding was unique to the journalists studied by
Campbell, or whether it was a preference shared by journalists in general.
Clearly, research targeting source preferences of journalists confirmed that informal
sources are favored, despite the perceived accuracy of formal sources of information. However,
none of the studies focused on online information, and interaction with the Internet and
information technology. This could be attributed to the fact that the Internet did not gain high
popularity until late in the 1990s. Ward, Hansen and McLeod (1988) investigated the impact of
23
an electronic library on news reporting and found that “reasons for using the library and types of
library materials used changed little in the period immediately following introduction of the
electronic clip files." However, it is suspect whether these findings would hold true today.
2.2.2 Information Needs & Uses
Journalists need information for five extensive tasks- scrutinize facts, raise their awareness of
current news, research, obtain a framework, and to stimulate their thoughts (Nicholas & Martin,
1997). The researchers agreed that information technologies were changing the information
behaviors (needs and seeking) of journalists, and identified time, access, training, and
information overload, as major obstacles faced by journalists when seeking information
(Nicholas & Martin, 1997). These tasks and obstacles were adopted by this study and
incorporated into the questionnaire to examine journalists in Kuwait, and whether these findings
would be similar or not.
In another study that examined the information behaviors of journalists, Chinn (2001)
found that the information needs of the journalists studied matched the information gathering
behaviors observed. Further, the researcher concluded that the extent of change in information
needs brought about by the emerging technologies "depends on the perception of the journalist
involved and the environment in which they work," Chinn, 2001). This finding reflected two of
the four elements of the unified theory of acceptance and use of technology (UTAUT)- social
influence and facilitating conditions. The perceptions of journalists are affected by social
influence from peers, leaders, and other individuals in society towards information technology,
making the use of the technology more important. The work environment referred to by Chinn
24
relates to the facilitating conditions and whether the infrastructure and necessary equipment are
available for the use of journalists or not. However, Chinn fails to examine the other two
elements of the UTAUT- performance expectancy and effort expectancy. Incorporating all four
elements into the study could have yielded more in-depth results that shed light on the
information behaviors of journalists in relations to information technology.
In 1986, Harman conducted a study to obtain data related to the use of Newsbank, a
database that included news items produced by Reuters. It is the first known study in LIS of
journalists' information behaviors in relations to electronic environments. The results showed
that 42.4 percent of respondents never used Newsbank, while 36.4 percent used in between one
to five times in a week. This lack of use was attributed to the notion that journalists did not
perceive searching a database as one of their job functions, and that librarians were available to
conduct searches and retrieve material. Lack of training, system ambiguity, and the need for
professional assistance were the main reasons cited for not using the database (Harman, 1986).
Despite the successful gathering of quantitative data to examine the preferences of journalists,
Harman failed in describing the study's population demographics, and whether factors such as
age, experience, gender, and voluntary use, affected preferences. According to the unified theory
of acceptance and use of technology (UTAUT) these factors are important in shaping the
behaviors of individuals. Further, the theory of diffusion of innovations identifies the mechanics
and complexities of an innovation as one of three elements that affect innovation adoption. In the
previous study, Harman failed to address the complexities of Newsbank, and whether the system
itself was hindering usage rather than assisting users in finding information. However, Harman's
findings reflected the lack of adoption and embracing of new technologies in the workplace at
the early stages of information technology spread.
25
However, this resistance to change and adoption of information technologies would
decrease in the '90s when the Internet was commercialized and gained popularity. As the interest
in information technologies and the Internet grew, so did researchers' interest in studying the
effects of these technologies on different aspects of human life. One of these aspects was related
to the effects of new technologies and the Internet on the information behaviors of individuals.
This interest was evident in the number of studies that were interested in measuring the effects of
information technologies and the Internet on journalists.
2.2.3 Information Technology & Internet
Ward and Hansen (1991) looked at the impact of information technology on the roles of
journalists and librarians working in 105 American daily newspapers. The researchers discovered
that most of the newspapers surveyed had adopted information technologies and were using them
for searching, selecting, and analyzing information. The study concluded by pointing to the
benefits of information technologies, and how they allowed journalists to work in a time-efficient
manner (Ward & Hansen, 1991). This could be attributed to the time-frame of the study,
conducted in 1991. At that time, the Internet was still in its preliminary commercialization
process, and information overload was yet to become a problem.
Further, the researchers relied on quantitative methods, and did not expand their findings
using in-depth qualitative methods. At a time when the Internet was in its beginning stages, it
would have been beneficial to supplement the quantitative data with qualitative data that
examined information technology adoption by newspapers, obstacles faced, and how technology
assisted journalists in conducting their tasks more efficiently. Also, incorporating the diffusion of
26
innovations theory into the study would have provided more beneficial results in terms of how
information technology was being adopted, and what obstacles were presented by the
complexities of the information technology studied.
In an examination of an online community of journalists, Millen and Dray (2000) found
that individuals used the online community to compliment face-to-face meetings. Also, the study
found that 51 percent of the postings involved answers to technical questions, while 12 percent
of the posts were questions by members of the group. Another finding showed that a small
number of members were responsible for most of the postings (Millen & Dray, 2000). Similar to
many LIS research studies targeting information behaviors of journalists, Millen and Dray
depended on quantitative data. However, the researchers examined the online postings in the
form of qualitative data, to provide a more in-depth understanding of the mechanics of the online
community. Despite that, the researchers did not expand on their main finding- individuals used
the online community to compliment face-to-face meeting- and the reasons behind that behavior.
In one of the more in-depth studies of its kind, Nicholas, William, Cole and Martin
(2000) investigated the impact of the Internet on the British media by surveying 345 journalists,
media librarians, system/IT editors, and journalism students. The study found that 68 percent of
the respondents used the Internet at the workplace, and that 66 percent of those users were
"experienced journalists into their thirties/forties," (Nicholas et al., 2000). Researchers attributed
this finding to the seniority of older employees and the job security that is afforded to them.
These findings were incorporated into this study to examine their validity.
As for the World Wide Web (WWW) resources used, the study found that 53 percent of
the respondents favored sites that offered "familiar, traditional and authoritative information"
such as newspapers and official sites (Nicholas et al., 2000). Graphics and pictures were the least
27
sought after resources on the WWW (9 percent). Further, the study found that all Internet users
said they used electronic mail (E-mail). The major use of E-mail was to contact individuals
overseas (47 percent) while the least use was to communicate with readers (5 percent). The
major factor that attracted respondents to E-mail was its ability to overcome time differences (35
percent), while E-mail's biggest problem was the lack of face-to-face interaction (16 percent). As
for newsgroups, more than half of the 23 respondents who did subscribe to newsgroups did so to
find human sources of information, such as experts or government officials (Nicholas et al.,
2000). Findings related to E-mail and the WWW were incorporated into this study to examine
the behaviors of journalists in Kuwait. Usage patterns, obstacles, and advantages and
disadvantages were also incorporated into the questionnaire to examine behaviors, and provide a
precise reflection of the current situation in Kuwait.
Further, the researchers examined information overload and the Internet. 30 percent of
respondents considered information overload as a problem, while 26 percent did not consider
overload a problem. Adoption of time-limits, using bookmarks, selectivity, and advanced search
strategies were considered possible solutions to information overload on the Internet (Nicholas et
al., 2000). Information overload was incorporated as an obstacle faced online in this study, to
add depth to the examination of the behaviors of journalists.
In terms of the total population, Nicholas et al. (2000) estimated that “it is unlikely that
more than one in five journalists used the Internet" due to "lack of access, the richness of existing
information provision, suspicion of the new resource …, and a shortage of time." They felt that
"it is very unlikely that there will be any dramatic changes, just a slow absorption of the
technology." Reasons for the slow adoption of the Internet by journalists in the UK were
28

attributed, by the researchers, to the lack access in the workplace, preference for primary data,
and the work practices in-place (Nicholas et al., 2000).
Despite the use of multiple-methods to gather data including questionnaires and
interviews, researchers did not make an attempt to incorporate the theory of diffusion of
innovations into the study. It could have been beneficial to incorporate the theory, as it could
have led to more in-depth data reflecting factors behind the preferences found, and reasons for
the slow adoption of the Internet in the UK. Further, the study combines different types of
journalists, such as broadcast, print, radio, etc., and generalizes results for all journalists. This
generalization could be invalidated if the factors behind the preferences found were examined, as
print journalists could have behaved differently than broadcast journalists due to differing
deadlines and work processes. Also, the study examines differing numbers of journalists working
in daily newspapers, weekly magazines, news agencies, television, radio, and other media
outlets. This combining of journalists negatively affected the results of the study, which cannot
be generalized as the researchers did. In this study, the researcher identified print-journalists
working at daily newspapers in Kuwait as the population of the study to provide results that
accurately reflected the issues examined.
Despite the slow adoption of the Internet in the UK, the Internet’s growth and adoption of
information technologies by media organizations in the US was constantly on the rise. An
examination of two American newspapers found that most respondents used the Internet (Poteet,
2000). Online information sources, considered important for information gathering by the
majority of respondents, were mainly used for obtaining background information to supplement
news stories, finding facts, keeping up-to-date with current news, and tracking down experts who
can be used for preparing news stories (Poteet, 2000). Although Poteet effectively used
29
questionnaires to examine preferences towards the Internet and how journalists used information
obtained online, the researcher did not examine what Internet applications where favored by
journalists. The study was conducted in the late 1990s, when the Internet offered more tools
applications than just E-mail and the WWW. The researcher did not examine these other tools
and applications preferring to focus on E-mail and the WWW. This study incorporated Poteet's
findings regarding how journalists used information found online, in addition to expanding on
the examination of Internet tools and applications to include search engines, newsgroups,
messengers, language-tools, and others.
Another study examined daily newspapers in Michigan to evaluate the use of information
technology and the Internet (Davenport, Fico & Detwiler, 2001). The study found that reporters
heavily used the Internet, CD-ROMS, public records, bulletin boards, online databases,
electronic archives of institution, and newspaper-related databases. Editors and librarians relied
heavily on the electronic archives of the organization (Davenport, Fico & Detwiler, 2001). The
results demonstrated that media personnel have adopted, and were heavily using, electronic
sources of information. However, the researchers failed to examine the factors behind shaping
the population's behaviors towards using each type of technology, and what the information was
being used for. The main goal of the study was to examine the adoption of information
technologies. Yet, the researchers failed to identify an adoption theory that could have guided the
study to provide better results.
The amount of use of online information sources for newsgathering by American
newspapers as reported by Garrison (1999) was 57.2 percent in 1994, 89.8 percent in 1997, and
92.0 percent in 1999. The frequency of use of online resource also recorded a similar increase
from 27.4 percent for daily use in 1994, to 63.2 percent in 1999. Garrison (1999) also found that
30
state government and US Census sites were favored by respondents. Garrison examined
preferences towards a number of site types, such as government, education, etc., which were
incorporated into this study to examine the preferences of journalists in Kuwait.
Respondents to Garrison's survey (1999) judged the quality of the site based on a number
of factors including authoritativeness (80.5 percent), validity and accuracy (77.8 percent), and
the ability to search a website (70.3 percent). The same group of respondents identified the major
problems for website use which included no verification (54.1 percent), unreliable information
(44.9 percent), badly sourced information (44.3 percent), and lack of site credibility (43.8
percent).
Garrison (2002) also examined E-mail as a newsgathering tool by US daily newspapers.
The results showed that 75.1 percent of respondents used E-mail to correspond with sources.
Also, 61.2 percent corresponded with colleagues, and 45.3 percent corresponded with their
superiors using E-mail. In contrast to the study conducted by Nicholas et al. (2000) in the UK,
American journalists were found to be embracing of E-mail, and used it for communicating with
many different individuals, regardless of their location.
The major issue that worried journalists in regards to E-mail was the amount of time
consumed with unsolicited E-mail (Garrison, 2002). The study also found that journalists who
are 34 years old or younger were most worried about spending a lot of time sorting through
unsolicited E-mail (Garrison, 2002). In addition to that problem, journalists older than 34 years
older expressed their worry about E-mail viruses. Again, these findings demonstrate the
difference between journalists in the US and the UK. Despite the time-frame of each study
(Garrison, 1999, 2002; Nicholas et al., 2000), results clearly demonstrated that US journalists
were more aware of E-mail issues and problems than their counterparts in the UK. This could be
31
attributed to the slow adoption of new technologies in the UK. Also, Garrison (2000) found that
computer use in newsgathering increased from 66.3 percent in 1994 to 89.7 percent in 1999. For
that same period, the use of online resources for newsgathering also increased from 57.2 percent
in 1994 to 95.1 percent in 1999.
This clearly demonstrated the constant growth and adoption of online resources by media
organizations in the US during the '90s. Another interesting finding of this study demonstrated
the increase in the number of journalists conducting research online (Garrison, 2000). The study
found that in 1995, only 23.5 percent of journalists conducted research online, with librarians, or
researchers, conducting the bulk of online research (25.3 percent). However, by 1999, 68.8
percent of journalists were conducting research online, while only 15.7 percent of librarians, or
researchers, doing the same. This clearly demonstrated a trend where journalists were more open
to conducting their own research online once they were knowledgeable and confident enough
with the new technologies.
Despite Garrison's in-depth data, the studies did not incorporate any technology adoption
theories and models to guide the research. Further, Garrison depended on quantitative data using
questionnaires for all of his studies targeting journalists in the US. This dependency on one
method restricted findings and did not allow for in-depth examinations of the factors that shaped
the behaviors and preferences found. Therefore, this study incorporated Garrison's categories and
findings related to E-mail and the WWW, in addition to incorporating factors such as age,
experience, and gender, to allow for a more in-depth examination of the data.
In another Internet-related study conducted in Germany, Lüge (1999) found that the
telephone was the most widely used medium on the job (90.1 percent) followed by E-mail (79.2
percent). In examining time spent online during work, the researcher found that individuals
32
younger than 25 years old spent the least time, while individuals between the ages of 25 and 40
spent the most time. This finding was confirmed by Nicholas et al. (2000) who found that older
journalists spent more time online. Lüge's (1999) study also found that the Internet ranked third
as a main source for news stories after the traditional media (radio, television, and print), and
human sources of information.
In examining searching behaviors on the Internet, Lüge (1999) found that the respondents
often used the WWW to access media websites. This finding was confirmed in other studies
(e.g., Nicholas et al., 2000). Other uses online included finding specific information, accessing
corporate information, finding experts, and searching for press releases (Lüge, 1999). Also, the
study found that the speed of the Internet was the major problem faced by respondents. Other
problems included erroneous hyperlinks, lack of ability to evaluate a website, and information
overload. Content was regarded as most important when visiting a website. Navigation and speed
of loading were also very important (Lüge, 1999).
Despite Lüge's findings, the research was not based on a specific and explicit theory
related to the issues being examined. This affected the focus of the study resulting in many
findings that are not examined, explained, or linked efficiently. Further, the researcher used an
online questionnaire to gather data for the study without addressing the integrity of the research
instrument, and whether it represented a specific kind of journalists, such as print, or journalists
in general.
Overall, the major Internet-related studies (Garrison, 1999, 2000, 2002; Lüge, 1999;
Nicholas et al., 2000) provided in-depth data that demonstrated that information behaviors can be
affected by a number of factors including access, time, and the overall environment. From the
previous studies, it is evident that journalists in the US are advanced in using IT and the Internet
33
in their daily work routines. In the UK, job-constraints, access, and the overall environment
hindered the integration of IT and the Internet into daily work routines. As for Germany, findings
demonstrated that journalists there are in the process of integrating IT and the Internet.
Despite these Internet-related studies, researchers failed to examine in-depth the factors
that affected and shaped the behaviors and preferences of the populations examined. Further,
most of the studies reviewed earlier depended on a single research instrument in the form of a
self-administered questionnaire, without any theories to guide the research. These shortcomings
were taken into account in this study, where the researcher attempted to improve the study by
using quantitative and qualitative data to comprehensively examine and reflect the behaviors and
preferences of print journalists in Kuwait in relations to the Internet and information technology,
in addition to examining factors such as gender, age, experience, and more, and how they
affected findings. The diffusion of innovations theory and the unified theory of acceptance and
use of technology were identified as the theoretical framework for this research.
2.2.4 Skills, Training, and Evaluation
To provide a comprehensive reflection of the Internet-related behaviors of journalists, it is
necessary to explore and examine the skills and training of journalists, as these two factors can
greatly affect information behaviors positively and negatively. The average journalist's job
requirements changed as the Internet and information technology spread through newsrooms
across the globe. Journalists were expected to be able to use the Internet effectively to find
sources and communicate with relevant individuals, search the Internet for information,
exchange data, conducting research, locating stories, and other tasks. This change in job
34
requirements brought about a need to evaluate the skills of journalists, and implement training
programs to improve those skills and provide journalists with the capabilities to use the Internet
more efficiently.
In order for journalists to be able to acquire and process information in the Internet era, a
new set of skills was required (Wickham, 1999). Miller's research in the area of journalist
training yielded a list of basic skills that journalists need in order to be able to function
effectively in the new newsroom environment (Wickham, 1999). The list contained eight major
areas requiring training including computer basics, word processing, spreadsheets, databases,
communications software, E-mail, the WWW, and Internet Protocols such as File Transfer
Protocol. These eight areas were included in the questionnaire of this study in order to evaluate
the skill-levels of print journalists in Kuwait, and highlight areas that require more attention.
Also, other researchers including Dedman, Loeb, Stith, and Wolfe (as cited in Wickham,
1999) examined the skills and training of journalists in relations to the Internet and information
technology. The researchers suggested that journalists be trained in five areas that included
training in acquiring basic computing knowledge and skills, programming languages, electronic
information exchange, and the use of databases. This study evaluated the skills of journalists in
accordance with Miller's list, and the journalists' usage patterns of information technology
devices and applications. This evaluation was important for identifying areas of weakness, and
recommending improvements.
Further, to effectively examine journalists’ evaluation of information found online as part
of their skills, it was necessary to review literature in evaluation techniques and criteria. Studies
in this area (e.g. Dong, 2003; Dragulanescu 2002; Tillman, 2003; Williams & Nicholas, 1997)
agree that authority and accuracy are two important criteria for evaluating online information.
35
Authority relates to the expertise of the author, or provider, of the information (Dong, 2003).
Tate and Alexander (1996) emphasized that establishing authority of information online is
difficult since it is likely that no background information retaining to the author’s experience is
provided.
In terms of accuracy, Dragulanescu (2002) provided guidelines to examine the
information for accuracy, including whether or not sources of information are mentioned,
checking these sources, whether the author’s background is relevant to the information provided,
and whether methodology and data collection techniques, where applicable, are mentioned by
the author. Tate and Alexander (1996) stated that online information is not verified, and the
ability to publish information online without verification steps is detrimental to accuracy.
Therefore, it is important for journalists, who use information retrieved online for their work, to
be aware of this criterion, and the effects of the lack of accuracy on the overall output.
Another important criterion for evaluating online information is coverage. This criterion
is related to the depth of coverage of the site’s topics, and the relevancy, comprehensiveness, and
appropriateness of the information provided (Dragulanescu, 2002). Tate and Alexander (1996)
noted that a source published in both print form and on the WWW could differ in content. The
print version usually includes guides to the topics covered, while the WWW version might not
(Tate and Alexander, 1996). It is important for journalists to be aware of this difference in
publishing approaches, as it could assist them in finding useful information in an effective
manner.
Objectivity is another important criterion identified by researchers. Objectivity can be
problematic to assess since the publishers of online information might have differing agendas
and goals than what is displayed (Tate and Alexander, 1996). Objectivity is directly linked to the
36
real goals of the website providing the information, any purposes held by the author, and whether
a user is confident, or not, of an author’s objectivity (Dragulanescu, 2002). Further, currency is
another important criterion. This criterion is related to displaying copyright information,
availability of resources, active links, and the date of creation and last update of the information
provided (Dragulanescu, 2002; Tillman, 2003). Dong (2003) identified currency as the second
most important criterion, after accuracy and authority. Tate and Alexander (1996) emphasized
the importance of understanding the meaning of dates, as they could refer to the time when the
information was written, or when it was published in print form, or on the website, or the date
when the information was last updated.
Other evaluation criteria identified by researchers include interactivity of a website,
where users can send and receive messages to an author or publisher of information, and
promptness of a website, or the time needed to find a website, and for its pages to load
(Dragulanescu, 2002). Further, Dong (2003) identified the cost and convenience of accessing
information as important criteria for evaluating the quality of information online. Convenience
was described in terms of the availability of an efficient search engine, ease of accessing the
information, and its stability over time (Dong, 2003).
It is evident that research examining evaluation criteria of online information is
expanding. As the information available through the Internet grows and expands, it becomes
more important for individuals, especially professionals, to be aware of the criteria available to
assist them in deciding which information is usable, and which is not.
Knowledge of evaluation criteria for information found online is important as it would
add to the effectiveness of interacting with the Internet, and improve information behaviors.
Therefore, this study examined the evaluation skills of print journalists in Kuwait according to
37
nine evaluation criteria identified by previous research that include authority and objectivity of
publisher, accuracy and currency of information, coverage, convenience and promptness in
obtaining information, the interactivity of a website, and the cost of obtaining information. These
criteria were viewed as the most basic and necessary for adequate evaluation of information
online. Incorporating these criteria into the study was beneficial in evaluating the evaluation
skills of journalists.
2.3 THEORETICAL FRAMEWORK
The researcher adopted an objectivist epistemology in approaching this study, with a view that
the Internet, its applications and resources, and information technologies, exist regardless of
whether an individual is aware of their existence or not. The objective meaning sought by the
researcher lies in the understandings and views of the individuals being studied in relation to
their interactions with the Internet and information technologies. A survey research methodology
was adopted to gather data, using questionnaires and interviews by E-mail.
Basing the study on quantitative data increased the reliability and validity of the results in
comparison to data derived from other methods. Further, the researcher chose to implement
interviews by E-mail to supplement findings from the questionnaire. This mixed-methods
approach is most efficient in answering the research questions since the researcher can expand on
specific thoughts and ideas to gather insightful data (Tashakkori & Teddlie, 1998).
The diffusion of innovations theory and the unified theory of acceptance and use of
technology (UTAUT) are adopted in this study to examine the interaction of journalists with the
38
Internet and information technology. Everett Rogers' diffusion of innovations theory is related to
describing the evolution of the adoption rates of an innovation, explaining the mechanisms and
complexities of the innovation, and predicting the success, or failure, of a specific innovation
(Rogers, 1995). The diffusion of innovations theory states that in order for an innovation to be
widely adopted, communication must occur in a social system, using certain channels over time.
The theory identifies five stages that an innovation is subjected to that include knowledge,
persuasion, decision, implementation, and confirmation.
The knowledge stage is related to users being exposed to the innovation, and gaining an
understanding of it from that exposure. This is followed by persuasion, or the formation of an
attitude towards the innovation, and the decision stage, where a user commits to the adoption of
the innovation. The fourth stage is where a user puts an innovation to use, and follows it to
confirm prior attitudes and beliefs about the innovation with positive outcomes. Once a user
adopts an innovation, and has a positive experience using it, communication with peers assists in
the diffusion of innovation. However, this process can unfold over a number of years before an
innovation is well-established and adopted (Rogers, 1995).
This study aims to examine the Internet-related information behaviors of journalists in the
context of the five stages identified by the innovation diffusion theory by examining the
knowledge and attitudes of journalists towards the Internet and information technology, their
commitment towards using the Internet and information technology to positively supplement
their work, and their usage patterns. One of the overall goals of the study is to explore and
describe the behaviors of journalists by examining the mechanisms and complexities presented
by the Internet and information technology.
39
Also, the UTAUT, which consolidates eight models related to information systems usage,
is integrated into the theoretical framework of this study to provide a precise reflection of the
information behaviors of journalists in relations to the Internet and information technology. The
UTAUT states that behaviors towards using information systems are directly affected by four
elements including performance expectancy, effort expectancy, social influence, and facilitating
conditions (Venkatesh, Morris, Davis, and Davis, 2003). Further, gender, age, experience, and
voluntary use are defined as facilitating factors that shape an individual's behaviors.
The UTAUT theory defines performance expectancy as the gain in job performance
attained by an individual due to the use of an information system (Venkatesh et al., 2003). The
second element, effort expectancy, is defined as the user's perception of the amount of ease
involved in using an information system. The third element, social influence, is related to the
social perceptions associated with using an information system, and whether it is important to
use a specific system. The final element, facilitating conditions, is defined as the perception of an
individual towards the availability of the technical aspects and infrastructure that can assist in the
use of an information system. Finally, gender, age, experience, and voluntary use, are factors that
affect the four elements mentioned. Therefore, to better understand behaviors and interactions
with a system, such as the Internet, it is important to understand the elements that affect and
shape these behaviors, and incorporate them into the study.
40
3.0 METHODOLOGY
This study adopted a self-constructed questionnaire as the primary research instrument. Also, a
secondary research instrument in the form of follow-up interviews by electronic mail (E-mail)
was utilized. Due to the exploratory nature of the study, this combination of research instruments
was viewed as the most effective method to obtain data that would reflect the current situation.
The study targeted print-journalists at the seven daily newspapers in Kuwait. Kuwait News
Agency, weekly newspapers, magazines, and other media outlets, were excluded from the study
due to the differing nature of their journalists’ work in terms of deadlines, scope of coverage, and
others.
The main purpose of the research instruments was to collect quantitative and qualitative
data about the interactions of print-journalists with the Internet and information technologies to
answer the research questions. Combining quantitative and qualitative methods is the most
efficient, and beneficial, approach for answering research questions (Tashakkori & Teddlie,
1998). The questionnaire provided rich data about the interactions of print-journalists with the
Internet and information technologies, while follow-up interviews by E-mail were most
beneficial in clarifying, and adding, to the data gleaned from the questionnaire.
Further, since there is no prior data related to Kuwaiti print-journalists and the Internet, a
cross-sectional survey is most useful for exploring the situation at the time of the study (Babbie,
1998). Despite the risks of non-response, slow speed of response, difficulty in interpreting
omissions, a lack of spontaneous answers, and lack of control over who responds to the
41
questionnaires, the instrument itself can provide large amounts of valid data inexpensively,
guarantee the anonymity of the respondent, and allow the use of a bigger sample due to lack of
geographic restrictions (Krathwohl, 1998). Anonymity is most important as it would guarantee
all print-journalists participating in the study that their opinions will not, in any way, affect their
current status. Anonymity would also encourage newspapers to participate in the study, as their
organization will not be singled out by name for negative criticism, if that was the case. As for
the data gathered, it provided rich insights into the current situation, and provided ideas for
future research. Also, the lack of geographic restrictions, and the flexibility of a questionnaire,
made it possible to examine all print-journalists working at daily newspapers in Kuwait.
Finally, many research studies in Kuwait (e.g. Al-Anezi, 2000; Alkhezzi, 2002; Al-
Najran, 1998; Al-Rasheed, 1998; Anwar, Al-Ansari & Abdullah, 2004; Ibrahim & Al-Ansari,
1996; Sharif, 2003) used self-administered questionnaires as their primary research instrument,
creating a certain degree of comfort towards participating in one. This comfort is an advantage
that will be utilized in this study by using a self-administered questionnaire.
As for follow-up interviews by E-mail, they were used in this study to complement
quantitative data extracted from the questionnaire. Such qualitative data allows a researcher to
further explore areas of interest, pose questions to extract further understanding, find
explanations for trends, and identify areas of importance from the target population’s perspective
(Krathwohl, 1998). Also, interviews allow the researcher more flexibility in posing questions
that could provide information useful for clarifying findings from the data gathered through a
questionnaire (Yin, 2003). Despite weaknesses of “bias, poor recall, and poor or inaccurate
articulation,” Yin (2003) noted that “well-informed respondents can provide important insights
into a situation. They also can provide shortcuts to the prior history of the situation.” These
42
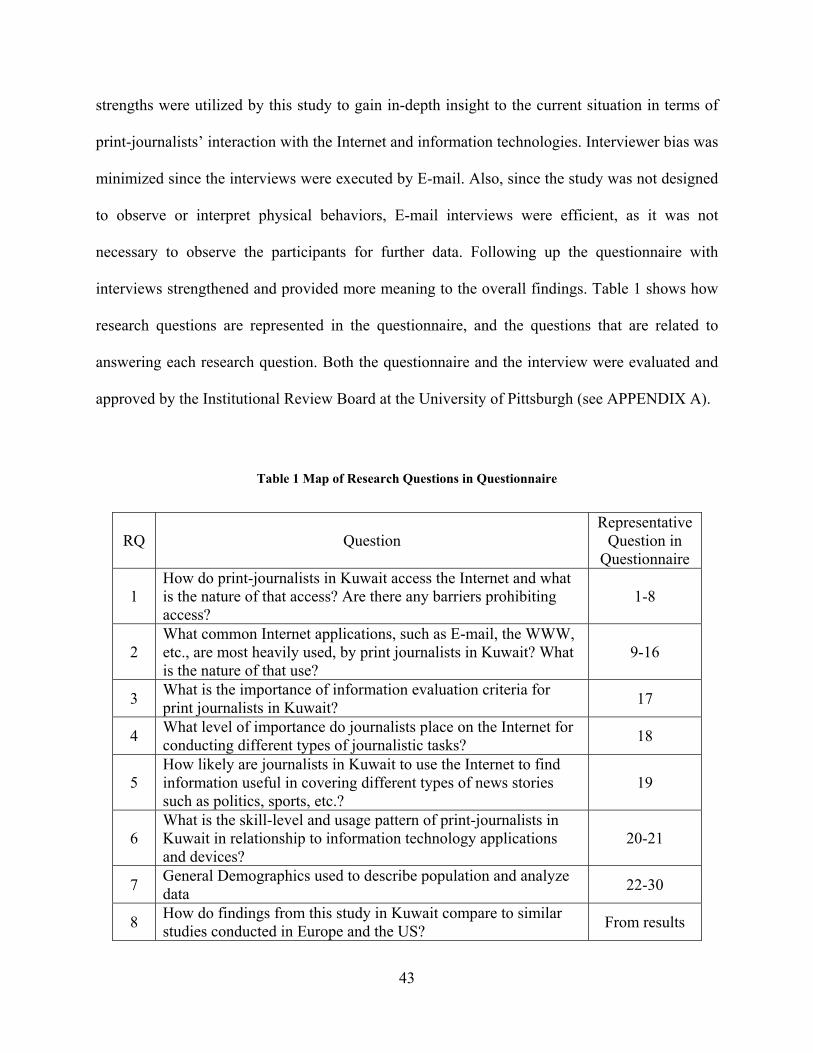
strengths were utilized by this study to gain in-depth insight to the current situation in terms of
print-journalists’ interaction with the Internet and information technologies. Interviewer bias was
minimized since the interviews were executed by E-mail. Also, since the study was not designed
to observe or interpret physical behaviors, E-mail interviews were efficient, as it was not
necessary to observe the participants for further data. Following up the questionnaire with
interviews strengthened and provided more meaning to the overall findings. Table 1 shows how
research questions are represented in the questionnaire, and the questions that are related to
answering each research question. Both the questionnaire and the interview were evaluated and
approved by the Institutional Review Board at the University of Pittsburgh (see APPENDIX A).
Table 1 Map of Research Questions in Questionnaire
RQ Question Representative
Question in Questionnaire
1 How do print-journalists in Kuwait access the Internet and what is the nature of that access? Are there any barriers prohibiting access?
1-8
2 What common Internet applications, such as E-mail, the WWW, etc., are most heavily used, by print journalists in Kuwait? What is the nature of that use?
9-16
3 What is the importance of information evaluation criteria for print journalists in Kuwait? 17
4 What level of importance do journalists place on the Internet for conducting different types of journalistic tasks? 18
5 How likely are journalists in Kuwait to use the Internet to find information useful in covering different types of news stories such as politics, sports, etc.?
19
6 What is the skill-level and usage pattern of print-journalists in Kuwait in relationship to information technology applications and devices?
20-21
7 General Demographics used to describe population and analyze data 22-30
8 How do findings from this study in Kuwait compare to similar studies conducted in Europe and the US? From results
43
3.1 DESIGN OF RESEARCH INSTRUMENT The questionnaire was divided into five sections: access and Internet usage, evaluation and
purpose, skills, demographics, and comments. These sections addressed the research questions,
with a comments section reserved for the respondents’ opinions regarding the study.
3.1.1 Access & Internet Usage
This section was designed to address the first and second research questions, related to access to
the Internet, and Internet application usage and importance. It included closed-ended questions
and Likert-type scales extracted from previous studies, and created by the researcher where
necessary. Internet access questions were brief, as it was only intended to gauge the extent of
Internet penetration in the newspapers, and reasons that hindered access, such as lack of time,
skills, confidence, equipment, etc.
Primarily, this section focused on Internet application usage and importance. The
questions were extracted from previous studies (e.g. Momani, 2003; Garrison, 1999, 2002; Lüge,
1999; Nicholas, Williams, Cole & Martin, 2000). The purpose was to identify which
applications, such as E-mail, World Wide Web, databases, discussion groups, etc., were most
heavily used, and perceived as most important by the print-journalists targeted. This data would
be important for future efforts geared towards enhancing the Internet, or Intranets, creating help
guides, enhancing software to adapt to the population’s preferences, and raise awareness of
applications that could be neglected.
44
Since E-mail is the most popular, and most widely used Internet application (Thomas,
1997), a number of questions were included to examine issues related to E-mail. The study
aimed to identify the leading uses of E-mail, issues related to E-mail, such as viruses, time, etc.,
and amount of use. Also, questions were included to examine another popular application- the
WWW. These questions were intended to identify web resources used by print-journalists in
terms of sites and their types, such as directories, newspapers, government sites, press releases,
etc.
In terms of question design and layout, the questionnaire contained a number of questions
that led to different sections for non-users of a specific application, or the Internet as a whole.
The first three questions were designed to separate Internet users from non-users. The non-users
were asked about the obstacles that prevented them from using the Internet, and whether they
were aware of the possible benefits of using the Internet. Non-users were then asked to go to
question 20 to answer the skills question, and the rest of the questions. This approach allowed the
study to gain valuable information about individuals who did not use the Internet. Questions 4 to
8 in the questionnaire were designed to evaluate the place of Internet access, the availability of
an Internet connection at work, years of experience in using the Internet, and obstacles faced
online. The goal of these questions was to answer research question 1. Questions 9 to 16 in the
questionnaire were designed to evaluate the amount of time spent using a number of
applications, such as E-mail, the WWW, forums, etc., in order to observe the importance of the
applications mentioned to the respondents. The researched adopted the assumption that the
amount of time spent using an application reflected the application’s importance to the
respondent, and that there was not a need to pose a similar question regarding the importance of
each application. In addition to saving space that was used for other issues, removing the
45
importance of applications question avoided repetition and confusion. Questions 10 to 13
targeted E-mail, since previous studies indicated that it is one of the more popular applications
on the Internet. Finally, questions 14 to 16 in the questionnaire targeted the WWW, as it was
another popular Internet application according to previous studies.
3.1.2 Evaluation & Purpose
This section was designed to examine the skills of print-journalists in evaluating online
information. To answer the third research question, the study examined the perceptions of print-
journalists towards different characteristics of websites, such as validity, accessibility, speed,
authority, reputation, stability, accuracy, objectivity, currency, etc., in the form of question 17 in
the questionnaire. These characteristics were extracted from previous studies (e.g., Garrison
1999; Tillman, 2003; Dong, 2003; Tate & Alexander, 1996; Dragulanescu, 2002). This
examination of evaluation criteria provided important data that would guide future efforts in
terms of creating help guides, enhancing electronic tools, improving teaching curricula, and
raising awareness of the available tools that can assist in evaluating information found online.
Also, this section examined the uses made by print-journalists of information found
online to answer the fourth research question in the form of question 18 in the questionnaire.
Questions were extracted from previous studies (e.g. Anwar, Al-Ansari & Abdullah, 2004;
Garrison, 1999; Ketterer, 2003; Metcalfe & Gascoigne, 2001), and were modified to suit the
intended goals of this study. The intention was to examine the degree of dependency on
information found online in the daily work of print-journalists. The higher the dependency on
information found online, the more important it is for journalists to be aware and capable of
46
using evaluation criteria to evaluate information. Therefore, question 19 in the questionnaire,
targeted the likeliness of turning to the Internet as a source of information for a number of
coverage types, such as health, politics, etc. The question was included to answer research
question 5.
3.1.3 Skills
This section was intended to examine the basic information technology skills needed by
journalists as developed by Miller (Wickham, 1999). The skills included using operating
systems, word processing programs, spreadsheets, databases, communication software, E-mail,
the WWW, and Internet protocols such as Gopher, file transfer protocol (ftp), etc. The purpose of
this section was to gain an idea about the current skill-level of print-journalists in Kuwait, and
areas of strength, or weakness.
Question 20 in the questionnaire was included to answer research question 6. This data
can be useful for guiding training programs for journalists and improving teaching curricula.
Also, question 21 in the questionnaire was included to answer research question 6. The goal was
to gauge the technology sophistication of respondents through the devices they used. This
question was meant to reflect the current situation, and possibly provide paths to new research
for system-oriented studies.
47
3.1.4 Demographics
This section, that included questions 22 to 30, was included to collect data describing the
population in terms of gender, age, primary journalistic beat, length of experience as a journalist,
citizenship, education, primary field of study (major), location of educational institution, and the
number of languages known. The data assisted in describing the characteristics of the population,
in addition to providing data that allowed the researcher to examine and analyze the data, or the
variables related to each research question, from a number of different angles such as length of
experience, gender, education, etc.
3.1.5 Comments
This section was included to provide respondents the opportunity to share their opinions
regarding the questionnaire design, the topics covered by the questionnaire, or any other ideas.
This was important since the researcher gained more insight about certain issues, and chose to
ask questions for clarification in the follow-up E-mail interviews.
48
3.2 FOLLOW-UP INTERVIEWS BY E-MAIL
Participation in the interviews was voluntary. Willing respondents to the questionnaire were
asked to provide their contact information for further participation in the study i.e. the interview.
The number of journalists who provided E-mail addresses was 68 individuals. These E-mail were
mostly commercial E-mails, with only one newspaper providing an E-mail server for its
employees. Knowledgeable media sources indicated that journalists were used to utilizing
commercial E-mail addresses for personal and business communications. Further, newspapers
have adopted commercial E-mails as an acceptable business communications medium to the
degree that these E-mails are published on a daily basis as part of news items to allow for
feedback from readers.
Around 50 percent of the total number of E-mails provided was chosen randomly for
participation. This yielded 34 E-mail addresses that were sent the follow-up interviews. Of the 34
volunteers chosen, 12 responded within the time allocated for this task, for a response rate of
nearly 35 percent. The interviews were conducted in both English and Arabic, depending on the
source of the E-mail. E-mail provided by journalists working in English-language newspapers
were sent the English version of the interview. Once the interviews were concluded, the
researcher quoted insightful responses and included them in the data analysis section to
supplement the overall findings of the study. Also, attention was provided to new issues raised
by respondents.
The questions that were included in the follow-up interviews were as following:
1. In your opinion, do you think that the Internet and other information technologies
encourage females to pursue careers in journalism or not? Why?
49
2. Please describe a situation where the Internet was instrumental in the development of a
news story.
3. Do you encourage enhancing the current educational curricula in Kuwait to improve
Internet-related behaviors of journalists? Why? And what changes would you
recommend?
4. What should training seminars and workshops focus on in order to improve Internet-
related behaviors of journalists?
5. Would more “journalist friendly” systems, or software, improve Internet-related
behaviors of journalists? What would these systems consist of? (For example E-mail,
browsing, virus protection, etc.)
The E-mail interviews were translated, when necessary, and analyzed accordingly. The
researcher attempted to identify ideas and trends that could benefit the overall findings. The
findings from E-mail interviews are quoted in the discussion of the results to supplement data
from questionnaires. This method of combining quantitative and qualitative data enhanced
findings, and provided a better framework for understanding results. Content analysis was
examined as a potential analysis tool for the follow-up interviews by E-mail. However, it was not
used since translating E-mail interviews, which were mostly in Arabic, will affect context and
meaning, which would affect the overall findings. Future studies could incorporate this approach
when the area is explored well-enough to allow for trends to appear in the data more clearly.
50
3.2.1 Methodological Findings for Interviews by E-mail
E-mail interviews were convenient and effective for the purposes of this study since these did not
require scheduling a convenient time for both the journalist and the researcher. Further, it
allowed the researcher to follow-up on the results of the questionnaire, rather than being a
differing version of the questionnaire. Previous studies emphasized the loss of spontaneity in E-
mail interviews. However, due to the nature of the topics covered in this study, spontaneity, body
language, and direct interaction with participants were not necessary, and were viewed to be
minimally beneficial to the goal of exploring opinions.
Also, using E-mail interviews allowed participants to construct their answers, since they
had ample time to refer to notes, references, and other information resources. This could be a
disadvantage for some studies, but in this study, this was beneficial since the aim was to explore
opinion and ideas in a new area. Constructed answers were beneficial towards pointing to
specific resources used in answers and the logic behind the ideas presented. Also, these added
depth to answers, which could be less beneficial if spontaneity was available.
Further, another benefit of this approach was yielding a sample of technology-savvy
respondents. The expectation was that the more technology-savvy respondents were more likely
to volunteer for the E-mail interviews. This assumption was examined by comparing the results
of E-mail participants to those of the general population, with the aim of describing the E-mail
interviews sample. Results showed that respondents who provided their E-mail addresses were
significantly more skilled in using the Internet than ones who did not.
The more technology-savvy respondents were more beneficial for the E-mail interviews
since they assisted the exploration of the topics of the study by providing in-depth and rich
51
answers. Also, they assisted in pointing to areas of weaknesses related to Internet behaviors
which resulted in recommendations for further research.
Further, a large number of responses to the interviews by E-mail were brief, and were not
useful for the purposes of this study. However, a small number of respondents provided lengthy,
insightful answers, which were beneficial for examination and inclusion in the analysis.
Overall, using this method was beneficial in terms of examining the preferences of the
population towards such a method. The population was very positive and was more willing than
not to participate in such an interview. However, timing could have affected the response rate,
and the overall outcome. The follow-up interviews by E-mail were conducted during the holy
month of Ramadan, a time when journalists worked shorter hours and had the same workload,
giving them less time for participation in the interview.
Follow-up interviews by E-mail were useful and efficient as secondary research
instrument. However, researchers in the developing world should be cautious in using this
method as a primary research instrument, as participation and response can be problematic. More
time is needed for the population in the developing world to be more aware of the different
research methods made available by the advances in technology and their importance as research
instruments.
52
3.3 POPULATION OF STUDY
The population of the study included all print-journalists working at the seven daily newspapers
in Kuwait. This included all employees who received a salary from a daily newspaper for
journalistic work, such as writing, editing, and interviewing contacts for the purpose of
developing news stories. Photographers, cartoonists, and guest columnists were excluded from
the population due to the differing nature of their work. The number of journalists included in the
study was determined through each daily newspaper. A letter in Arabic was sent to each editor-
in-chief requesting that the number of print-journalists, as defined by the study, working at the
newspaper be disclosed. The total number of journalists ranged from 100 to 140 individuals.
3.4 PRE-TESTING QUESTIONNAIRE
The pre-testing of the questionnaire was concluded in April, 2006. The number of participants
was 37 including 32 Kuwaiti journalism students in the US, and five personal contacts perceived
as qualified to assist and benefit the progress of this study. Journalism students were targeted
because they are familiar with the culture of Kuwait, and could provide valuable feedback.
Journalists in Kuwait were excluded from the pre-test to avoid sensitizing the population to the
topics of the questionnaire.
Ten participants received the English questionnaire, and an equal number received the
Arabic one. Also, 17 individuals received both Arabic and English versions. The sample size
53
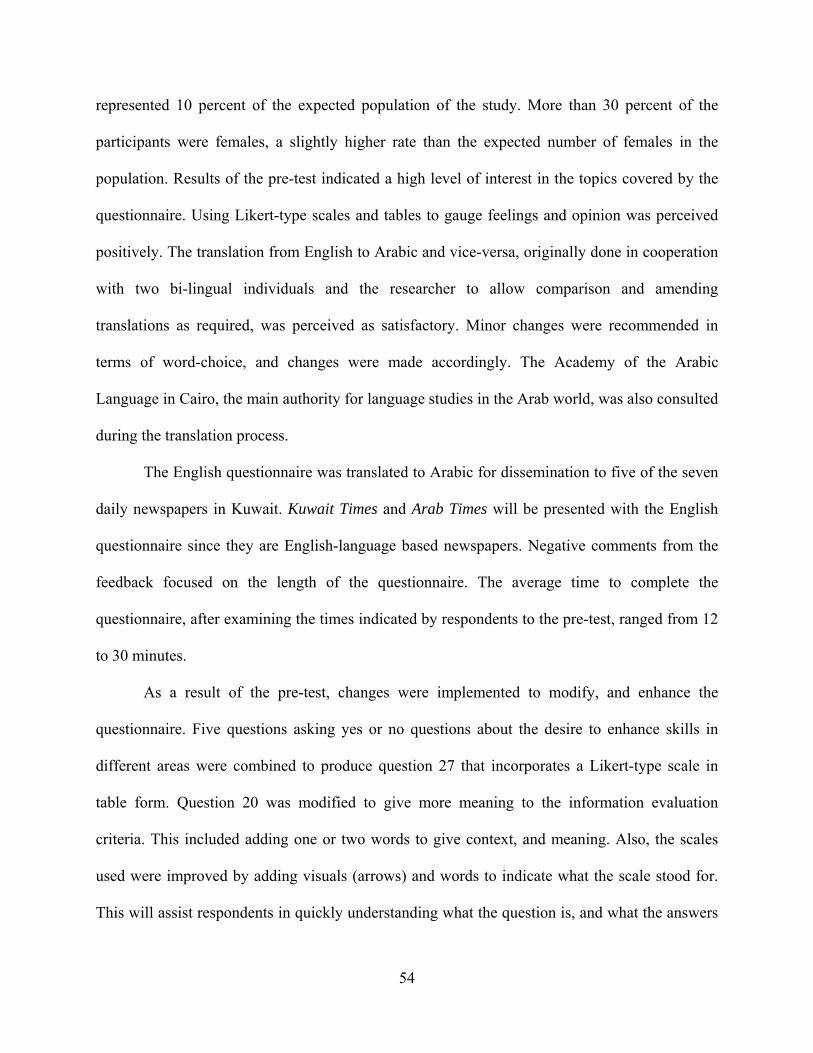
represented 10 percent of the expected population of the study. More than 30 percent of the
participants were females, a slightly higher rate than the expected number of females in the
population. Results of the pre-test indicated a high level of interest in the topics covered by the
questionnaire. Using Likert-type scales and tables to gauge feelings and opinion was perceived
positively. The translation from English to Arabic and vice-versa, originally done in cooperation
with two bi-lingual individuals and the researcher to allow comparison and amending
translations as required, was perceived as satisfactory. Minor changes were recommended in
terms of word-choice, and changes were made accordingly. The Academy of the Arabic
Language in Cairo, the main authority for language studies in the Arab world, was also consulted
during the translation process.
The English questionnaire was translated to Arabic for dissemination to five of the seven
daily newspapers in Kuwait. Kuwait Times and Arab Times will be presented with the English
questionnaire since they are English-language based newspapers. Negative comments from the
feedback focused on the length of the questionnaire. The average time to complete the
questionnaire, after examining the times indicated by respondents to the pre-test, ranged from 12
to 30 minutes.
As a result of the pre-test, changes were implemented to modify, and enhance the
questionnaire. Five questions asking yes or no questions about the desire to enhance skills in
different areas were combined to produce question 27 that incorporates a Likert-type scale in
table form. Question 20 was modified to give more meaning to the information evaluation
criteria. This included adding one or two words to give context, and meaning. Also, the scales
used were improved by adding visuals (arrows) and words to indicate what the scale stood for.
This will assist respondents in quickly understanding what the question is, and what the answers
54
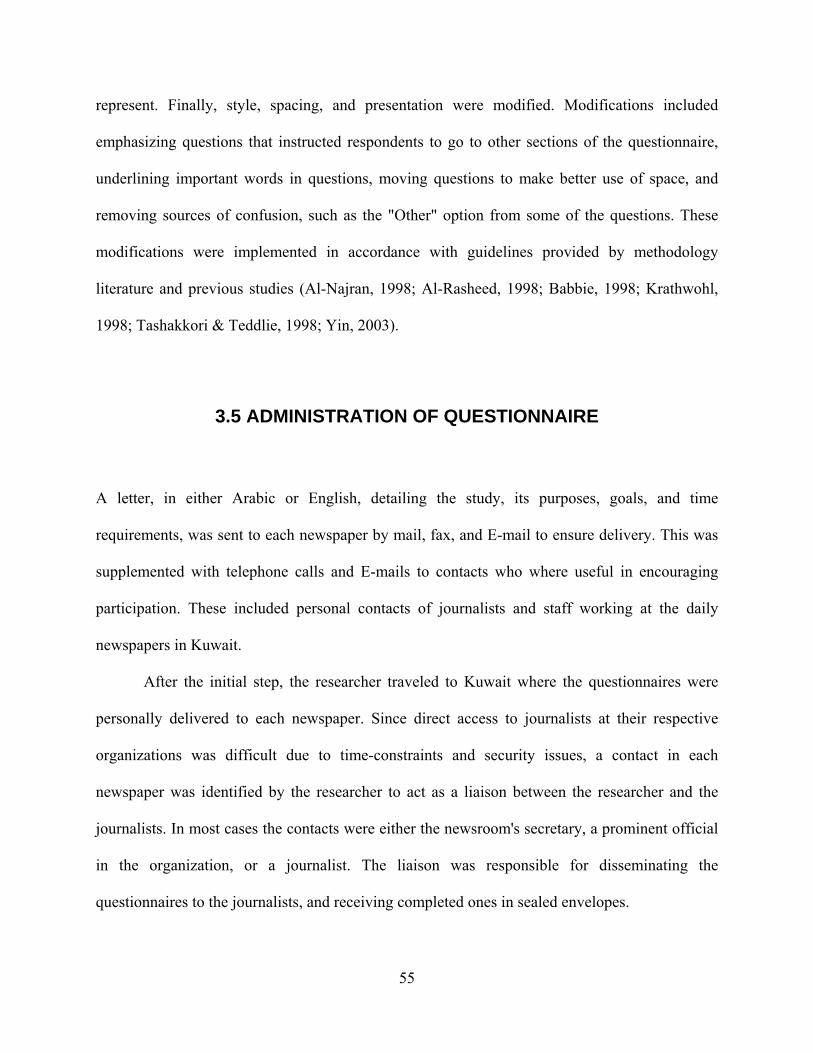
represent. Finally, style, spacing, and presentation were modified. Modifications included
emphasizing questions that instructed respondents to go to other sections of the questionnaire,
underlining important words in questions, moving questions to make better use of space, and
removing sources of confusion, such as the "Other" option from some of the questions. These
modifications were implemented in accordance with guidelines provided by methodology
literature and previous studies (Al-Najran, 1998; Al-Rasheed, 1998; Babbie, 1998; Krathwohl,
1998; Tashakkori & Teddlie, 1998; Yin, 2003).
3.5 ADMINISTRATION OF QUESTIONNAIRE
A letter, in either Arabic or English, detailing the study, its purposes, goals, and time
requirements, was sent to each newspaper by mail, fax, and E-mail to ensure delivery. This was
supplemented with telephone calls and E-mails to contacts who where useful in encouraging
participation. These included personal contacts of journalists and staff working at the daily
newspapers in Kuwait.
After the initial step, the researcher traveled to Kuwait where the questionnaires were
personally delivered to each newspaper. Since direct access to journalists at their respective
organizations was difficult due to time-constraints and security issues, a contact in each
newspaper was identified by the researcher to act as a liaison between the researcher and the
journalists. In most cases the contacts were either the newsroom's secretary, a prominent official
in the organization, or a journalist. The liaison was responsible for disseminating the
questionnaires to the journalists, and receiving completed ones in sealed envelopes.
55
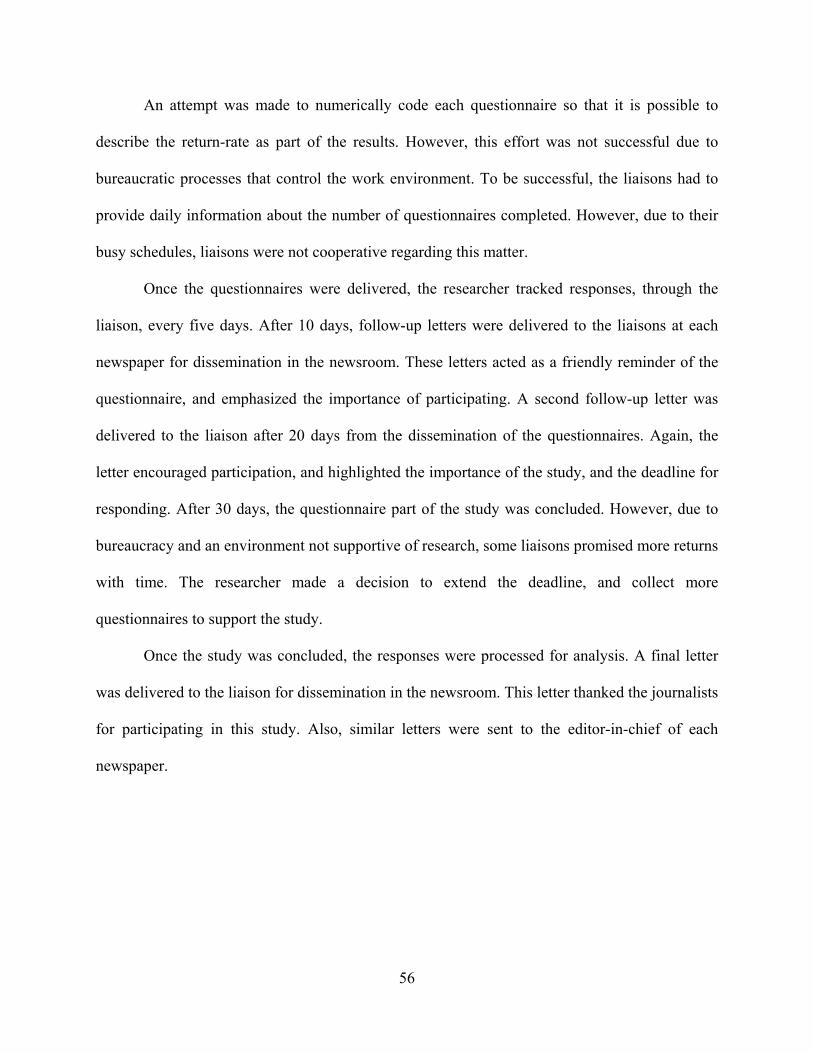
An attempt was made to numerically code each questionnaire so that it is possible to
describe the return-rate as part of the results. However, this effort was not successful due to
bureaucratic processes that control the work environment. To be successful, the liaisons had to
provide daily information about the number of questionnaires completed. However, due to their
busy schedules, liaisons were not cooperative regarding this matter.
Once the questionnaires were delivered, the researcher tracked responses, through the
liaison, every five days. After 10 days, follow-up letters were delivered to the liaisons at each
newspaper for dissemination in the newsroom. These letters acted as a friendly reminder of the
questionnaire, and emphasized the importance of participating. A second follow-up letter was
delivered to the liaison after 20 days from the dissemination of the questionnaires. Again, the
letter encouraged participation, and highlighted the importance of the study, and the deadline for
responding. After 30 days, the questionnaire part of the study was concluded. However, due to
bureaucracy and an environment not supportive of research, some liaisons promised more returns
with time. The researcher made a decision to extend the deadline, and collect more
questionnaires to support the study.
Once the study was concluded, the responses were processed for analysis. A final letter
was delivered to the liaison for dissemination in the newsroom. This letter thanked the journalists
for participating in this study. Also, similar letters were sent to the editor-in-chief of each
newspaper.
56
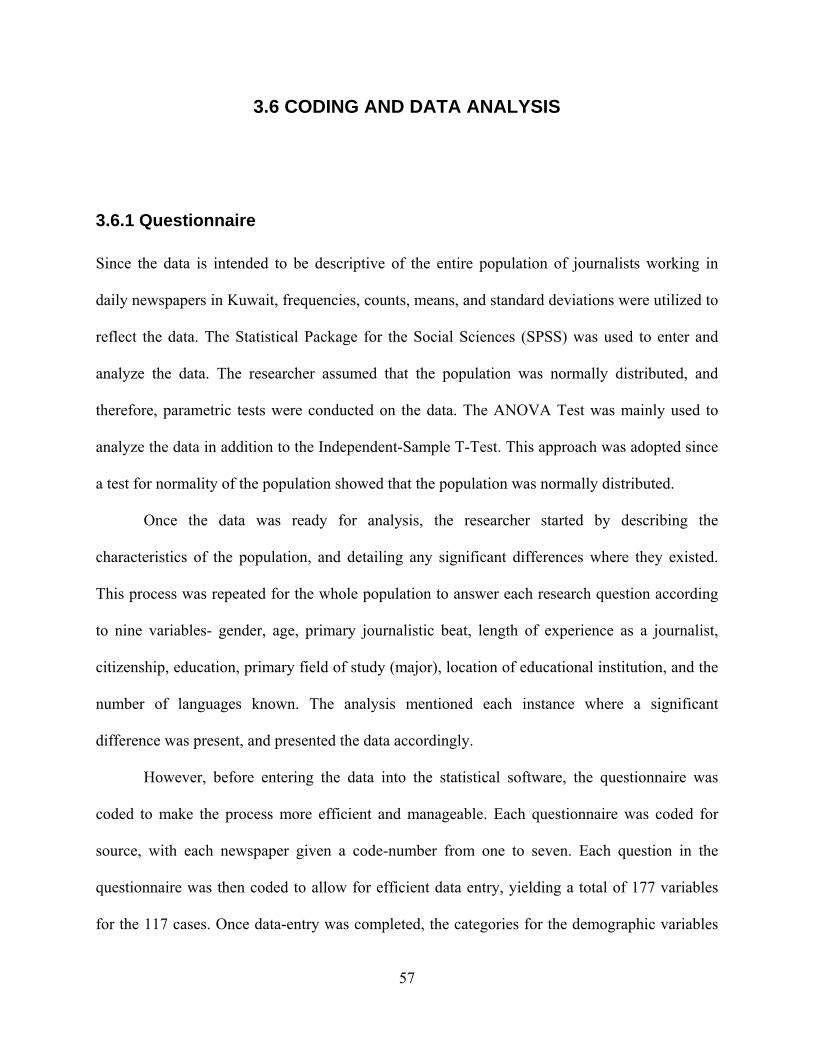
3.6 CODING AND DATA ANALYSIS
3.6.1 Questionnaire
Since the data is intended to be descriptive of the entire population of journalists working in
daily newspapers in Kuwait, frequencies, counts, means, and standard deviations were utilized to
reflect the data. The Statistical Package for the Social Sciences (SPSS) was used to enter and
analyze the data. The researcher assumed that the population was normally distributed, and
therefore, parametric tests were conducted on the data. The ANOVA Test was mainly used to
analyze the data in addition to the Independent-Sample T-Test. This approach was adopted since
a test for normality of the population showed that the population was normally distributed.
Once the data was ready for analysis, the researcher started by describing the
characteristics of the population, and detailing any significant differences where they existed.
This process was repeated for the whole population to answer each research question according
to nine variables- gender, age, primary journalistic beat, length of experience as a journalist,
citizenship, education, primary field of study (major), location of educational institution, and the
number of languages known. The analysis mentioned each instance where a significant
difference was present, and presented the data accordingly.
However, before entering the data into the statistical software, the questionnaire was
coded to make the process more efficient and manageable. Each questionnaire was coded for
source, with each newspaper given a code-number from one to seven. Each question in the
questionnaire was then coded to allow for efficient data entry, yielding a total of 177 variables
for the 117 cases. Once data-entry was completed, the categories for the demographic variables
57

were examined and tested for balance. This step was necessary so that the categories reflected a
more balanced number of cases. After the initial examination, it was decided to modify the
coding for age, primary journalistic beat, citizenship, level of education, primary field of study,
location of educational institution issuing latest degree, and the number of languages known. A
description of the modifications made to the variables mentioned follows.
58
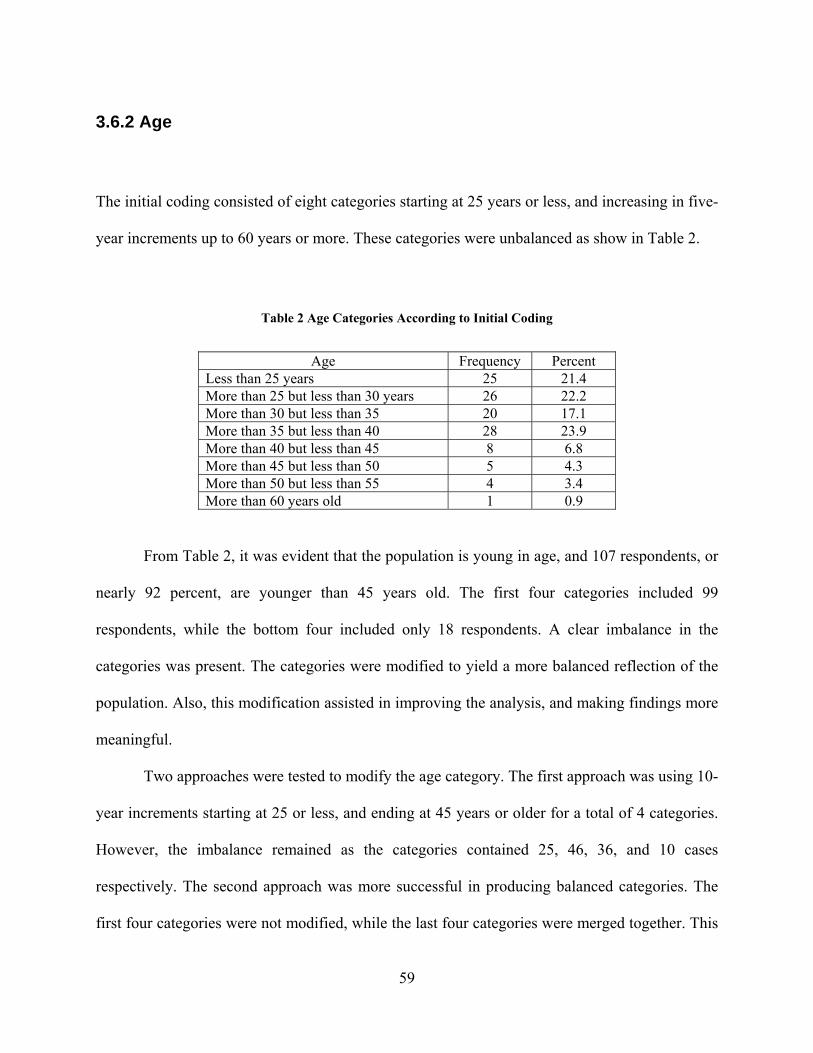
3.6.2 Age
The initial coding consisted of eight categories starting at 25 years or less, and increasing in five-
year increments up to 60 years or more. These categories were unbalanced as show in Table 2.
Table 2 Age Categories According to Initial Coding
Age Frequency Percent
Less than 25 years 25 21.4 More than 25 but less than 30 years 26 22.2 More than 30 but less than 35 20 17.1 More than 35 but less than 40 28 23.9 More than 40 but less than 45 8 6.8 More than 45 but less than 50 5 4.3 More than 50 but less than 55 4 3.4 More than 60 years old 1 0.9
From Table 2, it was evident that the population is young in age, and 107 respondents, or
nearly 92 percent, are younger than 45 years old. The first four categories included 99
respondents, while the bottom four included only 18 respondents. A clear imbalance in the
categories was present. The categories were modified to yield a more balanced reflection of the
population. Also, this modification assisted in improving the analysis, and making findings more
meaningful.
Two approaches were tested to modify the age category. The first approach was using 10-
year increments starting at 25 or less, and ending at 45 years or older for a total of 4 categories.
However, the imbalance remained as the categories contained 25, 46, 36, and 10 cases
respectively. The second approach was more successful in producing balanced categories. The
first four categories were not modified, while the last four categories were merged together. This
59
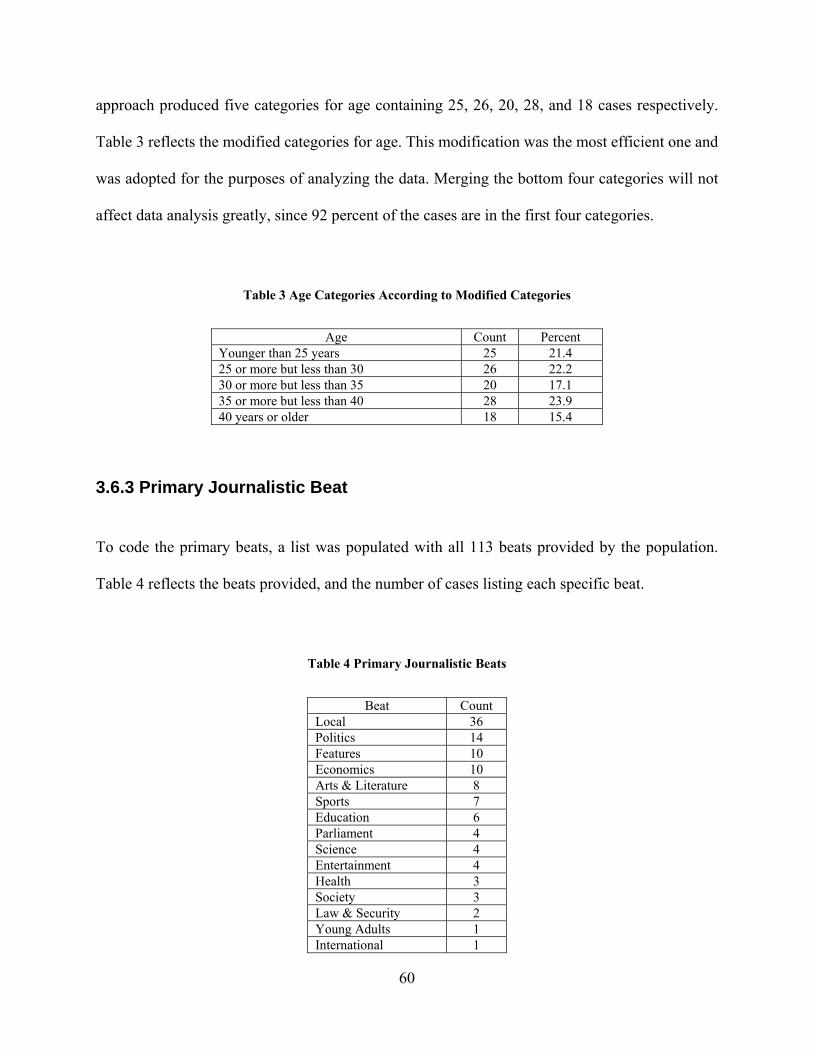
approach produced five categories for age containing 25, 26, 20, 28, and 18 cases respectively.
Table 3 reflects the modified categories for age. This modification was the most efficient one and
was adopted for the purposes of analyzing the data. Merging the bottom four categories will not
affect data analysis greatly, since 92 percent of the cases are in the first four categories.
Table 3 Age Categories According to Modified Categories
Age Count Percent
Younger than 25 years 25 21.4 25 or more but less than 30 26 22.2 30 or more but less than 35 20 17.1 35 or more but less than 40 28 23.9 40 years or older 18 15.4
3.6.3 Primary Journalistic Beat
To code the primary beats, a list was populated with all 113 beats provided by the population.
Table 4 reflects the beats provided, and the number of cases listing each specific beat.
Table 4 Primary Journalistic Beats
Beat Count
Local 36 Politics 14 Features 10 Economics 10 Arts & Literature 8 Sports 7 Education 6 Parliament 4 Science 4 Entertainment 4 Health 3 Society 3 Law & Security 2 Young Adults 1 International 1
60
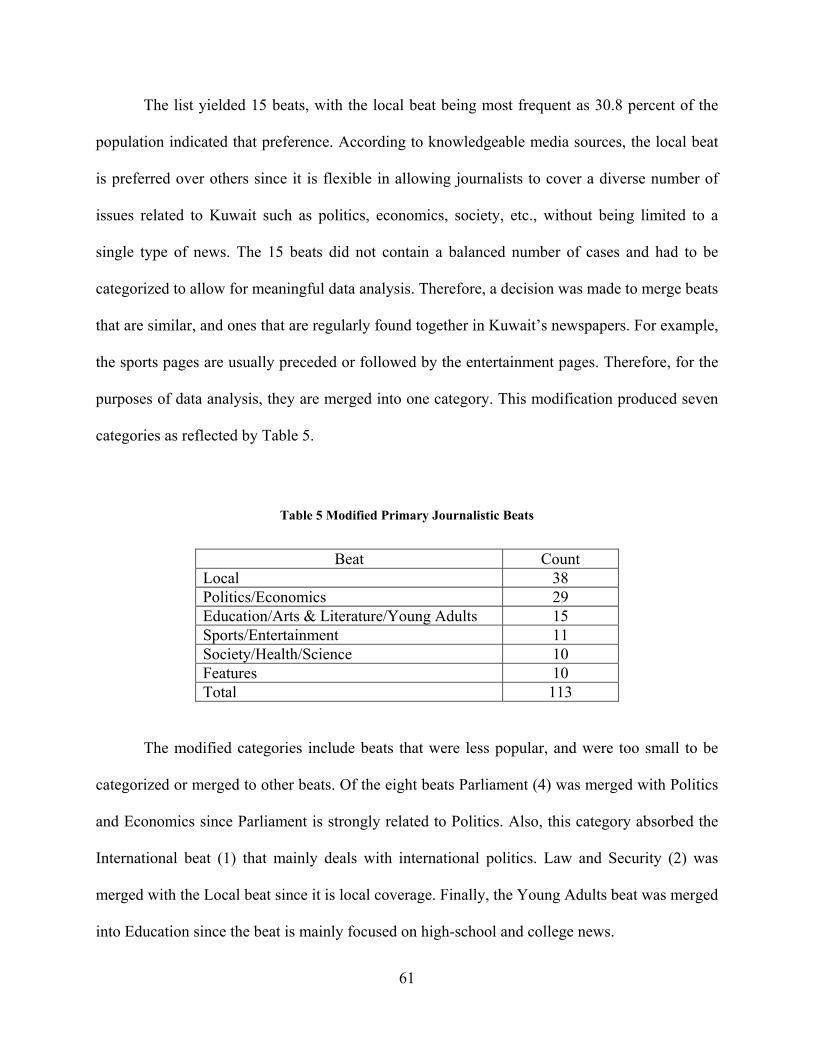
The list yielded 15 beats, with the local beat being most frequent as 30.8 percent of the
population indicated that preference. According to knowledgeable media sources, the local beat
is preferred over others since it is flexible in allowing journalists to cover a diverse number of
issues related to Kuwait such as politics, economics, society, etc., without being limited to a
single type of news. The 15 beats did not contain a balanced number of cases and had to be
categorized to allow for meaningful data analysis. Therefore, a decision was made to merge beats
that are similar, and ones that are regularly found together in Kuwait’s newspapers. For example,
the sports pages are usually preceded or followed by the entertainment pages. Therefore, for the
purposes of data analysis, they are merged into one category. This modification produced seven
categories as reflected by Table 5.
Table 5 Modified Primary Journalistic Beats
Beat Count
Local 38 Politics/Economics 29 Education/Arts & Literature/Young Adults 15 Sports/Entertainment 11 Society/Health/Science 10 Features 10 Total 113
The modified categories include beats that were less popular, and were too small to be
categorized or merged to other beats. Of the eight beats Parliament (4) was merged with Politics
and Economics since Parliament is strongly related to Politics. Also, this category absorbed the
International beat (1) that mainly deals with international politics. Law and Security (2) was
merged with the Local beat since it is local coverage. Finally, the Young Adults beat was merged
into Education since the beat is mainly focused on high-school and college news.
61
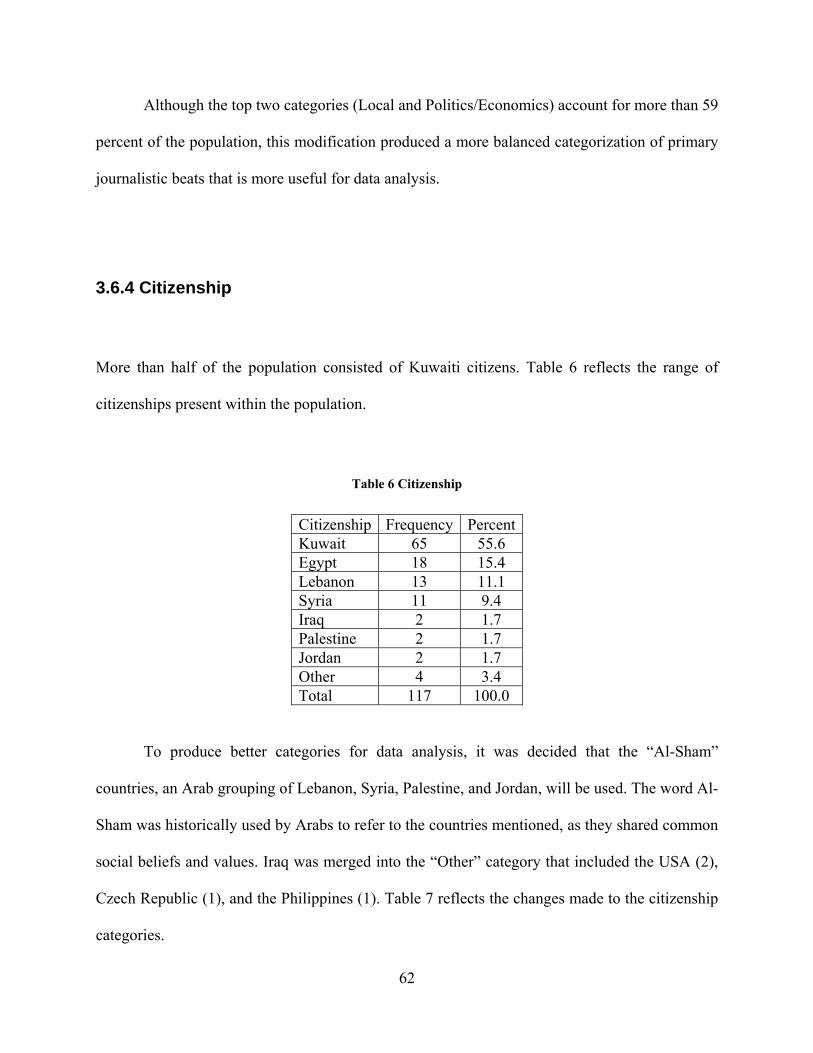
Although the top two categories (Local and Politics/Economics) account for more than 59
percent of the population, this modification produced a more balanced categorization of primary
journalistic beats that is more useful for data analysis.
3.6.4 Citizenship
More than half of the population consisted of Kuwaiti citizens. Table 6 reflects the range of
citizenships present within the population.
Table 6 Citizenship
Citizenship Frequency PercentKuwait 65 55.6 Egypt 18 15.4 Lebanon 13 11.1 Syria 11 9.4 Iraq 2 1.7 Palestine 2 1.7 Jordan 2 1.7 Other 4 3.4 Total 117 100.0
To produce better categories for data analysis, it was decided that the “Al-Sham”
countries, an Arab grouping of Lebanon, Syria, Palestine, and Jordan, will be used. The word Al-
Sham was historically used by Arabs to refer to the countries mentioned, as they shared common
social beliefs and values. Iraq was merged into the “Other” category that included the USA (2),
Czech Republic (1), and the Philippines (1). Table 7 reflects the changes made to the citizenship
categories.
62
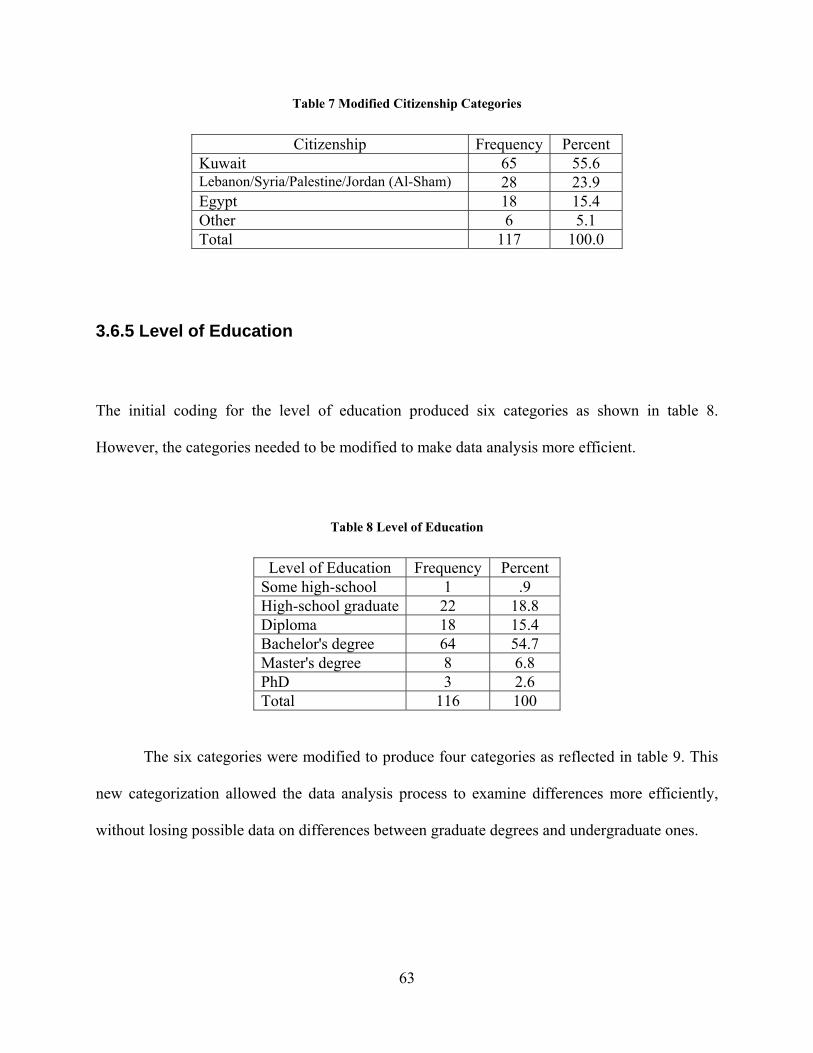
Table 7 Modified Citizenship Categories
Citizenship Frequency Percent Kuwait 65 55.6 Lebanon/Syria/Palestine/Jordan (Al-Sham) 28 23.9 Egypt 18 15.4 Other 6 5.1 Total 117 100.0
3.6.5 Level of Education
The initial coding for the level of education produced six categories as shown in table 8.
However, the categories needed to be modified to make data analysis more efficient.
Table 8 Level of Education
Level of Education Frequency Percent Some high-school 1 .9 High-school graduate 22 18.8 Diploma 18 15.4 Bachelor's degree 64 54.7 Master's degree 8 6.8 PhD 3 2.6 Total 116 100
The six categories were modified to produce four categories as reflected in table 9. This
new categorization allowed the data analysis process to examine differences more efficiently,
without losing possible data on differences between graduate degrees and undergraduate ones.
63
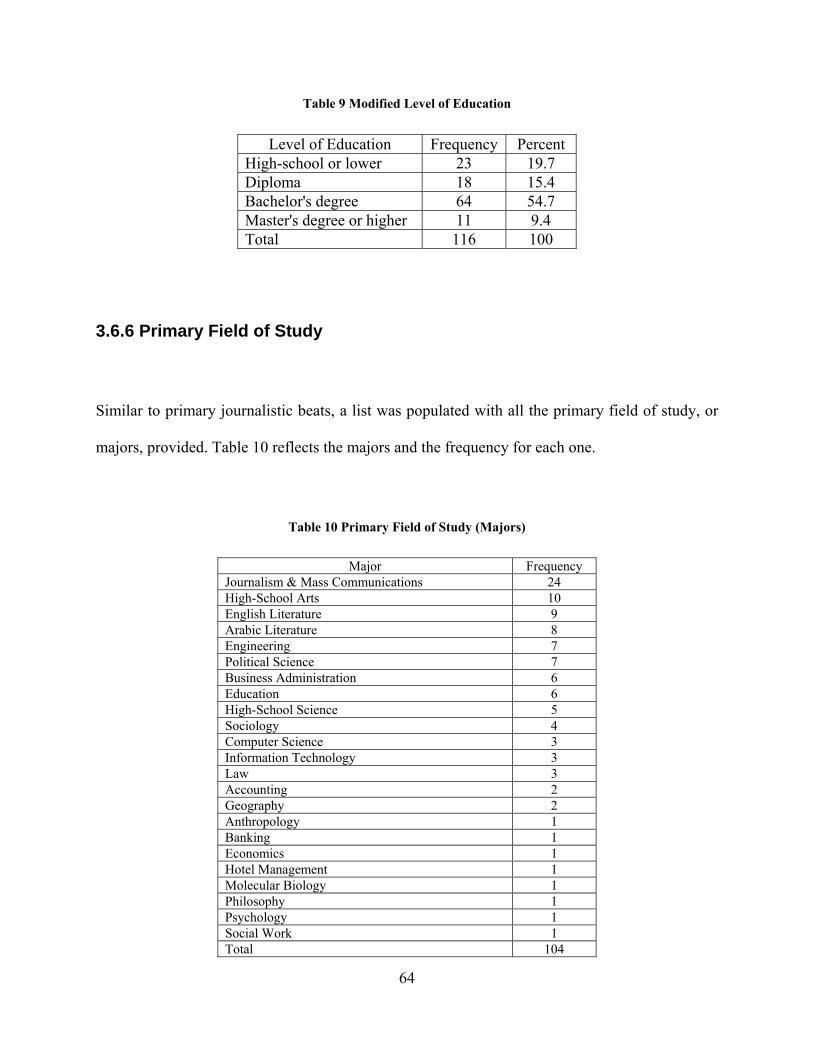
Table 9 Modified Level of Education
Level of Education Frequency Percent High-school or lower 23 19.7 Diploma 18 15.4 Bachelor's degree 64 54.7 Master's degree or higher 11 9.4 Total 116 100
3.6.6 Primary Field of Study
Similar to primary journalistic beats, a list was populated with all the primary field of study, or
majors, provided. Table 10 reflects the majors and the frequency for each one.
Table 10 Primary Field of Study (Majors)
Major Frequency Journalism & Mass Communications 24 High-School Arts 10 English Literature 9 Arabic Literature 8 Engineering 7 Political Science 7 Business Administration 6 Education 6 High-School Science 5 Sociology 4 Computer Science 3 Information Technology 3 Law 3 Accounting 2 Geography 2 Anthropology 1 Banking 1 Economics 1 Hotel Management 1 Molecular Biology 1 Philosophy 1 Psychology 1 Social Work 1 Total 104
64
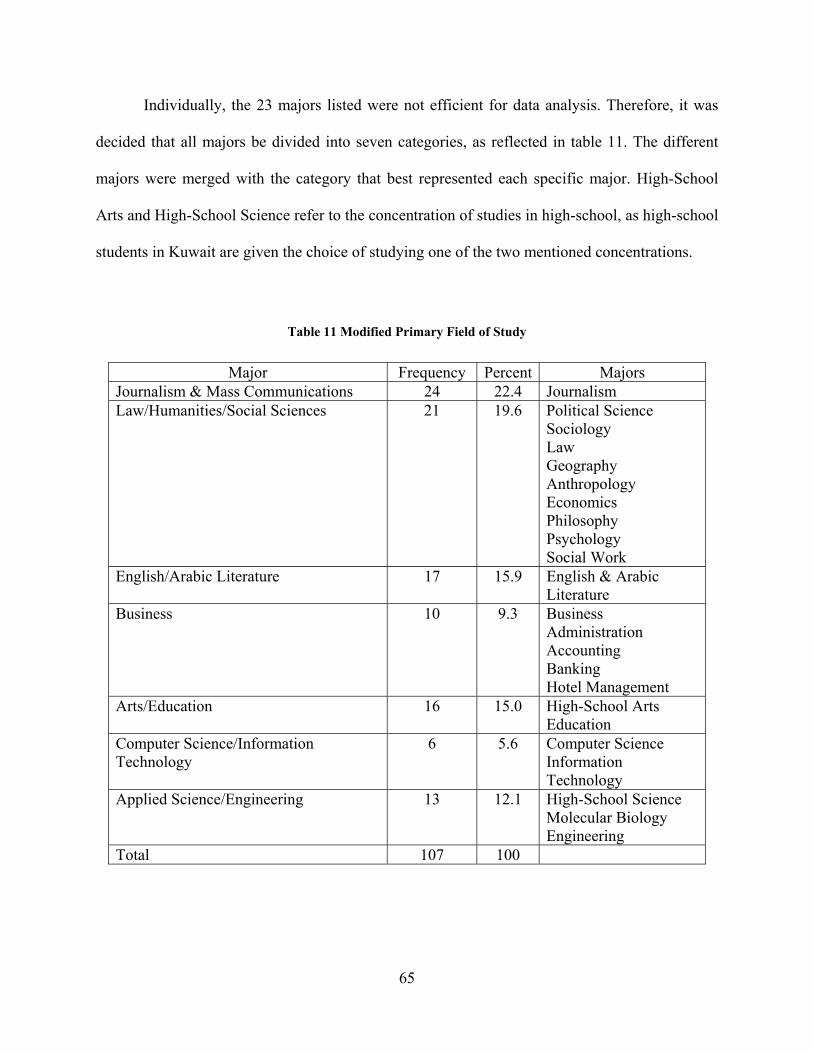
Individually, the 23 majors listed were not efficient for data analysis. Therefore, it was
decided that all majors be divided into seven categories, as reflected in table 11. The different
majors were merged with the category that best represented each specific major. High-School
Arts and High-School Science refer to the concentration of studies in high-school, as high-school
students in Kuwait are given the choice of studying one of the two mentioned concentrations.
Table 11 Modified Primary Field of Study
Major Frequency Percent Majors Journalism & Mass Communications 24 22.4 Journalism Law/Humanities/Social Sciences 21 19.6 Political Science
Sociology Law Geography Anthropology Economics Philosophy Psychology Social Work
English/Arabic Literature 17 15.9 English & Arabic Literature
Business 10 9.3 Business Administration Accounting Banking Hotel Management
Arts/Education 16 15.0 High-School Arts Education
Computer Science/Information Technology
6 5.6 Computer Science Information Technology
Applied Science/Engineering 13 12.1 High-School Science Molecular Biology Engineering
Total 107 100
65
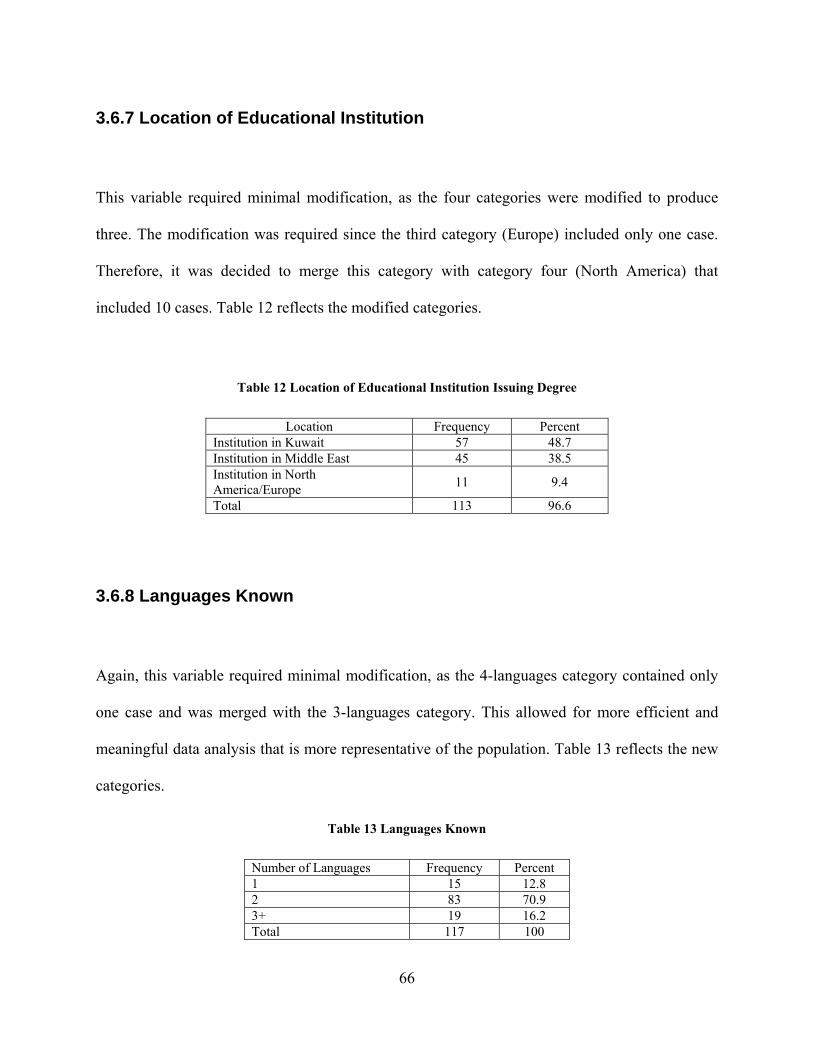
3.6.7 Location of Educational Institution
This variable required minimal modification, as the four categories were modified to produce
three. The modification was required since the third category (Europe) included only one case.
Therefore, it was decided to merge this category with category four (North America) that
included 10 cases. Table 12 reflects the modified categories.
Table 12 Location of Educational Institution Issuing Degree
Location Frequency Percent Institution in Kuwait 57 48.7 Institution in Middle East 45 38.5 Institution in North America/Europe 11 9.4
Total 113 96.6
3.6.8 Languages Known
Again, this variable required minimal modification, as the 4-languages category contained only
one case and was merged with the 3-languages category. This allowed for more efficient and
meaningful data analysis that is more representative of the population. Table 13 reflects the new
categories.
Table 13 Languages Known
Number of Languages Frequency Percent 1 15 12.8 2 83 70.9 3+ 19 16.2 Total 117 100
66
The analysis examined data from a number of angles including by gender, age, main
journalistic beat, length of experience as a journalist, citizenship, education level, field of study,
location of educational institution, and by the number of languages spoken. Each angle was
examined to identify potential behavioral differences in the population. This analysis was
important in identifying ways to improve inefficient Internet-related behaviors. Again, frequency
tables using means and standard deviations were used to reflect data according to each angle
mentioned previously. In-depth statistical analysis, such as ANOVA and regression, was not
executed as it would have added minimal benefits to the goals of the study of exploring the
current situation. Such in-depth statistical analysis could be conducted in future studies in the
same area, when the data is rich enough to conduct hypothesis-driven research.
3.7 MISSING VALUES
The researcher adopted an approach where missing values were ignored during data analysis
since the effect was minimal. Most respondents provided fully completed questionnaires. The
cover-letter of the questionnaire emphasized the importance of completing the questionnaire
fully. Further, the liaisons, and other personal contacts at each newspaper, cooperated in
reminding the respondents of the importance of participating in the study by providing complete
questionnaires. The handful of missing values that did exist in the data was attributed to human
error.
67
3.8 RELIABILITY AND VALIDITY
In terms of reliability of the questionnaire, reliability analysis was conducted using SPSS for the
scales used in questions 9, 16, 17, 18, 19, and 20, to determine Cronbach's Alpha. It was found
that all the scales used were highly reliable. Results are provided in the data analysis section for
each question.
As for validity, face validity was inspected by the researcher in both English and Arabic,
and was found to be reflective of the concepts being examined. Further, knowledgeable
individuals in both fields of computer science and journalism reviewed the questions included in
the research instruments, and were satisfied with face validity.
Further, evidence was gathered from the results to evaluate content validity, or measuring
what the researcher intended to measure. The evidence reflected valid results. As the length of
experience in using the Internet increased, so did the skill-levels in using information technology
applications, which is an expected result, implying that the questionnaire data was valid in terms
of measuring the underlying concepts.
3.9 TIMELINE
The study’s launch was delayed for more than a month due to political developments in Kuwait.
In May of 2006, the original date for the launch of the study, the political situation in Kuwait
became unstable resulting in the dissolution of Parliament, and a call for new elections on the
29th of June, 2006. The researcher, after conferring with knowledgeable sources, decided to delay
68
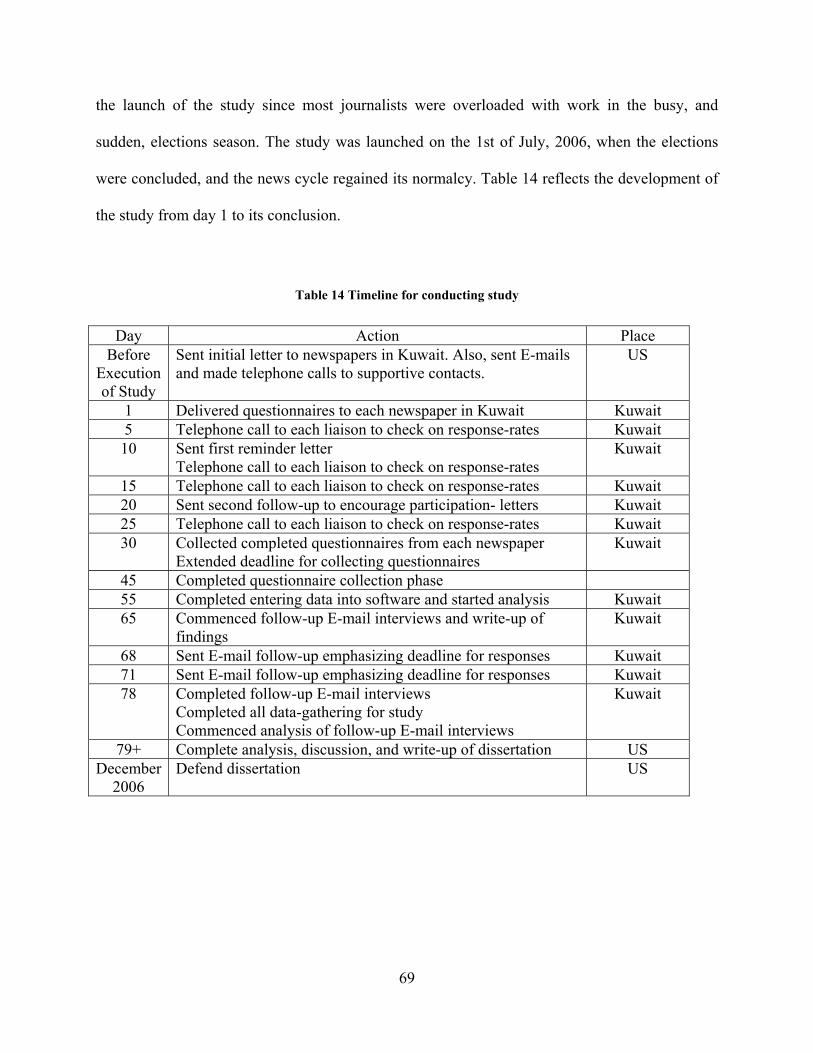
the launch of the study since most journalists were overloaded with work in the busy, and
sudden, elections season. The study was launched on the 1st of July, 2006, when the elections
were concluded, and the news cycle regained its normalcy. Table 14 reflects the development of
the study from day 1 to its conclusion.
Table 14 Timeline for conducting study
Day Action Place Before
Execution of Study
Sent initial letter to newspapers in Kuwait. Also, sent E-mails and made telephone calls to supportive contacts.
US
1 Delivered questionnaires to each newspaper in Kuwait Kuwait 5 Telephone call to each liaison to check on response-rates Kuwait 10 Sent first reminder letter
Telephone call to each liaison to check on response-rates Kuwait
15 Telephone call to each liaison to check on response-rates Kuwait 20 Sent second follow-up to encourage participation- letters Kuwait 25 Telephone call to each liaison to check on response-rates Kuwait 30 Collected completed questionnaires from each newspaper
Extended deadline for collecting questionnaires Kuwait
45 Completed questionnaire collection phase 55 Completed entering data into software and started analysis Kuwait 65 Commenced follow-up E-mail interviews and write-up of
findings Kuwait
68 Sent E-mail follow-up emphasizing deadline for responses Kuwait 71 Sent E-mail follow-up emphasizing deadline for responses Kuwait 78 Completed follow-up E-mail interviews
Completed all data-gathering for study Commenced analysis of follow-up E-mail interviews
Kuwait
79+ Complete analysis, discussion, and write-up of dissertation US December
2006 Defend dissertation US
69
4.0 DATA ANALYSIS AND RESULTS
This study was designed to be exploratory in nature and aimed to reflect a clear picture of the
current situation in Kuwait in terms of journalists and the Internet. The questionnaire collected
information about Internet access and usage, evaluation of online information and purpose of
use, information technology skill-levels, and demographics. Demographic information was
collected for nine variables for in-depth analysis. Each section was analyzed for the general
population, and then according to each of the nine variables mentions.
Questions included multiple-response and yes/no questions, and incremental scales in the
form of tables. The purpose was to gather detailed information about each concept being
examined. Data analysis involved descriptive statistics, frequencies, one-way ANOVA tests, and
Independent Samples T-Tests for variables that included only two categories such as gender.
Results of the data analysis will commence with demographic information, and proceed
to provide answers to each research question in the order they were listed previously. Significant
results will be displayed along with tables, while insignificant ones will only be mentioned.
Further, the data was analyzed using the Statistical Package for the Social Sciences
(SPSS) according to the statistical and analysis guidelines provided by Babbie (1998, 2004) and
Glass and Hopkins (1995).
70
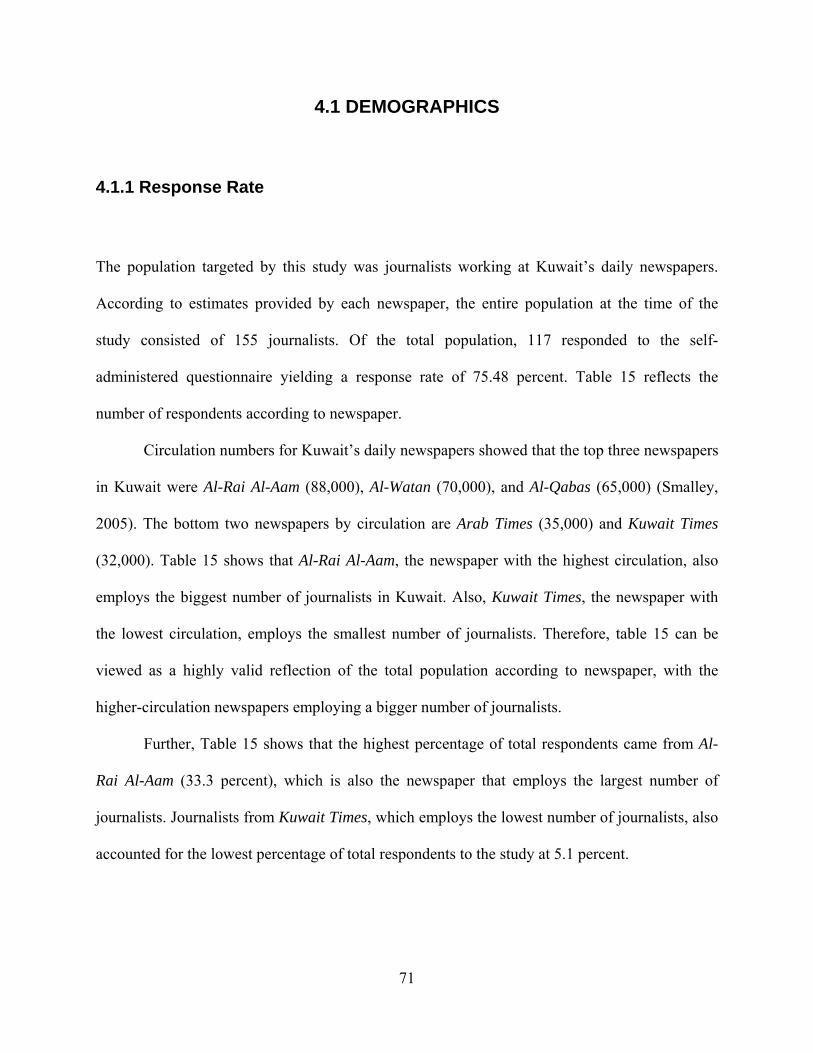
4.1 DEMOGRAPHICS
4.1.1 Response Rate
The population targeted by this study was journalists working at Kuwait’s daily newspapers.
According to estimates provided by each newspaper, the entire population at the time of the
study consisted of 155 journalists. Of the total population, 117 responded to the self-
administered questionnaire yielding a response rate of 75.48 percent. Table 15 reflects the
number of respondents according to newspaper.
Circulation numbers for Kuwait’s daily newspapers showed that the top three newspapers
in Kuwait were Al-Rai Al-Aam (88,000), Al-Watan (70,000), and Al-Qabas (65,000) (Smalley,
2005). The bottom two newspapers by circulation are Arab Times (35,000) and Kuwait Times
(32,000). Table 15 shows that Al-Rai Al-Aam, the newspaper with the highest circulation, also
employs the biggest number of journalists in Kuwait. Also, Kuwait Times, the newspaper with
the lowest circulation, employs the smallest number of journalists. Therefore, table 15 can be
viewed as a highly valid reflection of the total population according to newspaper, with the
higher-circulation newspapers employing a bigger number of journalists.
Further, Table 15 shows that the highest percentage of total respondents came from Al-
Rai Al-Aam (33.3 percent), which is also the newspaper that employs the largest number of
journalists. Journalists from Kuwait Times, which employs the lowest number of journalists, also
accounted for the lowest percentage of total respondents to the study at 5.1 percent.
71
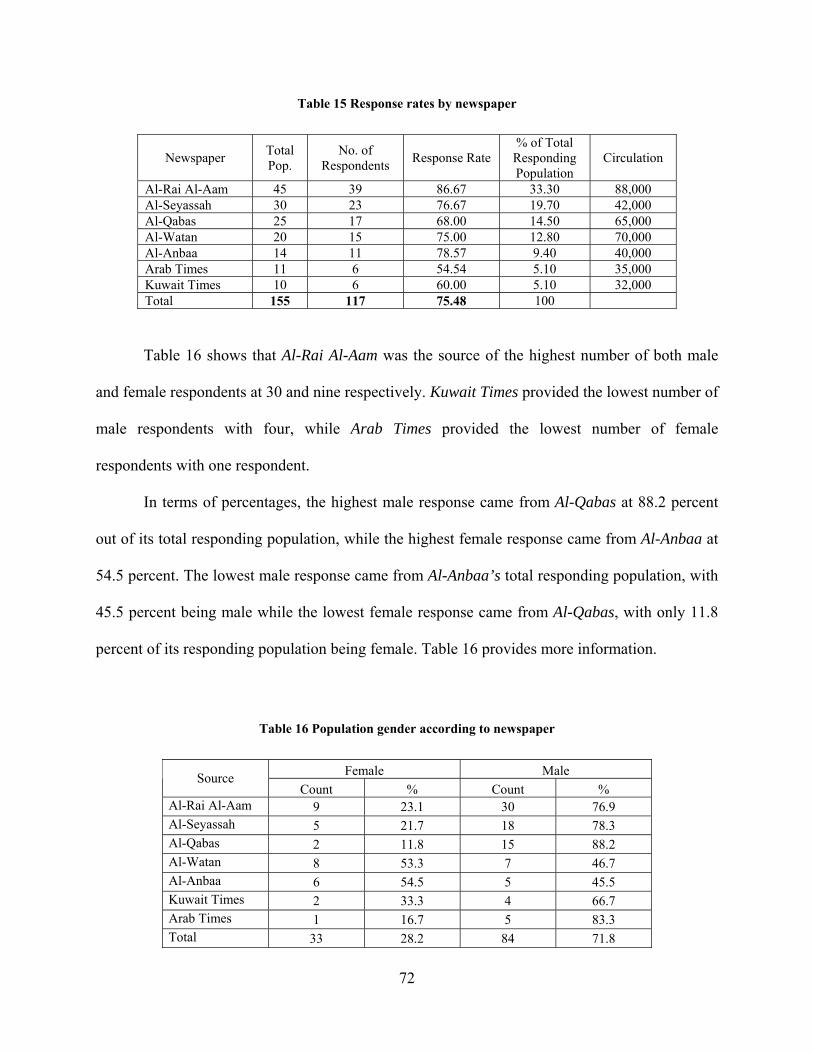
Table 15 Response rates by newspaper
Newspaper Total Pop.
No. of Respondents Response Rate
% of Total Responding Population
Circulation
Al-Rai Al-Aam 45 39 86.67 33.30 88,000 Al-Seyassah 30 23 76.67 19.70 42,000 Al-Qabas 25 17 68.00 14.50 65,000 Al-Watan 20 15 75.00 12.80 70,000 Al-Anbaa 14 11 78.57 9.40 40,000 Arab Times 11 6 54.54 5.10 35,000 Kuwait Times 10 6 60.00 5.10 32,000 Total 155 117 75.48 100
Table 16 shows that Al-Rai Al-Aam was the source of the highest number of both male
and female respondents at 30 and nine respectively. Kuwait Times provided the lowest number of
male respondents with four, while Arab Times provided the lowest number of female
respondents with one respondent.
In terms of percentages, the highest male response came from Al-Qabas at 88.2 percent
out of its total responding population, while the highest female response came from Al-Anbaa at
54.5 percent. The lowest male response came from Al-Anbaa’s total responding population, with
45.5 percent being male while the lowest female response came from Al-Qabas, with only 11.8
percent of its responding population being female. Table 16 provides more information.
Table 16 Population gender according to newspaper
Female Male Source Count % Count %
Al-Rai Al-Aam 9 23.1 30 76.9 Al-Seyassah 5 21.7 18 78.3 Al-Qabas 2 11.8 15 88.2 Al-Watan 8 53.3 7 46.7 Al-Anbaa 6 54.5 5 45.5 Kuwait Times 2 33.3 4 66.7 Arab Times 1 16.7 5 83.3 Total 33 28.2 84 71.8
72
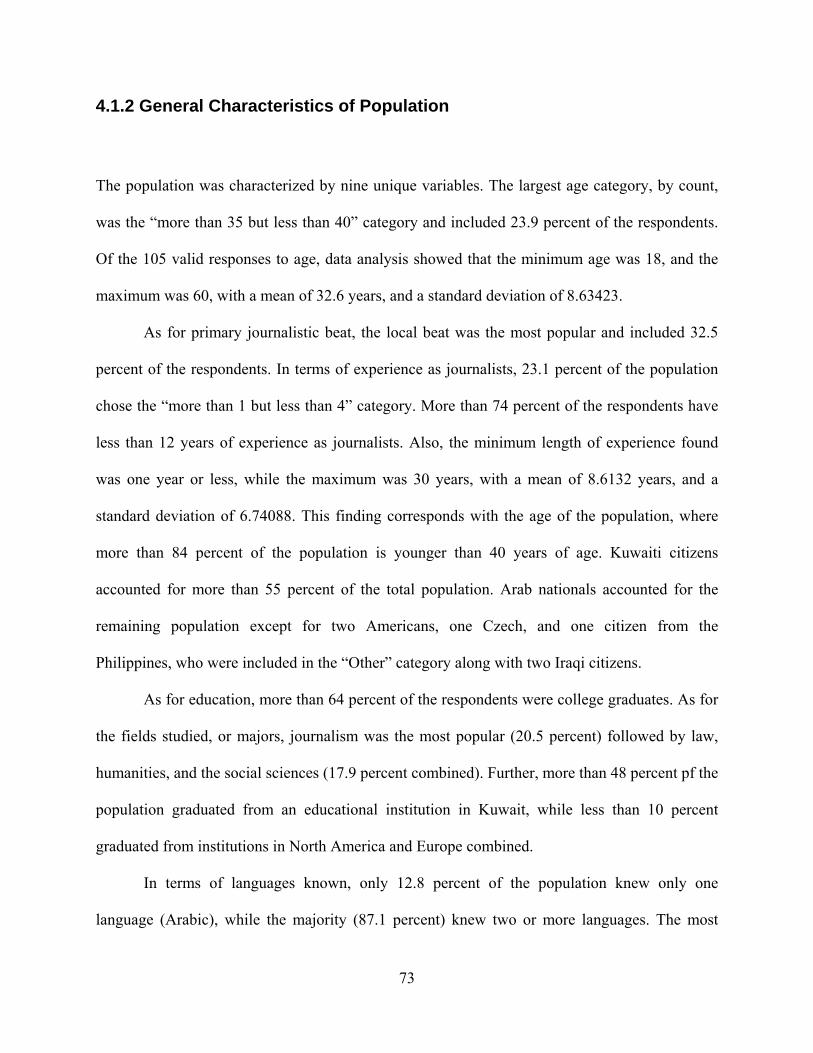
4.1.2 General Characteristics of Population
The population was characterized by nine unique variables. The largest age category, by count,
was the “more than 35 but less than 40” category and included 23.9 percent of the respondents.
Of the 105 valid responses to age, data analysis showed that the minimum age was 18, and the
maximum was 60, with a mean of 32.6 years, and a standard deviation of 8.63423.
As for primary journalistic beat, the local beat was the most popular and included 32.5
percent of the respondents. In terms of experience as journalists, 23.1 percent of the population
chose the “more than 1 but less than 4” category. More than 74 percent of the respondents have
less than 12 years of experience as journalists. Also, the minimum length of experience found
was one year or less, while the maximum was 30 years, with a mean of 8.6132 years, and a
standard deviation of 6.74088. This finding corresponds with the age of the population, where
more than 84 percent of the population is younger than 40 years of age. Kuwaiti citizens
accounted for more than 55 percent of the total population. Arab nationals accounted for the
remaining population except for two Americans, one Czech, and one citizen from the
Philippines, who were included in the “Other” category along with two Iraqi citizens.
As for education, more than 64 percent of the respondents were college graduates. As for
the fields studied, or majors, journalism was the most popular (20.5 percent) followed by law,
humanities, and the social sciences (17.9 percent combined). Further, more than 48 percent pf the
population graduated from an educational institution in Kuwait, while less than 10 percent
graduated from institutions in North America and Europe combined.
In terms of languages known, only 12.8 percent of the population knew only one
language (Arabic), while the majority (87.1 percent) knew two or more languages. The most
73

frequently listed languages were Arabic and English, with French, Czech, Persian, Urdu,
Tagalog, German, and Spanish, also being mentioned. Also, respondents were asked to volunteer
for a follow-up interview by E-mail. Of the 117 respondents, 58.1 percent provided their E-
mails.
Further, respondents were asked to provide information about their experience in using
the Internet. Data analysis showed that the minimum experience was one year or less, while the
maximum was 13 years. The mean length of experience in using the Internet for the population
was 6.1875 years, with a standard deviation of 3.01335. Table 17 provides more information
about the population’s characteristics.
Overall, a majority of journalists in Kuwait held Bachelor's degrees. However, less than
11 percent held Master's degrees or higher. This could be attributed to the average salaries
offered in the journalism field compared to other fields (Al-Rasheed, 1998). Graduate degree
holders were more likely to attain higher salaries outside of the journalism sector, a factor that
could be used to partially explain the low number of journalists holding graduate degrees, and
the high number of journalists that have educational backgrounds originating in other fields such
as economics, political science, and literature.
74
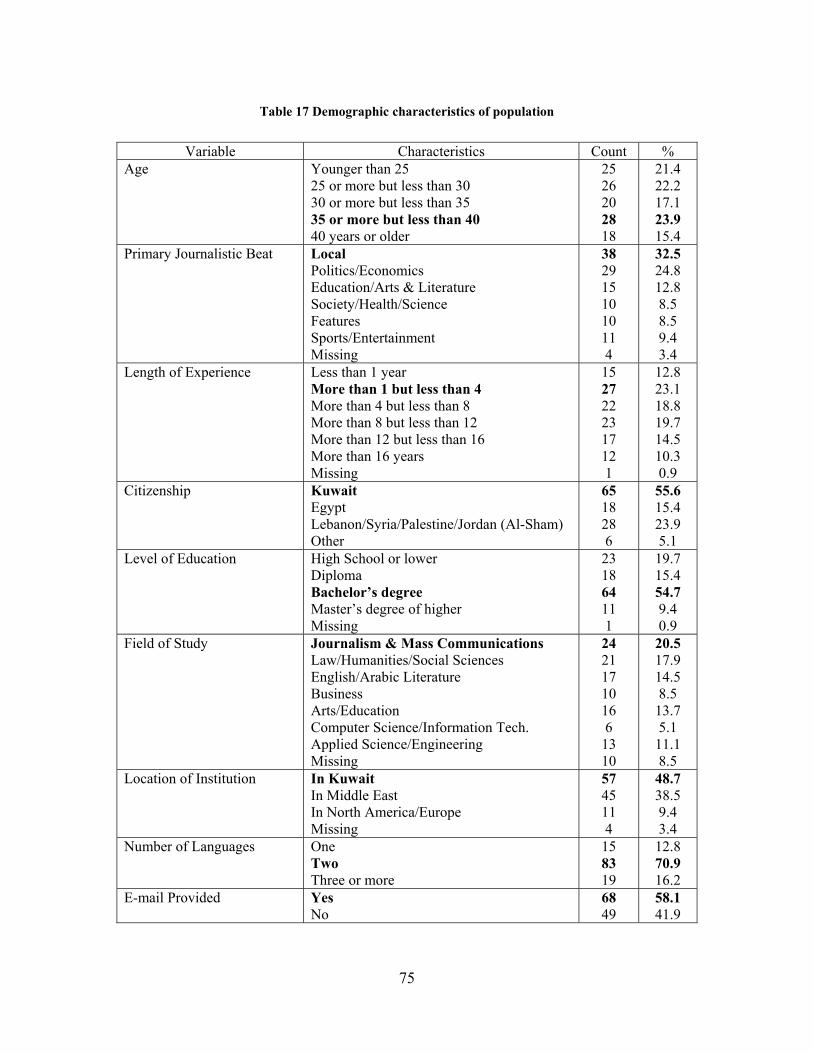
Table 17 Demographic characteristics of population
Variable Characteristics Count % Age Younger than 25
25 or more but less than 30 30 or more but less than 35 35 or more but less than 40 40 years or older
25 26 20 28 18
21.4 22.2 17.1 23.9 15.4
Primary Journalistic Beat Local Politics/Economics Education/Arts & Literature Society/Health/Science Features Sports/Entertainment Missing
38 29 15 10 10 11 4
32.5 24.8 12.8 8.5 8.5 9.4 3.4
Length of Experience Less than 1 year More than 1 but less than 4 More than 4 but less than 8 More than 8 but less than 12 More than 12 but less than 16 More than 16 years Missing
15 27 22 23 17 12 1
12.8 23.1 18.8 19.7 14.5 10.3 0.9
Citizenship Kuwait Egypt Lebanon/Syria/Palestine/Jordan (Al-Sham) Other
65 18 28 6
55.6 15.4 23.9 5.1
Level of Education High School or lower Diploma Bachelor’s degree Master’s degree of higher Missing
23 18 64 11 1
19.7 15.4 54.7 9.4 0.9
Field of Study Journalism & Mass Communications Law/Humanities/Social Sciences English/Arabic Literature Business Arts/Education Computer Science/Information Tech. Applied Science/Engineering Missing
24 21 17 10 16 6
13 10
20.5 17.9 14.5 8.5
13.7 5.1
11.1 8.5
Location of Institution In Kuwait In Middle East In North America/Europe Missing
57 45 11 4
48.7 38.5 9.4 3.4
Number of Languages One Two Three or more
15 83 19
12.8 70.9 16.2
E-mail Provided Yes No
68 49
58.1 41.9
75

4.1.3 Characteristics of Female Population
The demographic information of the population was analyzed by gender to provide accurate and
detailed information. Table 18 reflects the demographic characteristics of the females who
participated in this study. More than half (54.5 percent) of the female participants were younger
than 25 years of age, and were mainly covering local news (34.4 percent). More than one third of
females had less than one year of experience as a journalist, and were mostly Kuwaiti citizens
(48.5 percent). The majority of females (63.7 percent) were college graduates who attended
educational institutions located mostly in Kuwait and the Middle East (87.9 percent). Journalism
and Mass Communications was the favored major for 30 percent of the females, who were
mostly fluent in two languages (66.7 percent). Finally, 63.6 percent of the females provided their
E-mails for the follow-up interviews by E-mail.
76
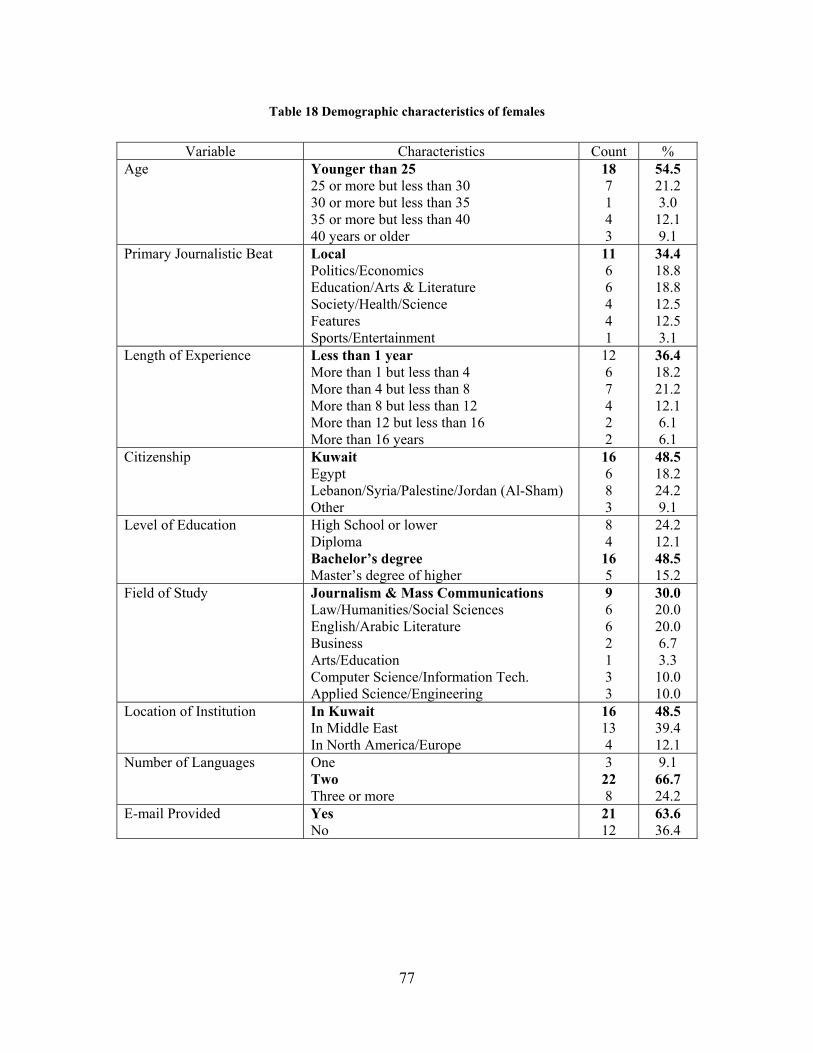
Table 18 Demographic characteristics of females
Variable Characteristics Count % Age Younger than 25
25 or more but less than 30 30 or more but less than 35 35 or more but less than 40 40 years or older
18 7 1 4 3
54.5 21.2 3.0
12.1 9.1
Primary Journalistic Beat Local Politics/Economics Education/Arts & Literature Society/Health/Science Features Sports/Entertainment
11 6 6 4 4 1
34.4 18.8 18.8 12.5 12.5 3.1
Length of Experience Less than 1 year More than 1 but less than 4 More than 4 but less than 8 More than 8 but less than 12 More than 12 but less than 16 More than 16 years
12 6 7 4 2 2
36.4 18.2 21.2 12.1 6.1 6.1
Citizenship Kuwait Egypt Lebanon/Syria/Palestine/Jordan (Al-Sham) Other
16 6 8 3
48.5 18.2 24.2 9.1
Level of Education High School or lower Diploma Bachelor’s degree Master’s degree of higher
8 4
16 5
24.2 12.1 48.5 15.2
Field of Study Journalism & Mass Communications Law/Humanities/Social Sciences English/Arabic Literature Business Arts/Education Computer Science/Information Tech. Applied Science/Engineering
9 6 6 2 1 3 3
30.0 20.0 20.0 6.7 3.3
10.0 10.0
Location of Institution In Kuwait In Middle East In North America/Europe
16 13 4
48.5 39.4 12.1
Number of Languages One Two Three or more
3 22 8
9.1 66.7 24.2
E-mail Provided Yes No
21 12
63.6 36.4
77
4.1.4 Characteristics of Male Population
Males differed from females in age, as the “more than 35 but less than 40” category counted 24
cases and was largest (28.6 percent). For males, the local beat was the most frequently listed as
the primary journalistic beat, with 33.3 percent of respondents. Nearly 28 percent of male
respondents had less than four years of experience as journalists. The most frequently provided
citizenship by males was also Kuwaiti (58.3 percent), with the majority of respondents being
Arab citizens (96.4 percent). In terms of education, males were similar to females as more than
64 percent of them held college degrees from institutions in Kuwait (51.3 percent) or the Middle
East (40 percent). Only 8.8 percent of male respondents went to educational institutions in North
America or Europe. More than 58 percent of males majored in journalism and mass
communications, law, humanities, social sciences, arts, and education. As for languages known,
a majority of male respondents were fluent in at least two languages (85.7 percent). More than
half of the male respondents (56 percent) provided their E-mails for the follow-up interviews by
E-mail. Table 19 presents more information about the demographic characteristics of the male
respondents.
78
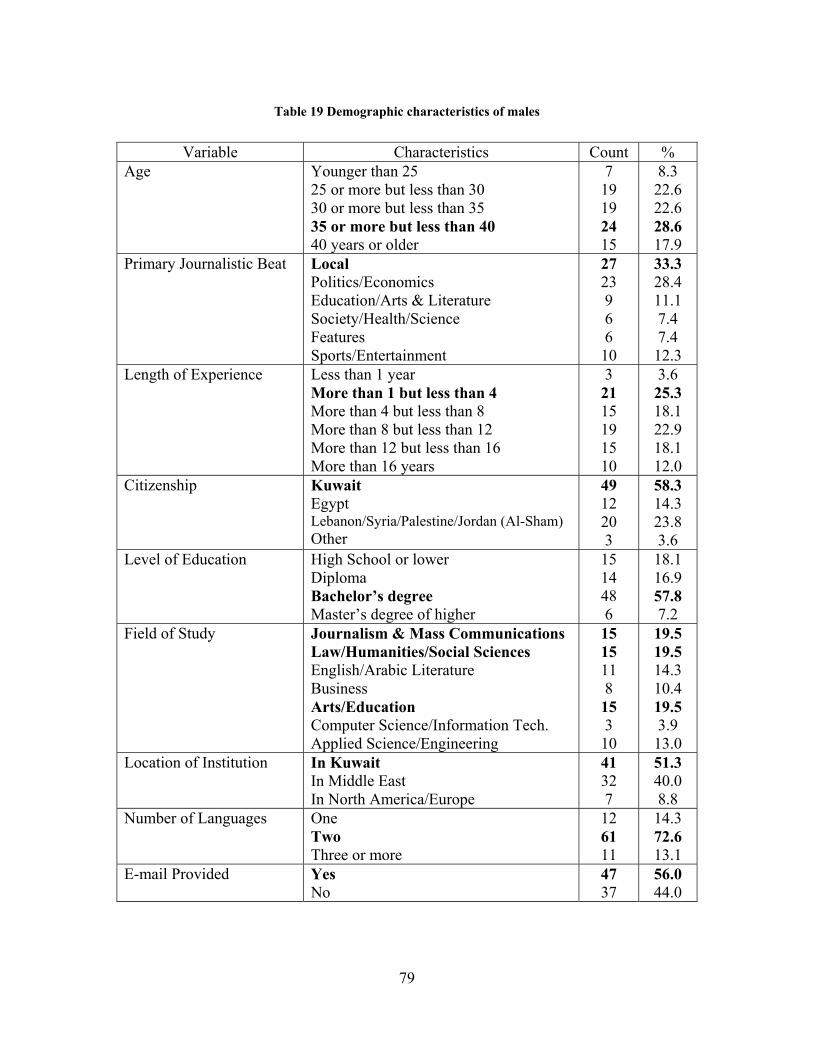
Table 19 Demographic characteristics of males
Variable Characteristics Count % Age Younger than 25
25 or more but less than 30 30 or more but less than 35 35 or more but less than 40 40 years or older
7 19 19 24 15
8.3 22.6 22.6 28.6 17.9
Primary Journalistic Beat Local Politics/Economics Education/Arts & Literature Society/Health/Science Features Sports/Entertainment
27 23 9 6 6 10
33.3 28.4 11.1 7.4 7.4 12.3
Length of Experience Less than 1 year More than 1 but less than 4 More than 4 but less than 8 More than 8 but less than 12 More than 12 but less than 16 More than 16 years
3 21 15 19 15 10
3.6 25.3 18.1 22.9 18.1 12.0
Citizenship Kuwait Egypt Lebanon/Syria/Palestine/Jordan (Al-Sham) Other
49 12 20 3
58.3 14.3 23.8 3.6
Level of Education High School or lower Diploma Bachelor’s degree Master’s degree of higher
15 14 48 6
18.1 16.9 57.8 7.2
Field of Study Journalism & Mass Communications Law/Humanities/Social Sciences English/Arabic Literature Business Arts/Education Computer Science/Information Tech. Applied Science/Engineering
15 15 11 8 15 3 10
19.5 19.5 14.3 10.4 19.5 3.9 13.0
Location of Institution In Kuwait In Middle East In North America/Europe
41 32 7
51.3 40.0 8.8
Number of Languages One Two Three or more
12 61 11
14.3 72.6 13.1
E-mail Provided Yes No
47 37
56.0 44.0
79
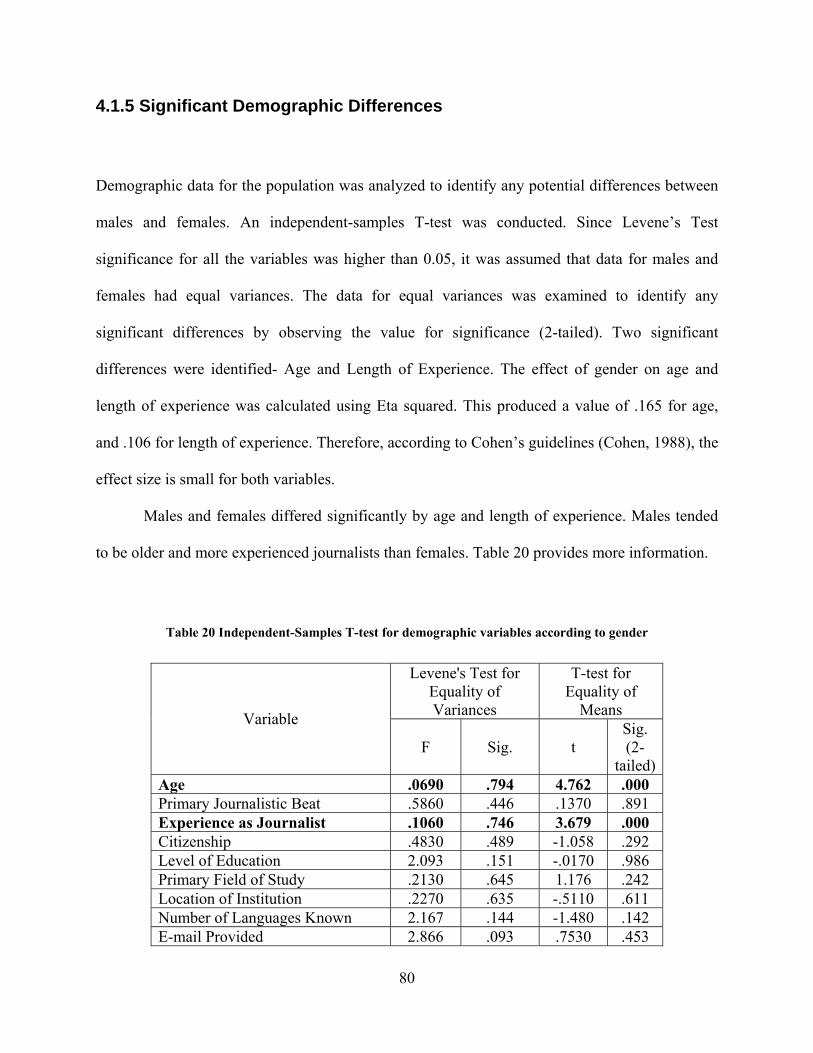
4.1.5 Significant Demographic Differences
Demographic data for the population was analyzed to identify any potential differences between
males and females. An independent-samples T-test was conducted. Since Levene’s Test
significance for all the variables was higher than 0.05, it was assumed that data for males and
females had equal variances. The data for equal variances was examined to identify any
significant differences by observing the value for significance (2-tailed). Two significant
differences were identified- Age and Length of Experience. The effect of gender on age and
length of experience was calculated using Eta squared. This produced a value of .165 for age,
and .106 for length of experience. Therefore, according to Cohen’s guidelines (Cohen, 1988), the
effect size is small for both variables.
Males and females differed significantly by age and length of experience. Males tended
to be older and more experienced journalists than females. Table 20 provides more information.
Table 20 Independent-Samples T-test for demographic variables according to gender
Levene's Test for Equality of Variances
T-test for Equality of
Means Variable
F Sig. t Sig. (2-
tailed)Age .0690 .794 4.762 .000 Primary Journalistic Beat .5860 .446 .1370 .891 Experience as Journalist .1060 .746 3.679 .000 Citizenship .4830 .489 -1.058 .292 Level of Education 2.093 .151 -.0170 .986 Primary Field of Study .2130 .645 1.176 .242 Location of Institution .2270 .635 -.5110 .611 Number of Languages Known 2.167 .144 -1.480 .142 E-mail Provided 2.866 .093 .7530 .453
80

In terms of other descriptive statistics, females were younger than males, with nearly
eight years of difference in mean. Also, females were more experienced in using the Internet
than males. As for length of experience as a journalist, males were nearly twice as experienced as
females. Table 21 provides more information.
Table 21 Quantitative statistics comparing males and females
Variable Gender N Mean Std. Dev.
Age FemaleMale
30 75
26.96 34.85
8.656 7.576
Length of experience as journalist FemaleMale
31 75
5.258 10.00
6.276 6.468
Length of experience using Internet FemaleMale
29 67
6.344 6.119
2.318 3.282
81
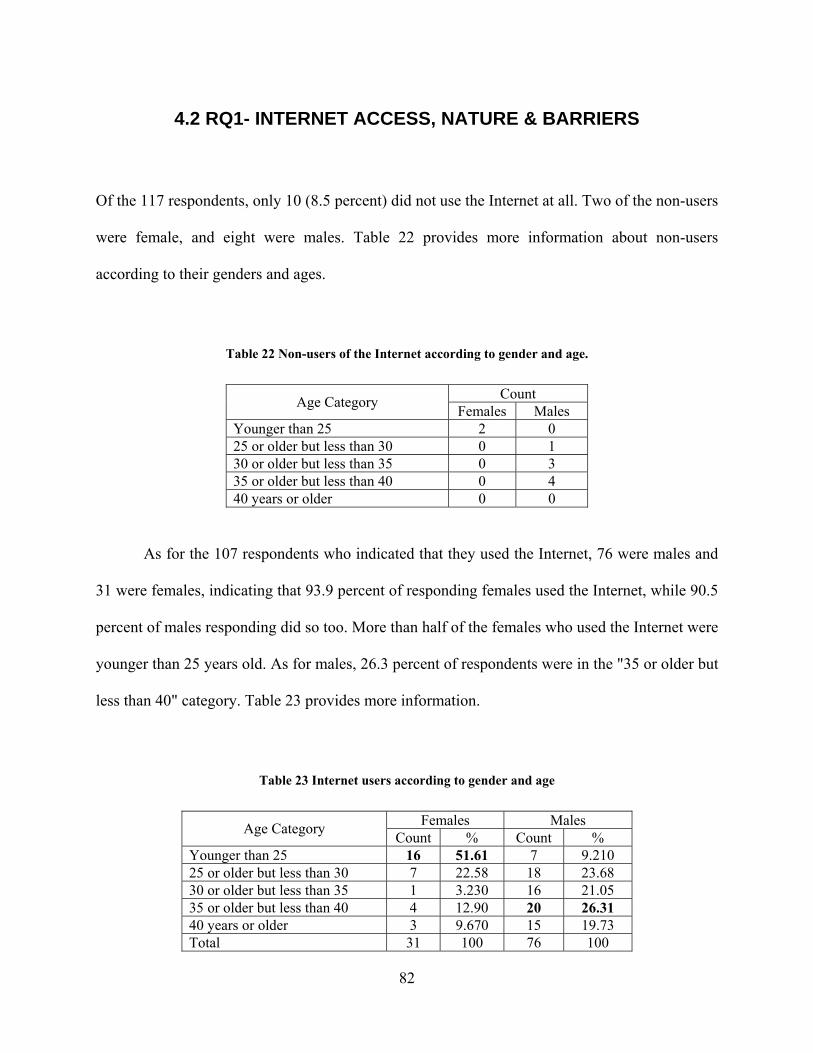
4.2 RQ1- INTERNET ACCESS, NATURE & BARRIERS
Of the 117 respondents, only 10 (8.5 percent) did not use the Internet at all. Two of the non-users
were female, and eight were males. Table 22 provides more information about non-users
according to their genders and ages.
Table 22 Non-users of the Internet according to gender and age.
Count Age Category Females Males Younger than 25 2 0 25 or older but less than 30 0 1 30 or older but less than 35 0 3 35 or older but less than 40 0 4 40 years or older 0 0
As for the 107 respondents who indicated that they used the Internet, 76 were males and
31 were females, indicating that 93.9 percent of responding females used the Internet, while 90.5
percent of males responding did so too. More than half of the females who used the Internet were
younger than 25 years old. As for males, 26.3 percent of respondents were in the "35 or older but
less than 40" category. Table 23 provides more information.
Table 23 Internet users according to gender and age
Females Males Age Category Count % Count % Younger than 25 16 51.61 7 9.210 25 or older but less than 30 7 22.58 18 23.68 30 or older but less than 35 1 3.230 16 21.05 35 or older but less than 40 4 12.90 20 26.31 40 years or older 3 9.670 15 19.73 Total 31 100 76 100
82
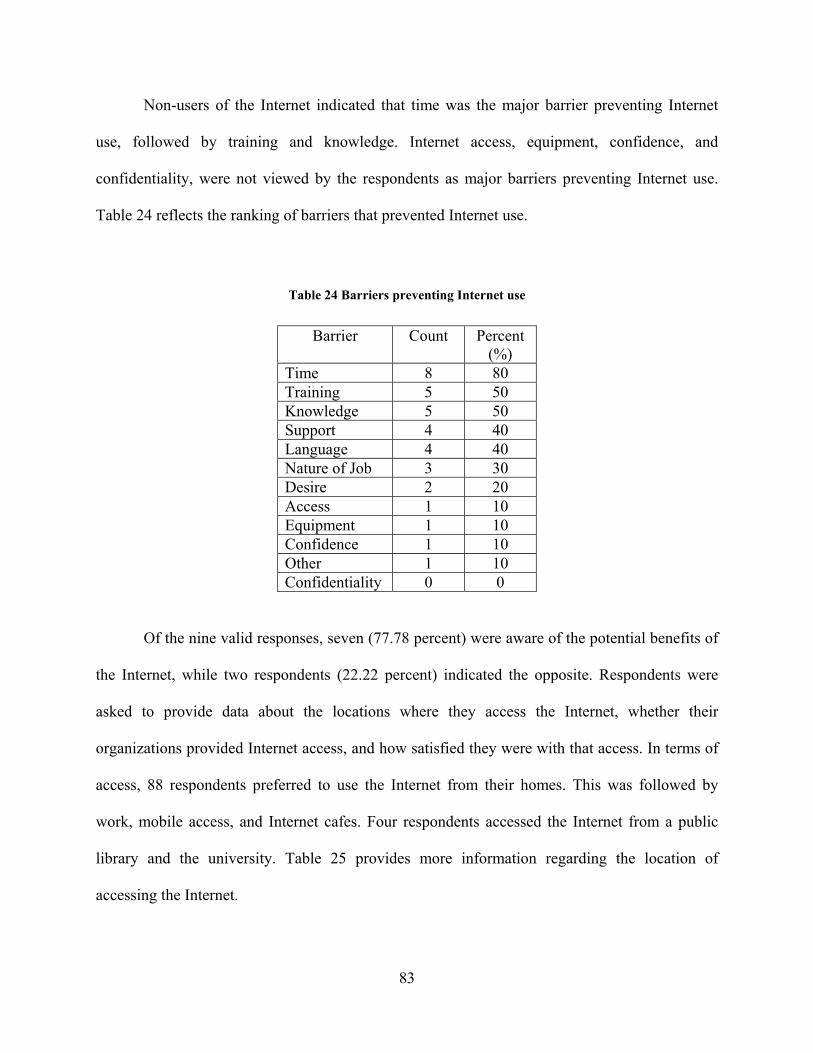
Non-users of the Internet indicated that time was the major barrier preventing Internet
use, followed by training and knowledge. Internet access, equipment, confidence, and
confidentiality, were not viewed by the respondents as major barriers preventing Internet use.
Table 24 reflects the ranking of barriers that prevented Internet use.
Table 24 Barriers preventing Internet use
Barrier Count Percent (%)
Time 8 80 Training 5 50 Knowledge 5 50 Support 4 40 Language 4 40 Nature of Job 3 30 Desire 2 20 Access 1 10 Equipment 1 10 Confidence 1 10 Other 1 10 Confidentiality 0 0
Of the nine valid responses, seven (77.78 percent) were aware of the potential benefits of
the Internet, while two respondents (22.22 percent) indicated the opposite. Respondents were
asked to provide data about the locations where they access the Internet, whether their
organizations provided Internet access, and how satisfied they were with that access. In terms of
access, 88 respondents preferred to use the Internet from their homes. This was followed by
work, mobile access, and Internet cafes. Four respondents accessed the Internet from a public
library and the university. Table 25 provides more information regarding the location of
accessing the Internet.
83
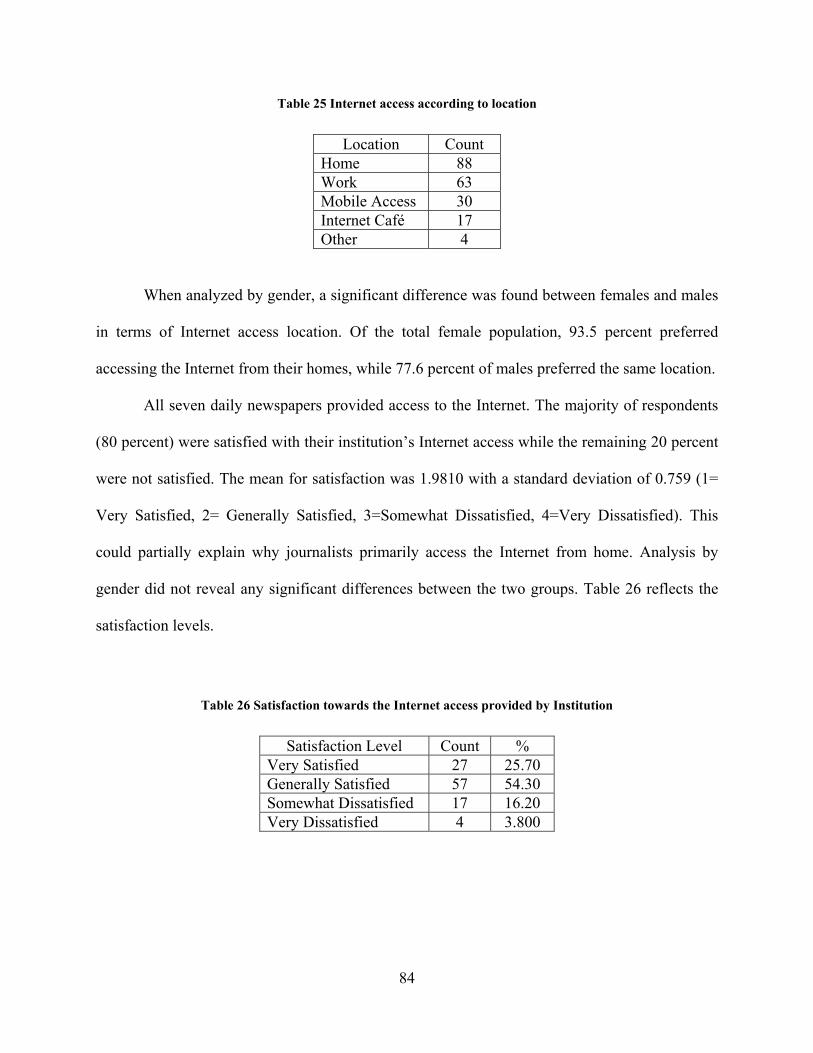
Table 25 Internet access according to location
Location Count Home 88 Work 63 Mobile Access 30 Internet Café 17 Other 4
When analyzed by gender, a significant difference was found between females and males
in terms of Internet access location. Of the total female population, 93.5 percent preferred
accessing the Internet from their homes, while 77.6 percent of males preferred the same location.
All seven daily newspapers provided access to the Internet. The majority of respondents
(80 percent) were satisfied with their institution’s Internet access while the remaining 20 percent
were not satisfied. The mean for satisfaction was 1.9810 with a standard deviation of 0.759 (1=
Very Satisfied, 2= Generally Satisfied, 3=Somewhat Dissatisfied, 4=Very Dissatisfied). This
could partially explain why journalists primarily access the Internet from home. Analysis by
gender did not reveal any significant differences between the two groups. Table 26 reflects the
satisfaction levels.
Table 26 Satisfaction towards the Internet access provided by Institution
Satisfaction Level Count % Very Satisfied 27 25.70 Generally Satisfied 57 54.30 Somewhat Dissatisfied 17 16.20 Very Dissatisfied 4 3.800
84
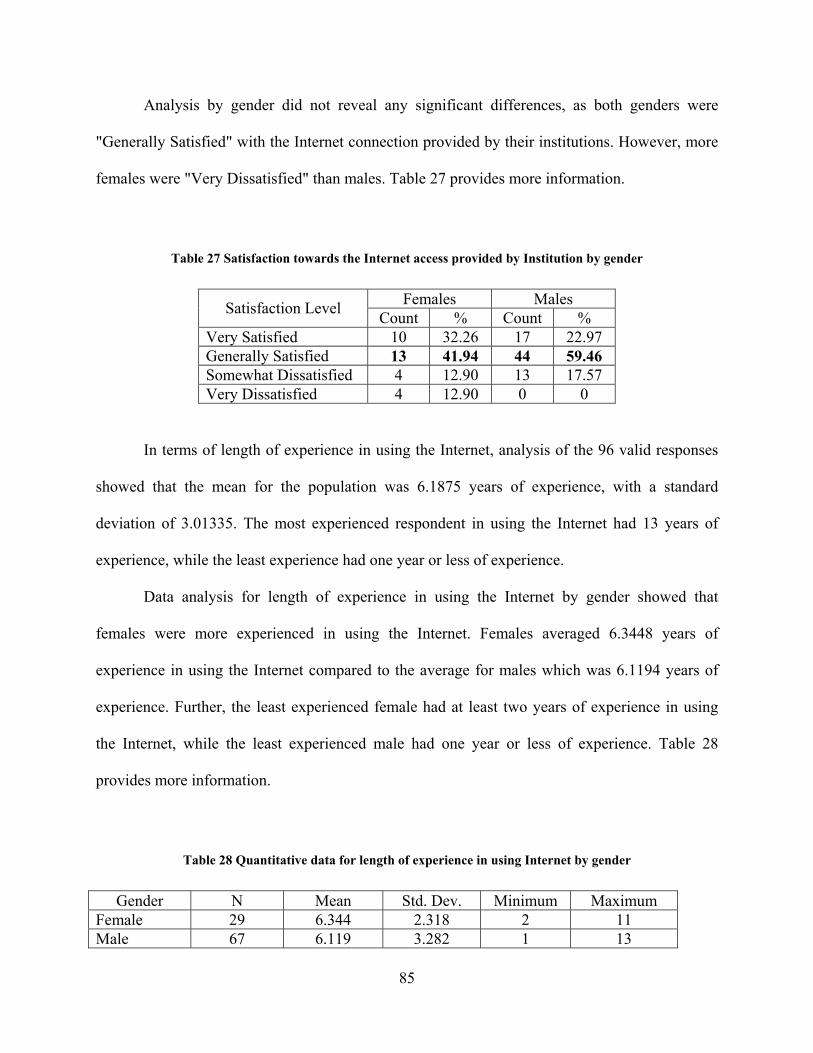
Analysis by gender did not reveal any significant differences, as both genders were
"Generally Satisfied" with the Internet connection provided by their institutions. However, more
females were "Very Dissatisfied" than males. Table 27 provides more information.
Table 27 Satisfaction towards the Internet access provided by Institution by gender
Females Males Satisfaction Level Count % Count % Very Satisfied 10 32.26 17 22.97 Generally Satisfied 13 41.94 44 59.46 Somewhat Dissatisfied 4 12.90 13 17.57 Very Dissatisfied 4 12.90 0 0
In terms of length of experience in using the Internet, analysis of the 96 valid responses
showed that the mean for the population was 6.1875 years of experience, with a standard
deviation of 3.01335. The most experienced respondent in using the Internet had 13 years of
experience, while the least experience had one year or less of experience.
Data analysis for length of experience in using the Internet by gender showed that
females were more experienced in using the Internet. Females averaged 6.3448 years of
experience in using the Internet compared to the average for males which was 6.1194 years of
experience. Further, the least experienced female had at least two years of experience in using
the Internet, while the least experienced male had one year or less of experience. Table 28
provides more information.
Table 28 Quantitative data for length of experience in using Internet by gender
Gender N Mean Std. Dev. Minimum Maximum Female 29 6.344 2.318 2 11 Male 67 6.119 3.282 1 13
85
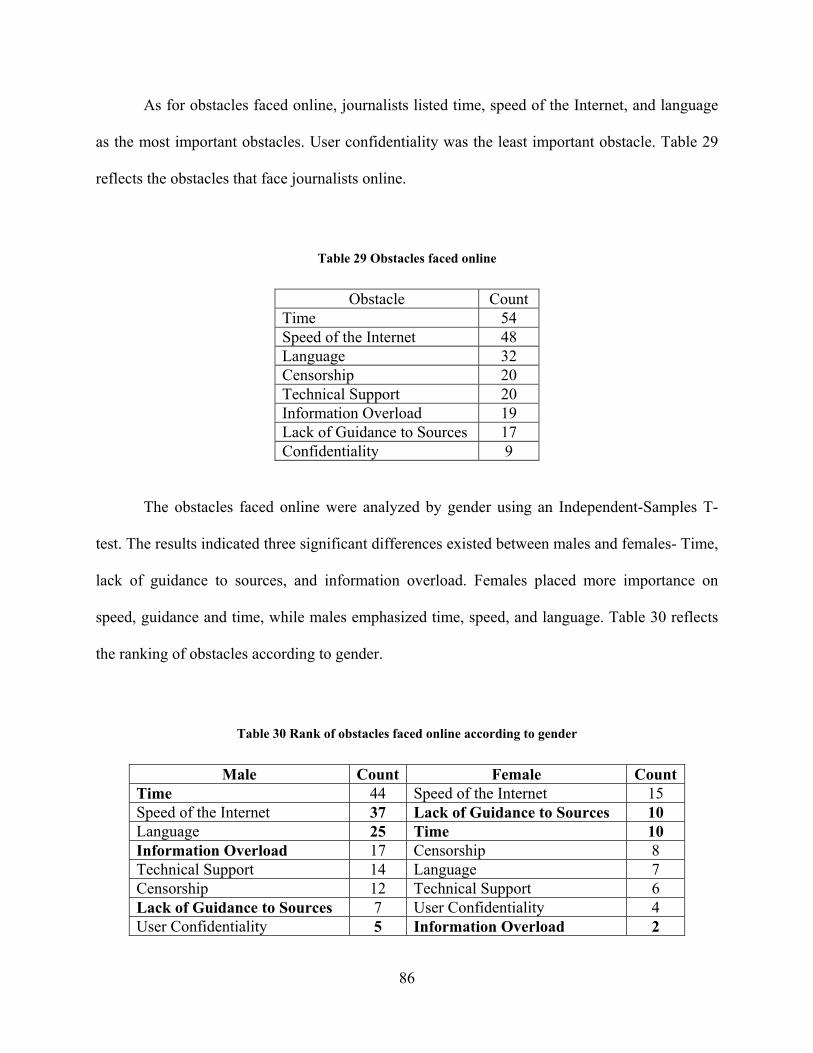
As for obstacles faced online, journalists listed time, speed of the Internet, and language
as the most important obstacles. User confidentiality was the least important obstacle. Table 29
reflects the obstacles that face journalists online.
Table 29 Obstacles faced online
Obstacle Count Time 54 Speed of the Internet 48 Language 32 Censorship 20 Technical Support 20 Information Overload 19 Lack of Guidance to Sources 17 Confidentiality 9
The obstacles faced online were analyzed by gender using an Independent-Samples T-
test. The results indicated three significant differences existed between males and females- Time,
lack of guidance to sources, and information overload. Females placed more importance on
speed, guidance and time, while males emphasized time, speed, and language. Table 30 reflects
the ranking of obstacles according to gender.
Table 30 Rank of obstacles faced online according to gender
Male Count Female CountTime 44 Speed of the Internet 15 Speed of the Internet 37 Lack of Guidance to Sources 10 Language 25 Time 10 Information Overload 17 Censorship 8 Technical Support 14 Language 7 Censorship 12 Technical Support 6 Lack of Guidance to Sources 7 User Confidentiality 4 User Confidentiality 5 Information Overload 2
86
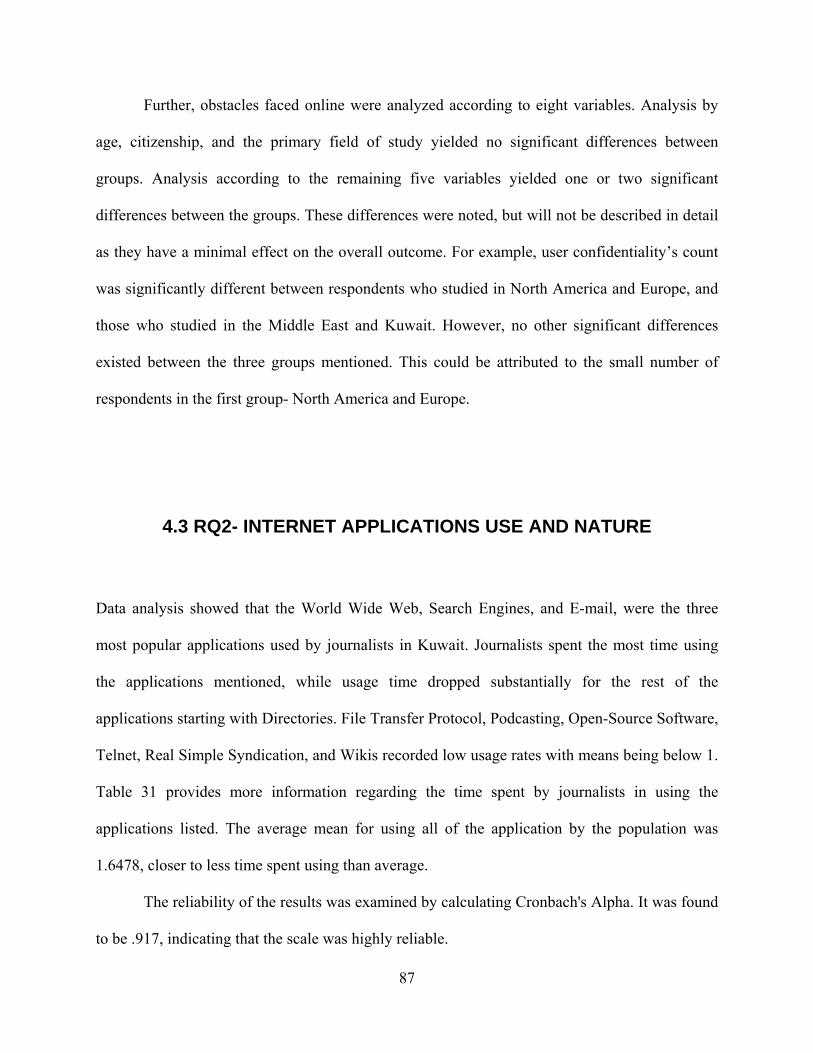
Further, obstacles faced online were analyzed according to eight variables. Analysis by
age, citizenship, and the primary field of study yielded no significant differences between
groups. Analysis according to the remaining five variables yielded one or two significant
differences between the groups. These differences were noted, but will not be described in detail
as they have a minimal effect on the overall outcome. For example, user confidentiality’s count
was significantly different between respondents who studied in North America and Europe, and
those who studied in the Middle East and Kuwait. However, no other significant differences
existed between the three groups mentioned. This could be attributed to the small number of
respondents in the first group- North America and Europe.
4.3 RQ2- INTERNET APPLICATIONS USE AND NATURE
Data analysis showed that the World Wide Web, Search Engines, and E-mail, were the three
most popular applications used by journalists in Kuwait. Journalists spent the most time using
the applications mentioned, while usage time dropped substantially for the rest of the
applications starting with Directories. File Transfer Protocol, Podcasting, Open-Source Software,
Telnet, Real Simple Syndication, and Wikis recorded low usage rates with means being below 1.
Table 31 provides more information regarding the time spent by journalists in using the
applications listed. The average mean for using all of the application by the population was
1.6478, closer to less time spent using than average.
The reliability of the results was examined by calculating Cronbach's Alpha. It was found
to be .917, indicating that the scale was highly reliable.
87
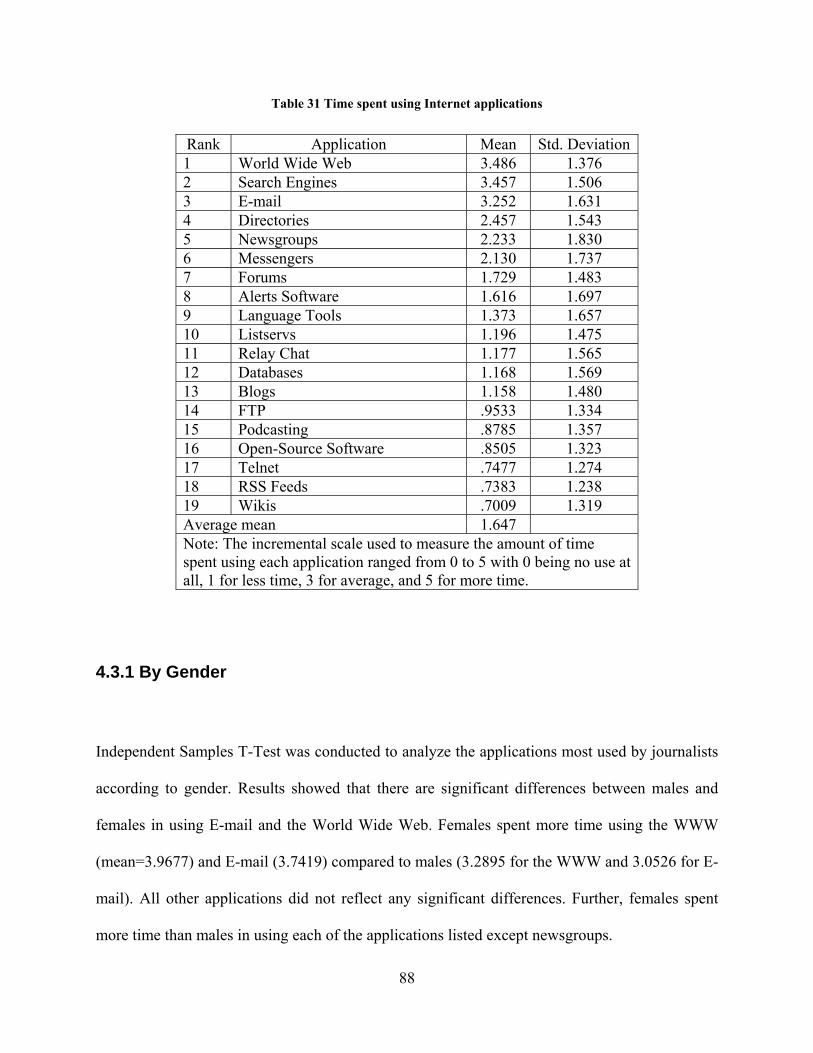
Table 31 Time spent using Internet applications
Rank Application Mean Std. Deviation 1 World Wide Web 3.486 1.376 2 Search Engines 3.457 1.506 3 E-mail 3.252 1.631 4 Directories 2.457 1.543 5 Newsgroups 2.233 1.830 6 Messengers 2.130 1.737 7 Forums 1.729 1.483 8 Alerts Software 1.616 1.697 9 Language Tools 1.373 1.657 10 Listservs 1.196 1.475 11 Relay Chat 1.177 1.565 12 Databases 1.168 1.569 13 Blogs 1.158 1.480 14 FTP .9533 1.334 15 Podcasting .8785 1.357 16 Open-Source Software .8505 1.323 17 Telnet .7477 1.274 18 RSS Feeds .7383 1.238 19 Wikis .7009 1.319 Average mean 1.647 Note: The incremental scale used to measure the amount of time spent using each application ranged from 0 to 5 with 0 being no use at all, 1 for less time, 3 for average, and 5 for more time.
4.3.1 By Gender
Independent Samples T-Test was conducted to analyze the applications most used by journalists
according to gender. Results showed that there are significant differences between males and
females in using E-mail and the World Wide Web. Females spent more time using the WWW
(mean=3.9677) and E-mail (3.7419) compared to males (3.2895 for the WWW and 3.0526 for E-
mail). All other applications did not reflect any significant differences. Further, females spent
more time than males in using each of the applications listed except newsgroups.
88

Table 32 provides more detailed information about the amount of time spent using each
application by gender, with application recording significant differences in means in bold. The
data shows that females spent more time than males in using 17 out of the 19 applications listed,
with the WWW being the most used application by both genders. By average mean for all the
applications, females (avg. mean=1.8879) spent more time than males (avg. mean=1.5499) in
using all of the 19 applications listed. However, the mean for both males and females were low,
indicating a need for improvement.
89
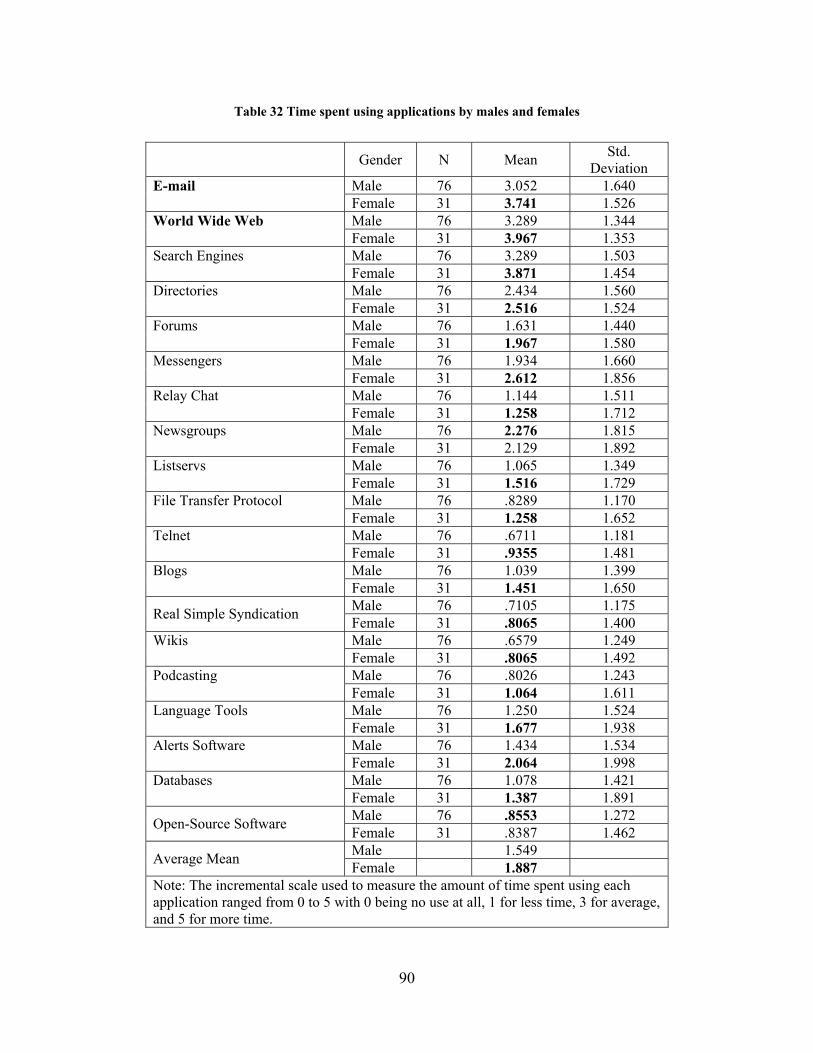
Table 32 Time spent using applications by males and females
Gender N Mean Std. Deviation
Male 76 3.052 1.640 E-mail Female 31 3.741 1.526
Male 76 3.289 1.344 World Wide Web Female 31 3.967 1.353
Male 76 3.289 1.503 Search Engines Female 31 3.871 1.454
Male 76 2.434 1.560 Directories Female 31 2.516 1.524
Male 76 1.631 1.440 Forums Female 31 1.967 1.580
Male 76 1.934 1.660 Messengers Female 31 2.612 1.856
Male 76 1.144 1.511 Relay Chat Female 31 1.258 1.712
Male 76 2.276 1.815 Newsgroups Female 31 2.129 1.892
Male 76 1.065 1.349 Listservs Female 31 1.516 1.729
Male 76 .8289 1.170 File Transfer Protocol Female 31 1.258 1.652
Male 76 .6711 1.181 Telnet Female 31 .9355 1.481
Male 76 1.039 1.399 Blogs Female 31 1.451 1.650
Male 76 .7105 1.175 Real Simple Syndication Female 31 .8065 1.400 Male 76 .6579 1.249 Wikis
Female 31 .8065 1.492 Male 76 .8026 1.243 Podcasting
Female 31 1.064 1.611 Male 76 1.250 1.524 Language Tools
Female 31 1.677 1.938 Male 76 1.434 1.534 Alerts Software
Female 31 2.064 1.998 Male 76 1.078 1.421 Databases
Female 31 1.387 1.891 Male 76 .8553 1.272 Open-Source Software Female 31 .8387 1.462 Male 1.549 Average Mean Female 1.887
Note: The incremental scale used to measure the amount of time spent using each application ranged from 0 to 5 with 0 being no use at all, 1 for less time, 3 for average, and 5 for more time.
90
4.3.2 By Age
Analysis by age revealed four significant differences at the 0.05 significance level in the amount
of time spent using E-mail, the WWW, Search Engines, and Messengers. A Tukey post-hoc test
revealed that in all four instances of significant differences, the difference was between the
youngest age group, younger than 25, and the oldest, 40 years or older. Table 33 sheds more
light on the significant differences between the youngest and oldest respondents. From table 33,
it is evident that younger journalists spent more time using E-mail, the WWW, Search Engines,
and Messengers, than their older counterparts. However, the data shows that the group that
journalist who were 35 or older but younger than 40 were the ones who spent most time using 12
out of the 19 applications listed. The youngest journalists, younger than 25 years, were the ones
who spent most time using six out of the 19 applications. Journalists who were 40 years or older
did not spent the most time using any of the applications in comparison to the other age groups.
Examining the average mean for all 19 applications showed that journalists who were 30
or older but younger than 35, spent the most time using applications. The oldest journalists, 40
years or older, spent the least time on average in using the applications listed.
91
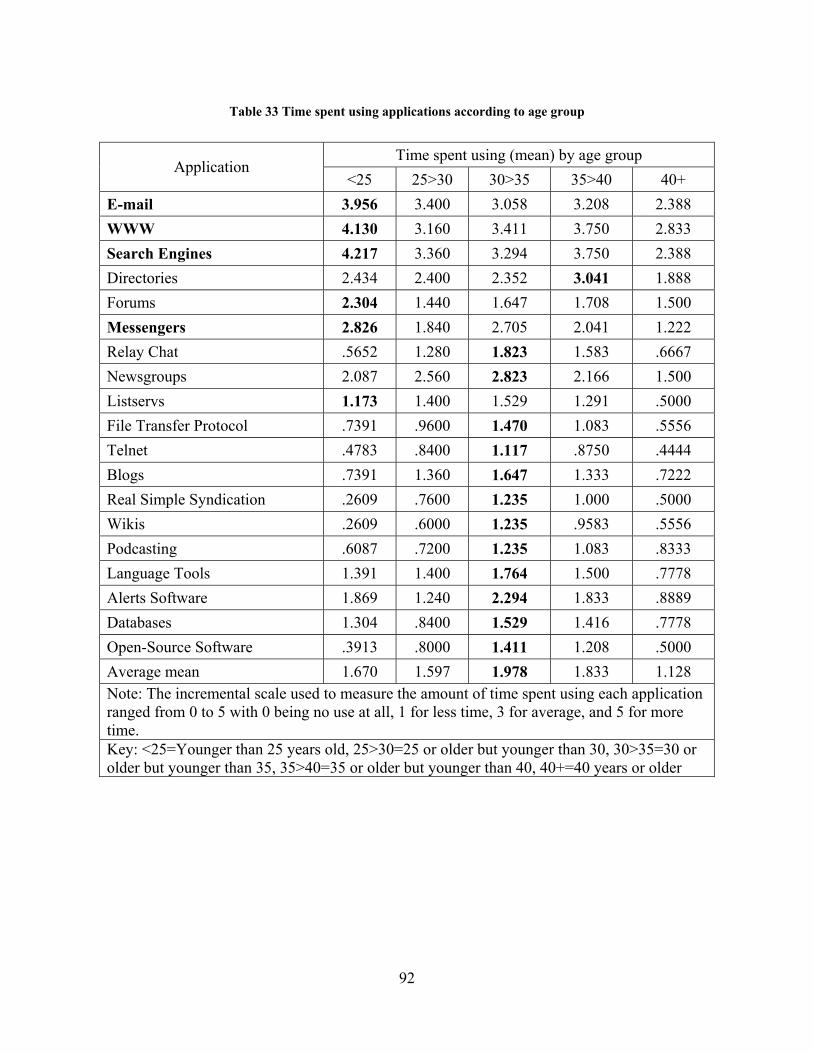
Table 33 Time spent using applications according to age group
Time spent using (mean) by age group Application
<25 25>30 30>35 35>40 40+ E-mail 3.956 3.400 3.058 3.208 2.388 WWW 4.130 3.160 3.411 3.750 2.833 Search Engines 4.217 3.360 3.294 3.750 2.388 Directories 2.434 2.400 2.352 3.041 1.888 Forums 2.304 1.440 1.647 1.708 1.500 Messengers 2.826 1.840 2.705 2.041 1.222 Relay Chat .5652 1.280 1.823 1.583 .6667 Newsgroups 2.087 2.560 2.823 2.166 1.500 Listservs 1.173 1.400 1.529 1.291 .5000 File Transfer Protocol .7391 .9600 1.470 1.083 .5556 Telnet .4783 .8400 1.117 .8750 .4444 Blogs .7391 1.360 1.647 1.333 .7222 Real Simple Syndication .2609 .7600 1.235 1.000 .5000 Wikis .2609 .6000 1.235 .9583 .5556 Podcasting .6087 .7200 1.235 1.083 .8333 Language Tools 1.391 1.400 1.764 1.500 .7778 Alerts Software 1.869 1.240 2.294 1.833 .8889 Databases 1.304 .8400 1.529 1.416 .7778 Open-Source Software .3913 .8000 1.411 1.208 .5000 Average mean 1.670 1.597 1.978 1.833 1.128 Note: The incremental scale used to measure the amount of time spent using each application ranged from 0 to 5 with 0 being no use at all, 1 for less time, 3 for average, and 5 for more time. Key: <25=Younger than 25 years old, 25>30=25 or older but younger than 30, 30>35=30 or older but younger than 35, 35>40=35 or older but younger than 40, 40+=40 years or older
92
4.3.3 By Journalistic Beat
Analysis according to Primary Journalistic Beat revealed eight significant differences in using
Telnet, Real Simple Syndication Feeds, Wikis, Podcasting, Language Tools, Alerts Software,
Databases, and Open-Source Software. The significant difference mainly involved respondents
who covered Society/Health/Science, and others. Table 34 displays the mean values for each
application according to primary journalistic beat. For Telnet, Society/Health/Science beats spent
significantly more time than Local and Politics/Economics beats. Despite that significant
difference, Society/Health/Science beats did not spent large amounts of time using Telnet. In the
case of RSS feeds, in addition to a difference between the Society/Health/Science beats and the
Local and Politics/Economics beats, there was a significant difference between
Sports/Entertainment and Politics/Economics.
For the rest of the applications, the significant differences occurred between
Society/Health/Science and the other beats (Table 34- significant differences in bold). Despite
these significant differences by primary journalistic beat, the findings could be a result of a low
number of cases for the Society/Health/Science beats (10 cases) in comparison to Local (38), and
Politics/Economics (29). Table 34 provides more information on the applications that recorded
significant differences in means between the groups.
93
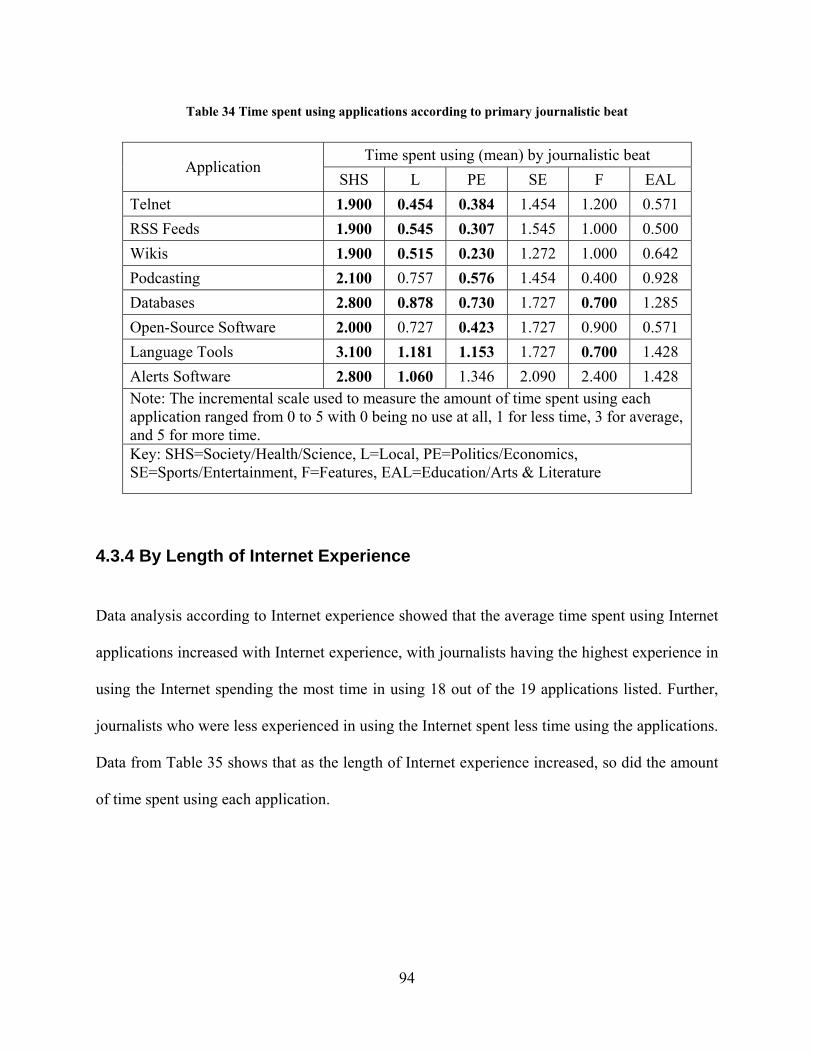
Table 34 Time spent using applications according to primary journalistic beat
Time spent using (mean) by journalistic beat Application
SHS L PE SE F EAL Telnet 1.900 0.454 0.384 1.454 1.200 0.571 RSS Feeds 1.900 0.545 0.307 1.545 1.000 0.500 Wikis 1.900 0.515 0.230 1.272 1.000 0.642 Podcasting 2.100 0.757 0.576 1.454 0.400 0.928 Databases 2.800 0.878 0.730 1.727 0.700 1.285 Open-Source Software 2.000 0.727 0.423 1.727 0.900 0.571 Language Tools 3.100 1.181 1.153 1.727 0.700 1.428 Alerts Software 2.800 1.060 1.346 2.090 2.400 1.428 Note: The incremental scale used to measure the amount of time spent using each application ranged from 0 to 5 with 0 being no use at all, 1 for less time, 3 for average, and 5 for more time. Key: SHS=Society/Health/Science, L=Local, PE=Politics/Economics, SE=Sports/Entertainment, F=Features, EAL=Education/Arts & Literature
4.3.4 By Length of Internet Experience
Data analysis according to Internet experience showed that the average time spent using Internet
applications increased with Internet experience, with journalists having the highest experience in
using the Internet spending the most time in using 18 out of the 19 applications listed. Further,
journalists who were less experienced in using the Internet spent less time using the applications.
Data from Table 35 shows that as the length of Internet experience increased, so did the amount
of time spent using each application.
94
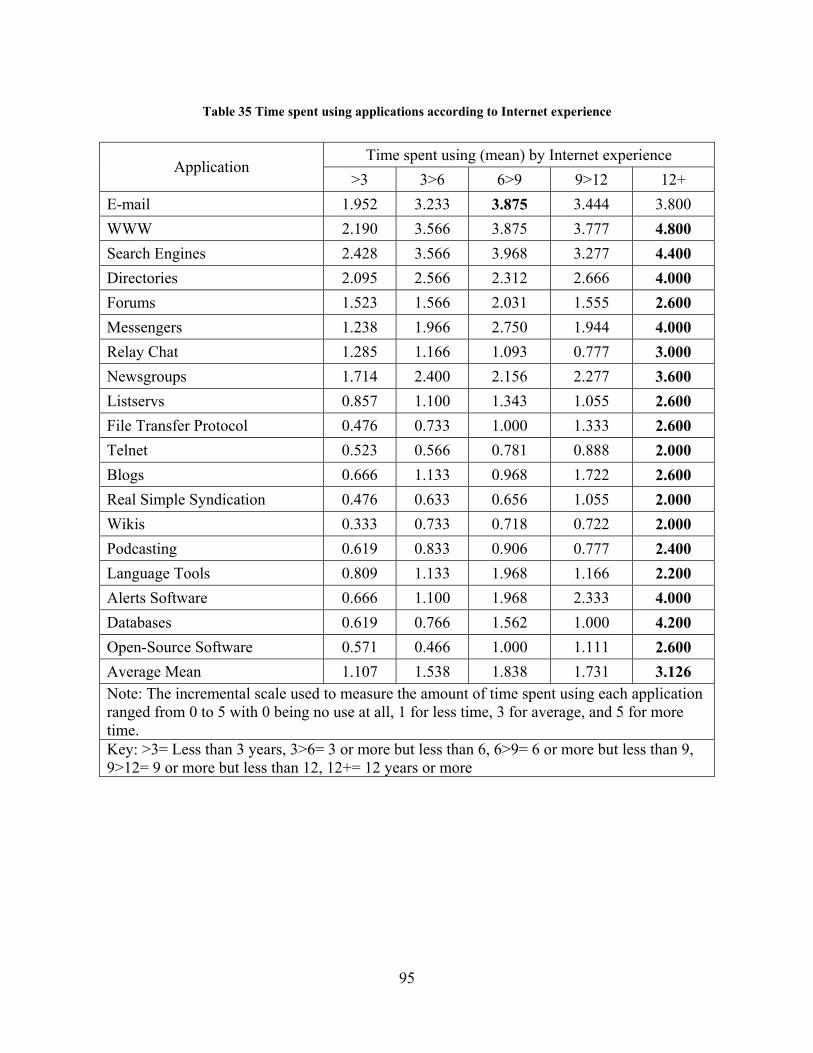
Table 35 Time spent using applications according to Internet experience
Time spent using (mean) by Internet experience Application
>3 3>6 6>9 9>12 12+ E-mail 1.952 3.233 3.875 3.444 3.800 WWW 2.190 3.566 3.875 3.777 4.800 Search Engines 2.428 3.566 3.968 3.277 4.400 Directories 2.095 2.566 2.312 2.666 4.000 Forums 1.523 1.566 2.031 1.555 2.600 Messengers 1.238 1.966 2.750 1.944 4.000 Relay Chat 1.285 1.166 1.093 0.777 3.000 Newsgroups 1.714 2.400 2.156 2.277 3.600 Listservs 0.857 1.100 1.343 1.055 2.600 File Transfer Protocol 0.476 0.733 1.000 1.333 2.600 Telnet 0.523 0.566 0.781 0.888 2.000 Blogs 0.666 1.133 0.968 1.722 2.600 Real Simple Syndication 0.476 0.633 0.656 1.055 2.000 Wikis 0.333 0.733 0.718 0.722 2.000 Podcasting 0.619 0.833 0.906 0.777 2.400 Language Tools 0.809 1.133 1.968 1.166 2.200 Alerts Software 0.666 1.100 1.968 2.333 4.000 Databases 0.619 0.766 1.562 1.000 4.200 Open-Source Software 0.571 0.466 1.000 1.111 2.600 Average Mean 1.107 1.538 1.838 1.731 3.126 Note: The incremental scale used to measure the amount of time spent using each application ranged from 0 to 5 with 0 being no use at all, 1 for less time, 3 for average, and 5 for more time. Key: >3= Less than 3 years, 3>6= 3 or more but less than 6, 6>9= 6 or more but less than 9, 9>12= 9 or more but less than 12, 12+= 12 years or more
95

4.3.5 By Level of Education
Level of Education revealed two significant differences in the time spent using Search Engines,
and FTP. Table 36 provides more information. For Search Engines, the significant difference
was between bachelor-degree holders, and diploma holders. For FTP, the significant difference
was between Master-degree or higher holders, and high-school or lower graduates. Further,
journalists who held Master's degrees or higher spent more time using all of the applications
listed when compared to other groups. High-school graduates or lower spent the least time on
average in using the same applications.
96
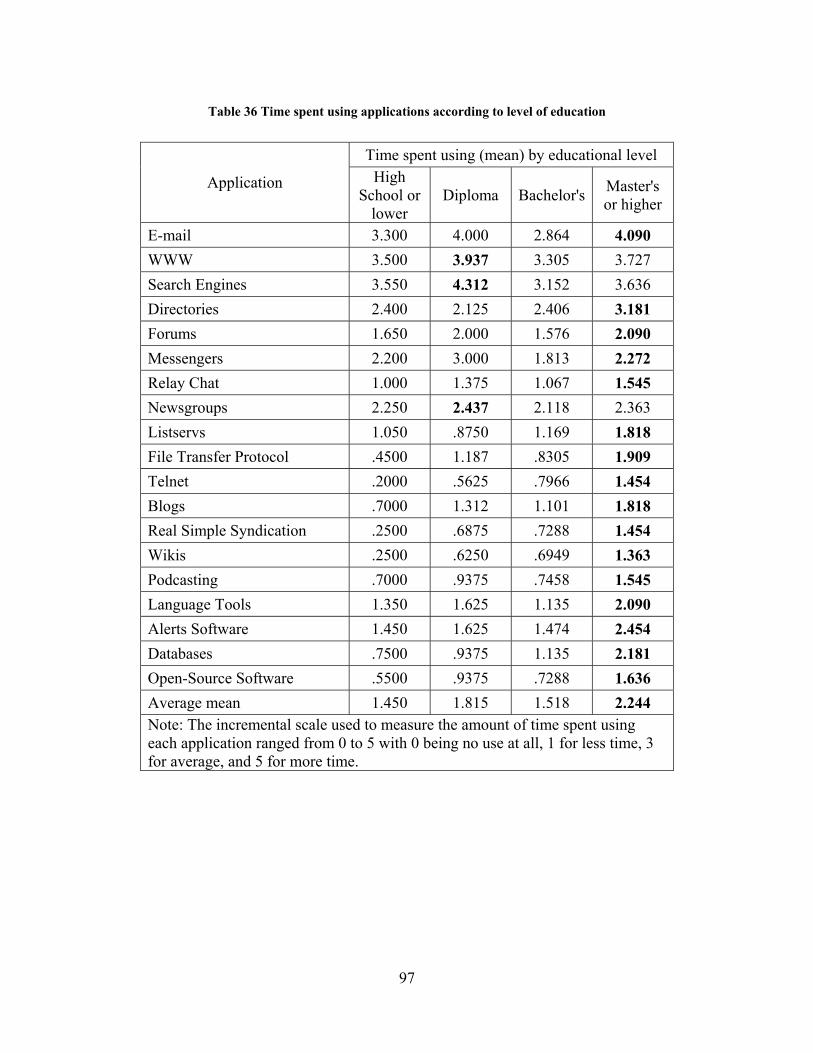
Table 36 Time spent using applications according to level of education
Time spent using (mean) by educational level
Application High School or
lower Diploma Bachelor's Master's
or higher
E-mail 3.300 4.000 2.864 4.090 WWW 3.500 3.937 3.305 3.727 Search Engines 3.550 4.312 3.152 3.636 Directories 2.400 2.125 2.406 3.181 Forums 1.650 2.000 1.576 2.090 Messengers 2.200 3.000 1.813 2.272 Relay Chat 1.000 1.375 1.067 1.545 Newsgroups 2.250 2.437 2.118 2.363 Listservs 1.050 .8750 1.169 1.818 File Transfer Protocol .4500 1.187 .8305 1.909 Telnet .2000 .5625 .7966 1.454 Blogs .7000 1.312 1.101 1.818 Real Simple Syndication .2500 .6875 .7288 1.454 Wikis .2500 .6250 .6949 1.363 Podcasting .7000 .9375 .7458 1.545 Language Tools 1.350 1.625 1.135 2.090 Alerts Software 1.450 1.625 1.474 2.454 Databases .7500 .9375 1.135 2.181 Open-Source Software .5500 .9375 .7288 1.636 Average mean 1.450 1.815 1.518 2.244 Note: The incremental scale used to measure the amount of time spent using each application ranged from 0 to 5 with 0 being no use at all, 1 for less time, 3 for average, and 5 for more time.
97
4.3.6 By Primary Field of Study
Analysis according to primary field of study, or major, revealed three significant differences in
terms of amount of time spent using Messengers, FTP, and Language Tools. The main difference
for all three applications was between Computer Science/Information Technology majors, and
others. This could be regarded as an expected finding since Computer Science majors are
expected to be more skilled in using applications, and therefore, spend more time using them.
Table 37 provides more information about these significant differences. A Tukey post-hoc test
showed that the difference in time spent using Messengers was between Computer
Science/Information Technology on one hand, and Journalism and Mass Communications,
Law/Humanities/Social Sciences, and Arts/Education, on the other.
The same applied to FTP, where Computer Science/Information Technology majors
spent more time using applications that others. As for language tools, the significant difference
was between two groups- Computer Science/Information Technology and Journalism and Mass
Communications. Further, table 37 shows that on average, computer science/information
technology majors spent more time using all of the applications in comparison to other majors.
Law/humanities/social sciences majors spent the least time on average in using all of the
applications.
98
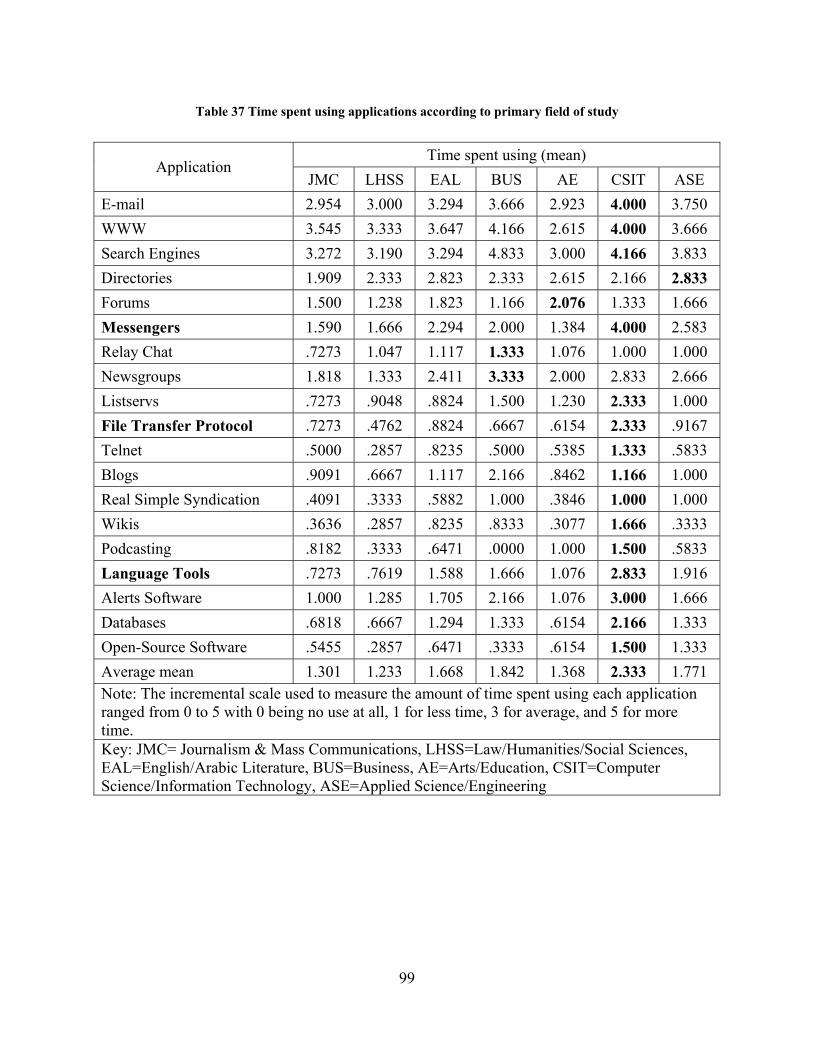
Table 37 Time spent using applications according to primary field of study
Time spent using (mean) Application
JMC LHSS EAL BUS AE CSIT ASE E-mail 2.954 3.000 3.294 3.666 2.923 4.000 3.750 WWW 3.545 3.333 3.647 4.166 2.615 4.000 3.666 Search Engines 3.272 3.190 3.294 4.833 3.000 4.166 3.833 Directories 1.909 2.333 2.823 2.333 2.615 2.166 2.833 Forums 1.500 1.238 1.823 1.166 2.076 1.333 1.666 Messengers 1.590 1.666 2.294 2.000 1.384 4.000 2.583 Relay Chat .7273 1.047 1.117 1.333 1.076 1.000 1.000 Newsgroups 1.818 1.333 2.411 3.333 2.000 2.833 2.666 Listservs .7273 .9048 .8824 1.500 1.230 2.333 1.000 File Transfer Protocol .7273 .4762 .8824 .6667 .6154 2.333 .9167 Telnet .5000 .2857 .8235 .5000 .5385 1.333 .5833 Blogs .9091 .6667 1.117 2.166 .8462 1.166 1.000 Real Simple Syndication .4091 .3333 .5882 1.000 .3846 1.000 1.000 Wikis .3636 .2857 .8235 .8333 .3077 1.666 .3333 Podcasting .8182 .3333 .6471 .0000 1.000 1.500 .5833 Language Tools .7273 .7619 1.588 1.666 1.076 2.833 1.916 Alerts Software 1.000 1.285 1.705 2.166 1.076 3.000 1.666 Databases .6818 .6667 1.294 1.333 .6154 2.166 1.333 Open-Source Software .5455 .2857 .6471 .3333 .6154 1.500 1.333 Average mean 1.301 1.233 1.668 1.842 1.368 2.333 1.771 Note: The incremental scale used to measure the amount of time spent using each application ranged from 0 to 5 with 0 being no use at all, 1 for less time, 3 for average, and 5 for more time. Key: JMC= Journalism & Mass Communications, LHSS=Law/Humanities/Social Sciences, EAL=English/Arabic Literature, BUS=Business, AE=Arts/Education, CSIT=Computer Science/Information Technology, ASE=Applied Science/Engineering
99
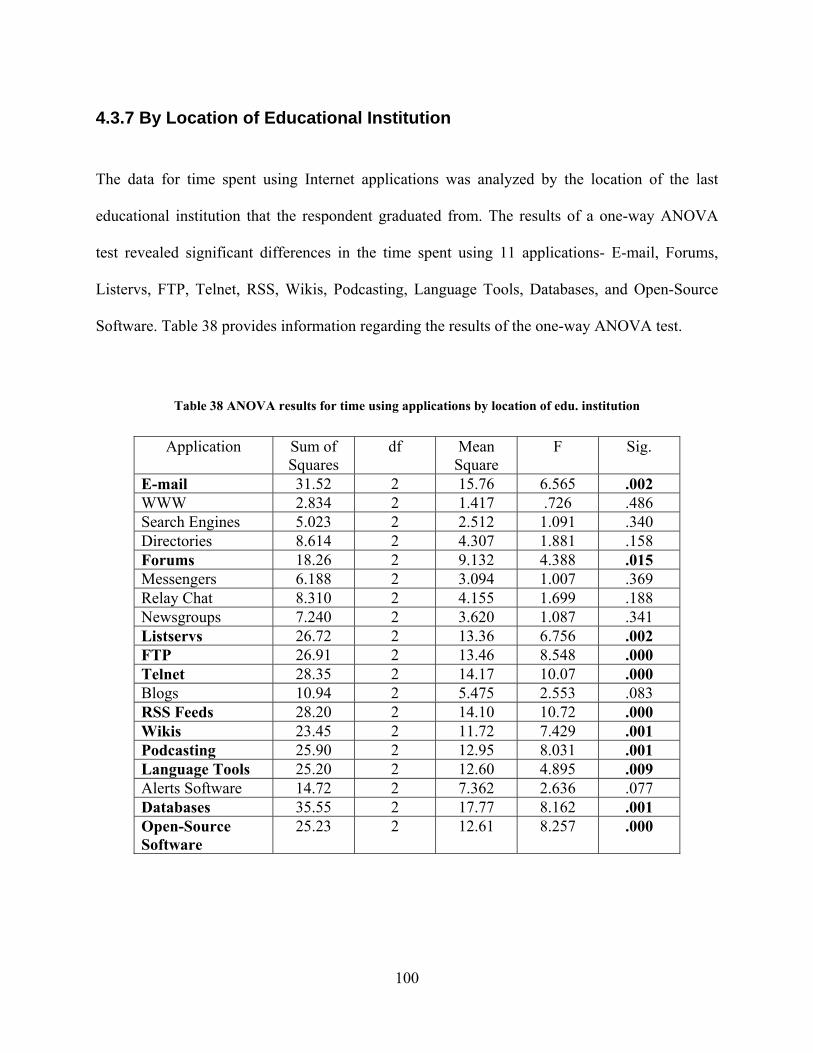
4.3.7 By Location of Educational Institution
The data for time spent using Internet applications was analyzed by the location of the last
educational institution that the respondent graduated from. The results of a one-way ANOVA
test revealed significant differences in the time spent using 11 applications- E-mail, Forums,
Listervs, FTP, Telnet, RSS, Wikis, Podcasting, Language Tools, Databases, and Open-Source
Software. Table 38 provides information regarding the results of the one-way ANOVA test.
Table 38 ANOVA results for time using applications by location of edu. institution
Application Sum of Squares
df Mean Square
F Sig.
E-mail 31.52 2 15.76 6.565 .002 WWW 2.834 2 1.417 .726 .486 Search Engines 5.023 2 2.512 1.091 .340 Directories 8.614 2 4.307 1.881 .158 Forums 18.26 2 9.132 4.388 .015 Messengers 6.188 2 3.094 1.007 .369 Relay Chat 8.310 2 4.155 1.699 .188 Newsgroups 7.240 2 3.620 1.087 .341 Listservs 26.72 2 13.36 6.756 .002 FTP 26.91 2 13.46 8.548 .000 Telnet 28.35 2 14.17 10.07 .000 Blogs 10.94 2 5.475 2.553 .083 RSS Feeds 28.20 2 14.10 10.72 .000 Wikis 23.45 2 11.72 7.429 .001 Podcasting 25.90 2 12.95 8.031 .001 Language Tools 25.20 2 12.60 4.895 .009 Alerts Software 14.72 2 7.362 2.636 .077 Databases 35.55 2 17.77 8.162 .001 Open-Source Software
25.23 2 12.61 8.257 .000
100
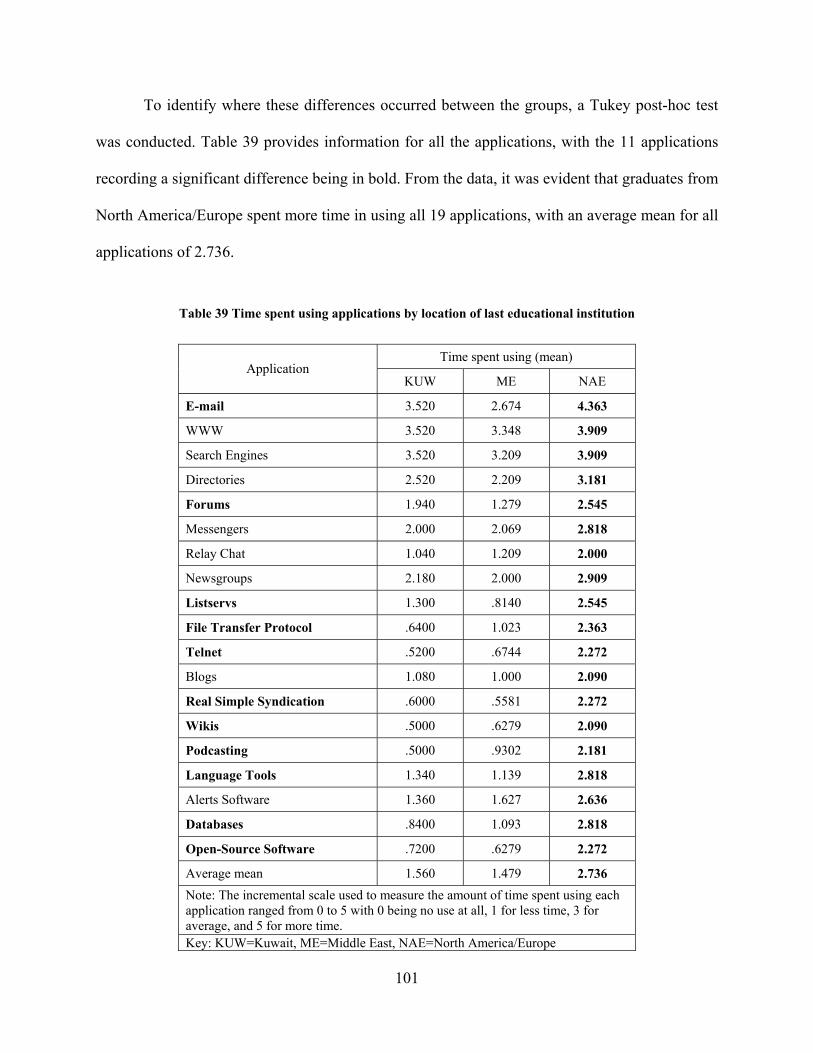
To identify where these differences occurred between the groups, a Tukey post-hoc test
was conducted. Table 39 provides information for all the applications, with the 11 applications
recording a significant difference being in bold. From the data, it was evident that graduates from
North America/Europe spent more time in using all 19 applications, with an average mean for all
applications of 2.736.
Table 39 Time spent using applications by location of last educational institution
Time spent using (mean) Application
KUW ME NAE
E-mail 3.520 2.674 4.363
WWW 3.520 3.348 3.909
Search Engines 3.520 3.209 3.909
Directories 2.520 2.209 3.181
Forums 1.940 1.279 2.545
Messengers 2.000 2.069 2.818
Relay Chat 1.040 1.209 2.000
Newsgroups 2.180 2.000 2.909
Listservs 1.300 .8140 2.545
File Transfer Protocol .6400 1.023 2.363
Telnet .5200 .6744 2.272
Blogs 1.080 1.000 2.090
Real Simple Syndication .6000 .5581 2.272
Wikis .5000 .6279 2.090
Podcasting .5000 .9302 2.181
Language Tools 1.340 1.139 2.818
Alerts Software 1.360 1.627 2.636
Databases .8400 1.093 2.818
Open-Source Software .7200 .6279 2.272
Average mean 1.560 1.479 2.736 Note: The incremental scale used to measure the amount of time spent using each application ranged from 0 to 5 with 0 being no use at all, 1 for less time, 3 for average, and 5 for more time. Key: KUW=Kuwait, ME=Middle East, NAE=North America/Europe
101
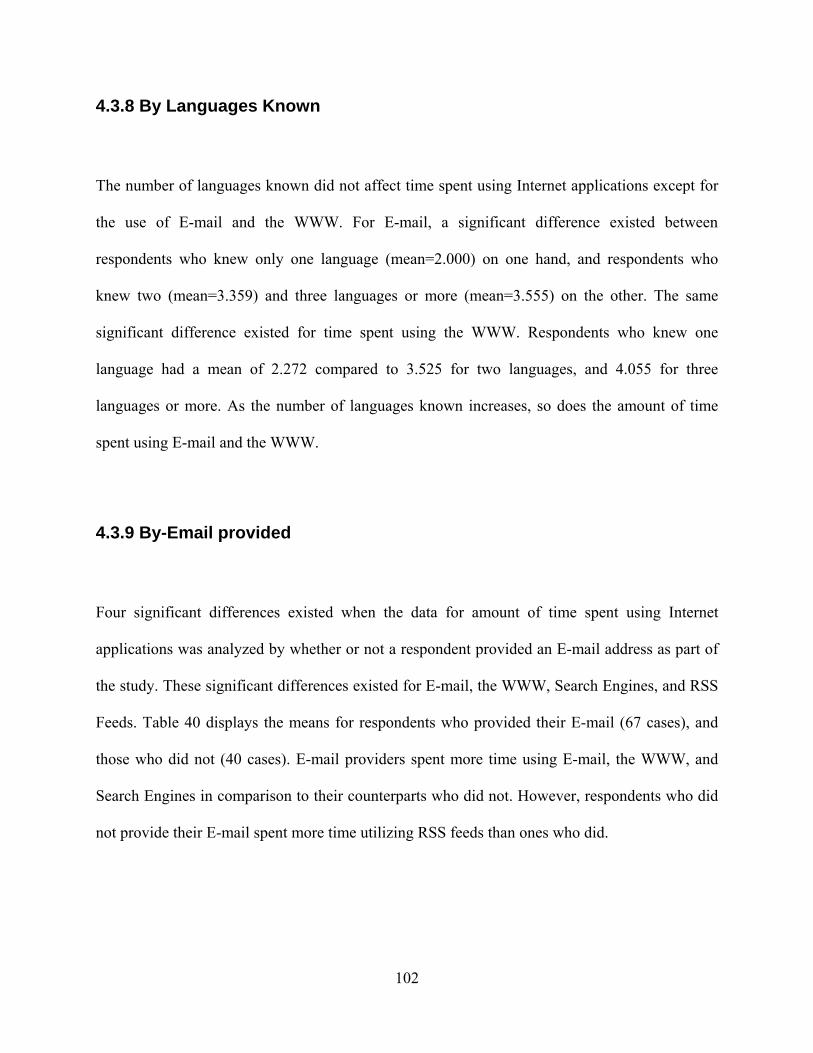
4.3.8 By Languages Known
The number of languages known did not affect time spent using Internet applications except for
the use of E-mail and the WWW. For E-mail, a significant difference existed between
respondents who knew only one language (mean=2.000) on one hand, and respondents who
knew two (mean=3.359) and three languages or more (mean=3.555) on the other. The same
significant difference existed for time spent using the WWW. Respondents who knew one
language had a mean of 2.272 compared to 3.525 for two languages, and 4.055 for three
languages or more. As the number of languages known increases, so does the amount of time
spent using E-mail and the WWW.
4.3.9 By-Email provided
Four significant differences existed when the data for amount of time spent using Internet
applications was analyzed by whether or not a respondent provided an E-mail address as part of
the study. These significant differences existed for E-mail, the WWW, Search Engines, and RSS
Feeds. Table 40 displays the means for respondents who provided their E-mail (67 cases), and
those who did not (40 cases). E-mail providers spent more time using E-mail, the WWW, and
Search Engines in comparison to their counterparts who did not. However, respondents who did
not provide their E-mail spent more time utilizing RSS feeds than ones who did.
102
From table 40, it is evident that journalists who did not provide their E-mails spent more
time using some of the applications listed. However, in terms of average mean for time spent
using all applications, journalists who did provide their E-mails had a higher average mean,
indicating that they spent more time than others in using the applications listed.
Table 40 Time spent using applications according to E-mail provided
Time spent using (mean) Application E-mail
Yes E-mail
No E-mail 3.582 2.700
WWW 3.820 2.925
Search Engines 3.835 2.825
Directories 2.298 2.725
Forums 1.776 1.650
Messengers 2.313 1.825
Relay Chat 1.164 1.200
Newsgroups 2.209 2.275
Listservs 1.134 1.300
File Transfer Protocol .8358 1.150
Telnet .6269 .9500
Blogs 1.044 1.350
Real Simple Syndication .5522 1.050
Wikis .5672 .9250
Podcasting .8657 .9000
Language Tools 1.358 1.400
Alerts Software 1.611 1.625
Databases 1.074 1.325
Open-Source Software .7164 1.075
Average mean 1.652 1.640 Note: The incremental scale used to measure the amount of time spent using each application ranged from 0 to 5 with 0 being no use at all, 1 for less time, 3 for average, and 5 for more time.
103
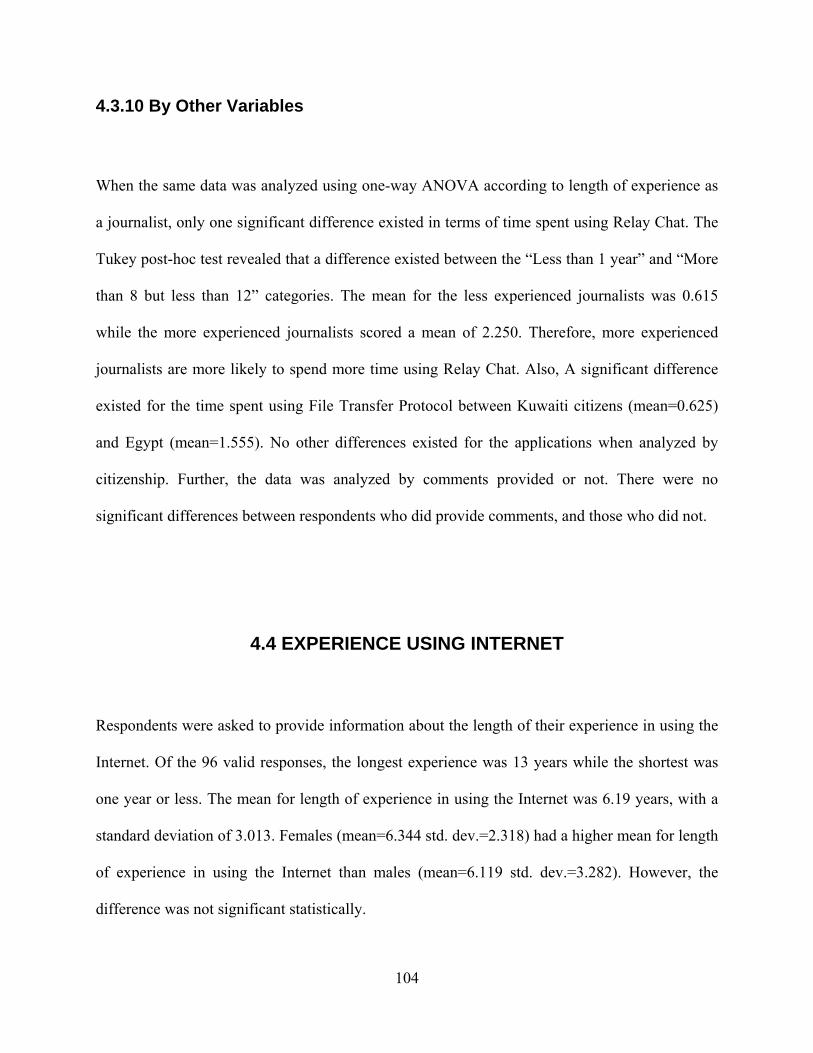
4.3.10 By Other Variables
When the same data was analyzed using one-way ANOVA according to length of experience as
a journalist, only one significant difference existed in terms of time spent using Relay Chat. The
Tukey post-hoc test revealed that a difference existed between the “Less than 1 year” and “More
than 8 but less than 12” categories. The mean for the less experienced journalists was 0.615
while the more experienced journalists scored a mean of 2.250. Therefore, more experienced
journalists are more likely to spend more time using Relay Chat. Also, A significant difference
existed for the time spent using File Transfer Protocol between Kuwaiti citizens (mean=0.625)
and Egypt (mean=1.555). No other differences existed for the applications when analyzed by
citizenship. Further, the data was analyzed by comments provided or not. There were no
significant differences between respondents who did provide comments, and those who did not.
4.4 EXPERIENCE USING INTERNET
Respondents were asked to provide information about the length of their experience in using the
Internet. Of the 96 valid responses, the longest experience was 13 years while the shortest was
one year or less. The mean for length of experience in using the Internet was 6.19 years, with a
standard deviation of 3.013. Females (mean=6.344 std. dev.=2.318) had a higher mean for length
of experience in using the Internet than males (mean=6.119 std. dev.=3.282). However, the
difference was not significant statistically.
104
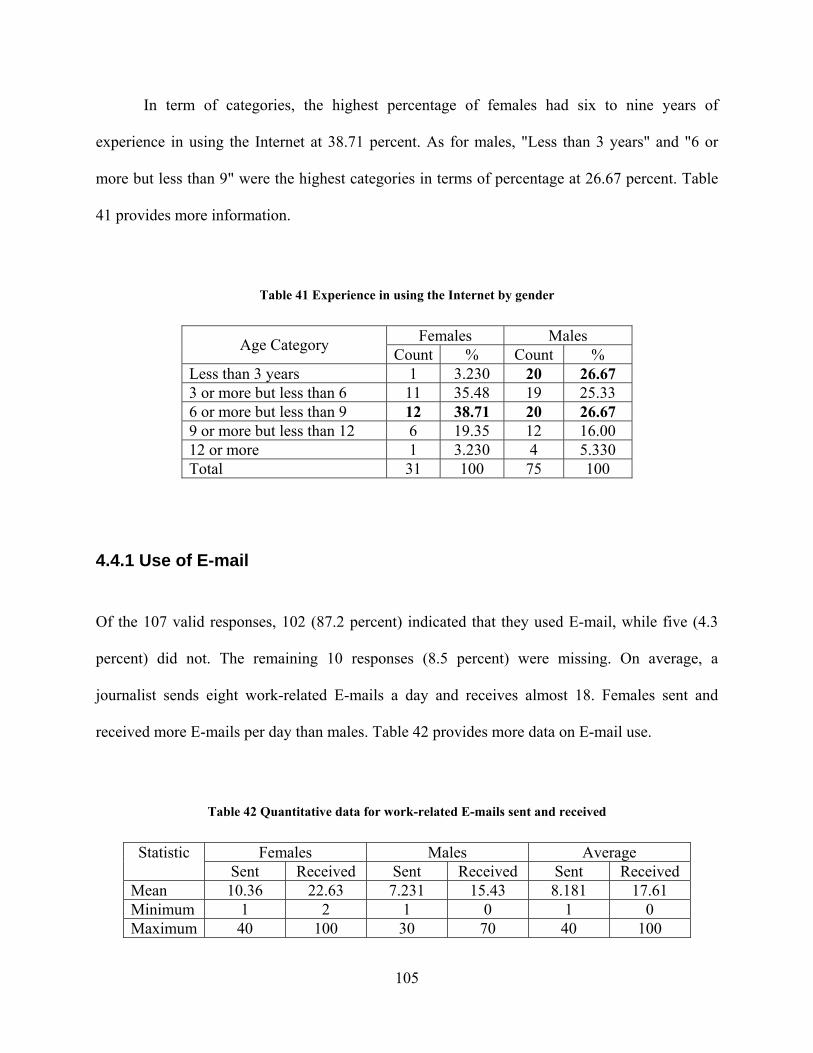
In term of categories, the highest percentage of females had six to nine years of
experience in using the Internet at 38.71 percent. As for males, "Less than 3 years" and "6 or
more but less than 9" were the highest categories in terms of percentage at 26.67 percent. Table
41 provides more information.
Table 41 Experience in using the Internet by gender
Females Males Age Category Count % Count % Less than 3 years 1 3.230 20 26.67 3 or more but less than 6 11 35.48 19 25.33 6 or more but less than 9 12 38.71 20 26.67 9 or more but less than 12 6 19.35 12 16.00 12 or more 1 3.230 4 5.330 Total 31 100 75 100
4.4.1 Use of E-mail
Of the 107 valid responses, 102 (87.2 percent) indicated that they used E-mail, while five (4.3
percent) did not. The remaining 10 responses (8.5 percent) were missing. On average, a
journalist sends eight work-related E-mails a day and receives almost 18. Females sent and
received more E-mails per day than males. Table 42 provides more data on E-mail use.
Table 42 Quantitative data for work-related E-mails sent and received
Females Males Average Statistic Sent Received Sent Received Sent Received
Mean 10.36 22.63 7.231 15.43 8.181 17.61 Minimum 1 2 1 0 1 0 Maximum 40 100 30 70 40 100
105

4.4.2 E-mail Attractions
Respondents were provided with seven potentially attractive features of E-mail and were asked
to choose only three. The most attractive feature of E-mail was its convenience, followed by file
uploading/downloading and overcoming time differences. Storage capabilities, cost, indexing
and searching were not viewed as very attractive features. Two respondents listed ease-of-use
and availability as "Other" attractive features. Table 43 provides more information.
Table 43 Attractive features of E-mail
Rank E-mail Feature Count 1 Convenience 75 2 File Uploading/Downloading 68 3 Overcoming Time Differences 57 4 Speed 56 5 Storage Capabilities 19 6 Cost 17 7 Indexing and Searching 11 8 Other 2
When analyzed by gender, the data revealed that females and males differed in terms of
what they found attractive about E-mail. Females emphasized Speed while males emphasized
Convenience. However, both genders found Cost, Storage Capabilities, and Indexing and
Searching, to be less attractive features of E-mail. Overcoming Time Differences ranked third for
both genders. Table 44 provides more information.
106
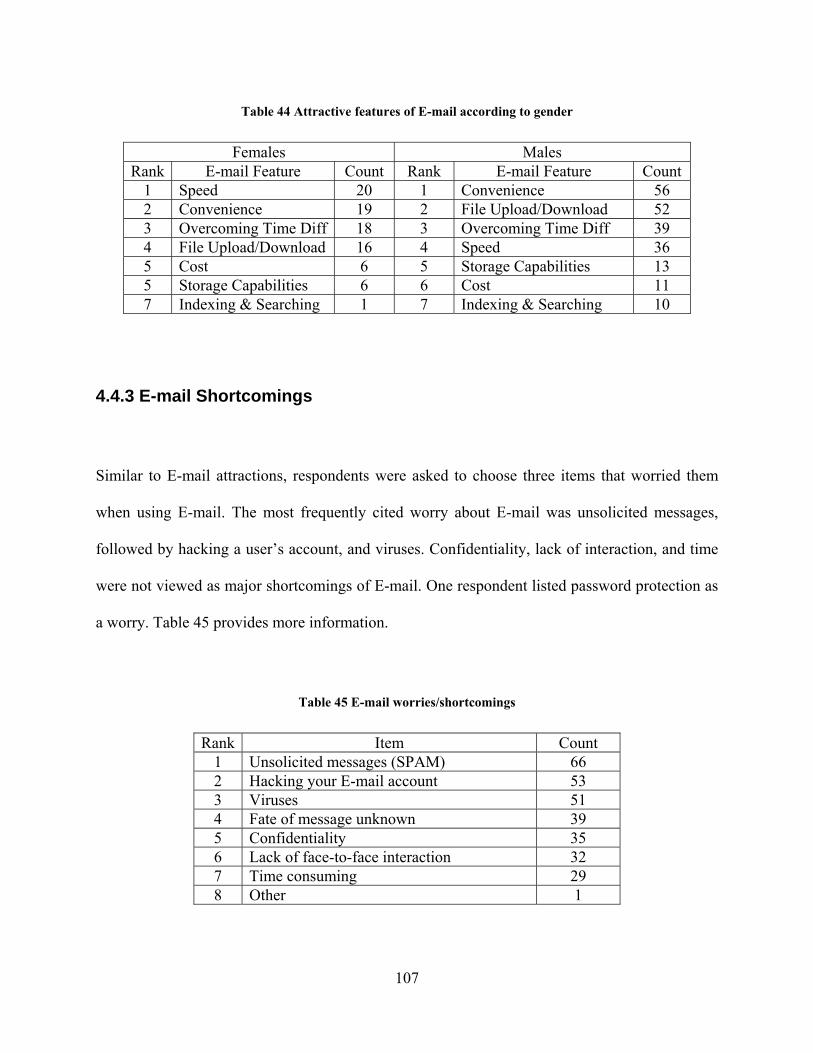
Table 44 Attractive features of E-mail according to gender
Females Males Rank E-mail Feature Count Rank E-mail Feature Count
1 Speed 20 1 Convenience 56 2 Convenience 19 2 File Upload/Download 52 3 Overcoming Time Diff 18 3 Overcoming Time Diff 39 4 File Upload/Download 16 4 Speed 36 5 Cost 6 5 Storage Capabilities 13 5 Storage Capabilities 6 6 Cost 11 7 Indexing & Searching 1 7 Indexing & Searching 10
4.4.3 E-mail Shortcomings
Similar to E-mail attractions, respondents were asked to choose three items that worried them
when using E-mail. The most frequently cited worry about E-mail was unsolicited messages,
followed by hacking a user’s account, and viruses. Confidentiality, lack of interaction, and time
were not viewed as major shortcomings of E-mail. One respondent listed password protection as
a worry. Table 45 provides more information.
Table 45 E-mail worries/shortcomings
Rank Item Count 1 Unsolicited messages (SPAM) 66 2 Hacking your E-mail account 53 3 Viruses 51 4 Fate of message unknown 39 5 Confidentiality 35 6 Lack of face-to-face interaction 32 7 Time consuming 29 8 Other 1
107
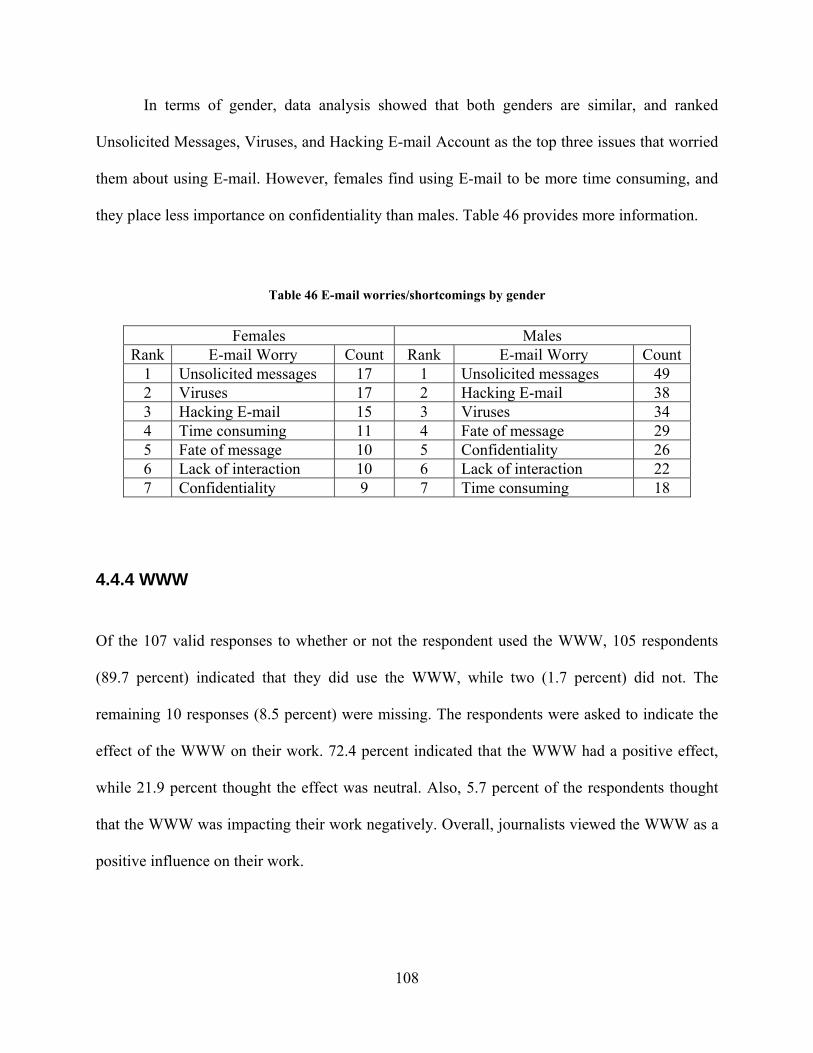
In terms of gender, data analysis showed that both genders are similar, and ranked
Unsolicited Messages, Viruses, and Hacking E-mail Account as the top three issues that worried
them about using E-mail. However, females find using E-mail to be more time consuming, and
they place less importance on confidentiality than males. Table 46 provides more information.
Table 46 E-mail worries/shortcomings by gender
Females Males Rank E-mail Worry Count Rank E-mail Worry Count
1 Unsolicited messages 17 1 Unsolicited messages 49 2 Viruses 17 2 Hacking E-mail 38 3 Hacking E-mail 15 3 Viruses 34 4 Time consuming 11 4 Fate of message 29 5 Fate of message 10 5 Confidentiality 26 6 Lack of interaction 10 6 Lack of interaction 22 7 Confidentiality 9 7 Time consuming 18
4.4.4 WWW
Of the 107 valid responses to whether or not the respondent used the WWW, 105 respondents
(89.7 percent) indicated that they did use the WWW, while two (1.7 percent) did not. The
remaining 10 responses (8.5 percent) were missing. The respondents were asked to indicate the
effect of the WWW on their work. 72.4 percent indicated that the WWW had a positive effect,
while 21.9 percent thought the effect was neutral. Also, 5.7 percent of the respondents thought
that the WWW was impacting their work negatively. Overall, journalists viewed the WWW as a
positive influence on their work.
108
4.4.5 Importance of WWW Resources
To further examine journalists’ use of the WWW, respondents were asked to rank 19 WWW
resources that included sites and services. The scale provided was incremental and started from 1
for not important, 3 for average, and 5 for very important. The analysis found that journalists
viewed newspaper sites (mean=3.9238) as the most important resource on the WWW, followed
by Search Engines, News Services, Magazine sites, and Press Releases sites.
Nine WWW resources had a mean of below 3, or average. The lowest ranked WWW
resources were Entertainment/Sports sites, Databases, and Financial/Company sites. Table 47
provides detailed information about the importance placed on every WWW resource listed. The
other category included items such as specific commercial websites and other site-types that
were covered in the list. Overall, journalists indicated that the WWW resources were below
average in importance. The average mean for all the WWW resources was 2.9902, slightly below
the average of three. Further, Cronbach's Alpha was found to be .911, indicating that the scales
used were highly reliable.
109
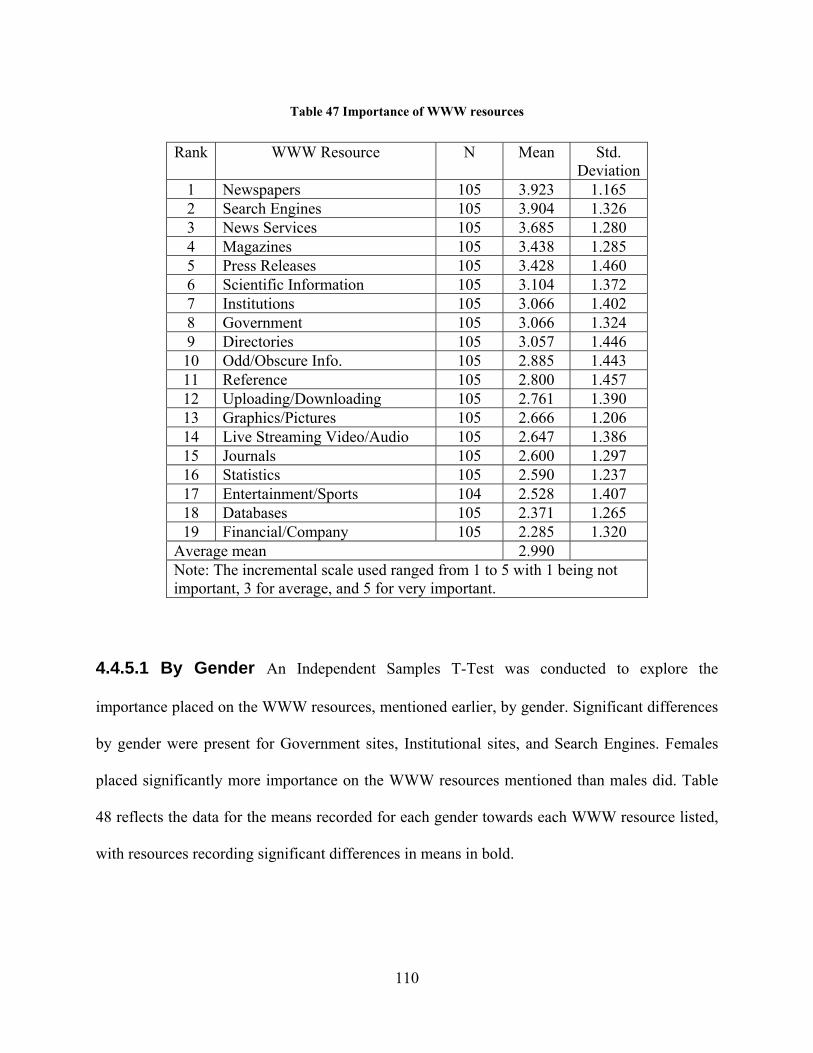
Table 47 Importance of WWW resources
Rank WWW Resource N Mean Std. Deviation
1 Newspapers 105 3.923 1.165 2 Search Engines 105 3.904 1.326 3 News Services 105 3.685 1.280 4 Magazines 105 3.438 1.285 5 Press Releases 105 3.428 1.460 6 Scientific Information 105 3.104 1.372 7 Institutions 105 3.066 1.402 8 Government 105 3.066 1.324 9 Directories 105 3.057 1.446 10 Odd/Obscure Info. 105 2.885 1.443 11 Reference 105 2.800 1.457 12 Uploading/Downloading 105 2.761 1.390 13 Graphics/Pictures 105 2.666 1.206 14 Live Streaming Video/Audio 105 2.647 1.386 15 Journals 105 2.600 1.297 16 Statistics 105 2.590 1.237 17 Entertainment/Sports 104 2.528 1.407 18 Databases 105 2.371 1.265 19 Financial/Company 105 2.285 1.320
Average mean 2.990 Note: The incremental scale used ranged from 1 to 5 with 1 being not important, 3 for average, and 5 for very important.
4.4.5.1 By Gender An Independent Samples T-Test was conducted to explore the
importance placed on the WWW resources, mentioned earlier, by gender. Significant differences
by gender were present for Government sites, Institutional sites, and Search Engines. Females
placed significantly more importance on the WWW resources mentioned than males did. Table
48 reflects the data for the means recorded for each gender towards each WWW resource listed,
with resources recording significant differences in means in bold.
110
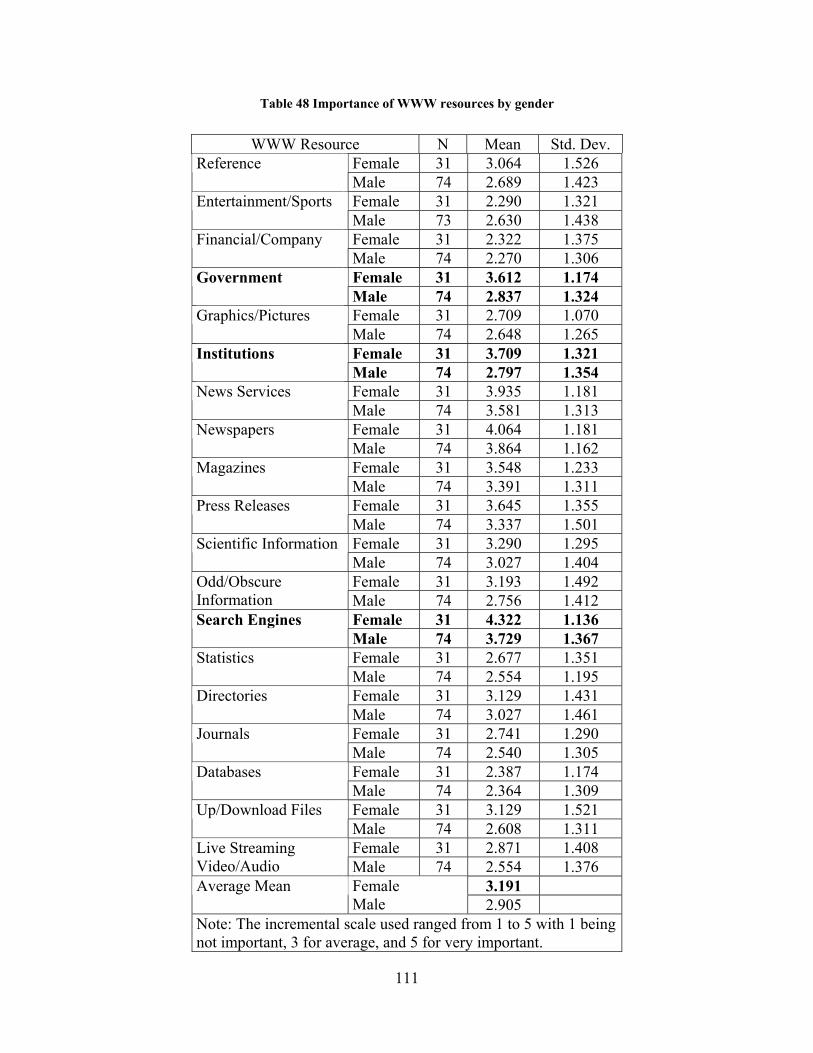
Table 48 Importance of WWW resources by gender
WWW Resource N Mean Std. Dev. Female 31 3.064 1.526 Reference
Male 74 2.689 1.423 Female 31 2.290 1.321 Entertainment/Sports
Male 73 2.630 1.438 Female 31 2.322 1.375 Financial/Company
Male 74 2.270 1.306 Female 31 3.612 1.174 Government
Male 74 2.837 1.324 Female 31 2.709 1.070 Graphics/Pictures
Male 74 2.648 1.265 Female 31 3.709 1.321 Institutions
Male 74 2.797 1.354 Female 31 3.935 1.181 News Services
Male 74 3.581 1.313 Female 31 4.064 1.181 Newspapers
Male 74 3.864 1.162 Female 31 3.548 1.233 Magazines
Male 74 3.391 1.311 Female 31 3.645 1.355 Press Releases
Male 74 3.337 1.501 Female 31 3.290 1.295 Scientific Information
Male 74 3.027 1.404 Female 31 3.193 1.492 Odd/Obscure
Information Male 74 2.756 1.412 Female 31 4.322 1.136 Search Engines
Male 74 3.729 1.367 Female 31 2.677 1.351 Statistics
Male 74 2.554 1.195 Female 31 3.129 1.431 Directories
Male 74 3.027 1.461 Female 31 2.741 1.290 Journals
Male 74 2.540 1.305 Female 31 2.387 1.174 Databases
Male 74 2.364 1.309 Female 31 3.129 1.521 Up/Download Files
Male 74 2.608 1.311 Female 31 2.871 1.408 Live Streaming
Video/Audio Male 74 2.554 1.376 3.191 Average Mean Female
Male 2.905 Note: The incremental scale used ranged from 1 to 5 with 1 being not important, 3 for average, and 5 for very important.
111
4.4.5.2 By Age In terms of age, a one-way ANOVA test showed that two significant
differences were present between the age groups. These differences were for Institutional sites
and Search Engines. A Tukey Post Hoc test identified the difference for Institutional sites to be
between the youngest category, younger than 25 (mean=3.8261) and the eldest, 40 years or older
(mean=2.5625). Younger journalists placed more importance on websites of institutions than
their older counterparts. A similar case was present for Search Engines where the youngest age
category (mean=4.6957) recorded a significant difference from the eldest (mean=3.3125).
Another significant difference for Search Engines existed between the youngest age category
(mean=4.6957) and the “More than 25 but less than 30” age category (mean=3.5600). The data
suggests that younger journalists place more importance on Search Engines than their
counterparts.
4.4.5.3 By Journalistic Beat One-way ANOVA identified five significant differences
when the data was analyzed by journalistic beat. These occurred for Financial/Company sites,
News Services, Journals, Databases, and Live Streaming Video/Audio. Full results are presented
in Table 49, with the WWW resources that recorded significant differences between journalistic
beats in bold. The results of the Tukey Post Hoc test revealed that the Education/Arts &
Literature beat was the primary cause of the significant differences for the five WWW resources.
In the case of Financial/Company sites, Education/Arts & Literature (mean=1.2143) differed
significantly from three other beats- Local, Society/Health/Science, and Features. Also, results
showed that feature journalists placed more importance than other groups on 14 out of the 19
WWW resources listed. Further, the average mean for all the WWW resources showed that
feature reporters placed the most importance on the resources in comparison to other groups.
112
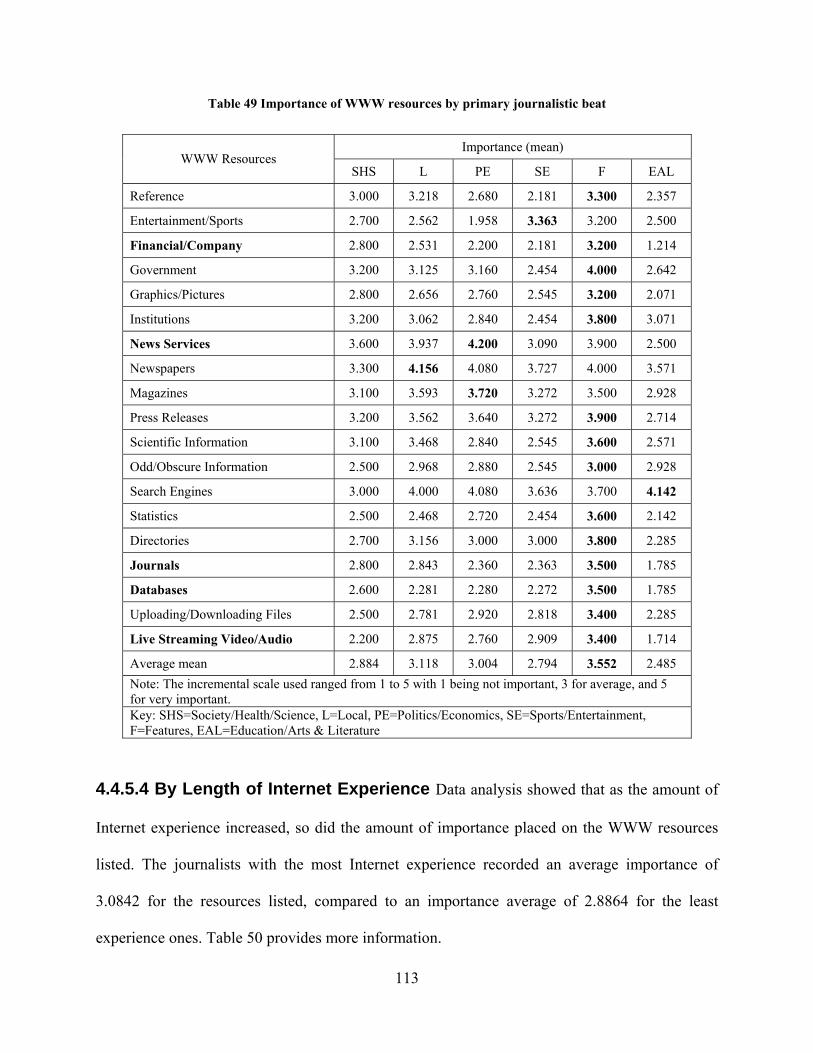
Table 49 Importance of WWW resources by primary journalistic beat
Importance (mean) WWW Resources
SHS L PE SE F EAL
Reference 3.000 3.218 2.680 2.181 3.300 2.357
Entertainment/Sports 2.700 2.562 1.958 3.363 3.200 2.500
Financial/Company 2.800 2.531 2.200 2.181 3.200 1.214
Government 3.200 3.125 3.160 2.454 4.000 2.642
Graphics/Pictures 2.800 2.656 2.760 2.545 3.200 2.071
Institutions 3.200 3.062 2.840 2.454 3.800 3.071
News Services 3.600 3.937 4.200 3.090 3.900 2.500
Newspapers 3.300 4.156 4.080 3.727 4.000 3.571
Magazines 3.100 3.593 3.720 3.272 3.500 2.928
Press Releases 3.200 3.562 3.640 3.272 3.900 2.714
Scientific Information 3.100 3.468 2.840 2.545 3.600 2.571
Odd/Obscure Information 2.500 2.968 2.880 2.545 3.000 2.928
Search Engines 3.000 4.000 4.080 3.636 3.700 4.142
Statistics 2.500 2.468 2.720 2.454 3.600 2.142
Directories 2.700 3.156 3.000 3.000 3.800 2.285
Journals 2.800 2.843 2.360 2.363 3.500 1.785
Databases 2.600 2.281 2.280 2.272 3.500 1.785
Uploading/Downloading Files 2.500 2.781 2.920 2.818 3.400 2.285
Live Streaming Video/Audio 2.200 2.875 2.760 2.909 3.400 1.714
Average mean 2.884 3.118 3.004 2.794 3.552 2.485 Note: The incremental scale used ranged from 1 to 5 with 1 being not important, 3 for average, and 5 for very important. Key: SHS=Society/Health/Science, L=Local, PE=Politics/Economics, SE=Sports/Entertainment, F=Features, EAL=Education/Arts & Literature
4.4.5.4 By Length of Internet Experience Data analysis showed that as the amount of
Internet experience increased, so did the amount of importance placed on the WWW resources
listed. The journalists with the most Internet experience recorded an average importance of
3.0842 for the resources listed, compared to an importance average of 2.8864 for the least
experience ones. Table 50 provides more information.
113
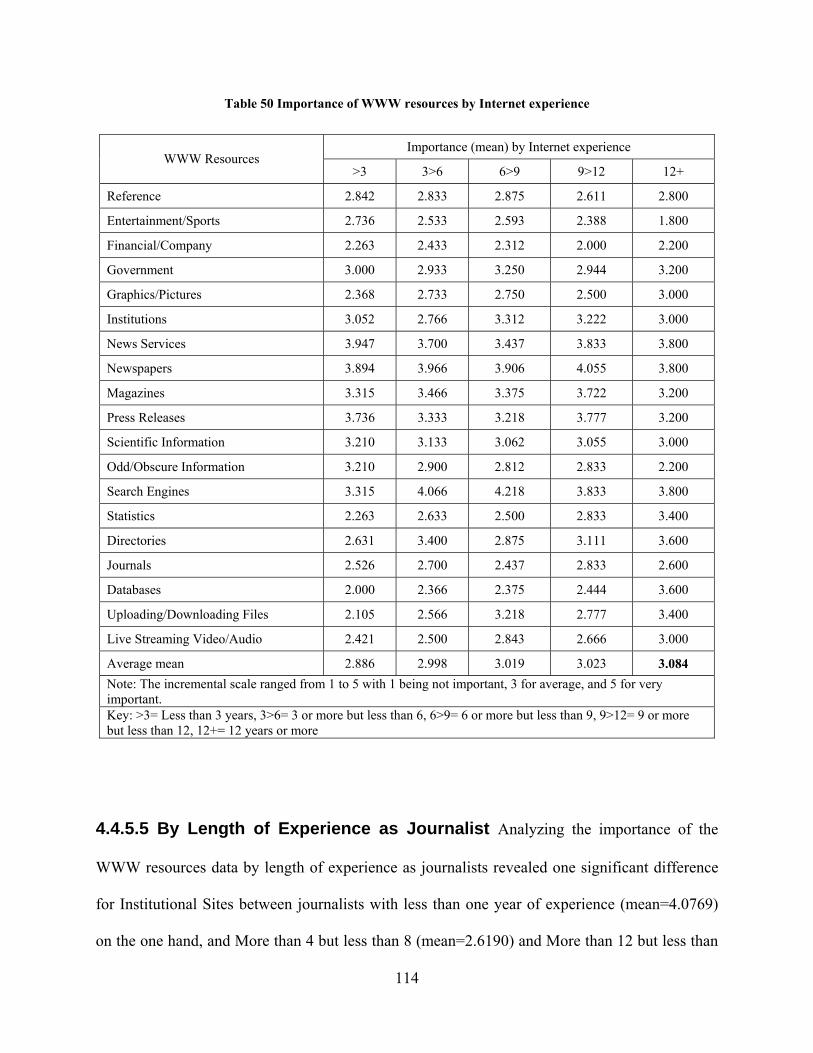
Table 50 Importance of WWW resources by Internet experience
Importance (mean) by Internet experience WWW Resources
>3 3>6 6>9 9>12 12+
Reference 2.842 2.833 2.875 2.611 2.800
Entertainment/Sports 2.736 2.533 2.593 2.388 1.800
Financial/Company 2.263 2.433 2.312 2.000 2.200
Government 3.000 2.933 3.250 2.944 3.200
Graphics/Pictures 2.368 2.733 2.750 2.500 3.000
Institutions 3.052 2.766 3.312 3.222 3.000
News Services 3.947 3.700 3.437 3.833 3.800
Newspapers 3.894 3.966 3.906 4.055 3.800
Magazines 3.315 3.466 3.375 3.722 3.200
Press Releases 3.736 3.333 3.218 3.777 3.200
Scientific Information 3.210 3.133 3.062 3.055 3.000
Odd/Obscure Information 3.210 2.900 2.812 2.833 2.200
Search Engines 3.315 4.066 4.218 3.833 3.800
Statistics 2.263 2.633 2.500 2.833 3.400
Directories 2.631 3.400 2.875 3.111 3.600
Journals 2.526 2.700 2.437 2.833 2.600
Databases 2.000 2.366 2.375 2.444 3.600
Uploading/Downloading Files 2.105 2.566 3.218 2.777 3.400
Live Streaming Video/Audio 2.421 2.500 2.843 2.666 3.000
Average mean 2.886 2.998 3.019 3.023 3.084 Note: The incremental scale ranged from 1 to 5 with 1 being not important, 3 for average, and 5 for very important. Key: >3= Less than 3 years, 3>6= 3 or more but less than 6, 6>9= 6 or more but less than 9, 9>12= 9 or more but less than 12, 12+= 12 years or more
4.4.5.5 By Length of Experience as Journalist Analyzing the importance of the
WWW resources data by length of experience as journalists revealed one significant difference
for Institutional Sites between journalists with less than one year of experience (mean=4.0769)
on the one hand, and More than 4 but less than 8 (mean=2.6190) and More than 12 but less than
114
16 (mean=2.4619) and More than 16 years (mean=2.3636) on the other. The results imply that
less experienced journalists are more likely to place more importance on Institutional sites than
their more experienced counterparts.
4.4.5.6 By Citizenship Analysis of the same data according to citizenship identified two
significant differences in the importance placed on Graphics/Pictures, and Databases. Kuwait
(mean=2.4630) placed less importance on databases than citizens in the “Other” category
(mean=3.8333). As for Databases, Egyptians (mean=3.3333) viewed this resources as more
important than the Al-Sham citizens (mean=2.2593) and Kuwait citizens (mean=2.0741).
4.4.5.7 By Level of Education Only Sports/Entertainment recorded a significant
difference between the groups when analyzed by level of education. Diploma holders
(mean=3.7500) placed more importance on Sports/Entertainment sites than High-School
graduates or lower (mean=1.9000) and Bachelor’s degree holders (mean=2.4035).
4.4.5.8 By Primary Field of Study Data analysis using one-way ANOVA by major
revealed nine significant differences between the groups- Reference, Entertainment/Sports,
Financial/Company, Government, Institutions, Odd/Obscure Information, Databases,
Uploading/Downloading Files, and Live Streaming Video/Audio. Further, results showed that
computer science/information technology majors placed more importance than all other majors
on 10 out of the 19 WWW resources listed. Business majors placed more importance than all
other majors on eight out of the 19 WWW resources.
115

Further, the average mean for all the WWW resources showed that computer science/information
technology majors placed more importance on the resources than all other majors, with
law/humanities/social sciences majors placing least importance on the same resources. Table 51
provides more information, with resources that recorded instances of significant difference
between the groups in bold.
116

Table 51 Importance of WWW resources by primary field of study
Importance (mean) WWW Resource
JMC LHSS EAL BUS AE CSIT ASE Reference 2.954 2.150 3.000 4.166 2.000 4.333 2.666 Entertainment/Sports 2.476 1.950 2.470 4.000 2.000 3.833 2.666 Financial/Company 2.454 1.700 2.235 2.833 1.583 3.500 2.083 Government 3.136 3.150 3.176 3.500 2.166 4.500 2.583 Graphics/Pictures 2.909 2.300 2.647 2.666 2.083 3.666 2.666 Institutions 3.409 2.900 3.176 3.666 1.916 4.166 2.916 News Services 3.909 3.350 3.647 4.166 3.750 4.333 3.583 Newspapers 3.727 4.100 3.823 4.666 3.833 4.166 4.083 Magazines 3.318 3.300 3.411 4.666 3.333 3.500 3.333 Press Releases 3.681 2.850 3.411 4.500 3.583 3.500 3.166 Scientific Information 3.227 2.350 3.411 4.166 2.916 3.500 3.166 Odd/Obscure Information 3.181 2.250 3.411 4.333 2.083 3.000 2.666 Search Engines 3.863 3.950 3.882 4.666 3.250 4.000 4.500 Statistics 2.500 2.300 2.705 3.166 2.166 3.166 2.500 Directories 2.772 2.600 3.647 2.666 3.166 3.500 3.416 Journals 2.500 1.850 3.117 3.000 2.666 3.166 2.583 Databases 2.363 1.900 2.764 1.833 1.916 3.666 2.250 Uploading/Downloading Files 2.772 2.050 3.352 2.000 2.083 4.166 3.166 Live Streaming Video/Audio 2.818 1.800 2.882 2.333 2.416 4.000 2.833 Average mean 3.051 2.568 3.167 3.526 2.574 3.771 2.991 Note: The incremental scale used ranged from 1 to 5 with 1 being not important, 3 for average, and 5 for very important.
Key: JMC= Journalism & Mass Communications, LHSS=Law/Humanities/Social Sciences, EAL=English/Arabic Literature, BUS=Business, AE=Arts/Education, CSIT=Computer Science/Information Technology, ASE=Applied Science/Engineering
117
4.4.5.9 By Location of Educational Institution A one-way ANOVA test revealed only
one significant difference when the data was analyzed according to the location of the
educational institution which the respondent graduated from. The Tukey Post Hoc test revealed
that the difference, which occurred for Newspaper websites, was between graduates from
institutions in North America and Europe (mean=2.818) and those who graduated from Kuwait
(mean=4.060) and the Middle East (mean=4.000).
4.4.5.10 By Languages Known The analysis revealed two significant differences for
Uploading/Downloading Files, and Live Streaming Video/Audio. For Uploading/Downloading
Files, the significant difference was between respondents who knew one language (mean=1.900)
and those who knew three (mean=3.277). As for Live Streaming Video/Audio, the significant
difference was between respondents who knew one language (mean=1.600), and those who knew
two (mean=2.740).
4.5 RQ3- INFORMATION EVALUATION CRITERIA
Data analysis showed that all evaluation criteria were viewed as important and recorded a mean
of at least 3, or average, for each criterion. However, Promptness, Convenience, and Accuracy
were viewed as the most important criteria for evaluating information found online. The
population placed less importance on Cost, Authority, and Interactivity.
118
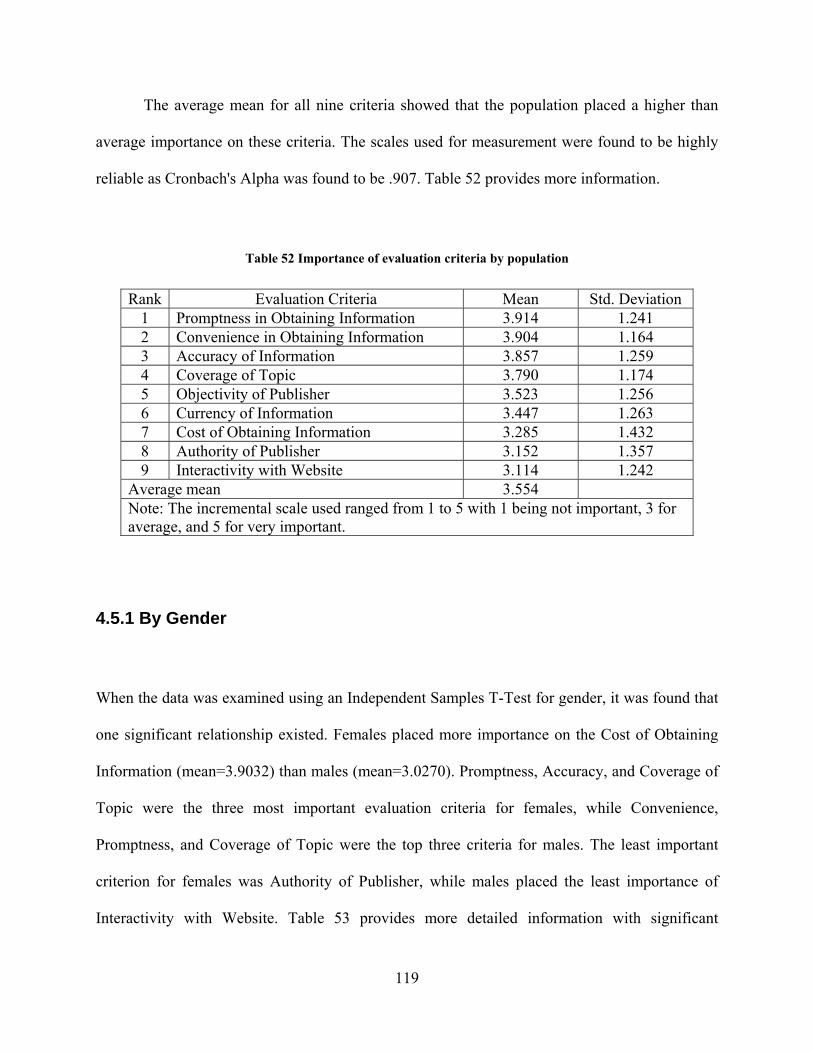
The average mean for all nine criteria showed that the population placed a higher than
average importance on these criteria. The scales used for measurement were found to be highly
reliable as Cronbach's Alpha was found to be .907. Table 52 provides more information.
Table 52 Importance of evaluation criteria by population
Rank Evaluation Criteria Mean Std. Deviation 1 Promptness in Obtaining Information 3.914 1.241 2 Convenience in Obtaining Information 3.904 1.164 3 Accuracy of Information 3.857 1.259 4 Coverage of Topic 3.790 1.174 5 Objectivity of Publisher 3.523 1.256 6 Currency of Information 3.447 1.263 7 Cost of Obtaining Information 3.285 1.432 8 Authority of Publisher 3.152 1.357 9 Interactivity with Website 3.114 1.242
Average mean 3.554 Note: The incremental scale used ranged from 1 to 5 with 1 being not important, 3 for average, and 5 for very important.
4.5.1 By Gender
When the data was examined using an Independent Samples T-Test for gender, it was found that
one significant relationship existed. Females placed more importance on the Cost of Obtaining
Information (mean=3.9032) than males (mean=3.0270). Promptness, Accuracy, and Coverage of
Topic were the three most important evaluation criteria for females, while Convenience,
Promptness, and Coverage of Topic were the top three criteria for males. The least important
criterion for females was Authority of Publisher, while males placed the least importance of
Interactivity with Website. Table 53 provides more detailed information with significant
119
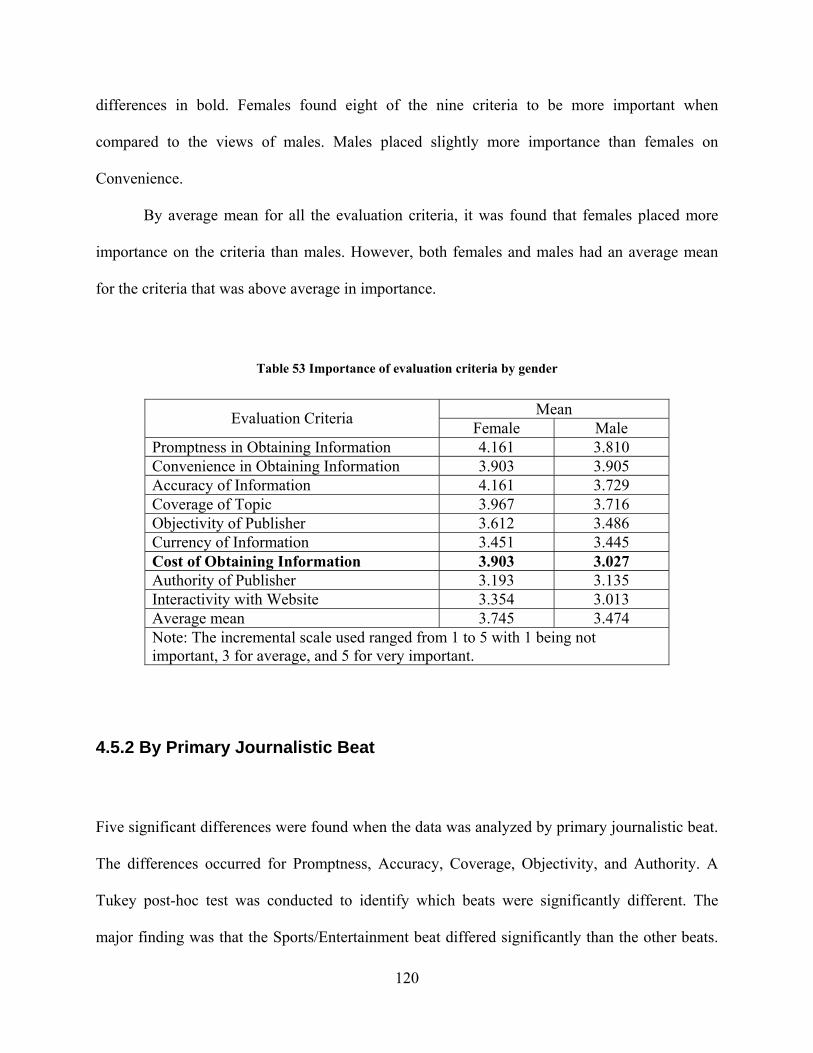
differences in bold. Females found eight of the nine criteria to be more important when
compared to the views of males. Males placed slightly more importance than females on
Convenience.
By average mean for all the evaluation criteria, it was found that females placed more
importance on the criteria than males. However, both females and males had an average mean
for the criteria that was above average in importance.
Table 53 Importance of evaluation criteria by gender
Mean Evaluation Criteria Female Male Promptness in Obtaining Information 4.161 3.810 Convenience in Obtaining Information 3.903 3.905 Accuracy of Information 4.161 3.729 Coverage of Topic 3.967 3.716 Objectivity of Publisher 3.612 3.486 Currency of Information 3.451 3.445 Cost of Obtaining Information 3.903 3.027 Authority of Publisher 3.193 3.135 Interactivity with Website 3.354 3.013 Average mean 3.745 3.474 Note: The incremental scale used ranged from 1 to 5 with 1 being not important, 3 for average, and 5 for very important.
4.5.2 By Primary Journalistic Beat
Five significant differences were found when the data was analyzed by primary journalistic beat.
The differences occurred for Promptness, Accuracy, Coverage, Objectivity, and Authority. A
Tukey post-hoc test was conducted to identify which beats were significantly different. The
major finding was that the Sports/Entertainment beat differed significantly than the other beats.
120
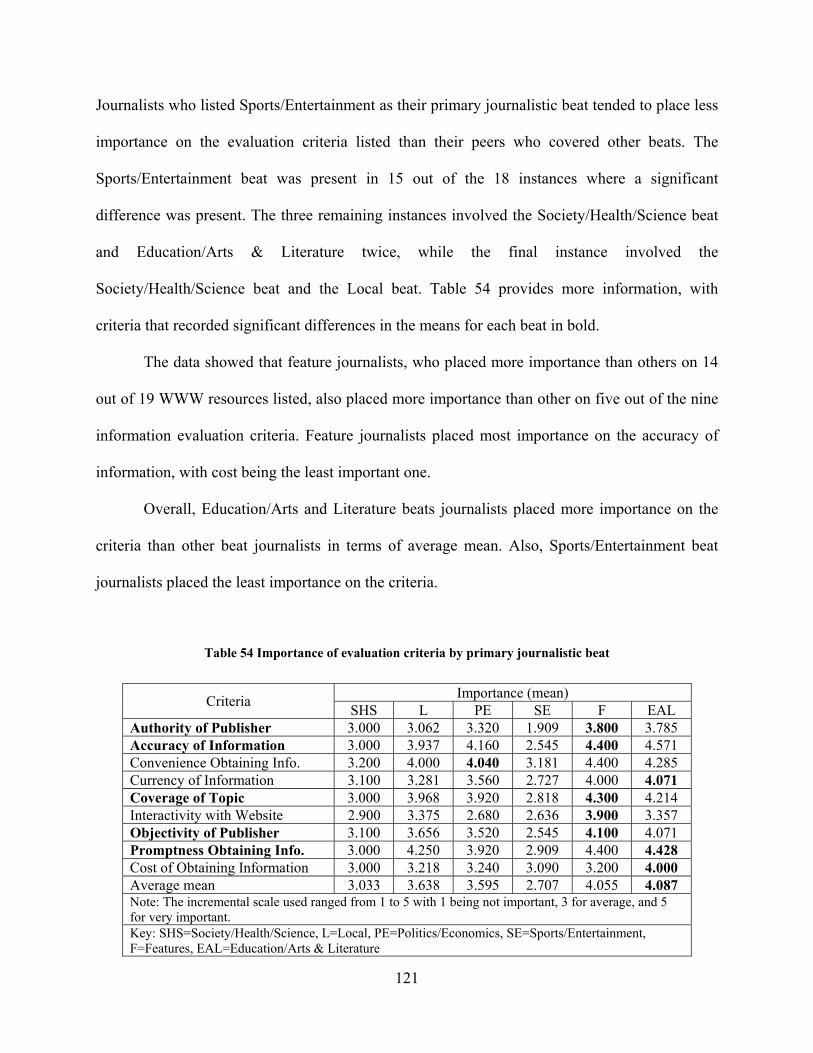
Journalists who listed Sports/Entertainment as their primary journalistic beat tended to place less
importance on the evaluation criteria listed than their peers who covered other beats. The
Sports/Entertainment beat was present in 15 out of the 18 instances where a significant
difference was present. The three remaining instances involved the Society/Health/Science beat
and Education/Arts & Literature twice, while the final instance involved the
Society/Health/Science beat and the Local beat. Table 54 provides more information, with
criteria that recorded significant differences in the means for each beat in bold.
The data showed that feature journalists, who placed more importance than others on 14
out of 19 WWW resources listed, also placed more importance than other on five out of the nine
information evaluation criteria. Feature journalists placed most importance on the accuracy of
information, with cost being the least important one.
Overall, Education/Arts and Literature beats journalists placed more importance on the
criteria than other beat journalists in terms of average mean. Also, Sports/Entertainment beat
journalists placed the least importance on the criteria.
Table 54 Importance of evaluation criteria by primary journalistic beat
Importance (mean) Criteria SHS L PE SE F EAL Authority of Publisher 3.000 3.062 3.320 1.909 3.800 3.785 Accuracy of Information 3.000 3.937 4.160 2.545 4.400 4.571 Convenience Obtaining Info. 3.200 4.000 4.040 3.181 4.400 4.285 Currency of Information 3.100 3.281 3.560 2.727 4.000 4.071 Coverage of Topic 3.000 3.968 3.920 2.818 4.300 4.214 Interactivity with Website 2.900 3.375 2.680 2.636 3.900 3.357 Objectivity of Publisher 3.100 3.656 3.520 2.545 4.100 4.071 Promptness Obtaining Info. 3.000 4.250 3.920 2.909 4.400 4.428 Cost of Obtaining Information 3.000 3.218 3.240 3.090 3.200 4.000 Average mean 3.033 3.638 3.595 2.707 4.055 4.087 Note: The incremental scale used ranged from 1 to 5 with 1 being not important, 3 for average, and 5 for very important. Key: SHS=Society/Health/Science, L=Local, PE=Politics/Economics, SE=Sports/Entertainment, F=Features, EAL=Education/Arts & Literature
121
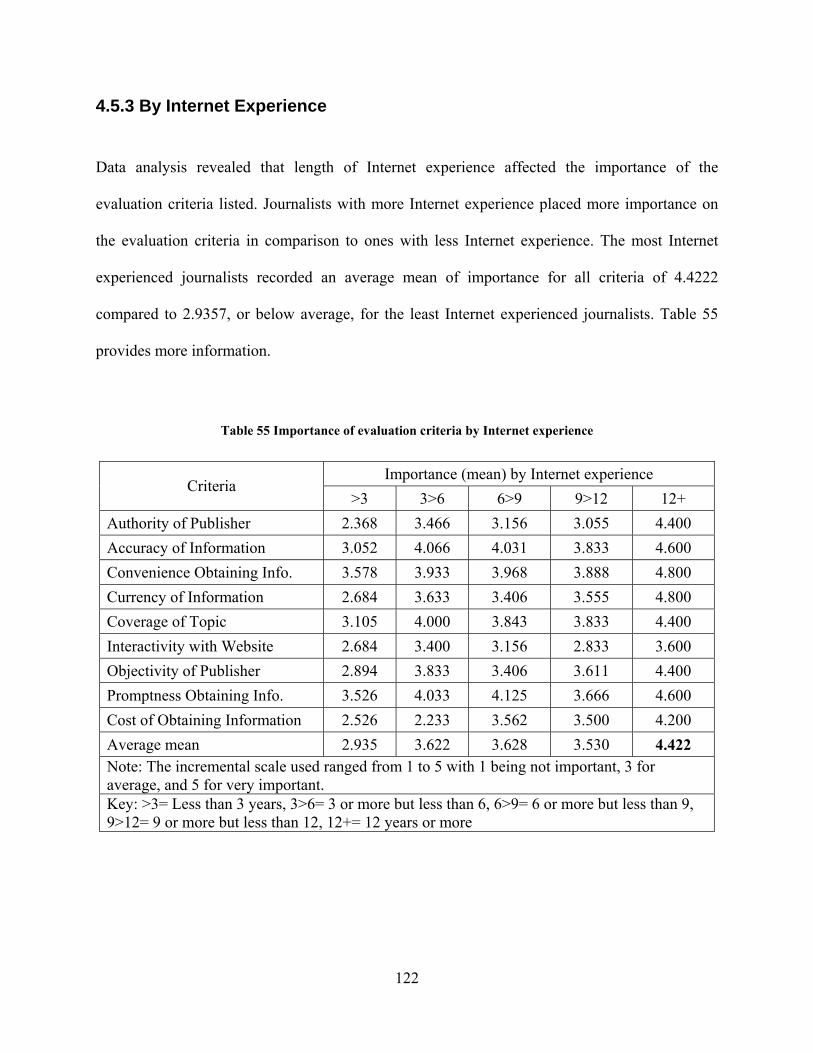
4.5.3 By Internet Experience
Data analysis revealed that length of Internet experience affected the importance of the
evaluation criteria listed. Journalists with more Internet experience placed more importance on
the evaluation criteria in comparison to ones with less Internet experience. The most Internet
experienced journalists recorded an average mean of importance for all criteria of 4.4222
compared to 2.9357, or below average, for the least Internet experienced journalists. Table 55
provides more information.
Table 55 Importance of evaluation criteria by Internet experience
Importance (mean) by Internet experience Criteria
>3 3>6 6>9 9>12 12+ Authority of Publisher 2.368 3.466 3.156 3.055 4.400 Accuracy of Information 3.052 4.066 4.031 3.833 4.600 Convenience Obtaining Info. 3.578 3.933 3.968 3.888 4.800 Currency of Information 2.684 3.633 3.406 3.555 4.800 Coverage of Topic 3.105 4.000 3.843 3.833 4.400 Interactivity with Website 2.684 3.400 3.156 2.833 3.600 Objectivity of Publisher 2.894 3.833 3.406 3.611 4.400 Promptness Obtaining Info. 3.526 4.033 4.125 3.666 4.600 Cost of Obtaining Information 2.526 2.233 3.562 3.500 4.200 Average mean 2.935 3.622 3.628 3.530 4.422 Note: The incremental scale used ranged from 1 to 5 with 1 being not important, 3 for average, and 5 for very important. Key: >3= Less than 3 years, 3>6= 3 or more but less than 6, 6>9= 6 or more but less than 9, 9>12= 9 or more but less than 12, 12+= 12 years or more
122
4.5.4 By Other Variables
Data analysis of the evaluation criteria by age, length of experience as a journalist, citizenship,
primary field of study, and the number of languages known yielded no significant differences
between the groups. However, the location of the educational institution that the respondent
graduated from and level of education reflected one significant difference between the groups.
The location of the educational institution affected the Interactivity with Website
criterion. The Tukey Post Hoc test revealed that respondents who graduated from North America
or Europe placed significantly more importance (mean=3.9091) on Interactivity than their
counterparts who graduated from an institution in the Middle East (mean=2.8049).
As for level of education, the groups differed significantly for the Promptness criterion
(Sig. =.017). High-school or lower respondents (mean=4.4500) placed more importance on
Promptness in obtaining information than respondents who held a Master’s degree or higher
(mean=3.0909).
4.6 RQ4- INTERNET AND JOURNALISTIC TASKS
Data analysis revealed that finding difficult-to-find facts was the most important task that the
Internet was used for in terms of completing journalistic tasks. On a scale ranging from 1 for not
important, and 5 for very important, respondents viewed finding difficult-to-find facts, finding
latest news to put in story, and finding documents to cite in a news item, as the top three tasks
where Internet use was important. Using the Internet was less important for defining terms of
123
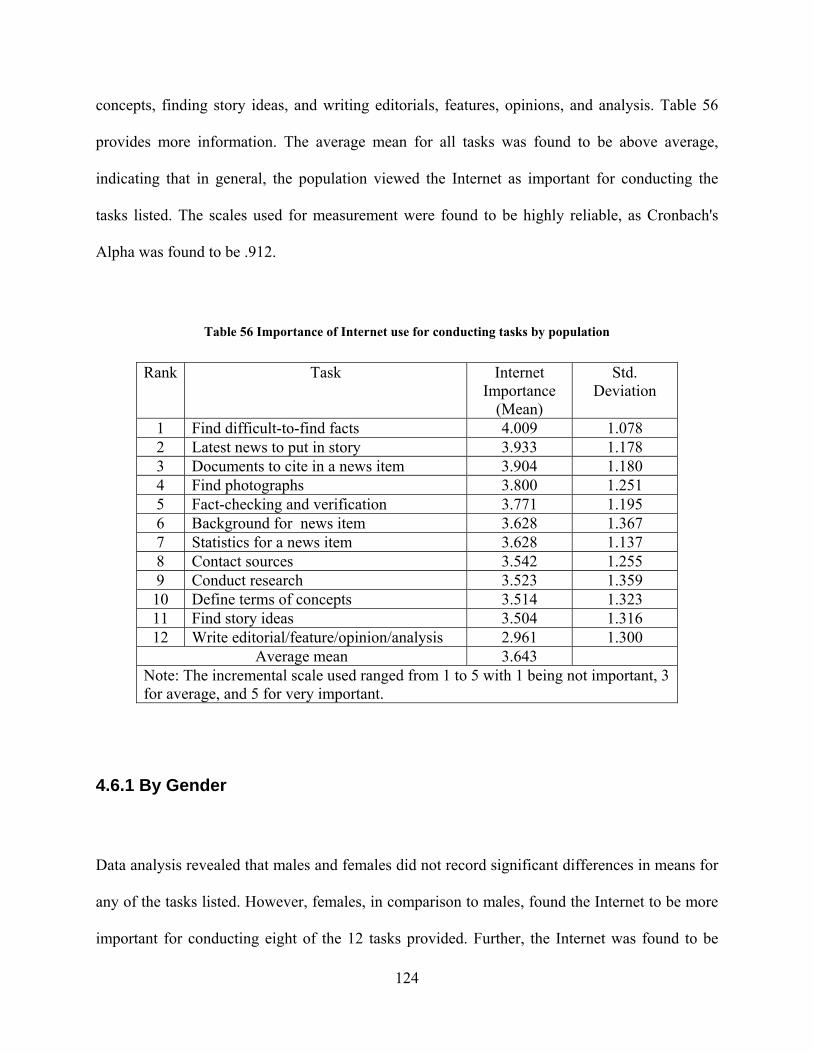
concepts, finding story ideas, and writing editorials, features, opinions, and analysis. Table 56
provides more information. The average mean for all tasks was found to be above average,
indicating that in general, the population viewed the Internet as important for conducting the
tasks listed. The scales used for measurement were found to be highly reliable, as Cronbach's
Alpha was found to be .912.
Table 56 Importance of Internet use for conducting tasks by population
Rank Task Internet Importance
(Mean)
Std. Deviation
1 Find difficult-to-find facts 4.009 1.078 2 Latest news to put in story 3.933 1.178 3 Documents to cite in a news item 3.904 1.180 4 Find photographs 3.800 1.251 5 Fact-checking and verification 3.771 1.195 6 Background for news item 3.628 1.367 7 Statistics for a news item 3.628 1.137 8 Contact sources 3.542 1.255 9 Conduct research 3.523 1.359 10 Define terms of concepts 3.514 1.323 11 Find story ideas 3.504 1.316 12 Write editorial/feature/opinion/analysis 2.961 1.300
Average mean 3.643 Note: The incremental scale used ranged from 1 to 5 with 1 being not important, 3 for average, and 5 for very important.
4.6.1 By Gender
Data analysis revealed that males and females did not record significant differences in means for
any of the tasks listed. However, females, in comparison to males, found the Internet to be more
important for conducting eight of the 12 tasks provided. Further, the Internet was found to be
124
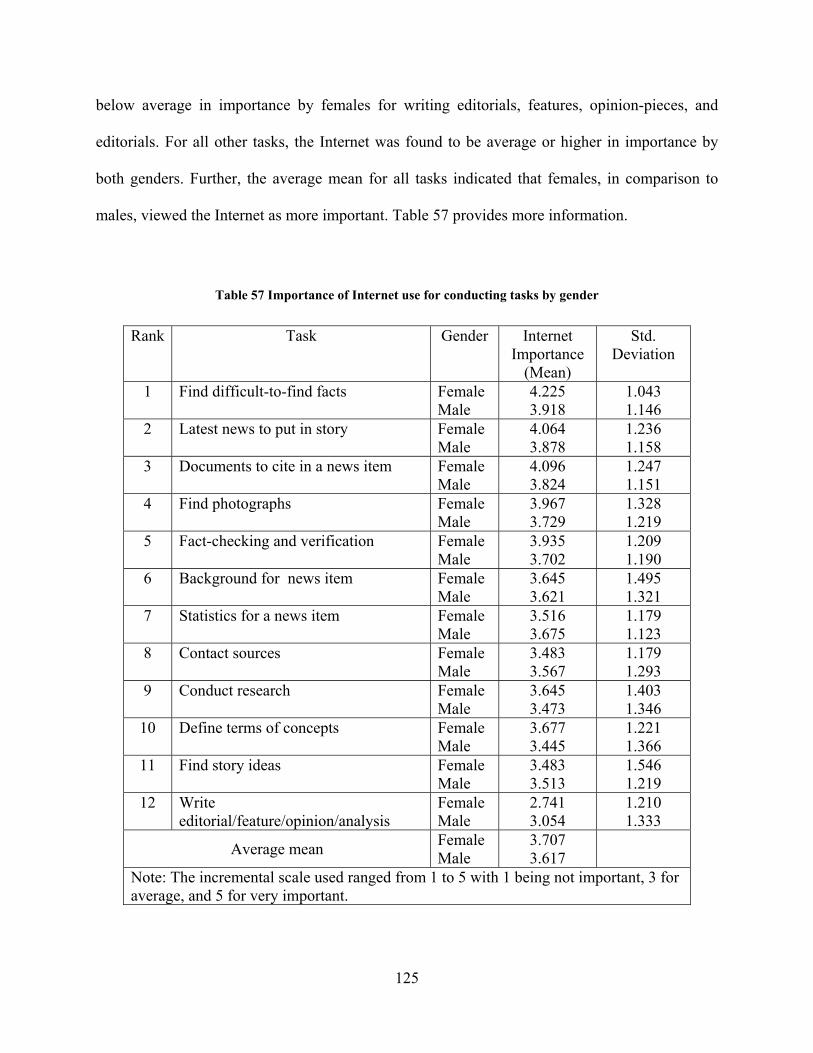
below average in importance by females for writing editorials, features, opinion-pieces, and
editorials. For all other tasks, the Internet was found to be average or higher in importance by
both genders. Further, the average mean for all tasks indicated that females, in comparison to
males, viewed the Internet as more important. Table 57 provides more information.
Table 57 Importance of Internet use for conducting tasks by gender
Rank Task Gender Internet Importance
(Mean)
Std. Deviation
1 Find difficult-to-find facts Female Male
4.225 3.918
1.043 1.146
2 Latest news to put in story Female Male
4.064 3.878
1.236 1.158
3 Documents to cite in a news item Female Male
4.096 3.824
1.247 1.151
4 Find photographs Female Male
3.967 3.729
1.328 1.219
5 Fact-checking and verification Female Male
3.935 3.702
1.209 1.190
6 Background for news item Female Male
3.645 3.621
1.495 1.321
7 Statistics for a news item Female Male
3.516 3.675
1.179 1.123
8 Contact sources Female Male
3.483 3.567
1.179 1.293
9 Conduct research Female Male
3.645 3.473
1.403 1.346
10 Define terms of concepts Female Male
3.677 3.445
1.221 1.366
11 Find story ideas Female Male
3.483 3.513
1.546 1.219
12 Write editorial/feature/opinion/analysis
Female Male
2.741 3.054
1.210 1.333
Average mean Female Male
3.707 3.617
Note: The incremental scale used ranged from 1 to 5 with 1 being not important, 3 for average, and 5 for very important.
125

4.6.2 By Age
Analyzing the data by age revealed two significant differences. Both instances were between the
same age groups- Younger than 25 years and 40 years or older. The younger respondents place
more importance on using the Internet to find difficult-to-find facts and fact-checking and
verification than their older counterparts.
Further, results showed that the youngest journalists, younger than 25 years old, were the
biggest group indicating the Internet was important for conducting 11 out of the 12 tasks listed.
Finding difficult-to-find facts was the most important task requiring Internet use as indicated by
the youngest journalists. The same age group indicated that using the Internet was least
important for writing editorials, etc. The average mean supported earlier findings, indicating that
the youngest journalists viewed the Internet as important for all the tasks more than the other age
groups. The oldest age group was the one that placed least importance, by average mean, on the
Internet for conducting the tasks listed. Table 58 provides more information, with tasks recording
significant differences in the means of the age groups in bold.
126
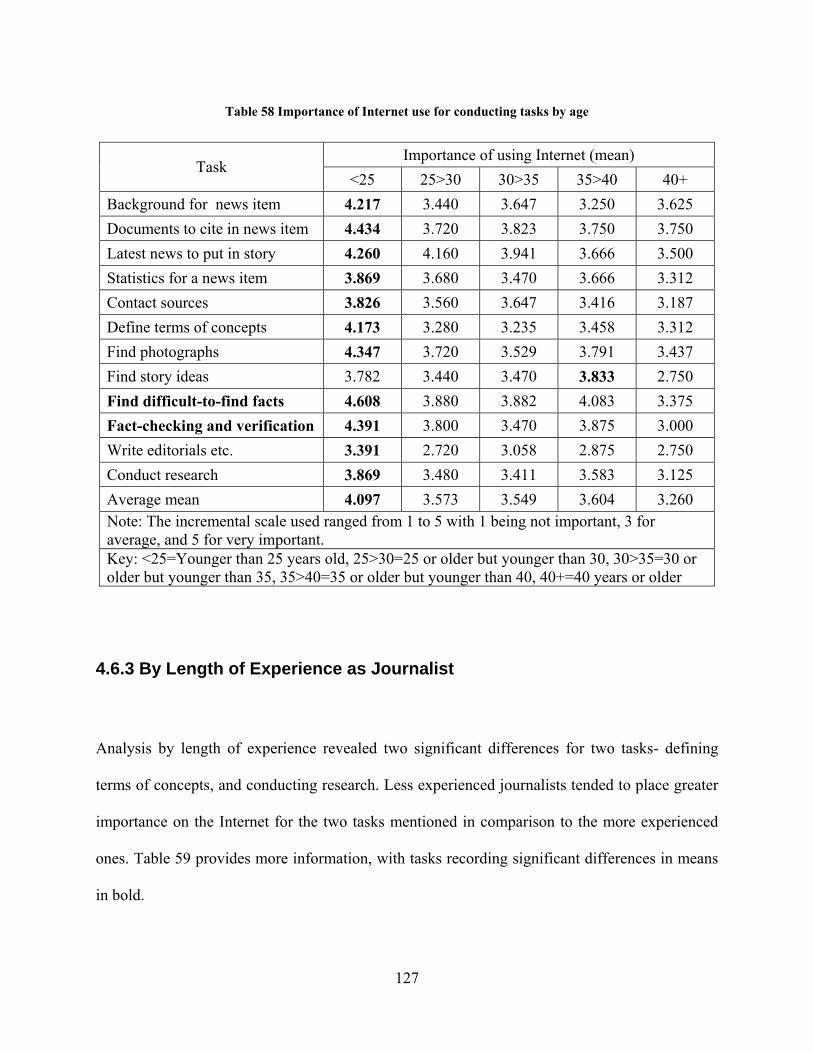
Table 58 Importance of Internet use for conducting tasks by age
Importance of using Internet (mean) Task
<25 25>30 30>35 35>40 40+ Background for news item 4.217 3.440 3.647 3.250 3.625 Documents to cite in news item 4.434 3.720 3.823 3.750 3.750 Latest news to put in story 4.260 4.160 3.941 3.666 3.500 Statistics for a news item 3.869 3.680 3.470 3.666 3.312 Contact sources 3.826 3.560 3.647 3.416 3.187 Define terms of concepts 4.173 3.280 3.235 3.458 3.312 Find photographs 4.347 3.720 3.529 3.791 3.437 Find story ideas 3.782 3.440 3.470 3.833 2.750 Find difficult-to-find facts 4.608 3.880 3.882 4.083 3.375 Fact-checking and verification 4.391 3.800 3.470 3.875 3.000 Write editorials etc. 3.391 2.720 3.058 2.875 2.750 Conduct research 3.869 3.480 3.411 3.583 3.125 Average mean 4.097 3.573 3.549 3.604 3.260 Note: The incremental scale used ranged from 1 to 5 with 1 being not important, 3 for average, and 5 for very important. Key: <25=Younger than 25 years old, 25>30=25 or older but younger than 30, 30>35=30 or older but younger than 35, 35>40=35 or older but younger than 40, 40+=40 years or older
4.6.3 By Length of Experience as Journalist
Analysis by length of experience revealed two significant differences for two tasks- defining
terms of concepts, and conducting research. Less experienced journalists tended to place greater
importance on the Internet for the two tasks mentioned in comparison to the more experienced
ones. Table 59 provides more information, with tasks recording significant differences in means
in bold.
127
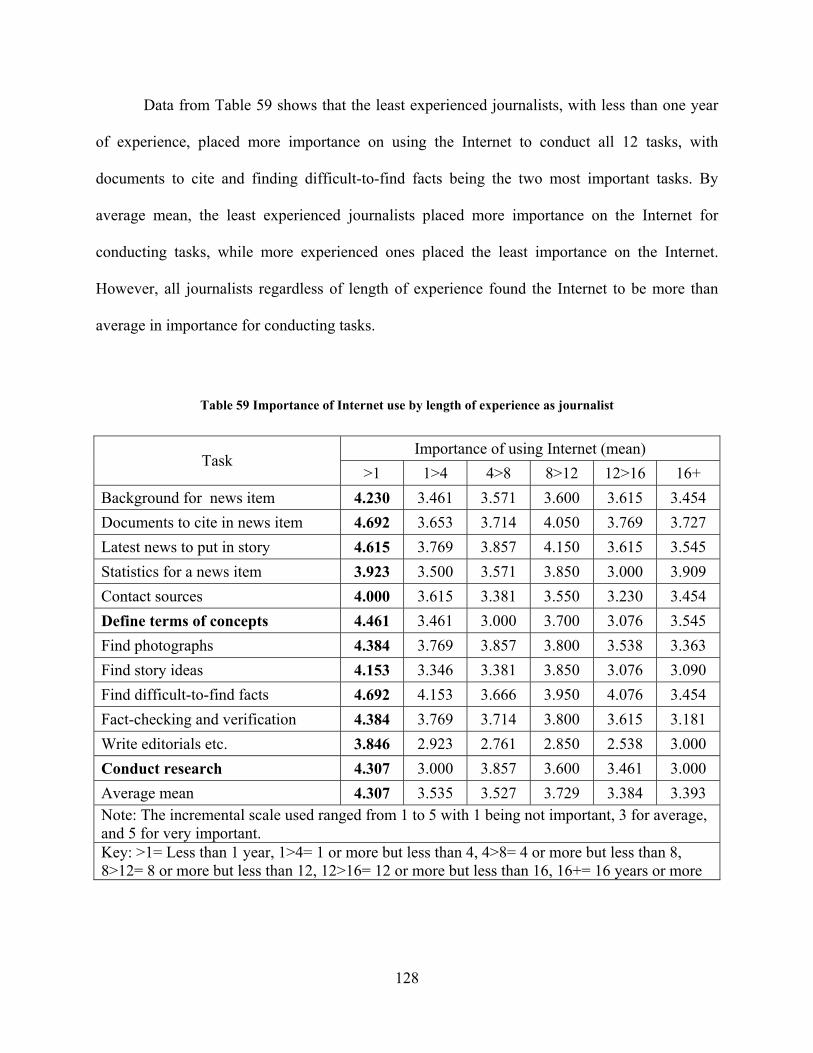
Data from Table 59 shows that the least experienced journalists, with less than one year
of experience, placed more importance on using the Internet to conduct all 12 tasks, with
documents to cite and finding difficult-to-find facts being the two most important tasks. By
average mean, the least experienced journalists placed more importance on the Internet for
conducting tasks, while more experienced ones placed the least importance on the Internet.
However, all journalists regardless of length of experience found the Internet to be more than
average in importance for conducting tasks.
Table 59 Importance of Internet use by length of experience as journalist
Importance of using Internet (mean) Task
>1 1>4 4>8 8>12 12>16 16+ Background for news item 4.230 3.461 3.571 3.600 3.615 3.454 Documents to cite in news item 4.692 3.653 3.714 4.050 3.769 3.727 Latest news to put in story 4.615 3.769 3.857 4.150 3.615 3.545 Statistics for a news item 3.923 3.500 3.571 3.850 3.000 3.909 Contact sources 4.000 3.615 3.381 3.550 3.230 3.454 Define terms of concepts 4.461 3.461 3.000 3.700 3.076 3.545 Find photographs 4.384 3.769 3.857 3.800 3.538 3.363 Find story ideas 4.153 3.346 3.381 3.850 3.076 3.090 Find difficult-to-find facts 4.692 4.153 3.666 3.950 4.076 3.454 Fact-checking and verification 4.384 3.769 3.714 3.800 3.615 3.181 Write editorials etc. 3.846 2.923 2.761 2.850 2.538 3.000 Conduct research 4.307 3.000 3.857 3.600 3.461 3.000 Average mean 4.307 3.535 3.527 3.729 3.384 3.393 Note: The incremental scale used ranged from 1 to 5 with 1 being not important, 3 for average, and 5 for very important. Key: >1= Less than 1 year, 1>4= 1 or more but less than 4, 4>8= 4 or more but less than 8, 8>12= 8 or more but less than 12, 12>16= 12 or more but less than 16, 16+= 16 years or more
128
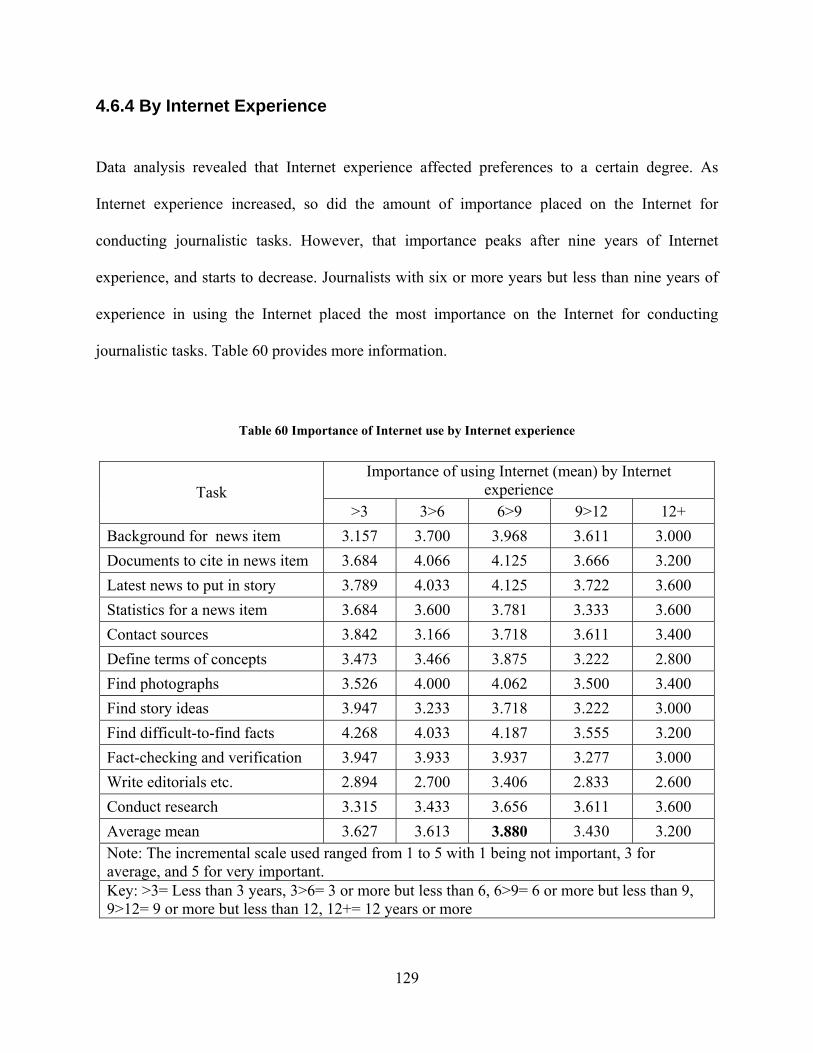
4.6.4 By Internet Experience
Data analysis revealed that Internet experience affected preferences to a certain degree. As
Internet experience increased, so did the amount of importance placed on the Internet for
conducting journalistic tasks. However, that importance peaks after nine years of Internet
experience, and starts to decrease. Journalists with six or more years but less than nine years of
experience in using the Internet placed the most importance on the Internet for conducting
journalistic tasks. Table 60 provides more information.
Table 60 Importance of Internet use by Internet experience
Importance of using Internet (mean) by Internet experience Task
>3 3>6 6>9 9>12 12+ Background for news item 3.157 3.700 3.968 3.611 3.000 Documents to cite in news item 3.684 4.066 4.125 3.666 3.200 Latest news to put in story 3.789 4.033 4.125 3.722 3.600 Statistics for a news item 3.684 3.600 3.781 3.333 3.600 Contact sources 3.842 3.166 3.718 3.611 3.400 Define terms of concepts 3.473 3.466 3.875 3.222 2.800 Find photographs 3.526 4.000 4.062 3.500 3.400 Find story ideas 3.947 3.233 3.718 3.222 3.000 Find difficult-to-find facts 4.268 4.033 4.187 3.555 3.200 Fact-checking and verification 3.947 3.933 3.937 3.277 3.000 Write editorials etc. 2.894 2.700 3.406 2.833 2.600 Conduct research 3.315 3.433 3.656 3.611 3.600 Average mean 3.627 3.613 3.880 3.430 3.200 Note: The incremental scale used ranged from 1 to 5 with 1 being not important, 3 for average, and 5 for very important. Key: >3= Less than 3 years, 3>6= 3 or more but less than 6, 6>9= 6 or more but less than 9, 9>12= 9 or more but less than 12, 12+= 12 years or more
129
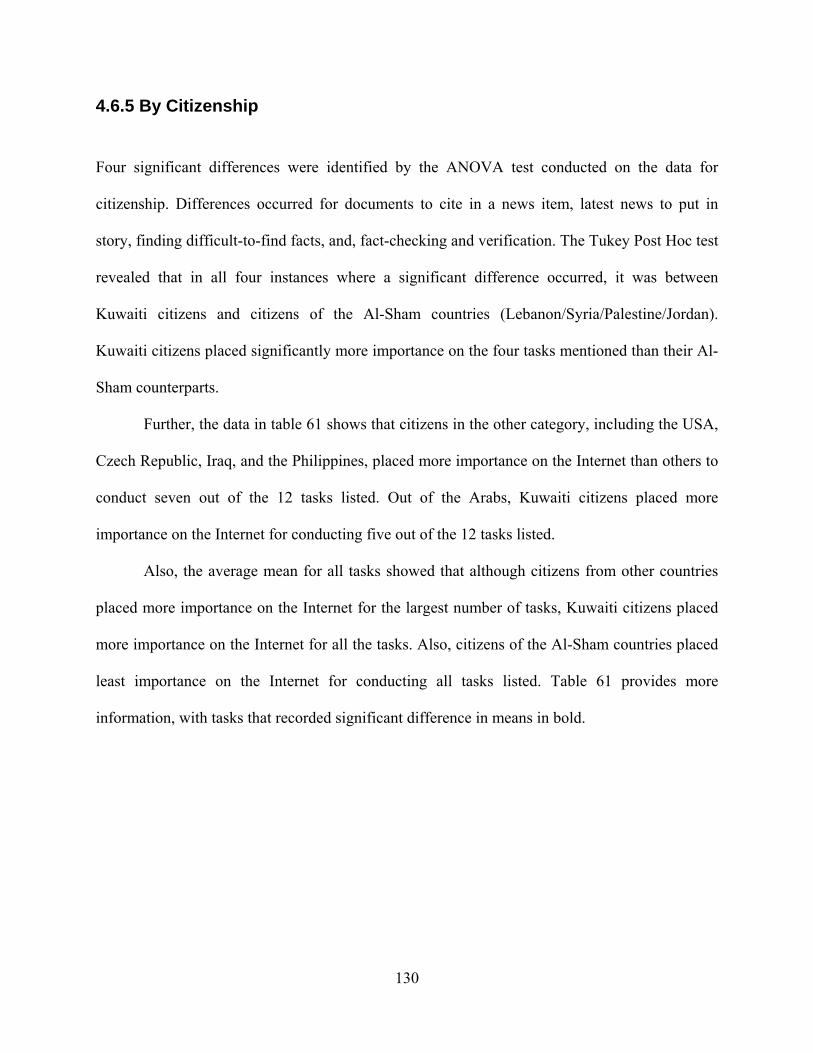
4.6.5 By Citizenship
Four significant differences were identified by the ANOVA test conducted on the data for
citizenship. Differences occurred for documents to cite in a news item, latest news to put in
story, finding difficult-to-find facts, and, fact-checking and verification. The Tukey Post Hoc test
revealed that in all four instances where a significant difference occurred, it was between
Kuwaiti citizens and citizens of the Al-Sham countries (Lebanon/Syria/Palestine/Jordan).
Kuwaiti citizens placed significantly more importance on the four tasks mentioned than their Al-
Sham counterparts.
Further, the data in table 61 shows that citizens in the other category, including the USA,
Czech Republic, Iraq, and the Philippines, placed more importance on the Internet than others to
conduct seven out of the 12 tasks listed. Out of the Arabs, Kuwaiti citizens placed more
importance on the Internet for conducting five out of the 12 tasks listed.
Also, the average mean for all tasks showed that although citizens from other countries
placed more importance on the Internet for the largest number of tasks, Kuwaiti citizens placed
more importance on the Internet for all the tasks. Also, citizens of the Al-Sham countries placed
least importance on the Internet for conducting all tasks listed. Table 61 provides more
information, with tasks that recorded significant difference in means in bold.
130
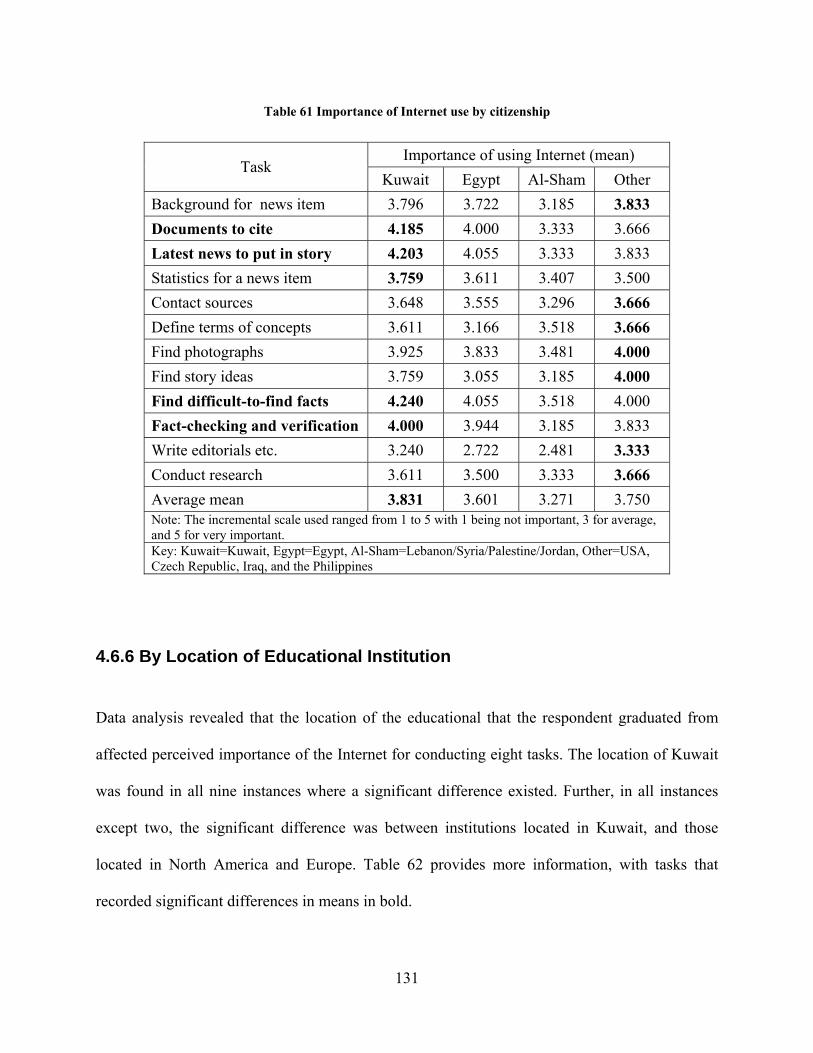
Table 61 Importance of Internet use by citizenship
Importance of using Internet (mean) Task
Kuwait Egypt Al-Sham Other Background for news item 3.796 3.722 3.185 3.833 Documents to cite 4.185 4.000 3.333 3.666 Latest news to put in story 4.203 4.055 3.333 3.833 Statistics for a news item 3.759 3.611 3.407 3.500 Contact sources 3.648 3.555 3.296 3.666 Define terms of concepts 3.611 3.166 3.518 3.666 Find photographs 3.925 3.833 3.481 4.000 Find story ideas 3.759 3.055 3.185 4.000 Find difficult-to-find facts 4.240 4.055 3.518 4.000 Fact-checking and verification 4.000 3.944 3.185 3.833 Write editorials etc. 3.240 2.722 2.481 3.333 Conduct research 3.611 3.500 3.333 3.666 Average mean 3.831 3.601 3.271 3.750 Note: The incremental scale used ranged from 1 to 5 with 1 being not important, 3 for average, and 5 for very important. Key: Kuwait=Kuwait, Egypt=Egypt, Al-Sham=Lebanon/Syria/Palestine/Jordan, Other=USA, Czech Republic, Iraq, and the Philippines
4.6.6 By Location of Educational Institution
Data analysis revealed that the location of the educational that the respondent graduated from
affected perceived importance of the Internet for conducting eight tasks. The location of Kuwait
was found in all nine instances where a significant difference existed. Further, in all instances
except two, the significant difference was between institutions located in Kuwait, and those
located in North America and Europe. Table 62 provides more information, with tasks that
recorded significant differences in means in bold.
131
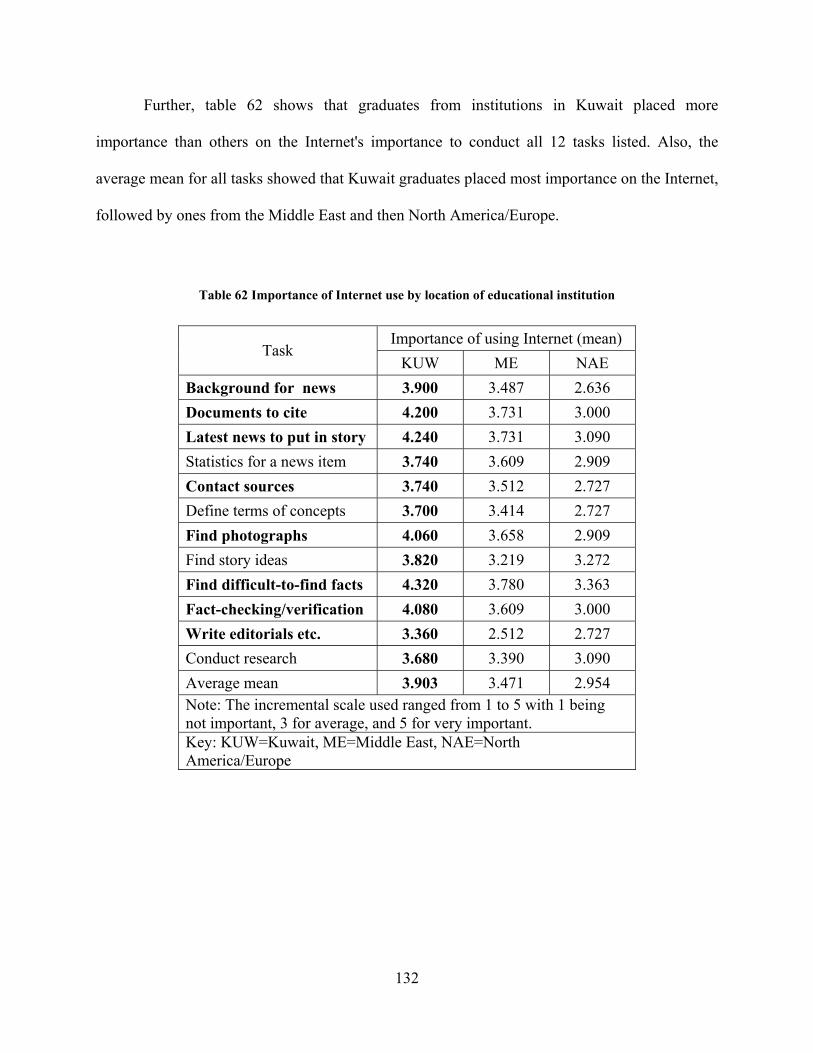
Further, table 62 shows that graduates from institutions in Kuwait placed more
importance than others on the Internet's importance to conduct all 12 tasks listed. Also, the
average mean for all tasks showed that Kuwait graduates placed most importance on the Internet,
followed by ones from the Middle East and then North America/Europe.
Table 62 Importance of Internet use by location of educational institution
Importance of using Internet (mean) Task
KUW ME NAE Background for news 3.900 3.487 2.636 Documents to cite 4.200 3.731 3.000 Latest news to put in story 4.240 3.731 3.090 Statistics for a news item 3.740 3.609 2.909 Contact sources 3.740 3.512 2.727 Define terms of concepts 3.700 3.414 2.727 Find photographs 4.060 3.658 2.909 Find story ideas 3.820 3.219 3.272 Find difficult-to-find facts 4.320 3.780 3.363 Fact-checking/verification 4.080 3.609 3.000 Write editorials etc. 3.360 2.512 2.727 Conduct research 3.680 3.390 3.090 Average mean 3.903 3.471 2.954 Note: The incremental scale used ranged from 1 to 5 with 1 being not important, 3 for average, and 5 for very important. Key: KUW=Kuwait, ME=Middle East, NAE=North America/Europe
132
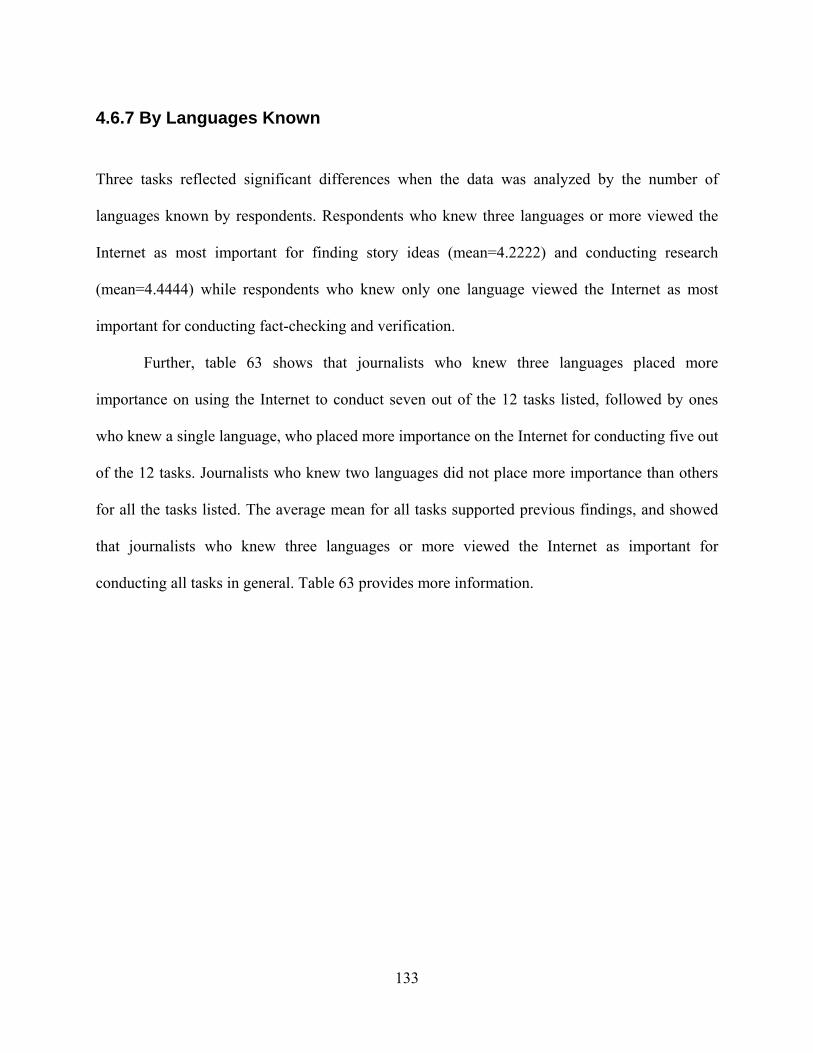
4.6.7 By Languages Known
Three tasks reflected significant differences when the data was analyzed by the number of
languages known by respondents. Respondents who knew three languages or more viewed the
Internet as most important for finding story ideas (mean=4.2222) and conducting research
(mean=4.4444) while respondents who knew only one language viewed the Internet as most
important for conducting fact-checking and verification.
Further, table 63 shows that journalists who knew three languages placed more
importance on using the Internet to conduct seven out of the 12 tasks listed, followed by ones
who knew a single language, who placed more importance on the Internet for conducting five out
of the 12 tasks. Journalists who knew two languages did not place more importance than others
for all the tasks listed. The average mean for all tasks supported previous findings, and showed
that journalists who knew three languages or more viewed the Internet as important for
conducting all tasks in general. Table 63 provides more information.
133
Table 63 Importance of Internet use by number of languages
Importance of using Internet (mean) Task
1 2 3+ Background for news 3.800 3.454 4.277 Documents to cite 4.000 3.779 4.388 Latest news to put in story 4.000 3.844 4.277 Statistics for a news item 4.000 3.532 3.833 Contact sources 3.700 3.506 3.611 Define terms of concepts 3.700 3.363 4.055 Find photographs 4.400 3.662 4.055 Find story ideas 3.600 3.324 4.222 Find difficult-to-find facts 4.600 3.844 4.388 Fact-checking/verification 4.600 3.584 4.111 Write editorials etc. 2.100 3.000 3.277 Conduct research 2.700 3.415 4.444 Average mean 3.766 3.526 4.078 Note: The incremental scale used ranged from 1 to 5 with 1 being not important, 3 for average, and 5 for very important. Key: 1= One language, 2= Two languages, 3+= Three or more languages known
4.6.8 By Other Variables
Data analysis by primary journalistic beat, level of education, and major field of study revealed
no significant differences between the groups. Therefore, results will not be displayed.
134
4.7 RQ5- INTERNET FOR INFORMATION
The population was asked to indicate the likeliness of them using the Internet to find specific
types of information, such as information related to society, economics, politics, etc. An
incremental scale that commenced with 1 for less likely to use the Internet, 3 for average, and 5
for more likely, was provided.
Data analysis showed that the most likely type of news that would point journalists to the
Internet was Political (mean=3.2286), followed by Arts and Culture, and Tourism. From the data,
it is less likely that journalists would use the Internet to find information about Entertainment,
Security and Defense, and Energy and Industrial (mean=2.4095).
Despite these findings, the data showed that in general, journalists are less likely to use
the Internet to find information about any type or coverage, as the highest type or coverage,
political, recorded a mean that was fractionally above average on the evaluation scale. Further,
the population's average mean for all information types listed was below average, indicating that
journalists were less likely to use the Internet to search for any of the information types listed.
Table 64 provides more information. The scales were found to be highly reliable as Cronbach's
Alpha was found to be .896.
135
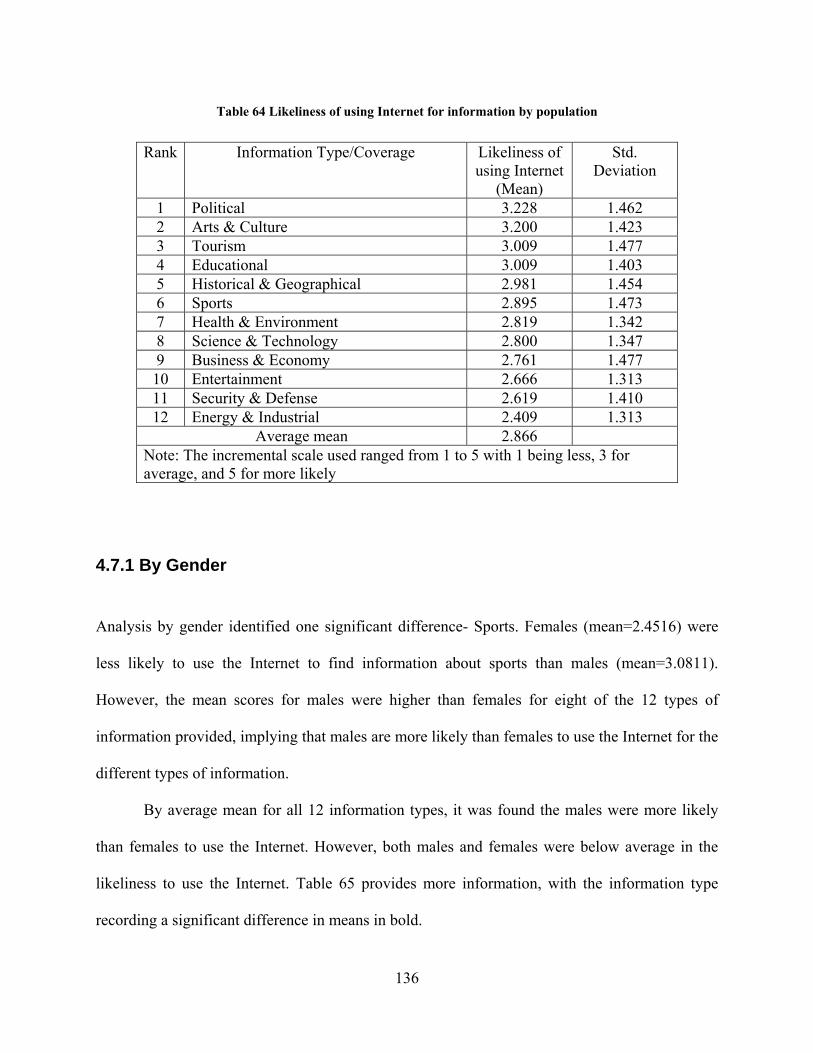
Table 64 Likeliness of using Internet for information by population
Rank Information Type/Coverage Likeliness of using Internet
(Mean)
Std. Deviation
1 Political 3.228 1.462 2 Arts & Culture 3.200 1.423 3 Tourism 3.009 1.477 4 Educational 3.009 1.403 5 Historical & Geographical 2.981 1.454 6 Sports 2.895 1.473 7 Health & Environment 2.819 1.342 8 Science & Technology 2.800 1.347 9 Business & Economy 2.761 1.477 10 Entertainment 2.666 1.313 11 Security & Defense 2.619 1.410 12 Energy & Industrial 2.409 1.313
Average mean 2.866 Note: The incremental scale used ranged from 1 to 5 with 1 being less, 3 for average, and 5 for more likely
4.7.1 By Gender
Analysis by gender identified one significant difference- Sports. Females (mean=2.4516) were
less likely to use the Internet to find information about sports than males (mean=3.0811).
However, the mean scores for males were higher than females for eight of the 12 types of
information provided, implying that males are more likely than females to use the Internet for the
different types of information.
By average mean for all 12 information types, it was found the males were more likely
than females to use the Internet. However, both males and females were below average in the
likeliness to use the Internet. Table 65 provides more information, with the information type
recording a significant difference in means in bold.
136
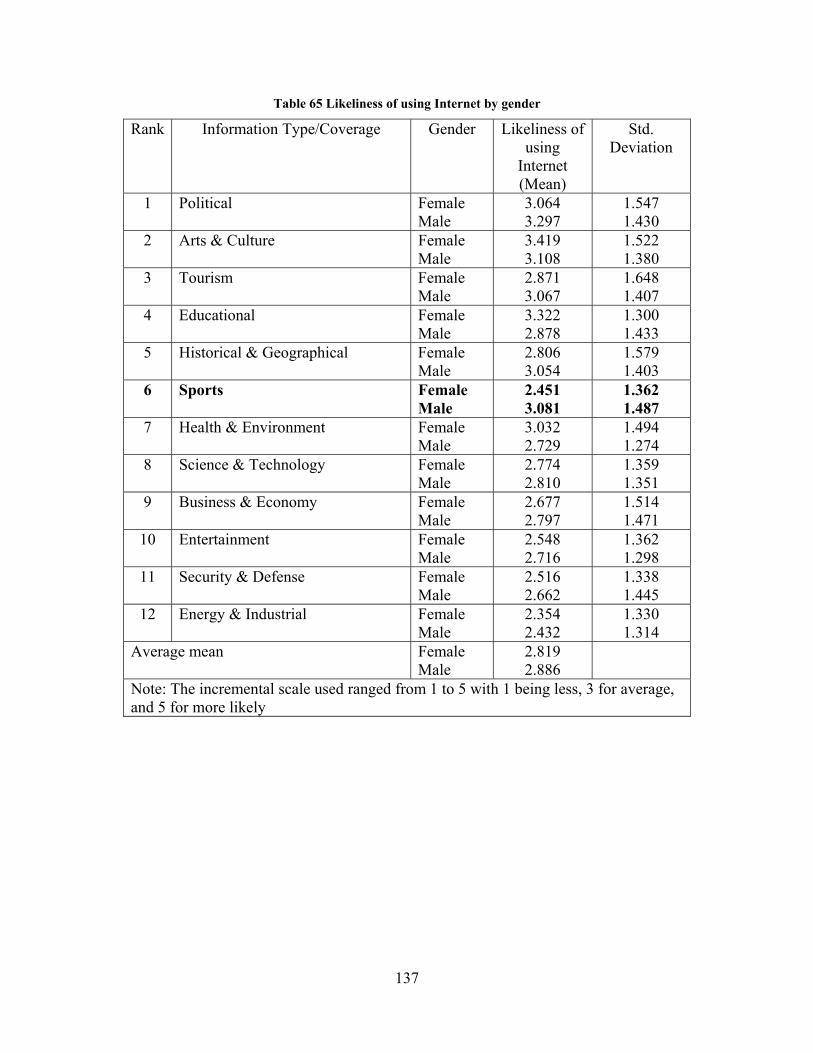
Table 65 Likeliness of using Internet by gender
Rank Information Type/Coverage Gender Likeliness of using
Internet (Mean)
Std. Deviation
1 Political Female Male
3.064 3.297
1.547 1.430
2 Arts & Culture Female Male
3.419 3.108
1.522 1.380
3 Tourism Female Male
2.871 3.067
1.648 1.407
4 Educational Female Male
3.322 2.878
1.300 1.433
5 Historical & Geographical Female Male
2.806 3.054
1.579 1.403
6 Sports Female Male
2.451 3.081
1.362 1.487
7 Health & Environment Female Male
3.032 2.729
1.494 1.274
8 Science & Technology Female Male
2.774 2.810
1.359 1.351
9 Business & Economy Female Male
2.677 2.797
1.514 1.471
10 Entertainment Female Male
2.548 2.716
1.362 1.298
11 Security & Defense Female Male
2.516 2.662
1.338 1.445
12 Energy & Industrial Female Male
2.354 2.432
1.330 1.314
Average mean Female Male
2.819 2.886
Note: The incremental scale used ranged from 1 to 5 with 1 being less, 3 for average, and 5 for more likely
137
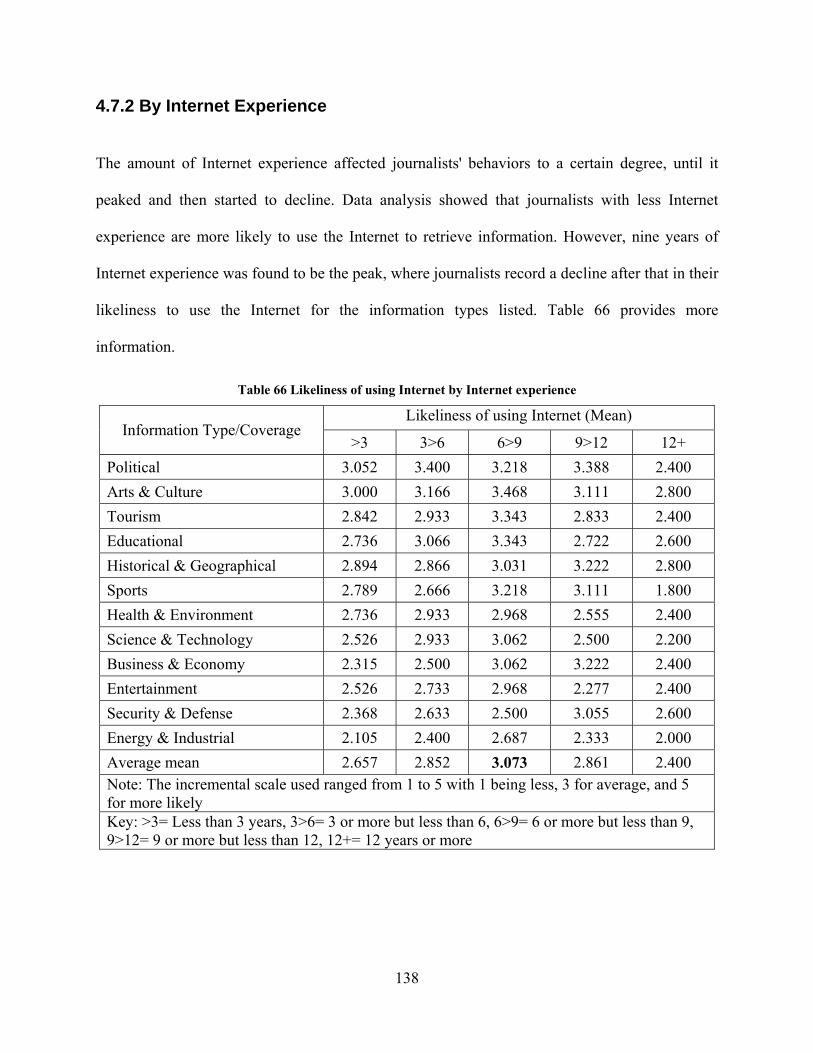
4.7.2 By Internet Experience The amount of Internet experience affected journalists' behaviors to a certain degree, until it
peaked and then started to decline. Data analysis showed that journalists with less Internet
experience are more likely to use the Internet to retrieve information. However, nine years of
Internet experience was found to be the peak, where journalists record a decline after that in their
likeliness to use the Internet for the information types listed. Table 66 provides more
information.
Table 66 Likeliness of using Internet by Internet experience
Likeliness of using Internet (Mean) Information Type/Coverage
>3 3>6 6>9 9>12 12+ Political 3.052 3.400 3.218 3.388 2.400 Arts & Culture 3.000 3.166 3.468 3.111 2.800 Tourism 2.842 2.933 3.343 2.833 2.400 Educational 2.736 3.066 3.343 2.722 2.600 Historical & Geographical 2.894 2.866 3.031 3.222 2.800 Sports 2.789 2.666 3.218 3.111 1.800 Health & Environment 2.736 2.933 2.968 2.555 2.400 Science & Technology 2.526 2.933 3.062 2.500 2.200 Business & Economy 2.315 2.500 3.062 3.222 2.400 Entertainment 2.526 2.733 2.968 2.277 2.400 Security & Defense 2.368 2.633 2.500 3.055 2.600 Energy & Industrial 2.105 2.400 2.687 2.333 2.000 Average mean 2.657 2.852 3.073 2.861 2.400 Note: The incremental scale used ranged from 1 to 5 with 1 being less, 3 for average, and 5 for more likely Key: >3= Less than 3 years, 3>6= 3 or more but less than 6, 6>9= 6 or more but less than 9, 9>12= 9 or more but less than 12, 12+= 12 years or more
138
4.7.3 By Level of Education
The one-way ANOVA test revealed two significant differences between the level of education
groups. A Tukey Post Hoc test revealed the difference to be between Bachelor degree holders
and Diploma holders in both instances where a significant difference existed. Bachelor-degree
holders were more likely to use the Internet to find information related to politics and education
than diploma-holders.
Also, table 67 shows that the most educated journalists, with Master's degrees or higher,
were the most likely to use the Internet for eight out of the 12 information types listed.
Journalists with less than a Bachelor's degree were the most likely to use the Internet for three
out of the 12 information types listed. In terms of average mean, covering the likeliness of using
the Internet to find any type of the 12 information types provided, Master's degree holders or
higher were the most likely group to use the Internet. Diploma degree holders were least likely to
use the Internet to find information about any of the 12 information types listed, with an average
mean of 1.9375. Table 67 provides more information, with information types that recorded
significant differences in the means of the groups in bold.
139
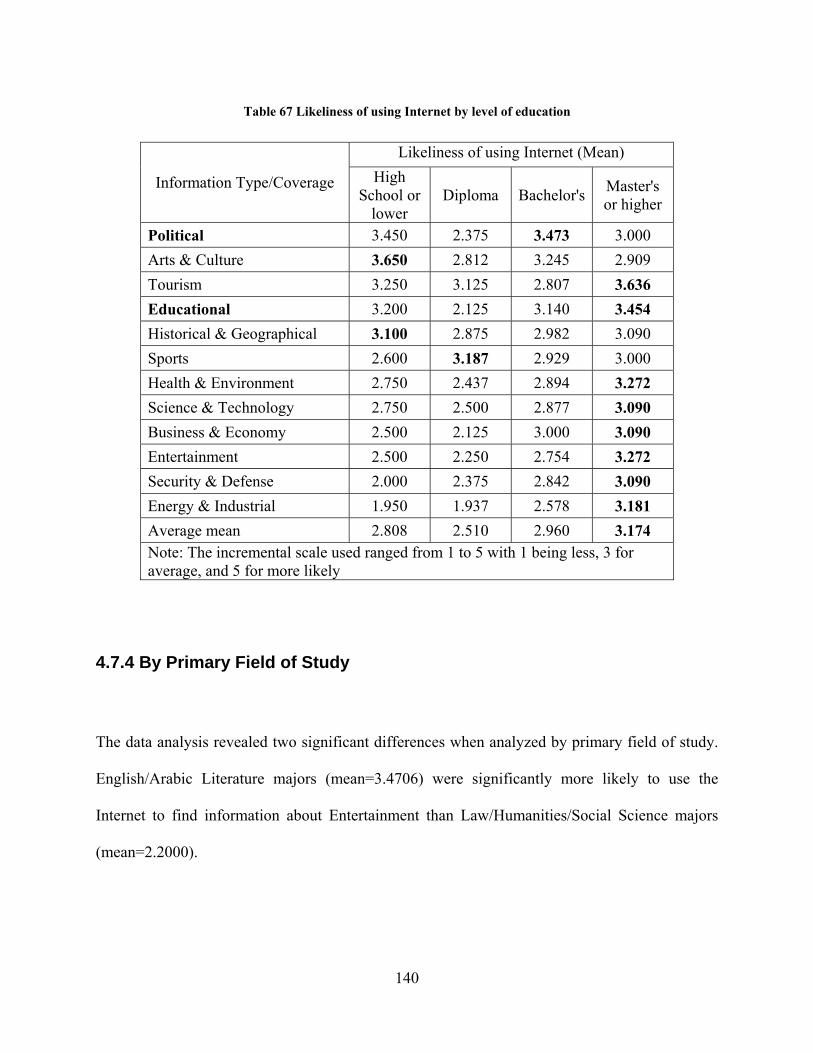
Table 67 Likeliness of using Internet by level of education
Likeliness of using Internet (Mean)
Information Type/Coverage High School or
lower Diploma Bachelor's Master's
or higher
Political 3.450 2.375 3.473 3.000 Arts & Culture 3.650 2.812 3.245 2.909 Tourism 3.250 3.125 2.807 3.636 Educational 3.200 2.125 3.140 3.454 Historical & Geographical 3.100 2.875 2.982 3.090 Sports 2.600 3.187 2.929 3.000 Health & Environment 2.750 2.437 2.894 3.272 Science & Technology 2.750 2.500 2.877 3.090 Business & Economy 2.500 2.125 3.000 3.090 Entertainment 2.500 2.250 2.754 3.272 Security & Defense 2.000 2.375 2.842 3.090 Energy & Industrial 1.950 1.937 2.578 3.181 Average mean 2.808 2.510 2.960 3.174 Note: The incremental scale used ranged from 1 to 5 with 1 being less, 3 for average, and 5 for more likely
4.7.4 By Primary Field of Study
The data analysis revealed two significant differences when analyzed by primary field of study.
English/Arabic Literature majors (mean=3.4706) were significantly more likely to use the
Internet to find information about Entertainment than Law/Humanities/Social Science majors
(mean=2.2000).
140
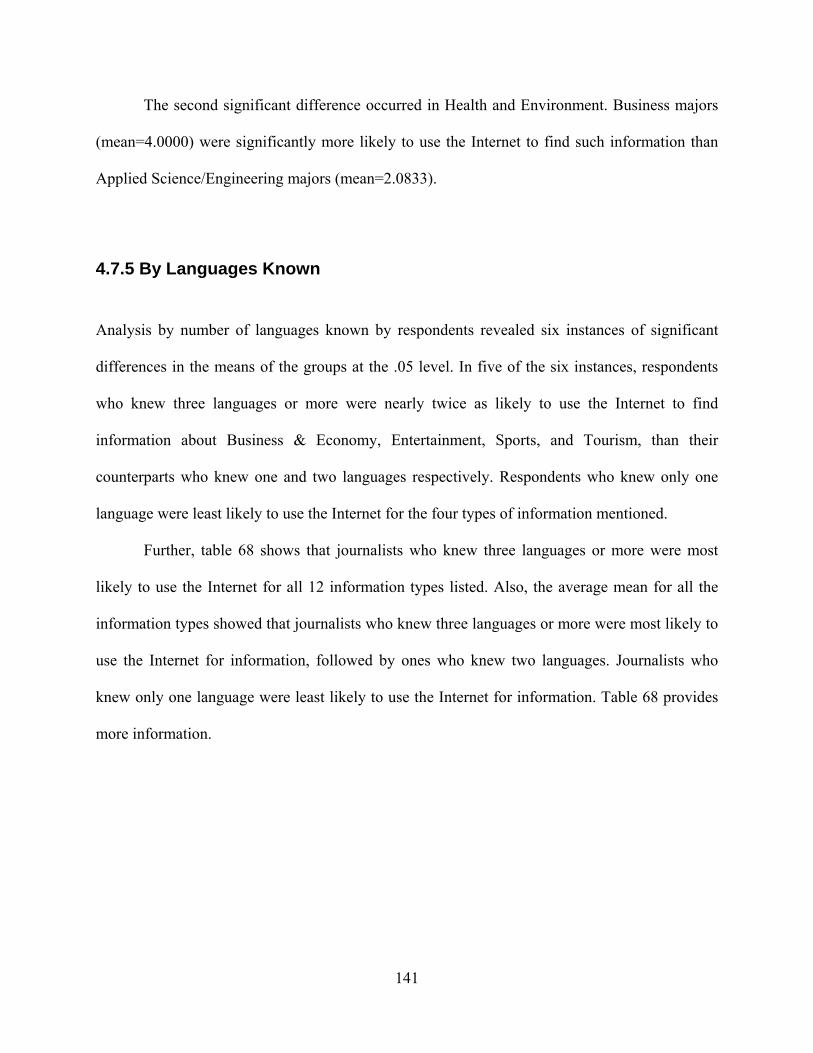
The second significant difference occurred in Health and Environment. Business majors
(mean=4.0000) were significantly more likely to use the Internet to find such information than
Applied Science/Engineering majors (mean=2.0833).
4.7.5 By Languages Known
Analysis by number of languages known by respondents revealed six instances of significant
differences in the means of the groups at the .05 level. In five of the six instances, respondents
who knew three languages or more were nearly twice as likely to use the Internet to find
information about Business & Economy, Entertainment, Sports, and Tourism, than their
counterparts who knew one and two languages respectively. Respondents who knew only one
language were least likely to use the Internet for the four types of information mentioned.
Further, table 68 shows that journalists who knew three languages or more were most
likely to use the Internet for all 12 information types listed. Also, the average mean for all the
information types showed that journalists who knew three languages or more were most likely to
use the Internet for information, followed by ones who knew two languages. Journalists who
knew only one language were least likely to use the Internet for information. Table 68 provides
more information.
141
Table 68 Likeliness of using Internet by languages known
Likeliness of using Internet (Mean) Information Type/Coverage
1 2 3+ Political 3.200 3.207 3.333 Arts & Culture 3.200 3.168 3.333 Tourism 2.100 2.974 3.666 Educational 2.500 2.987 3.388 Historical & Geographical 2.700 2.909 3.444 Sports 1.900 2.831 3.722 Health & Environment 2.300 2.727 3.500 Science & Technology 2.200 2.779 3.222 Business & Economy 1.500 2.766 3.444 Entertainment 1.800 2.636 3.277 Security & Defense 2.100 2.597 3.000 Energy & Industrial 1.800 2.376 2.888 Average mean 2.275 2.830 3.351 Note: The incremental scale used ranged from 1 to 5 with 1 being less, 3 for average, and 5 for more likely Key: 1= One language known, 2= Two language known, 3+= Three or more languages known
4.7.6 By Other Variables Data analysis did not reveal any significant differences when analysis was done by length of
experience as a journalist, citizenship, and location of educational institution. However, one
significant difference existed when data was analyzed by primary journalistic beat. The
difference was for Business and Economy information. The Politics/Economics beats journalists
were more likely to use the Internet (mean=3.4000) to find Business and Economy information
than journalists who covered Education/Arts and Literature (mean=1.9286).
142
4.8 RQ6- SKILLS AND USAGE
Journalists were asked to indicate their skill-level in using each of 21 applications listed on an
incremental scale starting at 1 for novice, 3 for average, and 5 for expert. Data analysis revealed
that journalists were most skilled in using E-mail (mean=3.512), the WWW (mean=3.478), and
Operating Systems (3.102). However, the data revealed that journalists were skilled at less than
the average level in using 17 out of the 21 applications listed, as fifth ranked Audio/Video
Software recorded a skill-level mean o 2.555, or below the average of 3 according to the scale
provided. Further, journalists were least skilled in using more recent information technologies
and applications such as Podcasting, RSS Feeds, and Wikis. Further, the average mean for all
applications listed showed that journalists were below average in skill-level. Table 69 provides
more information. The scales used were found to be highly reliable as Cronbach's Alpha was
found to be .956 for the 21 items listed.
143
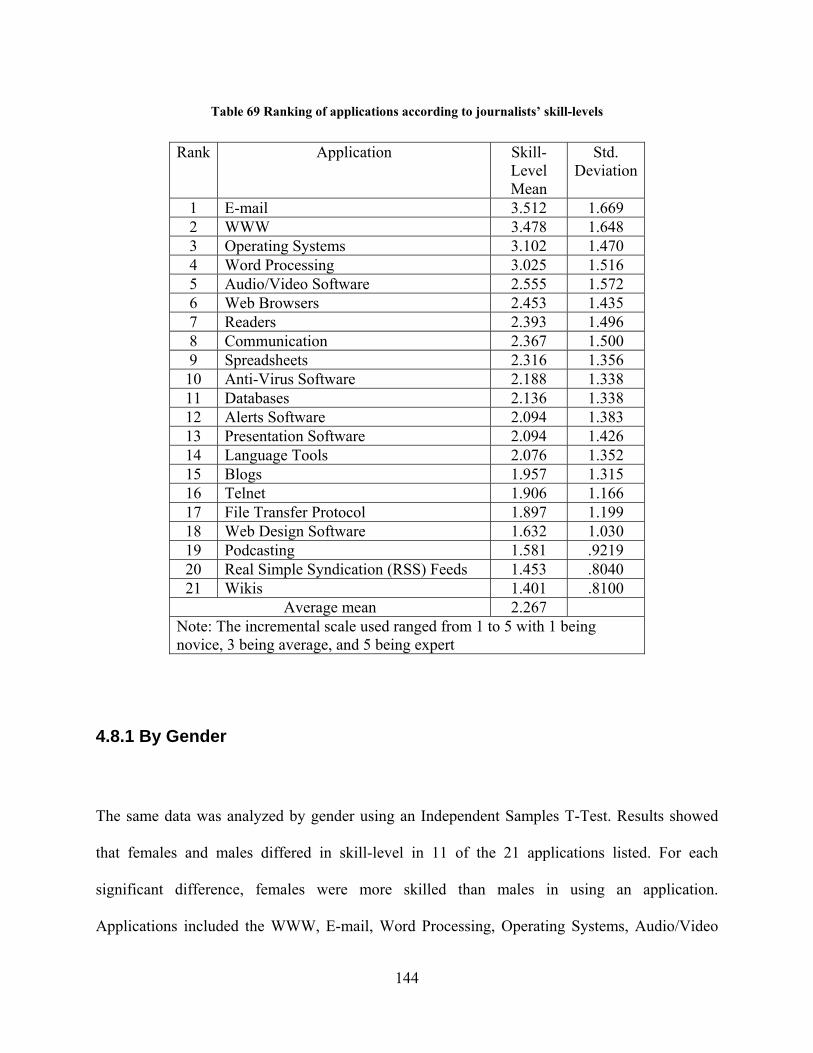
Table 69 Ranking of applications according to journalists’ skill-levels
Rank Application Skill- Level Mean
Std. Deviation
1 E-mail 3.512 1.669 2 WWW 3.478 1.648 3 Operating Systems 3.102 1.470 4 Word Processing 3.025 1.516 5 Audio/Video Software 2.555 1.572 6 Web Browsers 2.453 1.435 7 Readers 2.393 1.496 8 Communication 2.367 1.500 9 Spreadsheets 2.316 1.356 10 Anti-Virus Software 2.188 1.338 11 Databases 2.136 1.338 12 Alerts Software 2.094 1.383 13 Presentation Software 2.094 1.426 14 Language Tools 2.076 1.352 15 Blogs 1.957 1.315 16 Telnet 1.906 1.166 17 File Transfer Protocol 1.897 1.199 18 Web Design Software 1.632 1.030 19 Podcasting 1.581 .9219 20 Real Simple Syndication (RSS) Feeds 1.453 .8040 21 Wikis 1.401 .8100
Average mean 2.267 Note: The incremental scale used ranged from 1 to 5 with 1 being novice, 3 being average, and 5 being expert
4.8.1 By Gender
The same data was analyzed by gender using an Independent Samples T-Test. Results showed
that females and males differed in skill-level in 11 of the 21 applications listed. For each
significant difference, females were more skilled than males in using an application.
Applications included the WWW, E-mail, Word Processing, Operating Systems, Audio/Video
144
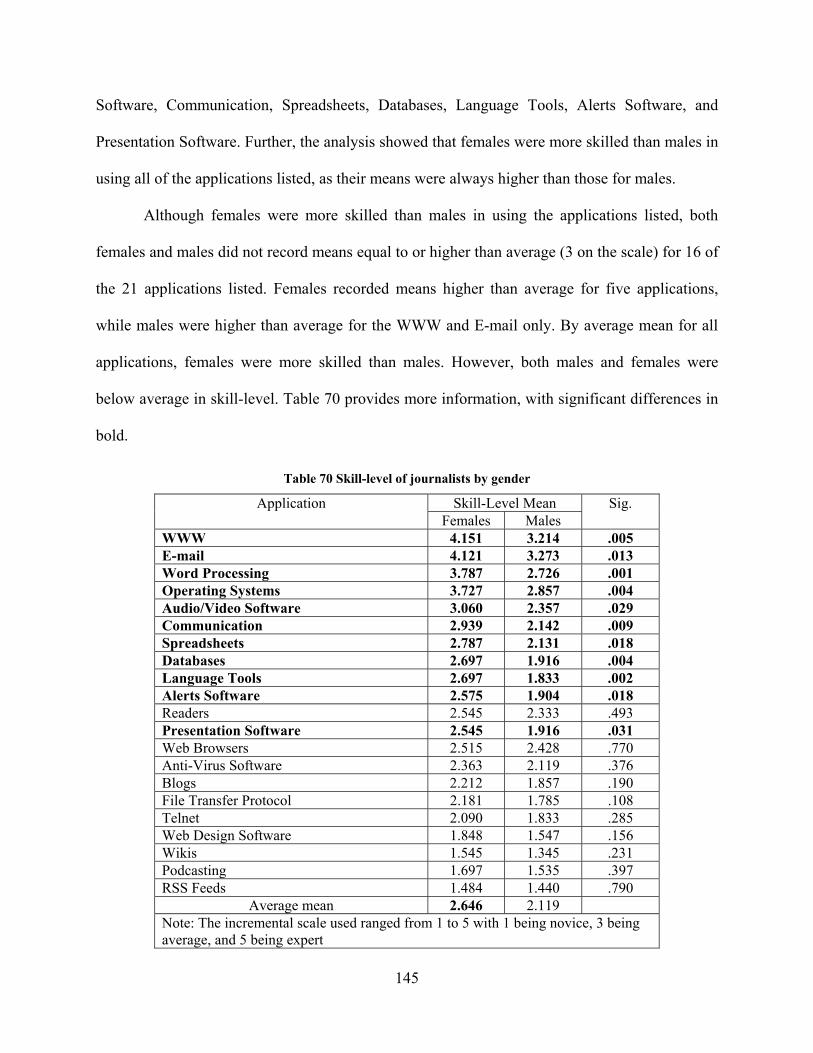
Software, Communication, Spreadsheets, Databases, Language Tools, Alerts Software, and
Presentation Software. Further, the analysis showed that females were more skilled than males in
using all of the applications listed, as their means were always higher than those for males.
Although females were more skilled than males in using the applications listed, both
females and males did not record means equal to or higher than average (3 on the scale) for 16 of
the 21 applications listed. Females recorded means higher than average for five applications,
while males were higher than average for the WWW and E-mail only. By average mean for all
applications, females were more skilled than males. However, both males and females were
below average in skill-level. Table 70 provides more information, with significant differences in
bold.
Table 70 Skill-level of journalists by gender
Skill-Level Mean Application Females Males
Sig.
WWW 4.151 3.214 .005 E-mail 4.121 3.273 .013 Word Processing 3.787 2.726 .001 Operating Systems 3.727 2.857 .004 Audio/Video Software 3.060 2.357 .029 Communication 2.939 2.142 .009 Spreadsheets 2.787 2.131 .018 Databases 2.697 1.916 .004 Language Tools 2.697 1.833 .002 Alerts Software 2.575 1.904 .018 Readers 2.545 2.333 .493 Presentation Software 2.545 1.916 .031 Web Browsers 2.515 2.428 .770 Anti-Virus Software 2.363 2.119 .376 Blogs 2.212 1.857 .190 File Transfer Protocol 2.181 1.785 .108 Telnet 2.090 1.833 .285 Web Design Software 1.848 1.547 .156 Wikis 1.545 1.345 .231 Podcasting 1.697 1.535 .397 RSS Feeds 1.484 1.440 .790
Average mean 2.646 2.119 Note: The incremental scale used ranged from 1 to 5 with 1 being novice, 3 being average, and 5 being expert
145
4.8.2 By Age
Data for skill-level was analyzed by age using a one-way ANOVA test. The results revealed that
the groups differed in skill-level for five applications including the WWW, E-mail, Audio/Video
Software, Spreadsheets, and Language Tools. A Tukey Post Hoc test was conducted to identify
these differences resulting in eight instances of difference. In all eight instances where a
significant difference existed, the age category Younger than 25 was always present. Younger
journalists were more skilled than their older counterparts in using the five applications listed.
Further, table 71 shows that the youngest journalists were most skilled of all age groups
in using 16 out of the 21 applications listed. In terms of average mean for all the applications by
age, the youngest journalists were the most skilled in using the applications. However, their
average mean of 2.6819 was below average and indicated a need for improvement. The least
skilled journalists by average mean for all the applications listed were the oldest journalists, who
were 40 years or older. Table 71 provides more information about the differences.
146
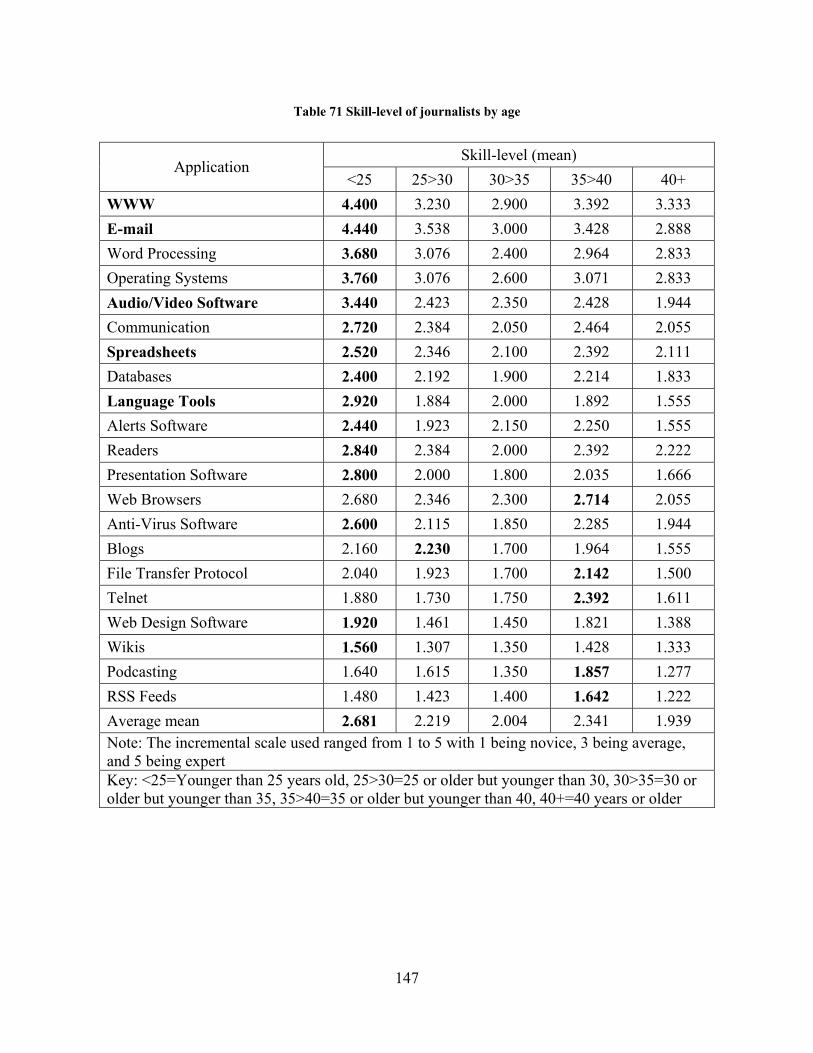
Table 71 Skill-level of journalists by age
Skill-level (mean) Application
<25 25>30 30>35 35>40 40+ WWW 4.400 3.230 2.900 3.392 3.333 E-mail 4.440 3.538 3.000 3.428 2.888 Word Processing 3.680 3.076 2.400 2.964 2.833 Operating Systems 3.760 3.076 2.600 3.071 2.833 Audio/Video Software 3.440 2.423 2.350 2.428 1.944 Communication 2.720 2.384 2.050 2.464 2.055 Spreadsheets 2.520 2.346 2.100 2.392 2.111 Databases 2.400 2.192 1.900 2.214 1.833 Language Tools 2.920 1.884 2.000 1.892 1.555 Alerts Software 2.440 1.923 2.150 2.250 1.555 Readers 2.840 2.384 2.000 2.392 2.222 Presentation Software 2.800 2.000 1.800 2.035 1.666 Web Browsers 2.680 2.346 2.300 2.714 2.055 Anti-Virus Software 2.600 2.115 1.850 2.285 1.944 Blogs 2.160 2.230 1.700 1.964 1.555 File Transfer Protocol 2.040 1.923 1.700 2.142 1.500 Telnet 1.880 1.730 1.750 2.392 1.611 Web Design Software 1.920 1.461 1.450 1.821 1.388 Wikis 1.560 1.307 1.350 1.428 1.333 Podcasting 1.640 1.615 1.350 1.857 1.277 RSS Feeds 1.480 1.423 1.400 1.642 1.222 Average mean 2.681 2.219 2.004 2.341 1.939 Note: The incremental scale used ranged from 1 to 5 with 1 being novice, 3 being average, and 5 being expert Key: <25=Younger than 25 years old, 25>30=25 or older but younger than 30, 30>35=30 or older but younger than 35, 35>40=35 or older but younger than 40, 40+=40 years or older
147
4.8.3 By Length of Experience as Journalist
Data analysis showed that although no significant differences were found between the groups,
the least experienced journalists, with less than one year or experience, were most skilled, in
comparison to other groups, in using 15 out of the 21 applications listed. The average mean
showed that the least experienced journalists were in general more skilled than others in using
information technology applications. Further, the most experienced journalists, with 16 or more
years of experience, were the least skilled in using information technology applications. Table 72
provides more information.
148
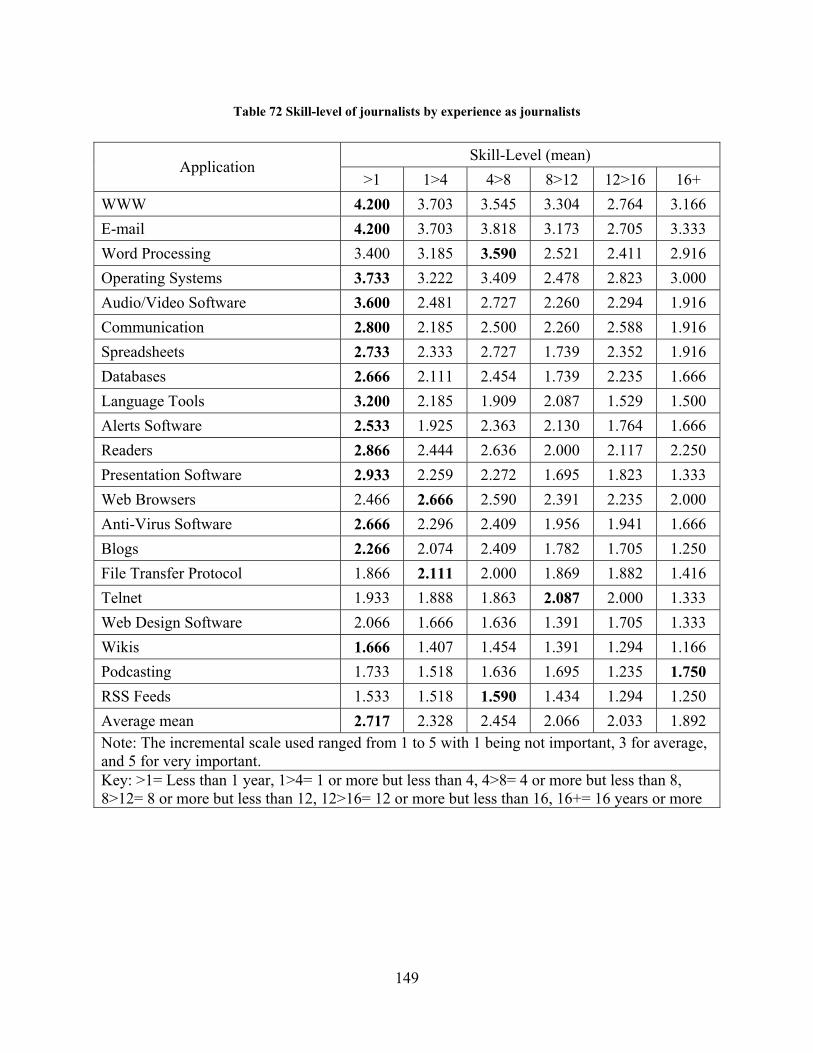
Table 72 Skill-level of journalists by experience as journalists
Skill-Level (mean) Application
>1 1>4 4>8 8>12 12>16 16+ WWW 4.200 3.703 3.545 3.304 2.764 3.166 E-mail 4.200 3.703 3.818 3.173 2.705 3.333 Word Processing 3.400 3.185 3.590 2.521 2.411 2.916 Operating Systems 3.733 3.222 3.409 2.478 2.823 3.000 Audio/Video Software 3.600 2.481 2.727 2.260 2.294 1.916 Communication 2.800 2.185 2.500 2.260 2.588 1.916 Spreadsheets 2.733 2.333 2.727 1.739 2.352 1.916 Databases 2.666 2.111 2.454 1.739 2.235 1.666 Language Tools 3.200 2.185 1.909 2.087 1.529 1.500 Alerts Software 2.533 1.925 2.363 2.130 1.764 1.666 Readers 2.866 2.444 2.636 2.000 2.117 2.250 Presentation Software 2.933 2.259 2.272 1.695 1.823 1.333 Web Browsers 2.466 2.666 2.590 2.391 2.235 2.000 Anti-Virus Software 2.666 2.296 2.409 1.956 1.941 1.666 Blogs 2.266 2.074 2.409 1.782 1.705 1.250 File Transfer Protocol 1.866 2.111 2.000 1.869 1.882 1.416 Telnet 1.933 1.888 1.863 2.087 2.000 1.333 Web Design Software 2.066 1.666 1.636 1.391 1.705 1.333 Wikis 1.666 1.407 1.454 1.391 1.294 1.166 Podcasting 1.733 1.518 1.636 1.695 1.235 1.750 RSS Feeds 1.533 1.518 1.590 1.434 1.294 1.250 Average mean 2.717 2.328 2.454 2.066 2.033 1.892 Note: The incremental scale used ranged from 1 to 5 with 1 being not important, 3 for average, and 5 for very important. Key: >1= Less than 1 year, 1>4= 1 or more but less than 4, 4>8= 4 or more but less than 8, 8>12= 8 or more but less than 12, 12>16= 12 or more but less than 16, 16+= 16 years or more
149
4.8.4 By Internet Experience
The data analysis showed that as experience in using the Internet increased, so did the skill-level
of the individual. However, that increase in skills peaked after six to nine years of experience,
and started to decrease. Also, according to the average mean for all applications, the most skilled
journalists were ones who had between six to nine years of experience in using the Internet. The
least skilled were ones who had less than one year of experience in using the Internet. Table 73
provides more information.
150
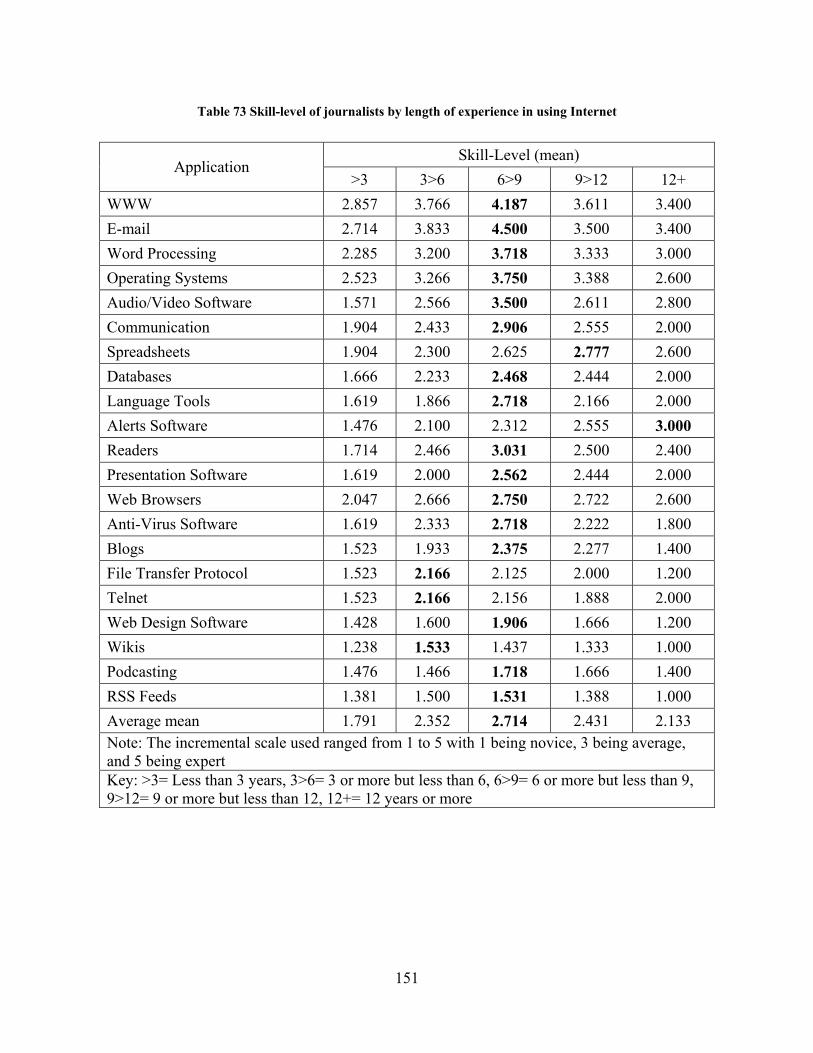
Table 73 Skill-level of journalists by length of experience in using Internet
Skill-Level (mean) Application
>3 3>6 6>9 9>12 12+ WWW 2.857 3.766 4.187 3.611 3.400 E-mail 2.714 3.833 4.500 3.500 3.400
3.718 Word Processing 2.285 3.200 3.333 3.000 3.750 Operating Systems 2.523 3.266 3.388 2.600 3.500 Audio/Video Software 1.571 2.566 2.611 2.800
Communication 1.904 2.433 2.906 2.555 2.000 Spreadsheets 1.904 2.300 2.625 2.777 2.600 Databases 1.666 2.233 2.468 2.444 2.000
2.718 Language Tools 1.619 1.866 2.166 2.000 3.000 Alerts Software 1.476 2.100 2.312 2.555
Readers 1.714 2.466 3.031 2.500 2.400 2.562 Presentation Software 1.619 2.000 2.444 2.000 2.750 Web Browsers 2.047 2.666 2.722 2.600 2.718 Anti-Virus Software 1.619 2.333 2.222 1.800
Blogs 1.523 1.933 2.375 2.277 1.400 File Transfer Protocol 1.523 2.166 2.125 2.000 1.200 Telnet 1.523 2.166 2.156 1.888 2.000 Web Design Software 1.428 1.600 1.906 1.666 1.200 Wikis 1.238 1.533 1.437 1.333 1.000 Podcasting 1.476 1.466 1.718 1.666 1.400 RSS Feeds 1.381 1.500 1.531 1.388 1.000 Average mean 1.791 2.352 2.714 2.431 2.133 Note: The incremental scale used ranged from 1 to 5 with 1 being novice, 3 being average, and 5 being expert Key: >3= Less than 3 years, 3>6= 3 or more but less than 6, 6>9= 6 or more but less than 9, 9>12= 9 or more but less than 12, 12+= 12 years or more
151
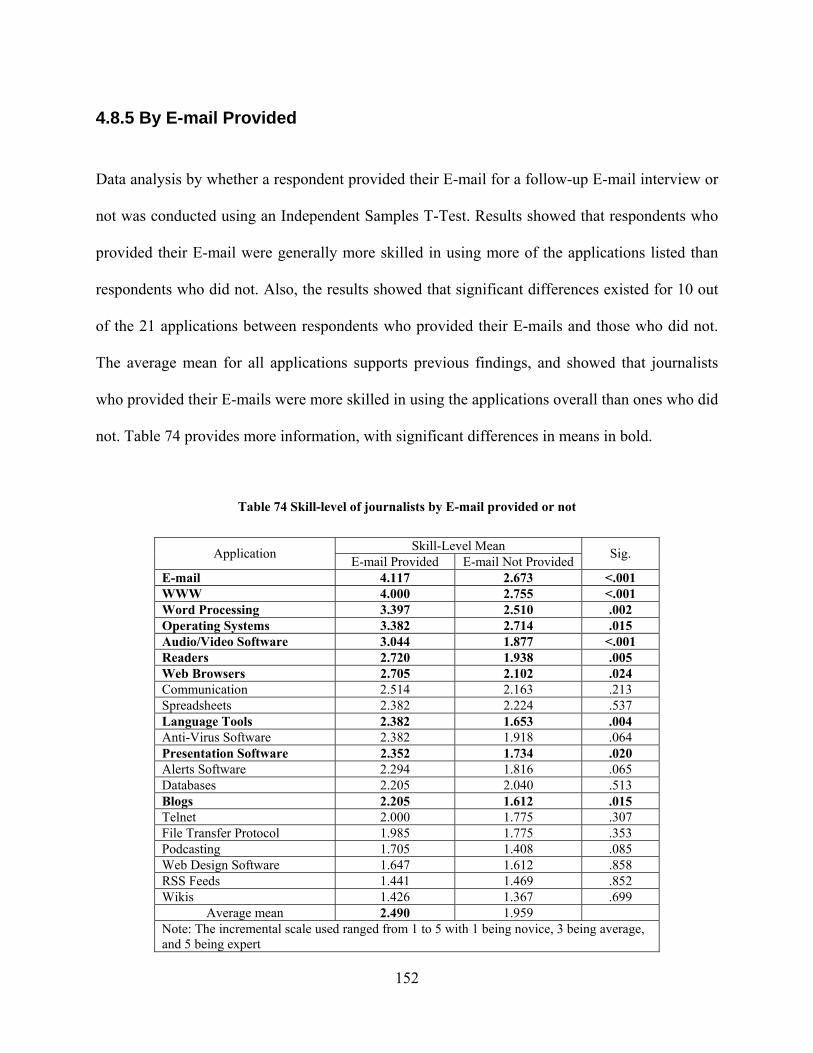
4.8.5 By E-mail Provided
Data analysis by whether a respondent provided their E-mail for a follow-up E-mail interview or
not was conducted using an Independent Samples T-Test. Results showed that respondents who
provided their E-mail were generally more skilled in using more of the applications listed than
respondents who did not. Also, the results showed that significant differences existed for 10 out
of the 21 applications between respondents who provided their E-mails and those who did not.
The average mean for all applications supports previous findings, and showed that journalists
who provided their E-mails were more skilled in using the applications overall than ones who did
not. Table 74 provides more information, with significant differences in means in bold.
Table 74 Skill-level of journalists by E-mail provided or not
Skill-Level Mean Application E-mail Provided E-mail Not Provided Sig.
E-mail 4.117 2.673 <.001 WWW 4.000 2.755 <.001 Word Processing 3.397 2.510 .002 Operating Systems 3.382 2.714 .015 Audio/Video Software 3.044 1.877 <.001 Readers 2.720 1.938 .005 Web Browsers 2.705 2.102 .024 Communication 2.514 2.163 .213 Spreadsheets 2.382 2.224 .537 Language Tools 2.382 1.653 .004 Anti-Virus Software 2.382 1.918 .064 Presentation Software 2.352 1.734 .020 Alerts Software 2.294 1.816 .065 Databases 2.205 2.040 .513 Blogs 2.205 1.612 .015 Telnet 2.000 1.775 .307 File Transfer Protocol 1.985 1.775 .353 Podcasting 1.705 1.408 .085 Web Design Software 1.647 1.612 .858 RSS Feeds 1.441 1.469 .852 Wikis 1.426 1.367 .699
Average mean 2.490 1.959 Note: The incremental scale used ranged from 1 to 5 with 1 being novice, 3 being average, and 5 being expert
152
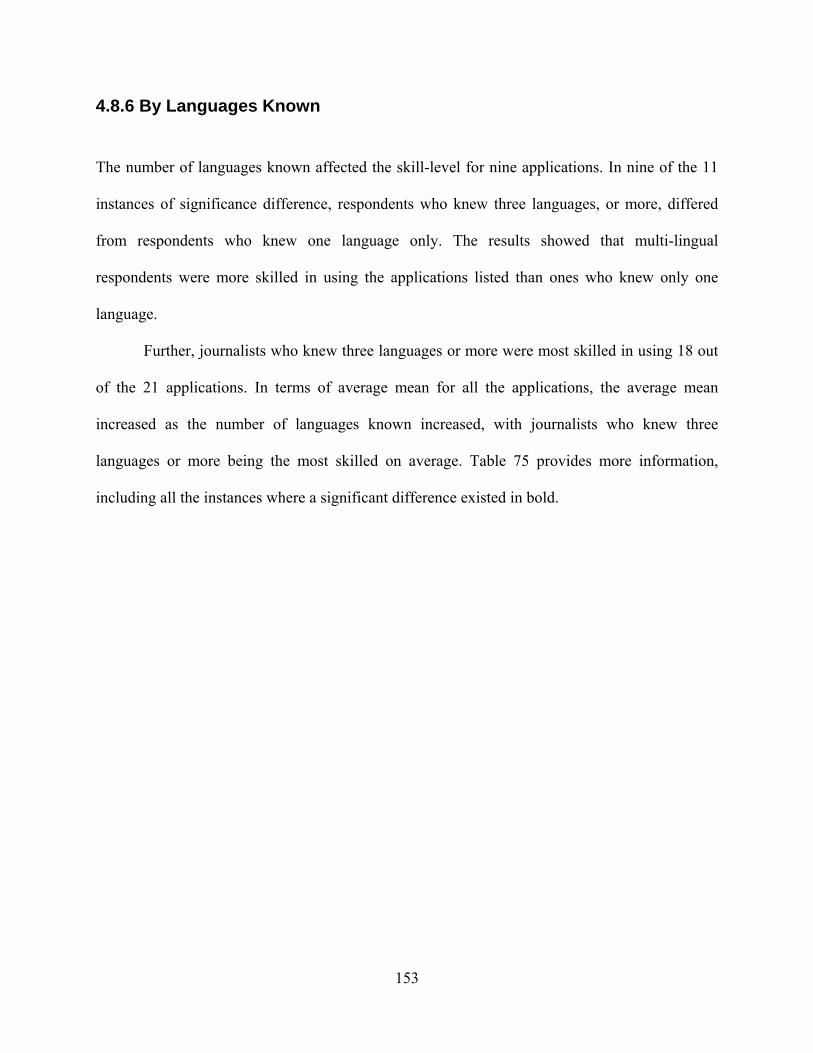
4.8.6 By Languages Known
The number of languages known affected the skill-level for nine applications. In nine of the 11
instances of significance difference, respondents who knew three languages, or more, differed
from respondents who knew one language only. The results showed that multi-lingual
respondents were more skilled in using the applications listed than ones who knew only one
language.
Further, journalists who knew three languages or more were most skilled in using 18 out
of the 21 applications. In terms of average mean for all the applications, the average mean
increased as the number of languages known increased, with journalists who knew three
languages or more being the most skilled on average. Table 75 provides more information,
including all the instances where a significant difference existed in bold.
153
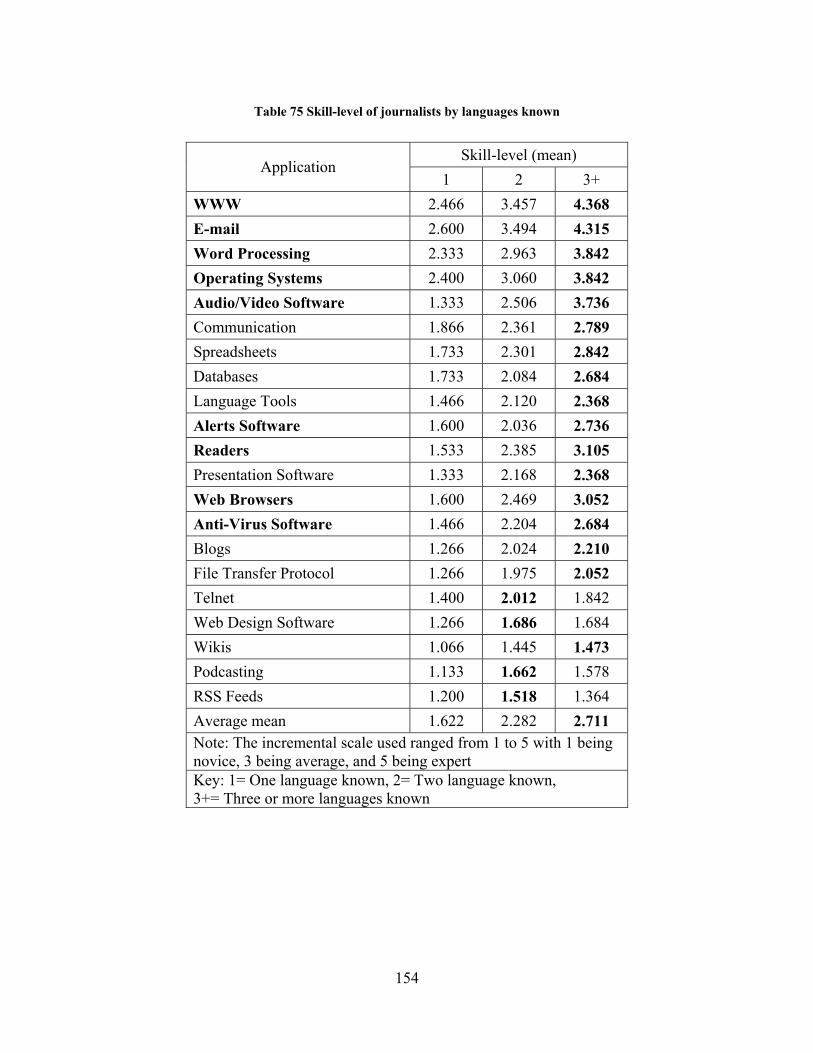
Table 75 Skill-level of journalists by languages known
Skill-level (mean) Application
1 2 3+ WWW 2.466 3.457 4.368 E-mail 2.600 3.494 4.315 Word Processing 2.333 2.963 3.842 Operating Systems 2.400 3.060 3.842 Audio/Video Software 1.333 2.506 3.736 Communication 1.866 2.361 2.789 Spreadsheets 1.733 2.301 2.842 Databases 1.733 2.084 2.684 Language Tools 1.466 2.120 2.368 Alerts Software 1.600 2.036 2.736 Readers 1.533 2.385 3.105 Presentation Software 1.333 2.168 2.368 Web Browsers 1.600 2.469 3.052 Anti-Virus Software 1.466 2.204 2.684 Blogs 1.266 2.024 2.210 File Transfer Protocol 1.266 1.975 2.052 Telnet 1.400 2.012 1.842 Web Design Software 1.266 1.686 1.684 Wikis 1.066 1.445 1.473 Podcasting 1.133 1.662 1.578 RSS Feeds 1.200 1.518 1.364 Average mean 1.622 2.282 2.711 Note: The incremental scale used ranged from 1 to 5 with 1 being novice, 3 being average, and 5 being expert Key: 1= One language known, 2= Two language known, 3+= Three or more languages known
154

4.8.7 By Primary Field of Study
Data analysis using one-way ANOVA revealed that the groups for primary field of study differed
for five applications. A Tukey Post Hoc test revealed nine instances where a significant
difference was present. For eight of the nine instances, Computer Science/Information
Technology majors were present. Respondents who majored in Computer Science/Information
Technology were significantly more skilled in using the five applications mentioned.
Also, data showed that computer science/information technology majors were most
skilled in using 20 out of the 21 applications listed. In terms of average means of all the
applications by major, computer science/information technology majors were most skilled, and
above average in skill-level with an average mean of 3.2460. All other majors were below
average in terms of average mean, with law/humanities/social sciences majors being the least
skilled. Table 76 reflects the significant differences in means for applications in bold.
155
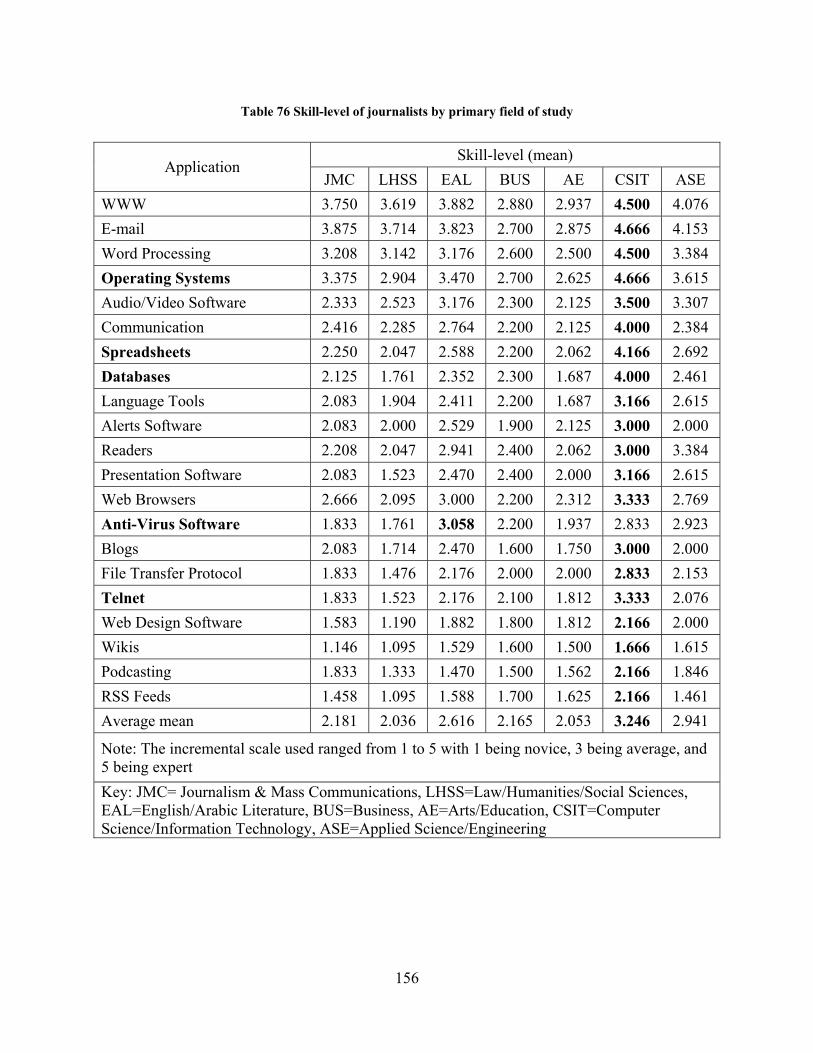
Table 76 Skill-level of journalists by primary field of study
Skill-level (mean) Application
JMC LHSS EAL BUS AE CSIT ASE WWW 3.750 3.619 3.882 2.880 2.937 4.500 4.076 E-mail 3.875 3.714 3.823 2.700 2.875 4.666 4.153 Word Processing 3.208 3.142 3.176 2.600 2.500 4.500 3.384 Operating Systems 3.375 2.904 3.470 2.700 2.625 4.666 3.615 Audio/Video Software 2.333 2.523 3.176 2.300 2.125 3.500 3.307 Communication 2.416 2.285 2.764 2.200 2.125 4.000 2.384 Spreadsheets 2.250 2.047 2.588 2.200 2.062 4.166 2.692 Databases 2.125 1.761 2.352 2.300 1.687 4.000 2.461 Language Tools 2.083 1.904 2.411 2.200 1.687 3.166 2.615 Alerts Software 2.083 2.000 2.529 1.900 2.125 3.000 2.000 Readers 2.208 2.047 2.941 2.400 2.062 3.000 3.384 Presentation Software 2.083 1.523 2.470 2.400 2.000 3.166 2.615 Web Browsers 2.666 2.095 3.000 2.200 2.312 3.333 2.769 Anti-Virus Software 1.833 1.761 3.058 2.200 1.937 2.833 2.923 Blogs 2.083 1.714 2.470 1.600 1.750 3.000 2.000 File Transfer Protocol 1.833 1.476 2.176 2.000 2.000 2.833 2.153 Telnet 1.833 1.523 2.176 2.100 1.812 3.333 2.076 Web Design Software 1.583 1.190 1.882 1.800 1.812 2.166 2.000 Wikis 1.146 1.095 1.529 1.600 1.500 1.666 1.615 Podcasting 1.833 1.333 1.470 1.500 1.562 2.166 1.846 RSS Feeds 1.458 1.095 1.588 1.700 1.625 2.166 1.461 Average mean 2.181 2.036 2.616 2.165 2.053 3.246 2.941
Note: The incremental scale used ranged from 1 to 5 with 1 being novice, 3 being average, and 5 being expert Key: JMC= Journalism & Mass Communications, LHSS=Law/Humanities/Social Sciences, EAL=English/Arabic Literature, BUS=Business, AE=Arts/Education, CSIT=Computer Science/Information Technology, ASE=Applied Science/Engineering
156
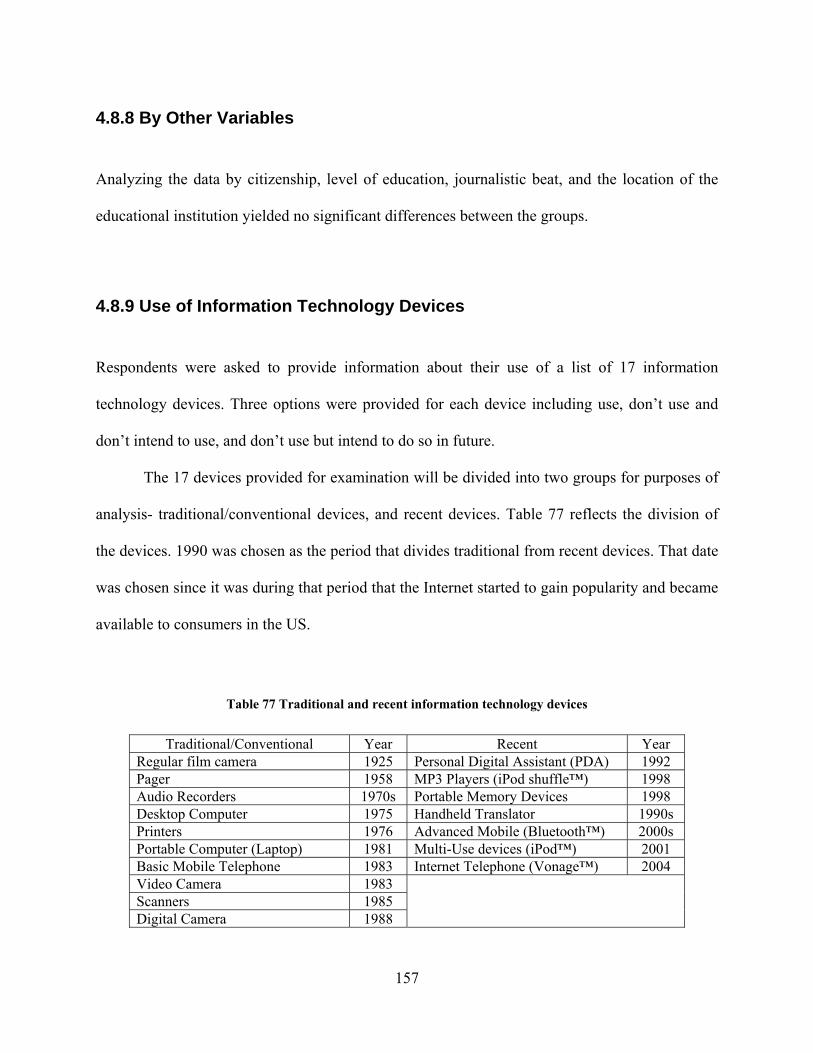
4.8.8 By Other Variables
Analyzing the data by citizenship, level of education, journalistic beat, and the location of the
educational institution yielded no significant differences between the groups.
4.8.9 Use of Information Technology Devices
Respondents were asked to provide information about their use of a list of 17 information
technology devices. Three options were provided for each device including use, don’t use and
don’t intend to use, and don’t use but intend to do so in future.
The 17 devices provided for examination will be divided into two groups for purposes of
analysis- traditional/conventional devices, and recent devices. Table 77 reflects the division of
the devices. 1990 was chosen as the period that divides traditional from recent devices. That date
was chosen since it was during that period that the Internet started to gain popularity and became
available to consumers in the US.
Table 77 Traditional and recent information technology devices
Traditional/Conventional Year Recent Year Regular film camera 1925 Personal Digital Assistant (PDA) 1992 Pager 1958 MP3 Players (iPod shuffle™) 1998 Audio Recorders 1970s Portable Memory Devices 1998 Desktop Computer 1975 Handheld Translator 1990s Printers 1976 Advanced Mobile (Bluetooth™) 2000s Portable Computer (Laptop) 1981 Multi-Use devices (iPod™) 2001 Basic Mobile Telephone 1983 Internet Telephone (Vonage™) 2004 Video Camera 1983 Scanners 1985 Digital Camera 1988
157
The data was analyzed using counts to identify the nature of use. It was found that a basic
mobile telephone was the most widely used device (count=111), followed by an advanced
mobile telephone (count=89) and audio recorders (count=74). The least used devices were found
to be multi-use devices (count=21), pagers (count=18), and personal digital assistants
(count=13).
Journalists are more conventional in their use of information technology devices, where
the more recent advancements received little usage (portable memory devices, Internet
telephone, MP3 players, etc.). In terms of future use, portable memory devices, handheld
translators, and multi-use devices are the most likely to be used by journalists in future.
However, it is unlikely for journalists to adopt certain information technology devices such as
Internet telephone, MP3 Players, and personal digital assistants. Regular film cameras are
outdated and results showed that journalists are less likely to use them and do not intend to do so
in future. Table 78 provides more in-depth information.
158
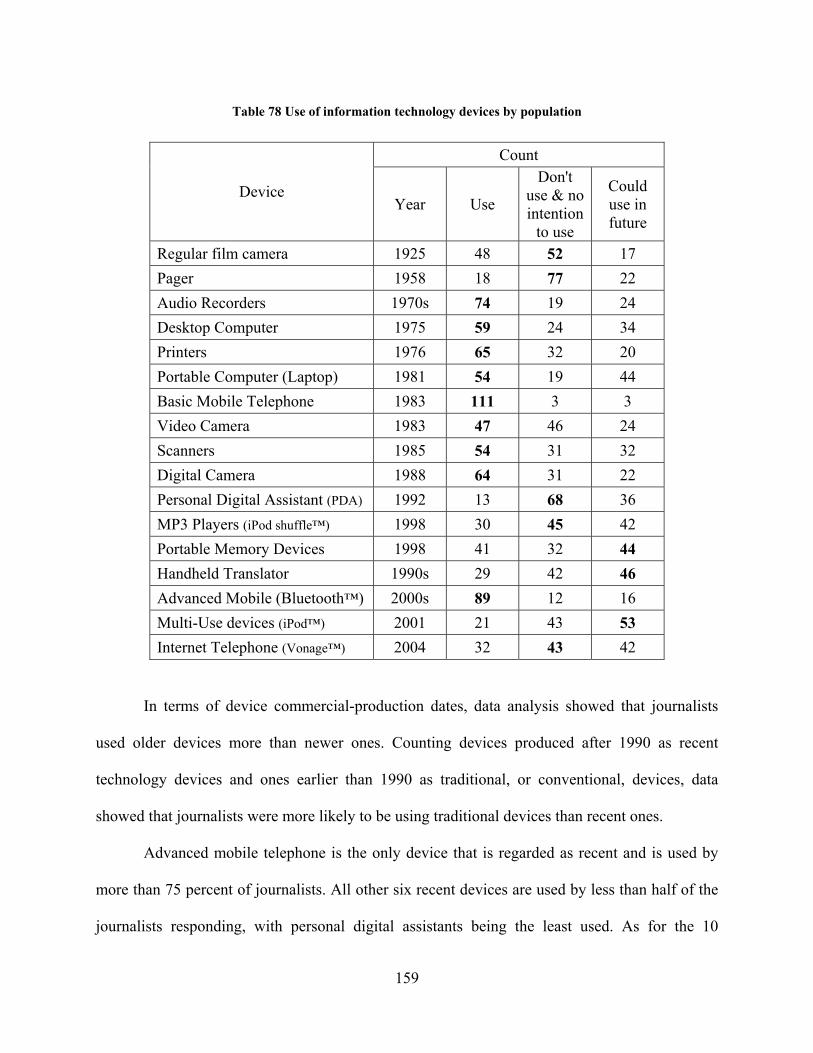
Table 78 Use of information technology devices by population
Count
Device Year Use
Don't use & no intention
to use
Could use in future
Regular film camera 1925 48 52 17 Pager 1958 18 77 22 Audio Recorders 1970s 74 19 24 Desktop Computer 1975 59 24 34 Printers 1976 65 32 20 Portable Computer (Laptop) 1981 54 19 44 Basic Mobile Telephone 1983 111 3 3 Video Camera 1983 47 46 24 Scanners 1985 54 31 32 Digital Camera 1988 64 31 22 Personal Digital Assistant (PDA) 1992 13 68 36 MP3 Players (iPod shuffle™) 1998 30 45 42 Portable Memory Devices 1998 41 32 44 Handheld Translator 1990s 29 42 46 Advanced Mobile (Bluetooth™) 2000s 89 12 16 Multi-Use devices (iPod™) 2001 21 43 53 Internet Telephone (Vonage™) 2004 32 43 42
In terms of device commercial-production dates, data analysis showed that journalists
used older devices more than newer ones. Counting devices produced after 1990 as recent
technology devices and ones earlier than 1990 as traditional, or conventional, devices, data
showed that journalists were more likely to be using traditional devices than recent ones.
Advanced mobile telephone is the only device that is regarded as recent and is used by
more than 75 percent of journalists. All other six recent devices are used by less than half of the
journalists responding, with personal digital assistants being the least used. As for the 10
159
traditional devices, half of them are used by at least 50 percent of the journalists, with pagers
being the least used devices. If mobile telephones were discounted, audio recorders would be the
most popular of the traditional devices, while portable memory devices would be the most
popular of the recent devices.
4.8.10 By Gender
Data analysis revealed that females used information technology devices more than males. For
12 of the 17 devices provided, more females indicated that they used them than males. Data
analysis according to each device's commercial production date and use by gender showed that
females were bigger users of traditional devices (produced before 1990), while males were
bigger users of recent technologies (produced after 1990). The most popular traditional device
was a basic mobile telephone for both females and males. Further, discounting that device
showed that audio recorders were the most popular traditional devices for females and males
alike.
In terms of recent devices (produced after 1990), analysis showed that males used four
out of the seven devices more than females. The most popular recent device was an advanced
mobile telephone for both males and females. Discounting advanced mobile telephone showed
that portable memory devices were the most popular recent device for both males and females.
Table 79 provides more information.
160

Table 79 Use of information technology devices according gender
Use (%) Device (oldest first) Year
Females Males Regular film camera 1925 39.4 41.7 Pager 1958 18.2 14.3 Audio Recorders 1970s 78.8 57.1 Desktop Computer 1975 57.6 47.6 Printers 1976 71.0 51.2 Portable Computer (Laptop) 1981 57.6 41.7 Basic Mobile Telephone 1983 100 92.9 Video Camera 1983 48.5 36.9 Scanners 1985 48.5 45.2 Digital Camera 1988 69.7 48.8 Personal Digital Assistant 1992 9.1 11.9 MP3 Players (iPod shuffle™) 1998 21.2 27.4 Portable Memory Devices 1998 42.4 32.1 Handheld Translator 1990s 39.4 19.0 Advanced Mobile (Bluetooth™) 2000s 72.7 77.4 Multi-Use devices (iPod™) 2001 21.2 16.7 Internet Telephone (Vonage™) 2004 24.2 28.6
As for future use of information technology devices, males indicated a bigger willingness
to do so than females for 11 of the 17 applications provided. Of the 11 devices, 10 are labeled as
traditional devices. Females were more likely to start using recent devices for five out of the
seven devices. The device that had the highest chance of being used by males in future was a
handheld translator, while females were most likely to start using MP3 players. Both devices
mentioned for males and females are regarded as recent technology devices.
In terms of least likeliness of use, and after discounting mobile telephones, males showed
that they are least likely to start using regular film cameras and printers. Females were least
161
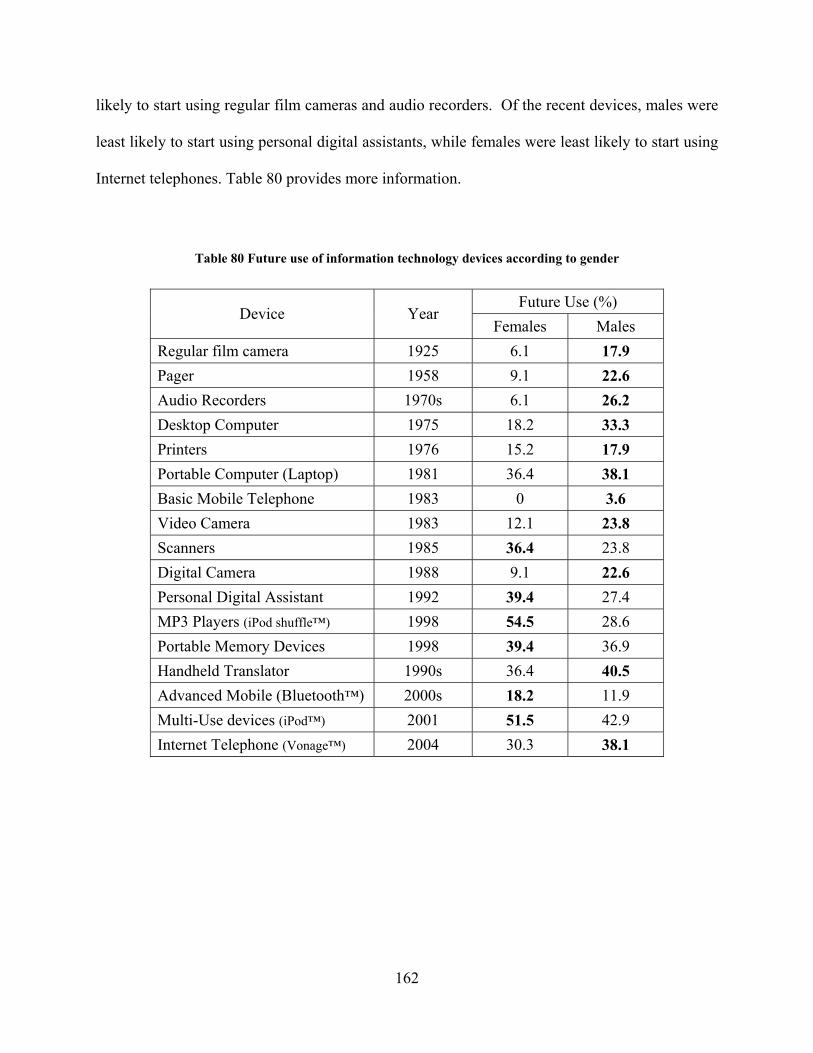
likely to start using regular film cameras and audio recorders. Of the recent devices, males were
least likely to start using personal digital assistants, while females were least likely to start using
Internet telephones. Table 80 provides more information.
Table 80 Future use of information technology devices according to gender
Future Use (%) Device Year
Females Males Regular film camera 1925 6.1 17.9 Pager 1958 9.1 22.6 Audio Recorders 1970s 6.1 26.2 Desktop Computer 1975 18.2 33.3 Printers 1976 15.2 17.9 Portable Computer (Laptop) 1981 36.4 38.1 Basic Mobile Telephone 1983 0 3.6 Video Camera 1983 12.1 23.8 Scanners 1985 36.4 23.8 Digital Camera 1988 9.1 22.6 Personal Digital Assistant 1992 39.4 27.4 MP3 Players (iPod shuffle™) 1998 54.5 28.6 Portable Memory Devices 1998 39.4 36.9 Handheld Translator 1990s 36.4 40.5 Advanced Mobile (Bluetooth™) 2000s 18.2 11.9 Multi-Use devices (iPod™) 2001 51.5 42.9 Internet Telephone (Vonage™) 2004 30.3 38.1
162
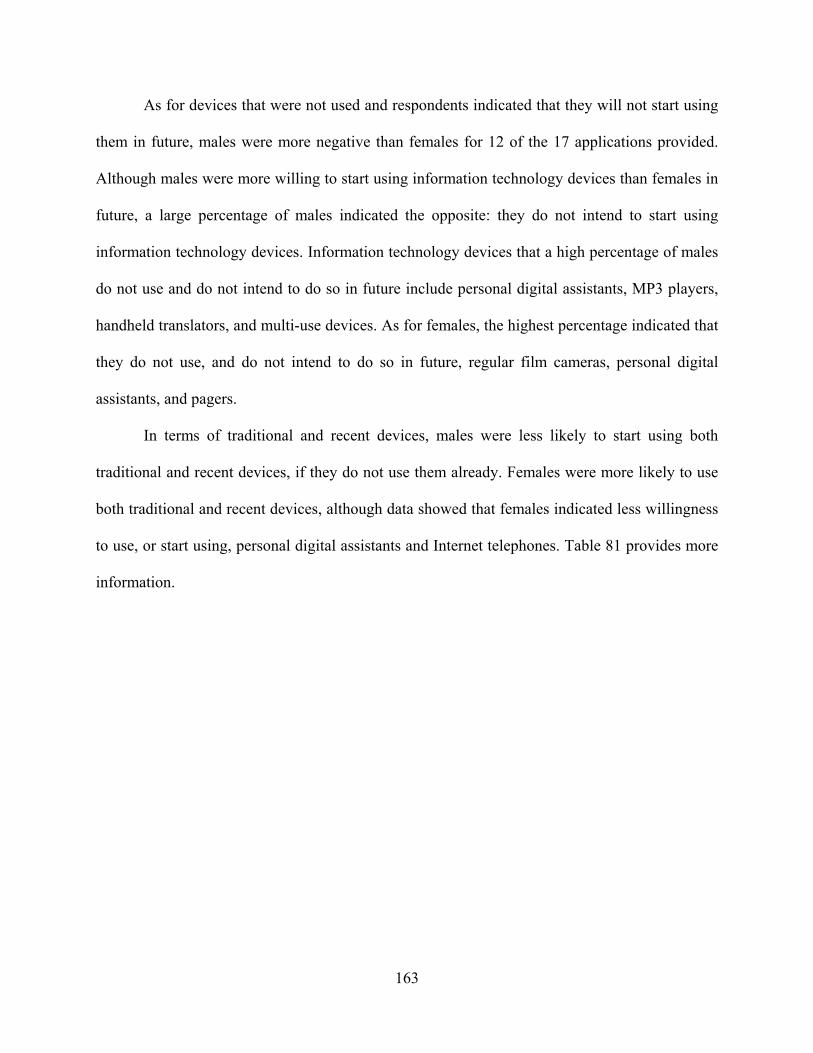
As for devices that were not used and respondents indicated that they will not start using
them in future, males were more negative than females for 12 of the 17 applications provided.
Although males were more willing to start using information technology devices than females in
future, a large percentage of males indicated the opposite: they do not intend to start using
information technology devices. Information technology devices that a high percentage of males
do not use and do not intend to do so in future include personal digital assistants, MP3 players,
handheld translators, and multi-use devices. As for females, the highest percentage indicated that
they do not use, and do not intend to do so in future, regular film cameras, personal digital
assistants, and pagers.
In terms of traditional and recent devices, males were less likely to start using both
traditional and recent devices, if they do not use them already. Females were more likely to use
both traditional and recent devices, although data showed that females indicated less willingness
to use, or start using, personal digital assistants and Internet telephones. Table 81 provides more
information.
163
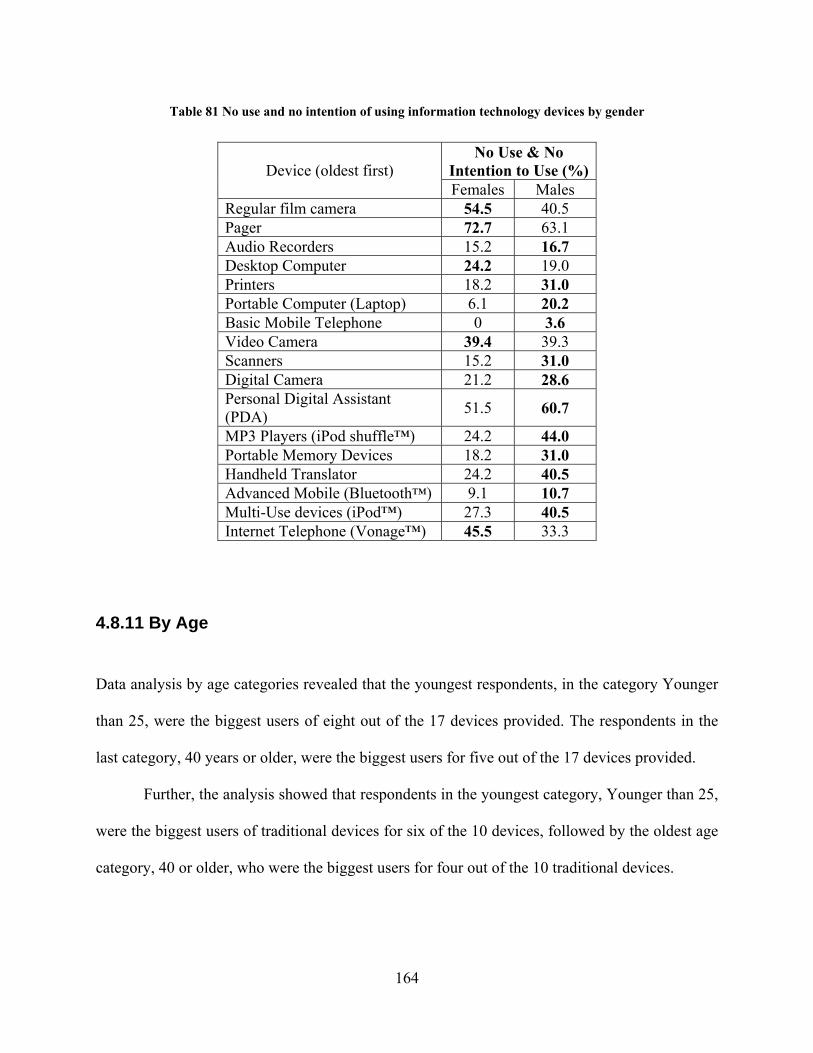
Table 81 No use and no intention of using information technology devices by gender
No Use & No Intention to Use (%) Device (oldest first) Females Males
Regular film camera 54.5 40.5 Pager 72.7 63.1 Audio Recorders 15.2 16.7 Desktop Computer 24.2 19.0 Printers 18.2 31.0 Portable Computer (Laptop) 6.1 20.2 Basic Mobile Telephone 0 3.6 Video Camera 39.4 39.3 Scanners 15.2 31.0 Digital Camera 21.2 28.6 Personal Digital Assistant (PDA) 51.5 60.7
MP3 Players (iPod shuffle™) 24.2 44.0 Portable Memory Devices 18.2 31.0 Handheld Translator 24.2 40.5 Advanced Mobile (Bluetooth™) 9.1 10.7 Multi-Use devices (iPod™) 27.3 40.5 Internet Telephone (Vonage™) 45.5 33.3
4.8.11 By Age
Data analysis by age categories revealed that the youngest respondents, in the category Younger
than 25, were the biggest users of eight out of the 17 devices provided. The respondents in the
last category, 40 years or older, were the biggest users for five out of the 17 devices provided.
Further, the analysis showed that respondents in the youngest category, Younger than 25,
were the biggest users of traditional devices for six of the 10 devices, followed by the oldest age
category, 40 or older, who were the biggest users for four out of the 10 traditional devices.
164
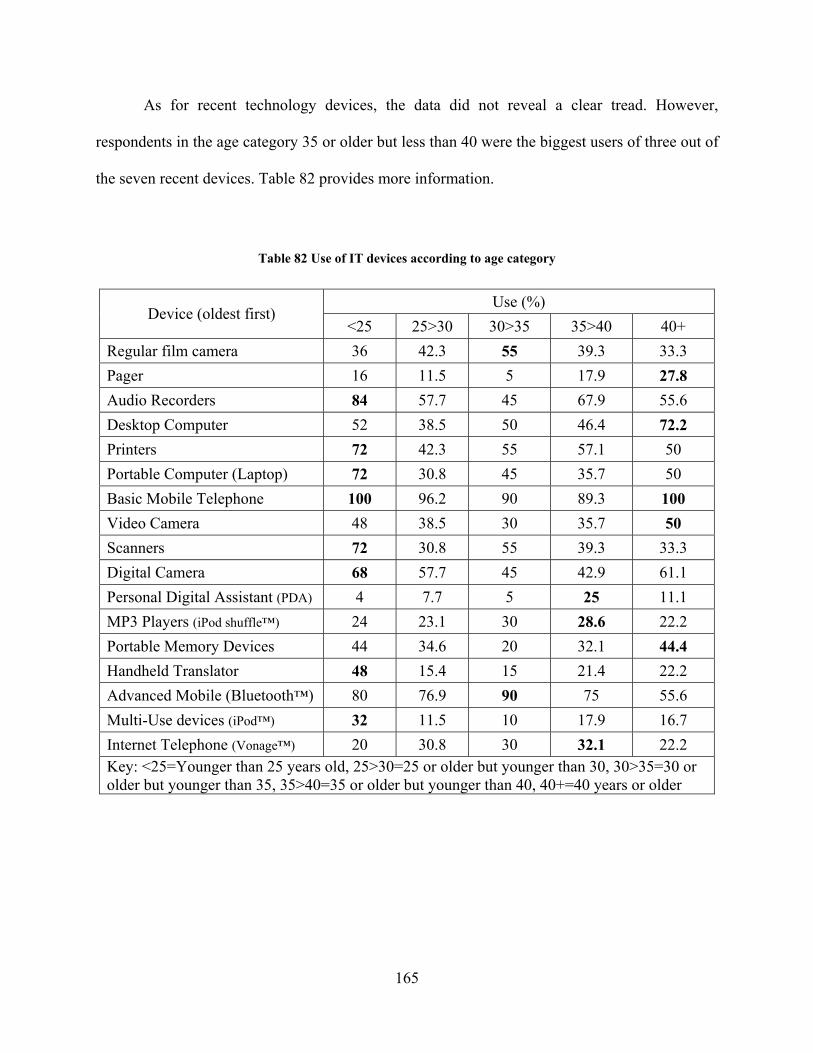
As for recent technology devices, the data did not reveal a clear tread. However,
respondents in the age category 35 or older but less than 40 were the biggest users of three out of
the seven recent devices. Table 82 provides more information.
Table 82 Use of IT devices according to age category
Use (%) Device (oldest first)
<25 25>30 30>35 35>40 40+ Regular film camera 36 42.3 55 39.3 33.3 Pager 16 11.5 5 17.9 27.8 Audio Recorders 84 57.7 45 67.9 55.6 Desktop Computer 52 38.5 50 46.4 72.2 Printers 72 42.3 55 57.1 50 Portable Computer (Laptop) 72 30.8 45 35.7 50 Basic Mobile Telephone 100 96.2 90 89.3 100 Video Camera 48 38.5 30 35.7 50 Scanners 72 30.8 55 39.3 33.3 Digital Camera 68 57.7 45 42.9 61.1 Personal Digital Assistant (PDA) 4 7.7 5 25 11.1 MP3 Players (iPod shuffle™) 24 23.1 30 28.6 22.2 Portable Memory Devices 44 34.6 20 32.1 44.4 Handheld Translator 48 15.4 15 21.4 22.2 Advanced Mobile (Bluetooth™) 80 76.9 90 75 55.6 Multi-Use devices (iPod™) 32 11.5 10 17.9 16.7 Internet Telephone (Vonage™) 20 30.8 30 32.1 22.2 Key: <25=Younger than 25 years old, 25>30=25 or older but younger than 30, 30>35=30 or older but younger than 35, 35>40=35 or older but younger than 40, 40+=40 years or older
165
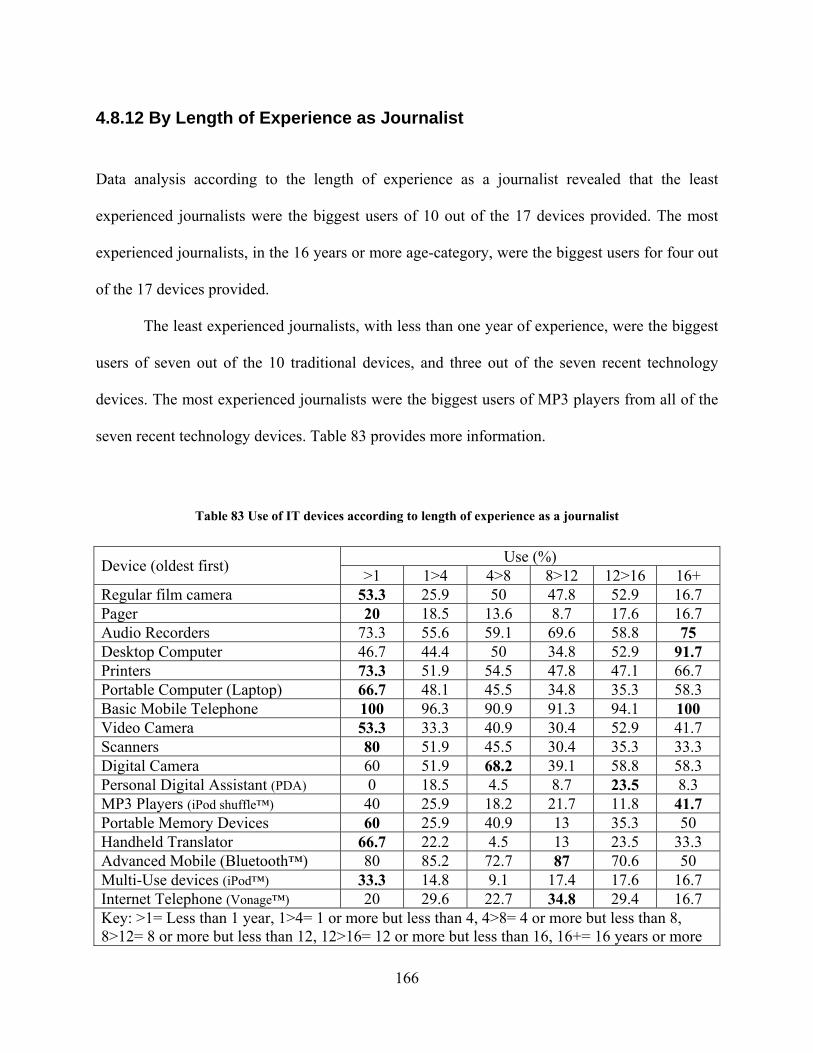
4.8.12 By Length of Experience as Journalist
Data analysis according to the length of experience as a journalist revealed that the least
experienced journalists were the biggest users of 10 out of the 17 devices provided. The most
experienced journalists, in the 16 years or more age-category, were the biggest users for four out
of the 17 devices provided.
The least experienced journalists, with less than one year of experience, were the biggest
users of seven out of the 10 traditional devices, and three out of the seven recent technology
devices. The most experienced journalists were the biggest users of MP3 players from all of the
seven recent technology devices. Table 83 provides more information.
Table 83 Use of IT devices according to length of experience as a journalist
Use (%) Device (oldest first) >1 1>4 4>8 8>12 12>16 16+ Regular film camera 53.3 25.9 50 47.8 52.9 16.7 Pager 20 18.5 13.6 8.7 17.6 16.7 Audio Recorders 73.3 55.6 59.1 69.6 58.8 75 Desktop Computer 46.7 44.4 50 34.8 52.9 91.7 Printers 73.3 51.9 54.5 47.8 47.1 66.7 Portable Computer (Laptop) 66.7 48.1 45.5 34.8 35.3 58.3 Basic Mobile Telephone 100 96.3 90.9 91.3 94.1 100 Video Camera 53.3 33.3 40.9 30.4 52.9 41.7 Scanners 80 51.9 45.5 30.4 35.3 33.3 Digital Camera 60 51.9 68.2 39.1 58.8 58.3 Personal Digital Assistant (PDA) 0 18.5 4.5 8.7 23.5 8.3 MP3 Players (iPod shuffle™) 40 25.9 18.2 21.7 11.8 41.7 Portable Memory Devices 60 25.9 40.9 13 35.3 50 Handheld Translator 66.7 22.2 4.5 13 23.5 33.3 Advanced Mobile (Bluetooth™) 80 85.2 72.7 87 70.6 50 Multi-Use devices (iPod™) 33.3 14.8 9.1 17.4 17.6 16.7 Internet Telephone (Vonage™) 20 29.6 22.7 34.8 29.4 16.7 Key: >1= Less than 1 year, 1>4= 1 or more but less than 4, 4>8= 4 or more but less than 8, 8>12= 8 or more but less than 12, 12>16= 12 or more but less than 16, 16+= 16 years or more
166
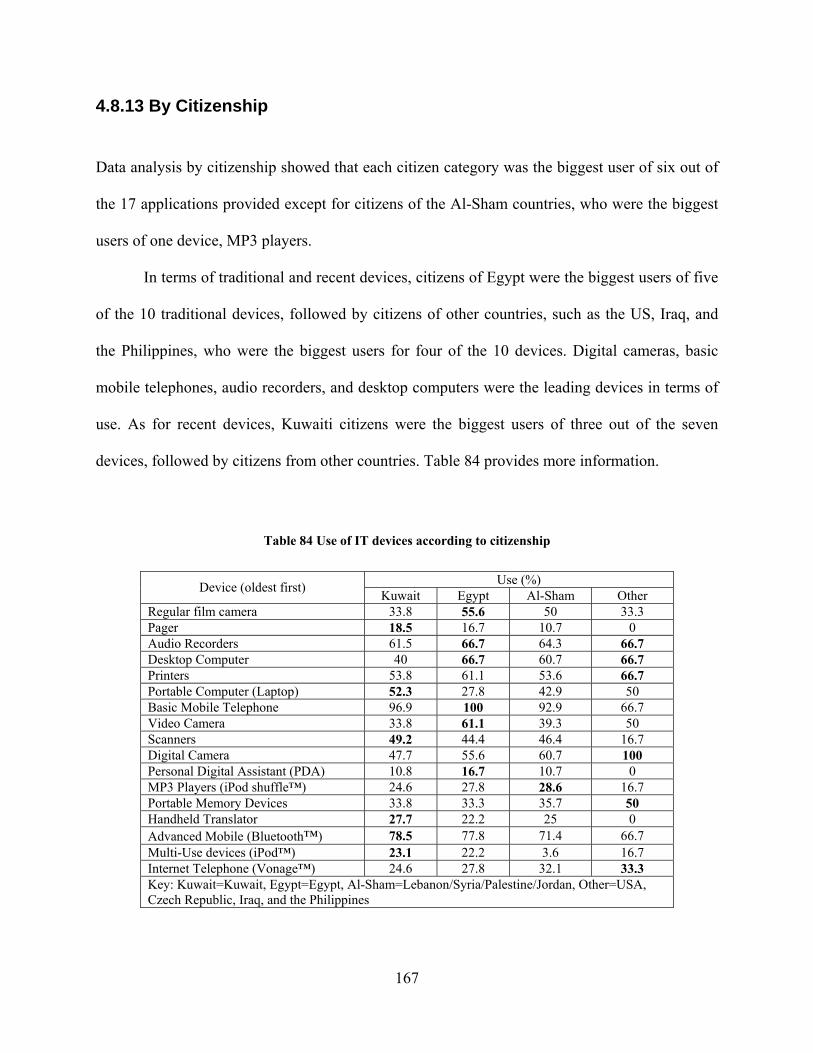
4.8.13 By Citizenship
Data analysis by citizenship showed that each citizen category was the biggest user of six out of
the 17 applications provided except for citizens of the Al-Sham countries, who were the biggest
users of one device, MP3 players.
In terms of traditional and recent devices, citizens of Egypt were the biggest users of five
of the 10 traditional devices, followed by citizens of other countries, such as the US, Iraq, and
the Philippines, who were the biggest users for four of the 10 devices. Digital cameras, basic
mobile telephones, audio recorders, and desktop computers were the leading devices in terms of
use. As for recent devices, Kuwaiti citizens were the biggest users of three out of the seven
devices, followed by citizens from other countries. Table 84 provides more information.
Table 84 Use of IT devices according to citizenship
Use (%) Device (oldest first) Kuwait Egypt Al-Sham Other Regular film camera 33.8 55.6 50 33.3 Pager 18.5 16.7 10.7 0 Audio Recorders 61.5 66.7 64.3 66.7 Desktop Computer 40 66.7 60.7 66.7 Printers 53.8 61.1 53.6 66.7 Portable Computer (Laptop) 52.3 27.8 42.9 50 Basic Mobile Telephone 96.9 100 92.9 66.7 Video Camera 33.8 61.1 39.3 50 Scanners 49.2 44.4 46.4 16.7 Digital Camera 47.7 55.6 60.7 100 Personal Digital Assistant (PDA) 10.8 16.7 10.7 0 MP3 Players (iPod shuffle™) 24.6 27.8 28.6 16.7 Portable Memory Devices 33.8 33.3 35.7 50 Handheld Translator 27.7 22.2 25 0 Advanced Mobile (Bluetooth™) 78.5 77.8 71.4 66.7 Multi-Use devices (iPod™) 23.1 22.2 3.6 16.7 Internet Telephone (Vonage™) 24.6 27.8 32.1 33.3 Key: Kuwait=Kuwait, Egypt=Egypt, Al-Sham=Lebanon/Syria/Palestine/Jordan, Other=USA, Czech Republic, Iraq, and the Philippines
167
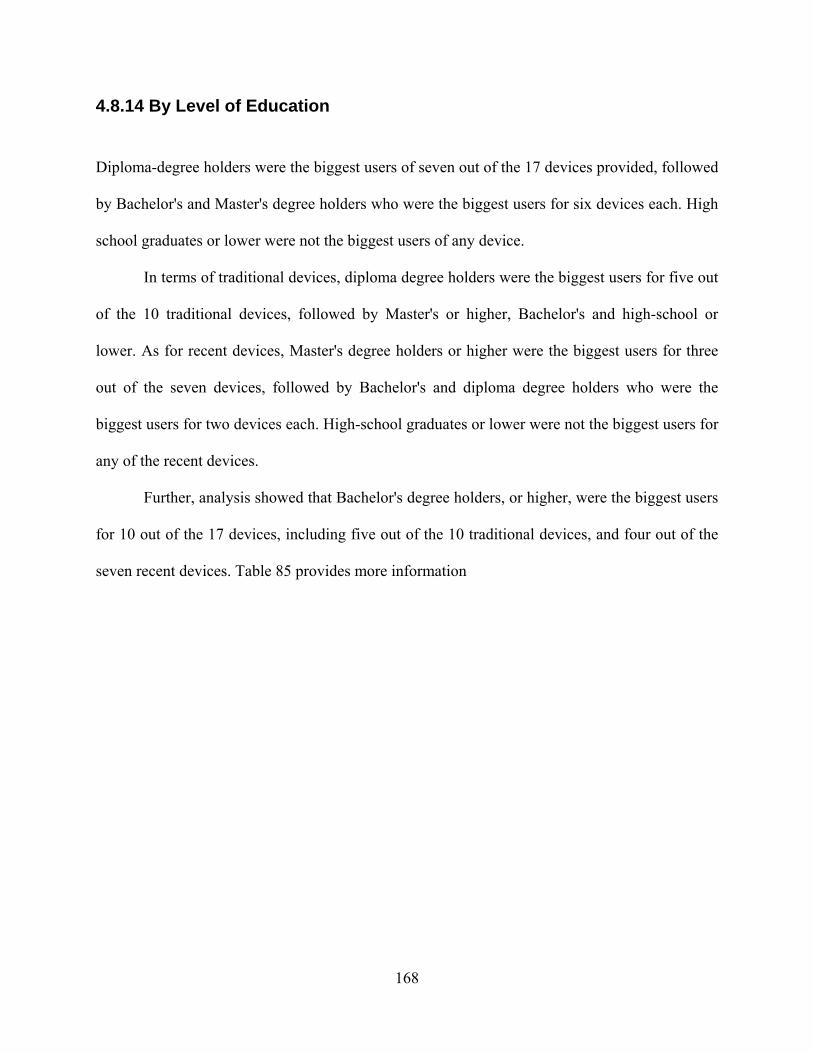
4.8.14 By Level of Education
Diploma-degree holders were the biggest users of seven out of the 17 devices provided, followed
by Bachelor's and Master's degree holders who were the biggest users for six devices each. High
school graduates or lower were not the biggest users of any device.
In terms of traditional devices, diploma degree holders were the biggest users for five out
of the 10 traditional devices, followed by Master's or higher, Bachelor's and high-school or
lower. As for recent devices, Master's degree holders or higher were the biggest users for three
out of the seven devices, followed by Bachelor's and diploma degree holders who were the
biggest users for two devices each. High-school graduates or lower were not the biggest users for
any of the recent devices.
Further, analysis showed that Bachelor's degree holders, or higher, were the biggest users
for 10 out of the 17 devices, including five out of the 10 traditional devices, and four out of the
seven recent devices. Table 85 provides more information
168
Table 85 Use of IT devices according to level of education
Use (%)
Device (oldest first) High School
or lower Diploma Bachelor's Master's
or higher
Regular film camera 26.1 33.3 46.9 45.5 Pager 4.3 27.8 15.6 18.2 Audio Recorders 69.6 77.8 60.9 45.5 Desktop Computer 43.5 44.4 54.7 54.5 Printers 56.5 55.6 54.7 63.6 Portable Computer (Laptop) 47.8 72.2 40.6 36.4 Basic Mobile Telephone 87 94.4 96.9 100 Video Camera 34.8 44.4 42.2 36.4 Scanners 52.2 38.9 42.2 63.6 Digital Camera 52.2 72.2 53.1 45.5 Personal Digital Assistant (PDA) 4.3 5.6 15.6 9.1 MP3 Players (iPod shuffle™) 17.4 16.7 23.4 63.6 Portable Memory Devices 30.4 22.2 40.6 36.4 Handheld Translator 30.4 33.3 20.3 27.3 Advanced Mobile (Bluetooth™) 82.6 88.9 70.3 72.7 Multi-Use devices (iPod™) 21.7 16.7 15.6 27.3 Internet Telephone (Vonage™) 17.4 11.1 29.7 54.5
4.8.15 By Primary Field of Study
Data analysis showed that Computer Science/Information Technology majors were the biggest
users of six out of the 17 devices provided, followed by Business and English/Arabic Literature
majors, being the largest groups for six devices each.
As for traditional devices, computer science/information technology majors were the
biggest users for five out of the 10 devices. Arts and education majors were not the biggest users
169
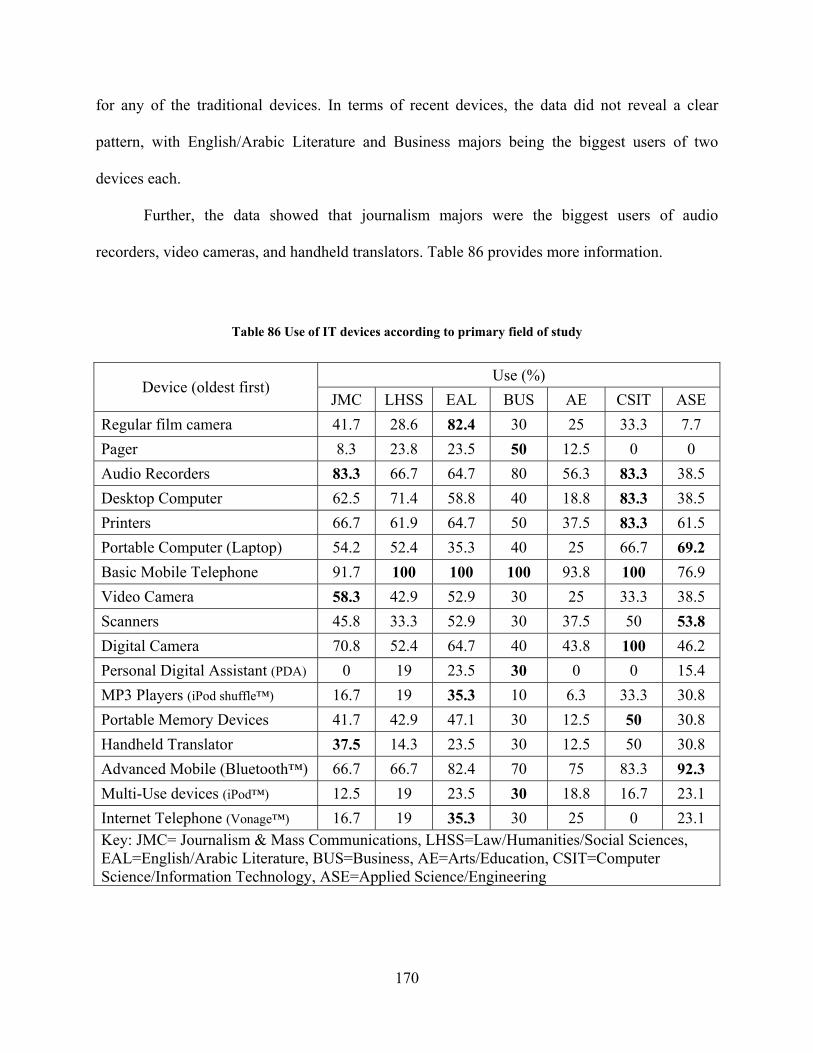
for any of the traditional devices. In terms of recent devices, the data did not reveal a clear
pattern, with English/Arabic Literature and Business majors being the biggest users of two
devices each.
Further, the data showed that journalism majors were the biggest users of audio
recorders, video cameras, and handheld translators. Table 86 provides more information.
Table 86 Use of IT devices according to primary field of study
Use (%) Device (oldest first)
JMC LHSS EAL BUS AE CSIT ASE Regular film camera 41.7 28.6 82.4 30 25 33.3 7.7 Pager 8.3 23.8 23.5 50 12.5 0 0 Audio Recorders 83.3 66.7 64.7 80 56.3 83.3 38.5 Desktop Computer 62.5 71.4 58.8 40 18.8 83.3 38.5 Printers 66.7 61.9 64.7 50 37.5 83.3 61.5 Portable Computer (Laptop) 54.2 52.4 35.3 40 25 66.7 69.2 Basic Mobile Telephone 91.7 100 100 100 93.8 100 76.9 Video Camera 58.3 42.9 52.9 30 25 33.3 38.5 Scanners 45.8 33.3 52.9 30 37.5 50 53.8 Digital Camera 70.8 52.4 64.7 40 43.8 100 46.2 Personal Digital Assistant (PDA) 0 19 23.5 30 0 0 15.4 MP3 Players (iPod shuffle™) 16.7 19 35.3 10 6.3 33.3 30.8 Portable Memory Devices 41.7 42.9 47.1 30 12.5 50 30.8 Handheld Translator 37.5 14.3 23.5 30 12.5 50 30.8 Advanced Mobile (Bluetooth™) 66.7 66.7 82.4 70 75 83.3 92.3 Multi-Use devices (iPod™) 12.5 19 23.5 30 18.8 16.7 23.1 Internet Telephone (Vonage™) 16.7 19 35.3 30 25 0 23.1 Key: JMC= Journalism & Mass Communications, LHSS=Law/Humanities/Social Sciences, EAL=English/Arabic Literature, BUS=Business, AE=Arts/Education, CSIT=Computer Science/Information Technology, ASE=Applied Science/Engineering
170
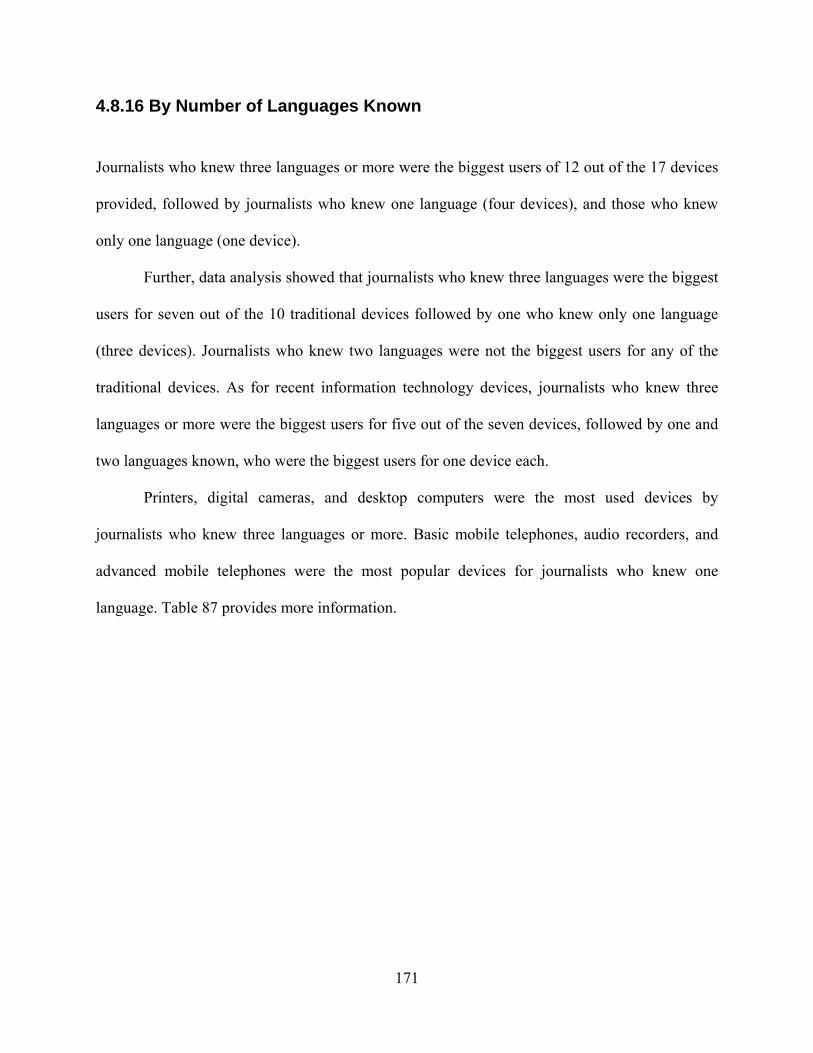
4.8.16 By Number of Languages Known
Journalists who knew three languages or more were the biggest users of 12 out of the 17 devices
provided, followed by journalists who knew one language (four devices), and those who knew
only one language (one device).
Further, data analysis showed that journalists who knew three languages were the biggest
users for seven out of the 10 traditional devices followed by one who knew only one language
(three devices). Journalists who knew two languages were not the biggest users for any of the
traditional devices. As for recent information technology devices, journalists who knew three
languages or more were the biggest users for five out of the seven devices, followed by one and
two languages known, who were the biggest users for one device each.
Printers, digital cameras, and desktop computers were the most used devices by
journalists who knew three languages or more. Basic mobile telephones, audio recorders, and
advanced mobile telephones were the most popular devices for journalists who knew one
language. Table 87 provides more information.
171
Table 87 Use of IT devices according to number of languages known
Use (%) Device (oldest first)
1 2 3+ Regular film camera 26.7 38.6 63.2 Pager 33.3 13.3 10.5 Audio Recorders 86.7 55.4 78.9 Desktop Computer 40 45.8 78.9 Printers 40 50.6 89.5 Portable Computer (Laptop) 33.3 47 52.6 Basic Mobile Telephone 100 94 94.7 Video Camera 46.7 33.7 63.2 Scanners 33.3 44.6 63.2 Digital Camera 40 51.8 78.9 Personal Digital Assistant (PDA) 20 9.6 10.5 MP3 Players (iPod shuffle™) 13.3 25.3 36.8 Portable Memory Devices 13.3 32.5 63.2 Handheld Translator 20 25.3 26.3 Advanced Mobile (Bluetooth™) 80 74.7 78.9 Multi-Use devices (iPod™) 20 14.5 31.6 Internet Telephone (Vonage™) 20 28.9 26.3 Key: 1= One language, 2= Two languages, 3+= Three or more languages known
4.8.17 By Internet Experience
Journalists with six or more years but less than nine years of experience in using the Internet
were the biggest users for eight out of the 17 devices provided. The most experienced journalists
in using the Internet, with 12 or more years of experience, were the biggest users for six out of
the 17 devices provided.
172
In terms of traditional and recent devices, journalists with six or more years but less than
nine years of experience were the biggest users for five out of the 10 traditional devices. More
experienced journalists were the biggest users for four out of the 10 devices, while journalists
with three or more years of experience but less than six were the biggest users for one device.
The least experienced journalists were not the biggest users for any of the traditional devices.
Examining the data further showed that journalists with six or more years of experience were the
biggest users for nine out of the 10 devices.
As for recent devices, journalists with six or more years of experience in using the
Internet were the biggest users for six out of the seven recent information technology devices.
Again, the least experienced journalists with less than three years of experience in using the
Internet were not the biggest users for any device. Comprehensively, journalists with six or more
years of experience in the Internet were the biggest users for 16 out of the 17 devices. Table 88
provides more information.
173
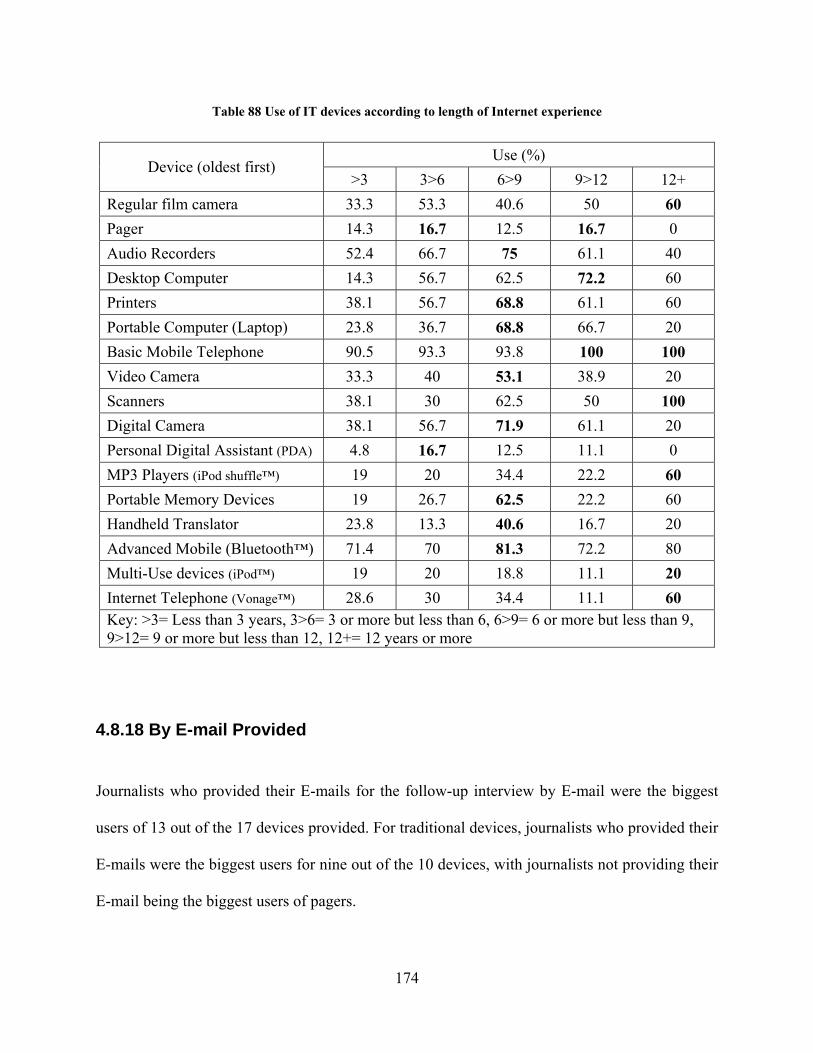
Table 88 Use of IT devices according to length of Internet experience
Use (%) Device (oldest first)
>3 3>6 6>9 9>12 12+ Regular film camera 33.3 53.3 40.6 50 60 Pager 14.3 16.7 12.5 16.7 0 Audio Recorders 52.4 66.7 75 61.1 40 Desktop Computer 14.3 56.7 62.5 72.2 60 Printers 38.1 56.7 68.8 61.1 60 Portable Computer (Laptop) 23.8 36.7 68.8 66.7 20 Basic Mobile Telephone 90.5 93.3 93.8 100 100 Video Camera 33.3 40 53.1 38.9 20 Scanners 38.1 30 62.5 50 100 Digital Camera 38.1 56.7 71.9 61.1 20 Personal Digital Assistant (PDA) 4.8 16.7 12.5 11.1 0 MP3 Players (iPod shuffle™) 19 20 34.4 22.2 60 Portable Memory Devices 19 26.7 62.5 22.2 60 Handheld Translator 23.8 13.3 40.6 16.7 20 Advanced Mobile (Bluetooth™) 71.4 70 81.3 72.2 80 Multi-Use devices (iPod™) 19 20 18.8 11.1 20 Internet Telephone (Vonage™) 28.6 30 34.4 11.1 60 Key: >3= Less than 3 years, 3>6= 3 or more but less than 6, 6>9= 6 or more but less than 9, 9>12= 9 or more but less than 12, 12+= 12 years or more
4.8.18 By E-mail Provided
Journalists who provided their E-mails for the follow-up interview by E-mail were the biggest
users of 13 out of the 17 devices provided. For traditional devices, journalists who provided their
E-mails were the biggest users for nine out of the 10 devices, with journalists not providing their
E-mail being the biggest users of pagers.
174
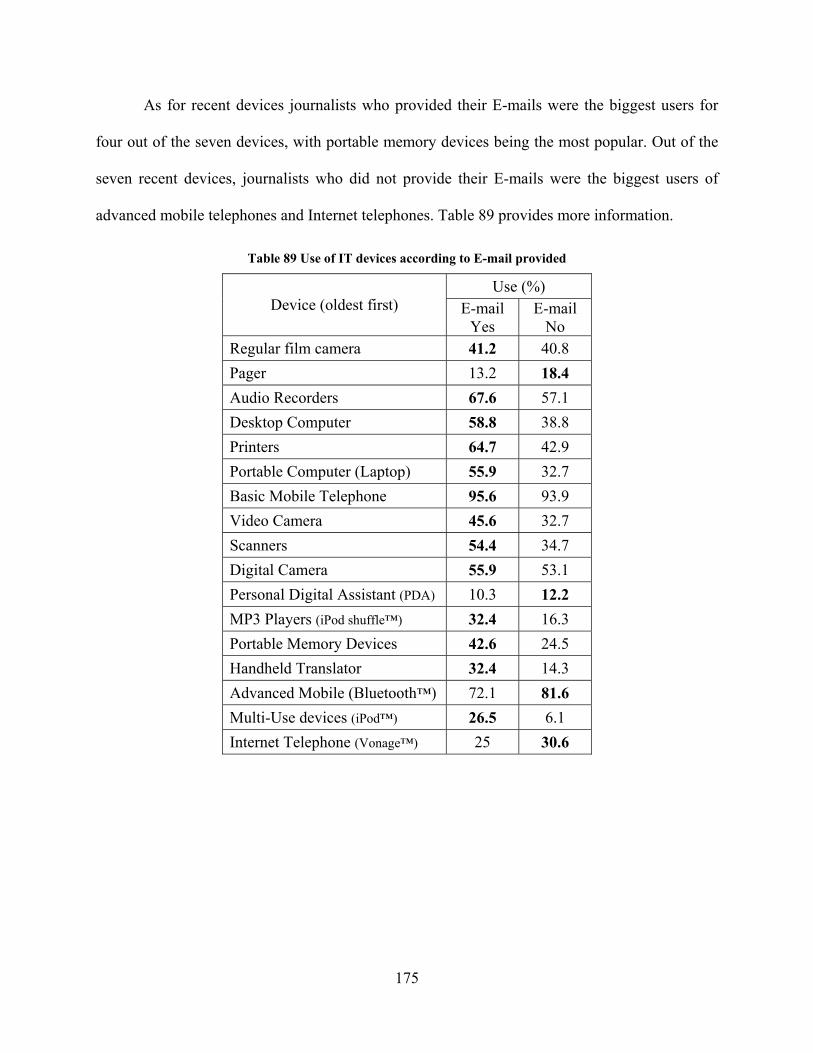
As for recent devices journalists who provided their E-mails were the biggest users for
four out of the seven devices, with portable memory devices being the most popular. Out of the
seven recent devices, journalists who did not provide their E-mails were the biggest users of
advanced mobile telephones and Internet telephones. Table 89 provides more information.
Table 89 Use of IT devices according to E-mail provided
Use (%) Device (oldest first) E-mail
Yes E-mail
No Regular film camera 41.2 40.8 Pager 13.2 18.4 Audio Recorders 67.6 57.1 Desktop Computer 58.8 38.8 Printers 64.7 42.9 Portable Computer (Laptop) 55.9 32.7 Basic Mobile Telephone 95.6 93.9 Video Camera 45.6 32.7 Scanners 54.4 34.7 Digital Camera 55.9 53.1 Personal Digital Assistant (PDA) 10.3 12.2 MP3 Players (iPod shuffle™) 32.4 16.3 Portable Memory Devices 42.6 24.5 Handheld Translator 32.4 14.3 Advanced Mobile (Bluetooth™) 72.1 81.6 Multi-Use devices (iPod™) 26.5 6.1 Internet Telephone (Vonage™) 25 30.6
175
4.9 RQ7- COMPARISON OF INFORMATION BEHAVIORS
A number of findings from this study validated ones of a previous study conducted in Kuwait
(Mumtaz, Al-Ansari & Abdullah, 2004). This study found that the Internet was important for
finding difficult-to-find facts. Similarly, the previous study found that fact-checking and
verification were important factors that encouraged the use of the Internet.
Further, the previous study conducted in Kuwait found that the Internet was critically
important to journalists, who expressed a high degree of satisfaction towards the medium. This
finding was validated by findings from this study that showed Kuwaiti journalists and ones who
graduated from institutions in Kuwait were highly dependent on the Internet as a source of
information.
In terms of problems faced online, the previous study found time, lack of training, and
information overload to be major obstacles. This study found that time was a major obstacle,
followed by speed of the Internet connection, and language. Training and information overload
were found to be smaller obstacles faced by less than a quarter of the journalists surveyed. This
could reflect an improvement in Internet-related behaviors over the last few years as training,
education, or even personal experience, assisted journalists in overcoming the training and
information overload problems that they encountered initially.
A study conducted in the UK targeting the Internet-related behaviors of journalists
showed that journalists used the Internet to access newspaper/magazine sites, official sites, and
institutional sites including universities (Nicholas, Williams, Cole & Martin, 2000). In terms of
journalists in Kuwait, this study found the Internet was most important to access newspaper sites,
search engines, and news services. Institutional and governmental sites were ranked seventh and
176
eighth in importance by journalists in Kuwait. This could be due to a lack of Kuwaiti, and
Arabic, information-based websites that could be useful to journalists. Therefore, it is less likely
that journalists in Kuwait would use the Internet to find such information, and could possibly
rely on local sources of information.
In terms of E-mail-related behaviors, journalists in the UK indicated that overcoming
time differences, convenience and cost were the major attractions of E-mail (Nicholas et al.,
2000). Journalists in Kuwait reflected similar preferences, indicating that convenience, file
uploading/downloading and overcoming time differences were the three top attractions of E-
mail. The cost of using E-mail was ranked lower in Kuwait than in the UK. This could be due to
the free-access provided to journalists in Kuwait by their organizations. Also, the cheap cost of
Internet access in Kuwait could be a factor in making cost a non-factor for use of E-mail.
As for E-mail problems, journalists in the UK indicated that the lack of face-to-face
interaction was the single most worrying problem of E-mail. This problem was not reflected by
journalists in Kuwait, as this study found unsolicited messages to be the biggest problem
journalist faced when using E-mail. Lack of face-to-face interaction was ranked sixth by
journalists in Kuwait. This could be due to a lack of E-mail use to conduct interviews in Kuwait,
making face-to-face interaction less of a worry.
The study conducted in the UK found that 15 percent of journalists used listservs, while
28 percent used newsgroups compared to 55.1 percent of Kuwaiti journalists who used listservs
and 72.9 percent who used newsgroups. This significant difference could be due to the timing of
the two studies, as the UK study was conducted in 2000 while the Kuwait study was conducted
in 2006. Internet's popularity has risen significantly and constantly over the years, brining
awareness to the different tools and applications it provides.
177
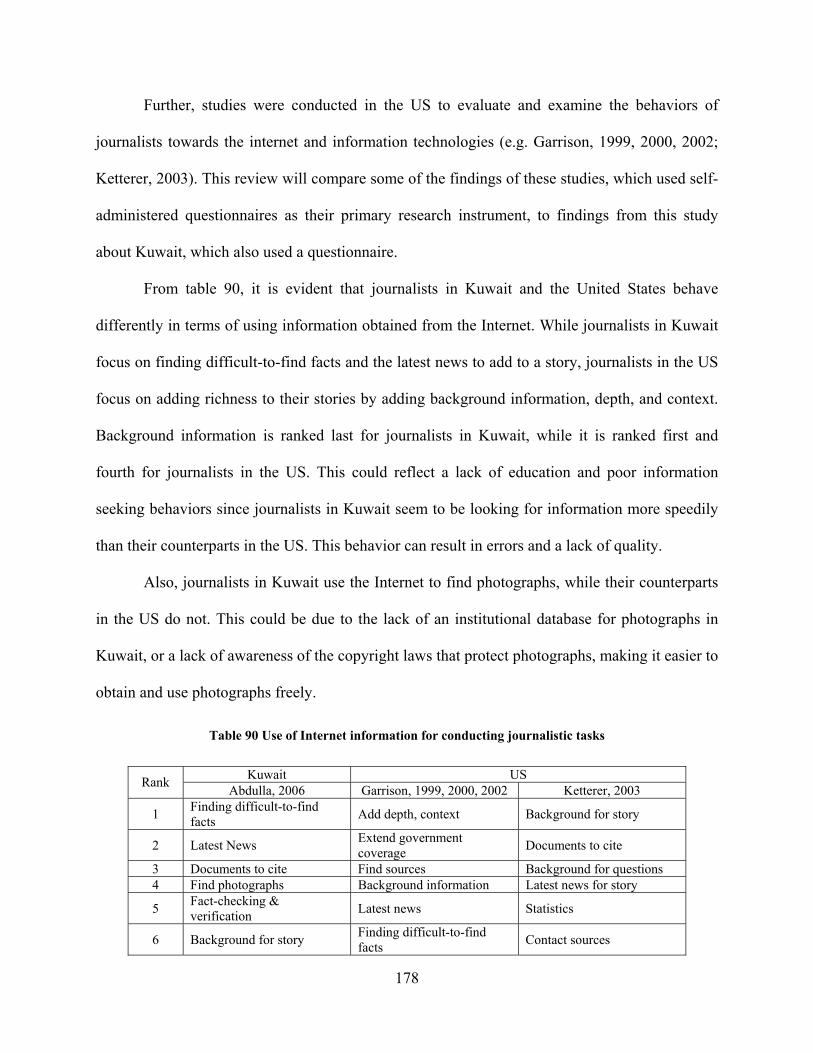
Further, studies were conducted in the US to evaluate and examine the behaviors of
journalists towards the internet and information technologies (e.g. Garrison, 1999, 2000, 2002;
Ketterer, 2003). This review will compare some of the findings of these studies, which used self-
administered questionnaires as their primary research instrument, to findings from this study
about Kuwait, which also used a questionnaire.
From table 90, it is evident that journalists in Kuwait and the United States behave
differently in terms of using information obtained from the Internet. While journalists in Kuwait
focus on finding difficult-to-find facts and the latest news to add to a story, journalists in the US
focus on adding richness to their stories by adding background information, depth, and context.
Background information is ranked last for journalists in Kuwait, while it is ranked first and
fourth for journalists in the US. This could reflect a lack of education and poor information
seeking behaviors since journalists in Kuwait seem to be looking for information more speedily
than their counterparts in the US. This behavior can result in errors and a lack of quality.
Also, journalists in Kuwait use the Internet to find photographs, while their counterparts
in the US do not. This could be due to the lack of an institutional database for photographs in
Kuwait, or a lack of awareness of the copyright laws that protect photographs, making it easier to
obtain and use photographs freely.
Table 90 Use of Internet information for conducting journalistic tasks
Kuwait US Rank Abdulla, 2006 Garrison, 1999, 2000, 2002 Ketterer, 2003
1 Finding difficult-to-find facts Add depth, context Background for story
2 Latest News Extend government coverage Documents to cite
3 Documents to cite Find sources Background for questions 4 Find photographs Background information Latest news for story
5 Fact-checking & verification Latest news Statistics
6 Background for story Finding difficult-to-find facts Contact sources
178

In terms of the types of information journalists obtain from the Internet, US journalists
focused on government sites and reports, while journalists in Kuwait ranked that type of
information eighth out of 19. Again, this could be due to the lack of official Kuwaiti presence
online compared to the websites, and information, being disseminated by the many different
institutions of the US government. Sites of other newspapers were ranked third and fourth in
importance by US journalists, while it was the most important online source of information for
journalists in Kuwait. This could be due to the fierce competition and the geographical location
of the Kuwaiti newspapers. All seven daily newspapers in Kuwait are located in one block. This
adds to the fierce competition for readership and advertisers between the newspapers. Although
similar competition does exist in the US, newspapers are more widely dispersed, and news
coverage can vary from city to city.
Further, journalists in Kuwait ranked search engines higher than their counterparts in the
US, implying their confidence in the medium, and their dependence on it as findings elsewhere
in this study indicated. Organizations, reference, and statistics sites were ranked low in
importance by journalists in Kuwait compared to ones in the US. Again, competitive practices,
geographical location, and the nature of the workplace in Kuwait and the US could affect the
importance of the types of information found online. Table 91 provides more information.
Table 91 Types of information obtained from the Internet
Kuwait US Rank Abdulla, 2006 Garrison, 1999, 2000, 2002 Ketterer, 2003 1 Other newspapers Government sites Government reports 2 Search engines Statistics sites Reference sites 3 News services Search engines Other newspapers 4 Magazine sites Other newspapers Search engines 5 Press releases Organizations Laws & regulations 6 Scientific sites Environmental sites Statistics sites
179
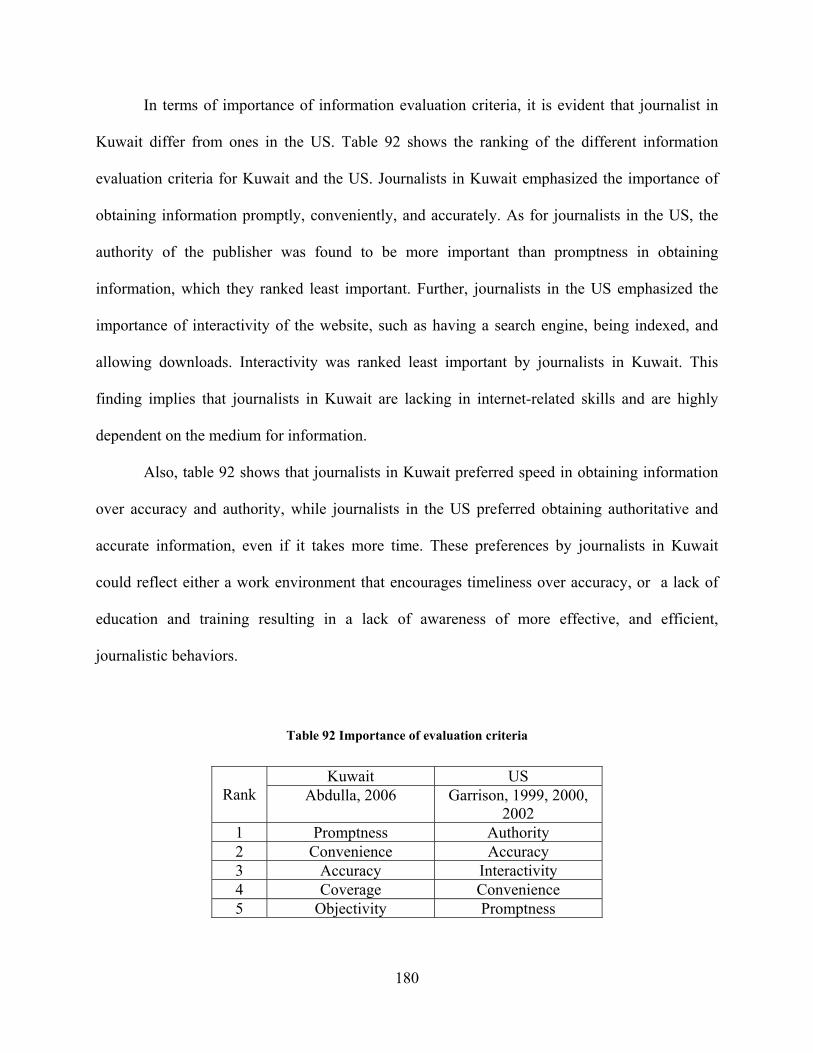
In terms of importance of information evaluation criteria, it is evident that journalist in
Kuwait differ from ones in the US. Table 92 shows the ranking of the different information
evaluation criteria for Kuwait and the US. Journalists in Kuwait emphasized the importance of
obtaining information promptly, conveniently, and accurately. As for journalists in the US, the
authority of the publisher was found to be more important than promptness in obtaining
information, which they ranked least important. Further, journalists in the US emphasized the
importance of interactivity of the website, such as having a search engine, being indexed, and
allowing downloads. Interactivity was ranked least important by journalists in Kuwait. This
finding implies that journalists in Kuwait are lacking in internet-related skills and are highly
dependent on the medium for information.
Also, table 92 shows that journalists in Kuwait preferred speed in obtaining information
over accuracy and authority, while journalists in the US preferred obtaining authoritative and
accurate information, even if it takes more time. These preferences by journalists in Kuwait
could reflect either a work environment that encourages timeliness over accuracy, or a lack of
education and training resulting in a lack of awareness of more effective, and efficient,
journalistic behaviors.
Table 92 Importance of evaluation criteria
Kuwait US Rank Abdulla, 2006
Garrison, 1999, 2000,
2002 1 Promptness Authority 2 Convenience Accuracy 3 Accuracy Interactivity 4 Coverage Convenience 5 Objectivity Promptness
180
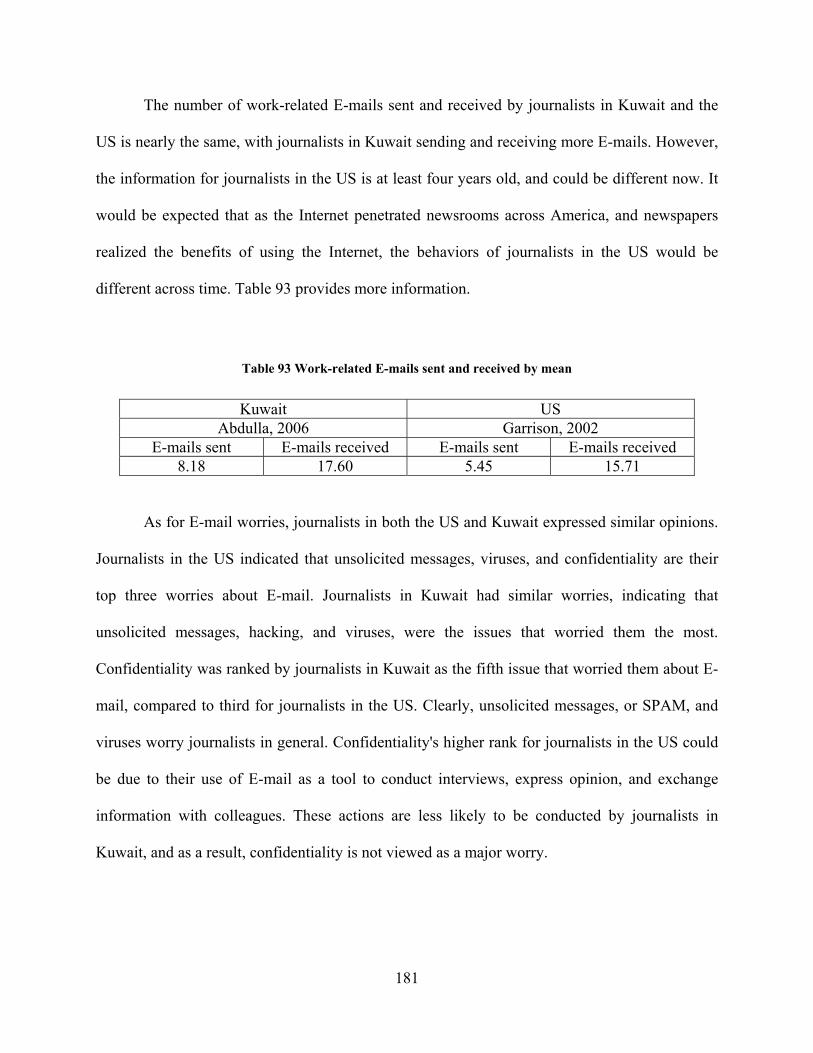
The number of work-related E-mails sent and received by journalists in Kuwait and the
US is nearly the same, with journalists in Kuwait sending and receiving more E-mails. However,
the information for journalists in the US is at least four years old, and could be different now. It
would be expected that as the Internet penetrated newsrooms across America, and newspapers
realized the benefits of using the Internet, the behaviors of journalists in the US would be
different across time. Table 93 provides more information.
Table 93 Work-related E-mails sent and received by mean
Kuwait US Abdulla, 2006 Garrison, 2002
E-mails sent E-mails received E-mails sent E-mails received 8.18 17.60 5.45 15.71
As for E-mail worries, journalists in both the US and Kuwait expressed similar opinions.
Journalists in the US indicated that unsolicited messages, viruses, and confidentiality are their
top three worries about E-mail. Journalists in Kuwait had similar worries, indicating that
unsolicited messages, hacking, and viruses, were the issues that worried them the most.
Confidentiality was ranked by journalists in Kuwait as the fifth issue that worried them about E-
mail, compared to third for journalists in the US. Clearly, unsolicited messages, or SPAM, and
viruses worry journalists in general. Confidentiality's higher rank for journalists in the US could
be due to their use of E-mail as a tool to conduct interviews, express opinion, and exchange
information with colleagues. These actions are less likely to be conducted by journalists in
Kuwait, and as a result, confidentiality is not viewed as a major worry.
181

Overall, journalists in Kuwait reflected areas of strength and weakness when compared to
ones in the UK and US. In terms of E-mail, journalists in Kuwait reflected satisfactory behaviors
in terms of usage and worries. However, a weakness was reflected for using Internet information
to conduct journalistic tasks, the types of information being sought, and information evaluation
criteria. These issues require education and practical training to improve the Internet-related
behaviors of journalists in Kuwait, and raise their awareness in relation to journalistic practices
and norms that would improve the work environment, and the final output of journalists.
4.10 FOLLOW-UP INTERVIEWS BY E-MAIL
Of the 34 journalist randomly chosen for the follow-up interviews by E-mail, 12 responded
within the set time-frame. This could have been due to the timing of the interviews, which was
during the holy month of Ramadan. Usually, work hours are decreased during Ramadan while
the workload remains the same which creates a hectic work environment. Also, the low response
rate could be due to the lack of awareness and interest in participating. None of the previous
studies conducted in Kuwait used this method, and therefore, it was a new approach that could
have been given less importance by journalists. Despite that lack of awareness and participation,
it was necessary to introduce this method in order to develop it and use it more effectively in
future studies.
Of the 12 journalists who responded to the follow-up interviews, two responses were
unusable and were not included in the analysis. These responses were brief and were not focused
182
on the topic being examined. As for the other 10 responses, some answers were brief, while
others were focused on personal issues rather than the general question being posed. Overall, the
researcher used satisfactory and insightful answers for inclusion in this section.
4.10.1 Question 1
"In your opinion, do you think that the Internet and other information technologies encourage
females to pursue careers in journalism or not? Why?"
Journalists were asked for their opinions regarding the Internet in relation to the
behaviors of females in pursuing careers in journalism. The goal was to gauge the overall
feelings, and possibly uncover new issues for future research. The responses were unanimous in
emphasizing the importance of the Internet and information technologies in encouraging females
to pursue careers in journalism. Reasons included the Internet's ability to save time and make
efforts more efficient, its ability to provide content that is comprehensive regardless of
geographical location, and its convenience.
From the responses, it was evident that fieldwork was the biggest barrier females faced as
journalists. However, the Internet and information technologies were the major force behind
overcoming the barrier of fieldwork, and welcoming females to the journalism sector. This could
partly explain why females were more skilled than males in using information technologies
including E-mail and the WWW. Some answers to this question were as following:
• Of course the Internet and information technologies assist females in merging with the
world of journalism especially since journalism requires a lot of effort and time.
Looking at society in Kuwait, females have a lot of responsibilities that require a part of
183
their time and effort. However, the Internet encourages females to be a part of the world
of journalism. Personally, I think the Internet and information technologies are the most
important means for communicating with readers and conducting feature stories.
Further, Internet and E-mail allow me to pursue my college studies without the need of
being physically present at the newspaper.
• Yes because females are not able to work in the field at all times, including traveling to
far away places, the Internet eases the potential obstacles of time and distance. Also, the
Internet allows females to be more aggressive in looking for information. For example,
in a face-to-face interview, a female reporter might be less aggressive in asking
questions to a high-ranking male official than when conducting the interview through
the Internet. The Internet provides females with access to information that was not
accessible before.
• The Internet and information technologies are not the only, or main, reasons behind
encouraging females to work as journalists but they are factors amongst many others
that assist in conducting daily tasks which enables females to complete these tasks
without feeling that they are neglecting other daily tasks in their lives.
All responses viewed the Internet positively in relation to females and pursuing careers in
journalism. Respondents indicated that the Internet was one factor of several others that affected
females pursuing careers in journalism. Other factors included social norms, workplace practices,
and personal responsibilities.
184
4.10.2 Question 2
"Please describe a situation where the Internet was instrumental in the development of a news
story."
This question was asked to collect responses that showed how journalists were using, and
potentially, benefiting from the Internet. A high number of respondents described a situation
where they could not find a certain fact, and turned to the Internet to find it. Search engines were
highly appreciated and were positively mentioned by most respondents. This was similar to the
finding of the questionnaire, where search engines were ranked by journalists as the second most
important WWW resource after newspaper websites. A number of insightful situations were as
following:
• The most important situation was during the parliamentary elections this year (2006). I
was supposed to send the results of the vote-count to the newspaper on a continuous
basis. However, the fax machine at the polling station where I was located at was broken,
and it was very difficult to go to the newspaper to deliver the updates. However, thanks to
the Internet, I was able to send the updates. In other situations, sometimes we need
reports about some international universities which are difficult to find in libraries in
Kuwait. Using the Internet, it is easier to locate such information with the help of search
engines. The world of indexing in libraries has become extinct and made easier through
the Internet.
• When I first started, it was difficult for me to write about any topic because I was
inexperienced. The Internet was my primary assistant that I turned to for help, until I
gained more experience with time. I used the Internet for all the tasks that were assigned
185
to me such as writing or editing a news story, finding story ideas, finding facts, and even
conducting research.
• A while back, I was assigned a story that required information about a certain Arab
actress that I had little knowledge of. With the help of the Internet, I was able to find a lot
of information about her which allowed me to complete the story effectively and in a
timely manner.
Clearly, respondents emphasized the importance of the Internet for finding information.
However, as previous findings of this study indicated, this high reliance on the Internet could
have catastrophic results if the proper evaluation skills were not utilized.
4.10.3 Question 3
"Do you encourage enhancing the current educational curricula in Kuwait to improve Internet-
related behaviors of journalists? Why? And what changes would you recommend?"
The majority of respondents agreed that the current educational curricula in Kuwait were
obsolete and required a comprehensive effort to evaluate and update them. Another issue that
received high mention by respondents was the issue of theoretical versus practical training.
Respondents emphasized the theoretical aspect of curricula in Kuwait, indicating that the
practical aspect was neglected and required intervention. Respondents thought that educational
curricula were a primary reason behind journalists' lack of skills and knowledge of the Internet
and information technologies. Some answers were as following:
• In addition to being a journalist, I am a student majoring in computers and information
technology. In my opinion, there is a divide between journalists and information
186
technologies that requires immediate remedy through enhancing the out-of-date
educational curricula. My experience and skills with computers in information
technologies did not come from studying because there is a serious functional disorder in
the educational curricula especially in the scientific-based majors such as computers.
Some universities and schools teach computer science from a theoretical perspective and
that is a big mistake as it is useless to teach such things theoretically. From my personal
experience, practical training and use is important for learning. I learned what I know
about computers, the Internet, and other technologies through means of trial-and-error
since I was not taught how to use them at school or even during college. This should not
be the case.
• I encourage and support changing educational curricula at both the high-school and
university levels. I suggest that curricula include not only theoretical aspects but practical
ones such as searching the Internet for information etc., which will positively affect the
future of journalism. Educational curricula should be updated to reflect the times we live
in where the Internet has become a major force in most aspects of society, and especially
in the workplace. Not educating students on how to use the Internet effectively results in
graduates who need more learning and training, making them a burden to the
organizations that hire them.
Previous findings indicated that knowledge was the third ranked barrier preventing Internet
use behind time and training. Answers to this question supplement that finding by shedding light
on the weaknesses of educational curricula in Kuwait, and the need to reform them.
187
4.10.4 Question 4
"What should training seminars and workshops focus on in order to improve Internet-related
behaviors of journalists?"
This question sought to gather responses that could raise attention of certain skills that
needed attention. Generally, respondents indicated that journalists needed intensive training in
using the Internet at all levels with a focus on basic Internet skills. Findings from this study
showed that journalists were indeed lacking the basic skills needed to use the Internet and
information technologies. Further, some respondents mentioned age as a focus for training,
indicating that older journalists were ones who needed the most training. Again, results from this
study indicated that older journalists were less skilled than their younger counterparts.
Respondents emphasized the need for training journalists on how to use E-mail, the
WWW, operating systems software, and word processing. These are all basic resources that
journalists do not have enough skills to use. Further, no respondent indicated the need for
training journalists to use databases, which was somewhat surprising. Databases are viewed as
important resources for journalists that can provide accurate and authoritative information in a
timely manner. Yet, journalists fail to mention it as an important resource that requires training.
Findings indicated that journalists were below average in using databases.
Training was the second ranked barrier that prevented Internet. Some responses were as
following:
• In my opinion, there has to be a gradual training program for journalists where it first
focuses on the basics such as turning on a computer, creating files, using word processing
software and learning its basics, and using portable memory devices. After that, the
188
training program can advance to Internet basics such as using search engines, E-mail, and
web browsers. Such a program should be mandatory for all journalists and would be
more efficient if they enroll in it when they first join the organization. These skills are
important for a journalist, and one who does not possess these skills should be given the
means to learn.
• Most journalists need training from the most experienced ones to the beginners so that
they can develop their skills. For older, more experienced journalists, these training
programs should be mandatory as they are highly ignorant of the Internet which is
something embarrassing. As for beginning journalists, training programs or workshops
could focus on the dangers of the Internet, and how to effectively use it. Training
programs should be basic, moderate, and advanced, so that journalists can benefit
according to their skill-level. Further, workshops should be conducted on a continuous
basis to teach journalists skills related to new technologies. Workshops should not only
focus on skills, but also on issues related to journalists such as new journalist-targeted
software, ethics, and work-related issues.
• Training programs should be made brief and focused to allow journalists to enroll and
benefit. Current training programs consume a long time, making employers less inclined
to encourage journalists to enroll in such programs. Brief, and focused, training would be
more effective in encouraging journalists to enroll. For example, a program could target a
specific tool such as E-mail. Within one day, or a few hours, a journalist learns about the
basics of E-mail in a practical manner. This approach would be most beneficial as
journalists can then custom-design their training requirements. Another possible approach
is to organize brief workshops at each organization. This makes participation much more
189
appealing and convenient. In conclusion, the main problem for training and workshops is
not the content, but the time-related issues related to enrolling in such programs.
Employers should be aware of this, and be more accommodating to the needs of their
employees.
4.10.5 Question 5
"Will creating more 'journalist friendly' systems, or software, improve Internet-related behaviors
of journalists? What would these systems consist of? (For example E-mail, browsing, virus
protection, etc.)"
The question was asked to seek ideas that could improve Internet-related behaviors of
journalists. The respondents indicated that such systems or software would be positive and
beneficial to journalists as it would focus their skills on specific tools rather than each journalist
using a different tool.
Respondents emphasized the need for protection from hacking and viruses, protection
from unsolicited messages (SPAM), and a system that was fast in its operation. Findings from
this study showed that unsolicited messages (SPAM), hacking, and viruses were the top ranked
E-mail worries/shortcomings respectively. The answers to this question supplemented that
finding as journalists indicated that they would prefer systems that protected them from those
issues.
Also, respondents emphasized the need for a fast system. This could be partly explained
by the slow Internet connections that journalists use now. Findings from this study showed that
almost half the respondents choose speed of their Internet connection as an obstacle faced online,
190
ranking speed as the second obstacle after time. Therefore, it is not surprising that journalists
prefer a fast system as it would allow them to use their time more efficiently. Some responses to
this question were as following:
• More journalist friendly systems and software will spread electronic awareness since
focused systems and software are easier to work with. In my opinion, software has to be
developed with high protection from hackers, auto-scanning and saving for attached files
for E-mails, in addition to better protection from SPAM.
• Behaviors cannot be taught to journalists and are personal in nature. Although it is not
teachable, it distinguishes journalists who are more capable of using such systems and
software.
• Journalist friendly systems and software cannot by themselves improve the behaviors of
journalists. However, if these systems and programs were presented along with training
and education, it could raise the awareness of journalists and affect their Internet-related
behaviors positively. New systems and programs targeting journalists should focus on
privacy. As privacy is a highly important issue for journalists, it is important that
journalists trust the systems and programs that they use to provide them with security for
their privacy. E-mail, the WWW, translation capabilities, virus protection, sending and
receiving files abilities, and speed are all issues to consider when creating a system or
program targeting journalists. A final issue would be access to a vast array of information
sources.
191
5.0 DISCUSSION The results obtained from the data analysis will be discussed in this section to provide a clear,
complete, and meaningful picture of the current situation in Kuwait in relation to Internet-related
behaviors of journalists. The discussion will follow the pattern established by the data analysis
by discussing each research question in the order that it was analyzed earlier.
5.1 INTERNET ACCESS, NATURE, AND BARRIERS Although 80 percent of respondents were satisfied with the Internet connection provided by their
institutions, the majority of respondents preferred to access the Internet from home followed by
work. This preference could be due to the lack of time at work, the speed of the connection at
home versus work, and censorship. Also, preferring to access the Internet from home could be
attributed to the fact that commercial Internet access is cheap in Kuwait when compared to other
countries in the region. Accessing the Internet from home could give users a sense of privacy not
available at work or elsewhere. Further, home use of the Internet could be more convenient for
respondents, as time, or lack of it, is the major obstacle faced online.
Of the 10 respondents who indicated that they did not use the Internet, more than half
reported that time, training, and knowledge were the barriers preventing from using the Internet.
70 percent of the non-users were 30 years of age or older, while 30 percent were younger than
192
30. Further, 80 percent of the non-users of the Internet were males. Data analysis showed that
these findings are in accordance with others that showed females were more skilled, and more
adapt at using the Internet than males.
As for the 107 respondents who did use the Internet, 71 percent were males. However,
counting the non-users of the Internet showed that more females used the Internet than males.
Further, more than 73 percent of the responding females who used the Internet were younger
than 30 years old, compared to less than 33 percent of males in that same age category. More
than 67 percent of males who indicated that they used the Internet were 30 years or older,
compared to less than 26 percent of females. This significant difference could be attributed to the
ages of the journalists. More than 54 percent of female journalists were younger than 25 years
old, while the largest age category for males was 35 or more but less than 40 with 28.6 percent of
the population. Only 8.3 percent of male journalists were younger than 25 years old.
Further, data showed that females were less experienced than males in being journalists,
implying that females are recent graduates, and are just starting in the field. This could be an
important factor affecting the Internet-related behaviors of females, as recent graduates are likely
to have learned in a more information technology friendly environment in comparison to ones
who graduated in the early 1990s and before, since the Internet was not as robust and popular as
it is nowadays.
193

5.1.1 Barriers
Of the 10 respondents who indicated that they did not use the Internet, more than half reported
that time, training, and knowledge were the barriers preventing them from using the Internet. As
for the rest of the respondents, time, speed of connection, and language, were the main obstacles
faced online. It is evident that time, or lack of it, plays an important role in the Internet-related
behaviors of respondents.
In terms of gender, significant differences occurred for time, information overload, and
lack of guidance to sources. Males emphasized the importance of time as an obstacle followed by
speed of the Internet connection and language while females emphasized speed of the Internet
connection, lack of guidance to sources, and time. This could be attributed to the work processes
of males and females. Males are more likely to be in the field covering news stories than
females, and therefore, find time, or the lack of it, as a major obstacle. For females, time is not as
important as the lack of guidance to sources. This can be explained by the fact that females are
generally better skilled than males in using the Internet and its applications, according to results
found elsewhere in this study. The difference in skills can imply that females can manage their
time better, and therefore, do not view time as a major obstacle online.
Although 80 percent of respondents indicated that they were satisfied with the
connections provided to them by their institutions, females expressed more dissatisfaction than
males. Again, the Internet-related behaviors of females showed that they are more capable of
using the medium, and are more dependent on it for their work. Therefore, it is normal that
females emphasize the speed of the connection more than males, as the Internet was viewed as
more important to their work.
194
Quantitative data regarding the length of experience in using the Internet showed that
females were more experienced than males, with the minimum length of experience for females
being two years. This finding supports previous findings regarding females having better
Internet-related behaviors than males. Assuming that 22 years of age is the age at which
individuals are expected to graduate from university as Bachelor's degree holders, it can be
assumed than a majority of female journalists were enrolled in universities during the period
from 1998 to 2001, as their average age was 27 years old for this study. The same calculation for
males shows that they were enrolled at a university during the period from 1990 to 1994. In
1990, the Internet was just starting to be available to the public in the US and Kuwait, and was in
its beginning stage. Educational institutions were going through a transition period that involved
evaluating the new medium, incorporating some uses, acquiring the technology, and changing
curricula. As for the period from 1998 to 2001, the average for females, educational institutions
had started to embrace and incorporate many facets of the Internet and the technologies
associated with it. Curriculums were better-designed to teach students about the Internet.
Therefore, education could be a major factor affecting the Internet-related behaviors of
journalists, with the youngest journalists, both male and female, being more skilled and more
embracing of the Internet than their older counterparts.
Further analysis showed that more than 74 percent of female journalists had between
three and nine years or experience in using the Internet, compared to 52 percent of males for the
same time length. The least experienced journalists with less than 3 years of experience in using
the Internet were composed of one female (3.23 percent) and 20 males (26.67 percent). Clearly,
females, who were younger than males, were more experienced in using the Internet.
195
5.1.2 Findings
Major findings for this research question included the following:
• Time, or the lack of it, was the major barrier preventing journalists from using the
Internet. Also, time was the biggest obstacle facing journalists when online.
o Time, speed of connection, and language were the top three obstacles facing
males online.
o Speed of connection, lack of guidance to sources and time were the top three
obstacles facing females online.
• A large majority of journalists are satisfied with the Internet connection provided by their
institutions. However, a majority of journalists preferred to access the Internet from their
homes, followed by work, mobile access, and Internet cafes.
• Females were more experienced than males in using the Internet, with a mean of 6.3
years compared to 6.1 years for males.
196
5.2 INTERNET APPLICATIONS USE AND NATURE It was expected that E-mail and the WWW were the most popular, and most widely used,
Internet applications by journalists in Kuwait. Further, results showed that journalists were above
average in using only three of the 19 Internet applications listed- the WWW, search engines, and
E-mail. Use of more recent applications and technologies such as blogs, and podcasting, was
nearly non-existent. This reflects a lack of awareness and skill of the more recent innovations.
This is a weakness that needs to be addressed in order to improve Internet-related behaviors.
Analysis for each application by gender showed that females used all the applications
listed more than males except for newsgroups and open-source software. Again, this could be
due to the difference in ages between females and males, as the majority of females are younger
than 25, while males are mostly 30 years or older. This finding was supported by further analysis
that showed journalists in the youngest age category, younger than 25 years old, spent more time
using E-mail, the WWW, search engines, and messengers in comparison to journalists in the
oldest age category, 40 years or older.
In terms of education, results showed that graduates from educational institutions in
North America and Europe spent significantly more time than their peers who graduated from an
institution in Kuwait or the Middle East. Again, education was a major factor affecting Internet-
related behaviors of journalists. It can be assumed that educational institutions in North America
were quicker to embrace the Internet and its related technologies than institutions elsewhere, as
the Internet's infrastructure was more advanced in North America. This step of embracing the
Internet assisted these institutions in enhancing their curricula, training, work-habits, and others,
faster than institutions elsewhere in the world.
197
5.2.1 Nature of E-mail
Females spent significantly more time than males in using E-mail. Due to social values and
beliefs, and even politics, males are more likely than females to be assigned tasks that require
fieldwork. This implies less time for males to spend using the Internet. It could also indicate that
females prefer to communicate using E-mail to break through the social values and beliefs that
hinder their work. In terms of other variables, amount of time spent using differed for age,
location of educational institution, number of languages known, and E-mail provided for the
follow-up interview by E-mail. For age, the youngest age group, younger than 25, spent
significantly more time than the oldest age group, 40 years or older. This could be attributed to
the embracing of the new technologies by the younger journalists, and their ability to adopt and
utilize these technologies faster than their older counterparts. Also, younger journalists were,
more likely than not, educated during the 1990s and early 2000s where information technology
was gaining significant popularity, and was being adopted by educational institutions around the
globe. It is probable that the older journalists completed their education at least 15-20 years ago
during an age where information technologies, and the Internet, were not yet popular, or widely
adopted.
In terms of location of the educational institution that the journalist graduated from,
results showed a significant difference between journalists who graduated from in Kuwait and
North America/Europe on one hand, and those who graduated from institutions in the Middle
East on the other. Graduates from North America/Europe and Kuwait spent significantly more
time than their ones from Middle Eastern institutions. This finding implies that educational
institutions in North America/Europe and Kuwait could be more aware of the Internet and the
many different information technologies available, and prepare their students accordingly.
198
As for the number of languages known, results indicated that journalists who knew two
or more languages spent more time using E-mail than their counterparts who knew only one
language. This is likely due to the fact that journalists who do not know English are less likely to
spend a large amount of time using E-mail, as they would probably face difficulties in navigating
and utilizing E-mail in an efficient manner. Further, journalists who provided their E-mail
address voluntarily for the follow-up interview by E-mail spent significantly more time using E-
mail than journalists who did not. Again, this finding is normal as journalists who are more
skilled in using E-mail are more likely to have a personal E-mail and spend more time using it
than their counterparts who do not own a personal E-mail.
Most journalists indicated that they used E-mail which is an expected finding. On
average, a journalist in Kuwait sends eight work-related E-mails a day, and receives nearly 18. In
terms of gender, females sent and received more E-mails a day than males. Again, this finding
reflects the skill-level and dependency of females on using the Internet in comparison to males.
E-mail attractions included convenience, uploading/downloading abilities, overcoming
time differences, and speed. Further, storage capabilities, cost, and indexing and searching, were
not as highly favored features of E-mail. This could indicate a lack of awareness of the features
of E-mail, and a lack of skills. Storage, indexing, and searching, can be very useful features that
can assist journalists in conducting their tasks more efficiently.
In terms of E-mail shortcomings, journalists indicated that unsolicited messages, hacking,
and viruses, were the top three issues that worried them. Other worrying issues that were further
down in rank included the fate of the message, confidentiality, lack of face-to-face interaction,
and time consuming. Again, the results indicate that journalists lack the proper awareness in
relations to E-mail.
199
5.2.2 Nature of WWW
More than 89 percent of the population indicated that they use the World Wide Web (WWW).
Females spent significantly more time using the WWW than males. Also, similar to E-mail, the
youngest age group spent significantly more time using the WWW than the oldest group.
Further, journalists who provided their E-mails spent more time using E-mail than ones who did
not provide their E-mails. The results are somewhat similar to the nature of E-mail usage.
In terms of WWW resource importance, journalists found nine of the 19 resources or
applications provided to be average or higher in terms of importance. These included sites for
newspapers, search engines, news services, magazines, press releases, scientific information,
institutions, government, and directories. Again, the results imply a lack of awareness of the
resources available through the WWW. Journalists indicated less than average importance for
resources such as reference sites, journals, statistical sources, and databases.
When the data was analyzed by gender, it was found that females placed more
importance on 17 out of the 19 WWW resources listed. Also, males and females differed
significantly for government sites, institutional sites, and search engines. In all three instances,
females placed more importance on the resource or application than males. The result reinforces
the finding about females spending more time using the Internet and its applications than males.
Again, this could be due to the work nature of each gender, age and education, and the effects of
social norms and values.
Results of the data analysis of WWW resource importance by primary field of study
uncovered nine significant differences between the groups. These differences occurred for
reference sites, entertainment/sports, financial/company, government, institutions, odd/obscure
information, databases, uploading/downloading files, and live streaming video/audio. In eight of
200
the nine instances of significance difference, computer science/information technology majors
were present. Further, computer science/information technology majors gave more importance to
the WWW resources mentioned than other majors. In six instances out of the nine, computer
science/information technology majors gave more importance to the WWW resources mentioned
than law/humanities/social sciences majors. Although it is expected that computer
science/information technology majors would find WWW resources more important than others
due to their educational backgrounds and training, the result is significant and implies that
law/humanities/social sciences majors need more education and training in relations to the
WWW resources available.
201
5.2.3 Findings
Major findings for this research question included the following:
• World Wide Web, search engines, and E-mail were the most popular Internet applications
used by journalists.
• FTP, podcasting, open-source software, telnet, RSS feeds, and Wikis were the least
popular applications.
• Females spent more time than males in using 17 out of the 19 applications listed, with a
significant difference for the WWW and E-mail. Females spent significantly more time
using the WWW and E-mail than males.
• Younger journalists spent significantly more time using the applications listed than their
oldest peers.
• Journalists who graduated from institutions in North America and Europe spent
significantly more time using the applications listed than ones who graduated from
institutions in Kuwait or the Middle East.
• A majority of females had at least 6 years of experience in using the Internet.
• Females sent and received more work related E-mail per day than males.
• Convenience was the major attraction of E-mail for the population.
o Speed was the most popular attraction for females, while convenience was the
most popular for males.
• Unsolicited messages were the major shortcoming of E-mail for the population.
• Newspaper sites, search engines, and news services were the most important WWW
resources for the population.
202

o 10 out of the 19 WWW resources were viewed as less than average in importance.
• Females placed more importance than males on 18 out of the 19 WWW resources listed.
• Computer Science/Information Technology majors placed more importance on the
WWW resources listed than their peers.
5.3 INFORMATION EVALUATION CRITERIA Journalists found all nine information evaluation criteria provided to be more than average in
importance, with promptness and convenience in obtaining information, and accuracy, being the
most important. Cost of obtaining information, authority of publisher, and interactivity with
website were less important. Again, females placed more importance on eight out of the nine
criteria than males. Males placed more importance on convenience in obtaining information than
females.
The results indicate that journalists are willing to trade authority of publisher for
promptness and convenience. This could be due to the nature of their work, and the many
deadlines they face on a daily-basis. However, authority of publisher is an important criterion
that should not be overlooked. Further, objectivity and currency of information ranked fifth, and
sixth, in terms of importance. This could indicate the lack of understanding of these criteria, or
reflect a work habit where time consumed finding the information is more important than the
information itself. It is important for journalists to understand information evaluation criteria and
be able to utilize them effectively. The findings were troubling, and are cause for effective
educational and training interventions so that the Internet is used efficiently without affecting the
203
quality of output. Further, work habits could be changed to allow journalists sufficient time to
use the WWW in an effective manner, rather than focus on speed over objectivity and authority.
In terms of gender, results were similar except for one significant difference in terms of
cost of obtaining information. Females placed more importance on that criterion than males.
Since previous results indicated that females spent more time using E-mail and the WWW than
males, it is expected that cost would be important for them, as they depended on the WWW more
than males for information.
For females, promptness in obtaining information and accuracy were the two most
important criteria, while males indicated that promptness and convenience were the two most
important criteria for them. Time could be an important factor here, as males, who indicated that
time was the biggest obstacle they faced online, could be exchanging accuracy for convenience.
As for females, time was the third major obstacle they faced online, implying that females had
more time than males, and are not willing to exchange the accuracy of the information obtained
online for any other factor.
Data analysis of information evaluation criteria by primary journalistic beat reflected
significant differences for five of the eight criteria. Sports/entertainment journalists were the
main source of significant difference, as they placed less importance on promptness, accuracy,
coverage, objectivity, and authority, than their counterparts who covered features, and in some
instances local, politics/economics, and education/arts & literature. This result is expected as
sports/entertainment journalists rely heavily on the local community for news, and are less likely
to turn to the WWW for information partly because local presence on the WWW is not yet large
enough to be regarded as a source of local information. Also, newspapers in Kuwait usually
obtain information regarding international sports and entertainment through news wires and
204
services. However, increasing the education and training of journalists who cover
sports/entertainment can be useful and efficient for newspapers, as it could assist journalists in
supplementing their news stories with facts and figures from the WWW, resulting in richer, more
complete, news stories.
In terms of location of educational institution that the journalist graduated from, one
instance of significance was found for interactivity with the website between graduates from
North America/Europe and ones from the Middle East. Again, this could be the result of North
American educational institution's being more open and adoptive of information technologies
than their Middle Easter counterparts. Since the Internet and information technologies were
primarily created and presented to the mass markets by North America, it is expected that
graduates from their institutions are more aware of, and skilled, in using these technologies.
Further, the Internet and a number of information technologies were presented in North America
much earlier than the Middle East, which could account for the differences found here and
elsewhere in the analysis.
Further, high-school graduates placed significantly more importance on promptness than
Master-degree of higher holders. This is a troubling finding, indicating a need to educate high-
school graduates on the information evaluation criteria, and methods of utilizing them
effectively. Further, emphasizing promptness could indicate that high-school graduates prefer
WWW resources that provide information quickly, rather than ones that provide accurate and
authoritative information. This preference could affect news stories negatively, as erroneous
information is more likely to be present. Education and practical training is necessary to improve
the awareness of high-school graduates regarding evaluation criteria.
205
5.3.1 Findings
Major findings for this research question included the following:
• All nine information evaluation criteria were found to be more than average in
importance by the population, with promptness in obtaining information being the most
important one.
• The authority of the publisher was viewed as less important.
• Females placed more importance than males on eight out of the nine evaluation criteria.
o Promptness in obtaining information and accuracy were the most important
criteria for females, while convenience in obtaining information and promptness
were the most important for males.
o A significant difference in means for gender was found for cost of obtaining
information. Females placed more importance on cost than males.
• Journalists who covered sports/entertainment placed least importance on the information
evaluation criteria.
5.4 INTERNET AND JOURNALISTIC TASKS
Journalists found the Internet's importance to be average to very important for 11 of the 12
journalistic tasks provided. By gender, females placed more importance on the Internet for
conducting eight out of the 12 in comparison to males. Only using the Internet to write an
editorial, feature, opinion, or analysis, was found to be less than average in terms of importance.
206
Using the Internet was most important for finding difficult-to-find facts, the latest news to add to
a news story, and documents to cite. These results could have implications for citing sources
correctly, or plagiarism, since the three most important uses of the Internet for journalistic tasks
included finding facts, news, and documents, to supplement news stories.
Although conducting research and finding story ideas were found to be important, they
were not as highly ranked as the three tasks mentioned earlier. Again, raising awareness of the
resources available on the Internet could improve journalistic tasks and make work processes
more efficient and accurate. Promptness was found to be the most important information
evaluation criteria, and therefore, affects what information, such as facts, latest news, or
documents, is obtained for addition to news stories. As journalists rely more on promptness, it is
more likely that their facts, latest news, or documents, contain errors that could have been
avoided if other information evaluation criteria were utilized.
Data analysis by age revealed two instances of significant difference between the
youngest age group and the oldest one for finding difficult-to-find facts, and fact-checking and
verification. In addition to spending more time using E-mail and the WWW, the youngest
journalists found the Internet significantly important for the two tasks mentioned than their
oldest counterparts. This implies that younger journalists are more likely to depend on the
WWW for their facts which is both positive and negative. It is positive since it indicated that the
younger journalists are more embracing of the information technologies available and are likely
to utilize it for the benefit of their work-related tasks. However, it is negative since depending on
the WWW, without the proper education or awareness, could result in avoidable errors and
mistakes that could be magnified in a medium such as a newspaper. Further, this finding
reinforces previous ones about younger journalists being more adoptive and embracing of the
207
Internet and information technologies than their older counterparts. This could be due to a
number of reasons including the period when the journalist was receiving his/her education, as
educational institutions started vigorously embracing the Internet in the late 1990s and early
2000s in comparison to earlier periods.
In terms of length of experience, results indicated that beginning journalists relied on the
Internet more to conduct research and define terms of concepts. Although the population ranked
conducting research and defining terms of concepts as 10th and 11th respectively, beginning
journalists indicated a heavy reliance on the Internet for conducting those two tasks. This could
imply that beginning journalists either lack the skills required to conduct their journalistic tasks
efficiently, or lack the necessary guidance from their older counterparts. Further, relying on the
Internet could be due to the beginning journalist's fearfulness of asking others for assistance and
directions to resources, as it might be viewed as a sign of incompetence in a highly competitive
environment. Therefore, it is important to address this dependence on the Internet through
education, training, and mentoring by more experienced journalists. Depending on the Internet is
not a negative behavior by itself but doing so without the proper education and training could be
negative which could reflect on the output produced by the journalists through errors,
misinformation, and plagiarism.
In terms of citizenship, four tasks displayed significant differences involving Kuwaiti
citizens and those from the Al-Sham countries. Kuwaiti citizens placed more importance on
using the Internet to find documents, latest news, difficult-to-find facts, and fact-checking and
verification, than their counterparts from the Al-Sham countries. This finding was reinforced
when data was analyzed by the location of the educational institution that the journalist
graduated from. For seven of the 12 tasks provided, graduates from institutions in Kuwait
208

differed significantly than their counterparts who graduated from North America/Europe. For
one task, graduates from institutions in Kuwait differed from their counterparts who graduated
from institutions in the Middle East. Generally, graduates from educational institutions in Kuwait
placed more importance on using the Internet to conduct journalistic tasks than their
counterparts.
These findings are troubling and indicate that Kuwaiti citizens and graduates of Kuwaiti
institutions rely on the Internet heavily to conduct their journalistic tasks. Although the findings
indicate that these two groups highly embrace the Internet, they also raise questions about the
nature of that embracement that require further research and evaluation. These include the
following:
• Are Kuwaiti citizens more embracing of the Internet due to educational curriculums that
highly encourage Internet and information technologies usage? Are these curriculums
well-established and built according to systematic means and methods?
• Are the work habits of Kuwaiti citizens similar, or different, than their counterparts from
other countries? Do Kuwaiti citizens conduct fieldwork as much as their counterparts
from other countries?
• What is the quality level of news stories produced by Kuwaiti citizens compared to non-
Kuwaiti citizens in terms of errors and richness of content?
• Do experts in journalism education and knowledgeable journalists regard a high-
dependence on the Internet for information as a positive, or negative, behavior?
Answering the questions mentioned is important as it could have great implications on
journalism in Kuwait in terms of reinforcing current behaviors, or adjusting them, if necessary,
through training and education.
209
5.4.1 Findings
Major findings for this research question included the following:
• The Internet was found to be most important for finding difficult-to-find facts, the latest
news to add to a story, and documents to cite.
• The Internet was least important for defining terms of concepts, finding story ideas, and
writing editorials or features or opinions or analysis.
• Females, in comparison to males, found the Internet to be more important for conducting
eight of the 12 tasks listed.
• Age and length of experience as a journalist affected the amount of importance placed on
the Internet for conducting tasks. Younger, less experienced journalists placed more
importance on the Internet than the oldest journalists.
• Kuwaiti citizens and graduates of educational institutions in Kuwait placed more
importance on the Internet for conducting tasks than their counterparts.
• Journalists who knew more than one language placed more importance on the Internet for
conducting tasks than ones who knew only one language.
5.5 INTERNET FOR INFORMATION Journalists indicated that they are average to more likely to use the Internet to find information
about four out of the 12 information types provided. The four information types were political,
arts and culture, tourism, and educational. Journalists were least likely to use the Internet to find
210
information about security/defense, and energy/industrial. Using the Internet for political
information is more likely to be related to international politics than local since the local
presence on the WWW is not significant yet. It could be that journalists supplement international
political news received through the news wires and services with information from the Internet to
provide more richness to their coverage. As for arts/culture and tourism, results are not surprising
since that type of information is not readily available in the local community, and is only
available through small libraries and related institutions that are not widely known. Increasing
awareness of the resources available in the local community could benefit journalists looking for
arts/culture and tourism information.
For the rest of the information types provided, such as science/technology,
business/economy, and historical/geographical, journalists indicated that they were less likely to
use the Internet to find such information. This could be due to the lack of awareness of the
resources available online, or the lack of interest in finding such information and being satisfied
with what is available locally. Again, education is important for raising awareness of the
resources available online to enable journalists to have a wide spectrum of sources of
information to access.
Analysis by gender showed that males, in comparison to females, were more likely to use
the Internet for nine out of the 12 information types listed. Males were most likely to use the
Internet for political information while females were most likely to use it for arts and culture
information. Females were least likely to use the Internet to search for security and defense
information while males were least likely to search for energy and industrial information.
When the data was analyzed by other variables, only the number of languages known
displayed a significant difference for four of the 12 information types provided. Journalists who
211
knew three languages or more indicated that they were more likely to turn to the internet for
information about business/economy, entertainment, sports, and tourism, than ones who knew
only one, or two, languages. Of the four information types that displayed significant differences,
only tourism was ranked higher than average by the general population. This indicates that
language is important in terms of using the Internet for specific types of information, as
journalists who knew three languages or more were significantly more likely to use the Internet
for information types valued at below average by the general population. Targeted education for
journalists could improve the situation, allowing journalists to use the Internet more efficiently.
For example, journalists who cover business can be provided with a list containing the most
popular and widely used business terms in Arabic and English.
5.5.1 Findings
Major findings for this research question included the following:
• Journalists are most likely to use the Internet to find information about politics, arts and
culture, tourism, and education. They are least likely to use the Internet to find
information related to entertainment, security and defense, and energy and industry.
• Only four of the 12 information types listed had means greater than average, indicating
that journalists do not heavily rely on the Internet for information.
o Males were more likely than females to use the Internet to find information about
nine of the 12 types of information provided, with the most likely search focusing
on political information.
212
o Females were most likely to use the Internet to find information about art and
culture.
• Level of education and languages known affected the likeliness of using the Internet to
search for specific types of information. The likelihood of using the Internet to search for
specific types of information increased as the educational level and the number of
languages known increased.
5.6 SKILLS AND USAGE
5.6.1 Skill-level for Applications/Tools/Software
Journalists were skilled at the average to expert level in using four out of the 21 applications
provided including E-mail, the WWW, operating systems, and word processing software. The
general population indicated a lack of skill in using many applications such as web browsers,
readers, databases, and language tools. Journalists were least skilled in using more recent
innovations such as podcasting, RSS feeds, and Wikis. These results are troubling and indicate
an important need for raising the skill-levels of journalists through education and training. Also,
results indicate that despite the embracing of the Internet and information technologies,
journalists in Kuwait are functioning in a more traditional, and obsolete, work environment.
Increasing the skill-levels of journalists would affect the journalism sector in Kuwait positively,
and introduce a new era of journalism.
213
Functioning in an obsolete environment might be satisfactory for the current time where
only seven daily newspapers compete for readership, but as the Internet and information
technologies further penetrate societies and human life with time, it will be unsatisfactory to be
operating under the current conditions. Also, the increasing competition that is expected to arise
between newspapers once new newspapers start publishing will make such work environments
impractical for competing. Raising the skill-levels of journalists would not only benefit the
journalists themselves and the daily tasks and routines, but the newspaper itself in terms of more
efficient and timely output.
The analysis showed that females were found to be more skilled than males in using all of
the 21 applications provided. Further, females were significantly more skilled than males in
using 11 of the 21 applications provided. This could be attributed to the amount of time females
spend using these applications in comparison to males as results showed. Also, it can be
attributed to the nature of work of each gender. Males are more likely to conduct fieldwork,
while females were more likely to use technology to conduct their work tasks. Also, time, age,
and education are major factors that were found to affect Internet-related behaviors of journalists.
Further research is required to examine the difference in skill-level between females and males.
In terms of age, the youngest journalists were significantly more skilled than others in
using five of the 21 applications provided. As previous results showed, younger, less
experienced, journalists depended more on the Internet than their older counterparts. Results for
skill-levels reinforce previous findings.
As for length of experience as a journalist, data supported previous findings, where the
less experienced, and younger journalists, were the most skilled ones in using information
technology applications. Further, the length of experience in using the Internet affected skill-
214
level. Journalists with six to nine years of experience in using the Internet were the most skilled,
while ones with the least experience, less than one year, were least skilled in using the
applications. Clearly, the data indicated a link between age, length of experience as a journalist,
and length of experience in using the Internet and skill-level. Younger, less experienced
journalists, tended to be more experienced in using the Internet, and more skilled in using
information technology applications.
As for E-mail, journalists who provided their E-mail for the follow-up interview by E-
mail were more skilled than ones who did not in using 20 of the 21 applications provided. That
difference in skills was significant for 10 of the applications. This result implies that journalists
who own a personal E-mail are more likely to be skilled in using information technologies.
Further, journalists who did not provide an E-mail address, could be less interested, or less
embracing, of information technologies in general, and therefore, are less skilled in using the
applications.
The number of languages known by a journalist significantly affected skill-levels for nine
of the 21 applications provided. The main difference was between journalists who knew three
languages or more, and ones who knew only one language. Multi-lingual journalists were more
skilled in using the nine information technology applications. This could be due to the fact that
most of these information technologies operate using the English-language. Therefore,
journalists who know only one language are less likely to embrace, or utilize, these information
technologies. Educational interventions could improve the situation, and assist journalists in
using information technologies more efficiently. Further, designing multi-lingual information
technology applications can be useful in assisting journalists in this regard.
215
The data analysis according to primary field of study indicated that computer
science/information technology majors were more skilled than other majors in using five of the
21 applications provided. The less skilled groups for the five applications were journalism, and
arts and education majors. Although it is expected that computer science/information technology
majors would be more skilled in using information technologies, education is needed to raise the
skill-levels of journalists majoring in all areas.
5.6.2 Usage of Information Technology Devices
Data analysis was conducted to examine the journalists' usage of 17 information technology
related devices. Results showed that journalists in Kuwait used devices that can be viewed as
conventional, or ones that are well-established in the mass markets and have been available for
the longest time. These include devices such as advanced mobile telephones, audio recorders,
printers, desktop and laptop computers, and scanners.
However, results showed that journalists did not use more recent information technology
innovations such as portable memory devices, Internet telephony, multi-use devices, and
personal digital assistants. These findings reinforce skill-level results that showed journalists as
being most skilled in using conventional applications such as E-mail and the WWW, while being
least skilled in using more recent innovations such as podcasting, RSS feeds, and Wikis. Again,
journalists are functioning in an obsolete environment that can be greatly enhanced through the
correct and efficient use of the Internet and information technologies.
In terms of future behavior, journalists reflected mixed opinions. The highest number of
respondents indicated that they do not use, and do not intend to use in future, devices such as
216
Internet telephony, MP3 players, and personal digital assistants. However, for portable memory
devices, handheld translators, and multi-use devices, the highest number of respondents indicated
that they could start using such devices in future. The mixed responses could be a result of lack
of awareness of the functions of the different devices. Educating journalists on the features,
benefits, and functions of technology devices, conventional and more recent ones, is necessary.
This ensures that journalists are aware of the information technologies available, and can make a
decision on whether to use a certain device or not to benefit their daily work routines.
Further, the analysis showed that the highest number of journalists do not use, and do not intend
to use, regular film camera and pagers. This result was expected as these two devices have
become obsolete as digital cameras and mobile telephones became widely available and
affordable.
In terms of traditional and recent information technology devices, a majority of the
population indicated that they used eight out of the 10 traditional devices, and only one of the
recent devices. As for no use and no intention of using, journalists indicated that preference for
two traditional devices and three recent ones. However, journalists indicated that they could start
using half of the recent devices in future. These results show that journalists are not well-
informed on the recent devices, as their preferences do not reveal a pattern, and their responses
were mixed.
Analysis by gender showed that females used 12 out of the 17 devices listed more than
males. As their skill-levels are higher, their experience in using the Internet is longer, it is
expected that females used information technology devices more than males. However,
examining recent devices showed that males used four out of the seven devices listed more than
females did. This result was reflected by the future use data, where females were more likely
217
than males to start using five out of the seven devices listed. Again, results were mixed and did
not reveal a clear pattern. Although females were more experienced and skilled in using the
Internet, they were not using recent devices as much as males. This could be due to a number of
factors including lack of awareness, satisfaction with what is currently available, or the cost of
obtaining newer technologies. Further research is required to examine these issues including the
devices afforded to journalists by their institutions, and ones that they have to acquire
themselves.
In terms of age, the youngest journalists were the biggest users of eight out of the 17
devices. This finding reinforces previous ones related to age and experience, skill-level, and
dependency on the Internet. Younger journalists are more likely to use, and be skilled at using,
the Internet than their older counterparts. Analysis by length of experience further reinforced that
finding as it indicated that the least experienced journalists, with less than one year of
experience, were the biggest users for 10 out of the 17 devices listed.
Results of the analysis by citizenship did not reveal a pattern. Kuwaiti citizens,
Egyptians, North Americans, and Europeans, were the biggest users for six of the 17 devices
listed. For two devices, Egyptians and North Americans and Europeans were tied. The results
clearly indicated that journalists from the Al-Sham countries were the biggest users of one device
only- MP3 players. This could indicate a lack of skill that needs to be addressed promptly.
As the educational-level of journalists increased, so did their information technology
device usage. Bachelor-degree holders or higher were the biggest users for 10 out of the 17
devices listed. On the other hand, journalists who were high-school graduates or lower were not
the biggest users for any of the 17 devices listed. This proves that education and information
technology usage are closely related, further emphasizing the need for better education.
218
In terms of primary fields of study, analysis showed that computer science and
information technology majors were the biggest users of seven out of the 17 devices listed. This
is an expected finding due to the nature of computer science education that is engrained in
information technologies and devices. On the other hand, journalism majors were the biggest
users of only two out of the 17 devices, with both being traditional devices. Clearly, journalism
curricula need to be improved and enhanced to accommodate new technologies that can make
work processes more efficient, and save time for the time-deficient journalists.
The number of languages a journalist knew directly affected device-usage behaviors.
Analysis showed that journalists who knew three languages or more were the biggest users for
12 out of the 17 devices listed, including seven traditional and five recent devices. As the number
of languages known increased, so did the usage of an information technology device. Clearly, the
data indicated a relationship between language and device usage, which further emphasizes the
need for better education.
Length of experience in using the Internet was also directly related to information
technology device usage. As the length of experience increased, so did the usage of devices.
Journalists with at least six years of experience in using the Internet were the biggest users of 16
out of the 17 devices listed, including six out of the seven recent devices. The most experienced
journalists in using the Internet, with 12 or more years of experience, were the biggest users for
six out of the 17 devices listed. The least experienced, with less than three years of experience in
using the Internet, were not the biggest users for any of the 17 devices listed. Education can play
an important role here, as providing students with experience early-on during their educational
careers can enhance their Internet-related behaviors, including the usage of information
technology devices.
219
Finally, data analysis showed that journalists who provided their E-mail addresses were
significantly more likely to use information technology devices than ones who did not.
Journalists who provided their E-mails were the biggest users of 13 out of the 17 devices listed,
including nine traditional devices and four recent devices. Clearly, journalists who have a
personal E-mail are more skilled and are bigger users of information technologies than ones who
do not, or did not provide one. It could be due to awareness, knowledge, or education. This
significant difference could be addressed through brief workshops that emphasize the benefits of
E-mail, and how it can be used by journalists most effectively.
Overall, age, length of experience as a journalist, level of education, primary field of
study, languages known, length of experience in using the Internet, and E-mail, were all major
factors that shaped the usage-patterns of information technology devices by journalists. Further,
length of experience in using the Internet was the biggest factor from all the ones mentioned
previously in affecting information technology devices usage. The more experience journalists
have with the Internet, the more likely it will be that they use information technology devices,
both traditional and recent.
5.6.3 Findings
Major findings for this research question included the following:
• Journalists were most skilled in using E-mail and the WWW. They were skilled more
than average for four of the 21 applications listed.
• Journalists were least skilled in using podcasting, RSS feeds, and Wikis, which were the
applications that were least used in terms of time.
220
• Females were more skilled in using all of the 21 applications listed, with the difference
with males being significant for 11 applications.
• Younger journalists were more skilled than older ones in using the applications listed.
• Journalists who provided their E-mail addresses were more skilled than ones who did not
for 20 of the 21 applications listed, with the difference being significant for 10
applications.
• Journalists who knew three languages or more were more skilled than ones who knew
only one language in using the applications listed, with the difference being significant
for nine out of the 21 applications listed.
• Computer Science/Information Technology majors were more skilled than other majors
in using the applications listed, with the difference being significant in right instances.
• Basic and advanced mobile telephones, audio recorders, and printers were the most
popular information technology devices used by journalists. The least used device by the
population was a personal digital assistant.
• The youngest journalists were the biggest group of users for eight out of the 17 devices
listed.
• The least experienced journalists were the biggest group of users for 10 out of the 17
devices listed.
• The amount of usage of information technology devices increased with educational level,
number of languages known, length of experience in using the Internet, and if the
journalist had provided an E-mail address.
221
5.7 SUMMARY OF DISCUSSION Data analysis revealed that most print journalists in Kuwait lack the necessary skills required to
use and efficiently operate the Internet and other information technologies. Time was a major
factor that prevented the use of the Internet and also was the major obstacle journalists faced
online. In terms of time spent using application related to the Internet, it was found that E-mail
and the WWW were the two most popular and heavily used applications. Females spent more
time, and where more skilled, than males in using all of the Internet and information technology
applications provided.
Convenience was found to be the highest ranked factor that attracted print journalists to
E-mail, while unsolicited messages was ranked as the highest factor that worried them. As for
the WWW, journalists reflected a lack of knowledge and resources available online, and
indicated that less than half of the 19 resources provided were average or higher in importance.
In terms of information evaluation criteria, print journalists found all criteria to be
important with promptness in obtaining information being the most important one. The cost of
obtaining information was more important for females than males. That finding reflected earlier
results in terms of females spending more time using the Internet, and were more dependent on
the medium than males.
Journalists indicated that the Internet was most important for finding difficult-to-find
facts, and fact-checking and verification. Kuwaiti citizens and graduates of educational
institutions in Kuwait reflected a high dependence on the Internet as a source of information.
Kuwaiti citizens relied heavily on the Internet to conduct their journalistic tasks.
222
As for using the Internet to find specific types of information, journalists indicated that
they would most likely search for political information online. Eight of the 12 information types
were not likely to encourage print journalists to search for information online. In terms of skills,
the general population showed less that average skill in using 17 of the 21 applications provided.
Journalists were most skilled in using conventional applications such as E-mail and the WWW,
while they were least skilled in using more recent applications such as podcasting, RSS feeds,
and Wikis. Females were more skilled than males in using almost all of the applications listed.
Information technology devices used by journalists reflected results of their skill-level.
Journalists used more conventional devices such as mobile telephones, printers, and audio
recorders. As for the more recent innovations, journalists were mixed, as they indicated that they
would be willing to use some devices but not all of them. That finding implies that journalists
lack the knowledge about recent innovations, and how these devices can assist them in
conducting their daily tasks.
Overall, results showed that journalists have a lack of awareness and knowledge when it
comes to the Internet and information technologies. Their Internet-related behaviors were poor,
and required intervention to improve them gradually over time.
223
6.0 CONCLUSION AND RECOMMENDATIONS
6.1 SUMMARY
This study was conducted to gain a better understanding of Internet-related information
behaviors of journalists in Kuwait. Results showed that journalists in general lacked the skills,
awareness, and knowledge, required to efficiently use the Internet and its related technologies.
In terms of different measurement variables, females displayed better Internet-related
information behaviors than males, yet they remain lacking in a number of areas. Age was an
important factor shaping Internet-related information behaviors, as younger, less experienced,
journalists were more skilled in using the Internet and its applications. However, young
journalists displayed a dependency on the Internet for information, especially during their first
years as journalists. This was a troubling finding as dependency on the Internet as a main source
of information could have negative consequences in future.
Also, educational-level and the number of languages known were found to be important
factors that affected Internet-related information behaviors. As the educational-level and number
of languages increased, so did the skills, awareness, and usage behaviors of journalists.
Graduates from educational institutions in Kuwait, and Kuwaiti citizens, placed the most
importance on the Internet for conducting journalistic tasks, reflecting a high dependency on the
medium. However, graduates from institutions in North America/Europe spent the most time
224
using the Internet and its applications. E-mail and the World Wide Web (WWW) were found to
be the two most popular Internet applications used by journalists, who were most skilled in using
them. Time was found to be a major obstacle hindering the Internet.
As for E-mail, its convenience was a major attraction while unsolicited messages were its
major drawback. Further, journalists indicated that newspaper websites were the most important
resource available to them on the WWW, followed by search engines and news services. The
Internet, and the WWW, were mainly used to find facts, the latest news, and documents.
Journalists indicated that the Internet was important for conducting 11 out of 12 journalistic
tasks. As for evaluation, all journalists found information evaluation criteria to be important,
with promptness in obtaining information being the most important one.
Also, journalists indicated that they were most likely to use the Internet to obtain four out
of 12 types of information listed, including political, arts and culture, tourism, and education. As
the educational-level and the number of languages known increased, the likeliness of using the
Internet to obtain information also increased. The data showed a direct link between the two
variables mentioned and Internet use.
In terms of skills, journalists showed above average skill in using only four out of the 21
applications provided. Females were above average in using five applications, while males were
above average for using only E-mail and the WWW. Clearly, a lack of skills exists for both
female and male journalists in Kuwait. The length of experience in using the Internet greatly
affected skill-level. Journalists with six to nine years of experience were most skilled in using the
applications listed. Also, journalists who provided their E-mails to participate in the follow-up
interview by E-mail were more skilled than ones who did not.
225
As for devices used by journalists, the population was mostly reliant on traditional
devices, with mobile phones, audio recorders, and digital cameras being the most popular.
Similar to recent Internet applications such as blogs, wikis, and podcasting, recent devices are
underutilized by journalists. Females used technology devices more than males. Again, the least
experienced journalists, who were most skilled in using information technology devices, were
the biggest users of many information technology devices. In addition to be being most skilled in
using information technology applications, Computer Science/Information Technology majors
were the biggest users for a number of information technology devices. The number of languages
known greatly affected device usage, as journalists who knew three languages or more were the
biggest users of a majority of the information technology devices listed.
In addition to being the most skilled in using information technology devices, journalists
who had six to nine years of experience in using the Internet were found to be the biggest group
of users for a number of devices. Also, journalists who provided their E-mail addresses were
found to be bigger users of information technology devices than ones who did not.
6.2 CONCLUSIONS
Journalists in Kuwait are lacking in terms of Internet-related information behaviors. They can be
regarded as being at the beginning stages of Internet adoption, and its effective usage. Spending
most time, and being most skilled, in using E-mail and the WWW is an encouraging beginning
for journalists in Kuwait. However, the Internet is not limited to E-mail and the WWW, and can
226
be a major source of information, and better work practices, if used properly and with efficient
awareness and knowledge.
Further, journalists in Kuwait are divided by age, with the youngest journalists displaying
better Internet-related information behaviors than their older colleagues. This could be a direct
result of education, as journalists who received their education recently tended to display better
behaviors than ones who did not. Other important factors dividing journalists in Kuwait include
educational-level, number of languages known, length of experience as a journalist, and length of
experience in using the Internet. Also, gender was found to be a factor in displaying better
information behaviors, as females displayed better information behaviors than males.
Finally, journalists in Kuwait are lagging behind their counterparts in the developed
world in terms of Internet-related information behaviors. Data showed that journalists in Kuwait
compared well with their counterparts in the developed world in terms of E-mail and WWW
behaviors. However, other issues such as information evaluation and using the Internet to
conduct journalistic tasks showed that journalists in Kuwait required more experience.
Overall, enhancing the Internet-related information behaviors of journalists in Kuwait
requires a multi-faceted approach that focuses on education and curricula, training, and
workplace practices.
227
6.3 RECOMMENDATIONS
Based on the findings of this study, the researcher will recommend changes in general, in
education, in training, and in workplace practices. When adopted and implemented, these
recommendations will be effective in enhancing the Internet-related information behaviors for
the benefit of journalists, newspapers, readers, educators, and society as a whole in Kuwait.
6.3.1 General
The government of Kuwait is commencing a number of initiatives targeting E-government,
information-based society, and the integration of technology into all aspects of society. In
general, there is a demanding need for raising awareness of the Internet, its applications, and the
benefits that can come from it. This need, in addition to the government's initiatives, can be
achievable by implementing the following recommendations:
• Along with the reform campaigns ongoing, launching a nation-wide campaign that
focuses on the Internet, its uses, and its benefits, can greatly raise awareness of the
medium.
• Providing inexpensive and efficient Internet access to the population, including
individuals who cannot afford Internet access.
• Creating Internet-related centers that specialize in instructing individuals on the Internet
at basic, intermediate, and advanced levels.
• Using the media to raise awareness of the Internet and its benefits by demonstrating the
basic uses of the Internet and encouraging efficient use.
228
• Publishing educational, promotional, and instructive material that can assist individuals in
learning more about the Internet and other information technologies.
• Using positive encouragement by hosting nation-wide contests and events featuring the
Internet, such as a contest for best sites representing Kuwait.
• Permanently transferring some basic governmental activities online, such as applying for
a passport, or registering to vote.
• Integrating and efficiently utilizing the Internet in the core institutions of society, to
demonstrate how the Internet can be beneficial, in addition to encouraging Internet usage.
• Emphasize Internet-related skills for obtaining government employment, where more
skilled applicants are given priority in employment.
• Establish and publicize a set of national goals related to the Internet, which are to be
achieved according to a preset timetable.
6.3.2 Education and Curricula
Education was a major factor shaping the Internet-related information behaviors of journalists in
Kuwait. As the educational-level of journalists increased, so did their Internet-related
information behaviors. Therefore, it is necessary to enhance education and curricula to enhance
journalists' Internet-related information behaviors. This can be done by implementing the
following recommendations:
• Evaluating and modifying current educational curricula at the high-school and university
level to reflect efficient Internet-related information behaviors, recent technology
applications and devices, and information evaluation criteria.
229
• Construct curricula that focus on the most recent Internet applications and information
technologies
• Construct or modify curricula to focus on practical training related to the Internet in
addition to theoretical instruction.
• Provide, or expand as needed, the information technology infrastructure, such as
computer labs hosting the latest technologies, or increasing the number of computers, or
providing a faster connection to the Internet.
• Encourage instructors to be up-to-date regarding the latest information technologies and
resources available online.
• Encourage instructors to be proactive in teaching curricula related to the Internet by
introducing new concepts, encouraging students to experiment with new technologies,
and incorporating the Internet in their daily instruction through presentation, class-work,
or homework.
• Host weekly, monthly, or yearly conferences, seminars, or lectures that focus on the latest
trends in the Internet and information technology.
• Incorporate curricula that focus on information evaluation tools, criteria, and methods.
• Create flexible curricula that can be modified every course to focus on the latest
information technologies.
• Encourage students to hand in their projects, papers, and homework electronically.
• Create a technology friendly environment for students so that they can embrace
information technologies and learn how to use them efficiently.
230
6.3.3 Journalism-related Recommendations
In addition to the previous recommendations, journalism schools in Kuwait can implement the
following recommendations to improve Internet-related information behaviors:
• Evaluate all curricula and identify ones that need modification to reflect efficient Internet
use, advancements in information technologies, and practical training in using the
Internet and information technologies.
• Broaden the perspectives of journalism students by introducing recent technologies both
theoretically and practically by instructing them and allowing them to experiment with
new devices.
• Create beat-specific curricula that focus on specific sources of information and ways of
utilizing them efficiently. For example, creating a course related to the social sciences
can focus on sources of information that are important in the social sciences and ways to
use that information efficiently as journalists.
• Emphasize through instruction the importance of information evaluation criteria, and the
important need of differentiating between good and bad information.
• Host school-wide contests that focus on the Internet in terms of best feature story written
with the assistance of the Internet, or best website on information relevant to journalists.
• Instruct students on copyright laws in the digital age, with focus on what constitutes
plagiarism and how information should be attributed correctly.
• Instruct journalists on online reporting, and the techniques that are required to be
successful in as an online reporter.
231
6.3.4 Training
In addition to education and curricula, there is a need to enhance the training of journalists in
Kuwait to improve their Internet-related information behaviors. This can be achieved by
implementing the following recommendations:
• Create institution-wide workshops targeting journalists. These workshops should be brief
in terms of time, and focused on a specific tool or application. Also, these workshops
should be available at beginner, intermediate, and advanced levels to accommodate the
different skill-levels of journalists.
• Create customized training courses for journalists in your institution after evaluating their
specific needs.
• Allocate each journalist with time on a weekly or monthly basis for the sole purpose of
training.
• Use a reward system for journalists who improve their Internet-related information
behaviors.
• Target older, more experienced journalists for comprehensive training focused on the
Internet and information technologies.
• Target younger, less experienced journalists for comprehensive training focused on
information evaluation criteria, attributing digital information and copyright laws, and the
pros and cons on dependency on the Internet.
• Host experts on Internet and information technology related issues at your institution on a
regular basis.
• Create training benchmarks that are expected from every journalist at your institution.
232
6.3.5 Workplace Practices
The third factor for improving Internet-related information behaviors is workplace practices.
Implementing the following recommendations can assist newspapers and journalists in achieving
that goal:
• Create a work environment that encourages efficient Internet and information technology
behaviors, and innovation, for the benefit of the individual and the organization. For
example, this can be done by providing positive demonstrations of how the Internet and
information technologies can be used to supplement a news story. Further, journalists
with new ideas about utilizing the Internet for the benefit of work practices should be
encouraged to express their ideas freely.
• Adopt a series of Internet and information technology related strategic goals to be
achieved after a set period of time. These goals can focus on the skills of journalists, their
training and education, and the quality of the output of journalists.
• Differentiate between online journalism and conventional journalism. Instead of
providing a print-copy of the newspaper online, a newspaper can develop and evolve by
adopting online journalism, where the newspaper is updated according to news
developments continually throughout the day.
• Encourage mentoring and knowledge sharing in the organization by creating teams of
journalists. A team can consist of an older, more experienced journalist, and a younger,
less experienced journalist. This practice can improve Internet-related information
behaviors for both journalists as the older journalists can learn about the Internet and
information technologies from their younger colleagues, while the younger journalists
can learn about journalism practices.
233

• Motivate older journalists to train and educate themselves about the Internet and
information technologies.
• Emphasize quality of information over quantity. This can be done by implementing
strategies to examine and evaluate information, and demonstrate to journalists what
quality is expected from them.
6.3.6 LIS-related Recommendations
For the LIS professionals, results of this study can assist in improving interactions with print
journalists and better-understanding their information behaviors. The following
recommendations are made to achieve that goal:
• Create guides for online resources for a variety of topics, such as politics, economics,
etc., that include a diverse list of sources such as authoritative and dependable sites,
journal sites, institutional sites, government sites, and more. These guides should be brief
yet concise so that journalists can refer to them while interacting with electronic
resources.
• Provide topic-specific library instruction that illustrates the resources available online,
and discusses issues such as access, cost, and quality-related matters.
• Provide an interactive website for the organization's library that can guide journalists
through the basics of online navigation and interaction, and provide guides and
assistance.
234
• Become pro-active in the efforts to assist journalists, especially older ones, with their
information needs by learning how to use relevant software and hardware, and be
available to provide basic technical assistance, or information, if needed.
6.3.7 System-design
From the results of this study, it was evident that Internet and information technology related
behaviors of journalists in Kuwait were lacking. However, their preferences displayed a need for
a system that is capable of assisting them efficiently in conducting their daily tasks.
Implementing the following recommendations can assist in achieving that goal:
• Create a system that provides a fast Internet connection, and makes available basic
Internet applications such as E-mail, the WWW, and a search engine.
• Create a system that is highly secure and can limit unsolicited messages (SPAM).
• Create a multi-lingual system with translation, dictionary, and thesaurus, capabilities.
• Include brief, user-friendly help instructions on how to operate the system
• Provide guides to sources of information that are screened by experts and viewed as good
information.
• Provide access to multi-lingual reference information such as encyclopedias, atlases, and
dictionaries.
• Provide beginner, intermediate, and advanced modes so that journalists can work using
an electronic environment that they are comfortable with.
• Allow remote access to the system.
235
• Adopt a flexible system that can be expanded in future to accommodate for more
complex journalistic tasks such as publishing news items electronically, which could
potentially lead to an online production system in future.
6.4 FUTURE RESEARCH
The results of this study uncovered a number of issues that require further research. These
include:
• Examining the differences in Internet-related information behaviors between males and
females, and whether time is the major factor causing that difference or whether other
factors are involved.
• Examining the reliance of Kuwaiti citizens, and graduates from educational institutions in
Kuwait, on the Internet. The examination could involve assessing the journalists'
awareness of attribution and digital copyright laws.
• Examining the work environment in newspaper organizations in Kuwait, and whether
they encourage or discourage Internet-related information behaviors. This examination
can include gender to identify any possible factors that encourage or discourage males or
females from using the Internet.
• Examining the differences in skills according to age, and whether the time of education is
the major factor causing the difference between the youngest and the oldest journalists.
• Examining the output of journalists who are skilled in using information technologies in
comparison to ones who are not according to a set of criteria chosen by the researcher.
236
• Conducting a study to examine the information behaviors of editors-in-chief at each
newspaper, to identify whether their behaviors are adequate and encouraging of Internet
and information technologies adoption, or not, and recommending improvements.
• Examining the reasons behind the low use of databases, and some technologies and
applications, such as blogs, alerts software, and RSS feeds, and whether the reasons are
related to poor information behaviors, or to other reasons such as lack of awareness, or
the lack of need to use such technologies and applications to enhance work processes and
tasks. Also, this examination could explore the nature of databases use, to identify which
databases are heavily relied on, and reasons behind that behavior, if present.
• Examining the effects of Internet experience on Internet-related behaviors, and the factors
behind such behaviors. This study found that behaviors improved as the length of Internet
experience increased. However, that improvement peaked after six to nine years of
Internet experience, and reflected a decline Internet experience surpassed the nine years
mark. A future study can examine the factors behind the behavioral patterns uncovered
by this study.
• Examining and describing the online Arabic resources that are used by journalists, and
identifying websites that are viewed as reliable ones, and ones that are not, in an attempt
to provide criteria and guidelines for creating reliable Arabic resources online.
237
6.4.1 Considerations for Future Researchers
From conducting this study, the researcher experienced a number of issues that should be
considered by future researchers. Taking these issues into consideration can improve the overall
execution of a follow-up or replication study. These issues include the following:
• Time. Researchers should take into account the time of execution of their study's research
instruments, such as questionnaires. Administering questionnaires, or other instruments,
during holidays, the summer months, or any other events that can be considered major,
can greatly affect response rate. For this study, the summer months affected response
rate, as many journalists were on leave. Further, the holy month of Ramadan affected the
response rate for the follow-up interviews by E-mail, as journalists worked shorter hours,
while their workloads stayed the same, giving them less time to participate in research
studies.
• Length of Research Instrument. It is important to understand the culture that the
researcher intends to examine. Research instruments acceptable in the developed world
could be less acceptable elsewhere. The researcher found that many journalists in Kuwait
thought that the questionnaire was long. However, the length of the questionnaire would
be considered by many as acceptable in the developed world.
• Type of Research Instrument. In the case of this study, the researcher used interviews by
E-mail. Although a large number of journalists provided their E-mail for the interview,
not many understood what was required of them. Therefore, it was necessary to provide
detailed instructions so that the least skilled respondent could have participated easily.
238
• Personal Contacts. To conduct research in the developing world, a researcher should have
a good network of contacts at the organization targeted by the study. These contacts can
be important for the success, or failure, of the study, as they are the ones who can
encourage the population to participate. Further, personal contacts can make the process
of distributing, administering, and collecting questionnaire more efficient by identifying
individuals who could benefit the overall execution of the study. However, a researcher
must be aware of the potential of bias that may result from using personal contacts.
• Anonymity and Confidentiality. This is an important issue that researchers should
consider when conducting research in the developing world. Journalists were more open
and likely to participate in the study when they were assured that their responses would
not identify them in person. Further, confidentiality was important and effective in
encouraging journalists to participate. Assuring the journalists that their responses would
be anonymous and confidential was positive in encouraging participation. This allows
journalists to participate without worrying about their job stability or fear of being
singled out for negative comments.
• Identification. It was important for the progress of this study to assure newspaper officials
that their organization was not being compared to the others, and that the study did not
intend to rank journalists according to their newspaper affiliation. Newspapers in Kuwait
exist in a highly competitive environment and any comparison would not be welcome as
it could affect readership, advertising revenue, and overall authority of the newspaper.
• Presence. It is important for researchers to examine this issue before conducting their
study. The physical presence of the researcher could greatly affect the outcome of the
study in the developing world. In the developed world, contacting the population through
239
E-mail, or mail, might be an acceptable way of gathering data. However, in the
developing world, physical presence is most important for the execution of the study.
Meeting with contacts regularly was important for gathering data from the questionnaire
for this study.
240
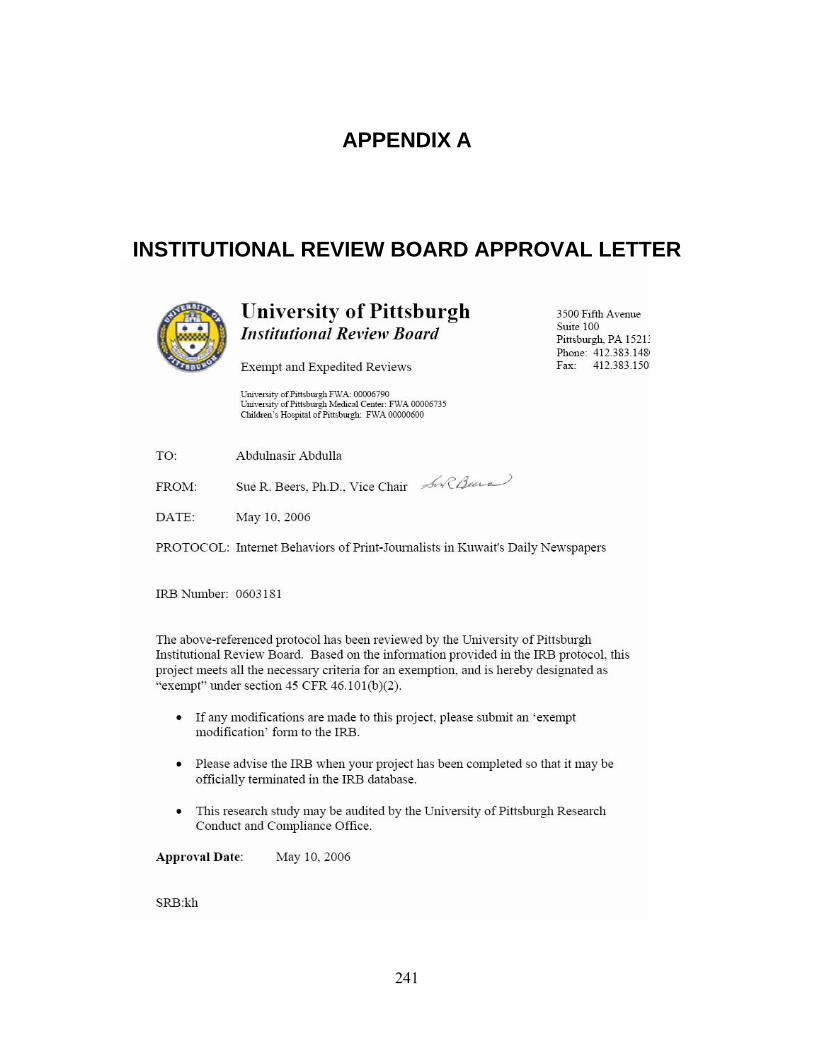
APPENDIX A
INSTITUTIONAL REVIEW BOARD APPROVAL LETTER
241

APPENDIX B
QUESTIONNAIRE Dear Journalist, The questionnaire you have been presented with is related to my research as a doctoral student at the Department of Library and Information Science at the University of Pittsburgh in the United States of America. It is designed to gather data for my dissertation titled “Internet-related information behaviors of journalists in Kuwait’s daily newspapers,” which is part of my work as a scholarship teaching assistant at the Department of Library & Information Science at Kuwait University. This study is the first of its kind in Kuwait, and the Middle East, and aims to study aspects such as usage and importance of Internet applications, evaluating information found online, and evaluating information technology skills of journalists. Completing the questionnaire will take between 15 to 20 minutes of your valuable time. Your kind participation is greatly appreciated, and will benefit the future of journalism in Kuwait especially knowing that evaluation and measurement are the building blocks of future planning and reform. Please note that all the information gathered for the purposes of this study will be confidential and will be used only for educational and research purposes. Your anonymity is guaranteed, and the study will in no way identify the names of those who will participate. Your participation is voluntary, and you may withdraw from this project at any time. For any additional inquiries about this study, you are encouraged to contact the researcher using any of the following methods:
School of Information Sciences- DLIS University of Pittsburgh
Pittsburgh, PA 15260 [email protected]
+965-901-0500 (KUW) Thank you for your greatly appreciated cooperation.
242
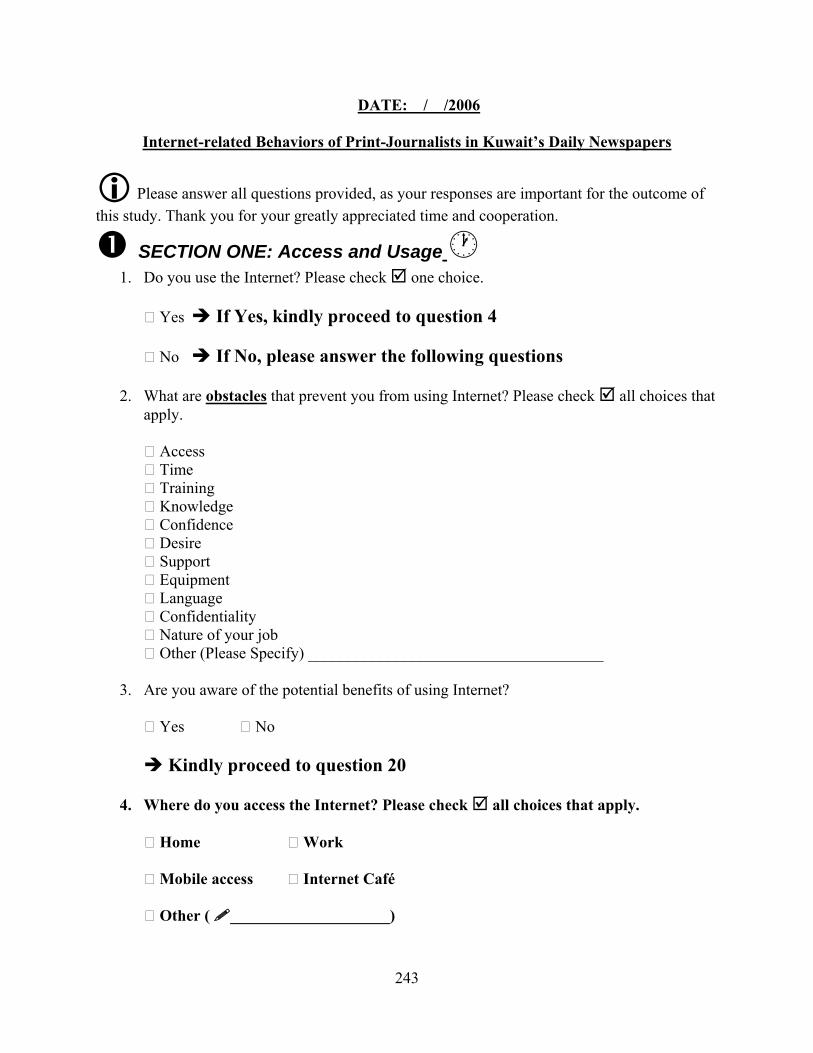
DATE: / /2006
Internet-related Behaviors of Print-Journalists in Kuwait’s Daily Newspapers
Please answer all questions provided, as your responses are important for the outcome of this study. Thank you for your greatly appreciated time and cooperation.
SECTION ONE: Access and Usage 1. Do you use the Internet? Please check one choice.
Yes If Yes, kindly proceed to question 4 No If No, please answer the following questions
2. What are obstacles that prevent you from using Internet? Please check all choices that
apply.
Access Time Training Knowledge Confidence Desire Support Equipment Language Confidentiality Nature of your job Other (Please Specify) _____________________________________
3. Are you aware of the potential benefits of using Internet?
Yes No
Kindly proceed to question 20
4. Where do you access the Internet? Please check all choices that apply.
Home Work Mobile access Internet Café Other ( ____________________)
243
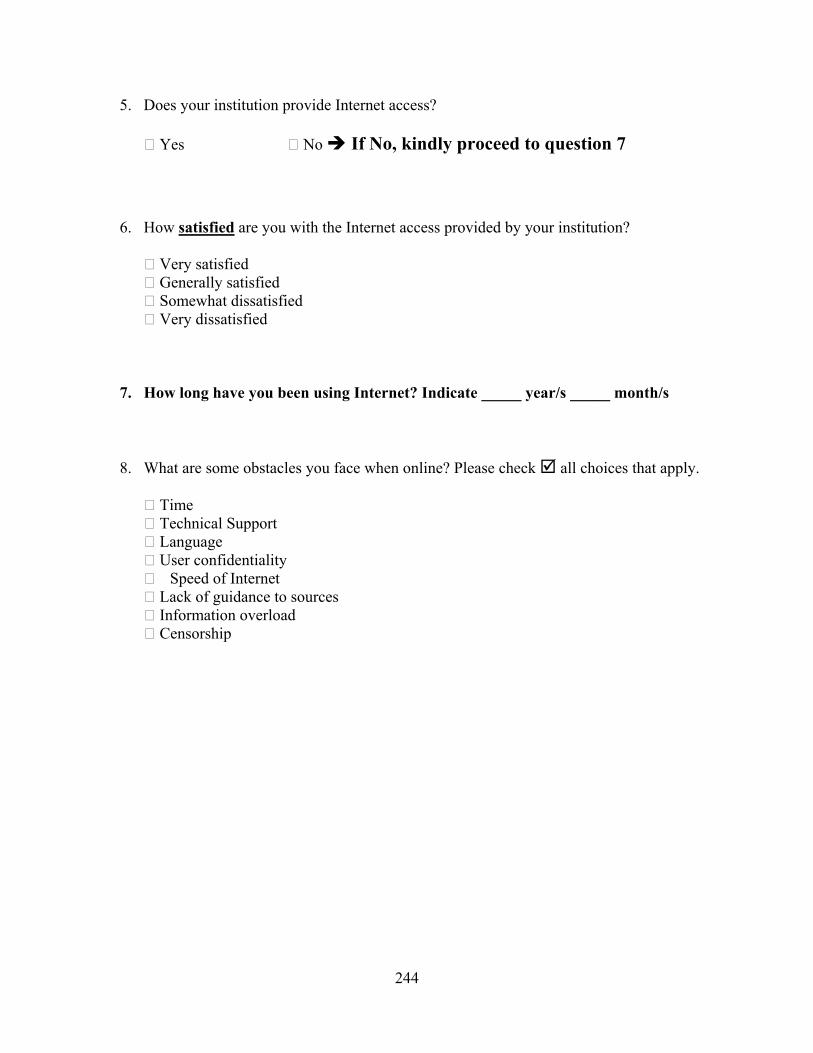
5. Does your institution provide Internet access?
Yes No If No, kindly proceed to question 7
6. How satisfied are you with the Internet access provided by your institution?
Very satisfied Generally satisfied Somewhat dissatisfied Very dissatisfied
7. How long have you been using Internet? Indicate _____ year/s _____ month/s
8. What are some obstacles you face when online? Please check all choices that apply.
Time Technical Support Language User confidentiality Speed of Internet Lack of guidance to sources Information overload Censorship
244
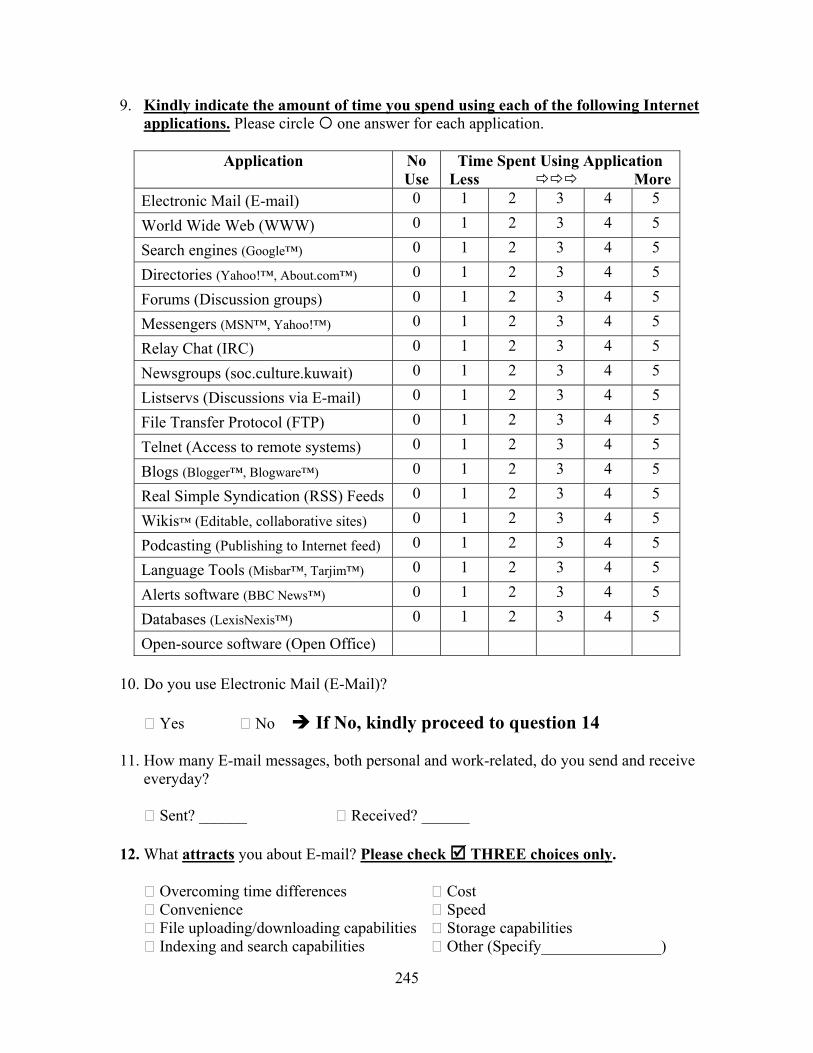
9. Kindly indicate the amount of time you spend using each of the following Internet applications. Please circle one answer for each application.
Application No
Use Time Spent Using Application
Less More 0 1 2 3 4 5 Electronic Mail (E-mail) 0 1 2 3 4 5 World Wide Web (WWW) 0 1 2 3 4 5 Search engines (Google™) 0 1 2 3 4 5 Directories (Yahoo!™, About.com™) 0 1 2 3 4 5 Forums (Discussion groups) 0 1 2 3 4 5 Messengers (MSN™, Yahoo!™) 0 1 2 3 4 5 Relay Chat (IRC) 0 1 2 3 4 5 Newsgroups (soc.culture.kuwait) 0 1 2 3 4 5 Listservs (Discussions via E-mail) 0 1 2 3 4 5 File Transfer Protocol (FTP) 0 1 2 3 4 5 Telnet (Access to remote systems) 0 1 2 3 4 5 Blogs (Blogger™, Blogware™) 0 1 2 3 4 5 Real Simple Syndication (RSS) Feeds 0 1 2 3 4 5 Wikis™ (Editable, collaborative sites) 0 1 2 3 4 5 Podcasting (Publishing to Internet feed) 0 1 2 3 4 5 Language Tools (Misbar™, Tarjim™) 0 1 2 3 4 5 Alerts software (BBC News™) 0 1 2 3 4 5 Databases (LexisNexis™) Open-source software (Open Office)
10. Do you use Electronic Mail (E-Mail)?
Yes No If No, kindly proceed to question 14
11. How many E-mail messages, both personal and work-related, do you send and receive
everyday?
Sent? ______ Received? ______
12. What attracts you about E-mail? Please check THREE choices only.
Overcoming time differences Cost Convenience Speed File uploading/downloading capabilities Storage capabilities Indexing and search capabilities Other (Specify_______________)
245
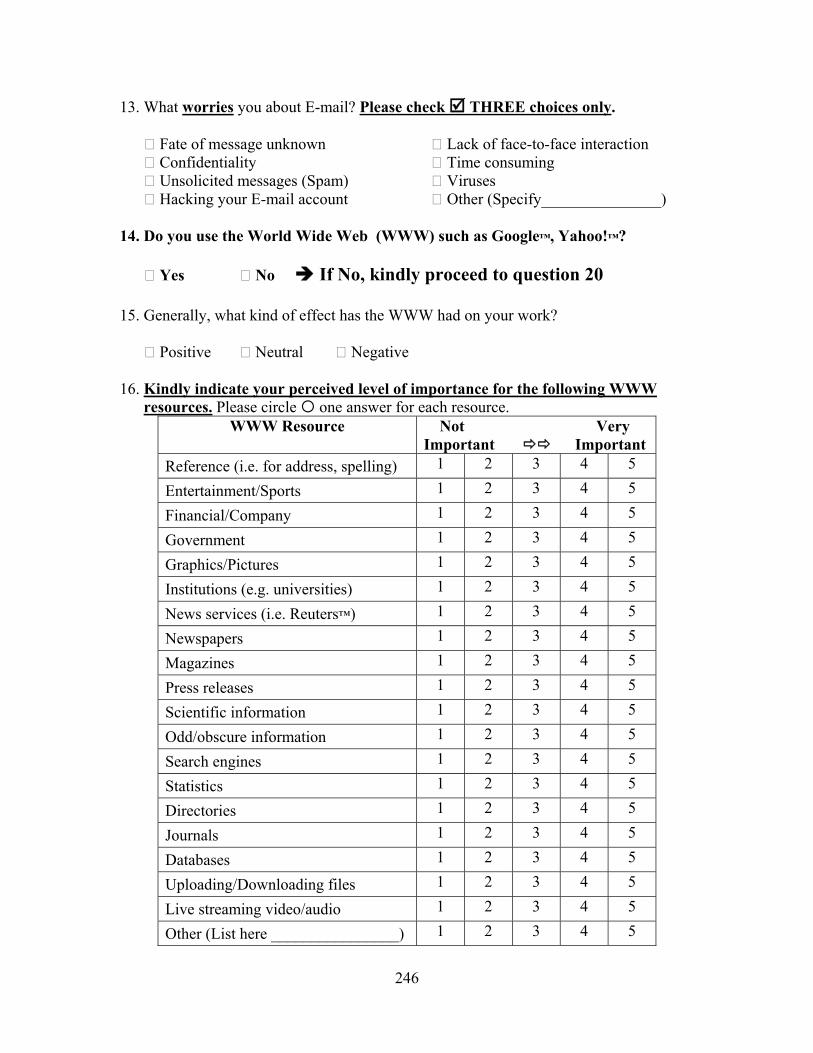
13. What worries you about E-mail? Please check THREE choices only.
Fate of message unknown Lack of face-to-face interaction Confidentiality Time consuming Unsolicited messages (Spam) Viruses Hacking your E-mail account Other (Specify_______________)
14. Do you use the World Wide Web (WWW) such as Google™, Yahoo!™?
Yes No If No, kindly proceed to question 20
15. Generally, what kind of effect has the WWW had on your work?
Positive Neutral Negative 16. Kindly indicate your perceived level of importance for the following WWW
resources. Please circle one answer for each resource. WWW Resource Not Very
Important Important 1 2 3 4 5 Reference (i.e. for address, spelling) 1 2 3 4 5 Entertainment/Sports 1 2 3 4 5 Financial/Company 1 2 3 4 5 Government 1 2 3 4 5 Graphics/Pictures 1 2 3 4 5 Institutions (e.g. universities) 1 2 3 4 5 News services (i.e. Reuters™) 1 2 3 4 5 Newspapers 1 2 3 4 5 Magazines 1 2 3 4 5 Press releases 1 2 3 4 5 Scientific information 1 2 3 4 5 Odd/obscure information 1 2 3 4 5 Search engines 1 2 3 4 5 Statistics 1 2 3 4 5 Directories 1 2 3 4 5 Journals 1 2 3 4 5 Databases 1 2 3 4 5 Uploading/Downloading files 1 2 3 4 5 Live streaming video/audio
Other (List here ________________) 1 2 3 4 5
246
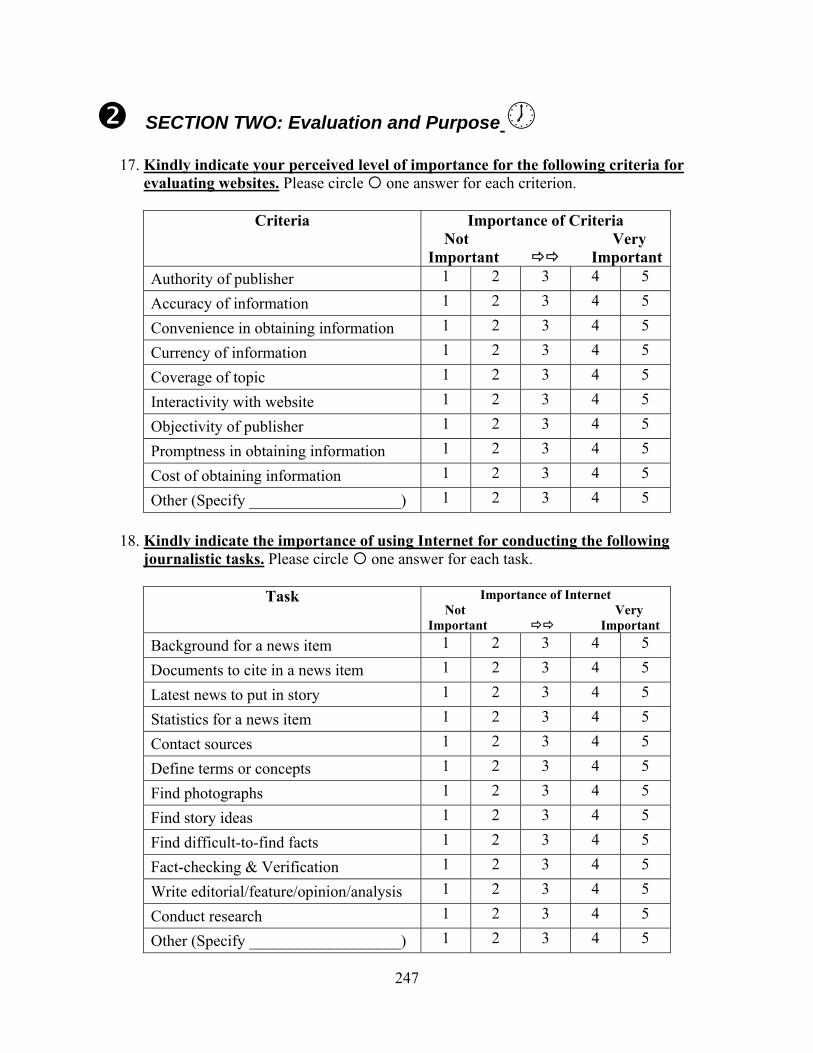
SECTION TWO: Evaluation and Purpose
17. Kindly indicate your perceived level of importance for the following criteria for evaluating websites. Please circle one answer for each criterion.
Criteria Importance of Criteria
Not Very Important Important
Authority of publisher 1 2 3 4 5
Accuracy of information 1 2 3 4 5
Convenience in obtaining information 1 2 3 4 5
Currency of information 1 2 3 4 5
Coverage of topic 1 2 3 4 5
Interactivity with website 1 2 3 4 5
Objectivity of publisher 1 2 3 4 5 1 2 3 4 5 Promptness in obtaining information 1 2 3 4 5 Cost of obtaining information 1 2 3 4 5 Other (Specify ___________________)
18. Kindly indicate the importance of using Internet for conducting the following
journalistic tasks. Please circle one answer for each task.
Task Importance of Internet Not Very Important Important
Background for a news item 1 2 3 4 5
Documents to cite in a news item 1 2 3 4 5
Latest news to put in story 1 2 3 4 5
Statistics for a news item 1 2 3 4 5
Contact sources 1 2 3 4 5
Define terms or concepts 1 2 3 4 5
Find photographs 1 2 3 4 5 1 2 3 4 5 Find story ideas 1 2 3 4 5 Find difficult-to-find facts 1 2 3 4 5 Fact-checking & Verification 1 2 3 4 5 Write editorial/feature/opinion/analysis 1 2 3 4 5 Conduct research
Other (Specify ___________________) 1 2 3 4 5
247
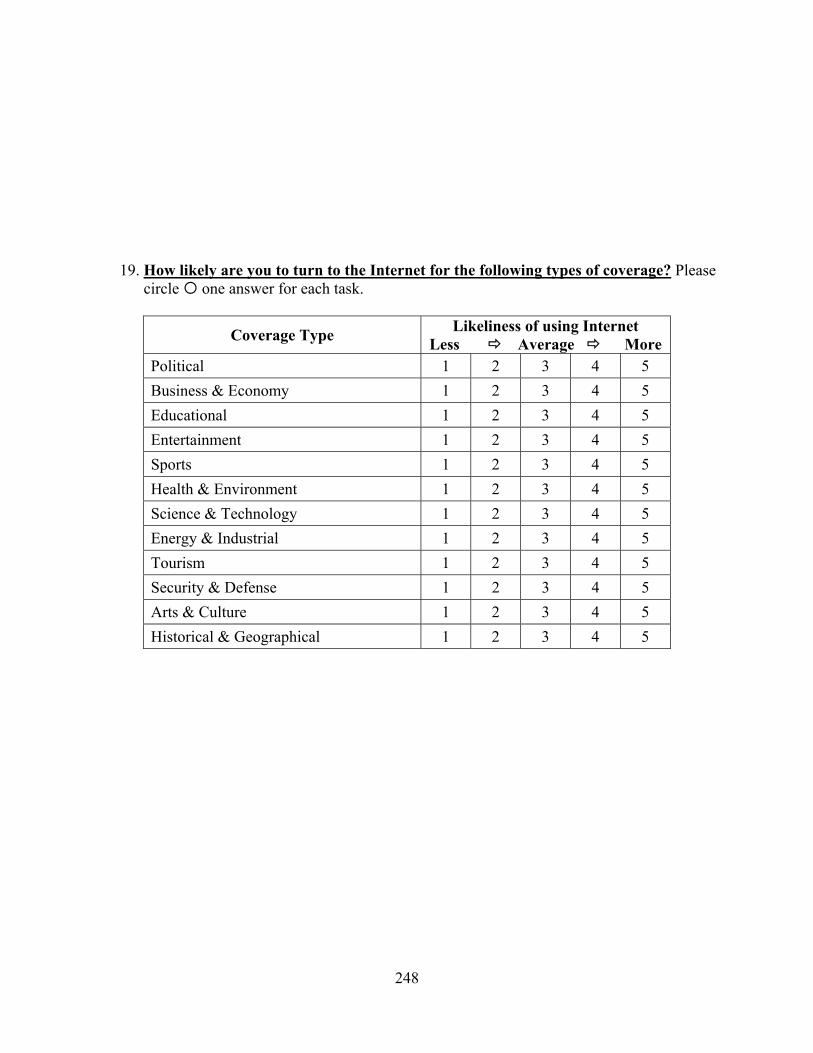
19. How likely are you to turn to the Internet for the following types of coverage? Please
circle one answer for each task.
Coverage Type Likeliness of using Internet Less Average More
Political 1 2 3 4 5 Business & Economy 1 2 3 4 5 Educational 1 2 3 4 5 Entertainment 1 2 3 4 5 Sports 1 2 3 4 5 Health & Environment 1 2 3 4 5 Science & Technology 1 2 3 4 5 Energy & Industrial 1 2 3 4 5 Tourism 1 2 3 4 5 Security & Defense 1 2 3 4 5 Arts & Culture 1 2 3 4 5 Historical & Geographical 1 2 3 4 5
248
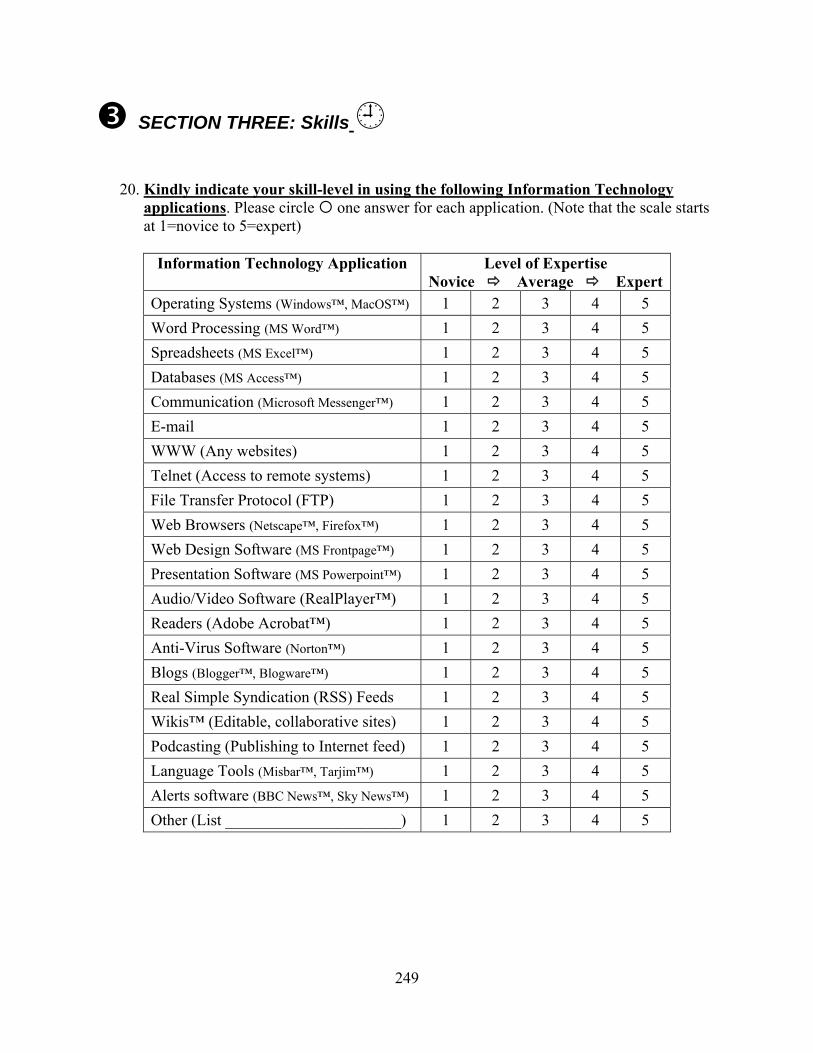
SECTION THREE: Skills
20. Kindly indicate your skill-level in using the following Information Technology applications. Please circle one answer for each application. (Note that the scale starts at 1=novice to 5=expert)
Information Technology Application Level of Expertise
Novice Average ExpertOperating Systems (Windows™, MacOS™) 1 2 3 4 5 Word Processing (MS Word™) 1 2 3 4 5 Spreadsheets (MS Excel™) 1 2 3 4 5 Databases (MS Access™) 1 2 3 4 5 Communication (Microsoft Messenger™) 1 2 3 4 5 E-mail 1 2 3 4 5 WWW (Any websites) 1 2 3 4 5 Telnet (Access to remote systems) 1 2 3 4 5 File Transfer Protocol (FTP) 1 2 3 4 5 Web Browsers (Netscape™, Firefox™) 1 2 3 4 5 Web Design Software (MS Frontpage™) 1 2 3 4 5 Presentation Software (MS Powerpoint™) 1 2 3 4 5 Audio/Video Software (RealPlayer™) 1 2 3 4 5 Readers (Adobe Acrobat™) 1 2 3 4 5 Anti-Virus Software (Norton™) 1 2 3 4 5 Blogs (Blogger™, Blogware™) 1 2 3 4 5 Real Simple Syndication (RSS) Feeds 1 2 3 4 5 Wikis™ (Editable, collaborative sites) 1 2 3 4 5 Podcasting (Publishing to Internet feed) 1 2 3 4 5 Language Tools (Misbar™, Tarjim™) 1 2 3 4 5 Alerts software (BBC News™, Sky News™) 1 2 3 4 5 Other (List ______________________) 1 2 3 4 5
249
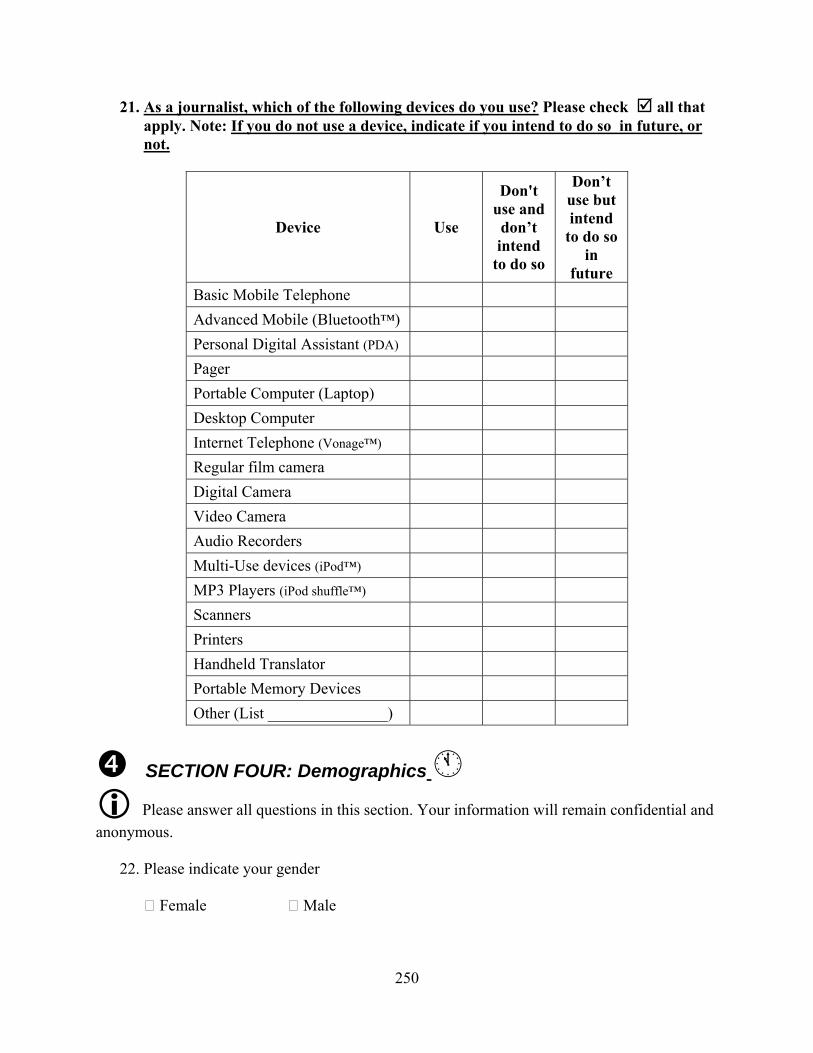
21. As a journalist, which of the following devices do you use? Please check all that apply. Note: If you do not use a device, indicate if you intend to do so in future, or not.
Device Use
Don't use and don’t intend
to do so
Don’t use but intend
to do so in
future Basic Mobile Telephone Advanced Mobile (Bluetooth™) Personal Digital Assistant (PDA) Pager Portable Computer (Laptop) Desktop Computer Internet Telephone (Vonage™) Regular film camera Digital Camera Video Camera Audio Recorders Multi-Use devices (iPod™) MP3 Players (iPod shuffle™) Scanners Printers Handheld Translator Portable Memory Devices Other (List _______________)
SECTION FOUR: Demographics
Please answer all questions in this section. Your information will remain confidential and anonymous.
22. Please indicate your gender
Female Male
250
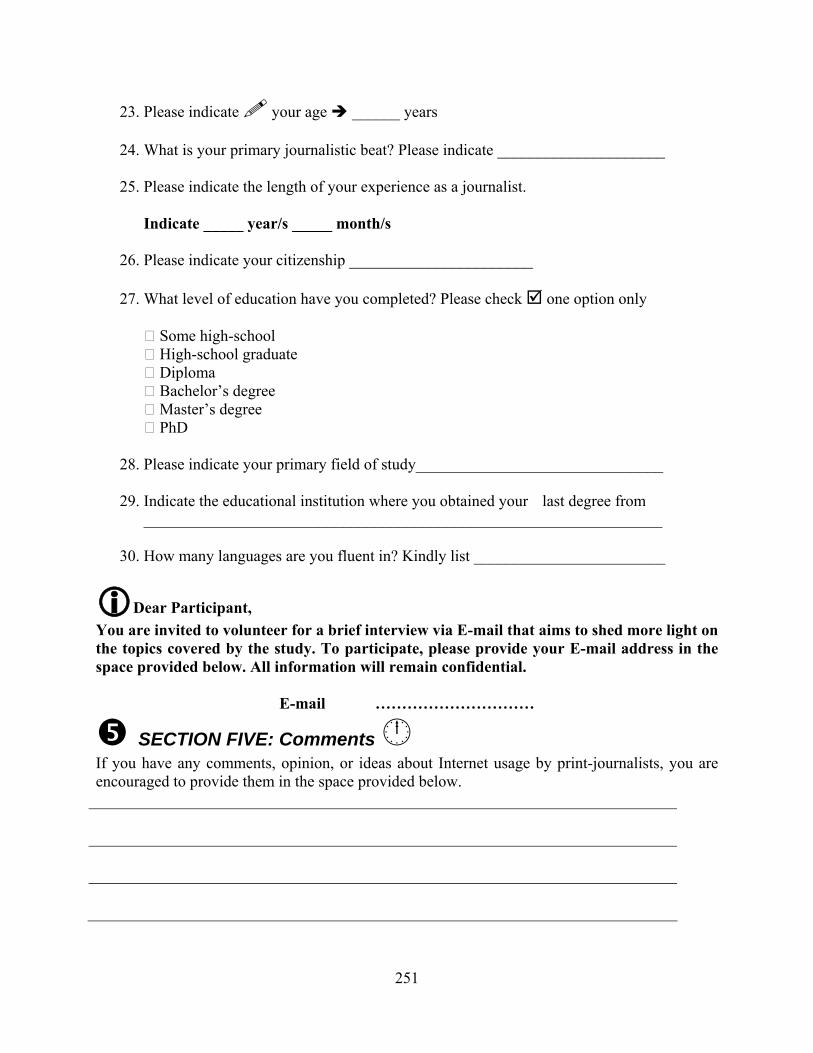
23. Please indicate your age ______ years 24. What is your primary journalistic beat? Please indicate _____________________
25. Please indicate the length of your experience as a journalist.
Indicate _____ year/s _____ month/s
26. Please indicate your citizenship _______________________
27. What level of education have you completed? Please check one option only
Some high-school High-school graduate Diploma Bachelor’s degree Master’s degree PhD
28. Please indicate your primary field of study_______________________________ 29. Indicate the educational institution where you obtained your last degree from
_________________________________________________________________
30. How many languages are you fluent in? Kindly list ________________________
Dear Participant, You are invited to volunteer for a brief interview via E-mail that aims to shed more light on the topics covered by the study. To participate, please provide your E-mail address in the space provided below. All information will remain confidential.
E-mail …………………………
SECTION FIVE: Comments If you have any comments, opinion, or ideas about Internet usage by print-journalists, you are encouraged to provide them in the space provided below.
251

ARABIC VERSION عزيزتي المشارآة،،،/ عزيزي المشارك تحية طيبة وبعد،،،
وم ة عل ة لكلي هذا االستبيان الذي بين يديك يتعلق بموضوع اطروحتي لرسالة الدآتوراه المقدمسبيرغ ة بيت ي جامع ات ف دة (University of Pittsburgh)المعلوم ات المتح بالوالي
ا ة وعنوانه ة باالنترن"االمريكي ة المتعلق سلوآيات المعلوماتي ي ال املين ف صحافيين الع دى ال ت لة ة اليومي ات " الصحف الكويتي وم المكتب سم عل دى ق ة ل د عضو بعث ي آمعي وهي جزء من عمل
.والمعلومات في جامعة الكويت
شرق االوسط سليط وتعتبر الدراسة المذآورة االولى من نوعها في الكويت وال ى ت وتهدف الل ال ن قب ت م تخدام االنترن ة اس ى آيفي ضوء عل ات ال شمل التطبيق واحي ت دة ن ن ع صحافيين م
ارات استخدام يم مه ى تقي ى االنترنت اضافة ال يم المعلومات عل المستخدمة واهميتها وآيفية تقي .تكنولوجيا المعلومات لدى الصحافيين
يم ت ألن التقي ي الكوي صحافة ف ستقبل ال ى م النفع عل ا ب تعود حتم ة س شارآتكم الكريم ان م
.ات التخطيط للمستقبل واالصالحوالقياس هي اولى لبن
ي ستخدم اال لغرض البحث العلم ن ت رية ول ة س ة بالدراس ات المتعلق ع المعلوم ذآر ان جمي يشارك ة الم رية هوي ظ س شكل يحف مم ب تبيان ص ان االس ذلك ف ن / ول ب م ا يتطل شارآة آم الم
م دراسةشخصكم الكريم التطوع لإلجابة الصريحة والدقيقة الهمية رايكم على نتائج ال مع العل . دقيقة من وقتكم الثمين20 و 15بان اجابة جميع االسئلة قد يستغرق مابين
ة ة المراجع ل لجن ه من قب ة علي ه والموافق ويرجى العلم بأن االستبيان المرفق قد تمت مراجعت
(Institutional Review Board) . لدى الجامعة المذآورة اعالهالمؤسسية
.ر واالمتنان لمشارآتكم الكريمةولكم مني جزيل الشك عبدالناصر عبداهللا الشطي/ اخوآم
ق ع الباحث عن طري ذا البحث يرجى التواصل م ديكم عن ه سار ل ود اي استف ال وج ي ح ف
:الوسيلة التي تفضلونهاSchool of Information Sciences
University of Pittsburgh Pittsburgh, PA 15260
[email protected] Telephone: +965-901-0500 (KUW)
252
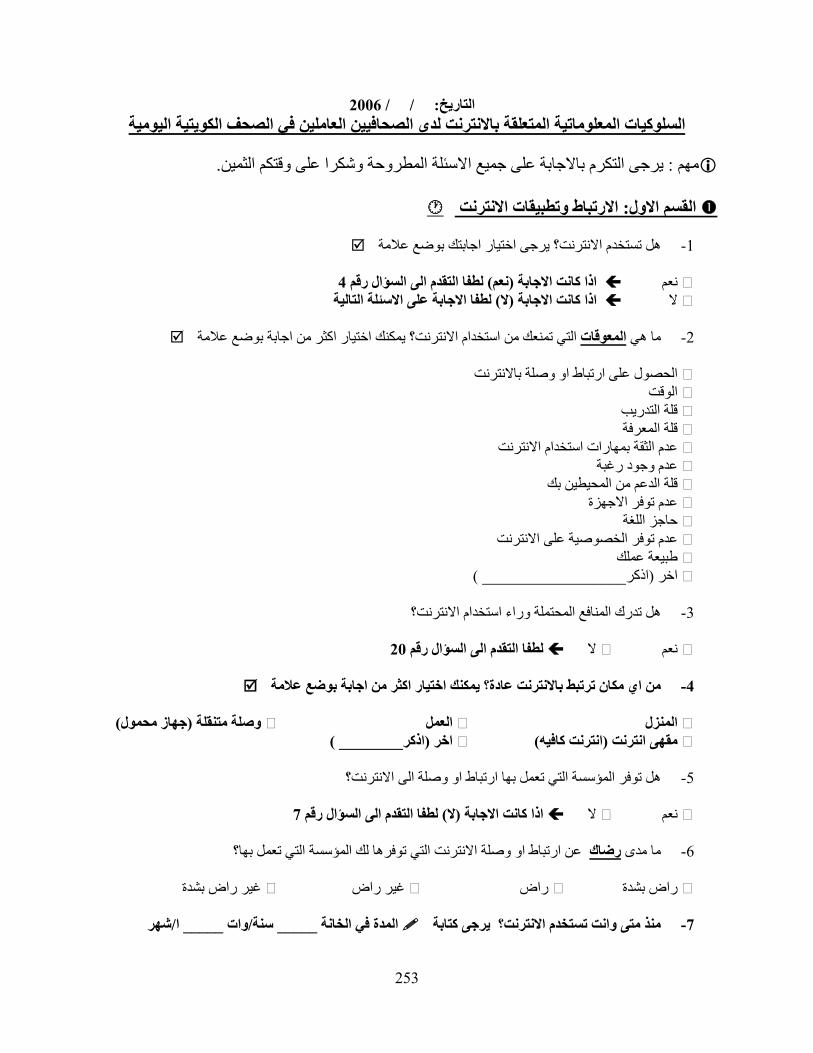
2006: / / التاريخالسلوآيات المعلوماتية المتعلقة باالنترنت لدى الصحافيين العاملين في الصحف الكويتية اليومية
.يرجى التكرم باالجابة على جميع االسئلة المطروحة وشكرا على وقتكم الثمين: مهم
ت االنترنت االرتباط وتطبيقا: القسم االول
هل تستخدم االنترنت؟ يرجى اختيار اجابتك بوضع عالمة 1-
4لطفا التقدم الى السؤال رقم ) نعم(آانت االجابة اذا نعم ال لطفا االجابة على االسئلة التالية) ال( اذا آانت االجابة
-2 من اجابة بوضع عالمة التي تمنعك من استخدام االنترنت؟ يمكنك اختيار اآثرالمعوقاتما هي
الحصول على ارتباط او وصلة باالنترنت الوقت قلة التدريب قلة المعرفة عدم الثقة بمهارات استخدام االنترنت عدم وجود رغبة قلة الدعم من المحيطين بك عدم توفر االجهزة حاجز اللغة عدم توفر الخصوصية على االنترنت ك طبيعة عمل اذآر( اخر __________________(
-3 هل تدرك المنافع المحتملة وراء استخدام االنترنت؟
نعم 20 لطفا التقدم الى السؤال رقم ال
من اي مكان ترتبط باالنترنت عادة؟ يمكنك اختيار اآثر من اجابة بوضع عالمة 4-
جهاز محمول( وصلة متنقلة( العمل المنزل
اذآر( اخر ________( قهى انترنت م)انترنت آافيه(
-5 هل توفر المؤسسة التي تعمل بها ارتباط او وصلة الى االنترنت؟
نعم 7لطفا التقدم الى السؤال رقم ) ال( اذا آانت االجابة ال
-6 عن ارتباط او وصلة االنترنت التي توفرها لك المؤسسة التي تعمل بها؟رضاكما مدى
غير راض بشدة غير راض راض راض بشدة شهر/ا_____ وات /سنة_____ المدة في الخانة منذ متى وانت تستخدم االنترنت؟ يرجى آتابة -7
253
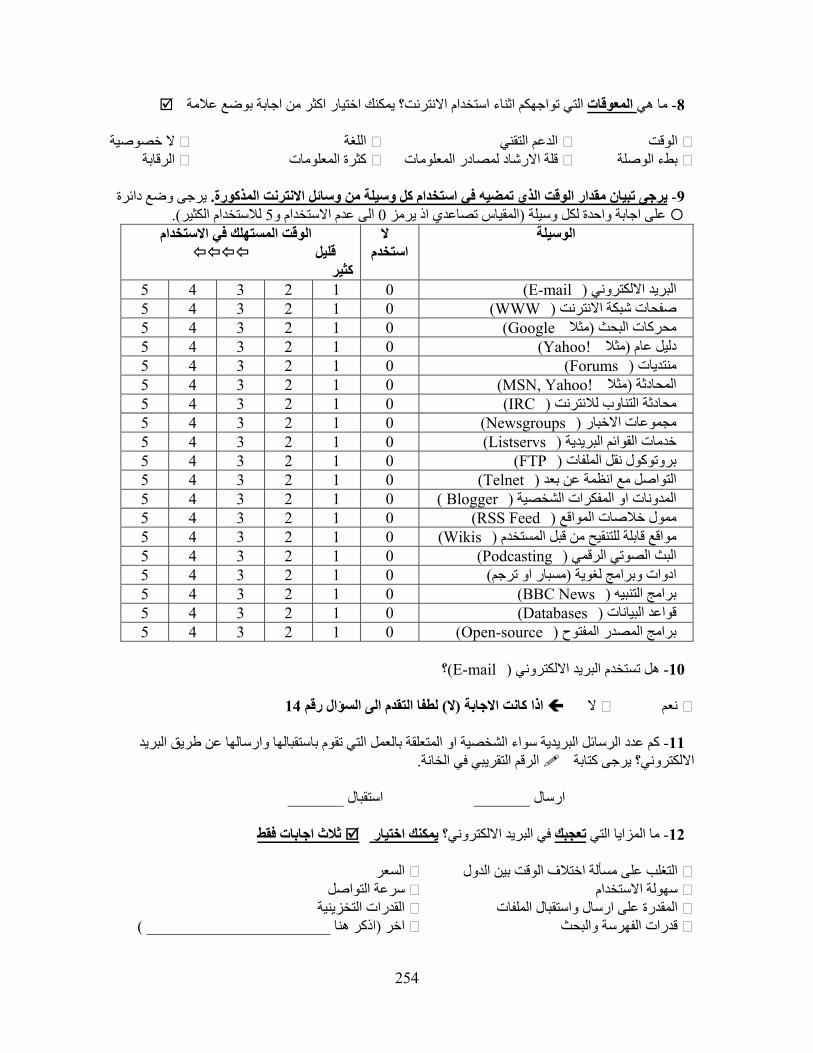
التي تواجهكم اثناء استخدام االنترنت؟ يمكنك اختيار اآثر من اجابة بوضع عالمة المعوقات ما هي -8
ال خصوصية للغة ا الدعم التقني الوقت الرقابة آثرة المعلومات قلة االرشاد لمصادر المعلومات بطء الوصلة
يرجى وضع دائرة.تبيان مقدار الوقت الذي تمضيه في استخدام آل وسيلة من وسائل االنترنت المذآورة يرجى -9
). لالستخدام الكثير5ستخدام و الى عدم اال0المقياس تصاعدي اذ يرمز ( على اجابة واحدة لكل وسيلة ال الوقت المستهلك في االستخدام
استخدمالوسيلة
قليل آثير
5 4 3 2 1 0 (E-mail (البريد االلكتروني 5 0 1 2 3 4 (WWW (صفحات شبكة االنترنت
0 1 2 3 4 5 (Google مثال (محرآات البحث 0 1 2 3 4 5 (Yahoo! مثال (دليل عام 0 1 2 3 4 5 (Forums (منتديات 0 1 2 3 4 5 (MSN, Yahoo! مثال (المحادثة 0 1 2 3 4 5 (IRC (محادثة التناوب لالنترنت 0 1 2 3 4 5 (Newsgroups (مجموعات االخبار 0 1 2 3 4 5 (Listservs (خدمات القوائم البريدية 0 1 2 3 4 5 (FTP (بروتوآول نقل الملفات 0 1 2 3 4 5 (Telnet (التواصل مع انظمة عن بعد
3 4 5 2 0 1 ( Blogger (المدونات او المفكرات الشخصية 3 4 5 2 0 1 (RSS Feed (ممول خالصات المواقع 3 4 5 2 0 1 (Wikis (مواقع قابلة للتنقيح من قبل المستخدم 3 4 5 2 0 1 (Podcasting (البث الصوتي الرقمي )مسبار او ترجم(ت وبرامج لغوية ادوا 1 0 2 5 4 33 4 5 2 0 1 (BBC News (برامج التنبيه 3 4 5 2 0 1 (Databases (قواعد البيانات
2 0 1 (Open-source 5 4 3(برامج المصدر المفتوح
؟)( هل تستخدم البريد االلكتروني -10 E-mail
نعم 14التقدم الى السؤال رقم لطفا ) ال( اذا آانت االجابة ال
آم عدد الرسائل البريدية سواء الشخصية او المتعلقة بالعمل التي تقوم باستقبالها وارسالها عن طريق البريد -11 . الرقم التقريبي في الخانةااللكتروني؟ يرجى آتابة
_______استقبال _______ارسال
ثالث اجابات فقطRيمكنك اختيار تروني؟ في البريد االلكتعجبك ما المزايا التي -12
السعر التغلب على مسألة اختالف الوقت بين الدول
سهولة االستخدام سرعة التواصل القدرات التخزينية المقدرة على ارسال واستقبال الملفات
اذآر هنا ( اخر _______________________( قدرات الفهرسة والبحث
254
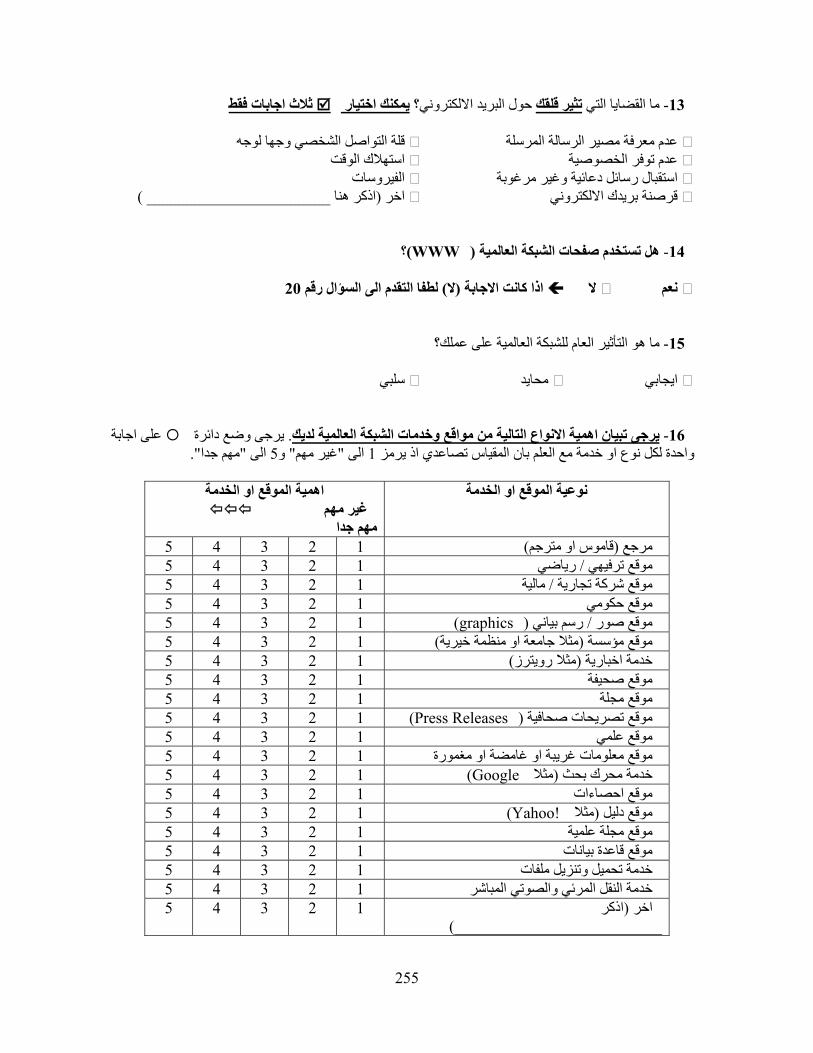
ثالث اجابات فقطRيمكنك اختيار حول البريد االلكتروني؟ تثير قلقكا القضايا التي م-13 عدم معرفة مصير الرسالة المرسلة قلة التواصل الشخصي وجها لوجه
استهالك الوقت عدم توفر الخصوصية استقبال رسائل دعائية وغير مرغوبة الفيروسات
اذآر هنا ( اخر _______________________( قرصنة بريدك االلكتروني
WWW ؟) ( هل تستخدم صفحات الشبكة العالمية -14 نعم 20لطفا التقدم الى السؤال رقم ) ال( اذا آانت االجابة ال
ما هو التأثير العام للشبكة العالمية على عملك؟-15 سلبي ايجابي محايد
على اجابة يرجى وضع دائرة . االنواع التالية من مواقع وخدمات الشبكة العالمية لديكيرجى تبيان اهمية -16 ".مهم جدا" الى 5و" غير مهم" الى 1واحدة لكل نوع او خدمة مع العلم بان المقياس تصاعدي اذ يرمز
اهمية الموقع او الخدمة نوعية الموقع او الخدمة غير مهم
هم جدام)قاموس او مترجم(مرجع 2 1 3 5 4
رياضي/ موقع ترفيهي 3 2 1 4 5مالية/ موقع شرآة تجارية 4 3 2 1 5
موقع حكومي 5 4 3 2 11 2 3 4 5 (graphics (رسم بياني / موقع صور )مثال جامعة او منظمة خيرية(موقع مؤسسة 5 4 3 2 1
)مثال رويترز(خدمة اخبارية 1 5 4 3 2موقع صحيفة 1 2 3 4 5موقع مجلة 1 2 3 4 55 4 3 2 1 (Press Releases (موقع تصريحات صحافية موقع علمي 1 2 3 4 5موقع معلومات غريبة او غامضة او مغمورة 1 2 3 4 55 4 3 2 1 (Google مثال (خدمة محرك بحث موقع احصاءات 1 2 3 4 55 4 3 2 1 Yahoo!( مثال (موقع دليل موقع مجلة علمية 1 2 3 4 5
موقع قاعدة بيانات 1 2 5 4 3خدمة تحميل وتنزيل ملفات 1 2 5 4 3خدمة النقل المرئي والصوتي المباشر 1 2 5 4 3
اذآر (اخر 1 2__________________________(
3 4 5
255

256
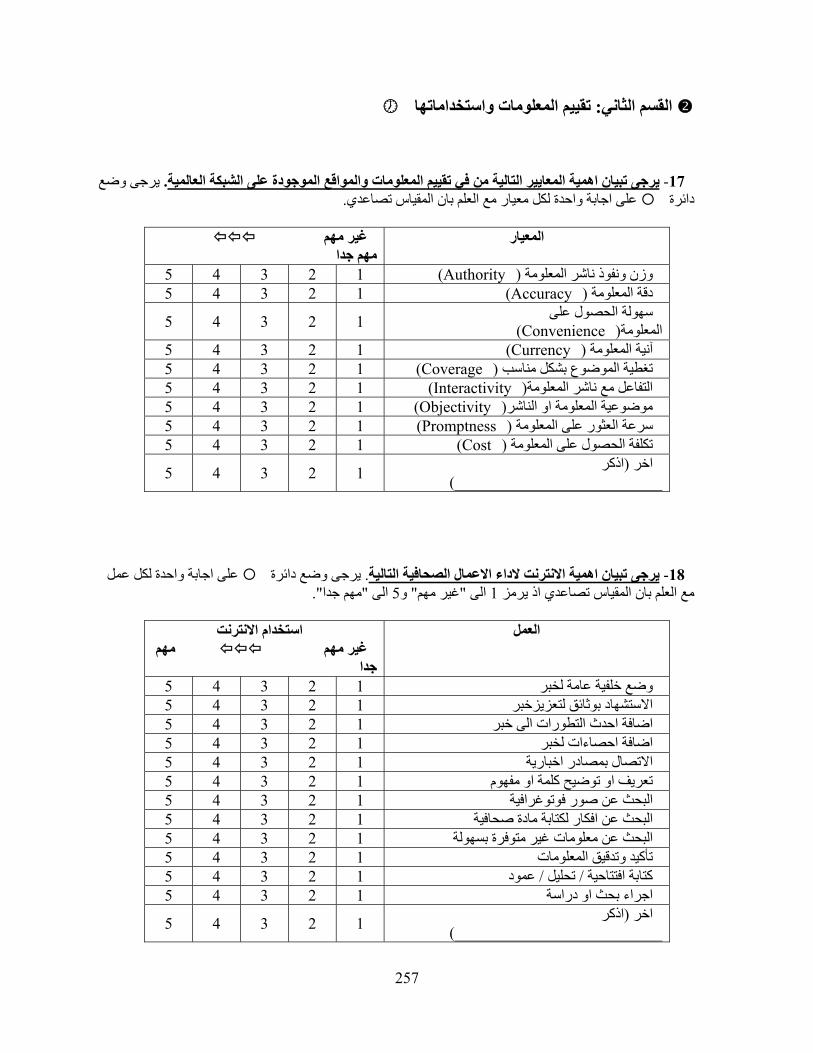
تقييم المعلومات واستخداماتها : القسم الثاني
يرجى وضع .يان اهمية المعايير التالية من في تقييم المعلومات والمواقع الموجودة على الشبكة العالميةيرجى تب -17 . على اجابة واحدة لكل معيار مع العلم بان المقياس تصاعديدائرة
غير مهم المعيار
مهم جدا4 3 2 1 (Authority 5(وزن ونفوذ ناشر المعلومة 4 3 2 1 Accuracy( 5(دقة المعلومة
سهولة الحصول على 4(المعلومة 3 2 1 (Convenience5
4 3 2 1 Currency( 5(آنية المعلومة 4 3 2 1 (Coverage 5(تغطية الموضوع بشكل مناسب 4 3 2 1 (Interactivity 5(التفاعل مع ناشر المعلومة4 3 2 1 (Objectivity 5(موضوعية المعلومة او الناشر4 3 2 1 (Promptness 5(سرعة العثور على المعلومة 4 3 2 1 (Cost 5(تكلفة الحصول على المعلومة
اذآر (اخر __________________________(4 3 2 15
ة لكل عمل على اجابة واحديرجى وضع دائرة . يرجى تبيان اهمية االنترنت الداء االعمال الصحافية التالية -18 ".مهم جدا" الى 5و" غير مهم" الى 1مع العلم بان المقياس تصاعدي اذ يرمز
العمل استخدام االنترنت مهم غير مهم
جدا12345وضع خلفية عامة لخبر
12345االستشهاد بوثائق لتعزيزخبر12345اضافة احدث التطورات الى خبر
12345ضافة احصاءات لخبرا12345االتصال بمصادر اخبارية
12345تعريف او توضيح آلمة او مفهوم12345البحث عن صور فوتوغرافية
12345البحث عن افكار لكتابة مادة صحافية12345البحث عن معلومات غير متوفرة بسهولة
12345تأآيد وتدقيق المعلومات12345عمود/ تحليل / آتابة افتتاحية
12345اجراء بحث او دراسةاذآر (اخر
__________________________(12345
257

258
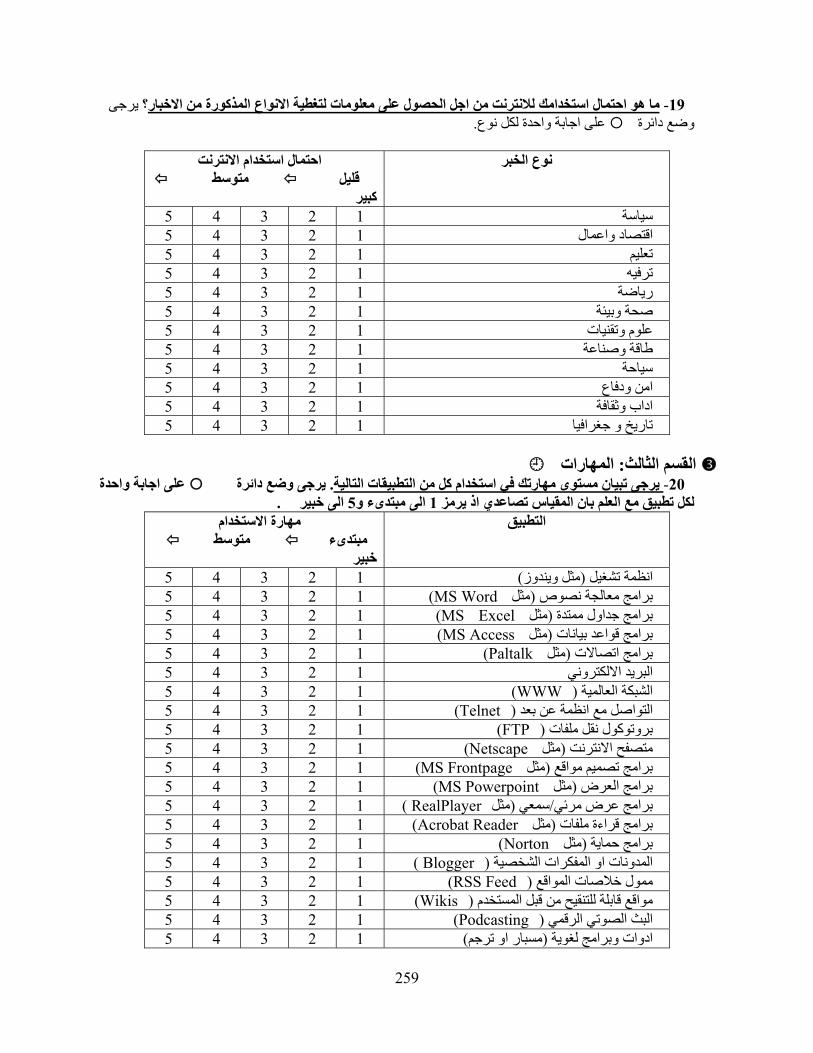
؟ يرجى ما هو احتمال استخدامك لالنترنت من اجل الحصول على معلومات لتغطية االنواع المذآورة من االخبار -19 .دة لكل نوع على اجابة واحوضع دائرة
نوع الخبر احتمال استخدام االنترنت
قليل متوسط آبير
4 3 2 1 5سياسة4 3 2 1 5اقتصاد واعمال4 3 2 1 5تعليم4 3 2 1 5ترفيه4 3 2 1 5رياضة 4 3 2 1 5صحة وبيئة4 3 2 1 5علوم وتقنيات4 3 2 1 5طاقة وصناعة4 3 2 1 5سياحة4 3 2 1 5امن ودفاع4 3 2 1 5اداب وثقافة4 3 2 1 5تاريخ و جغرافيا
المهارات : القسم الثالث
على اجابة واحدة يرجى وضع دائرة. يرجى تبيان مستوى مهارتك في استخدام آل من التطبيقات التالية-20 . الى خبير5 الى مبتدىء و1مز لكل تطبيق مع العلم بان المقياس تصاعدي اذ ير
التطبيق مهارة االستخدام مبتدىء متوسط
خبير4 3 2 1 5)مثل ويندوز(انظمة تشغيل 4 3 2 1 (MS Word 5مثل (برامج معالجة نصوص 4 3 2 1 (MS Excel 5مثل (برامج جداول ممتدة4 3 2 1 (MS Access 5مثل (برامج قواعد بيانات 4 3 2 1 (Paltalk 5مثل (برامج اتصاالت 4 3 2 1 5البريد االلكتروني4 3 2 1 (WWW 5(الشبكة العالمية 4 3 2 1 (Telnet 5(التواصل مع انظمة عن بعد 4 3 2 1 (FTP 5(بروتوآول نقل ملفات 4 3 2 1 (Netscape 5مثل (متصفح االنترنت 4 3 2 1 (MS Frontpage 5مثل (برامج تصميم مواقع 4 3 2 1 (MS Powerpoint 5مثل (برامج العرض 4 3 2 1 ( RealPlayer 5مثل(سمعي /برامج عرض مرئي4 3 2 1 (Acrobat Reader 5مثل (برامج قراءة ملفات 4 3 2 1 (Norton 5مثل (برامج حماية 4 3 2 1 ( Blogger 5(المدونات او المفكرات الشخصية 4 3 2 1 (RSS Feed 5(خالصات المواقع ممول 4 3 2 1 (Wikis 5(مواقع قابلة للتنقيح من قبل المستخدم
Podcasting 12345)(البث الصوتي الرقمي 12345)مسبار او ترجم(ادوات وبرامج لغوية
259
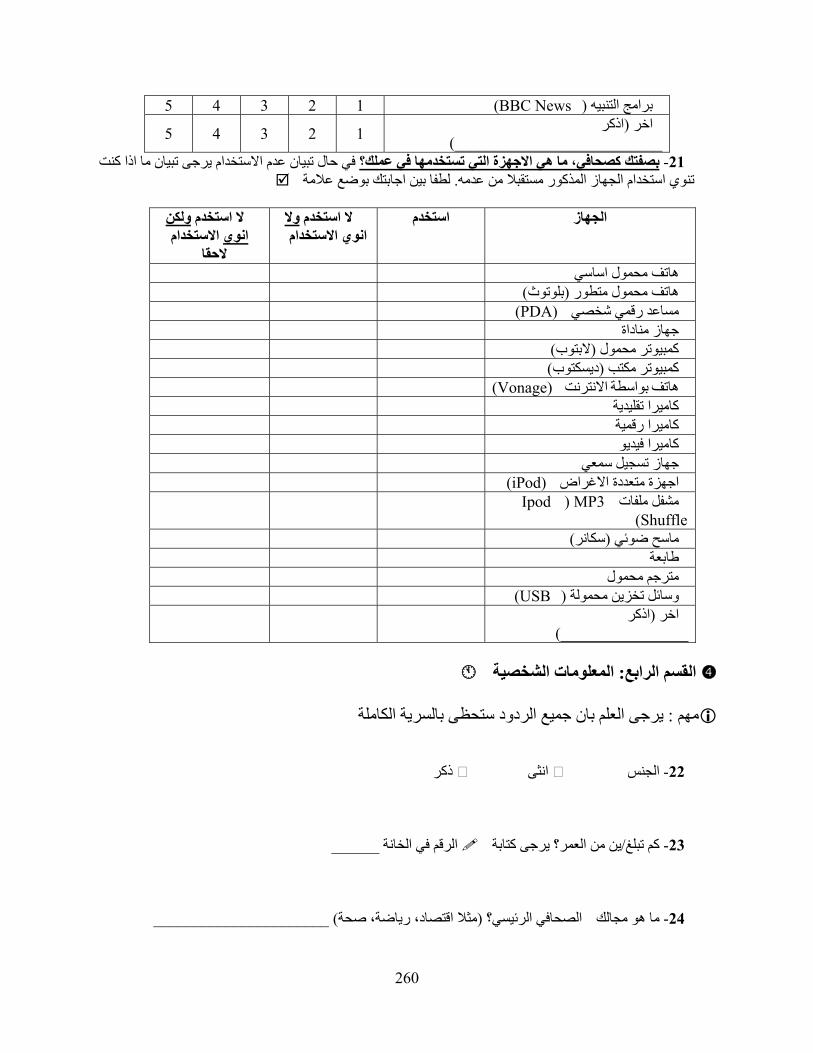
4 3 2 1 (BBC News 5(برامج التنبيه اذآر (اخر
__________________________(4 3 2 15
في حال تبيان عدم االستخدام يرجى تبيان ما اذا آنت بصفتك آصحافي، ما هي االجهزة التي تستخدمها في عملك؟ -21 لطفا بين اجابتك بوضع عالمة . تنوي استخدام الجهاز المذآور مستقبال من عدمه
وال ال استخدم
انوي االستخداماستخدم ولكن ال استخدم الجهاز
تخدام االسانويالحقا
هاتف محمول اساسي )بلوتوث(هاتف محمول متطور
(PDA) مساعد رقمي شخصيجهاز مناداة
)البتوب(آمبيوتر محمول )ديسكتوب(آمبيوتر مكتب (Vonage) هاتف بواسطة االنترنت
آاميرا تقليدية آاميرا رقمية آاميرا فيديو
ل سمعيجهاز تسجي (iPod) اجهزة متعددة االغراض
MP3) مشفل ملفاتIpod Shuffle(
)سكانر(ماسح ضوئي طابعة
مترجم محمول (USB (وسائل تخزين محمولة اذآر (اخر
________________(
المعلومات الشخصية : القسم الرابع
د ستحظى بالسرية الكاملة يرجى العلم بان جميع الردو: مهم
انثى ذآر الجنس-22
______ الرقم في الخانة ين من العمر؟ يرجى آتابة / آم تبلغ-23
______________________) مثال اقتصاد، رياضة، صحة(الصحافي الرئيسي؟ ما هو مجالك-24
260
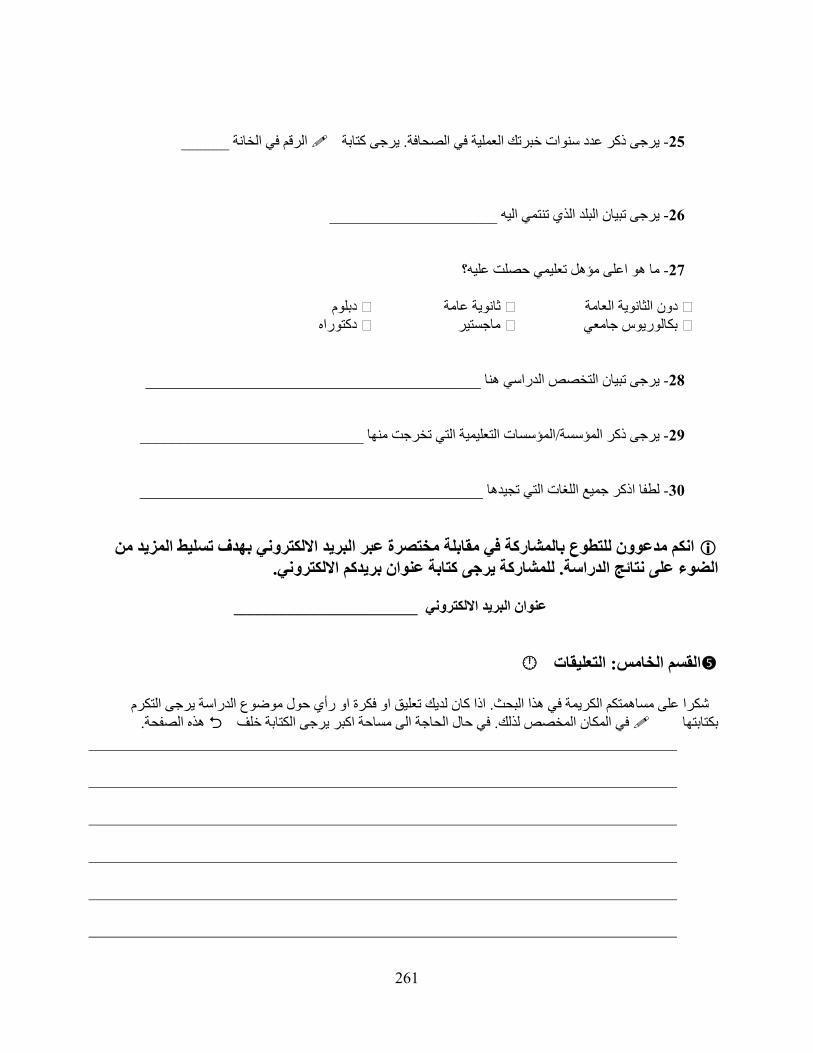
______ الرقم في الخانة جى آتابة ير. يرجى ذآر عدد سنوات خبرتك العملية في الصحافة-25
_____________________ يرجى تبيان البلد الذي تنتمي اليه -26
ما هو اعلى مؤهل تعليمي حصلت عليه؟-27 دبلوم دون الثانوية العامة ثانوية عامة
دآتوراه ماجستير بكالوريوس جامعي
__________________________________________نا يرجى تبيان التخصص الدراسي ه-28
____________________________ المؤسسات التعليمية التي تخرجت منها / يرجى ذآر المؤسسة-29
___________________________________________ لطفا اذآر جميع اللغات التي تجيدها -30 ابلة مختصرة عبر البريد االلكتروني بهدف تسليط المزيد من انكم مدعوون للتطوع بالمشارآة في مق
.للمشارآة يرجى آتابة عنوان بريدآم االلكتروني. الضوء على نتائج الدراسة
_______________________عنوان البريد االلكتروني
التعليقات : القسم الخامس
ك تعليق او فكرة او رأي حول موضوع الدراسة يرجى التكرم اذا آان لدي. شكرا على مساهمتكم الكريمة في هذا البحث. هذه الصفحةفي حال الحاجة الى مساحة اآبر يرجى الكتابة خلف . في المكان المخصص لذلك بكتابتها
261

262

APPENDIX C
QUESTIONNAIRE-RELATED LETTERS Dear Editor-in-Chief, I am sending this letter to request your kind assistance in my research project. I am a PhD student on scholarship through the Department of Library and Information Science at Kuwait University since 2003. Currently, I am working on a dissertation titled “Internet Behaviors of Print-Journalists in Kuwait’s Daily Newspapers” at the University of Pittsburgh in the United States of America. The dissertation aims to explore the internet behaviors of journalists in terms of what applications are depended on, what evaluation techniques are used, and the skill-level of journalists in using applications of information technology. Your organization’s participation in the study, the first of its kind in Kuwait and the Middle East, is very important for the final outcome. In addition, your valued participation will add to the accuracy of the results, and assist in exploring new paths of research in future. As a previous journalist, I am greatly aware of the issues faced by journalists in Kuwait, and seek to provide a means of improving, and reforming current practices through systematic research. Also, I would like to assure you that all the information obtained for the purpose of this study will by anonymous and confidential. No information will be used for any purpose other than the research study mentioned, and no person will be singled out for identification. Your participation is voluntary, and you may withdraw from this study at any time. The targeted population includes the Editor-in-Chief and his/her assistants, editorial managers and his/her assistants, heads of departments and their assistants, editors, and journalists. Any individual who receives a payment for a journalistic task is targeted. If you have any inquiries about this study, you are encouraged to contact the researcher using any of the methods listed below. Thank you for your time.
Abdulnasir Abdulla Al-Shatti School of Information Sciences- Department of Library and Information Science
University of Pittsburgh
263

ARABIC VERSION
السيد رئيس التحرير المحترم،،، تحية طيبة وبعد،،،
أنني بعثت في عام ارآم ب ة 2003في البداية أود اخط ات والمعلومات في جامع م المكتب سم عل ل ق من قب
.الكويت للحصول على درجة الدآتوراه في تخصص علم المكتبات والمعلومات
سبيرغ االمري ة بيت ي جامع وراه ف ب دآت ا آطال وم حالي اتي واق سلوك المعلوم ة عن ال ة األطروح ة بكتاب كياملين في الصحف ) انترنت(للصحافيين لدى استخدام الشبكة االلكترونية ع الع من خالل استبيان يشمل جمي
.اليومية الكويتية
ى االشتراك في ة عل ا في Rلذا، ارجو من سعادتكم الموافق ى من نوعه ذه الدراسة التي ستكون االول هى الكويت والشرق االوسط علما بأن مشارآتكم الكريمة ستزيد من صدق وثبات الدراسة مما يعود بالنفع عل
.الجميع
تم التطرق الشخاص ن ي آما اود ان اشير الى ان جميع المعلومات المتعلقة بالصحافيين ستكون سرية ول .بذاتهم في الدراسة
ر وتشمل الدراسة جميع العاملين في صحيفتكم الموقرة وأقصد بال ا شهريا نظي تحديد آل من يتقاضى راتب
ررين، سام، المح اء األق ه، رؤس ر ونواب دير التحري ه، م ر ونواب يس التحري ك رئ شمل ذل ا وي ال تحريري عم.والصحافيين
.وفي حال وجود استفسارات اضافية حول طبيعة الدراسة يرجى التكرم باالتصال بالباحث
صحافة وفي الختام تقبلوا تحياتي وشكري الجزيل ة ال ة وتطوير مهن امال ان تساهم هذه الدراسة في تنمي
. في الكويت
عبدالناصر عبداهللا الشطي/ ابنكم المعيد
Abdulnasir Abdulla Al-Shatti School of Information Sciences- DLIS
University of Pittsburgh Pittsburgh, PA 15260
[email protected] +965-901-0500 (KUW)
264
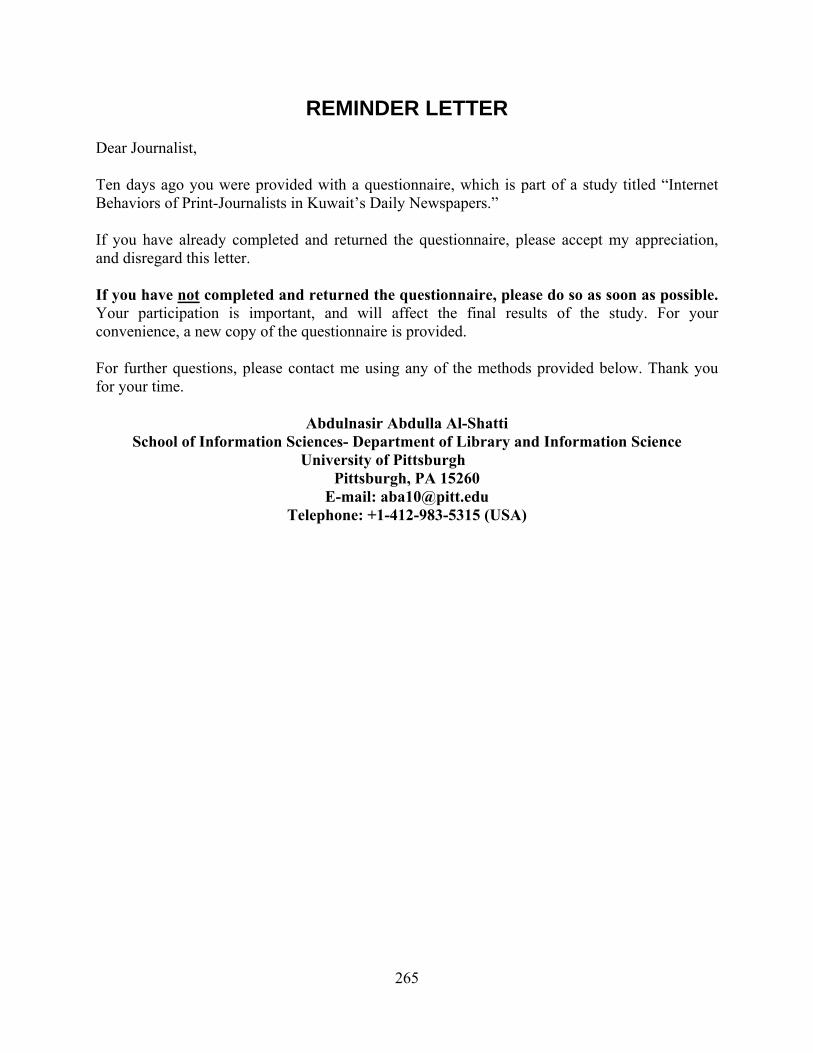
REMINDER LETTER Dear Journalist, Ten days ago you were provided with a questionnaire, which is part of a study titled “Internet Behaviors of Print-Journalists in Kuwait’s Daily Newspapers.” If you have already completed and returned the questionnaire, please accept my appreciation, and disregard this letter. If you have not completed and returned the questionnaire, please do so as soon as possible. Your participation is important, and will affect the final results of the study. For your convenience, a new copy of the questionnaire is provided. For further questions, please contact me using any of the methods provided below. Thank you for your time.
Abdulnasir Abdulla Al-Shatti School of Information Sciences- Department of Library and Information Science
University of Pittsburgh Pittsburgh, PA 15260
E-mail: [email protected] Telephone: +1-412-983-5315 (USA)
265
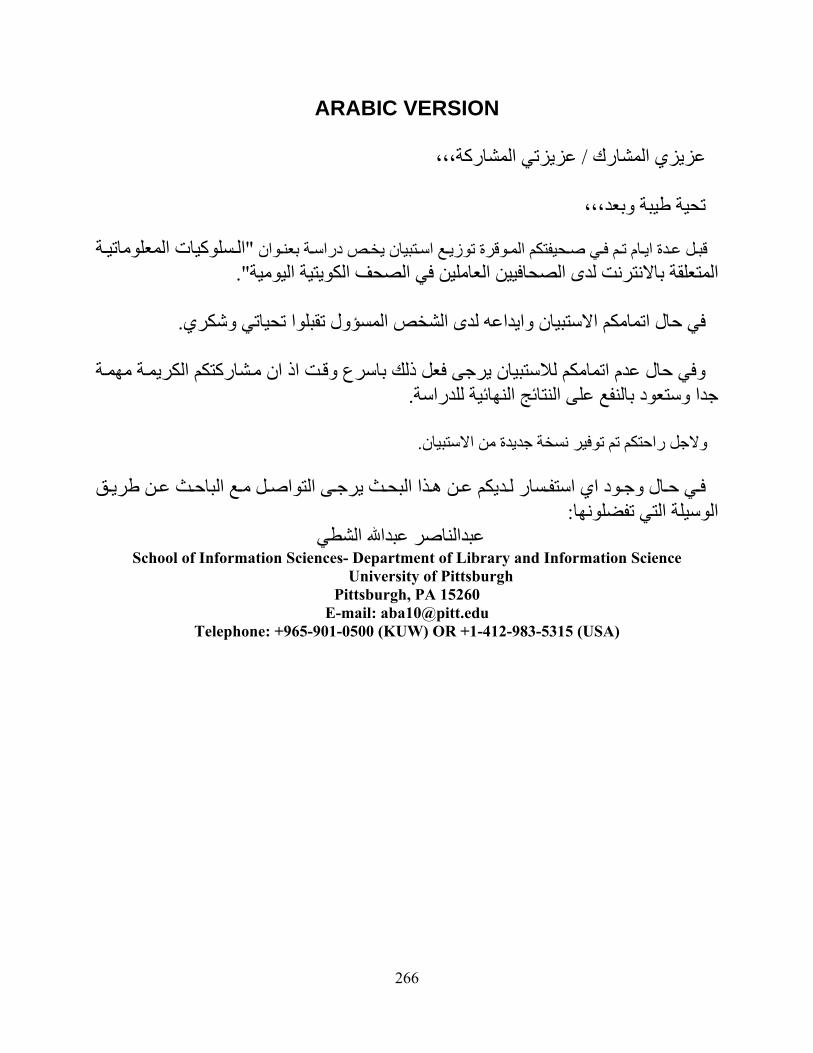
ARABIC VERSION
عزيزتي المشارآة،،،/ عزيزي المشارك
تحية طيبة وبعد،،،
وان ة بعن تبيان يخص دراس ع اس وقرة توزي ي صحيفتكم الم م ف ام ت دة اي ل ع ة "قب سلوآيات المعلوماتي ال ".المتعلقة باالنترنت لدى الصحافيين العاملين في الصحف الكويتية اليومية
.ص المسؤول تقبلوا تحياتي وشكريفي حال اتمامكم االستبيان وايداعه لدى الشخ
ة ة مهم شارآتكم الكريم وفي حال عدم اتمامكم لالستبيان يرجى فعل ذلك باسرع وقت اذ ان م
. جدا وستعود بالنفع على النتائج النهائية للدراسة
. والجل راحتكم تم توفير نسخة جديدة من االستبيان
ذا البحث ير ديكم عن ه سار ل ود اي استف ال وج ي ح ق ف ع الباحث عن طري جى التواصل م :الوسيلة التي تفضلونها
عبدالناصر عبداهللا الشطيSchool of Information Sciences- Department of Library and Information Science
University of Pittsburgh Pittsburgh, PA 15260
E-mail: [email protected] Telephone: +965-901-0500 (KUW) OR +1-412-983-5315 (USA)
266

QUESTIONNAIRE PRE-TESTING LETTER Dear colleague, You have been randomly chosen, as a student of journalism and mass communications, to participate in the pre-testing of an academic questionnaire. I am currently conducting a research study titled “Information Behaviors of Print-Journalists in Kuwait’s Daily Newspaper.” The study is part of fulfilling the requirements for a PhD degree at the Department of Library and Information Science at the University of Pittsburgh. The study, the first of its kind in Kuwait and the Middle East, will examine Internet-related behaviors, such as preferences and uses of E-mail, the World Wide Web (WWW), etc. In addition, the study will examine journalists’ skills in evaluating information found online, and their skills in using Internet Technologies. I would greatly appreciate your assistance regarding this important matter. Your important role requires that you carefully examine the attached questionnaire, and provide me with feedback regarding content, format, clarity, flexibility, and comprehensiveness of the questionnaire. Your feedback is of great importance and will affect the overall design of the questionnaire. For example, your feedback can include comments about re-wording a question, or clarifying a question, or using a different word that is more understandable, or any issue that is important to the overall outcome. Also, kindly provide the time it took for you to complete the questionnaire. Please note that all information collected through this process is confidential, and will not be released to any third-parties. The information you provide will be used for research purposes only. You can send your feedback via E-mail to [email protected], or by regular mail using the address provided below. Please note that the deadline for feedback is the 1st of May, 2006. Thank you for your greatly appreciated time and assistance. For further information, please contact me using any of the methods provided below. Yours truthfully,
Abdulnasir Abdulla Al-Shatti School of Information Sciences- Department of Library and Information Science
University of Pittsburgh Pittsburgh, PA 15260
E-mail: [email protected] Telephone: +1-412-983-5315 (USA)
267
ARABIC VERSION
عزيزي الطالب، عزيزتي الطالبة،
ة وبعد،تحية طيب
ا ة عنوانه من دراس ي ض تبيان علم حة اس ل ص ي تحلي شارآة ف الم للم ة اع شوائيا آطلب ارآم ع م اختي تة " ة اليومي أتي ".السلوآيات المعلوماتية المتعلقة باالنترنت لدى الصحافيين العاملين في الصحف الكويتي ت
سبيرغ وهي هذه الدراسة ضمن متطلبات درجة الدآتوراه لدى قسم علم المكتبات والم ة بيت دى جامع علومات ل.االولى من نوعها في الكويت والشرق االوسط
شمل واحي ت دة ن ل الصحافيين من ع وتهدف الدراسة الى تسليط الضوء على آيفية استخدام االنترنت من قب
تخ ارات اس يم مه ى تقي افة ال ت اض ى االنترن ات عل يم المعلوم ة تقي ا وآيفي ستخدمة واهميته ات الم دام التطبيق .تكنولوجيا المعلومات لدى الصحافيين
ى اس هي اول يم والقي ستقبل الصحافة في الكويت ألن التقي ى م ان مشارآتكم الكريمة ستعود حتما بالنفع عل
.لبنات التخطيط للمستقبل واالصالح
م االسئلة، موا ويرجى التكرم بتوفير معلومات ى، سهولة فه ضيع تتعلق بتصميم االستبيان، وضوح المعنام . االسئلة، واي امور اخرى ترونها ضرورية وتحسن االستبيان ذي استغرقته التم آما يرجى ذآر الوقت ال
.االستبيان
ى ي ال د االلكترون ر البري م عب ال ردودآ انكم ارس ى Redu.pitt@10abaوبامك د عل الل البري ن خ او ماه ع المعلومات التي . العنوان المذآور ادن ان جمي م ب ستخدم اال ويرجى العل ن ت تبقى سرية ول ا س د توفرونه ق .لغرض البحث العلمي
ي يلة الت ق الوس ع الباحث عن طري ذا البحث يرجى التواصل م ديكم عن ه سار ل ي حال وجود اي استف ف
:تفضلونها
عبدالناصر عبداهللا الشطيSchool of Information Sciences- Department of Library and Information
Science University of Pittsburgh
Pittsburgh, PA 15260 edu.pitt@10aba
Telephone: +1-412-983-5315 (USA)
.ولكم مني جزيل الشكر واالمتنان لمشارآتكم الكريمة
268

APPENDIX D
FOLLOW-UP INTERVIEW BY E-MAIL
Internet Behaviors of Print-Journalists in Kuwait’s Daily Newspapers
Follow-up Interview By E-mail Thank you for participating in this study. Please answer the following questions. Your input is greatly valued, and will be given great consideration in the final results of this study.
1. In your opinion, do you think that the Internet and other information technologies
encourage females to pursue careers in journalism or not? Why?
2. Please describe a situation where the Internet was instrumental in the development of a
news story.
3. Do you encourage enhancing the current educational curricula in Kuwait to improve
Internet-related behaviors of journalists? Why? And what changes would you
recommend?
4. What should training seminars and workshops focus on in order to improve Internet-
related behaviors of journalists?
5. Will creating more “journalist friendly” systems, or software, improve Internet-related
behaviors of journalists? What would these systems consist of? (For example E-mail,
browsing, virus protection, etc.)
269
ARABIC VERSION
السلوآيات المعلوماتية المتعلقة باالنترنت لدى الصحافيين العاملين في الصحف الكويتية
اليومية
مقابلة عن طريق البريد االلكتروني
ة . شكرا على قبولكم المشارآة في هذه الدراسة يرجى التكرم باالجابة على االسئلة التالية حيث ان آراءآم مهم
)عبدالناصر عبداهللا الشطي: الباحث(ئج النهائية للدراسة وستلقى االهتمام المناسب في النتا
هل تعتقد بان االنترنت وتقنيات المعلومات تشجع المرأة على العمل في مجال الصحافة؟ لماذا؟ .1
ادة .2 ر او م ز خب يرجى وصف موقف حدث لك وآان فيه لالنترنت دورا آبيرا وبارزا في بلورة وتجهي
.صحافية
ة هل تشجع عملية تعديل الم .3 سلوآيات المعلوماتي ناهج التعليمية الحالية في الكويت من اجل تحسين ال
وما هي التعديالت التي تقترحها؟ المتعلقة باالنترنت لدى الصحافيين؟ لماذا؟
درات الصحافيين .4 ع مق ة وورش العمل من اجل رف دورات التدريبي ماذا يجب ان يكون محل ترآيز ال
في التعامل مع االنترنت ولماذا؟
سلوك ه .5 ى تحسن ال ؤدي ال د ي ل تعتقد بان تطوير انظمة او برامج مخصصة الحتياجات الصحافيين ق
ة رامج او االنظم ذه الب ل ه ات مث ا هي مكون ت؟ م ق باالنترن اتي المتعل د (المعلوم درات البري ثال ق م
؟ )االلكتروني او التصفح او الحماية من الفيروسات الخ
270
APPENDIX E
NEWSPAPERS AND INTERNET IN KUWAIT Newspapers Kuwait's experience with the printed press can be traced back to 1928, when AbdulAziz Al-
Rasheed established Majalat Al-Kuwait (Kuwait Magazine) (Abdullah, 1986; Ayalon, 1995). It
was a monthly magazine that covered religion, history, literature, linguistics, and morality
(Meleji, 1982). The magazine was the first of its kind in the Gulf region. However, due to lack of
financing, and the difficulties in transporting the publication from Egypt, where it was printed, to
Kuwait, the magazine was stopped after two years.
That initial experience was expanded in December of 1946 when Kuwaiti students
studying in Egypt established Majalat Al-Be'tha (Delegation Magazine). Despite its humble
beginning, the students managed to keep the magazine going for more than seven years. During
that period, many magazines, such as Kathma, Al-Sha'ab, Al-Fajer, Al-Basheer, Al-Eman, Al-
Raed, and Al-Kuwait, were established but none of them found enough support to keep them in-
print.
However, as Kuwait started gaining large profits from oil exportation, the society started
evolving and developing at a fast pace. This development yielded the establishment of Kuwait's
first newspaper in April of 1961- Al-Rai Al-Aam (Public Opinion). This was followed by Al-
Watan (The Homeland) in 1962, Kuwait Times in 1963, Al-Seyassah (Politics) in 1965, Al-Qabas
271
(The Beacon) in 1972, Al-Anbaa (The News) in 1976, and Arab Times in 1977 (Abdullah, 1986;
Smalley, 2005). The rapid evolution of the Kuwaiti society was paralleled by a similar evolution
in the printed press. By the 1980s, Kuwait hosted more than 36 magazines and newspapers, with
a number of these publications, such as Al-Arabi (Pioneer) magazine, being popular not only
locally, but in the region as a whole (Kazan, 1994). Although many of these publications ceased
from publishing, new magazines continue to appear constantly. However, since the establishment
of the Arab Times, the government stopped issuing licenses for new daily newspapers. Despite
that hurdle, a new law is currently being discussed which allows for new daily newspaper
licenses.
Kuwait's political evolution was also occurring during the 1940s and 1950s, culminating
in the establishment of a National Assembly in 1963 (Ministry of Communications, 2001).
Kuwait's constitution also went into effect that same year. The 1960s witnessed a qualitative and
quantitative growth in newspapers, as the "dailies started to appear with a high level of
sophistication and a wide spectrum of orientations," (Kazan, 1994).
The constitution's creators, aware of the rapid developments occurring at the time, did not
overlook the press, and addressed it in article 37, which states "Freedom of the press, printing,
and publishing is guaranteed in accordance with the conditions and manner specified by law."
(Kuwait, 1962) The freedom of the press, guaranteed by the constitution, created one of the
freest media in the Middle East. Reporters Without Borders (Reporters Without Borders, 2004)
stated in a report that "Kuwait, along with Lebanon, is one of the most relaxed Arab countries
about press freedom." This was previously reflected by Rugh (1987), who classified the Arab
media into three systems: the mobilization press, the loyalist press, and the diverse press. The
Kuwaiti press, along with the Lebanese and Moroccan, were classified in the diverse press
272
“because its most significant distinguishing characteristic is that the newspapers are clearly
different from each other in content and apparent political tendency as well as in style,” (Rugh,
1987). This diversity is attributed to political openness, private ownership of newspapers, and the
ruling regime’s acceptance of the media (Rugh, 1987). Kazan (1994) attributed the diversity and
development of media in Kuwait to "diversified and pluralistic demographic structure and a
higher level of popular political participation than the other Arab states."
Also, this diversity of the Kuwaiti press can be attributed to the large number of
expatriates working in the media (Anwar, Al-Ansari, Abdullah, 2004). This diverse workforce
reflects positively on the editorial policies and coverage of newspapers. However, males
dominate the profession by a ratio of 9 to 1 (Al-Rasheed, 1998; Anwar, Al-Ansari & Abdullah,
2004). The average age of a journalist in Kuwait is under 35 years old, and more than 50 percent
of them hold a university degree (Al-Rasheed, 1998). However, of the university degree holders,
less than 20 percent of them studied journalism (Al-Rasheed, 1998). This can be a positive
addition to the Kuwaiti media as it adds to its diversity. However, it can also be a negative point
acting as an obstacle towards achieving a truly professional workforce that is dedicated to the
field of journalism. Other obstacles facing the evolution of the Kuwaiti media include the lack of
training, and the dependence on part-time employment. This part-time employment could be due
to the low salaries paid by employers, as Al-Rasheed (1998) found that more that 80 percent of
journalists in Kuwait are paid less than 600 Kuwaiti Dinars ($2000) per month.
A turning point for the Kuwaiti media, occurred after the liberation of Kuwait in 1991.
Editorial policies started reflecting more sympathy towards the West, and less towards the
previously favored pan-Arab issues. The invasion transformed the press in many ways, as
newspapers became focused on local news, opinion, and criticism of governmental decisions
273
(Al-Rasheed, 1998). Further, the Kuwaiti press witnessed the publication of three new dailies
over the period of the Iraqi invasion. Sawt Al-Kuwait (Voice of Kuwait) and New Arabia were
published by the Kuwaiti government in exile and did not circulate in Kuwait until after the
liberation in 1991. Al-Fajr Al-Jadeed (New Dawn) was launched in March of 1991. However,
none of the three government-owned newspapers managed to survive, mainly due to competition
from the other dailies (Kazan, 1994).
Style & Coverage
The newspapers in Kuwait provide similar coverage that includes local, regional and
international news, economy, sports, entertainment, law and security, arts and culture, health,
women's issues, obituaries, education, and more. Sometimes coverage is provided for specific
areas on a weekly basis such as technology pages, general complaints from the public, religion,
automobiles, and others. Also, newspapers produce daily and weekly supplements covering
specific events, such as the football world cup, or a major news event. Further, Al-Qabas
occasionally gives its subscribers a new book every month. Promotions for subscriptions are
frequent, with newspapers offering new subscribers a chance to win valuable prizes such as cars,
money, and more.
All seven daily newspapers are printed on broadsheet papers, with their sizes being
identical. The number of pages differs depending on the news cycle, but an average of 65 pages
is expected on a daily basis. The number of pages declines during the weekend days on Thursday
and Friday because of the slowing news cycle in the Middle East in general due to the weekend.
274
Further, all the daily newspapers host electronic versions except Al-Anbaa. The electronic
versions, despite being a sign of progress, are only carbon copies of the print editions of each
newspaper. Online journalism has yet to take effect on Kuwait's newspapers. The styles of the
newspapers are also similar. The front-page is anchored by a large masthead displaying the
newspaper's name. The date, in Arabic and English, are printed under the masthead. The rest of
the front page is occupied by large headlines of the news of the day. The last page of each
newspaper has been traditionally reserved for light, or odd, news. That is also where the obituary
section exists, and the daily caricature.
Overall, that similarity in style and coverage between newspapers has created fierce
competition between them in order to attract new subscribers. The newspapers' main income
comes from advertising. However, a strong subscription rate assists in attracting new advertisers.
It is rare that a Kuwaiti house, or organization, does not have a subscription to a daily newspaper.
275
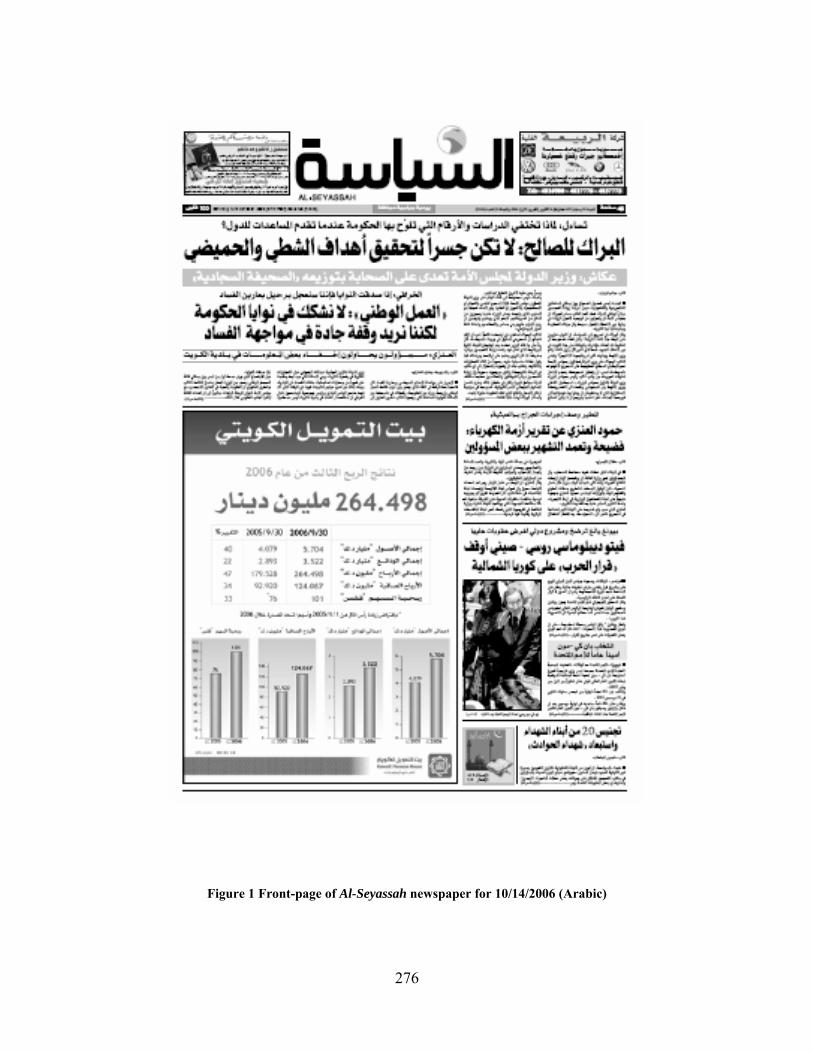
Figure 1 Front-page of Al-Seyassah newspaper for 10/14/2006 (Arabic)
276
Al-Rai Al-Aam (Public Opinion)
Although it started as a weekly newspaper for almost one year, Al-Rai Al-Aam became the first
Arabic-language daily newspaper in Kuwait (Abdullah, 1986). Its first issue was published on
the 16th of April, 1961. The newspaper was suspended from publishing, and fined, on several
occasions due to its editorials and caricatures. Published by Dar Al-Jazeerah Press, Printing &
Publishing Co., the newspaper's estimated circulation is 88,000 (Smalley, 2005), making it the
most popular newspaper currently in Kuwait. The newspaper maintains an electronic website
(www.alraialaam.com) that is ranked 7,209 in overall web traffic by Alexa Internet, Inc. Also,
150 websites link to the newspapers website, according to Alexa. The newspaper established its
website in August, 1999, and online users can retrieve electronic copies of the newspaper dating
back to June, 2004. No search engine is available.
Rugh (1987) described the newspaper's attitude as supportive of the Al-Sabah ruling
family, critical of public figures who opposed communism and Arab socialism, and critical of
American policies in the Middle East. However, as a result of the Iraqi invasion of 1990, the
media in Kuwait became supportive of America and the West, and less concerned with Arab
socialism, and other Pan-Arab issues.
Al-Watan (The Homeland)
The second Arabic-language daily newspaper in Kuwait published its first issue on the 5th of
June, 1962. Similar to Al-Rai Al-Aam, the newspaper started out as a weekly, and transformed
into a daily after it was bought by Mohammed Musaed Al-Saleh, one of the main contributors to
277
Majalat Al-Be'tha (Abdullah, 1986). The newspaper is published by Dar Al-Watan Press,
Publishing & Printing, and its circulation is claimed to be 70,000 (Smalley, 2005). It has a
website (http://www.alwatan.com.kw) that is ranked 4,960 in terms of overall traffic on the web
by Alexa. The newspaper also has 196 websites linking to its website. Al-Watan allows online
users to retrieve electronic versions dating back to July, 2001. A search engine is provided but is
not helpful.
Rugh (1987) described Al-Watan as an outspoken newspaper that advocated "democratic
concepts including free speech and the free exchange of ideas." Rugh (1987) also noted that Al-
Watan, on many occasions, was "critical of the Kuwaiti government." This description by Rugh
does not hold true today, as the ownership of the newspaper was transferred to a member of the
ruling family. The newspaper has become an invisible propaganda tool serving the needs of
government and top officials. Kazan (1994) described Al-Watan, along with Al-Qabas, as the
most liberal while Al-Seyassah was the most conservative.
Kuwait Times
The first non-Arabic language daily newspaper in Kuwait started publishing on the 8th of July,
1963. Kuwait Times published in English with frequent supplements in Urdu, Malayalam, and
Tagalog (Abdullah, 1986). Published by Kuwait Times Publishing House, the newspaper
estimated its circulation to be around 32,000 daily newspapers (Smalley, 2005). Kuwait Times
maintains a website (www.kuwaittimes.net) that is ranked 271,039 in terms of overall traffic on
the web by Alexa. Sixty-eight other websites are linked to the newspaper's website, which has
278
been online since June 2001. The website allows online users to retrieve news dated back to
November, 2005. However, no search capabilities are provided.
The newspaper presents a "moderate, liberal point of view," with a strong emphasis on
non-Arab affairs (Rugh, 1987). At a time of great instability in the Middle East, Yousuf Saleh
Alyan, founder of Kuwait Times, thought that an English newspaper was an effective mechanism
to bridge the "communication" gap between Kuwait and the rest of the world by "explaining the
monumental changes taking place in the world and bolstering Kuwait's image abroad," (Kuwait
Times, 2006).
Al-Seyassah (Politics)
This newspaper also started as a weekly when its first issue appeared on the 3rd of June, 1965
(Abdullah, 1986). Nearly three years later, on the 8th of April, 1968, it transformed into a daily
newspaper. Published by Dar Al-Seyassah for Publishing and Advertising, the newspaper
estimated its circulation to be around 42,000 (Smalley, 2005). Similar to its counterparts, Al-
Seyassah maintains a website (www.alseyassah.com) that is ranked 4,769 in terms of overall
traffic on the web by Alexa, making it the most popular Kuwaiti daily newspaper online. Also,
218 websites link to the newspaper's site, which has been online since March, 2002. The number
of links to the website is the highest among Kuwaiti online newspaper. In its online version, the
newspaper maintains complete copies of its paper version in portable document format (pdf)
dating back to April, 2004. These pdf versions are available to online users for free. However,
the site does not maintain a search engine, making it difficult to find information in a timely
manner.
279
Al-Seyassah's editorial policies are more liberal and diverse in comparison to the other
newspapers (Rugh, 1987). Also, the newspaper advocates "moderate courses of action, treating
issues in a less emotional fashion," (Rugh, 1987).
Al-Qabas (The Beacon)
Its first issue was published on the 22nd of February, 1972. Published by Al-Qabas Press, the
newspaper estimated its circulation to be around 65,000 (Smalley, 2005). Al-Qabas maintains a
website (www.alqabas.com.kw) that is ranked 9,099 in terms of overall traffic on the web by
Alexa. Eighty-eight websites link to the newspaper's site. Also, the newspaper maintains
complete copies of its paper version in pdf format dating back to 7 days only. These files are
available to online users for free. The website also provides a search engine. However, it is very
complicated to use, and is a hindrance rather than help. Labeled as the most successful
newspaper in Kuwait, Al-Qabas seeks to satisfy all the different Kuwaiti sects (Rugh, 1987). Its
orientation is driven by free enterprise capitalism, political objectivity, and nationalism (Rugh,
1987). However, similar to Al-Watan, Al-Qabas is partly owned by members of the ruling family
(Gidron, 1993).
Al-Anbaa (The News)
Its first issue came to light on the 5th of January, 1976, increasing the number of Arabic-language
daily newspaper in Kuwait to five (Abdullah, 1986). The newspaper is published by Dar Al-
Kuwait Press, and has yet to create an online website.
280
Al-Anbaa, the youngest of the Arabic dailies in Kuwait, is a strong "advocate of
capitalism and Arab family traditions, and it has been an outspoken critic of governmental
policy," (Rugh, 1987).
Arab Times
This newspaper became the second non-Arabic language daily newspaper in Kuwait. Its main
publishing language is English, in addition to frequent supplements in Urdu and other languages.
Its first issue was published in February, 1977, and is an affiliate of Al-Seyassah newspaper. The
newspaper estimated its circulation to be around 35,000 (Smalley, 2005). The newspaper
maintains a website (http://www.arabtimesonline.com/arabtimes/) that is ranked equally with Al-
Seyassah, as both newspapers share the same server. Rugh (1987) described the Arab Times as
liberal newspaper focusing on regional news. Its lively style made the newspaper one of the most
popular non-Arabic publications in Kuwait (Rugh, 1987).
Internet in Kuwait
Since the commercialization of the Internet in the beginning of the 1990s, Kuwait embarked on a
national campaign to make the most, and best, use of the medium. Due to the fact that Kuwait
was spending billions of dollars to rebuild the country after the devastation suffered from the
Iraqi invasion of 1990, the Internet was integrated into the rebuilding process, resulting in the
assembly of a “highly networked and dependable communications infrastructure,” (Wheeler,
2000). In 1992, Kuwait became the first country in the region to provide free Internet access to
281
all students and faculty in Kuwait University, the only university in the country at the time
(Wheeler, 1998). This free access assisted greatly in the adoption, and spread, of the Internet in
Kuwait. Soon after, Kuwait was host to more than half of the Internet sites in the Persian Gulf
(Burkhart, 1998). Further, this growth was encouraged by low prices for Internet access. Kuwait
provided Internet access for less than $20 a month, the cheapest amongst all Arab countries
(Aladwani, 2003). Also, Kuwait is one of the rare countries in the Middle East where Internet
censorship is minimal. Censorship is limited to pornographic and gambling sites.
Kuwait currently has three Internet Service Providers- Gulfnet/KEMS, Qualitynet, and
Fast Telecommunications. Also, there are 13 sub-ISPs, providing pre-paid Internet access, in
addition to more than 150 Internet cafés (Economic and Social Commission for Western Asia,
2003). The ISPs serve the needs of more than 567, 000 users, or 4.22 percent of the total
population (Al-Shimmari, 2005). Today, users in Kuwait have a variety of options for connecting
to the Internet. These include purchasing pre-paid Internet cards that provide access for a pre-
defined amount of hours or days ($1 for 7 hours up to $16 for one month of unlimited access),
and subscribing to dial-up ($29/month). Also, users can subscribe to an Asymmetric Digital
Subscriber Line, which offers connection speeds ranging from 64 kilobits per second
($50/month) up to 2 megabits per second ($900/month). Wireless connection cards and Internet
connections using satellite dish are also available. New developments in the area of Internet
connections include the installation of wireless access points at popular locations, and the
availability of Internet connections using mobile phones, as provided by the mobile companies in
Kuwait.
Internet usage in Kuwait has grown more than 278 percent over the past five years, with
Kuwait accounting for 3 percent of the total Internet users in the Middle East, estimated at 25
282
million users (Al-Shimmari, 2005). This growth rate is expected to continue as the government
forges ahead with its plans to create an information society, and continues promoting Internet
adoption. The government, which is mainly responsible for the introduction and spread of the
Internet in Kuwait (Wheeler, 2001), launched its electronic government (e-government) initiative
in 2000. Since then, the initiative yielded websites to most governmental ministries and
organizations, online access to government databases, and a growing number of electronic
services (Central Technical Body, 2006).
As the e-government initiative evolved, the Kuwaiti government introduced the national
document for building an information society in Kuwait (Al-Shimmari, 2005). This latest
initiative sets long-term strategic goals to assist in building an information society, including
building and developing information technology infrastructure, its applications and services,
working internationally towards bridging the digital divide, and developing regional cooperation
on issues of importance such as education and training in the information technology sector. The
ultimate goal is to increase productivity in all sectors of society by proving quick access to
information (Al-Shimmari, 2005).
This included the media, where the national document calls for a media policy that is
based on transparency and openness (Al-Shimmari, 2005). It further calls for implementing
training programs to educate the public on information technologies, and enhancing educational
curriculums at all levels. Also, the document emphasized the importance of launching a media
campaign to increase awareness about information technologies. This emphasis reflects on the
skills of media personnel in interacting with information technologies, and their ability to be
effective participants in the proposed media campaign.
283

Despite the slow speed of implementing the previously mentioned initiatives due to
bureaucracy and other factors, Kuwait is set to become one of the leading countries in the Middle
East in improving its society using the latest information technologies. This adds to the
importance of this study that will positively assist in improving the current situation.
284
APPENDIX F
DEFINITIONS The following definitions will be adopted throughout this study:
• Print journalist- An individual who collects, writes, edits, and presents news articles in a
newspaper. The individual is also responsible for verifying and analyzing information as
objectively as possible.
• Internet-related information behaviors- A reference to behaviors when interacting with
the Internet in terms of information. This includes seeking, evaluating, organizing, and
retrieving information from the Internet.
• Information- For the purposes of this study, information will be used in a broad sense to
cover data, including statistics, and any message that has a meaning to its receiver within
the set context.
• Internet- Gralla’s (2004) definition of the Internet will be used for this study. It stated that
Internet is “a collection of thousands of individual networks and organizations … each
network cooperates with other networks to direct Internet traffic so that information can
pass among them.” Also, the following definition is broadly applied- “The Internet is at
once a world-wide broadcasting capability, a mechanism for information dissemination,
and a medium for collaboration and interaction between individuals and their computers
without regard for geographic location,” (Leiner et al., 2003).
285
• Internet Applications- Any program, database, tool, service, etc., that requires access to
the Internet in order to be used. These include websites, electronic mail, file transfer
protocol, search engines, listservs™, journals, online databases, telnet, etc.
• Liberal- When used to describe newspapers or journalists or the media in general, liberal
is meant to reflect bold actions that are regarded as untraditional in terms of opinion,
coverage, and style. A liberal newspaper is one that expresses opinions that are regarded
as taboo by other newspapers, and society in general. Also, a liberal newspaper is one
that takes new, broad- and open-minded stances on issues.
286
BIBLIOGRAPHY
Abdullah, M. (1986). Al-sahafa wa al-sahafeyon fe al-Kuwait [Journalism and journalists in Kuwait]. Kuwait: That Elsalasel Press.
Aladwani, A. (2003). Key Internet characteristics and e-commerce issues in Arab countries.
Information Technology & People, 16(1), 9-20. Al-Anezi, K. (2000). Factors influencing chief editors' news selection in Kuwait television and
Kuwait radio. Unpublished Dissertation, Southern Illinois University, Carbondale. Alkhezzi, F. (2002). Internet use of graduate and undergraduate students in the college of
education at Kuwait university. Unpublished Dissertation, University of Northern Colorado, Greeley.
Al-Najran, T. (1998). Internet adoption and use by Kuwait university students: new medium,
same old gratifications. Unpublished Dissertation, The Ohio State University, Columbus. Al-Rasheed, A. (1998). Professional values: a survey of working journalists in the Kuwaiti daily
press. Unpublished Dissertation, Southern Illinois University, Carbondale. Al-Shimmari, D. (2005, 24/12). Al-Qabas tanshur alwatheeqa alwataneeya le benaa mujtama il
maloomat [Al-Qabas publishes the national document for building an information society]. Al-Qabas.
Al-Wawan, S., Yousif, R., Al-Hajri, K., & Al-Omran, B. (2006, 02/21). Majles al-omah baya' bil
ejma' Nawaf Al-Ahmad waleyan lil-ahd [Parliament unanimously vote Nawaf Al-Ahmad crown prince]. Al-Seyassah, pp. 14-15.
Anwar, M., Al-Ansari, H., & Abdullah, A. (2004). Information seeking behaviour of Kuwaiti
journalists. Libri, 54(4), 228-236.
287
Ayalon, A. (1995). The press in the Arab Middle East: a history. Oxford: Oxford University Press.
Babbie, E. (1998). Survey research methods (2nd ed.) Belmont: Wadsworth. Babbie, E. (2004) The practice of social research (10th ed.) Belmont: Wadsworth. Bookstein, A., & Cooper, W. (1976). General mathematical model for information retrieval
systems .Library Quarterly, 46 )2( ,153-167. Bradley, R. (1980). Motivations in legislative information use. Legislative Studies Quarterly,
5(3), 393-406. Broadus, R. (1980). Use studies of library collections. Library Resources and Technical
Services, 24, 317-324. Burkhart, G. (1988). National security and the Internet in the Persian Gulf region. Retrieved 02-
28, 2006, from http://www.georgetown.edu/research/arabtech/pgi98-1.html Campbell, F. (1997). Journalistic construction of news: information gathering. New Library
World, 98(1133), 60-64. Case, D. (1991). Example of the social construction of information technologies: videotex in the
United States and Europe. Paper presented at the 54th Annual Meeting of the American Society for Information Science, Washington, DC.
Cawkell, A. E. (1975). Measure of 'efficiency factor'-communication theory applied to document
selection systems .Information Processing and Management, 11 )8-12( ,243-248. Central Technical Body. (2006). Achievements. Retrieved 02/01, 2006, from
http://www.e.gov.kw/Default.aspx?pageId=11 Chinn, L. A. (2001). The information seeking behavior and needs of journalists in context.
Unpublished Master's Thesis, University of North Carolina, Chapel Hill.
288
Clarke, P., & James, J. (1967). The effects of situation, attitude intensity and personality on information-seeking. Sociometry, 30(3), 235-245.
Cohen, J. (1988) Statistical Power Analysis for the Behavioral Sciences (2nd ed.). New York:
Academic Press. Davenport, L., Fico, F., & Detwiler, M. (2001). How Michigan dailies use computers to gather
news. Newspaper Research Journal, 22(3), 44-57. Dervin, B., & Nilan, M. (1986). Information needs and uses. In M. E. Williams (Ed.), Annual
Review of Information Science and Technology (ARIST) (Vol. 21, pp. 3-33). White Plains, NY: Knowledge Industry Publications, Inc.
Deutsch, F., Fleming, A., Brooks-Gunn, J., Ruble, D., & Stangor, C. (1988). Information-seeking
and maternal self-definition during the transition to motherhood. Journal of Personality and Social Psychology, 55(3), 420-431.
Dong, X. (2003). Searching information and evaluation of internet: a Chinese academic user
survey. International Information & Library Review, 35, 163-187. Dragulanescu, N. (2002). Website quality evaluations: criteria and tools. International
Information & Library Review, 34, 247-254. Drone, J. (1984). Use study of the card catalogs in the university of Illinois music library.
Library Resources & Technical Services, 8(3), 253-262. Dumais, S., & Landauer, T. (1984). Describing categories of objects for menu retrieval systems.
Behavior Research Methods, Instruments, & Computers, 16, 242-248. Edem, U. S. (1993). Information needs and information seeking behavior patterns of journalists
in selected Nigerian towns. Journal of Library and Information Science, 19(2), 1-14. Eickelman, D., & Anderson, J. (Eds.). (1999). New media in the Muslim world: the emerging
public sphere. Bloomington & Indianapolis: Indiana University Press.
289
Economic and Social Commission for Western Asia, U. N. (2003). Profile of the information society in the State of Kuwait. Retrieved 02/25, 2006, from http://www.escwa.org.lb/wsis/reports/docs/Kuwait-E.pdf
Foster, A., & Ford, N. (2003). Serendipity and information seeking: an empirical study. Journal
of Documentation, 59(3), 321-340. Garrison, B. (1999). Journalists' perceptions of online information-gathering problems.
Retrieved 03/01, 2004, from http://www.miami.edu/com/car/neworleans1.htm. Garrison, B. (2000). Online information use in newsrooms: a longitudinal diffusion study.
Retrieved 03/03, 2005, from http://com.miami.edu/car/phoenix1.htm Garrison, B. (2002). The use of electronic mail as a newsgathering resource. Retrieved 03/31,
2004, from http://www.miami.edu/com/car/miamibeach2.htm Gidron, A. (1993). Power, mass media and the Middle East. Middle East Report, 180, 20. Glass, G., & Hopkins, K. (1995). Statistical methods in education and psychology (3rd ed.).
Boston: Allyn and Bacon. Gralla, P. (2004). How The Internet Works (7th ed.). Indianapolis: Que Publishing. Harman, J. (1986). Reuters: a survey of end-user searching. Aslib Proceedings, 38(1), 35-42. Herron, N. L. (1986). Information seeking behavior and the perceptions of information channels
by journalists of two daily metropolitan newspapers. Unpublished Doctoral Dissertation, University of Pittsburgh, Pittsburgh.
Hewins, E. (1990). Information need and use studies. In M. E. Williams (Ed.), Annual Review of
Information Science and Technology (ARIST) (Vol. 25, pp. 145-172). Amsterdam: Elsevier Science Publishers.
Ibrahim, M. M., & Al-Ansari, H. (1996). The role of press information centers in the State of
Kuwait. Arab Journal for the Humanities, 56, 68-109.
290
Iyer, H. (1982). Facet-structure of subjects: an empirical study of concretenes and predictability of categories. Library Science, 19(4), 223-239.
Jomaa, A., & Al-Saeedi, I. (2006, 03/07). Qanoon jadeed lil matboa'at bil ejma' [Unanimously a
new press law]. Al-Qabas, p. 1. Joseph, R. (1993). How Indian journalists use libraries? Information Development, 9(1/2), 70-75. Kazan, F. E. (1994). Kuwait. In Y. Kamalipour & H. Mowlana (Eds.), Mass media in the Middle
East: a comprehensive handbook. Westport: Greenwood Press. Ketterer, S. (2003). Oklahoma small dailies, weeklies use internet as reporting tool. Newspaper
Research Journal, 24(2), 107-113. Krathwohl, D. (1998). Methods of educational and social science research: an integrated
approach (2nd ed.). Long Grove: Waveland Press Inc. Kuhlthau, C. (1991). Inside the search process: information seeking from the user's perspective.
Journal of the American Society for Information Science, 42(5), 361-371. Kuwait. (1962). Kuwait constitution and resolutions. Retrieved 02-28, 2006, from
http://www.kuwait-info.com/sidepages/cont.asp Kuwait News Agency. (2006). NA approves press and publication draft law, refers it to
government. Retrieved 03/07, 2006, from http://www.kuna.net.kw/Story.aspx?Language=en&DSNO=835743
Kuwait Times. (2006). Kuwait Times: Forty years on. Retrieved 02-28, 2006, from
http://www.kuwaittimes.net/history.asp Leckie, G., Pettigrew, K., & Sylvain, C. (1996). Modeling the information seeking of
professionals: a general model derived from research on engineers, health care professionals, and lawyers. Library Quarterly, 66(2), 161-193.
291
Leiner, B., Cerf, V., Clark, D., Kahn, R., Kleinrock, L., Lynch, D., et al. (2003, 12/10/2003). A brief history of the Internet. Retrieved 01/25, 2006, from http://www.isoc.org/internet/history/brief.shtml#introduction
Lipetz, B. (1970). Information needs and uses. In C. Cuadra (Ed.), Annual Review of Information
Science and Technology (Vol. 5, pp. 3-32). Chicago: Encyclopaedia Britannica. Logan, E. (1988). Learning modes and online behavior of novice searchers. Paper presented at
the 9th National Online Meeting, New York, NY. Lüge, T. (1999). Usage patterns and information needs of journalists on the internet. University
of Munich, Munich. Meleji, A. (1982). Al-sahafa wa ruwadooha fe al-Kuwait: AbdulAziz Al-Rasheed wa thalath
majalat [Journalism and its pioneers in Kuwait: AbdulAziz Al-Rasheed and three magazines]. Kuwait: Kathma Company for Publishing, Translation, and Dissemination.
Menzel, H. (1966). Information needs and uses in science and technology. In C. Cuadra (Ed.),
Annual Review of Information Science and Technology (ARIST) (Vol. 1, pp. 41-69). New York: Interscience Publishers.
Metcalfe, J., & Gascoigne, T. (2001). Survey on how Australian journalists use the internet.
Retrieved 02/01, 2006, from http://www.econnect.com.au/pdf/internet_svy.pdf Millen, D., & Dray, S. (2000). Information sharing in an online community of journalists. Aslib
Proceedings, 52(5), 166-173. Ministry of Communications. (2001). Al-Kuwait haqaeq wa arqam [Kuwait facts and figures].
Kuwait: Administration of Media Publications- Ministry of Communications. Momani, H. (2003). Evaluation of the nature, extent, and satisfaction with use if the internet by
applied science and technology faculty members in Jordan. Unpublished Dissertation, University of Pittsburgh, Pittsburgh.
Neill, S. (1984). Reference process and certain types of memory: semantic, episodic, and
schematic. RQ, 23, 417-423.
292
New York Times. (1952, 03/16). Oil boom in Kuwait. New York Times, p. SM10. Nicholas, D., & Martin, H. (1997). Assessing information needs: a case study of journalists.
Aslib Proceedings, 49(2), 43-52. Nicholas, D., William, P. E., Cole, P., & Martin, H. (2000). The impact of the Internet on
information seeking in the media. Aslib Proceedings, 52(3), 98-114. Poteet, A. R. (2000). Newspaper journalists' information seeking behavior with online
information sources. Unpublished Master's Thesis, University of North Carolina, Chapel Hill.
Rogers, E. (1995). Diffusion of Innovations (4th ed.). New York: Free Press. Rugh, W. (1987). The Arab press (2nd ed.). Syracuse: Syracuse University Press. Reporters Without Borders. (2004). Kuwait- annual report (Website): Reporters Without
Borders. Saracevic, T. (1975). Relevance: a review of and a framework for thinking on the notion in
information science. Journal of the American Society for Information Science, 26, 321-343.
Schutz, A. (1970). Reflections on the problem of relevance. New Haven CT: Yale University
Press. Sharif, A. (2003). Factors affecting the adoption of the internet by public relations practitioners
in Kuwait: a comparison of two social systems. Unpublished Dissertation, Southern Illinois University, Carbondale.
Smalley, B. (Ed.). (2005). Middle East media guide. Dubai: Sandstone. Spink, A. (2004). Multitasking information behavior and information task switching: an
exploratory study. Journal of Documentation, 60(4), 336-351.
293

Spink, A., & Greisdorf, H. (2001). Regions and levels: measuring and mapping users' relevance judgments. Journal of the American Society for Information Science and Technology, 52(2), 161-173.
Spink, A., Ozmutlu, H., & Ozmutlu, S. (2002). Multitasking information seeking and searching
processes. Journal of the American Society for Information Science and Technology, 53(8), 639-652.
Spink, A., & Saracevic, T. (1997). Interaction in information retrieval: selection and
effectiveness of search terms. Journal of the American Society for Information Science, 48(8), 741-761.
Spink, A., Wilson, T. D., Ford, N., Foster, A., & Ellis, D. (2002). Information seeking and
mediated searching study part 3 successive searching. Journal of the American Society for Information Science and Technology, 53(9), 716-727.
Stanbridge, R. (1992). Journalists begin to embrace online databases. Information World Review,
76(December), 46-48. Tashakkori, A., & Teddlie, C. (1998). Mixed methodology: combining qualitative and
quantitative approaches. Thousand Oaks: Sage Publications Inc. Tate, M., & Alexander, J. (1996). Teaching critical evaluation skills for world wide web
resources. Computers in Libraries, 16(10), 49-55. Thomas, B. (1997). The Internet for scientists and engineers (3rd ed.). New York: Institute of
Electrical & Electronics Engineers. Tillman, H. (2003, 03/2003). Evaluating quality on the net. Retrieved 02/15, 2006, from
http://www.hopetillman.com/findqual.html Van Pulis, N., & Ludy, L. (1988). Subject Searching in an Online Catalog with Authority
Control. College & Research Libraries, 49, 523-533. Venkatesh, V., Morris, M., Davis, G., & Davis, F. (2003). User acceptance of information
technology: toward a unified view .MIS Quarterly, 27 )3( ,425-478.
294
Vreekamp, H. (1995). The information seeking attitudes of non-metropolitan journalists: A qualitative study of two communities and their primary and secondary sources. The Electronic Library, 13(1), 43-51.
Ward, J., & Hansen, K. A. (1991). Journalist and librarian roles, information technology and
newsmaking. Journalism Quarterly, 68(3), 491-498. Ward, J., Hansen, K. A., & McLeod, D. M. (1988). Effects of the electronic library on news
reporting protocols. Journalism Quarterly, 65, 845-852. Watkins, K. (2005). Human Development Report. New York: United Nations Development
Program. Wheeler, D. (1998). Global culture or culture clash- new information technologies in the Islamic
world- a view from Kuwait. Communication Research, 25(4), 359-376. Wheeler, D. (2000). New media, globalization and Kuwaiti national identity. The Middle East
Journal, 54(3), 432-442. Wheeler, D. (2001). New technologies, old culture: a look at women, gender, and the Internet in
Kuwait. In C. Ess & F. Sudweeks (Eds.), Culture, technology, communication: towards an intercultural global village. Albany: State University of New York.
Wickham, K. (1999). Newsroom technology: form, style, and content. Unpublished Dissertation,
The University of Memphis, Memphis. Williams, P., & Nicholas, D. (1997). Journalists, news librarians and the internet. New Library
World, 98(1137), 217-223. Yin, R. (2003). Case study research: design and methods (3rd ed.). Thousand Oaks: Sage
Publications Inc.
295
Related Documents