Working Paper Research Interna tionali zation strategy and performance of small and medium sized enterprises by Jonas Onkelinx and Leo Sleuwaegen October 2010 No 197

Welcome message from author
This document is posted to help you gain knowledge. Please leave a comment to let me know what you think about it! Share it to your friends and learn new things together.
Transcript
8/10/2019 Internationalization Strategy and Performance of SME
http://slidepdf.com/reader/full/internationalization-strategy-and-performance-of-sme 1/47
Working Paper Research
Internationalization strategy and performanceof small and medium sized enterprises
by Jonas Onkelinx and Leo Sleuwaegen
October 2010 No 197
8/10/2019 Internationalization Strategy and Performance of SME
http://slidepdf.com/reader/full/internationalization-strategy-and-performance-of-sme 2/47
NBB WORKING PAPER No. 197 - OCTOBER 2010
Editorial Director
Jan Smets, Member of the Board of Directors of the National Bank of Belgium
Editoral
On October 14-15, 2010 the National Bank of Belgium hosted a Conference on
"International trade: threats and opportunities in a globalised world".
Papers presented at this conference are made available to a broader audience in the
NBB Working Paper Series (www.nbb.be).
Statement of purpose:
The purpose of these working papers is to promote the circulation of research results (Research Series) and analyticalstudies (Documents Series) made within the National Bank of Belgium or presented by external economists in seminars,conferences and conventions organised by the Bank. The aim is therefore to provide a platform for discussion. The opinionsexpressed are strictly those of the authors and do not necessarily reflect the views of the National Bank of Belgium.
Orders
For orders and information on subscriptions and reductions: National Bank of Belgium,Documentation - Publications service, boulevard de Berlaimont 14, 1000 Brussels.
Tel +32 2 221 20 33 - Fax +32 2 21 30 42
The Working Papers are available on the website of the Bank: http://www.nbb.be.
© National Bank of Belgium, Brussels
All rights reserved.Reproduction for educational and non-commercial purposes is permitted provided that the source is acknowledged.
ISSN: 1375-680X (print)
ISSN: 1784-2476 (online)
8/10/2019 Internationalization Strategy and Performance of SME
http://slidepdf.com/reader/full/internationalization-strategy-and-performance-of-sme 3/47
1
Internationalization strategy and performance
of small and medium sized enterprises
Leo Sleuwaegen
Vlerick Leuven Gent Management School and
K.U.Leuven
Jonas Onkelinx
Vlerick Leuven Gent Management School
Abstract
Focusing on the timing and geographical scope of import and export activities of Belgian small and
medium sized enterprises (SMEs), the paper analyzes the importance, structural features and
performance implications of firms that recently started to export following the geographical
configuration of their international trade operations and their year of establishment. The analysis
allows us to separate firms that started to export in the period 1998-2005 into four distinct groups:
born internationals, i.e. firms which were established less than five years before their first year of
exporting and exporting to less than five countries in the same region (regional focus), born globals;
young firms but with a more internationally diversified export portfolio, born again globals, i.e. firms
similar to born globals but established longer than five years before their first exports and traditional
internationalizers, firms established more than five years before their first export operations
characterized by a narrow geographical scope of their exports.
We find SME export growth to be driven by a small group of born global firms, accounting for 60 per
cent of the total increase in SME exports between 1998 and 2005. Analyzing the structural feature of
the different types of firms, we find born globals to be more productive and characterized by a higher
R&D spending and intangible asset intensity compared to other types of traders.
We next test if the typology matters for the observed export performance differences across firms
over time. We find that born globals grow faster in terms of export sales, have a stronger
commitment to export markets and are more likely to continue exporting. Born globals also have the
highest failure rate, traditional internationalizers the lowest. These findings suggest strong
risk/return tradeoffs among the strategies chosen by the different types of firms.
Performing a dynamic analysis of changes in trade configurations of firms over the observation
period, we investigate how these changes have an impact on performance. Specific attention is paid
to firms that stop importing/exporting. Especially firms that move from being exporters to become
two-way traders, i.e. also starting to import goods from other countries show the most marked
increases in turnover and productivity.
The final part of the study analyzes the relationship between export and import activities to
particular countries following the sequence in which they occur. We find that the probability to start
importing from a country is 4 times higher for firms already exporting to that country than for
trading SMEs without prior export experience in that country.
The authors gratefully acknowledge the comments made by the NBB staff and the other conference
presenters. They are particularly grateful to Philippe De Coninck for all the help in processing the
data.
8/10/2019 Internationalization Strategy and Performance of SME
http://slidepdf.com/reader/full/internationalization-strategy-and-performance-of-sme 4/47
2
1. Introduction
There is a striking consistency in the findings about the internationalization of firms across countries:
firms involved in international activities are fewer in number, but bigger and more productive than
other firms. Only a small number of firms account for the bulk of aggregate exports and foreign
direct investment in the investigated countries. For Belgium, it was estimated that the top tenpercent of all exporters account for 84% of all exports of products in 2003 (Mayer and Ottaviano,
2007; Muûls and Pisu, 2007). The reason for this strong concentration is ascribed to international
competition which triggers a selection process where more productive firms replace less productive
firms, and which enables successful firms to grow strongly across borders.
Despite this strong concentration, Mayer and Ottaviano (2007) show that the number of exporting
firms, the so-called extensive margin, is more important than the increase in the exports sales per
firm, the so-called intensive margin for explaining increases in the aggregate value of exports for a
set of countries. Moreover, given the superior performance of firms participating in international
markets, a larger number of those firms would also raise productivity, GDP and wages of the
countries more than proportionally. Hence, their plea for policies geared towards increasing thenumber of exporting firms, instead of promoting established exporters.
Following this perspective, we focus on the internationalization of small and medium sized
enterprises (SMEs) and investigate their contribution to export growth, job creation and value added
creation. Recent developments show an increasingly active role played by SMEs in international
markets (e.g. OECD, 2000, 2007). Because of declining government barriers and advances in
technology, this trend is expected to gain further momentum (Lu and Beamish, 2001).
However, in spite of the positive evolution, the internationalization of SMEs is often limited, both in
geographical scope and in terms of the share of international versus domestic activities (Westhead
et al., 2004).
Export and import are also more common among older and larger SMEs. Despite the increasing
prevalence of international new ventures, i.e. recently established firms that start exporting soon
after inception, most SMEs venturing abroad often still do so using a cautious, stepwise approach
after several years of domestic growth. While high tech firms may choose rapid internationalization
and follow the international new venture approach (Oviatt and McDougall, 1994), the stage theory
(Johanson and Vahlne, 1977) may still be the most appropriate one for firms in mature industries.
The timing and risks involved in these approaches are different, and firms need to evaluate whether
they want to reduce the risk and follow a conservative pattern, or need to rapidly capture market
share before their technology becomes obsolete.
The question also arises whether or not international trade participation matters for the
performance of SMEs. Several studies have indicated that internationalization is often accompanied
by improved firm performance, growth and competitiveness (e.g. De Loecker, 2007). The impact of
export on sales growth is straightforward. In addition, the subsequent larger sales volumes enable
firms to achieve economies of scale and increase labor productivity and management efficiency. The
associated cost savings should have a direct impact on firm profitability. A growing body of empirical
research has also demonstrated the superior characteristics of exporting firms relative to domestic
ones. Exporters are larger, more productive, more capital intensive, more technology intensive, and
pay higher wages (e.g. Bernard and Jensen, 1999). The central issue is the direction of the causality
between export and firm performance. There is convincing evidence that strong, efficient firms
become exporters: exporters are larger, more productive and have higher employment growth
before their first exporting activities. Bernard and Jensen (1999) suggest , however, that while export
8/10/2019 Internationalization Strategy and Performance of SME
http://slidepdf.com/reader/full/internationalization-strategy-and-performance-of-sme 5/47
3
does not lead to faster productivity growth at the firm level, employment growth is higher and
exporting firms are more likely to survive than non-exporters with similar characteristics (see for
Belgium, Coucke and Sleuwaegen, 2008).
Based on a review of 45 studies on the impact of export on productivity, Wagner (2005) concludes
there is convincing evidence that the more productive firms self-select into export markets, whileexporting does not necessarily improve productivity. Nevertheless, some researchers (e.g. De
Loecker, 2007) find that export entrants become more productive, and that the productivity gap
between exporters and domestic firms further increases over time. Studying the same question in a
different direction, Girma, Greenaway and Kneller (2002) find firms exiting from exporting to suffer a
mild decrease in total factor productivity, but sizeable losses in output and employment.
Unfortunately, since research on the effects of export on firm performance has lacked a focus on
small firms, it remains unclear to what extent SMEs are subject to the same effects. Moreover, as we
show in the next section, such effects may differ following the different internationalization
strategies adopted by SMEs.
2. SME internationalization strategies
SMEs need to carefully consider the entry mode, timing, scope and pace at which they deploy their
international activities. Several behavioral process models have been developed in this regard. The
best known model is the so-called “Uppsala model” which sees firms growing internationally in a
staged approach first entering and committing resources in psychically close markets before moving
on very gradually to more distant markets (Johanson and Vahlne, 1977). This approach has been
challenged by models of new ventures that from the outset are driven to be present in many foreign
markets at the same time, not only because of the wide scope of the relevant market on which they
need to compete, but also to develop and leverage critical resources in those centers of the world
where the best supporting conditions are available. Especially for R&D intensive activities this seems
to be most relevant (Oviatt and McDougall, 1994). More recently, with the spreading of supplychains and the organization of supporting networks across countries, an increasing number of firms
have to follow their lead customers and accordingly have to adapt their scope and timing of
internationalization to not become left behind. This might explain the rapid and wide scope
internationalization of smaller firms in more traditional industries (Onkelinx and Sleuwaegen, 2008).
In view of these different developments, there has been a need to develop more general models
relating the environmental and market specificities to firms’ choice of internationalization strategies
(e.g. Zahra and George, 2002). While from a conceptual approach this may look obvious, the building
of formal theoretical models leading to a clear cause and effects logic has been less developed.
Perhaps, one of the most useful exceptions to this observation, and one that is highly useful for this
study, is the innovation diffusion model based on a dynamic competitive game theory framework
introduced by Kalish, Mahajan and Muller (1995). Using this framework, they investigate how firms
will introduce new products in foreign countries.
On the one hand, firms can choose for a so called sprinkler strategy, targeting multiple countries at
once. Another option is a waterfall strategy, slowly cascading from one country to the next. Taking
account of the high (sunk) cost of committing resources, few firms can internationalize
simultaneously in all regions. Especially for starting SMEs, a global approach is often not an option.
SMEs are more likely to gradually move from a successful domestic launch towards entering more
advanced countries and in a later stage to less developed economies. Using a sprinkler strategy,
firms can maximize revenues by exploiting economies of scale in R&D and manufacturing. Moreover,
a sprinkler strategy may pre-empt competitive moves in some countries, thus maximizing sales and
market share. Entering markets before competitors do may result in substantial first mover
8/10/2019 Internationalization Strategy and Performance of SME
http://slidepdf.com/reader/full/internationalization-strategy-and-performance-of-sme 6/47
4
advantages. From the interpretation of the comparative statics and dynamics of the model, Kalish et
al. (1995) found the following market conditions to favor waterfall strategies:
-Very long life cycle of the product
-Small foreign markets
-Slow growth in the foreign markets
-Low innovativeness in the foreign market-High fixed cost of entry into the foreign market
-Weak or no competitors in the foreign markets
-Co-operative behavior among competitors
From an empirical point of view, Mascarenhas (1997) found that being the first to enter the market
did indeed result in higher long-term international market share and survival. However, launching a
new product requires substantial investment in manufacturing, inventory, advertising, distribution,
human resources. Using a waterfall strategy, firms can limit these investments, as the new product is
introduced in a limited number of countries. If the product is unsuccessful in these countries, the
firm can refrain from making investments in other countries. Being successful, income from the first
market can be used to invest in a subsequent market. Consequently, a waterfall strategy can lowerthe pressure on cash flow. A waterfall strategy is thus less risky than a sprinkler strategy.
Moreover, possible benefits of delayed internationalization are improved learning by doing resulting
in higher productivity and a stronger competitive position. There is substantial evidence that only
the more productive firms export and survive in export markets, i.e. those firms that have reached a
certain productivity level necessary to compete in international markets (e.g. Bernard, Jensen and
Schott, 2006a).
From the considerations above it follows that choosing a sprinkler or a waterfall strategy involves a
strong tradeoff between sales maximization and risk minimization. Although a sprinkler strategy may
be more appropriate in many cases, managers might favor a waterfall strategy as a way to limit therisk of failure. This trade-off between revenues and risk in choosing between a sprinkler versus
waterfall strategy is central to the development of several of the hypotheses that will be tested in
this paper.
The remainder of the paper is organized as follows. Classifying firms according to the observed
differences in international scope configurations and timing of internationalization, the relative
contributions of each group to overall Belgian export growth is analyzed. Next, the relationship
between geographic scope at the start of the internationalization of SMEs is analyzed in relation to
structural features of these firms. Moving from a static to a dynamic analysis, the study continues by
relating changes in trade configurations over time to changes in performance. Specific attention is
paid to firms that stop exporting. The final part of the study analyzes if there are learning spillovers
between export and import activities in developing trade with foreign countries.
8/10/2019 Internationalization Strategy and Performance of SME
http://slidepdf.com/reader/full/internationalization-strategy-and-performance-of-sme 7/47
5
3. Newly internationalizing SMEs in Belgium over the period 1998-2005
3.1 The significance of international SMEs for the Belgian economy
In collaboration with the National Bank of Belgium (NBB), we have constructed a comprehensive
dataset linking firm level trade data to annual account data of firms collected by the Central BalanceSheet Office of the Bank. All non-financial firms in Belgium with at least 10 FTE employees (at least
one year between 1998 and 2005) were included in the dataset. SMEs were selected using the
employment criterion of the Eurostat definition: firms with fewer than 250 FTE employees. We
distinguish between small firms (<50 FTE), medium sized firms (50-249 FTE) and large firms (>= 250
FTE). The final dataset contains 35,240 SMEs and 1,009 large firms, across all industries. The period
covered is 1998-2005, as the thresholds for the Intrastat inquiry remained the same in this period.
Firm-level data on trade of goods are available per product (4-digit CN4) and country. The dataset
contains trade data for 1,279 products and 249 countries. Export dummies for the 1993-1997 period
were added indicating if firms had export activities before 1998.
This unique dataset is extremely well suited to reduce certain gaps in extant research on theinternationalization of SMEs. Arguably the most striking ones are the lack of empirical studies on the
evolution of internationalized SMEs over time (Zahra, 2005) and the limited number of studies
comprising multiple industries. As Coviello and Jones (2004) pointed out: “International
entrepreneurship research is characterized by static cross-sectional studies and a lack of service
sector and/or comparative research within and across sectors.” Not only will longitudinal data be
used in the proposed research design, it will also provide a complete picture of SME
internationalization across all sectors, including low tech manufacturing industries and services
industries. The lack of attention being paid to services is all the more surprising, given that evidence
shows that exports by services SMEs are increasing and only 28% of SME exporters in the U.S. are
manufacturers (U.S. Department of Commerce, 2005).
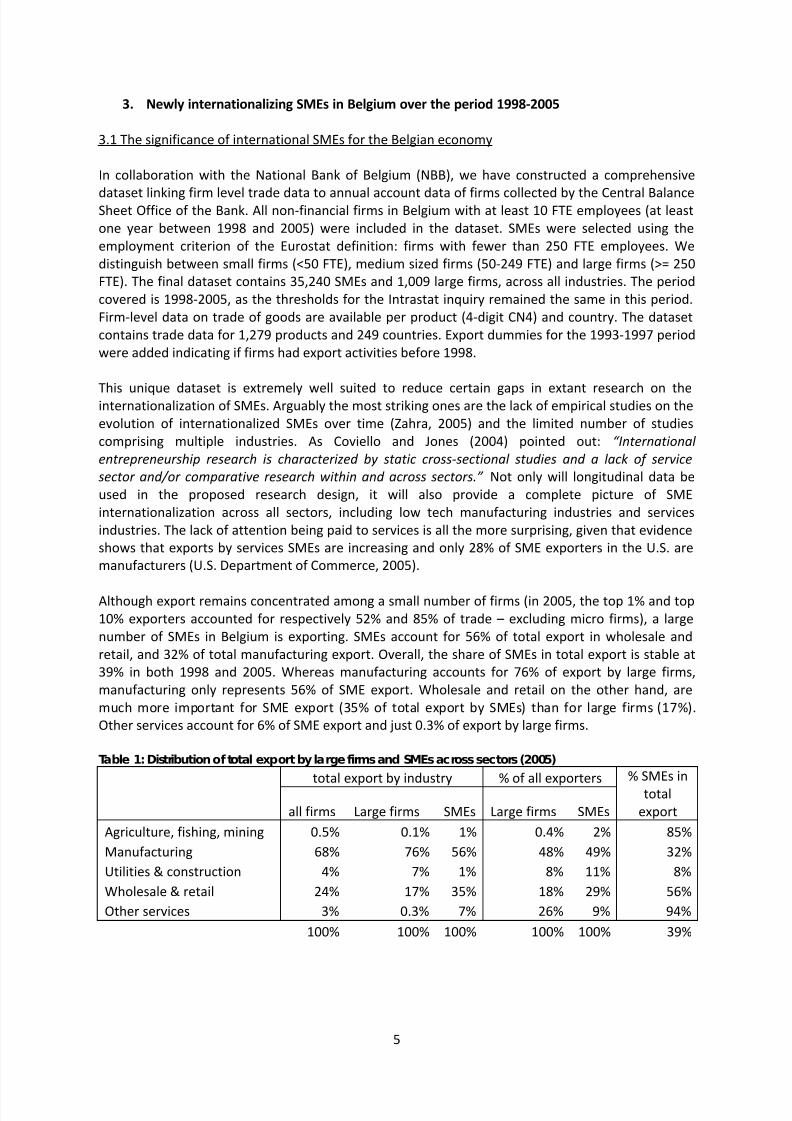
Although export remains concentrated among a small number of firms (in 2005, the top 1% and top
10% exporters accounted for respectively 52% and 85% of trade – excluding micro firms), a large
number of SMEs in Belgium is exporting. SMEs account for 56% of total export in wholesale and
retail, and 32% of total manufacturing export. Overall, the share of SMEs in total export is stable at
39% in both 1998 and 2005. Whereas manufacturing accounts for 76% of export by large firms,
manufacturing only represents 56% of SME export. Wholesale and retail on the other hand, are
much more important for SME export (35% of total export by SMEs) than for large firms (17%).
Other services account for 6% of SME export and just 0.3% of export by large firms.
Table 1: Distribution of total export by large firms and SMEs across sectors (2005)
total export by industry % of all exporters % SMEs in
total
exportall firms Large firms SMEs Large firms SMEs
Agriculture, fishing, mining 0.5% 0.1% 1% 0.4% 2% 85%
Manufacturing 68% 76% 56% 48% 49% 32%
Utilities & construction 4% 7% 1% 8% 11% 8%
Wholesale & retail 24% 17% 35% 18% 29% 56%
Other services 3% 0.3% 7% 26% 9% 94%
100% 100% 100% 100% 100% 39%
8/10/2019 Internationalization Strategy and Performance of SME
http://slidepdf.com/reader/full/internationalization-strategy-and-performance-of-sme 8/47
6
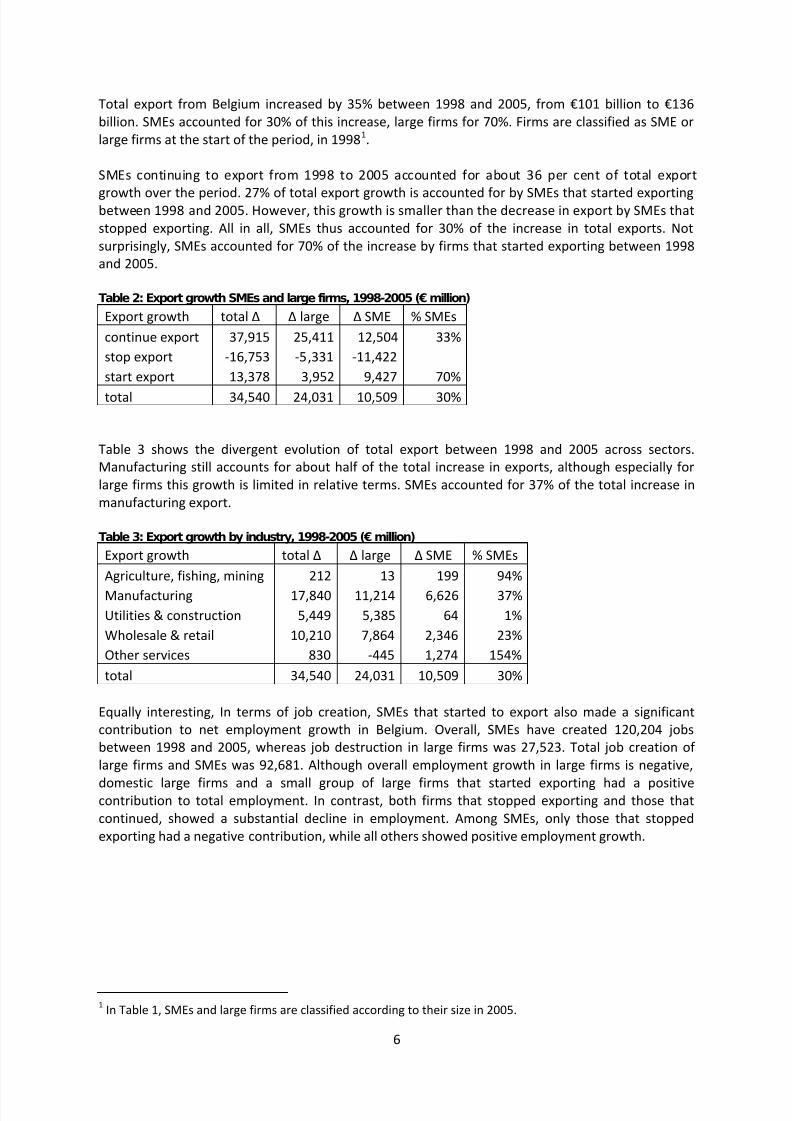
Total export from Belgium increased by 35% between 1998 and 2005, from €101 billion to €136
billion. SMEs accounted for 30% of this increase, large firms for 70%. Firms are classified as SME or
large firms at the start of the period, in 19981.
SMEs continuing to export from 1998 to 2005 accounted for about 36 per cent of total export
growth over the period. 27% of total export growth is accounted for by SMEs that started exportingbetween 1998 and 2005. However, this growth is smaller than the decrease in export by SMEs that
stopped exporting. All in all, SMEs thus accounted for 30% of the increase in total exports. Not
surprisingly, SMEs accounted for 70% of the increase by firms that started exporting between 1998
and 2005.
Table 2: Export growth SMEs and large firms, 1998-2005 (€ million)
Export growth total large SME % SMEs
continue export 37,915 25,411 12,504 33%
stop export -16,753 -5,331 -11,422
start export 13,378 3,952 9,427 70%
total 34,540 24,031 10,509 30%
Table 3 shows the divergent evolution of total export between 1998 and 2005 across sectors.
Manufacturing still accounts for about half of the total increase in exports, although especially for
large firms this growth is limited in relative terms. SMEs accounted for 37% of the total increase in
manufacturing export.
Table 3: Export growth by industry, 1998-2005 (€ million)
Export growth total large SME % SMEs
Agriculture, fishing, mining 212 13 199 94%
Manufacturing 17,840 11,214 6,626 37%
Utilities & construction 5,449 5,385 64 1%
Wholesale & retail 10,210 7,864 2,346 23%
Other services 830 -445 1,274 154%
total 34,540 24,031 10,509 30%
Equally interesting, In terms of job creation, SMEs that started to export also made a significant
contribution to net employment growth in Belgium. Overall, SMEs have created 120,204 jobs
between 1998 and 2005, whereas job destruction in large firms was 27,523. Total job creation of
large firms and SMEs was 92,681. Although overall employment growth in large firms is negative,
domestic large firms and a small group of large firms that started exporting had a positivecontribution to total employment. In contrast, both firms that stopped exporting and those that
continued, showed a substantial decline in employment. Among SMEs, only those that stopped
exporting had a negative contribution, while all others showed positive employment growth.
1 In Table 1, SMEs and large firms are classified according to their size in 2005.
8/10/2019 Internationalization Strategy and Performance of SME
http://slidepdf.com/reader/full/internationalization-strategy-and-performance-of-sme 9/47
7
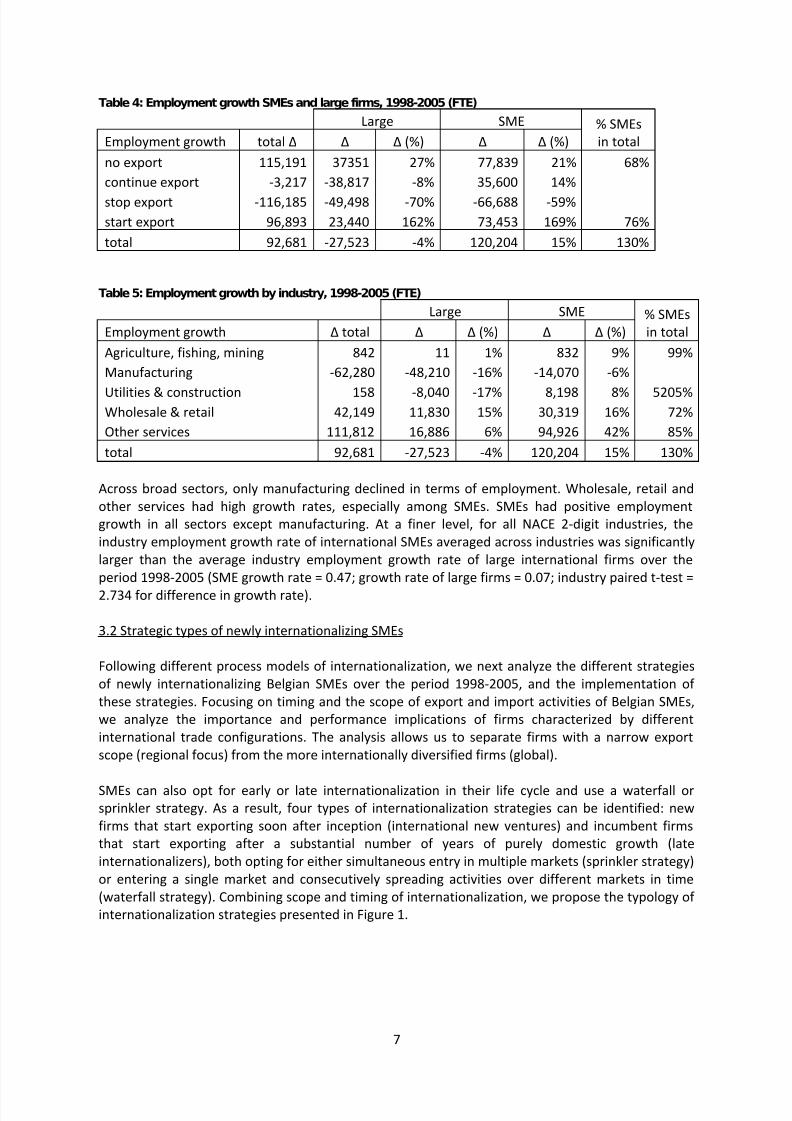
Table 4: Employment growth SMEs and large firms, 1998-2005 (FTE)
Large SME % SMEs
in totalEmployment growth total (%) (%)
no export 115,191 37351 27% 77,839 21% 68%
continue export -3,217 -38,817 -8% 35,600 14%
stop export -116,185 -49,498 -70% -66,688 -59%
start export 96,893 23,440 162% 73,453 169% 76%
total 92,681 -27,523 -4% 120,204 15% 130%
Table 5: Employment growth by industry, 1998-2005 (FTE)
Large SME % SMEs
in totalEmployment growth total (%) (%)
Agriculture, fishing, mining 842 11 1% 832 9% 99%
Manufacturing -62,280 -48,210 -16% -14,070 -6%
Utilities & construction 158 -8,040 -17% 8,198 8% 5205%Wholesale & retail 42,149 11,830 15% 30,319 16% 72%
Other services 111,812 16,886 6% 94,926 42% 85%
total 92,681 -27,523 -4% 120,204 15% 130%
Across broad sectors, only manufacturing declined in terms of employment. Wholesale, retail and
other services had high growth rates, especially among SMEs. SMEs had positive employment
growth in all sectors except manufacturing. At a finer level, for all NACE 2-digit industries, the
industry employment growth rate of international SMEs averaged across industries was significantly
larger than the average industry employment growth rate of large international firms over the
period 1998-2005 (SME growth rate = 0.47; growth rate of large firms = 0.07; industry paired t-test =
2.734 for difference in growth rate).
3.2 Strategic types of newly internationalizing SMEs
Following different process models of internationalization, we next analyze the different strategies
of newly internationalizing Belgian SMEs over the period 1998-2005, and the implementation of
these strategies. Focusing on timing and the scope of export and import activities of Belgian SMEs,
we analyze the importance and performance implications of firms characterized by different
international trade configurations. The analysis allows us to separate firms with a narrow export
scope (regional focus) from the more internationally diversified firms (global).
SMEs can also opt for early or late internationalization in their life cycle and use a waterfall or
sprinkler strategy. As a result, four types of internationalization strategies can be identified: new
firms that start exporting soon after inception (international new ventures) and incumbent firms
that start exporting after a substantial number of years of purely domestic growth (late
internationalizers), both opting for either simultaneous entry in multiple markets (sprinkler strategy)
or entering a single market and consecutively spreading activities over different markets in time
(waterfall strategy). Combining scope and timing of internationalization, we propose the typology of
internationalization strategies presented in Figure 1.
8/10/2019 Internationalization Strategy and Performance of SME
http://slidepdf.com/reader/full/internationalization-strategy-and-performance-of-sme 10/47
8
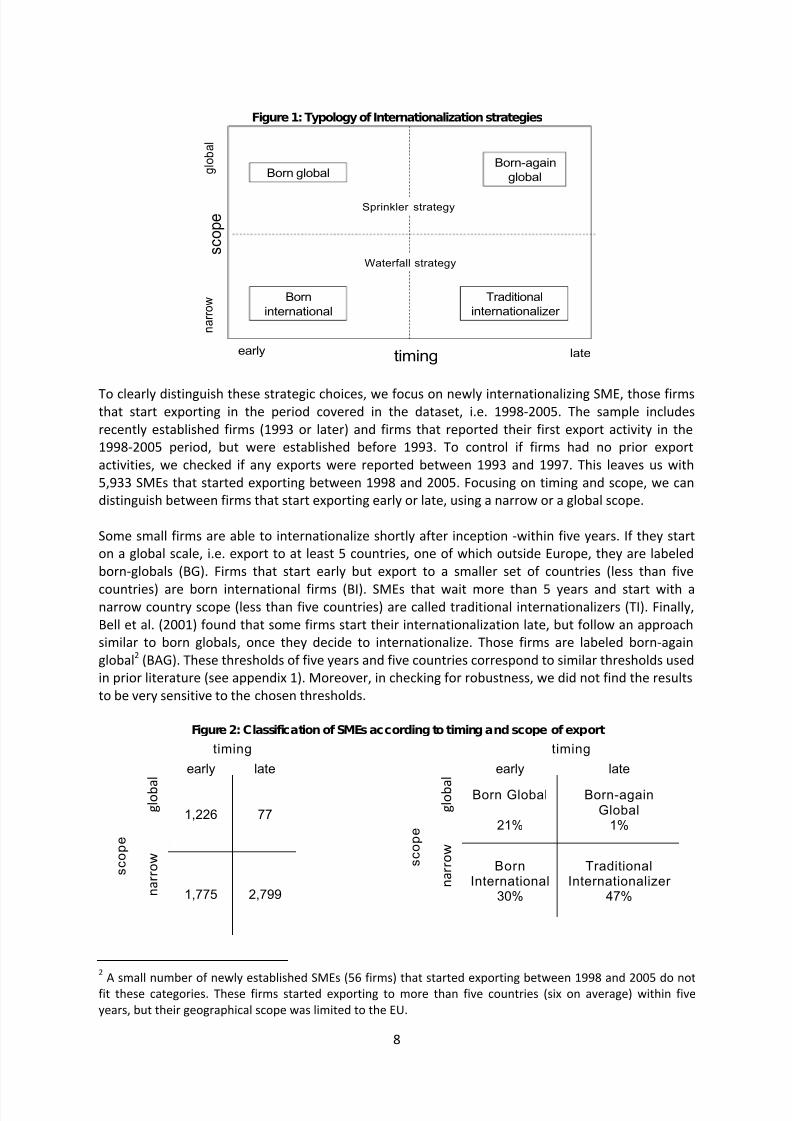
Figure 1: Typology of Internationalization strategies
To clearly distinguish these strategic choices, we focus on newly internationalizing SME, those firmsthat start exporting in the period covered in the dataset, i.e. 1998-2005. The sample includes
recently established firms (1993 or later) and firms that reported their first export activity in the
1998-2005 period, but were established before 1993. To control if firms had no prior export
activities, we checked if any exports were reported between 1993 and 1997. This leaves us with
5,933 SMEs that started exporting between 1998 and 2005. Focusing on timing and scope, we can
distinguish between firms that start exporting early or late, using a narrow or a global scope.
Some small firms are able to internationalize shortly after inception -within five years. If they start
on a global scale, i.e. export to at least 5 countries, one of which outside Europe, they are labeled
born-globals (BG). Firms that start early but export to a smaller set of countries (less than five
countries) are born international firms (BI). SMEs that wait more than 5 years and start with anarrow country scope (less than five countries) are called traditional internationalizers (TI). Finally,
Bell et al. (2001) found that some firms start their internationalization late, but follow an approach
similar to born globals, once they decide to internationalize. Those firms are labeled born-again
global2 (BAG). These thresholds of five years and five countries correspond to similar thresholds used
in prior literature (see appendix 1). Moreover, in checking for robustness, we did not find the results
to be very sensitive to the chosen thresholds.
Figure 2: Classification of SMEs according to timing and scope of export
timing
early late
s c o p e
g l o b a
l
1,226 77
n a r r o w
1,775 2,799
timing
early late
s c o p e
g l o b a
l
Born Global
21%
Born-againGlobal
1%
n a r r o w
BornInternational
30%
TraditionalInternationalizer
47%
2
A small number of newly established SMEs (56 firms) that started exporting between 1998 and 2005 do notfit these categories. These firms started exporting to more than five countries (six on average) within five
years, but their geographical scope was limited to the EU.
timing
s c o p e
early late
g l o b a l
n a r r o w
Sprinkler strategy
Waterfall strategy
Born globalBorn-again
global
Traditional
internationalizer
Born
international
8/10/2019 Internationalization Strategy and Performance of SME
http://slidepdf.com/reader/full/internationalization-strategy-and-performance-of-sme 11/47
9
The four types of internationalizing SMEs (5,877 firms) that started exporting between 1998 and
2005 accounted for 25% of total export growth and created 68,634 new jobs. Born globals were the
main drivers of SME export growth, accounting for 60 per cent of the total increase in SME exports
between 1998 and 2005. SMEs that started internationalizing between 1998 and 2005 were alsoimportant drivers of job creation. Early internationalizers had the largest contribution to
employment growth: born globals created 21,440 jobs (+76% relative to base year employment) and
born internationals 25,560 jobs (+121%). Traditional internationalizers created 19,481 jobs (+33%)
and a small group of born-again globals created 2153 jobs (+151%) between 1998 and 2005.
3.3 Globalized industries
Whereas born globals are almost equally distributed between manufacturing and services, the other
types of internationalizing SMEs are relatively more present in services. In a recent study on the
industry determinants of born globals, following an in depth review of the literature on this topic, it
was deducted that born globals would occur more frequently in high technology industries andglobalized industries
3 (Fernhaber, McDougall and Oviatt, 2007). Our dataset provides a direct
possibility to test this proposition. Classifying industries according to the R&D intensity4 and the
openness to international trade, we constructed contingency tables (Table 6 and
3 To analyze which of these strategy types are more common in globalized industries, we constructed an
industry globalization dummy. This dummy is based on the share of total industry trade (import and export) in
total industry sales, and the share of industry extra-EU trade in total industry trade. Industries with a share of
trade greater than 45% and a share of extra-EU trade greater than 17% were classified as globalized, all other
industries were local. We thus found 16 globalized industries in 2005 (nacebel 2 digit), or 29% of all industries.4
Manufacturing industries were classified into four categories according to the industry’s technology intensity,following the OECD classification. Based on three digit nacebel codes, industries were thus classified as high
tech (HT), medium-high tech (MH), medium-low tech (ML) and low tech (LT).
8/10/2019 Internationalization Strategy and Performance of SME
http://slidepdf.com/reader/full/internationalization-strategy-and-performance-of-sme 12/47
10
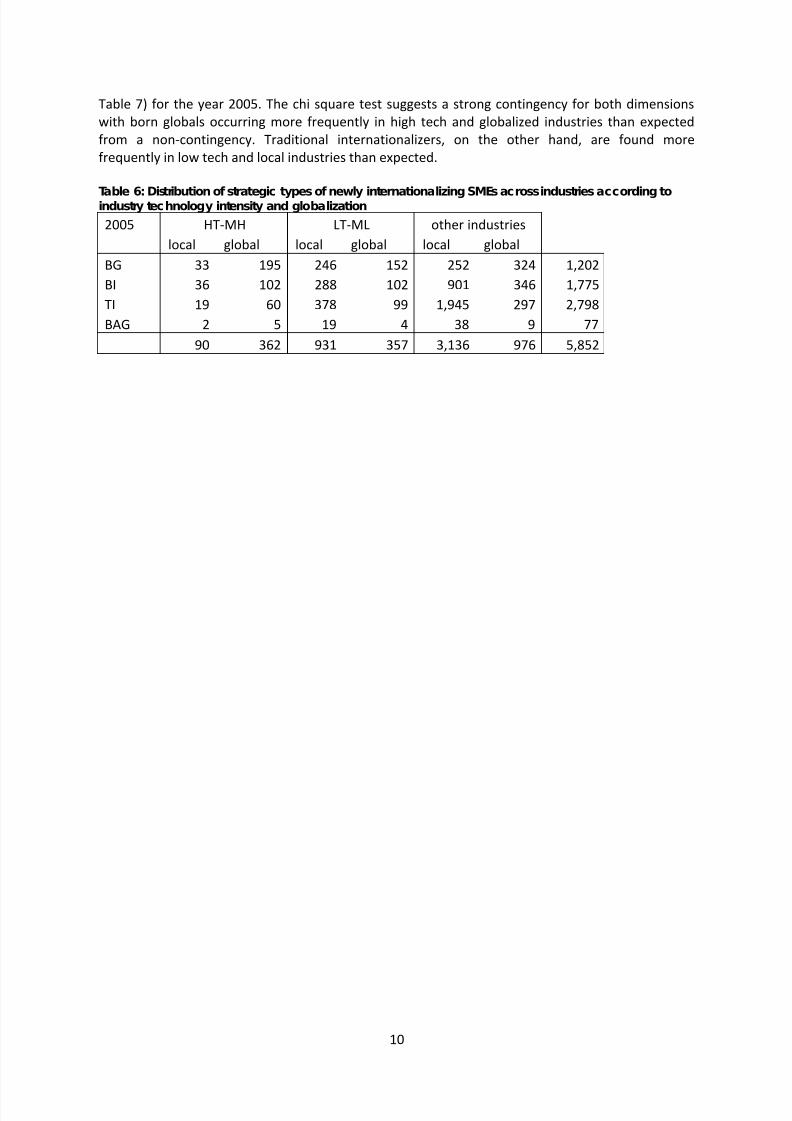
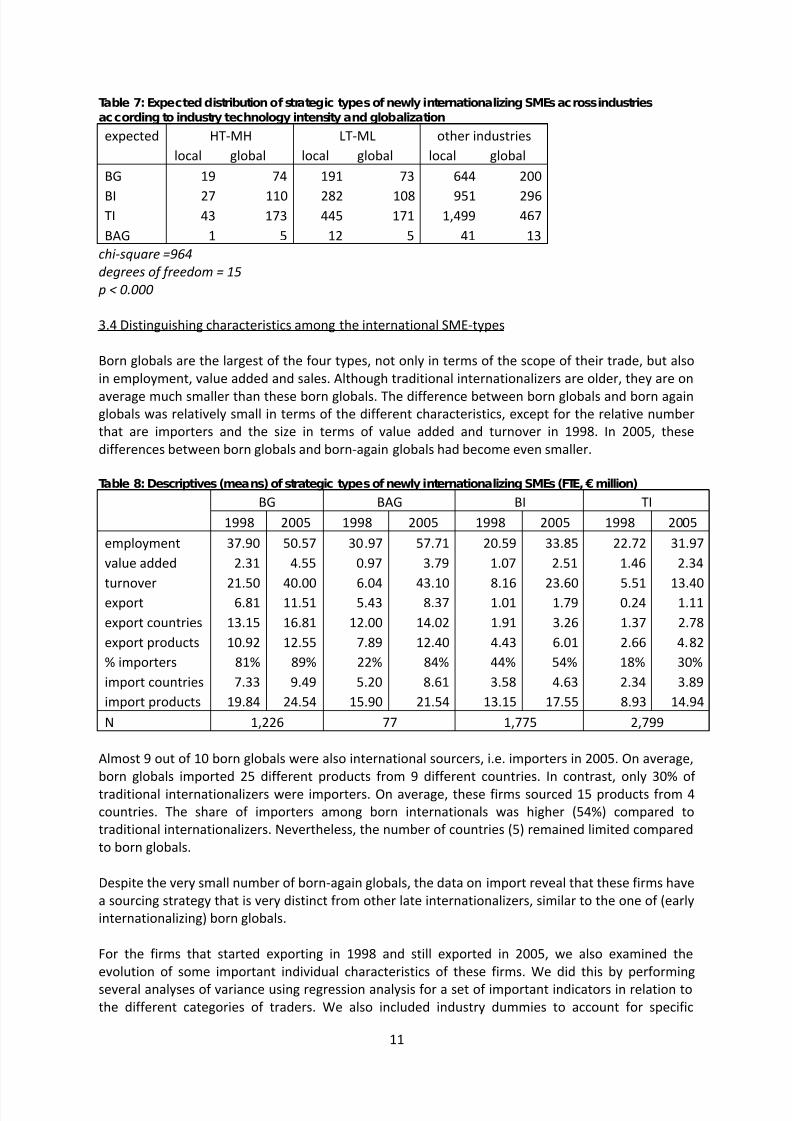
Table 7) for the year 2005. The chi square test suggests a strong contingency for both dimensions
with born globals occurring more frequently in high tech and globalized industries than expected
from a non-contingency. Traditional internationalizers, on the other hand, are found more
frequently in low tech and local industries than expected.
Table 6: Distribution of strategic types of newly internationalizing SMEs across industries according toindustry technology intensity and globalization
2005 HT-MH LT-ML other industries
local global local global local global
BG 33 195 246 152 252 324 1,202
BI 36 102 288 102 901 346 1,775
TI 19 60 378 99 1,945 297 2,798
BAG 2 5 19 4 38 9 77
90 362 931 357 3,136 976 5,852
8/10/2019 Internationalization Strategy and Performance of SME
http://slidepdf.com/reader/full/internationalization-strategy-and-performance-of-sme 13/47
11
Table 7: Expected distribution of strategic types of newly internationalizing SMEs across industries
according to industry technology intensity and globalization
expected HT-MH LT-ML other industries
local global local global local global
BG 19 74 191 73 644 200
BI 27 110 282 108 951 296TI 43 173 445 171 1,499 467
BAG 1 5 12 5 41 13
chi-square =964
degrees of freedom = 15
p < 0.000
3.4 Distinguishing characteristics among the international SME-types
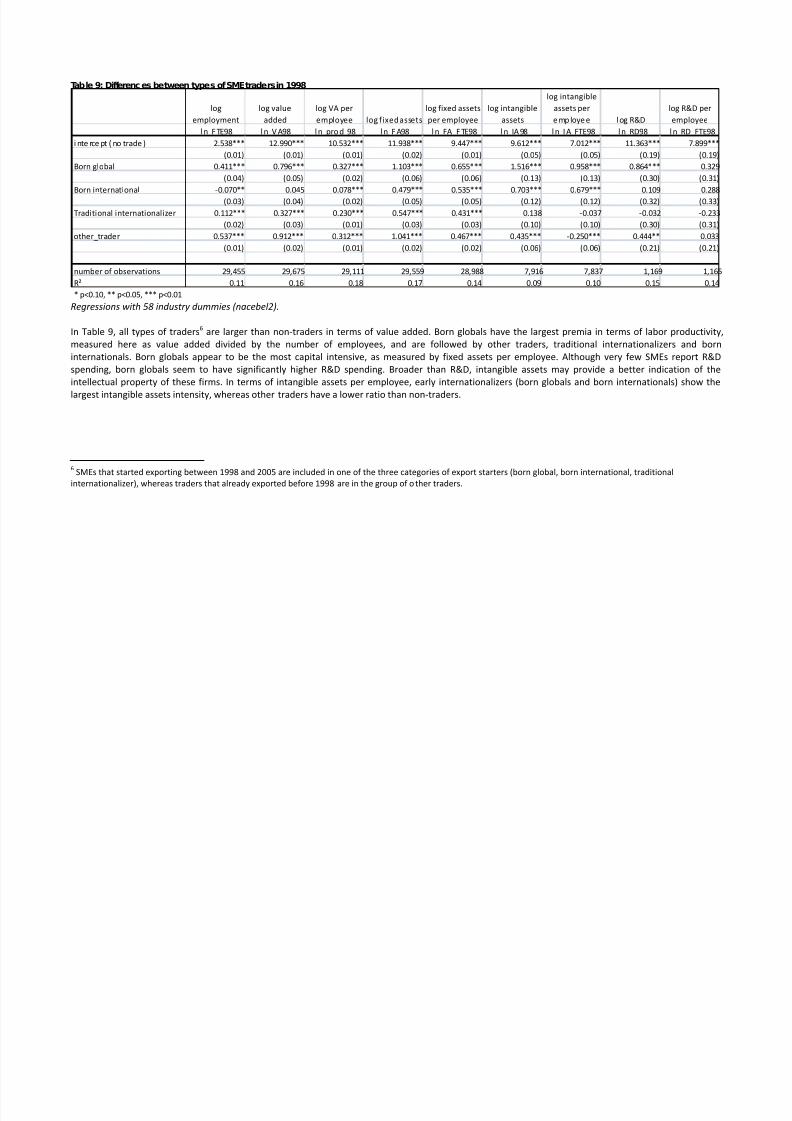
Born globals are the largest of the four types, not only in terms of the scope of their trade, but also
in employment, value added and sales. Although traditional internationalizers are older, they are on
average much smaller than these born globals. The difference between born globals and born againglobals was relatively small in terms of the different characteristics, except for the relative number
that are importers and the size in terms of value added and turnover in 1998. In 2005, these
differences between born globals and born-again globals had become even smaller.
Table 8: Descriptives (means) of strategic types of newly internationalizing SMEs (FTE, € million)
BG BAG BI TI
1998 2005 1998 2005 1998 2005 1998 2005
employment 37.90 50.57 30.97 57.71 20.59 33.85 22.72 31.97
value added 2.31 4.55 0.97 3.79 1.07 2.51 1.46 2.34
turnover 21.50 40.00 6.04 43.10 8.16 23.60 5.51 13.40export 6.81 11.51 5.43 8.37 1.01 1.79 0.24 1.11
export countries 13.15 16.81 12.00 14.02 1.91 3.26 1.37 2.78
export products 10.92 12.55 7.89 12.40 4.43 6.01 2.66 4.82
% importers 81% 89% 22% 84% 44% 54% 18% 30%
import countries 7.33 9.49 5.20 8.61 3.58 4.63 2.34 3.89
import products 19.84 24.54 15.90 21.54 13.15 17.55 8.93 14.94
N 1,226 77 1,775 2,799
Almost 9 out of 10 born globals were also international sourcers, i.e. importers in 2005. On average,
born globals imported 25 different products from 9 different countries. In contrast, only 30% of
traditional internationalizers were importers. On average, these firms sourced 15 products from 4
countries. The share of importers among born internationals was higher (54%) compared to
traditional internationalizers. Nevertheless, the number of countries (5) remained limited compared
to born globals.
Despite the very small number of born-again globals, the data on import reveal that these firms have
a sourcing strategy that is very distinct from other late internationalizers, similar to the one of (early
internationalizing) born globals.
For the firms that started exporting in 1998 and still exported in 2005, we also examined the
evolution of some important individual characteristics of these firms. We did this by performing
several analyses of variance using regression analysis for a set of important indicators in relation to
the different categories of traders. We also included industry dummies to account for specific

8/10/2019 Internationalization Strategy and Performance of SME
http://slidepdf.com/reader/full/internationalization-strategy-and-performance-of-sme 14/47
12
industry effects. The coefficients of the category variables represent differences in averages for the
different categories with respect to the reference group (SMEs that were non-traders both in 1998
and 2005). Given the logarithmic specification the coefficients can be interpreted as percentage
differences with respect to the original average of the variable (if differences are relatively small).
Table 9 and Table 10 distinguish between the types of traders that started exporting between 1998and 2005 (i.e. born globals, born internationals and traditional internationalizers
5) and all other
traders (i.e. those that started exporting before 1998 or firms that only imported) and non-traders.
5 Controlling for industry effects, and given the very limited number of observations for born-again globals, we
had to exclude this group from the analysis in table 9 and table 10.
8/10/2019 Internationalization Strategy and Performance of SME
http://slidepdf.com/reader/full/internationalization-strategy-and-performance-of-sme 15/47
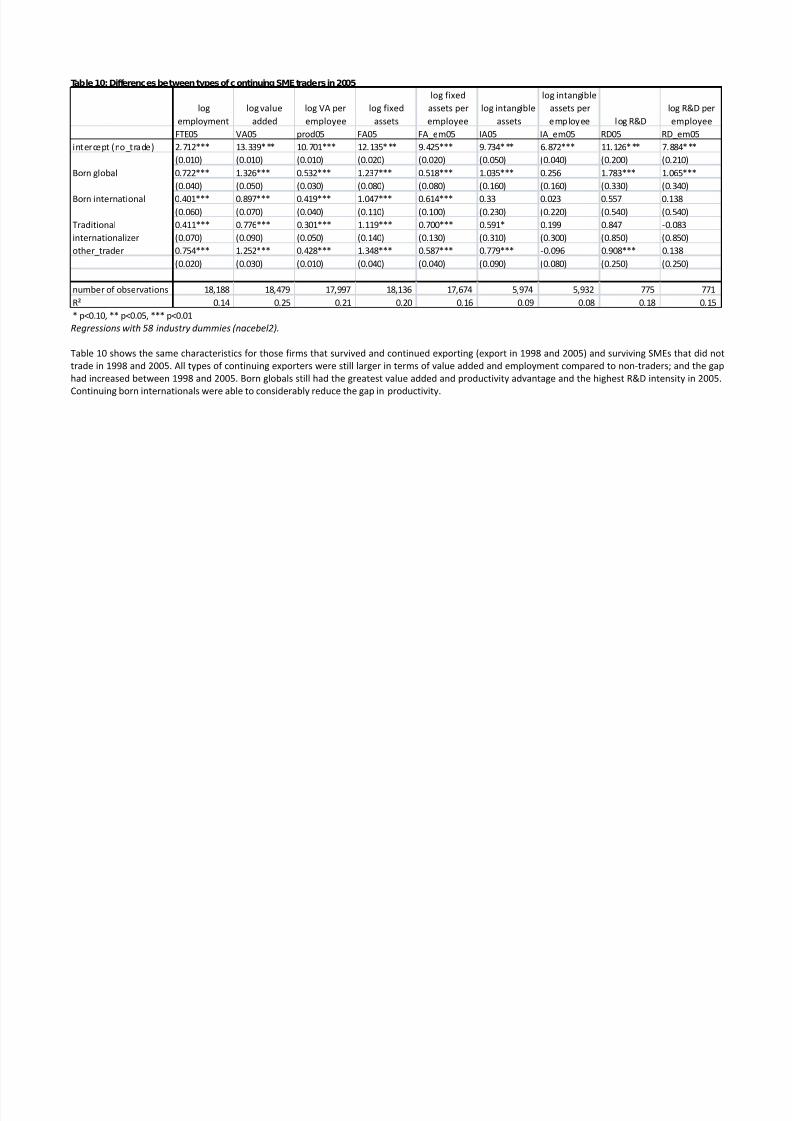
Table 9: Differences between types of SME traders in 1998
Regressions with 58 industry dummies (nacebel2).
In Table 9, all types of traders6 are larger than non-traders in terms of value added. Born globals have the largest premia in terms of labor productivity,
measured here as value added divided by the number of employees, and are followed by other traders, traditional internationalizers and born
internationals. Born globals appear to be the most capital intensive, as measured by fixed assets per employee. Although very few SMEs report R&D
spending, born globals seem to have significantly higher R&D spending. Broader than R&D, intangible assets may provide a better indication of the
intellectual property of these firms. In terms of intangible assets per employee, early internationalizers (born globals and born internationals) show the
largest intangible assets intensity, whereas other traders have a lower ratio than non-traders.
6 SMEs that started exporting between 1998 and 2005 are included in one of the three categories of export starters (born global, born international, traditional
internationalizer), whereas traders that already exported before 1998 are in the group of other traders.
log
employment
log value
added
log VA per
employee log fixed assets
log fixed assets
per employee
log intangible
assets
log intangible
assets per
e mp loye e log R&D
log R&D per
employee
ln_F TE98 ln_V A98 ln_pro d_98 ln_F A98 ln_FA_F TE98 ln_IA 98 ln_I A_FTE98 ln_RD98 ln_RD_FTE98
i nte rce pt ( no trade ) 2.538*** 12.990*** 10.532*** 11.938*** 9.447*** 9.612*** 7.012*** 11.363*** 7.899***
(0.01) (0.01) (0.01) (0.02) (0.01) (0.05) (0.05) (0.19) (0.19)
Born global 0.411*** 0.796*** 0.327*** 1.103*** 0.655*** 1.516*** 0.958*** 0.864*** 0.329
(0.04) (0.05) (0.02) (0.06) (0.06) (0.13) (0.13) (0.30) (0.31)
Born international -0.070** 0.045 0.078*** 0.479*** 0.535*** 0.703*** 0.679*** 0.109 0.288
(0.03) (0.04) (0.02) (0.05) (0.05) (0.12) (0.12) (0.32) (0.33)
Traditional internationalizer 0.112*** 0.327*** 0.230*** 0.547*** 0.431*** 0.138 -0.037 -0.032 -0.233
(0.02) (0.03) (0.01) (0.03) (0.03) (0.10) (0.10) (0.30) (0.31)
other_trader 0.537*** 0.912*** 0.312*** 1.041*** 0.467*** 0.435*** -0.250*** 0.444** 0.033
(0.01) (0.02) (0.01) (0.02) (0.02) (0.06) (0.06) (0.21) (0.21)
number of observations 29,455 29,675 29,111 29,559 28,988 7,916 7,837 1,169 1,165
R² 0.11 0.16 0.18 0.17 0.14 0.09 0.10 0.15 0.14
* p<0.10, ** p<0.05, *** p<0.01
8/10/2019 Internationalization Strategy and Performance of SME
http://slidepdf.com/reader/full/internationalization-strategy-and-performance-of-sme 16/47
Table 10: Differences between types of continuing SME traders in 2005
log
employment
log value
added
log VA per
employee
log fixed
assets
log fixed
assets per
employee
log intangible
assets
log intangible
assets per
employee log R&D
log R&D per
employee
FTE05 VA05 prod05 FA05 FA_em05 IA05 IA_em05 RD05 RD_em05
intercept (no_trade) 2.712*** 13.339*** 10.701*** 12.135*** 9.425*** 9.734*** 6.872*** 11.126*** 7.884***
(0.010) (0.010) (0.010) (0.020) (0.020) (0.050) (0.040) (0.200) (0.210)
Born global 0.722*** 1.326*** 0.532*** 1.237*** 0.518*** 1.035*** 0.256 1.783*** 1.065***
(0.040) (0.050) (0.030) (0.080) (0.080) (0.160) (0.160) (0.330) (0.340)
Born international 0.401*** 0.897*** 0.419*** 1.047*** 0.614*** 0.33 0.023 0.557 0.138
(0.060) (0.070) (0.040) (0.110) (0.100) (0.230) (0.220) (0.540) (0.540)
0.411*** 0.776*** 0.301*** 1.119*** 0.700*** 0.591* 0.199 0.847 -0.083
(0.070) (0.090) (0.050) (0.140) (0.130) (0.310) (0.300) (0.850) (0.850)
other_trader 0.754*** 1.252*** 0.428*** 1.348*** 0.587*** 0.779*** -0.096 0.908*** 0.138
(0.020) (0.030) (0.010) (0.040) (0.040) (0.090) (0.080) (0.250) (0.250)
number of observations 18,188 18,479 17,997 18,136 17,674 5,974 5,932 775 771
R² 0.14 0.25 0.21 0.20 0.16 0.09 0.08 0.18 0.15
* p<0.10, ** p<0.05, *** p<0.01
Traditional
internationalizer
Regressions with 58 industry dummies (nacebel2).
Table 10 shows the same characteristics for those firms that survived and continued exporting (export in 1998 and 2005) and surviving SMEs that did not
trade in 1998 and 2005. All types of continuing exporters were still larger in terms of value added and employment compared to non-traders; and the gap
had increased between 1998 and 2005. Born globals still had the greatest value added and productivity advantage and the highest R&D intensity in 2005.
Continuing born internationals were able to considerably reduce the gap in productivity.
8/10/2019 Internationalization Strategy and Performance of SME
http://slidepdf.com/reader/full/internationalization-strategy-and-performance-of-sme 17/47
15
4. The process of internationalization: Some testable hypotheses
The extensive and unique data make it possible to develop and test some specific hypotheses about
the internationalization process of SMEs. First, the recent international trade literature has shown
how increased openness of countries selects the most efficient firms into exporting and increases
the failure rate of less efficient firms (Melitz, 2003; Bernard et al., 2003; Costantini and Melitz, 2007;Melitz and Ottaviano, 2008). In a recent paper Eaton et al. (2004) develop a selection model in the
context of differentiated country markets and test it against a large sample of French firms. A basic
result of the model is that a more efficient firm will typically both enter more markets and sell more
widely in any given market. Moreover, this translates into higher profitability of the firm.
This results of efficiency getting translated in higher sales growth is also the basic idea in stochastic
growth models of firms, following up on the original ideas developed in Jovanovic’s (1982)
“Bayesian” learning model of firm growth (see Coad, 2009 for a recent overview). Following this
logic, firms enter the industry with different relative (fixed) efficiency levels. Once established in the
industry, firms learn about their efficiency, especially in their first years, with the least efficient ones
being forced to exit, while more efficient firms expand. The higher and erratic growth rates ofsmaller firms are also related to the small size at which firms enter vis-à-vis the minimum efficient
scale (MES), dictated by the technological conditions of the industry. Confronted with this scale cost-
disadvantage, surviving small firms will grow rapidly to reach the MES. Above the MES, growth may
become completely random (see e.g. Caves, 1998). In the empirical work testing for these ideas, it is
indeed found that smaller and younger firms grow faster than larger, older ones; but the volatility in
their growth rates is also higher as are their hazard rates (e.g., Evans 1987; Variyam and Kraybill
1992; Dunne and Hughes 1994; Yasuda 2005; Calvo, 2006).
Thus far these insights from the stochastic evolution models seem not to have been tested in the
context of expanding abroad and entering diverse international markets. This international
expansion forces firms to discover their relative efficiency in the specific market context of thedifferent countries to which they decide to export. Obviously, the selection process triggered by
trade liberalization will favor efficient firms in the domestic market and stimulate them to
internationalize. This self-selection should milder the learning process in foreign markets. However,
many unobserved factors in foreign markets may still lead to a similar growth process. We expect
this learning effect to be stronger for born globals and born internationals that as young firms and
early internationalizers need to expand in several countries at the same time. For traditional
internationalizers and/or established exporters, export growth will be more controlled and less
sensitive to a parallel discovery process.
Hypothesis 1: Born globals and born internationals will grow faster in export sales than traditional
internationalizers and established exporters.
An increasing number of studies both in the international business literature as well as in the
international trade literature link the entry into foreign markets through exports to a commitment of
resources coupled with substantial sunk costs that firms have to incur to enter these markets
(Bernard and Jensen, 2001). For narrow scope and traditional (i.e. staged) internationalizers, this
process will be gradual with a limited commitment of resources (Johanson and Vahlne, 1977). For
born globals on the other hand, the instant and simultaneous entry into several markets will involve
substantial investment that needs to be matched with substantial export volumes to overcome
these costs. We therefore hypothesize that the levels of commitment in terms of initial export
intensity will be much more substantial for the born global firms. Hence,
8/10/2019 Internationalization Strategy and Performance of SME
http://slidepdf.com/reader/full/internationalization-strategy-and-performance-of-sme 18/47
16
Hypothesis 2: Among the newly internationalizing SMEs, born globals will have the strongest initial
commitment to export markets.
The larger commitment of born globals should be associated with less flexibility in withdrawing from
foreign markets. This commitment is also likely to go together with a strategic intent to stay
significantly present in world markets. Moreover, as most of these firms operate in high technologyindustries and globalized industries, as shown in section 3.3 of the paper, the relevant market on
which they have to compete (i.e. the market where the competitive interaction among firms is high),
is also typically comprising several countries. This is very different from traditional internationalizers,
which occur more often in local traditional industries. Hence, we expect
Hypothesis 3: Among the newly internationalizing SMEs, born globals will show the highest
probability to continue exporting over time.
Conform the logic of the passive learning model, being a new firm and being exposed to many
different foreign markets also increases the risk of failure; i.e. bankruptcy of the firm. However,
there is also substantial evidence that prior to expanding abroad, firms self select and only the mostefficient ones will expand abroad (Bernard and Jensen, 1999) reducing excess risk. Some researchers
have found that despite the risks involved in internationalization, both import (e.g. Coucke and
Sleuwaegen, 2008) and export (e.g. Bernard and Jensen, 1999; Muûls and Pisu, 2007) positively
impact chances of firm survival. Moreover, some authors find that learning by exporting gives rise to
substantial productivity gains, increasing the chances of firm survival (e.g. De Loecker, 2007). If,
however, internationalization ultimately increases long term chances of firm survival, the costs and
risks involved in the process may reduce short term chances of survival (Sapienza et al., 2006).
Empirical research comparing the exit rates of different types of internationalizing SMEs to those of
domestic new ventures is limited. Zahra (2005) found that SME proceeding cautiously and
incrementally into international markets are likely to face fewer risks and pitfalls compared torapidly and globally internationalizing SMEs, and may therefore have higher chances of survival.
Mudambi and Zahra (2007) found lower survival rates for new ventures entering markets
simultaneously compared to sequential foreign market entry. However, these differences disappear
when competitive strategies are taken into account. Most of the past studies were based on small
samples, and did not always correct for industry influences. With the data at hand, we are able to do
a more complete analysis, and test if the failure rates of the different types of SMEs differ
systematically across industries. Following our typology, we can test for both born globals and born
internationals if next to the risk of being a new firm and trader there is an extra risk of entering
multiple foreign markets at the same time. More specifically, we hypothesize
Hypothesis 4: Among the newly internationalizing SMEs, born globals will show the highest failure
rate, traditional internationalizers the lowest.
Acquiring foreign market knowledge prior to expanding into a foreign market can reduce the risk of
entering foreign markets. Such prior knowledge will also facilitate the international development
path of small firms. So far, we have assumed that firms only expand in one direction by exporting to
foreign countries. However, recently there has been growing evidence that foreign sourcing, i.e.
importing intermediate goods and services from foreign countries, has been growing strongly over
time (Muûls and Pisu, 2007; Coucke and Sleuwaegen, 2008). From a learning perspective, those
contacts with foreign partners are likely to generate privileged knowledge about these countries,
and may be instrumental in reducing the risk and cost of entering by export those same foreign
markets. This learning process could equally well apply in the other direction. Exporting to a
particular country may also help to acquire better knowledge of possible foreign partners in that

8/10/2019 Internationalization Strategy and Performance of SME
http://slidepdf.com/reader/full/internationalization-strategy-and-performance-of-sme 19/47
8/10/2019 Internationalization Strategy and Performance of SME
http://slidepdf.com/reader/full/internationalization-strategy-and-performance-of-sme 20/47
18
5. Statistical evidence
5.1 Growth, selection and commitment
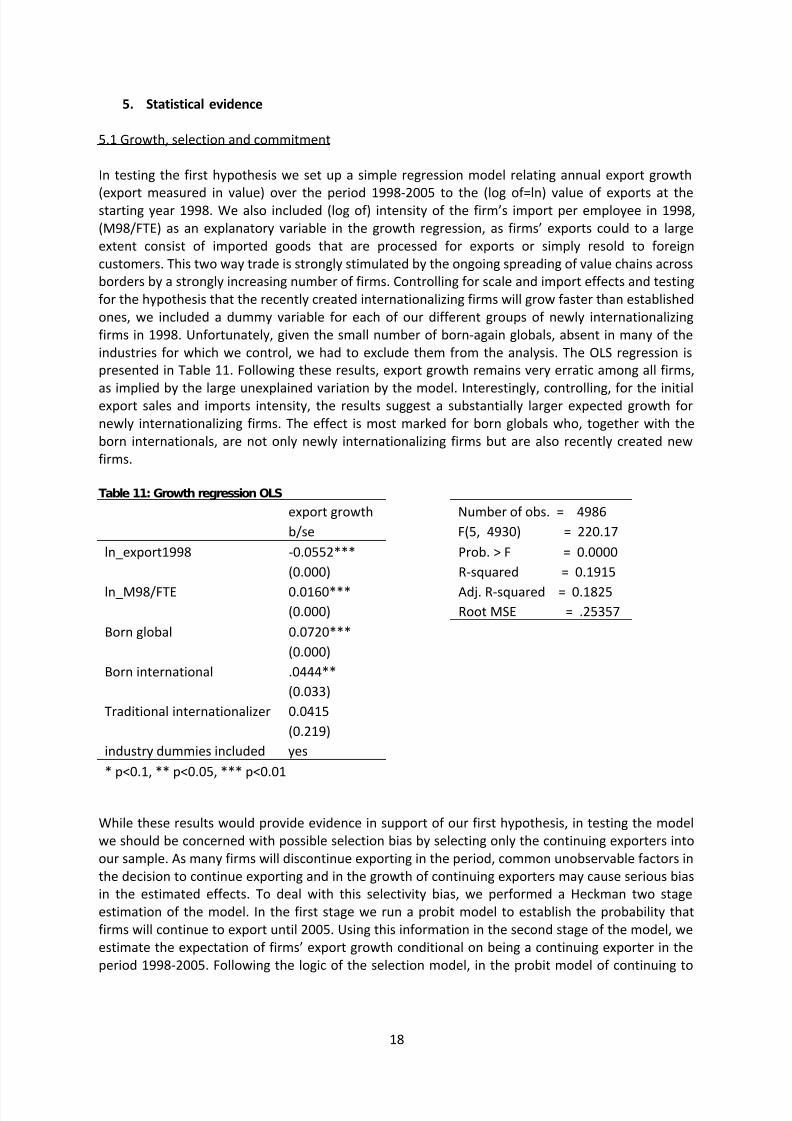
In testing the first hypothesis we set up a simple regression model relating annual export growth
(export measured in value) over the period 1998-2005 to the (log of=ln) value of exports at thestarting year 1998. We also included (log of) intensity of the firm’s import per employee in 1998,
(M98/FTE) as an explanatory variable in the growth regression, as firms’ exports could to a large
extent consist of imported goods that are processed for exports or simply resold to foreign
customers. This two way trade is strongly stimulated by the ongoing spreading of value chains across
borders by a strongly increasing number of firms. Controlling for scale and import effects and testing
for the hypothesis that the recently created internationalizing firms will grow faster than established
ones, we included a dummy variable for each of our different groups of newly internationalizing
firms in 1998. Unfortunately, given the small number of born-again globals, absent in many of the
industries for which we control, we had to exclude them from the analysis. The OLS regression is
presented in Table 11. Following these results, export growth remains very erratic among all firms,
as implied by the large unexplained variation by the model. Interestingly, controlling, for the initialexport sales and imports intensity, the results suggest a substantially larger expected growth for
newly internationalizing firms. The effect is most marked for born globals who, together with the
born internationals, are not only newly internationalizing firms but are also recently created new
firms.
Table 11: Growth regression OLS
export growth Number of obs. = 4986
b/se F(5, 4930) = 220.17
ln_export1998 -0.0552*** Prob. > F = 0.0000
(0.000) R-squared = 0.1915
ln_M98/FTE 0.0160*** Adj. R-squared = 0.1825
(0.000) Root MSE = .25357
Born global 0.0720***
(0.000)
Born international .0444**
(0.033)
Traditional internationalizer 0.0415
(0.219)
industry dummies included yes
* p<0.1, ** p<0.05, *** p<0.01
While these results would provide evidence in support of our first hypothesis, in testing the model
we should be concerned with possible selection bias by selecting only the continuing exporters into
our sample. As many firms will discontinue exporting in the period, common unobservable factors in
the decision to continue exporting and in the growth of continuing exporters may cause serious bias
in the estimated effects. To deal with this selectivity bias, we performed a Heckman two stage
estimation of the model. In the first stage we run a probit model to establish the probability that
firms will continue to export until 2005. Using this information in the second stage of the model, we
estimate the expectation of firms’ export growth conditional on being a continuing exporter in the
period 1998-2005. Following the logic of the selection model, in the probit model of continuing to
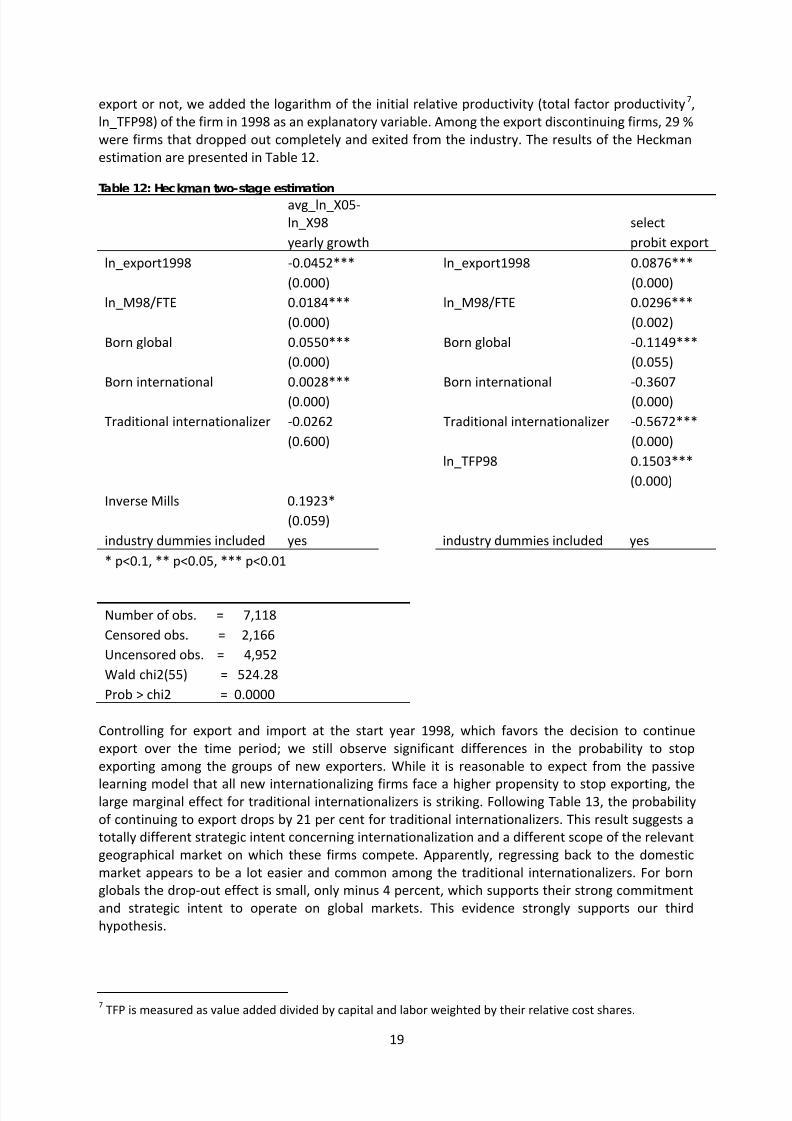
8/10/2019 Internationalization Strategy and Performance of SME
http://slidepdf.com/reader/full/internationalization-strategy-and-performance-of-sme 21/47
19
export or not, we added the logarithm of the initial relative productivity (total factor productivity7,
ln_TFP98) of the firm in 1998 as an explanatory variable. Among the export discontinuing firms, 29 %
were firms that dropped out completely and exited from the industry. The results of the Heckman
estimation are presented in Table 12.
Table 12: Heckman two-stage estimation
avg_ln_X05-
ln_X98 select
yearly growth probit export
ln_export1998 -0.0452*** ln_export1998 0.0876***
(0.000) (0.000)
ln_M98/FTE 0.0184*** ln_M98/FTE 0.0296***
(0.000) (0.002)
Born global 0.0550*** Born global -0.1149***
(0.000) (0.055)
Born international 0.0028*** Born international -0.3607
(0.000) (0.000)
Traditional internationalizer -0.0262 Traditional internationalizer -0.5672***
(0.600) (0.000)
ln_TFP98 0.1503***
(0.000)
Inverse Mills 0.1923*
(0.059)
industry dummies included yes industry dummies included yes
* p<0.1, ** p<0.05, *** p<0.01
Number of obs. = 7,118
Censored obs. = 2,166
Uncensored obs. = 4,952
Wald chi2(55) = 524.28
Prob > chi2 = 0.0000
Controlling for export and import at the start year 1998, which favors the decision to continue
export over the time period; we still observe significant differences in the probability to stop
exporting among the groups of new exporters. While it is reasonable to expect from the passive
learning model that all new internationalizing firms face a higher propensity to stop exporting, thelarge marginal effect for traditional internationalizers is striking. Following Table 13, the probability
of continuing to export drops by 21 per cent for traditional internationalizers. This result suggests a
totally different strategic intent concerning internationalization and a different scope of the relevant
geographical market on which these firms compete. Apparently, regressing back to the domestic
market appears to be a lot easier and common among the traditional internationalizers. For born
globals the drop-out effect is small, only minus 4 percent, which supports their strong commitment
and strategic intent to operate on global markets. This evidence strongly supports our third
hypothesis.
7 TFP is measured as value added divided by capital and labor weighted by their relative cost shares.
8/10/2019 Internationalization Strategy and Performance of SME
http://slidepdf.com/reader/full/internationalization-strategy-and-performance-of-sme 22/47
20
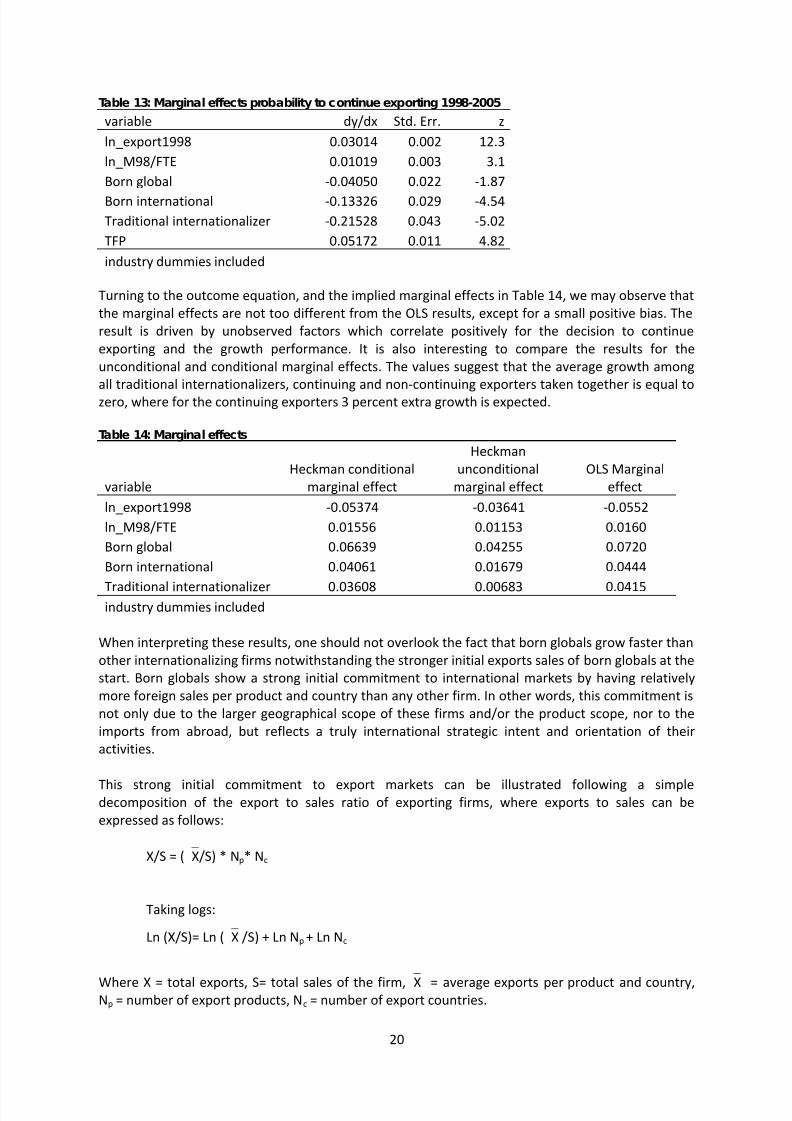
Table 13: Marginal effects probability to continue exporting 1998-2005
variable dy/dx Std. Err. z
ln_export1998 0.03014 0.002 12.3
ln_M98/FTE 0.01019 0.003 3.1
Born global -0.04050 0.022 -1.87
Born international -0.13326 0.029 -4.54
Traditional internationalizer -0.21528 0.043 -5.02
TFP 0.05172 0.011 4.82
industry dummies included
Turning to the outcome equation, and the implied marginal effects in Table 14, we may observe that
the marginal effects are not too different from the OLS results, except for a small positive bias. The
result is driven by unobserved factors which correlate positively for the decision to continue
exporting and the growth performance. It is also interesting to compare the results for the
unconditional and conditional marginal effects. The values suggest that the average growth among
all traditional internationalizers, continuing and non-continuing exporters taken together is equal to
zero, where for the continuing exporters 3 percent extra growth is expected.
Table 14: Marginal effects
variable
Heckman conditional
marginal effect
Heckman
unconditional
marginal effect
OLS Marginal
effect
ln_export1998 -0.05374 -0.03641 -0.0552
ln_M98/FTE 0.01556 0.01153 0.0160
Born global 0.06639 0.04255 0.0720
Born international 0.04061 0.01679 0.0444
Traditional internationalizer 0.03608 0.00683 0.0415industry dummies included
When interpreting these results, one should not overlook the fact that born globals grow faster than
other internationalizing firms notwithstanding the stronger initial exports sales of born globals at the
start. Born globals show a strong initial commitment to international markets by having relatively
more foreign sales per product and country than any other firm. In other words, this commitment is
not only due to the larger geographical scope of these firms and/or the product scope, nor to the
imports from abroad, but reflects a truly international strategic intent and orientation of their
activities.
This strong initial commitment to export markets can be illustrated following a simpledecomposition of the export to sales ratio of exporting firms, where exports to sales can be
expressed as follows:
X/S = ( X/S) * Np* Nc
Taking logs:
Ln (X/S)= Ln ( X /S) + Ln Np + Ln Nc
Where X = total exports, S= total sales of the firm, X = average exports per product and country,Np = number of export products, Nc = number of export countries.
8/10/2019 Internationalization Strategy and Performance of SME
http://slidepdf.com/reader/full/internationalization-strategy-and-performance-of-sme 23/47
21
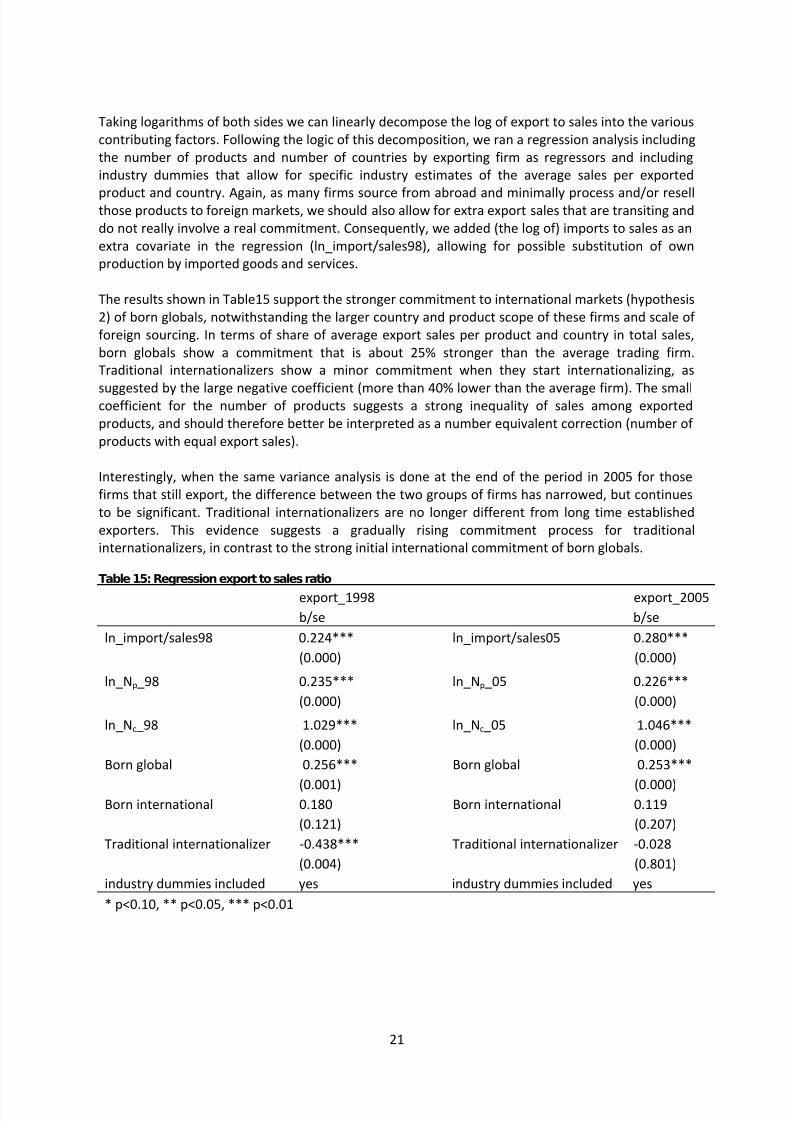
Taking logarithms of both sides we can linearly decompose the log of export to sales into the various
contributing factors. Following the logic of this decomposition, we ran a regression analysis including
the number of products and number of countries by exporting firm as regressors and including
industry dummies that allow for specific industry estimates of the average sales per exported
product and country. Again, as many firms source from abroad and minimally process and/or resellthose products to foreign markets, we should also allow for extra export sales that are transiting and
do not really involve a real commitment. Consequently, we added (the log of) imports to sales as an
extra covariate in the regression (ln_import/sales98), allowing for possible substitution of own
production by imported goods and services.
The results shown in Table15 support the stronger commitment to international markets (hypothesis
2) of born globals, notwithstanding the larger country and product scope of these firms and scale of
foreign sourcing. In terms of share of average export sales per product and country in total sales,
born globals show a commitment that is about 25% stronger than the average trading firm.
Traditional internationalizers show a minor commitment when they start internationalizing, as
suggested by the large negative coefficient (more than 40% lower than the average firm). The smallcoefficient for the number of products suggests a strong inequality of sales among exported
products, and should therefore better be interpreted as a number equivalent correction (number of
products with equal export sales).
Interestingly, when the same variance analysis is done at the end of the period in 2005 for those
firms that still export, the difference between the two groups of firms has narrowed, but continues
to be significant. Traditional internationalizers are no longer different from long time established
exporters. This evidence suggests a gradually rising commitment process for traditional
internationalizers, in contrast to the strong initial international commitment of born globals.
Table 15: Regression export to sales ratio
export_1998 export_2005
b/se b/se
ln_import/sales98 0.224*** ln_import/sales05 0.280***
(0.000) (0.000)
ln_Np _98 0.235*** ln_Np _05 0.226***
(0.000) (0.000)
ln_Nc _98 1.029*** ln_Nc _05 1.046***
(0.000) (0.000)
Born global 0.256*** Born global 0.253***
(0.001) (0.000)Born international 0.180 Born international 0.119
(0.121) (0.207)
Traditional internationalizer -0.438*** Traditional internationalizer -0.028
(0.004) (0.801)
industry dummies included yes industry dummies included yes
* p<0.10, ** p<0.05, *** p<0.01
8/10/2019 Internationalization Strategy and Performance of SME
http://slidepdf.com/reader/full/internationalization-strategy-and-performance-of-sme 24/47
22
Number of obs = 5,537 Number of obs = 5,006
F( 7, 5478) = 670.68 F( 7, 4950) = 682.15
Prob > F = 0.0000 Prob > F = 0.0000
R-squared = 0.5460 R-squared = 0.5600
Adj R-squared = 0.5412 Adj R-squared = 0.5551
Root MSE = 1.5707 Root MSE = 1.6031
5.2 Exit of newly internationalizing SME
The foregoing analysis pointed out important differences in the withdrawal of newly
internationalizing firms from export markets. In an important number of cases this withdrawal went
together with a complete exit of the firm from the industry. Although recent evidence on the
relationship between export and firm survival (e.g. Bernard and Jensen, 1999; Muûls and Pisu, 2007)
has suggested that exporting may increase the chances of firm survival, little was known about
survival of the various types of exporting SMEs. Conventional wisdom on small firm
internationalization follows the traditional stage models (e.g. Johanson and Vahlne, 1977), which
suggest that firms proceeding cautiously and incrementally into international markets face fewer
risks and compared to rapidly and globally internationalizing SMEs, and may therefore have higher
chances of survival. This implies that late internationalizers would have higher survival rates
compared to early internationalizers, as suggested by Autio (2005).
The results above suggest the strong commitment to international markets of born globals with only
a small percentage really withdrawing from export. However, the sprinkler strategy that these firms
develop assumes significant resources and competencies to deal with the complexities of expanding
into several countries (Kalish et al., 1995). Needless to say that such a drastic expansion may involvehigher risks. In fact, among the born globals that stopped exporting, 22% stopped as a result of
complete exit from the industry, compared to 15% for born internationals and only 7% of traditional
internationalizers. Only cessation of activities was considered as exit. An equal percentage of SMEs
that stopped exporting and appear to have exited, have in fact merged with another firm or have
been taken over.
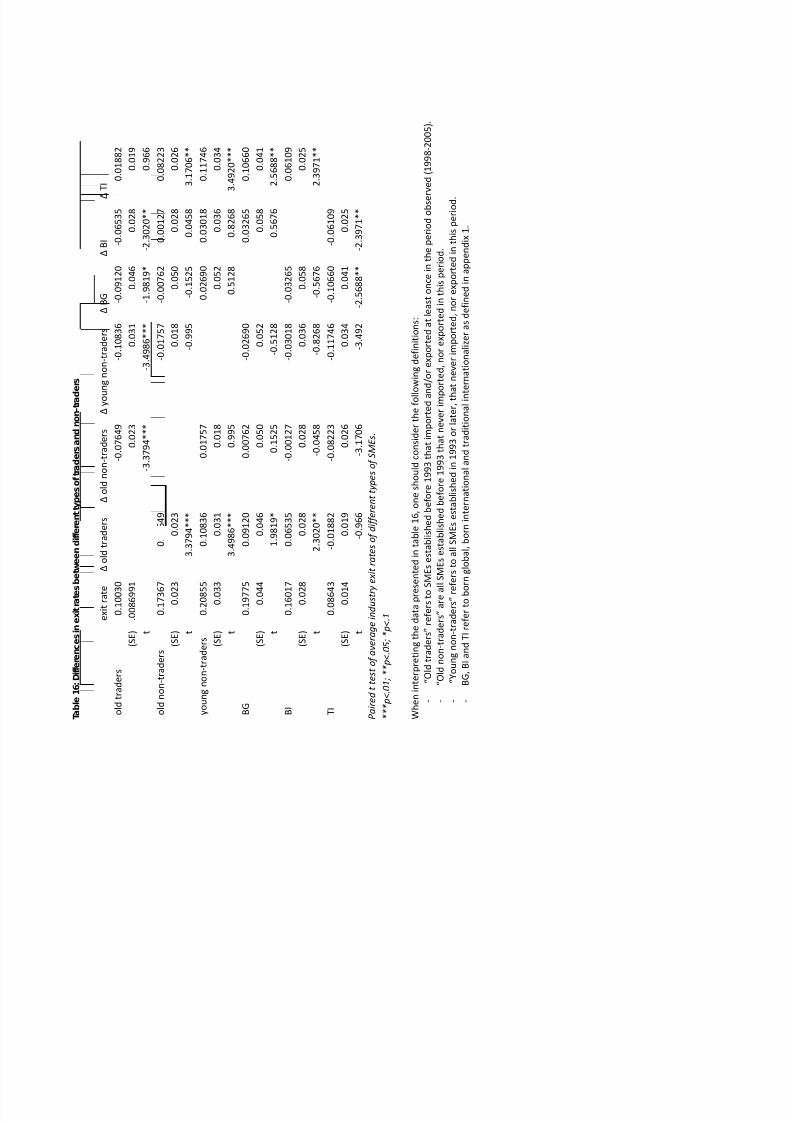
Taking account of possible industry influences (see section 3.3), we calculated exit rates8 per group
of new exporters per industry (nacebel 2 digit) and performed a paired t-test for differences in exit
rates among the groups. The results for average exit rates across industries and differences among
the different groups are shown in Table 16.
8 Exit was defined as firms that had ceased to exist according to the crossroads bank and no longer reported
employment in 2005. Even if the actual date these firms stopped was later than 2005 (i.e. between 2006 and
2009), the firm was classified as having exited in 2005 if it no longer reported employment in 2005. In the full
dataset, we find an average exit rate of 9.7%, across all firms and industries. However, these exit rates vary
greatly across industries. In three industries, we do not observe firm exit (forestry; fishing; and insurance and
pension funds), whereas in four other industries exit rates exceeded 20% (mining; textile manufacturing;manufacturing of radio, television and communication apparatus; and water purification and distribution).
8/10/2019 Internationalization Strategy and Performance of SME
http://slidepdf.com/reader/full/internationalization-strategy-and-performance-of-sme 25/47
T a b l e 1 6 : D i f f e r e n c e s i n e x i t r a t e s
b e t w e e n d i f f e r e n t t y p e s o f t r a d e r s a n d n o n - t r a d e r s
e x i t r a t e
o
l d t r a d e r s
o
l d n o n - t r a
d e r s
y o u
n g n o n - t r a
d e r s
B
G
B
I
T I
o l d t r a d e r s
0 . 1
0 0 3
0
- 0 . 0
7 6 4 9
- 0 . 1
0 8 3 6
- 0 . 0
9 1 2 0
- 0 . 0
6 5 3 5
0 . 0
1 8 8 2
( S E )
. 0 0 8 6 9 9
1
0 . 0
2 3
0 . 0
3 1
0 . 0
4 6
0 . 0
2 8
0 . 0
1 9
t
- 3 . 3
7 9 4 * * *
- 3 . 4
9 8 6 * * *
- 1 . 9
8 1 9 *
- 2 . 3
0 2 0 * *
0 . 9
6 6
o l d n o n - t r a
d e r s
0 . 1
7 3 6
7
0 . 0
7 6 4 9
- 0 . 0
1 7 5 7
- 0 . 0
0 7 6 2
0 . 0
0 1 2 7
0 . 0
8 2 2 3
( S E )
0 . 0 2
3
0 . 0
2 3
0 . 0
1 8
0 . 0
5 0
0 . 0
2 8
0 . 0
2 6
t
3 . 3
7 9 4 * * *
- 0 . 9
9 5
- 0 . 1
5 2 5
0 . 0
4 5 8
3 . 1
7 0 6 * *
y o u n g n o n - t r a
d e r s
0 . 2
0 8 5
5
0 . 1
0 8 3 6
0 . 0
1 7 5 7
0 . 0
2 6 9 0
0 . 0
3 0 1 8
0 . 1
1 7 4 6
( S E )
0 . 0 3
3
0 . 0
3 1
0 . 0
1 8
0 . 0
5 2
0 . 0
3 6
0 . 0
3 4
t
3 . 4
9 8 6 * * *
0 . 9
9 5
0 . 5
1 2 8
0 . 8
2 6 8
3 . 4
9 2 0 * * *
B G
0 . 1
9 7 7
5
0 . 0
9 1 2 0
0 . 0
0 7 6 2
- 0 . 0
2 6 9 0
0 . 0
3 2 6 5
0 . 1
0 6 6 0
( S E )
0 . 0 4
4
0 . 0
4 6
0 . 0
5 0
0 . 0
5 2
0 . 0
5 8
0 . 0
4 1
t
1 . 9
8 1 9 *
0 . 1
5 2 5
- 0 . 5
1 2 8
0 . 5
6 7 6
2 . 5
6 8 8 * *
B I
0 . 1
6 0 1
7
0 . 0
6 5 3 5
- 0 . 0
0 1 2 7
- 0 . 0
3 0 1 8
- 0 . 0
3 2 6 5
0 . 0
6 1 0 9
( S E )
0 . 0 2
8
0 . 0
2 8
0 . 0
2 8
0 . 0
3 6
0 . 0
5 8
0 . 0
2 5
t
2 . 3
0 2 0 * *
- 0 . 0
4 5 8
- 0 . 8
2 6 8
- 0 . 5
6 7 6
2 . 3
9 7 1 * *
T I
0 . 0
8 6 4
3
- 0 . 0
1 8 8 2
- 0 . 0
8 2 2 3
- 0 . 1
1 7 4 6
- 0 . 1
0 6 6 0
- 0 . 0
6 1 0 9
( S E )
0 . 0 1
4
0 . 0
1 9
0 . 0
2 6
0 . 0
3 4
0 . 0
4 1
0 . 0
2 5
t
- 0 . 9
6 6
- 3 . 1
7 0 6
- 3 . 4
9 2
- 2 . 5
6 8 8 * *
- 2 . 3
9 7 1 * *
P a i r e d t t e s t o f a v e r a g e i n d u s t r y
e x i t r a t e s o f d i f f e r e n t t y p e s o f S M E s .
* * * p < . 0 1 ; * * p < . 0 5 ; * p < . 1
W h e n i n t e r p r e t i n g t h e d a t a p r e s e n t e d i n t a b l e 1 6 ,
o n e s h o u l d c o n s i d e r t h e f o l l o w i n g d e f i n i t i o n s :
-
“ O l d t r a d e r s ” r e f e r s t o S M E s e s t a b l i s h e d b e f o r e 1 9 9 3 t h a t i m p o r t e d a n
d / o r e x p o r t e d a t l e a s t o n c e i n t h e p e r i o d o b s e r v e d ( 1 9 9 8 - 2 0 0 5 ) .
-
“ O l d n o n - t r a
d e r s ” a r e a l l S M E s e s t a b l i s h e d b e f o r e 1 9 9 3 t h a t n e v e r i m p o r t e d ,
n o r e x p o r t e d i n t h i s p e r i o d .
-
“ Y o u n g n o n - t r a
d e r s ” r e
f e r s t o a l l S M E s e s t a b l i s h e d i n 1 9 9 3 o r l a t e r , t h a t n e v e r i m p o r t e d ,
n o r e x p o r t e d i n t h i s p e r i o d .
-
B G ,
B I a n d T I r e f e r t o b o
r n g l o b a l , b o r n i n t e r n a t i o n a l a n d t r a d i t i o n a l i n t
e r n a t i o n a l i z e r a s d e f i n e d i n a p p e n d i x 1 .
8/10/2019 Internationalization Strategy and Performance of SME
http://slidepdf.com/reader/full/internationalization-strategy-and-performance-of-sme 26/47
24
Overall, traders have lower exit rates compared to non-traders in the same industry, confirming the
findings of Bernard and Jensen (1999) and Muûls and Pisu (2007). Analyzing differences between old
and young traders (i.e. firms that started to trade in the period 1998-2005) and non-traders, we find
that young non-trader firms have the highest exit rate. The exit rate of old traders is substantially
below the one observed for old non-trader firms.
Following our typology of firms that started exporting between 1998 and 2005, we tested if the
initial timing and scope of internationalization affects the chances of firm survival in the observation
period. As expected, we find that born globals have the highest exit rates among these three types9
and traditional internationalizers the lowest, supporting hypothesis 4. The exit of traditional
internationalizers was significantly lower than those of born globals and born internationals.
Interestingly, the export scope does not appear to have a significant impact on firm survival. A born
global strategy appears not more risky than early internationalization with a more narrow scope
(born globals versus born internationals). Furthermore, when comparing these latter two groups ofearly internationalizers with non-traders established in the same period, we find no differences in
survival rates. This may suggest that early internationalization does not negatively impact the
chances of survival when compared to no internationalization, a result that is at odds with the
findings by Sapienza et al. (2006), who find that the costs and risks involved in the process may
reduce short term chances of survival. However, the self selection of only those firms with a
relatively high efficiency level into born globals may obscure this additional risk effect in our analysis
and explain why the exit outcome for born globals is not too different from the exit rate of young
non-trading firms.
5.3 Dynamics of trade involvement by SMEs:
Many firms are unsuccessful in their internationalization endeavors and stop exporting after one or
more years, as we discussed in section 5.1. In this section we examine further changes in the trade
configuration of firms over the time period 1998-2005. The following table summarizes how the
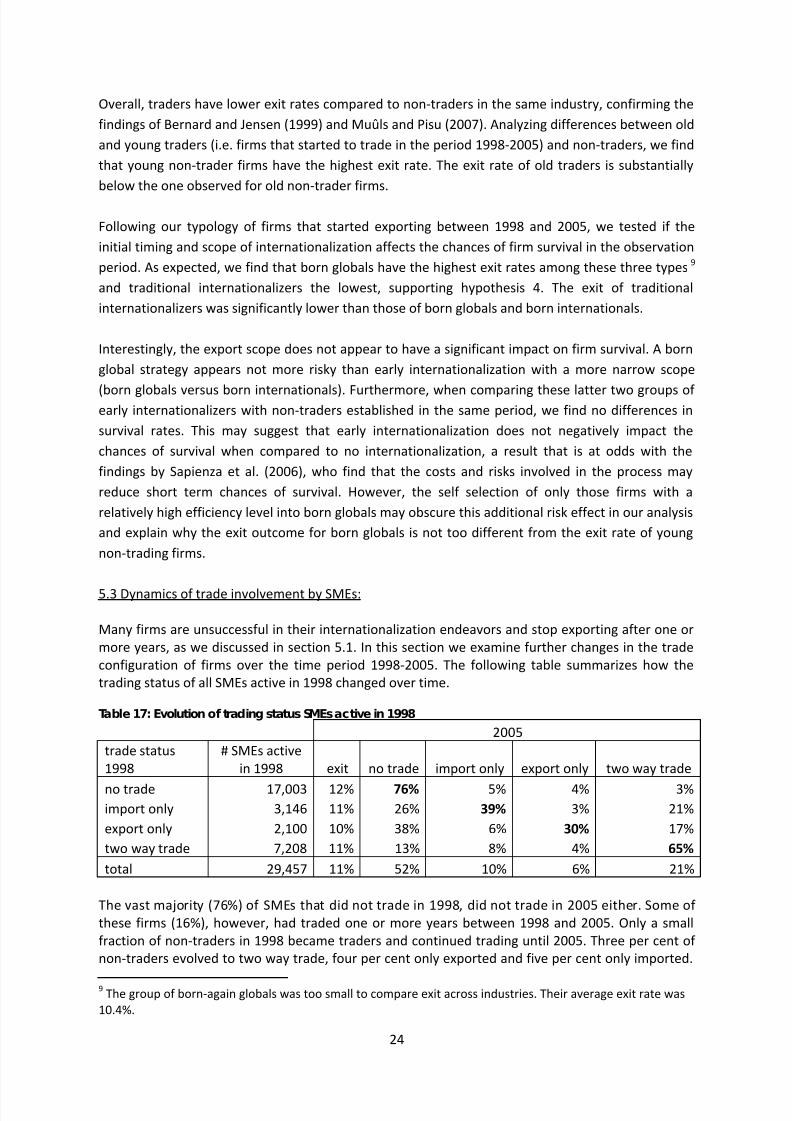
trading status of all SMEs active in 1998 changed over time.
Table 17: Evolution of trading status SMEs active in 1998
2005
trade status
1998
# SMEs active
in 1998 exit no trade import only export only two way trade
no trade 17,003 12% 76% 5% 4% 3%
import only 3,146 11% 26% 39% 3% 21%
export only 2,100 10% 38% 6% 30% 17%
two way trade 7,208 11% 13% 8% 4% 65%
total 29,457 11% 52% 10% 6% 21%
The vast majority (76%) of SMEs that did not trade in 1998, did not trade in 2005 either. Some of
these firms (16%), however, had traded one or more years between 1998 and 2005. Only a small
fraction of non-traders in 1998 became traders and continued trading until 2005. Three per cent of
non-traders evolved to two way trade, four per cent only exported and five per cent only imported.
9 The group of born-again globals was too small to compare exit across industries. Their average exit rate was
10.4%.

8/10/2019 Internationalization Strategy and Performance of SME
http://slidepdf.com/reader/full/internationalization-strategy-and-performance-of-sme 27/47
25
SMEs that only exported in 1998 are the least persistent: less than one third were still only exporters
in 2005, 17% had become two way traders and 38% stopped trading. Among firms that only
imported, more firms evolved towards two way trade (21%) and fewer firms stopped trading (26%).
Two way traders are the most consistent in their trading status: 65% of firms that were two way
traders in 1998 were still two way traders in 2005. Very few two way traders stopped trading; andmany more one way traders evolved to two way trade. The fact that this category is large and that
many firms move in the direction of becoming a two-way trader suggests that there must be
substantial gains in making this transition.
5.4 The importance of becoming a two-way trader
Tables 18 and 19 relate the change from moving from a one way trader to become a two way trader
to the change in performance of those firms in terms of value added and labor productivity,
measured as value added per worker. For comparison reason the tables also show the change in
performance for those firms who did not change status, moved in the other direction of trade, or
stopped trading internationally.
Table 18: Evolution of trading status of SMEs that only imported in 1998
Import only 1998
M+X 2005 Import only 2005 Export only 2005 No trade 2005
employment 60% 26% 26% 3%
value added 117% 53% 16% 34%
labor productivity 35% 22% -8% 29%
turnover 93% 59% 12% 10%
import products 39% 12%
import countries 46% 17%
N 644 1,234 95 590
% 25% 48% 4% 23%
In 1998, 3,146 SMEs only imported. Half of those that were still active in 2005 still only imported,
25% had become two-way traders and 23% stopped trading. A small number of firms switched from
import to export. The firms that became two-way traders had, on average, superior growth rates in
employment, value added, sales and labor productivity.
Table 19: Evolution of trading status of SMEs that only exported in 1998
Export only 1998
M+X 2005 Export only 2005 Import only 2005 No trade 2005 employment 46% 21% 39% 10%
value added 116% 62% 63% 12%
labor productivity 48% 34% 17% 2%
turnover 139% 74% 103% 46%
export products 85% 23%
export countries 54% 9%
N 355 621 120 599
% 21% 37% 7% 35%
8/10/2019 Internationalization Strategy and Performance of SME
http://slidepdf.com/reader/full/internationalization-strategy-and-performance-of-sme 28/47
26
In 1998, 2,100 SMEs only exported. Of those that were still active in 2005, 21% had become two-way
traders, 37% still only exported and 35% had stopped trading. Those firms that became two-way
traders had, on average, superior growth rates in employment, value added, sales and labor
productivity. Interestingly, these two-way traders also had a faster increase in the number of export
products and destinations compared to firms that strictly focused on exporting. They increased the
number of products from 4.6 to 7.1 and the number of countries from 4.5 to 8.3. For SMEs that onlyexported in 1998 and 2005 there was a modest increase in products from 3.1 to 3.8 and in
destinations from 3.2 to 3.5. For firms that stopped trading, there was a remarkable difference in
terms of productivity growth between firms that were only importers and those that only exported
in 1998.
5.5 Making the transition to two-way trade by country: Acquiring market knowledge through import
and export
SMES deciding to enter foreign markets face a number of challenges posed by these new markets;
including differences in language, lifestyles, cultural standards, consumer preferences, purchasing
power and institutional context (e.g. Lu and Beamish 2001; Sousa and Bradley 2005). Literature on
SME internationalization has identified psychic distance and institutional differences as a key
explanatory variable regarding expansion into foreign markets (e.g. Johanson and Vahlne, 1990;
Dollar and Kraay, 2002; Francois and Manchin, 2006). Internationalizing SMEs would thus first enter
psychically and institutionally close markets, before entering more distant markets. The learning
from each export market would contribute to the firm’s international experience, knowledge and
capabilities and thus enable them to overcome the difficulties in dealing with these more distant
markets. However, as we and others before us have demonstrated, a large number of
internationalizing SMEs do not follow this traditional approach of internationalization in incremental
stages. Consequently, many other factors seem to be at work explaining the various expansion pathsof SMEs.
A number of factors facilitating rapid internationalization have been proposed. Besides the need to
be globally active (cf. section 2) a key element for rapid internationalization is the international
orientation and prior export experience of the owner/manager (e.g. Zou and Stan, 1998; Manolova
and Manev, 2004). Likewise, hiring managers with prior export experience or knowledge about
specific markets can accelerate the internationalization of SMEs. Another source of market
knowledge can be found in the SME’s network. Domestic buyers and suppliers may have
international operations and can provide valuable information about certain markets. Analogously,
SMEs can benefit from learning from their international customers or suppliers. In this respect,
sourcing from a certain market may enable small firms to rapidly acquire knowledge about this
market and assess the export potential of this market. Similarly, interactions with customers in
foreign markets may help firms in identifying possible suppliers in these markets.
Whereas the stage theory proposed that SMEs learn from prior export experience before moving to
more distant markets (Johanson and Vahlne, 1977), acquiring knowledge about that specific market
through import may be even more important and thus enable SMEs to speed up their
internationalization and enter psychically and institutionally distant markets without much prior
export experience.
8/10/2019 Internationalization Strategy and Performance of SME
http://slidepdf.com/reader/full/internationalization-strategy-and-performance-of-sme 29/47
27
Table 24 and Table 25 in appendix show the evolution of trade of SMEs with Belgium’s 10 main
trading partners and 10 important but more distant trading partners, for firms active in 1998. For
non-traders and firms that only imported from a certain country in 1998, we analyzed how many of
these firms have started exporting to each of these markets by 2005. Overall, we find that for
geographically and institutionally nearby markets in the EU, more firms make this transition than for
more distant markets. In line with our hypothesis, we find a much larger share of importers that
started exporting to a particular market than non traders making the same evolution. The propensity
to start exporting conditional on importing from the same country is also significantly larger than the
same propensity for firms that have trade experience but no imports from the particular country.
This observation underscores the importance of having country specific knowledge about a potential
export market.
Similarly, moving to the other trade direction, we find that exporters to a particular country make
this transition to also import from that country more frequently than firms with no experience in this
market.
For more distant markets we observe less transitions but the relative frequency of starting to export
(import) by importing (exporting) firms from (to) the same country versus non-experience firms is
more marked, suggesting the greater importance of acquiring knowledge and experience in dealing
with these countries. We find that prior import or export experience substantially increases the
likelihood of subsequent export or import to or from that market. The share of firms making the
transition is smaller than for nearby markets. However, the importance of prior market experience is
greater for those more distant markets. For the most popular EU trading partners, importers
(exporters) are 5 times more likely to start exporting (importing) to (from) the same country than
non-traders. For countries outside the EU, importers are 8 times more likely to start exporting than
non-traders; and exporters are 9 times more likely to start importing from the same market thannon-traders, providing support for hypothesis 6.
One remarkable result is the share of firms only exporting to China in 1998 that had started
importing from this country by 2005 (Table 25 in appendix). More than one out of four SMEs that
only exported to China in 1998 started importing before 2005, suggesting that the export experience
in this market enabled these firms to discover opportunities for sourcing from China.
Table 20: Transition from import to export
import to
export
other country
trade to
export
other country
trade to export
no trade
to export
no trade
to exportmain EU trading partners 0.1713 0.0950 0.0763 0.0345 0.1368
(SE) (.010) (.009 ) (.004 ) (.003) (.007)
t 21.40*** 19.01***
non-EU trading partners 0.124 0.041 0.083 0.018 0.106
(SE) (.014) (.006) (.009) ( .002) (.012)
t 9.3784*** 9.192***
paired t test; *** p<.01
8/10/2019 Internationalization Strategy and Performance of SME
http://slidepdf.com/reader/full/internationalization-strategy-and-performance-of-sme 30/47
28
Table 21: Transition from export to import
export to
import
other country
trade to
export
other country
trade to export
no trade
to import
no trade
to import
main EU trading partners 0.265 0.123 0.143 0.051 0.215
(SE) (.012) (.012) (.006) (.005) (.008)t 23.68*** 26.48***
non-EU trading partners 0.132 0.039 0.094 0.018 0.115
(SE) (.020) (.007) ( .013) (.003) (.016)
t 7.43*** 7.01***
paired t test; *** p<.01
In sum, knowledge about a particular market turns out to be an important factor in the decision to
start trading, whether it is through import or export.
8/10/2019 Internationalization Strategy and Performance of SME
http://slidepdf.com/reader/full/internationalization-strategy-and-performance-of-sme 31/47
29
Discussion and conclusion
Even though international trade remains strongly concentrated among a small number of large
firms, the evidence in this paper pointed at the importance and dynamics of SMEs in international
trade. First, SMEs dominate trade in services, a sector that is increasingly contributing to
international trade. Second, newly internationalizing SMEs contributed to a very significant part ofnew exports in the period 1998-2005. International SMEs were also found as contributing positively
to employment creation, in contrast with the international large firms, which saw employment
decrease by 15% over the analyzed time period 1998 to 2005. This evidence corroborates earlier
findings of Mayer and Ottaviano (2007), who found the extensive margin, i.e. new exporting firms,
to be important in the creation of new trade for several countries in Europe.
More importantly, the evidence presented in this paper suggests that there are significant
differences among SMEs in the strategic orientation towards international expansion and the
emanating internationalization process. Taking timing and initial scope of export operations as
distinguishing features of the internationalization strategies of SMEs, we found marked differences
among those SMEs that go for a rapid and global internationalization, the so called born globalsversus the more traditional internationalizers, which start later and only move gradually from
expanding to one country after the other. The born globals are not a marginal phenomenon. They
accounted for about 21% of all firms that started exporting between 1998 and 2005. Their share in
the total extra trade that was created between 1998 and 2005, our observation period, was equal to
27% of all export growth.
If we include the born internationals which also start to internationalize soon after their creation,
but with a smaller geographical scope, the shares of rapid internationalizers goes up to 51% of all
firms that start to export in the period and 30% of all extra export that was created in that period. In
relating the type of internationalizing SME to industry environment, we observed born globals,
followed by born internationals to occur significantly more in global and high technology industriesthan traditional internationalizers.
We also find strong evidence of differences in initial commitment and export growth performance
among the different types of internationalizing SMEs. Consistent with passive learning models, we
find surviving born globals to grow faster than traditional internationalizers. We also find a
substantial difference in the initial commitment of both types of firms. While born globals at the
outset show a significantly higher commitment as illustrated by the much higher average export per
product and per country than the one observed for traditional internationalizers, the lower
commitment of traditional internationalizers goes together with a lower strategic intent to expand
into international markets. We found interesting evidence that, controlling for initial commitment,
the probability of traditional internationalizes to stop exporting is substantially higher than the one
observed for born globals. This evidence suggests that born globals see the relevant market on
which they need to compete and operate much larger than the traditional internationalizers, which
more easily revert to the domestic market. Born globals are also characterized by a substantially
higher R&D intensity and intangible asset intensity in the industries in which they are active,
suggesting that born globals are focused niche players in high value segments of the industry.
Interestingly, born global firms are also typically characterized by a high import intensity, implying
that they are not only selling their products to a wide set of markets, but are also substantially
sourcing products and services from abroad. This evidence suggests that born global firms are often
key actors in global supply chains, and develop their competitive advantage in the interaction in
global networks. Supporting evidence in this regard is the marked increase in productivity following
their increased participation in international markets after a couple of years of existence.
8/10/2019 Internationalization Strategy and Performance of SME
http://slidepdf.com/reader/full/internationalization-strategy-and-performance-of-sme 32/47
30
The importance of becoming better inserted in global supply chains became also evident when we
analyzed how the transition from exporting into sourcing abroad helps firms to significantly improve
their productivity and chance of survival, corroborating earlier evidence on the survival of Belgian
firms in industries exposed to strong international competition (Coucke and Sleuwaegen, 2008).
In examining the dynamics of trade among SMEs we found that the probability to start importing
from a country if the firm was already exporting to the country was about 4 to 8 times higher than
the same propensity for trading SMEs without prior export experience in that country. The
difference was most marked for institutionally and geographically distant countries. Also in the other
direction SMEs that were sourcing from a particular country were much more likely to export to the
same country in the short time interval 1998-2005.
Overall, we believe that our results contribute to a better understanding of the relation between
firm heterogeneity and trade performance and provide original insights in the different types of
internationalizing SMEs. Such findings add to a recently developing body of international business
research, looking at the implications of increasing global competition on firm strategy (Coucke and
Sleuwaegen, 2008; Bowen and Wiersema, 2008; Hutzschenreuter and Gröne, 2009).
We also believe that the body of evidence we present in this paper has strong implications for public
policies and trade promoting agencies. First, SMEs should receive more attention in policies and
instruments aiming to develop trade with foreign countries, especially SMEs that never considered
trade to these countries before. Second, in view of the different strategic types of internationalizing
SMEs, policies and instruments should be differentiated following the different needs of those
distinguished SMEs. A born global firm will need more assistance in mitigating the liability of
foreignness in the different countries where it simultaneously penetrates. Given that many of those
countries are institutionally very different from home and that those firms typically operate in
industries characterized by important intellectual property and regulatory issues, economicdiplomacy will be key to support those firms. For traditional internationalizers, the support should
be directed towards building increasing strategic thrust and commitment through providing
assistance and information in preparing firms to start exporting to a particular country. These SMEs
would also befit from assistance in the development of the necessary competencies to expand
abroad.
Third, globalization of industries and development of global supply chains provides many
opportunities for SMEs to quickly internationalize and benefit from being linked to productive
networks organized across borders. Instead of trying to freeze activities locally, policies should be
directed towards facilitating the offshoring of activities and the sourcing of goods and services by
SMEs from international partners. This approach will not only improve productivity and growthpotential of the firm; it will also help firms to expand internationally.
Finally, it is fair to mention some limitations of his study. First, this study focused on quantitative
measurements and completely ignored the qualitative dimensions related to management and
organization of internationalizing firms. We therefore recommend in depth case studies to shed
additional light on the development process itself. Second, our study was limited to the Belgian case.
Belgium, together with Singapore and Ireland, is one of the most open economies in the world.
Many SMEs have been exposed to this reality for a longer time than firms in other countries,
implying that some of our findings about the significance and incidence of born global firms may not
fully carry over to other countries. An extension of our analysis to a broad set of countries is
recommended to provide further evidence.
8/10/2019 Internationalization Strategy and Performance of SME
http://slidepdf.com/reader/full/internationalization-strategy-and-performance-of-sme 33/47
31
APPENDIX
1. Data and definitions
SME
In collaboration with the National Bank of Belgium (NBB), we constructed a comprehensive datasetlinking firm level trade data to annual accounts data. All non-financial firms incorporated in Belgium
with at least 10 FTE employees (at least one year between 1998 and 2005) were included in the
dataset. SMEs were selected using the employment criterion of the Eurostat definition: firms with
fewer than 250 FTE employees. However, we did not impose any restrictions in terms of Turnover or
Balance sheet total. We distinguished between small firms (<50 FTE), medium sized firms (50-249
FTE) and large firms (>= 250 FTE). The final dataset contains 35,240 SMEs and 1,009 large firms,
across all industries.
Trade
Throughout the paper, trade, import and export refer to trade of goods only. Firm-level data on
trade of goods are available per product (4-digit CN4) and country. The dataset contains trade datafrom 1998 until 2005 for 1,279 products and 249 countries. Export dummies for the 1993-1997
period were added indicating if firms had export activities before 1998.
For firms importing or exporting outside the EU (Extrastat), customs data are collected for all
transactions whose value is higher than 1,000 euro or whose weight is bigger than 1,000 Kg.
Coverage of extra-EU trade in the dataset is more comprehensive than that of intra-EU trade, which
has higher thresholds. For intra-EU trade, firms have to participate in the Intrastat inquiry if their
import or export exceeds 250,000 euro a year. This threshold remained unchanged between 1998
and 2005. Between 1995 and 1997, the threshold was 104,115 euro a year. This lower threshold for
intra-EU trade, combined with the low threshold for extra-EU trade, implies that the export
dummies for 1993-1997 are a good proxy to check if firms had any export before 1998.
As a result of the 2004 EU enlargement, trade to the eight new member states was no longer subject
to the Extrastat declaration. Consequently, a number of SMEs exporting to or importing from these
countries did no longer had to report this trade as of 2005, if it did not exceed the threshold of
250,000 euro.
Typology of internationalization strategies
We classify firms according to the timing and scope of their initial export. To analyze when firms
start exporting, and to how many markets, we focus on those firms that started exporting in the
period covered in the dataset, i.e. 1998-2005. This sample includes recently established firms (1993
or later) and firms that reported their first export activity in the 1998-2005 period, but were
established before 1993. To control if firms had no prior export activities, we checked if any exports
were reported between 1993 and 1997.
Literature on international new ventures or born globals lacks a consensus on how to define these
firms. Several definitions have been proposed, but no single definition is generally accepted. Some
authors (e.g. McDougall, Oviatt and Schrader, 2003) allow up to six years after inception for firms to
record their first international sales, whereas others (e.g. Madsen, Rasmussen and Servais, 2000)
restrict this to three years. According to Fernhaber, Gilbert and McDougall (2008, p. 272) “the
operational definition of a new venture within the entrepreneurship literature is up to 6 or 8 years of
age.” Export scope is often measured as a percentage of export in total sales, or in terms of number
of export destinations. Some authors use a combined measure of export share and number of
destinations. Taking the extant literature and the idiosyncrasies of the Belgian context into account,
8/10/2019 Internationalization Strategy and Performance of SME
http://slidepdf.com/reader/full/internationalization-strategy-and-performance-of-sme 34/47
32
we define early internationalization as export within five years after inception, and a global scope as
export to at least 5 countries, one of which outside the European Union. Consequently, late
internationalization refers to starting to export after more than five years, and a narrow scope is
export to less than five countries. A sensitivity analysis revealed that changing the cut-off in terms of
export markets has only a limited impact, as long as the extra-EU criterion is imposed. Changing the
cut-off for firm age to three or six years did not substantially change the distribution of SMEs acrossthese different types.
Hence, born globals (BG) are SMEs that started exporting within five years, to at least five countries,
including one outside the EU.
Born internationals (BI) are SMEs that started exporting within five years, to fewer than five
countries.
Traditional internationalizers (TI) are SMEs that started exporting after more than five years, to less
than five countries.
Born-again globals (BAG) are SMEs that started exporting after more than five years, to at least five
countries, including one outside the EU.
Nevertheless, these definitions entail some limitations. A small number of newly established SMEs
(56 firms) that started exporting between 1998 and 2005 do not fit these categories. These firms
started exporting to at least five countries (six on average) within five years, but their geographical
scope was limited to the EU. Given the data at hand, we cannot ascertain that firms established
before 1993, that started to export between 1998 and 2005 (i.e. traditional internationalizers and
born-again globals) never exported before 1993. However, since they did not export between 1993
and 1997, one could assume the subsequent decision to start exporting in 1998 or later is a strategic
decision unrelated to any export that may have taken place before 1993.
Data
Table 22: Descriptive statistics of variables
Variable Description Obs Mean Std. Dev.
ln_FTE98 Log FTE employees 1998 29,455 2.795624 0.9908205
ln_FTE05 Log FTE employees 2005 28,686 2.95564 0.949165
ln_VA98 Log Value added 1998 29,675 13.44359 1.274292
ln_VA05 Log Value added 2005 29,214 13.78925 1.246625
ln_prod_98 Log Value added/FTE1998 29,111 10.7022 0.6414989
ln_prod_05 Log Value added/FTE2005 28,334 10.89655 0.6438599
ln_FA98 Log Fixed assets 1998 29,559 12.49588 1.736948
ln_FA05 Log Fixed assets 2005 28,793 12.67776 1.825042
ln_FA_FTE98 Log Fixed assets/FTE 1998 28,988 9.731069 1.512899
ln_FA_FTE05 Log Fixed assets/FTE 2005 27,931 9.722847 1.623016
ln_IA98 Log Intangible assets 1998 7,916 9.933387 2.189313
ln_IA05 Log Intangible assets 2005 9,681 10.09066 2.300117
ln_IA_FTE98 Log Intangible assets/FTE 1998 7,837 6.962135 2.167422
ln_IA_FTE05 Log Intangible assets/FTE 2005 9,608 6.872226 2.190229
ln_RD98 Log R&D 1998 1,169 11.74191 1.953963
ln_RD05 Log R&D 2005 1,235 11.80546 2.135745
ln_RD_FTE98 Log R&D/FTE 1998 1,165 7.943239 1.965647
ln_RD_FTE05 Log R&D/FTE 2005 1,226 8.044165 2.1055ln_M_FTE98 Log Import/FTE 1998 10,354 10.23584 2.34652

8/10/2019 Internationalization Strategy and Performance of SME
http://slidepdf.com/reader/full/internationalization-strategy-and-performance-of-sme 35/47
33
ln_X98 Log export 1998 9,373 12.88446 2.892446
ln_X05 Log export 2005 8,974 13.13262 2.927103
TFP98 Log Total Factor productivity 1998 28,670 9.064988 0.5877397
avg_ln_X05-ln_X98 Log Average export growth 1998-2005 5,999 0.0470398 0.29339
ln_M_TO98 Log Import / turnover 1998 7,432 -2.102499 2.117547
ln_M_TO05 Log Import / turnover 2005 6,782 -2.185875 2.211695
ln_Np98 Log Number of export products 1998 9,373 1.404672 1.179461
ln_Np05 Log Number of export products 2005 8,974 1.493868 1.231677
ln_Nc98 Log Number of export countries 1998 9,373 1.474791 1.118719
ln_Nc05 Log Number of export countries 2005 8,974 1.588056 1.165463

8/10/2019 Internationalization Strategy and Performance of SME
http://slidepdf.com/reader/full/internationalization-strategy-and-performance-of-sme 36/47
T a b l e 2 3 : C h a n g e i n n u m b e r o f e
x p o r t m a r k e t s ( 1 9 9 8 - 2 0 0 5 )
# S M E s
# e x p o r t m a r k e t s 2 0 0 5
# e x p o r t m a r k e t s 1 9 9 8
0
1
2
3
4
5
6 - 1 0
1 1 - 2 5
2 6 - 5 0
> 5 0
t o t a
l
1
5 , 5
3 3
1 , 0 3 3
3 6 5
1 8 2
1 2 7
8 2
1 9 0
9 9
9
2
7 , 6
2 2
2
1 , 6
5 9
4 2 4
2 8 9
1 6 6
1 1 7
8 4
1 3 2
7 4
1 3
1
2 , 9
5 9
3
9 3 7
1 8 2
1 6 0
1 6 2
1 1 0
8 4
1 4 1
5 3
7
1
1 , 8
3 7
4
6 4 6
1 2 4
1 0 1
1 2 4
1 3 0
9 3
2 0 6
6 3
9
0
1 , 4
9 6
5
4 4 8
4 7
6 7
7 0
8 5
8 6
2 1 2
7 3
5
0
1 , 0
9 3
6 - 1 0
9 8 3
1 2 3
1 2 1
9 3
1 5 4
1 7 4
7 5 5
5 1 9
3 2
0
1 , 9
7 1
1 1 - 2 5
5 7 9
4 4
3 9
2 6
4 0
2 9
2 6 8
8 9 4
2 5 0
8
2 , 1
7 7
2 6 - 5 0
1 2 6
7
5
4
1
3
1 1
7 5
2 4 0
7 2
5
4 4
> 5 0
3 1
2
0
0
0
0
0
3
1 3
4 7
9 6
t o t a l
9 , 9 5 9
1 , 9 8 6
1 , 1 4 7
8 2 7
7 6 4
6 3 5
1 , 9 1 5
1 , 8 5 3
5 7 8
1 3 1
1 9 , 7
9 5
# S M E s
# e x p o r t m a r k e t s 2 0 0 5
# e x p o r t m a r k e t s 1 9 9 8
0
1
2
3
4
5
6 - 1 0
1 1 - 2 5
2 6 - 5 0
> 5 0
t o t a
l
1
7 3 %
1 4 %
5 %
2 %
2 %
1 %
2 %
1 %
0 %
0 %
1 0 0 %
2
5 6 %
1 4 %
1 0 %
6 %
4 %
3 %
4 %
3 %
0 %
0 %
1 0 0 %
3
5 1 %
1 0 %
9 %
9 %
6 %
5 %
8 %
3 %
0 %
0 %
1 0 0 %
4
4 3 %
8 %
7 %
8 %
9 %
6 %
1 4 %
4 %
1 %
0 %
1 0 0 %
5
4 1 %
4 %
6 %
6 %
8 %
8 %
1 9 %
7 %
0 %
0 %
1 0 0 %
6 - 1 0
5 0 %
6 %
6 %
5 %
8 %
9 %
3 8 %
2 6 %
2 %
0 %
1 0 0 %
1 1 - 2 5
2 7 %
2 %
2 %
1 %
2 %
1 %
1 2 %
4 1 %
1 1 %
0 %
1 0 0 %
2 6 - 5 0
2 3 %
1 %
1 %
1 %
0 %
1 %
2 %
1 4 %
4 4 %
1 3 %
1 0 0 %
> 5 0
3 2 %
2 %
0 %
0 %
0 %
0 %
0 %
3 %
1 4 %
4 9 %
1 0 0 %
t o t a l
5 0 %
1 0 %
6 %
4 %
4 %
3 %
1 0 %
9 %
3 %
1 %
1 0 0 %
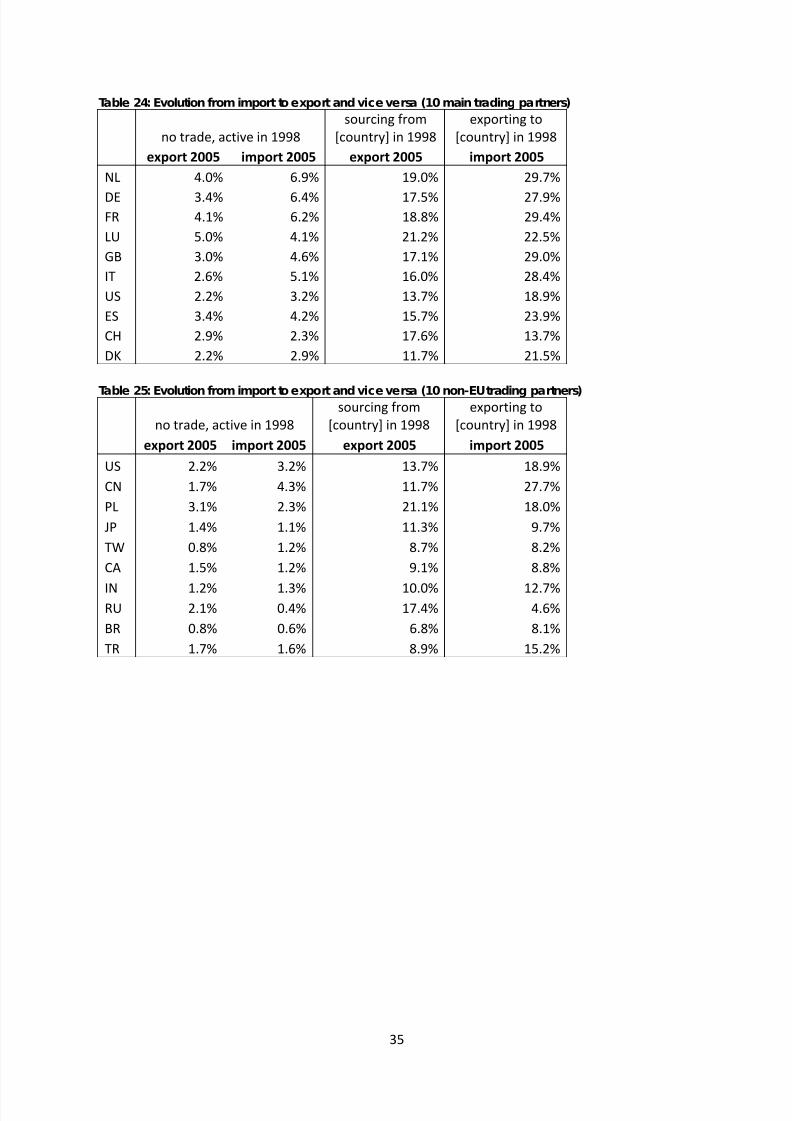
8/10/2019 Internationalization Strategy and Performance of SME
http://slidepdf.com/reader/full/internationalization-strategy-and-performance-of-sme 37/47
35
Table 24: Evolution from import to export and vice versa (10 main trading partners)
no trade, active in 1998
sourcing from
[country] in 1998
exporting to
[country] in 1998
export 2005 import 2005 export 2005 import 2005
NL 4.0% 6.9% 19.0% 29.7%
DE 3.4% 6.4% 17.5% 27.9%FR 4.1% 6.2% 18.8% 29.4%
LU 5.0% 4.1% 21.2% 22.5%
GB 3.0% 4.6% 17.1% 29.0%
IT 2.6% 5.1% 16.0% 28.4%
US 2.2% 3.2% 13.7% 18.9%
ES 3.4% 4.2% 15.7% 23.9%
CH 2.9% 2.3% 17.6% 13.7%
DK 2.2% 2.9% 11.7% 21.5%
Table 25: Evolution from import to export and vice versa (10 non-EU trading partners)
no trade, active in 1998
sourcing from
[country] in 1998
exporting to
[country] in 1998
export 2005 import 2005 export 2005 import 2005
US 2.2% 3.2% 13.7% 18.9%
CN 1.7% 4.3% 11.7% 27.7%
PL 3.1% 2.3% 21.1% 18.0%
JP 1.4% 1.1% 11.3% 9.7%
TW 0.8% 1.2% 8.7% 8.2%
CA 1.5% 1.2% 9.1% 8.8%
IN 1.2% 1.3% 10.0% 12.7%RU 2.1% 0.4% 17.4% 4.6%
BR 0.8% 0.6% 6.8% 8.1%
TR 1.7% 1.6% 8.9% 15.2%
8/10/2019 Internationalization Strategy and Performance of SME
http://slidepdf.com/reader/full/internationalization-strategy-and-performance-of-sme 38/47
36
References
Aaby, N.-E., Slater, S.F. (1989), Management Influences on Export Performance: A Review of the Empirical Literature
1978-88, International Marketing Review, 6 (4), 7-26.
Acs, Z.J., Morck, R., Shaver, J.M. and Yeung, B. (1997), The Internationalization of Small and Medium-Sized
Enterprises: A Policy Perspective, Small Business Economics, 9(1), 7-20.
Autio, E. (2005), Creative tension: the significance of Ben Oviatt’s and Patricia McDougall’s article ‘toward a theory of
international new ventures’, Journal of International Business Studies, 36, 9-19.
Bell, J., McNaughton, R., Young, S. (2001), ‘Born-again global’ firms. An extension to the ‘born global’ phenomenon,
Journal of International Management, 7, 173-189.
Bernard, A.B., Jensen, J.B. (1999), Exceptional exporter performance: cause, effect, or both?, Journal of International
Economics, 47, 1–25.
Bernard, A.B., Jensen, J.B. (2001), Why some firms export, NBER Working Paper No. W8349, Washington, US.
Bernard, A.B., Eaton, J., Jensen, J.B., Kortum, S.S., (2003), Plants and Productivity in International Trade, American
Economic Review 93 (4), 1268-1290.
Bernard, A.B., Jensen, J.B., Schott, P. K., (2006a), Trade costs, Firms and Productivity. Journal of Monetary Economics
53 (5), 917-937.
Bernard, A. B., Jensen, J. B., Redding, S. J., Schott, P. K. (2007). Firms in international trade. Journal of Economic
Perspectives, 21(3):105-130.
Bowen, H. P., Wiersema, M. (2008), Corporate diversification: the impact of foreign competition, industry
globalization, and product diversification, Strategic Management Journal, 29 (2), 115 – 132.
Calvo, J., (2006), Testing Gibrat's Law for Small, Young and Innovating Firms, Small Business Economics, 26, 117-123.
Caves, R., (1998), Industrial organisation and new findings on the turnover and mobility of firms, Journal of Economic
Literature, 36, 1947-1982.
Coad, A., (2009), The Growth of Firms: a Survey of Theories and Empirical Evidence, Edward Elgar, Cheltenham, UK
and Northampton, MA, USA.
Constantini, J.A., Melitz, M.J. (2007) The Dynamics of Firm-Level Adjustment to Trade Liberalization, mimeo.
Coucke, K., Sleuwaegen, L. (2008), Offshoring as a survival strategy: evidence from manufacturing firms in Belgium,
Journal of International Business Studies, 39 (8), 1261-1277.
Coviello, N.E., Jones, M.V. (2004), Methodological Issues in International Entrepreneurship Research, Journal ofBusiness Venturing, 19 (4), 485-508.
De Loecker, J. (2007), Do Exports Generate Higher Productivity? Evidence from Slovenia, Journal of International
Economics, 73 (1), 69-98.
Dollar, D., Kraay, A. (2002), Institutions, Trade, and Growth, Journal of Monetary Economics. 50: 133-162.
Dunne, P., Hughes, A., (1994), Age, size, growth and survival: UK companies in the 1980s, The Journal of Industrial
Economics, 42, 115-140.
Eaton, J., Kortum, S., Kramarz, F. (2004), Dissecting trade: firms, industries, and export destinations, American
Economic Review Papers and Proceedings, 94, 150–154.

8/10/2019 Internationalization Strategy and Performance of SME
http://slidepdf.com/reader/full/internationalization-strategy-and-performance-of-sme 39/47
37
Evans, D. E., (1987), The relationship between firm growth, size and age: estimates for 100 manufacturing industries,
The Journal of Industrial Economics, 35, 567-582.
Francois, J, Manchin, M. (2006), Institutional Quality, Infrastructure, and the Propensity to Export, CEPR, London.
Fernhaber, S.A., McDougall, P.P., Oviatt, B.M. (2007), Exploring the Role of Industry Structure in New Venture
Internationalization, Entrepreneurship Theory and Practice, 517-542.
Heckman, J. (1979), Sample Selection Bias as a Specification error, Econometrica, 47: 153-161.
Hutzschenreuter, T., Gröne, F. (2009), Product and geographic scope changes of multinational enterprises in
response to international competition, Journal of International Business Studies, 40 (7), 1149-1170.
Johanson, J., Vahlne, J.E. (1977), The internationalization process of the firm: A model of knowledge development
and increasing foreign market commitments, Journal of International Business Studies, 8, 23-32.
Jovanovic, B., (1982), Selection and the Evolution of Industry, Econometrica, 50(3), 649-670.
Kalish, S., Mahajan, V., Muller, E. (1995), Waterfall and sprinkler new-product strategies in competitive global
markets. International Journal of Research in Marketing, 12 (2), 105-119.
Lu, J.W., Beamish, P.W. (2001), The Internationalization and Performance of SMEs, Strategic Management Journal,
22 (6/7), 565-586.
Lu, J.W., Beamish, P.W. (2006), SME internationalization and performance: Growth vs. profitability, Journal of
International Entrepreneurship, 4, 27-48.
Madsen, T.K., Rasmussen, E., Servais, P. (2000), Differences and similarities between born globals and other types of
exporters, in Globalization, the Multinational Firm, and Emerging Economies, pages 247-265, JAI Press: Amsterdam.
Manolova, T.S., Manev, I. M. (2004) Internationalization and the performance of the small firm: A review of the
empirical literature 1996-2000, in Emerging Paradigms in International Entrepreneurship, pages 37-63, Edward Elgar,
Cheltenham, UK.
Mascarenhas, B. (1997), The order and size of entry into international markets, Journal of Business Venturing, 12 (4),
287-299.
Mayer, T., Ottaviano, G.I.P. (2007), The Happy Few: The internationalisation of European firms New facts based on
firm-level evidence, Bruegel Blueprint Series, Brussels, 95pp.
McDougall, P.P., Oviatt, B.M., Shrader, R.C. (2003), A comparison of international and domestic new ventures,
Journal of International Entrepreneurship 1 (1), 59–82.
Melitz, M.J. (2003), The Impact of Trade on Intra-Industry Reallocations and Aggregate Industry Productivity,
Econometrica, 71 (6), 1695-1725.
Melitz, M., Ottaviano. G. (2008) Market Size, Trade, and Productivity, Review of Economic Studies.
Mudambi, R., Zahra, S.A. (2007), The survival of international new ventures, Journal of International Business
Studies, 38, 333–352.
Muûls, M., Pisu, M. (2007), Imports and Exports at the Level of the Firm: Evidence from Belgium, Working Paper,
National Bank of Belgium, Brussels, 57pp.
OECD (2000), Small and Medium Sized Enterprises: Local Strength, Global Reach, Organisation for Economic Co-
operation and Development, 8pp.
OECD (2007), Working Party on SMEs and Entrepreneurship – Internationalisation of SMEs: Preliminary Project Plan,Organisation for Economic Co-operation and Development, 10 pp.
8/10/2019 Internationalization Strategy and Performance of SME
http://slidepdf.com/reader/full/internationalization-strategy-and-performance-of-sme 40/47
38
Onkelinx, J., Sleuwaegen, L. (2008), Internationalization of SMEs, Flanders DC and Vlerick Leuven Gent Management
School , 87pp.
Oviatt, B.M., McDougall, P.P. (1994), Toward a Theory of International New Ventures, Journal of International
Business Studies, 25(1) 45-62.
Sapienza, H.J., Autio, E., George, G., Zahra, S.A. (2006), A capabilities Perspective on the Effects of EarlyInternationalization on Firm Survival and Growth, Academy of Management Review , 31 (4), 914-933.
Sousa, C.M.P., Bradley, F. (2005), Global Markets: Does Psychic Distance Matter?, Journal of Strategic Marketing, 13
(1), 43–59.
U.S. Department of Commerce (2005), Small and Medium-Sized Exporting Companies: A Statistical Handbook, Office
of Trade and Industry Information, International Trade Administration, U.S. Department of Commerce, 67pp.
Variyam, J.N., Kraybill, D.S., (1992), Empirical evidence on determinants of firm growth, Economics Letters, 38, 31-36.
Wagner, J. (2005), Exports and Productivity: A Survey of the Evidence from Firm Level Data, University of Lüneburg
Working Paper Series in Economics, 30pp.
Yasuda, T. (2005), Firm growth, size, age and behavior in Japanese manufacturing, Small Business Economics, 24, 1-
15.
Zahra, S.A., George, G. (2002), International entrepreneurship: The current status of the field and future research
agenda. In M.A. Hitt, R.D. Ireland, S.M. Camp, & D.L. Sexton (Eds), Strategic entrepreneurship: Creating a new
mindset (pp. 255-288). Oxford, UK: Blackwell Publishers.
Zahra, S. (2005), A theory of international new ventures: a decade of research, Journal of International Business
Studies, 36, 20-28.
Zou, S., Stan. S. (1998), The determinants of export performance: A review of the empirical literature between 1987
and 1997, International Marketing Review, 15 (5):333–356.
8/10/2019 Internationalization Strategy and Performance of SME
http://slidepdf.com/reader/full/internationalization-strategy-and-performance-of-sme 41/47
NBB WORKING PAPER No. 197 - OCTOBER 2010 39
NATIONAL BANK OF BELGIUM - WORKING PAPERS SERIES
1. "Model-based inflation forecasts and monetary policy rules", by M. Dombrecht and R. Wouters, Research
Series, February 2000.
2. "The use of robust estimators as measures of core inflation", by L. Aucremanne, Research Series,February 2000.
3. "Performances économiques des Etats-Unis dans les années nonante", by A. Nyssens, P. Butzen andP. Bisciari, Document Series, March 2000.
4. "A model with explicit expectations for Belgium", by P. Jeanfils, Research Series, March 2000.
5. "Growth in an open economy: Some recent developments", by S. Turnovsky, Research Series, May2000.
6. "Knowledge, technology and economic growth: An OECD perspective", by I. Visco, A. Bassanini andS. Scarpetta, Research Series, May 2000.
7. "Fiscal policy and growth in the context of European integration", by P. Masson, Research Series, May2000.
8. "Economic growth and the labour market: Europe's challenge", by C. Wyplosz, Research Series, May2000.
9. "The role of the exchange rate in economic growth: A euro-zone perspective", by R. MacDonald,
Research Series, May 2000.10. "Monetary union and economic growth", by J. Vickers, Research Series, May 2000.
11. "Politique monétaire et prix des actifs: le cas des États-Unis", by Q. Wibaut, Document Series, August2000.
12. "The Belgian industrial confidence indicator: Leading indicator of economic activity in the euro area?", byJ.-J. Vanhaelen, L. Dresse and J. De Mulder, Document Series, November 2000.
13. "Le financement des entreprises par capital-risque", by C. Rigo, Document Series, February 2001.
14. "La nouvelle économie" by P. Bisciari, Document Series, March 2001.
15. "De kostprijs van bankkredieten", by A. Bruggeman and R. Wouters, Document Series, April 2001.
16. "A guided tour of the world of rational expectations models and optimal policies", by Ph. Jeanfils,Research Series, May 2001.
17. "Attractive prices and euro - Rounding effects on inflation", by L. Aucremanne and D. Cornille,Documents Series
, November 2001.18. "The interest rate and credit channels in Belgium: An investigation with micro-level firm data", byP. Butzen, C. Fuss and Ph. Vermeulen, Research series, December 2001.
19. "Openness, imperfect exchange rate pass-through and monetary policy", by F. Smets and R. Wouters,Research series, March 2002.
20. "Inflation, relative prices and nominal rigidities", by L. Aucremanne, G. Brys, M. Hubert, P. J. Rousseeuwand A. Struyf, Research series, April 2002.
21. "Lifting the burden: Fundamental tax reform and economic growth", by D. Jorgenson, Research series,May 2002.
22. "What do we know about investment under uncertainty?", by L. Trigeorgis, Research series, May 2002.
23. "Investment, uncertainty and irreversibility: Evidence from Belgian accounting data" by D. Cassimon,P.-J. Engelen, H. Meersman and M. Van Wouwe, Research series, May 2002.
24. "The impact of uncertainty on investment plans", by P. Butzen, C. Fuss and Ph. Vermeulen, Research
series, May 2002.25. "Investment, protection, ownership, and the cost of capital", by Ch. P. Himmelberg, R. G. Hubbard and
I. Love, Research series, May 2002.
26. "Finance, uncertainty and investment: Assessing the gains and losses of a generalised non-linearstructural approach using Belgian panel data", by M. Gérard and F. Verschueren, Research series, May2002.
27. "Capital structure, firm liquidity and growth", by R. Anderson, Research series, May 2002.
28. "Structural modelling of investment and financial constraints: Where do we stand?", by J.-B. Chatelain,Research series, May 2002.
29. "Financing and investment interdependencies in unquoted Belgian companies: The role of venturecapital", by S. Manigart, K. Baeyens, I. Verschueren, Research series, May 2002.
30. "Development path and capital structure of Belgian biotechnology firms", by V. Bastin, A. Corhay,
G. Hübner and P.-A. Michel, Research series, May 2002.31. "Governance as a source of managerial discipline", by J. Franks, Research series, May 2002.
32. "Financing constraints, fixed capital and R&D investment decisions of Belgian firms", by M. Cincera,Research series, May 2002.

8/10/2019 Internationalization Strategy and Performance of SME
http://slidepdf.com/reader/full/internationalization-strategy-and-performance-of-sme 42/47
NBB WORKING PAPER No. 197 - OCTOBER 2010 40
33. "Investment, R&D and liquidity constraints: A corporate governance approach to the Belgian evidence",by P. Van Cayseele, Research series, May 2002.
34. "On the origins of the Franco-German EMU controversies", by I. Maes, Research series, July 2002.
35. "An estimated dynamic stochastic general equilibrium model of the euro area", by F. Smets andR. Wouters, Research series, October 2002.
36. "The labour market and fiscal impact of labour tax reductions: The case of reduction of employers' social
security contributions under a wage norm regime with automatic price indexing of wages", byK. Burggraeve and Ph. Du Caju, Research series, March 2003.
37. "Scope of asymmetries in the euro area", by S. Ide and Ph. Moës, Document series, March 2003.
38. "De autonijverheid in België: Het belang van het toeleveringsnetwerk rond de assemblage vanpersonenauto's", by F. Coppens and G. van Gastel, Document series, June 2003.
39. "La consommation privée en Belgique", by B. Eugène, Ph. Jeanfils and B. Robert, Document series,June 2003.
40. "The process of European monetary integration: A comparison of the Belgian and Italian approaches", byI. Maes and L. Quaglia, Research series, August 2003.
41. "Stock market valuation in the United States", by P. Bisciari, A. Durré and A. Nyssens, Document series,November 2003.
42. "Modeling the term structure of interest rates: Where do we stand?", by K. Maes, Research series,February 2004.
43. "Interbank exposures: An ampirical examination of system risk in the Belgian banking system", byH. Degryse and G. Nguyen, Research series, March 2004.
44. "How frequently do prices change? Evidence based on the micro data underlying the Belgian CPI", byL. Aucremanne and E. Dhyne, Research series, April 2004.
45. "Firms' investment decisions in response to demand and price uncertainty", by C. Fuss andPh. Vermeulen, Research series, April 2004.
46. "SMEs and bank lending relationships: The impact of mergers", by H. Degryse, N. Masschelein andJ. Mitchell, Research series, May 2004.
47. "The determinants of pass-through of market conditions to bank retail interest rates in Belgium", byF. De Graeve, O. De Jonghe and R. Vander Vennet, Research series, May 2004.
48. "Sectoral vs. country diversification benefits and downside risk", by M. Emiris, Research series,May 2004.
49. "How does liquidity react to stress periods in a limit order market?", by H. Beltran, A. Durré and P. Giot,Research series, May 2004.
50. "Financial consolidation and liquidity: Prudential regulation and/or competition policy?", byP. Van Cayseele, Research series, May 2004.
51. "Basel II and operational risk: Implications for risk measurement and management in the financialsector", by A. Chapelle, Y. Crama, G. Hübner and J.-P. Peters, Research series, May 2004.
52. "The efficiency and stability of banks and markets", by F. Allen, Research series, May 2004.
53. "Does financial liberalization spur growth?", by G. Bekaert, C.R. Harvey and C. Lundblad, Research
series, May 2004.
54. "Regulating financial conglomerates", by X. Freixas, G. Lóránth, A.D. Morrison and H.S. Shin, Research
series, May 2004.
55. "Liquidity and financial market stability", by M. O'Hara, Research series, May 2004.
56. "Economisch belang van de Vlaamse zeehavens: Verslag 2002", by F. Lagneaux,Document series
,June 2004.
57. "Determinants of euro term structure of credit spreads", by A. Van Landschoot, Research series, July2004.
58. "Macroeconomic and monetary policy-making at the European Commission, from the Rome Treaties tothe Hague Summit", by I. Maes, Research series, July 2004.
59. "Liberalisation of network industries: Is electricity an exception to the rule?", by F. Coppens and D. Vivet,Document series, September 2004.
60. "Forecasting with a Bayesian DSGE model: An application to the euro area", by F. Smets andR. Wouters, Research series, September 2004.
61. "Comparing shocks and frictions in US and euro area business cycle: A Bayesian DSGE approach", byF. Smets and R. Wouters, Research series, October 2004.
62. "Voting on pensions: A survey", by G. de Walque, Research series, October 2004.
63. "Asymmetric growth and inflation developments in the acceding countries: A new assessment", by S. Ideand P. Moës, Research series, October 2004.
64. "Importance économique du Port Autonome de Liège: rapport 2002", by F. Lagneaux, Document series,November 2004.
8/10/2019 Internationalization Strategy and Performance of SME
http://slidepdf.com/reader/full/internationalization-strategy-and-performance-of-sme 43/47
NBB WORKING PAPER No. 197 - OCTOBER 2010 41
65. "Price-setting behaviour in Belgium: What can be learned from an ad hoc survey", by L. Aucremanne andM. Druant, Research series, March 2005.
66. "Time-dependent versus state-dependent pricing: A panel data approach to the determinants of Belgianconsumer price changes", by L. Aucremanne and E. Dhyne, Research series, April 2005.
67. "Indirect effects – A formal definition and degrees of dependency as an alternative to technicalcoefficients", by F. Coppens, Research series, May 2005.
68. "Noname – A new quarterly model for Belgium", by Ph. Jeanfils and K. Burggraeve, Research series,May 2005.
69. "Economic importance of the Flemish maritime ports: Report 2003", by F. Lagneaux, Document series,May 2005.
70. "Measuring inflation persistence: A structural time series approach", by M. Dossche and G. Everaert,Research series, June 2005.
71. "Financial intermediation theory and implications for the sources of value in structured finance markets",by J. Mitchell, Document series, July 2005.
72. "Liquidity risk in securities settlement", by J. Devriese and J. Mitchell, Research series, July 2005.
73. "An international analysis of earnings, stock prices and bond yields", by A. Durré and P. Giot, Research
series, September 2005.
74. "Price setting in the euro area: Some stylized facts from Individual Consumer Price Data", by E. Dhyne,L. J. Álvarez, H. Le Bihan, G. Veronese, D. Dias, J. Hoffmann, N. Jonker, P. Lünnemann, F. Rumler and
J. Vilmunen, Research series, September 2005.75. "Importance économique du Port Autonome de Liège: rapport 2003", by F. Lagneaux, Document series,
October 2005.
76. "The pricing behaviour of firms in the euro area: New survey evidence, by S. Fabiani, M. Druant,I. Hernando, C. Kwapil, B. Landau, C. Loupias, F. Martins, T. Mathä, R. Sabbatini, H. Stahl andA. Stokman, Research series, November 2005.
77. "Income uncertainty and aggregate consumption”, by L. Pozzi, Research series, November 2005.
78. "Crédits aux particuliers - Analyse des données de la Centrale des Crédits aux Particuliers", byH. De Doncker, Document series, January 2006.
79. "Is there a difference between solicited and unsolicited bank ratings and, if so, why?", by P. Van Roy,Research series, February 2006.
80. "A generalised dynamic factor model for the Belgian economy - Useful business cycle indicators and
GDP growth forecasts", by Ch. Van Nieuwenhuyze, Research series, February 2006.81. "Réduction linéaire de cotisations patronales à la sécurité sociale et financement alternatif", byPh. Jeanfils, L. Van Meensel, Ph. Du Caju, Y. Saks, K. Buysse and K. Van Cauter, Document series,March 2006.
82. "The patterns and determinants of price setting in the Belgian industry", by D. Cornille and M. Dossche,Research series, May 2006.
83. "A multi-factor model for the valuation and risk management of demand deposits", by H. Dewachter,M. Lyrio and K. Maes, Research series, May 2006.
84. "The single European electricity market: A long road to convergence", by F. Coppens and D. Vivet,Document series, May 2006.
85. "Firm-specific production factors in a DSGE model with Taylor price setting", by G. de Walque, F. Smetsand R. Wouters, Research series, June 2006.
86. "Economic importance of the Belgian ports: Flemish maritime ports and Liège port complex - Report
2004", by F. Lagneaux, Document series, June 2006.87. "The response of firms' investment and financing to adverse cash flow shocks: The role of bank
relationships", by C. Fuss and Ph. Vermeulen, Research series, July 2006.
88. "The term structure of interest rates in a DSGE model", by M. Emiris, Research series, July 2006.
89. "The production function approach to the Belgian output gap, estimation of a multivariate structural timeseries model", by Ph. Moës, Research series, September 2006.
90. "Industry wage differentials, unobserved ability, and rent-sharing: Evidence from matched worker-firmdata, 1995-2002", by R. Plasman, F. Rycx and I. Tojerow, Research series, October 2006.
91. "The dynamics of trade and competition", by N. Chen, J. Imbs and A. Scott, Research series, October2006.
92. "A New Keynesian model with unemployment", by O. Blanchard and J. Gali, Research series, October2006.
93. "Price and wage setting in an integrating Europe: Firm level evidence", by F. Abraham, J. Konings andS. Vanormelingen, Research series, October 2006.
94. "Simulation, estimation and welfare implications of monetary policies in a 3-country NOEM model", byJ. Plasmans, T. Michalak and J. Fornero, Research series, October 2006.
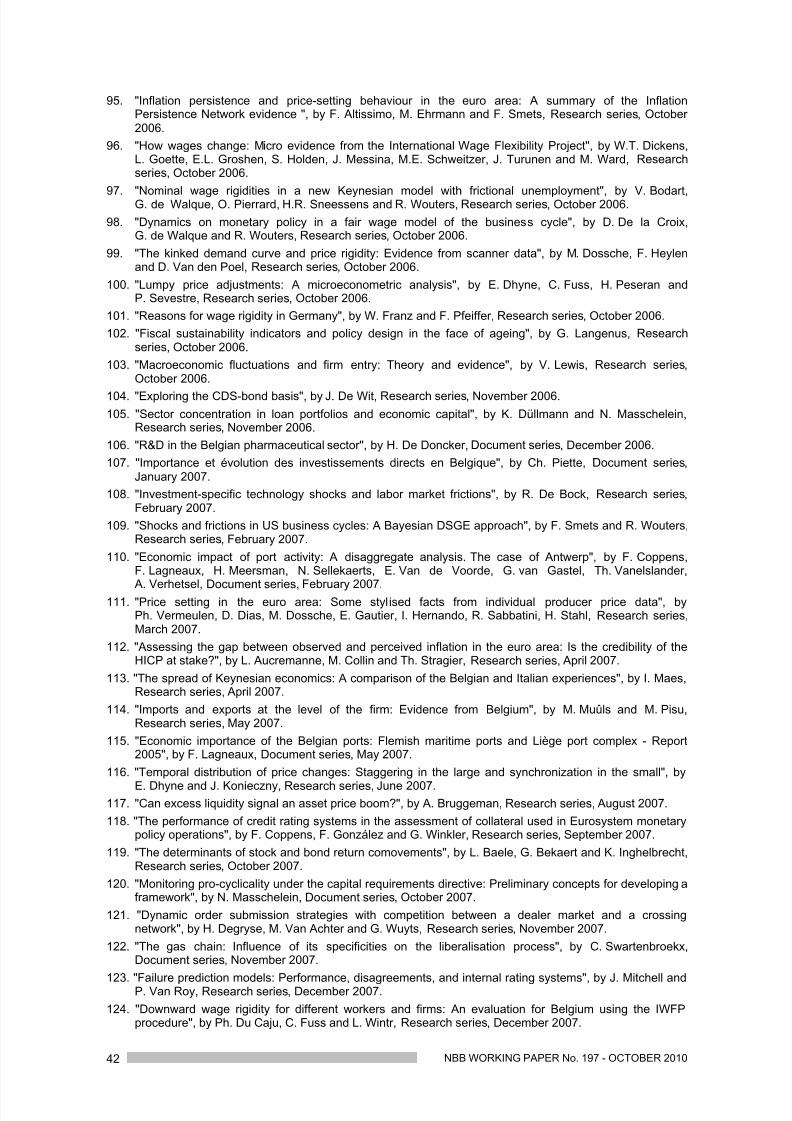
8/10/2019 Internationalization Strategy and Performance of SME
http://slidepdf.com/reader/full/internationalization-strategy-and-performance-of-sme 44/47
NBB WORKING PAPER No. 197 - OCTOBER 2010 42
95. "Inflation persistence and price-setting behaviour in the euro area: A summary of the InflationPersistence Network evidence ", by F. Altissimo, M. Ehrmann and F. Smets, Research series, October2006.
96. "How wages change: Micro evidence from the International Wage Flexibility Project", by W.T. Dickens,L. Goette, E.L. Groshen, S. Holden, J. Messina, M.E. Schweitzer, J. Turunen and M. Ward, Research
series, October 2006.
97. "Nominal wage rigidities in a new Keynesian model with frictional unemployment", by V. Bodart,G. de Walque, O. Pierrard, H.R. Sneessens and R. Wouters, Research series, October 2006.
98. "Dynamics on monetary policy in a fair wage model of the business cycle", by D. De la Croix,G. de Walque and R. Wouters, Research series, October 2006.
99. "The kinked demand curve and price rigidity: Evidence from scanner data", by M. Dossche, F. Heylenand D. Van den Poel, Research series, October 2006.
100. "Lumpy price adjustments: A microeconometric analysis", by E. Dhyne, C. Fuss, H. Peseran andP. Sevestre, Research series, October 2006.
101. "Reasons for wage rigidity in Germany", by W. Franz and F. Pfeiffer, Research series, October 2006.
102. "Fiscal sustainability indicators and policy design in the face of ageing", by G. Langenus, Research
series, October 2006.
103. "Macroeconomic fluctuations and firm entry: Theory and evidence", by V. Lewis, Research series,October 2006.
104. "Exploring the CDS-bond basis", by J. De Wit, Research series, November 2006.105. "Sector concentration in loan portfolios and economic capital", by K. Düllmann and N. Masschelein,
Research series, November 2006.
106. "R&D in the Belgian pharmaceutical sector", by H. De Doncker, Document series, December 2006.
107. "Importance et évolution des investissements directs en Belgique", by Ch. Piette, Document series,January 2007.
108. "Investment-specific technology shocks and labor market frictions", by R. De Bock, Research series,February 2007.
109. "Shocks and frictions in US business cycles: A Bayesian DSGE approach", by F. Smets and R. Wouters,Research series, February 2007.
110. "Economic impact of port activity: A disaggregate analysis. The case of Antwerp", by F. Coppens,F. Lagneaux, H. Meersman, N. Sellekaerts, E. Van de Voorde, G. van Gastel, Th. Vanelslander,
A. Verhetsel, Document series, February 2007.111. "Price setting in the euro area: Some styl ised facts from individual producer price data", byPh. Vermeulen, D. Dias, M. Dossche, E. Gautier, I. Hernando, R. Sabbatini, H. Stahl, Research series,
March 2007.
112. "Assessing the gap between observed and perceived inflation in the euro area: Is the credibility of theHICP at stake?", by L. Aucremanne, M. Collin and Th. Stragier, Research series, April 2007.
113. "The spread of Keynesian economics: A comparison of the Belgian and Italian experiences", by I. Maes,Research series, April 2007.
114. "Imports and exports at the level of the firm: Evidence from Belgium", by M. Muûls and M. Pisu,Research series, May 2007.
115. "Economic importance of the Belgian ports: Flemish maritime ports and Liège port complex - Report2005", by F. Lagneaux, Document series, May 2007.
116. "Temporal distribution of price changes: Staggering in the large and synchronization in the small", by
E. Dhyne and J. Konieczny, Research series, June 2007.117. "Can excess liquidity signal an asset price boom?", by A. Bruggeman, Research series, August 2007.
118. "The performance of credit rating systems in the assessment of collateral used in Eurosystem monetarypolicy operations", by F. Coppens, F. González and G. Winkler, Research series, September 2007.
119. "The determinants of stock and bond return comovements", by L. Baele, G. Bekaert and K. Inghelbrecht,Research series, October 2007.
120. "Monitoring pro-cyclicality under the capital requirements directive: Preliminary concepts for developing aframework", by N. Masschelein, Document series, October 2007.
121. "Dynamic order submission strategies with competition between a dealer market and a crossingnetwork", by H. Degryse, M. Van Achter and G. Wuyts, Research series, November 2007.
122. "The gas chain: Influence of its specificities on the liberalisation process", by C. Swartenbroekx,Document series, November 2007.
123. "Failure prediction models: Performance, disagreements, and internal rating systems", by J. Mitchell andP. Van Roy, Research series, December 2007.
124. "Downward wage rigidity for different workers and firms: An evaluation for Belgium using the IWFPprocedure", by Ph. Du Caju, C. Fuss and L. Wintr, Research series, December 2007.
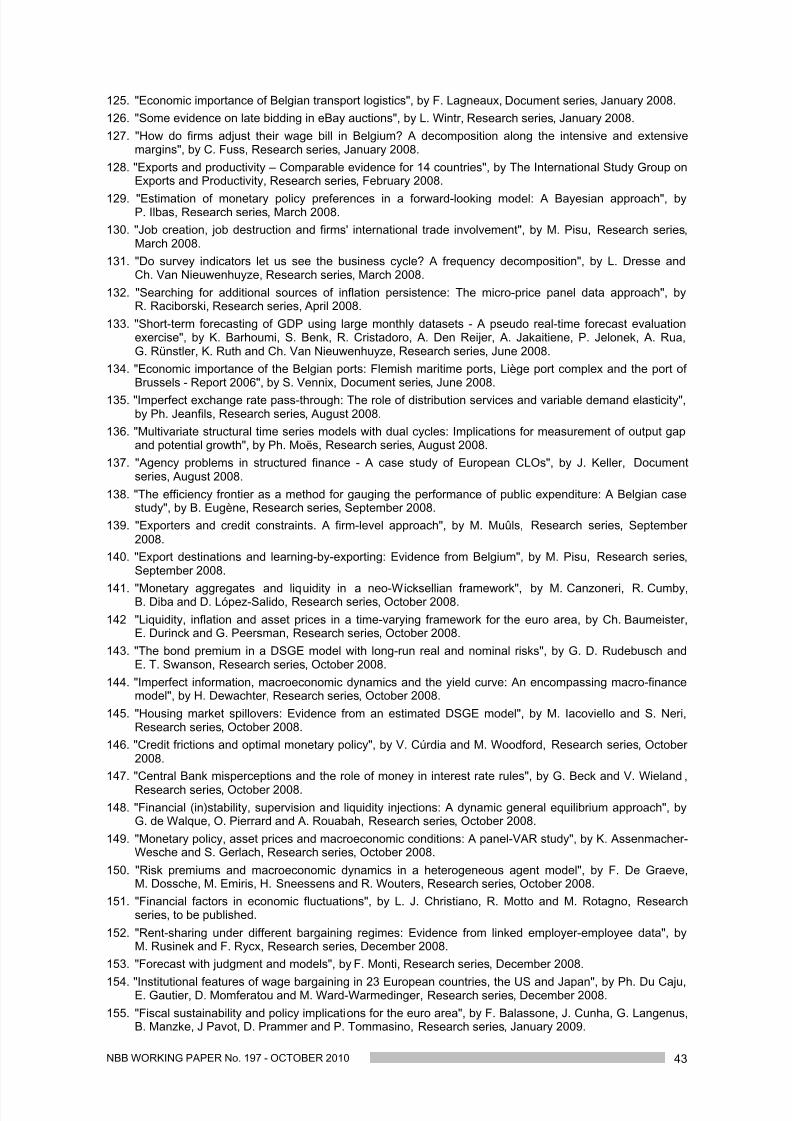
8/10/2019 Internationalization Strategy and Performance of SME
http://slidepdf.com/reader/full/internationalization-strategy-and-performance-of-sme 45/47
NBB WORKING PAPER No. 197 - OCTOBER 2010 43
125. "Economic importance of Belgian transport logistics", by F. Lagneaux, Document series, January 2008.
126. "Some evidence on late bidding in eBay auctions", by L. Wintr, Research series, January 2008.
127. "How do firms adjust their wage bill in Belgium? A decomposition along the intensive and extensivemargins", by C. Fuss, Research series, January 2008.
128. "Exports and productivity – Comparable evidence for 14 countries", by The International Study Group onExports and Productivity, Research series, February 2008.
129. "Estimation of monetary policy preferences in a forward-looking model: A Bayesian approach", byP. Ilbas, Research series, March 2008.
130. "Job creation, job destruction and firms' international trade involvement", by M. Pisu, Research series,March 2008.
131. "Do survey indicators let us see the business cycle? A frequency decomposition", by L. Dresse andCh. Van Nieuwenhuyze, Research series, March 2008.
132. "Searching for additional sources of inflation persistence: The micro-price panel data approach", byR. Raciborski, Research series, April 2008.
133. "Short-term forecasting of GDP using large monthly datasets - A pseudo real-time forecast evaluationexercise", by K. Barhoumi, S. Benk, R. Cristadoro, A. Den Reijer, A. Jakaitiene, P. Jelonek, A. Rua,G. Rünstler, K. Ruth and Ch. Van Nieuwenhuyze, Research series, June 2008.
134. "Economic importance of the Belgian ports: Flemish maritime ports, Liège port complex and the port ofBrussels - Report 2006", by S. Vennix, Document series, June 2008.
135. "Imperfect exchange rate pass-through: The role of distribution services and variable demand elasticity",by Ph. Jeanfils, Research series, August 2008.
136. "Multivariate structural time series models with dual cycles: Implications for measurement of output gapand potential growth", by Ph. Moës, Research series, August 2008.
137. "Agency problems in structured finance - A case study of European CLOs", by J. Keller, Document
series, August 2008.
138. "The efficiency frontier as a method for gauging the performance of public expenditure: A Belgian casestudy", by B. Eugène, Research series, September 2008.
139. "Exporters and credit constraints. A firm-level approach", by M. Muûls, Research series, September2008.
140. "Export destinations and learning-by-exporting: Evidence from Belgium", by M. Pisu, Research series,September 2008.
141. "Monetary aggregates and liquidity in a neo-Wicksellian framework", by M. Canzoneri, R. Cumby,B. Diba and D. López-Salido, Research series, October 2008.
142 "Liquidity, inflation and asset prices in a time-varying framework for the euro area, by Ch. Baumeister,E. Durinck and G. Peersman, Research series, October 2008.
143. "The bond premium in a DSGE model with long-run real and nominal risks", by G. D. Rudebusch andE. T. Swanson, Research series, October 2008.
144. "Imperfect information, macroeconomic dynamics and the yield curve: An encompassing macro-financemodel", by H. Dewachter, Research series, October 2008.
145. "Housing market spillovers: Evidence from an estimated DSGE model", by M. Iacoviello and S. Neri,Research series, October 2008.
146. "Credit frictions and optimal monetary policy", by V. Cúrdia and M. Woodford, Research series, October2008.
147. "Central Bank misperceptions and the role of money in interest rate rules", by G. Beck and V. Wieland ,
Research series, October 2008.148. "Financial (in)stability, supervision and liquidity injections: A dynamic general equilibrium approach", by
G. de Walque, O. Pierrard and A. Rouabah, Research series, October 2008.
149. "Monetary policy, asset prices and macroeconomic conditions: A panel-VAR study", by K. Assenmacher-Wesche and S. Gerlach, Research series, October 2008.
150. "Risk premiums and macroeconomic dynamics in a heterogeneous agent model", by F. De Graeve,M. Dossche, M. Emiris, H. Sneessens and R. Wouters, Research series, October 2008.
151. "Financial factors in economic fluctuations", by L. J. Christiano, R. Motto and M. Rotagno, Research
series, to be published.
152. "Rent-sharing under different bargaining regimes: Evidence from linked employer-employee data", byM. Rusinek and F. Rycx, Research series, December 2008.
153. "Forecast with judgment and models", by F. Monti, Research series, December 2008.
154. "Institutional features of wage bargaining in 23 European countries, the US and Japan", by Ph. Du Caju,E. Gautier, D. Momferatou and M. Ward-Warmedinger, Research series, December 2008.
155. "Fiscal sustainability and policy implications for the euro area", by F. Balassone, J. Cunha, G. Langenus,B. Manzke, J Pavot, D. Prammer and P. Tommasino, Research series, January 2009.
8/10/2019 Internationalization Strategy and Performance of SME
http://slidepdf.com/reader/full/internationalization-strategy-and-performance-of-sme 46/47
NBB WORKING PAPER No. 197 - OCTOBER 2010 44
156. "Understanding sectoral differences in downward real wage rigidity: Workforce composition, institutions,technology and competition", by Ph. Du Caju, C. Fuss and L. Wintr, Research series, February 2009.
157. "Sequential bargaining in a New Keynesian model with frictional unemployment and staggered wagenegotiation", by G. de Walque, O. Pierrard, H. Sneessens and R. Wouters, Research series, February2009.
158. "Economic importance of air transport and airport activities in Belgium", by F. Kupfer and F. Lagneaux,Document series
, March 2009.159. "Rigid labour compensation and flexible employment? Firm-Level evidence with regard to productivity forBelgium", by C. Fuss and L. Wintr, Research series, March 2009.
160. "The Belgian iron and steel industry in the international context", by F. Lagneaux and D. Vivet, Document
series, March 2009.
161. "Trade, wages and productivity", by K. Behrens, G. Mion, Y. Murata and J. Südekum, Research series,March 2009.
162. "Labour flows in Belgium", by P. Heuse and Y. Saks, Research series, April 2009.
163. "The young Lamfalussy: An empirical and policy-oriented growth theorist", by I. Maes, Research series,April 2009.
164. "Inflation dynamics with labour market matching: Assessing alternative specifications", by K. Christoffel,J. Costain, G. de Walque, K. Kuester, T. Linzert, S. Millard and O. Pierrard, Research series, May 2009.
165. "Understanding inflation dynamics: Where do we stand?", by M. Dossche, Research series, June 2009.
166. "Input-output connections between sectors and optimal monetary policy", by E. Kara, Research series,June 2009.
167. "Back to the basics in banking? A micro-analysis of banking system stability", by O. De Jonghe,Research series, June 2009.
168. "Model misspecification, learning and the exchange rate disconnect puzzle", by V. Lewis andA. Markiewicz, Research series, July 2009.
169. "The use of fixed-term contracts and the labour adjustment in Belgium", by E. Dhyne and B. Mahy,Research series, July 2009.
170. "Analysis of business demography using markov chains – An application to Belgian data”, by F. Coppensand F. Verduyn, Research series, July 2009.
171. "A global assessment of the degree of price stickiness - Results from the NBB business survey", byE. Dhyne, Research series, July 2009.
172. "Economic importance of the Belgian ports: Flemish maritime ports, Liège port complex and the port ofBrussels - Report 2007", by C. Mathys, Document series, July 2009.
173. "Evaluating a monetary business cycle model with unemployment for the euro area", by N. Groshenny,Research series, July 2009.
174. "How are firms' wages and prices linked: Survey evidence in Europe", by M. Druant, S. Fabiani andG. Kezdi, A. Lamo, F. Martins and R. Sabbatini, Research series, August 2009.
175. "Micro-data on nominal rigidity, inflation persistence and optimal monetary policy", by E. Kara, Research
series, September 2009.
176. "On the origins of the BIS macro-prudential approach to financial stability: Alexandre Lamfalussy andfinancial fragility", by I. Maes, Research series, October 2009.
177. "Incentives and tranche retention in securitisation: A screening model", by I. Fender and J. Mitchell,Research series, October 2009.
178. "Optimal monetary policy and firm entry", by V. Lewis, Research series, October 2009.
179. "Staying, dropping, or switching: The impacts of bank mergers on small firms", by H. Degryse,N. Masschelein and J. Mitchell, Research series, October 2009.
180. "Inter-industry wage differentials: How much does rent sharing matter?", by Ph. Du Caju, F. Rycx andI. Tojerow, Research series, October 2009.
181. "Empirical evidence on the aggregate effects of anticipated and unanticipated US tax policy shocks", byK. Mertens and M. O. Ravn, Research series, November 2009.
182. "Downward nominal and real wage rigidity: Survey evidence from European firms", by J. Babecký,Ph. Du Caju, T. Kosma, M. Lawless, J. Messina and T. Rõõm, Research series, November 2009.
183. "The margins of labour cost adjustment: Survey evidence from European firms", by J. Babecký,Ph. Du Caju, T. Kosma, M. Lawless, J. Messina and T. Rõõm, Research series, November 2009.
184. "Discriminatory fees, coordination and investment in shared ATM networks" by S. Ferrari, Research
series, January 2010.
185. "Self-fulfilling liquidity dry-ups", by F. Malherbe, Research series, March 2010.186. "The development of monetary policy in the 20th century - some reflections", by O. Issing, Research
series, April 2010.
8/10/2019 Internationalization Strategy and Performance of SME
http://slidepdf.com/reader/full/internationalization-strategy-and-performance-of-sme 47/47
Related Documents