NBER WORKING PAPER SERIES MEASURING INTERNATIONAL TRADE IN SERVICES Robert E. Lipsey Working Paper 12271 http://www.nber.org/papers/w12271 NATIONAL BUREAU OF ECONOMIC RESEARCH 1050 Massachusetts Avenue Cambridge, MA 02138 May 2006 I am indebted to Jing Sun for assistance in all phases of the research, and to Dave Richardson for comments and suggestions at the Conference, some of which are incorporated here. The views expressed herein are those of the author(s) and do not necessarily reflect the views of the National Bureau of Economic Research. ©2006 by Robert E. Lipsey. All rights reserved. Short sections of text, not to exceed two paragraphs, may be quoted without explicit permission provided that full credit, including © notice, is given to the source.

Welcome message from author
This document is posted to help you gain knowledge. Please leave a comment to let me know what you think about it! Share it to your friends and learn new things together.
Transcript

NBER WORKING PAPER SERIES
MEASURING INTERNATIONAL TRADE IN SERVICES
Robert E. Lipsey
Working Paper 12271http://www.nber.org/papers/w12271
NATIONAL BUREAU OF ECONOMIC RESEARCH1050 Massachusetts Avenue
Cambridge, MA 02138May 2006
I am indebted to Jing Sun for assistance in all phases of the research, and to Dave Richardson for commentsand suggestions at the Conference, some of which are incorporated here. The views expressed herein arethose of the author(s) and do not necessarily reflect the views of the National Bureau of Economic Research.
©2006 by Robert E. Lipsey. All rights reserved. Short sections of text, not to exceed two paragraphs, maybe quoted without explicit permission provided that full credit, including © notice, is given to the source.

Measuring International Trade in ServicesRobert E. LipseyNBER Working Paper No. 12271May 2006JEL No. F10, F23, F30, F40
ABSTRACT
World trade in services has recently been a little under $US2 trillion, about a quarter of worldtrade in goods. That ratio does not appear to have changed much in the last 50 years. For the US,exports of services have recently been over 40% and imports about 20% of exports and imports ofgoods, a return, for exports to the ratios of the early 1800s. Imports of services are now increasingmore rapidly than exports, but not faster than goods imports.
Because measures of service trade are not anchored in any observation of physical movement,they are dependent on definitions of residence. An example of that dependence and the ambiguitiesit creates is exports of educational services, a domestic activity that becomes an export becausestudents are defined as foreign residents. Since many students later become US residents, thesupposedly exported service never leaves the US, or returns to the US unobserved and uncounted.
A particularly serious problem of measurement is the growing transfer of intangible UScorporate assets to foreign affiliates of US firms, some of which use virtually no foreign factors ofproduction. These transfers, mainly for tax saving purposes, give rise to phantom flows of servicesfrom the foreign affiliates to the US and to other countries and remove the exports from the U.S.balance of payments. They make the meaning of measures of the current balances and GDPambiguous. One possible solution to the measurement problems would be to use measures assigningat least intangible assets to countries of ownership, rather than nominal residence.
Robert E. LipseyNational Bureau of Economic Research365 5th Avenue, Suite 5318New York, NY [email protected]

1
Measuring International Trade in Services
Robert E. Lipsey∗
Introduction
Most of the literature on international trade that has accumulated over the last 300 years
has dealt with trade in goods, and almost every country has had in place for many years a system
of collecting information on such trade. In the mercantilist era, a surplus of exports over imports
of goods was sought as a way of acquiring gold, and imports of goods were carefully watched
and counted as a source of tax revenue. As a result, there has been an apparatus in place for
measuring the inflow and outflow of goods in every country for centuries, based on counting and
appraising the value of goods as they crossed the country’s borders. Trade in goods among
regions of a country is often studied by trying to approximate the movement of goods across
regional, provincial, or state borders. Only recently, with the establishment of the single market
in the European Union, have some major trading countries moved away from the traditional
reliance on customs declarations at borders and been forced to invent other ways of measuring
trade in goods (OECD, 2001, p. 3). The collection of data on trade in goods is governed by
recommendations set forth in United Nations (2004), which translates for compilers of trade data
the methodological guidelines adopted by the United Nations Statistical Commission. One of the
principal recommendations is that countries use “…crossing the border rather than change of
ownership as the basic principle for compilation of trade statistics…” (P. 5). The geographical
basis of the data is emphasized by the recommendation that the data should “Record all goods
which add to or subtract from the stock of natural resources of a country by entering (imports) or ∗ I am indebted to Jing Sun for assistance in all phases of the research, and to Dave Richardson for comments and suggestions at the Conference, some of which are incorporated here.

2
leaving (exports) its economic territory (p. 74), and by the definition of the partner in terms of
the “statistical territory of its trading partners” or, when free zones are involved, the economic
territory if the reporting country uses “the strict version of the special system of trade.” The
definitions are all based on geography rather than ownership.
The measurement of trade in goods for the balance of payments has a different objective.
That is the measurement of changes in the ownership of goods between residents and non-
residents of a country. Since the great majority of such changes in ownership take place in
connection with the physical movement of the goods, the measures are quantitatively close, and
the balance of payments measures are mainly dependent on the data for the physical movement
of goods and very close to them. However, since imports are reported on a c.i.f. basis in the
goods trade data, and the balance of payments concept separates freight and insurance costs
from the value of the physical commodities, one adjustment that is required is to peel off those
costs and transfer them to the trade in services account.
Most of the differences between trade statistics and balance-of-payments measures for
trade in goods involve the dependence of the balance of payments accounts on change of
ownership rather than physical movement. Thus, the trade statistics include, and the balance of
payments data exclude, goods purchased by travelers and brought home, because there is no
change of ownership, while there is a change in location. Trade data include, but balance of
payments figures exclude, goods imported for projects by non-resident construction enterprises
and the major item on the export side, exports transferred under U.S. military agency sales
contracts. The trade figures exclude, but the balance of payments figures include, Bunkers,
Goods for repair and Goods entering or leaving a country illegally. Other adjustments involve,

3
for example, timing in terms of change of ownership rather than terms of the change in the
location of goods.
In contrast to trade in goods, trade in services does not have two alternative
measurements. It exists only in the balance of payments universe. As is observed in OECD
(2001), “Unlike trade in goods, trade in services involves no package crossing the customs
frontier with accompanying documentation showing an internationally recognized commodity
code, a description of the contents, information on quantity, origin, and destination, an invoice
and an administrative system based on customs duty collection, which facilitates data
compilation.” The difference is more than a question of documentation. Trade in services often
involves no crossing of an international boundary by the service, but only a crossing of a border
by the consumer of the service. Many trades in services are geographically domestic
transactions made international solely by a difference in country of residence between the buyer
and the seller of the service. It is a balance of payments concept more than a trade concept, and
the definition of residence plays a crucial part in defining what trade in services is.
The size and growth of world trade in services
Trade in services has been something of an orphan in international measurement, but
interest in it has been growing. However, it is hard to say just how large it is, because the
completeness of reporting varies greatly across countries. Some countries publish data, but they
cover only limited types of services. Some important participants, such as Bermuda and the
Cayman Islands, do not report to the IMF at all, although we know from their partners’
information that they are important transactors.

4
In 2002, the OECD countries as a group reported service exports of $US 1,622 billion, 25
per cent of the value of exports of goods. And they reported service imports of $US 1,631
billion, 26 per cent of reported imports of goods (OECD, 2003, Table A-1). Many countries that
report to the IMF do not report service exports and imports, but those that do, reported exports of
$US 1,885 billion and imports of $US 1,887 billion in 2003 (IMF 2006). Of these countries, the
145 that reported both goods and services exports and imports reported exports of services that
were 25.7 per cent of exports of goods, and imports of services that were 25.4 per cent of imports
of goods (IMF 2006). Thus there is fairly general agreement on a current ratio of services trade
to goods trade of about one quarter.
It is hard to judge how fast trade in services has been growing, because the number of
countries measuring it has increased, and the number of categories covered by surveys and
reporting has been growing over time, but to inconsistent degrees in different countries. For 22
countries that have reported service exports and imports to the IMF since 1972, and accounted
for over half of “world” exports of services in 2003, the ratio of service exports to goods exports
grew from 21 to over 28 per cent between 1972-76 and 2002-03. The corresponding ratio for
imports rose from 24 to 26 per cent over that same period (Table 1). For a larger group of 30
countries that have reported service exports and imports since 1977, and accounted for two thirds
of “world” service exports in 2003, the ratio of service exports to goods exports grew from about
22 to over 27 per cent between 1977-81 and 2002-03. The ratio for imports grew from 24-25 per
cent to a peak of 28 per cent in 1992-96 and has since settled back to around 27 per cent. Thus
there is some indication of an upward trend in at least the reported service trade relative to goods
trade. Many countries are dropped from the recent IMF Balance of Payments CDs for years
before 1972, presumably because the definitions and measures of service exports and imports did

5
not match the current definitions. However, it is possible to put together series extending back
somewhat further, to 1961, for 24 of the larger countries, from earlier IMF data (IMF, 1991).
These show almost the same ratios of service trade to goods trade in 1972 as in Table 1, 25.2
percent on the export side and 27.7 per cent on the import side. The corresponding ratios in 1961
were 26.6 per cent and 32 per cent, suggesting, if anything, a slight decline in the ratio, at least
on the import side, but no very large changes over these 40+ years.
A further indication of the trend in the world importance of service trade can be gleaned
from estimates for 1950-1954, purportedly covering the whole world (Woolley, 1966, Table 3, p.
23. The ratios quoted here exclude investment income, treated as service trade in the source).
On the export side, they show service exports 21.6 per cent of goods exports, below the 1961
ratio, but almost the same as the average ratio for the first five years, starting in 1972, in Table 1.
On the import side, the estimated ratio in 1950-1954 is over 24 per cent, again below the 1961
ratio, but almost exactly the average of 1972 to 1976 in Table 1. Thus, there is little indication of
a strong trend in the ratio in the last 50 years if we assume that the adjustments made to the data
for the earlier period had been adopted in the official data by 1972, or at least by 2002.
However, if the same omissions in the official services data remain, and they are equally
important in the later period (for example, Karreman, 1961, Table 20, p. 48, raised the reported
transportation receipts by over a third and payments by almost half), some long term rise in the
service/goods trade ratio is implied.
One reason for being suspicious about the apparent rising trend in service trade relative to
goods trade is that not only has the number of countries reporting service trade to the IMF risen
over the last 50 years, and even the last 30 years, but among those reporting, the number
reporting particular types of service trade has increased even more. While the number of

6
Table 1: Service Exports and Imports as Percent of Goods Exports and Imports 22 Countriesa 30 Countriesb
Year Exports Imports Exports Imports 1972~1976 21.40 24.32 n.a. n.a. 1977~1981 21.07 24.09 22.01 24.57 1982~1986 23.92 25.15 23.34 25.46 1987~1991 25.29 25.10 24.56 26.73 1992~1996 27.34 26.18 26.17 28.20 1997~2001 27.53 25.03 26.18 26.32
2002 28.87 25.91 27.68 27.10 2003 28.53 26.01 27.47 26.95
a. 22 countries include Australia, Austria, Barbados, Canada, Colombia, Dominican Rep., Germany,
Haiti, Israel, Italy, Jordan, Malta, Netherlands, New Zealand, Romania, Saudi Arabia, Singapore, South Africa, Sweden, United Kingdom, United States and Venezuela.
b. 30 countries include the 22 countries, plus Argentina, Belgium-Luxembourg, Brazil, Denmark, Finland, France, India and Japan.
Source: Appendix Table A.
countries reporting total service exports to the IMF has not changed greatly since 1983, the
number reporting exports of , for example, construction services, rose from 5 to 86, financial
services, 8 to 109, computer and information services, 1 to 96, and personal, cultural, and
recreational services, 4 to 92 (Table 2). In some cases, the services may not have existed in the
particular countries, or may not have been exported at all. In other cases, they might have been
reported under “other business services.” Neither of these reasons would imply any bias in the
overall ratios. However, it seems more likely that at least some of these services were traded, but
no device was in place for collection of data on them, in which case the increasing numbers of
reporters would imply upward bias in the overall ratios.
The same information for imports of services is provided in Table 3. In most cases,
collection and reporting of data on particular imports and exports moved together, but there were
exceptions. Reports of freight imports increased faster than those on freight exports, and the
same was true for reports on insurance imports and construction imports. In general, however,

7
Table 2: Number of Countries Reporting Trade in Various Services from the Export Side 1973 1975 1983 1993 2003
Total Services 23 61 141 156 154a Transportation 23 60 134 152 152a Passenger 12 39 98 103 124b Freight 18 49 110 112 119b Other Transportation 21 55 112 116 125b Travel 23 60 138 149 152a Government Services, nie 21 56 120 134 143c Other Services Communications 7 8 17 63 127 Construction 2 3 5 33 86d Insurance 14 44 103 108 133e Financial 2 2 8 38 109f Computer and Information 0 0 1 19 96g Royalties and License Fees 10 19 32 57 87 Other Business Services 22 60 138 148 146c Personal, Cultural and Recreational 4 3 4 23 92h a). For ten countries, data for 2002 are reported. They are Anguilla, Antigua and Barbuda, Dominica, Grenada, Malawi,
Montserrat, St. Kitts and Nevis, St. Lucia, St. Vincent & Grens., and Tonga. b). For Malawi, the report is for 2002. c). For nine countries, data for 2002 are reported. They are Anguilla, Antigua and Barbuda, Dominica, Grenada,
Montserrat, St. Kitts and Nevis, St. Lucia, St. Vincent & Grens., and Tonga. d). For St. Kitts and Nevis, the report is for 2002. e). For eight countries, data for 2002 are reported. They are Anguilla, Antigua and Barbuda, Dominica, Grenada,
Montserrat, St. Kitts and Nevis, St. Lucia, and St. Vincent & Grens.. f). For seven countries, data for 2002 are reported. They are Anguilla, Antigua and Barbuda, Dominica, Grenada,
Montserrat, St. Kitts and Nevis, and St. Vincent & Grens.. g). For St. Lucia, the report is for 2002. h). For Tonga, the report is for 2002. Source: IMF (2006)

8
Table 3: Number of Countries Reporting Trade in Various Services from the Import Side 1973 1975 1983 1993 2003
Total Services 23 62 142 156 154a Transportation 23 62 142 154 154a Passenger 16 44 101 115 126b Freight 22 61 142 136 137b Other Transportation 17 51 107 109 114b Travel 23 60 137 152 151a Government Services, nie 21 57 121 141 148c Other Services Communications 7 9 19 62 129 Construction 3 4 5 37 100d Insurance 20 57 137 141 145e Financial 2 3 8 44 114f Computer and Information 0 0 2 20 105 Royalties and License Fees 12 26 57 70 120e Other Business Services 23 60 139 150 152a Personal, Cultural and Recreational 6 6 10 30 98g
a). For ten countries, data for 2002 are reported. They are Anguilla, Antigua and Barbuda, Dominica, Grenada, Malawi,
Montserrat, St. Kitts and Nevis, St. Lucia, St. Vincent & Grens., and Tonga. b). For Malawi, the reports is for 2002. c). For nine countries, data for 2002 are reported. They are Anguilla, Antigua and Barbuda, Dominica, Grenada,
Montserrat, St. Kitts and Nevis, St. Lucia, St. Vincent & Grens., and Tonga. d). For five countries, data for 2002 are reported. They are Anguilla, Antigua and Barbuda, Dominica, Montserrat, and St.
Kitts and Nevis. e). For nine countries, data for 2002 are reported. They are Anguilla, Antigua and Barbuda, Dominica, Grenada, Malawi,
Montserrat, St. Kitts and Nevis, St. Lucia, and St. Vincent & Grens.. f). For Dominica, Grenada, and St. Kitts and Nevis, the report is for 2002. g). For Malawi and Tonga, the report is for 2002. Source: IMF (2006)

9
types of services poorly reported in import records were the same as those poorly reported in
export records, and the biases are probably similar on the two sides of the account.
Even if there has not been any strong trend in world service trade relative to world goods
trade over the last half century, the growth of service trade has outpaced the growth of world
GDP, since the ratio of goods trade to GDP has risen substantially since 1950 in almost every
country. However, since world production and employment have moved from goods producing
to service producing industries, one might have expected a corresponding shift in the
composition of trade. The absence of an obvious shift in that direction may reflect the fact that
we are comparing nominal rather than real values of the two types of trade. If prices of traded
services have fallen relative to prices of traded goods, the stability of the nominal ratio may
conceal a more rapid growth in real service trade. If relative prices of traded services have risen,
on the other hand, the stability of the services/goods trade ratio would imply a decline in the
importance of service trade in real terms. That question is discussed more fully below, in
connection with U.S. trade, for which we have slightly more data. Reported imports of services
were about 10 per cent larger than reported exports in 1950-1954 (Woolley, 1966, Table 3, p.
23). The same was true among 22 countries until the 1990s, sometimes by 10 per cent or more,
but they have been much closer in size since then. That same trend is shown in the data for 30
countries since 1977, with the latest figures showing exports and imports almost equal in size
(Appendix Table B). Either comparative advantages in service production have shifted toward
these groups of 22 and 30 countries or there have been more improvements in measuring service
exports than in measuring service imports.

10
A rough idea of the composition of world service trade and changes in composition over
the last 20 years, as reported by the IMF, is given by Table 4. The three major elements are
Transportation, Travel, and “Other Business Services.” The composition of reported imports is
considerably different from that of reported exports. The direction and size of the discrepancies
between reported export and reported import totals vary across service categories, probably
because reporting by developed countries is more complete than that by developing countries.
Thus, reported imports of freight transportation are much larger than reported exports, probably
because imports of freight transportation services are mainly by developed countries from
developing countries. On the other hand, for Financial and Computer and Information services,
reported exports are much larger than reported imports, presumably because these are mainly
export items for developed countries. Reported exports of Insurance Services are much smaller
than reported imports, probably because exports are, relative to country size, disproportionately
concentrated in Bermuda, which does not report to the IMF at all.
The major change in composition is the decline in importance of Freight and Other
transportation, reduced almost by half. Some of this reduction may be an effect of
containerization and other productivity improvements, but some may be an artifact of the
improvement in the reporting of “Other services” that can be seen in Tables 2 and 3. Passenger
transportation held up better than goods transportation. There was also a large decline in the
importance of Government services, n.i.e., which include “…services (such as expenditures of
embassies and consulates) associated with government sectors or international and regional
organizations and not classified other items” (International Monetary Fund, 2004, p. xxvi).

11
Table 4: The Composition of World Service Trade, 1983 & 2003 ($US Billions)3 Exports Imports 1983 2003 1983 2003
Total Services 373 1,864 415 1,836 Transportation2 114 400 145 467 Passenger 20 78 20 84 Freight 57 155 81 227 Other Transportation 36 110 45 111 Travel 96 526 89 495 Government Services, nie 32 53 50 69 Other Services1 131 885 131 805 Communications4 3 40 3 39 Construction4 7 36 5 30 Insurance4 6 56 11 86 Financial4 5 97 2 45 Computer and Information4 0 73 0 34 Royalties and License Fees4 10 95 10 105 Other Business Service4 100 451 97 433 Personal, Cultural & Recreational4 0 24 1 22
Note: 1. The imports and exports of Other Services are calculated by summing up the imports and exports of the component
services. 2. The imports and component services under Transportation do not add up to the imports and exports of Transportation,
presumably because not all countries report the component. 3. All the data in this table are taken from “Current Account” for Economic Concept tables in IMF BOP CD. 4. Taiwan is not included.
Source: 1. IMF (2006) 2. Republic of China (Taiwan) (1987), Statistical Yearbook of the Republic of China, 1987, Directorate-General of Budget,
Accounting & Statistics, Executive Yuan, Republic of China, Taipei, Taiwan.

12
Some indication of the geography of international trade in services is given in Table 5,
although again, the pattern may represent differences in reporting as much as differences in
behavior. Given the problems in reporting, the data indicate that the developed, or industrial,
countries as a group export services of a greater value than they import, while developing
countries run an import surplus in services. However, the distinction between the two sets of
countries does not govern the relationship completely. While the United States, France, and the
UK report an export surplus in services, Japan and Germany report importing considerably more
in services than they export. The developing country groups, except for those in Europe, all
show import surpluses in services.
Over 20 years, the reporting of service exports seems to have caught up to the reporting if
service imports, so that there is no longer a world surplus of reported imports. The main trend in
direction is that the share of industrial countries in exports has declined, while their share of
service imports has risen. The share in imports of the Euro area rose, and that accounted for
most of the increase in industrial country imports.
The size and growth of U.S. trade in services
The United States has been a leader in measuring service trade, perhaps because it offers
a more cheerful picture of the U.S. international position than the goods trade account. In 2005,
the United States reported a surplus of exports over imports in service trade, of $US 57 billion ,
in contrast to a deficit in goods trade of over $US 780 billion (Appendix Table C).
Services have recently been much larger relative to goods in U.S. exports (over 40 per
cent) than in U.S. imports (20 per cent or so), presumably reflecting U.S. comparative advantage
in service industries (Chart 1). Service exports were about 60 per cent as large as service

13
Table 5: The Geography of Service Trade, 1983 & 2003 ($US Billions) Exports Imports 1983 2003 1983 2003
World 373 1,864 415 1,836 Industrial Countries 292 1,360 275 1,297 U.S. 64 306 54 257 Japan 22 78 34 112 Euro Area 135 632 119 628 France 34 99 26 83 Germany 30 123 38 172 UK 29 153 23 125 Developing Countries1 523 579 Africa1 33 43 Asia1 265 282 Europe, excluding Industrial Countries1 109 99 Middle East1 56 84 Western Hemisphere1 61 71
Note: 1. Data for 2003 are from IMF regional tables. The sum of the exports (imports) of the countries within the specified regions
do not add up to the totals provided. Source: 1. IMF (2006) 2. Republic of China (Taiwan) (1987), Statistical Yearbook of the Republic of China, 1987, Directorate-General of
Budget, Accounting & Statistics, Executive Yuan, Republic of China, Taipei, Taiwan.
imports during the 1930s, became larger than imports during World War II, fell back to half in
the early 1950s, and then began to grow faster. By the early 1970s service exports began to
surpass imports and have done so ever since. However, in the last five years, it has been service
imports that have outpaced service exports (Appendix Table C).
The large current importance of services relative to goods in U.S. exports is not
unprecedented. In the first 30 years of balance of payments records, 1790 to 1819, U.S. service
exports averaged about a third of goods exports, but their relative importance trended downward
from then, reaching a level of only 2 per cent of exports of goods in the early 1900s. Then they
began a long rise in importance leading to the current high levels (Chart 1). Services were more

14
important in U.S. exports than in U.S. imports in the early days of the United States, usually
more than twice as important through the 1840s. After the Civil War, the relation was reversed,
and services were generally much more important in imports than in exports in the latter half of
the 19th Century and through the 1960s, reaching well over 40 per cent of goods imports during
the years when goods imports were affected by World War II and the postwar recovery. As
goods imports grew rapidly starting in the 1970s, the ratio of service to goods imports receded to
around 20 per cent, where it has remained since the 1970s (Chart 1).
Source: Appendix Table C.
Services have often been treated as nontradables, and they are, in fact, less traded than
goods, relative to their output. That is, exports and imports of services have been much smaller
relative to the output of services, than exports and imports of goods, relative to the production of

15
goods, at least since 1869. Aside from World War II, service exports were almost always less
than 2 per cent of service output until the 1960s, according to contemporary estimates, later
revised to almost 3 per cent for the 1960s. Since then, they have grown to usually about 5 per
cent of service output. Goods exports have generally been much larger relative to goods output
during the same period, often 10 to 14 per cent before World War I, falling back to 7 or 8 per
cent from 1929 through the 1960s and then rising, to above 20 per cent in most of the last decade
(Chart 2). Service imports were larger, over 3 per cent during the 1960s, and reaching over 4 per
cent of U.S. service output in recent years (Chart 3). Goods imports were 10 per cent of goods
output in most of the late 19th century, ranged from 5 to 8 per cent of goods output most years
from then through the 1960s, and then soared, to reach 35 to 40 per cent of goods production
since 2000 (Chart 3).
Source: Appendix Tables D & E.

16
Source: Appendix Tables D & E.
The relation of service trade to goods trade and the different movements of trade/output
ratios in the two sectors may reflect differences in price movements. As David Richardson
pointed out in his comments at the conference, the official data on implicit prices underlying
GDP and those for exports both show prices of services rising relative to those for goods. For
example, between 1929 and 2005, domestic prices for services rose by over three times as much
as domestic prices of goods, and export prices of services rose almost 2 &1/2 times as fast as
export prices of goods (Appendix Table I). If we accept these price estimates, they present a
very different picture from the nominal data, in some respects. In particular, they show the ratio
of services to goods in U.S. exports fairly stable from the 1960s through the early 1990s, and
then declining, instead of rising sharply through the 1970s and the 1980s. And they show the
ratio in U.S. imports to have fallen throughout the 1990s, instead of being stable (Chart 4).

17
Chart 4: U.S. Trade in Services Relative to Trade in Goods in 2000 Prices (%)
0
10
20
30
40
50
60
70
80
1925 1930 1935 1940 1945 1950 1955 1960 1965 1970 1975 1980 1985 1990 1995 2000 2005
Year
Rat
io: S
ervi
ces/
Goo
ds (%
)
ExportsImports
Source: Appendix Table F.

18
The translation from nominal to real, or constant dollar, terms makes much less
difference to the comparisons of trade to output in goods and services than to the comparison of
goods trade to services trade (Charts 5 and 6). The reason is that the reported disparity in price
movements between goods and services is in trade is very similar to that in domestic production.
One problem with all of these comparisons in constant dollars, or in “real terms,” is that
price measurement in the service sector, and corresponding quantity measurement, are the
weakest parts of the national accounts. Two volumes of the CRIW series, Griliches (1992), and
Cutler and Berndt, (2001), devoted a great deal of attention to the problems of measurement of
prices and output in this sector. And it is hard to have much confidence in the measures. The
problems for trade in services are worse than for domestic production, because the collection of
prices for service trade is at a very early stage, as indicated in the paper by Khatchadourian and
Wiesner (2006). They mention that the BLS International Price Program has collected service
price indexes that cover “…approximately 8 percent of export service trade and 23 percent of
import services trade” (p. 2).
The long-term history of costs of freight transportation, one of the largest segments of
international services trade, suggest that they were falling relative to prices of goods in general.
The evidence includes convergence of prices between origin and destination countries and
calculations of freight rates themselves, documented in papers by Harley, Hummels, North
(1958), and Williamson, many of which are discussed and summarized in Mohammed and
Williamson (2004). For other major parts of international service trade, such as travel and
business services, it is difficult to find price records, but they do not seem likely candidates for
large increases in price relative to goods.

19
Chart 5: U.S. Exports Relative to Output of Goods and Services in 2000 Prices (%)
0
5
10
15
20
25
1925 1930 1935 1940 1945 1950 1955 1960 1965 1970 1975 1980 1985 1990 1995 2000 2005
Year
Expo
rts/
Out
put (
%)
GoodsServices
Source: Appendix Tables G & H.
Chart 6: U.S. Imports Relative to Output of Goods and Services in 2000 Prices (%)
0
5
10
15
20
25
30
35
40
45
1925 1930 1935 1940 1945 1950 1955 1960 1965 1970 1975 1980 1985 1990 1995 2000 2005
Year
Impo
rts/
Out
put (
%)
GoodsServices
Source: Appendix Tables G & H.

20
The ratios of trade to output, particularly for goods, exaggerate the importance of trade
somewhat, because while the production figures are output net of purchases from other
industries, export and import figures are gross of such purchases. Since such purchases are more
important in goods industries than in service industries, the exaggeration of the importance of
trade is greater for goods than for services.
Estimates of U.S. service trade are still a work in progress. A report by the Office of
Technology Assessment estimated that exports of services, excluding banking services, were
about 60 per cent higher than “Official U.S. Government figures” in 1983 and 1984, and that
imports of services were 40-50 per cent higher in those years (U.S. Congress, Office of
Technology Assessment, 1986, Table 1). The latest official BEA calculations of service exports
and imports are quite close to the OTA estimates for those years, but somewhat larger for 1984
(Sauers and Pierce, 2005, Table 1).
The path to the much higher revised estimates of trade in services was described in the
Appendix to Whichard and Borga (2002). That path began with new legislation in 1984 that
permitted BEA to conduct surveys of trade in services. The first benchmark survey was carried
out for 1986, and annual follow-up surveys began in 1987. Also, in that year medical service
exports were first estimated and primary insurance services were added to previous estimates of
reinsurance transactions. Estimates of expenditures by foreign students in the United States and
U.S. students abroad started in 1989. In 1990, services were redefined to exclude investment
income. In 1992, trade in services between U.S and foreign parents and their affiliates was
placed on a gross, instead of a net, basis, increasing both exports and imports of services,
coverage of transportation services was increased, and some new services were added to the
1991 benchmark. Truck transportation services between the United States and Canada were

21
added to the service trade account in 1995. In 1996, BEA began a “Benchmark Survey of
Financial Services Transactions Between U.S. Financial Services Providers and Unaffiliated
Foreign Persons.” Since then, there have been other improvements in measures of transportation
services and reclassifications of software royalties and license fees, leasing of transportation
equipment, and compensation of employees, new sources for exports of medical services and
imports of travel, and various other items.
One consequence of all these improvements in data collection and expansions in the list
of services covered is that historical comparisons over long periods are questionable. The
earliest estimates of U.S. service exports included only shipping earnings, and later also port
charges on foreign ships, and foreign tourist expenditures in the United States, items that
accounted for perhaps a third of service exports in 2003 (BEA website, downloaded in 2006).
The same items, plus estimates of bankers’ commissions might cover more of the current imports
of services, perhaps a little over half.
Many services in the early United States were performed by foreign companies’ agents or
by affiliates of foreign firms, which possessed skills not common in the United States at that
time. Wilkins (1989) quotes a letter to Alexander Hamilton referring to Virginia to the effect
that “The trade of this state is carried on chiefly with foreign (British) capital. Those engaged in
it [the trade] hardly deserve the name of merchants, being factors, agents, and Shop-keepers of
the Merchants and Manufacturers of Great Britain…” She goes on to say that the passage does
not reveal whether theses were “…salaried, or partners in the British firms”, in which case they
might have represented imports of services into the United States, or “…financially independent
units that acted for British houses on a purely commission basis” (p. 40), in which case they
might have represented U.S. exports of services. Wilkins also reports that America’s national

22
banking legislation of 1864-65 “…had not provided a satisfactory basis for the largest American
banks to participate in foreign trade financing…” and that as a result, “…to finance much of that
trade, American enterprises depended on foreign (mainly British) banking services “ (p. 463).
Outside of banking, Wilkins notes that “…in 1914, the United States had to rely on foreign-
owned shipping, foreign-owned cables, and foreign-owned radio communication” (p. 524).
Shipping services were recorded in the balance of payments, but not the others.
Of course, many of the services traded currently, such as telecommunications and film
and television tape rentals, did not exist very long ago, but there apparently were many services
that did exist and were not recorded. It is therefore difficult to be sure how much of the apparent
trend in the share of service trade in total U.S. trade is genuine.
The definition of residence and trade in educational services
The measurement of trade in more and more services places a great deal of weight on the
definition of residence, because the identification of residence can change what is, on the face of
it, a domestic transaction into an international transaction. One case in which the attribution of
residence changes a domestic demand on a country’s resources into an international demand is
that of foreign students, who are treated as residents of the country from which they come, with
the result that their costs of education and living expenses become a service export of the host
country. The service that is simply domestic production and consumption or investment in
human capital if a student is a resident of the United States, is an export of educational services if
the student is classified as a “foreign resident”.
Since many students choose to stay in the host country after their education is completed,
the services “exported” to those students’ home countries never leave the host countries. The

23
service exports are re-imported when the students become host country residents, an item missed
in the balance of payments, or they could be thought of as turning into an import of human
capital by the host country, a type of import that is never recorded.
U.S. exports of educational services roughly doubled in value between 1992 and 2004,
reaching $13.5 billion (Nephew et al. 2005), but there are no comprehensive data on what
proportion of these service “exports” in fact never leave the United States. A hint that the share
staying in the United States might be important is provided by data on intentions to stay
expressed by foreign recipients of science and engineering doctorates in the United States. There
are data on “intentions to stay,” and on “definite plans to stay”. Among students from countries
accounting for about three quarters of such doctorates between 1985 and 1996, an intention to
stay in the United States was expressed by half in 1985, rising to 70 per cent in 1995 and 1996.
Among degree recipients from all countries, “plans to stay” were expressed by 68 per cent in
1992-95, 72 per cent in 1996-99, and 74 per cent in 2000-03. A “firm plan to stay,” meaning
that the student had accepted a definite offer of a postdoctoral appointment or employment in the
United States was reported by from 36 to 46 per cent of the doctoral recipients over 1985
through 1996, and “definite plans to stay” from 35 per cent in 1992-95, to 46 per cent in 1996-99
and 51 per cent in 2000-2003. (National Science Foundation, 1998b and 2006, Appendix Table 2
-33).
The data on plans to stay do not reveal outcomes. Some indication of the fulfillment of
these plans is that of about 8,000 temporary residents receiving Science and Engineering
doctorates in 1998, over 60 per cent were still in the United States in 2003 (National Science
Foundation, 2006, Table 3-24).

24
Recipients of doctorates were only a small part of the 13 per cent foreign-born share in
R&D scientists and engineers in the United States in 1993, although the foreign-born were more
important among Ph. Ds than among those with less education. At all degree levels, about two
thirds of the foreign-born scientists and engineers employed in the United States had received
their training in the United States (National Science Foundation, 1998a, Table 1).
If some substantial part of education exports remains in the United States, there is no
clear way to recognize that fact in the current balance of payments framework. What would be
required, but does not exist, is some accounting for flows of human capital. The decisions of
alien “importers” of U.S. education to settle in the United States would then be treated as an
import of human capital, analogous to the standard flows of financial capital. The re-import of
this education would be only a very small part of the imports of human capital via immigration.
The impact of exports of education services may go beyond the tendency of students to
stay in the countries where they receive higher education. Even if students do not stay after
graduation, they may return as immigrants, carrying back the previously exported education
services. One study of immigration found that student flows explained migration to the United
States more consistently than “…traditionally highlighted economic variables…” Similar
relationships could be observed for migration to a cross-section of OECD countries (Dreher and
Poutvaara, 2005, p. 17).
The idea that there is a human capital flow missing from the balance of payments data
was suggested a long time ago by Alfred Marshall. “England exports to India a good many able
young men: they do not enter in India’s list of imports; but it is claimed that they render to her
services whose value exceeds that of her total payments to them. They return to England (if they
come back at all) after their best strength has been spent: they are unreckoned exports from
25
England. But that part of their incomes, which they have saved, is likely to come back sooner or
later in the form of material goods which enter into her imports. On the other hand, India counts
those material goods among her exports to England: but of course she makes no entry among her
imports for the expensive young men who have been sent to her. (Marshall, 1923, pp.134-135).
Tax havens and trade in services
There is a considerable literature, some of which is summarized in Hines (2005), that
describes the effect of low rates of host country taxation in attracting investment and economic
activity by multinationals from the United States and probably, even more from other countries.
Some of the activity attracted is production, but much of it involves the shifting of income to
avoid or reduce taxes. Hines refers to “an impressive concentration of financial activity in tax
havens.” The 30 tax havens he lists accounted in 1999 for 0.7 per cent of the world’s population
and 2.1 per cent of world GDP, but for 4.8 per cent of net property, plant, and equipment of U.S.
affiliates, 3.4 per cent of employee compensation, and 3.7 per cent of employment. These shares
probably represent production taking place in the tax havens and are not of concern in
connection with the measurement of their production or export of services. However, these same
tax haven affiliates accounted for 15.7 per cent of gross foreign assets of U.S. affiliates, 13.4 per
cent of sales, and “…a staggering 30 per cent of total foreign income…” (ibid. p. 78). “Much of
reported tax haven income consists of financial flows from other foreign affiliates that parents
own indirectly through their tax haven affiliates. Clearly, American firms locate considerable
financial assets in foreign tax havens, and their reported profitability in tax havens greatly
exceeds any measure of their physical presence there” (ibid..). Hines goes on to suggest that
firms in other countries, such as Germany and the Netherlands, that largely exempt their firms’

26
foreign income from taxation, have even stronger incentives to locate investment and income
production in tax havens (ibid., p. 79). Desai, Foley, and Hines (2003, p. 68) refer to this
flexibility as “…the ability of multinational firms to adjust the reported location of their taxable
profits.”
This ability of firms to shift the location of assets and profits by paper transactions
internal to the firm makes the location of production ambiguous. That is especially true in
industries, such as banking and other financial services, in which production is intangible, but it
is also the case in other industries based on intellectual property and even in tangible goods
industries in which much of the value of the tangible goods stems from intangible intellectual
property. The ambiguity in the location of production produces a corresponding ambiguity in
measures of exports and imports, which involve the movement of goods and services across
international borders, ultimately from producers to consumers.
Reported service exports by U.S. affiliates for the world, main regions, and a few selected
countries are shown in Table 6, with comparisons to the service exports reported by the same
countries, mainly to the IMF. The affiliate “exports” are not reported as exports in the BEA
surveys, but as sales by affiliates other than local sales, divided between sales to the United
States and sales to other areas outside the host countries. The comparisons are very imprecise
for a number of reasons. The U.S. affiliate non-local sales of services are incomplete in several
respects. One is that they do not include banking, an important part of service exports
worldwide, because the BEA surveys of banks do not include the extensive list of questions
asked of non-banking parents and their affiliates. Secondly, the BEA data are confined to
majority-owned affiliates, because minority-owned affiliates are not asked the questions about
destination of sales. Third, the BEA data are heavily suppressed, with very little country detail

27
Table 6: Exports of Services Reported by US Firms' Affiliates and by Host Countries ($US, Millions)
1999 2002
Sales by Nonbank Majority-owned
Affiliates to US and Other Foreign
Countries
Exports of Services
Reported by Host
Countries
Sales by Nonbank Majority-owned
Affiliates to US and Other Foreign
Countries
Exports of Services
Reported by Host
Countries
All countries3 52,167 1,157,049 92,890 1,347,677 Canada 2,482 36,117 2,811 39,759 Europe9 27,639 728,272h 58,934 848,517h
Ireland 1,577 15,688 2,917 29,901 Netherlands 2,715 49,210 5,578 56,011 Switzerland 648 29,277 10,643 30,305 United Kingdom 12,440 118,613 23,652 132,990
Latin America and Other Western Hemisphere 11,652 54,707a,b 14,607 58,294a,b
Central & South America5 1,883 41,042b 1,810 44,040b
Other Western Hemisphere6 9,769 13,665a 12,797 14,254a Barbados (D) 1,029 1,282 1,041 Bermuda 6,311 1,486 (D) 1,603
United Kingdom Islands, Caribbean1 881 n. a. 1,540 n. a. Western Hemisphere, n.e.c.2 (D) 8,300a (D) 8,539a
Bermuda & Western Hemisphere, n.e.c.2 (D) 9,786a 9,975 10,142a
Barbados & Western Hemisphere, n.e.c.2 2,577 9,329a (D) 9,580a
Middle East7 586 24,656e 512 27,609e Other Middle East4 (D) 7,585c (D) 11,161d
Asia Pacific8 8,899 273,331f 14,740 327,110g
China 118 26,248 460 39,745 Hong Kong 1,536 35,625 2,060 44,601 Singapore 1,562 26,373 1,379 30,833

28
Notes to Table 6:
1. "United Kingdom Islands, Caribbean" refers to British Antilles, British Virgin Islands, Cayman Islands, Montserrat.
2. "Western Hemisphere, n.e.c." refers to Anguilla, Antigua and Barbuda, Aruba, Bahamas, Cuba, Dominica, French Islands, (Caribbean), Grenada, Haiti, Jamaica, Netherlands Antilles, St. Kitts and Nevis, St. Lucia, St. Vincent and the Grenadines, Trinidad and Tobago, United Kingdom Islands (Atlantic).
3. US is excluded. 4. "Other Middle East" refers to Bahrain, Iran, Jordan, Kuwait, Lebanon, Oman, Qatar, Syria and Yemen. 5. Central America refers to Belize, Costa Rica, El Salvador, Guatemala, Honduras, Mexico, Nicaragua,
Panama; South America, refers to Argentina, Bolivia, Brazil, Chile, Colombia, Ecuador, French Guiana, Guyana, Paraguay, Peru, Suriname, Uruguay, Venezuela.
6. "Other Western Hemisphere" refers to Barbados, Bermuda, Dominican Republic, United Kingdom Islands (Caribbean) and Western Hemipshere, n.e.c..
7. "Middle East" includes Israel, Saudi Arabia, United Arab Emirates and Other Middle East. 8. "Asia Pacific" includes Australia, Bangladesh, Bhutan, Brunei, Burma, Cambodia, China, Fiji, French
Islands (Indian Ocean), French Islands (Pacific), Hong Kong, India, Indonesia, Japan, Korea, Laos, Macau, Malaysia, Marshall Islands, Micronesia, Nauru, Nepal, New Zealand, Pakistan, Papua New Guinea, Philippines, Samoa, Singapore, Sri Lanka, Taiwan, Thailand, Tonga, Vanuatu, Vietnam.
9. "Europe" include Albania, Andorra, Armenia, Austria, Azerbaijan, Belarus, Belgium, Bosnia & Herzegovina, Bulgaria, Croatia, Cyprus, Czech Republic, Denmark, Estonia, Finland, France, Georgia, Germany, Gibraltar, Greece, Greenland, Hungary, Iceland, Ireland, Italy, Kazakhstan, Kyrgyzstan, Latvia, Liechtenstein, Lithuania, Luxembourg, Macedonia, Malta, Moldova, Netherlands, Norway, Poland, Portugal, Romania, Russia, Serbia, Slovakia, Slovenia, Spain, Sweden, Switzerland, Turkey, Turkmenistan, Ukraine, United Kingdom and Uzbekistan.
10. Data include all the countries in "Western Hemisphere, n.e.c." except Cuba, French Islands (Caribbean) and United Kingdom Islands (Atlantic).
11. French Guiana is excluded. 12. Data for Lebanon and Qatar are not available. 13. Data for Iran and Qatar are not available. 14. United Arab Emirates are not available. 15. Data exclude Bhutan, Brunei, Macau, French Islands (Indian Ocean), French Islands (Pacific), Marshall
Islands, Micronesia, Nauru, and Tonga. 16. Data exclude Bhutan, Brunei, Macau, Fiji, French Islands (Indian Ocean), French Islands (Pacific), Laos,
Marshall Islands, Micronesia, Nauru, Papua New Guinea, Samoa, and Tonga. 17. Data exclude Andorra, Gibraltar, Greenland, Liechtenstein, Serbia, Turkmenistan, and Uzbekistan. 18. (D): refers to the suppression of data. Source: Nonbank Majority-owned Affiliates Sales are from US Department of Commerce, Bureau of Economic Analysis, www.bea.doc.gov Exports of Services Reported by Host Countries are from IMF (2006). Exports of Services Reported by Host Countries for Bermuda in 1999 are from United Nations (2002). Exports of Services Reported by Host Countries for Bermuda in 2002 are from website of Statistics Department of Bermuda, www.statistics.gov.bm downloaded on April 10, 2006.

29
available for Caribbean countries that account for much of trade in financial services. That
problem could be solved to some extent by making use of the unpublished and confidential data
that have been collected by the BEA but cannot be examined outside the BEA.
The data reported by the countries to the IMF have other deficiencies. They lack detail,
and more important, several important countries in international trade in services, such as the
Cayman Islands and Bermuda, do not report to the IMF at all. However, Bermuda did report
exports and imports of services in its national accounts.
For the world as a whole, sales of services outside host countries reported by U.S.
affiliates account for less than 10 per cent of aggregate exports of services reported by host
countries. In a few cases, the share of U.S. affiliates is much higher. One example is
Switzerland, where they were more than a third in 2002. For western hemisphere countries
outside of Central and South America, sales outside the host countries by U.S. affiliates were
larger than the aggregate service exports reported by countries in 2002. That was particularly the
case for Bermuda’s reported service exports in its national accounts (Bermuda did not report to
the IMF). In the case of Barbados in 2002, the reported U.S. affiliate service sales outside the
host country were 23 per cent larger than the total service exports reported to the IMF.
Within Europe, where much more country detail is available, the notable change between
1999 and 2002 is that the growth of U.S. affiliate sales outside their host countries was, in a
number of cases, large relative to country reports to the IMF of increases in service exports. In
the Netherlands, U.S. affiliate external sales rose by almost $3 billion, while service exports
reported to the IMF rose by $6.8 billion. In Switzerland, U.S. affiliate external sales of services
increased by $10 billion, while service exports reported to the IMF rose by less than $1 billion.
And in the United Kingdom, U.S. affiliate external sales grew by over $11 billion, while service

30
exports reported to the IMF increased by $14 billion. Those high U.S. affiliate external sales
figures suggest, at a minimum, that there are differences between what the host countries think
their service exports are and what the affiliates consider their external sales of services.
Table 7 gives some hints about the characteristics of U.S. affiliates in various host
countries and what their peculiarities are. Affiliates in the area called “Other Western
Hemisphere,” essentially islands in the Caribbean, own enormous assets relative to their labor
input, measured by employment or employee compensation. For example, while the average
ratio around the world is about $700,000 per employee, the ratios in the three European countries
shown are all over $1.7 million per employee and those for affiliates in “Other Western
Hemisphere” are $9 million per employee. Within that group, affiliates in Bermuda had assets of
over $16 million per employee and those in the UK Islands in the Caribbean, $28 million per
employee. While worldwide, U.S. affiliates owned assets 21 times their payrolls, those in “Other
Western Hemisphere” had assets over 300 times their payrolls. Their activities appear to be very
capital-intensive types of production.
Of course, capital/labor ratios could differ across countries because the industry
composition of production is different. In some cases, it is possible to compare capital/labor
ratios within broad industries. Tables 8 and 9 show the ratios for Depository Institutions and for
Finance (except depository institutions), and Insurance. In the case of depository institutions, in
which the worldwide average assets per employee in U.S. affiliates was $10 million, U.S.
affiliates in “Other Western Hemisphere” owned $117 million of assets per employee. Their
assets were more than 2,000 times their employee compensation, as compared with about 150
times employee compensation worldwide (Table 8).

31
Table 7: Ratios of Total Assets to Other Input Measures: US Affiliates in All Industries, 1999
Ratios of Total Assets3 to
Sales Net Income Employment3 Compensation of
Employees All countries 2.4 34 696 21 Canada 1.3 25 360 11 Europe 2.6 34 941 22
Ireland 1.7 8 1,010~2,020 (D) Netherlands 2.2 16 1,710 37 Switzerland 2.1 14 2,131 31 United Kingdom 5.2 75 1,784 38
Latin America and Other Western Hemisphere 3.3 36 556 34
Central & South America 1.8 32 253 16
Other Western Hemisphere 10.3 39 9,375 335 Bermuda 7.6 19 16,287~32,574 (D) UK Islands, Caribbean1 16.8 63 28,157 462 Western Hemisphere, n.e.c.2 11.4 161 4,116~8,233 (D)
Middle East 3.0 31 1,078 25
Other Middle East4 7.0 45 3,967 100
Asia Pacific 2.0 38 563 20 China 1.4 33 112 17 Hong Kong 2.8 31 1,357 35 Singapore 1.8 35 1,204 37
1. "United Kingdom Islands, Caribbean" comprises British Antilles, British Virgin Islands, Cayman Islands,
Montserrat. 2. “Western Hemisphere, not elsewhere classified" refers to Anguilla, Antigua and Barbuda, Aruba, Bahamas, Cuba,
Dominica, French Islands (Caribbean), Grenada, Haiti, Jamaica, Netherlands Antilles, St. Kitts and Nevis, St. Lucia, St. Vincent and the Grenadines, Trinidad and Tobago, United Kingdom Islands (Atlantic).
3. Thousands of dollars per employee. 4. "Other Middle East" refers to Bahrain, Iran, Jordan, Kuwait, Lebanon, Oman, Qatar, Syria and Yemen. (D): refers to the suppression of data. Source: US Department of Commerce, Bureau of Economic Analysis, www.bea.doc.gov , downloaded on Sept. 23rd, 2005.

32
Table 8: Ratios of Total Assets to Other Input Measures: US Affiliates in Depository Institutions, 1999
Ratios of Total Assets3 to Sales Net Income Employment3 Compensation of Employees
All countries 20.0 503 10,245 168 Canada 14.5 280 2,744 106 Europe 24.0 366 11,766 147
Ireland 21.2 50 3,570~8,922 (D) Netherlands (D) (D) (D) (D) Switzerland 14.4 60 6,970 55 United Kingdom 29.9 1,636 20,080 195
Latin America and Other Western Hemisphere 17.2 -694 12,013 264
Central & South America 5.9 42 2,394 53
Other Western Hemisphere 30.2 -141 117,367 2,347 Bermuda 0 0 0 0 UK Islands, Caribbean1 41.5 -76 153,283 1,703 Western Hemisphere, n.e.c.2 (D) (D) (D) (D)
Middle East 17.2 227 16,593 215
Other Middle East4 (D) (D) (D) (D)
Asia Pacific 17.3 277 7,434 155 China 19.2 -43 8,653 288 Hong Kong 14.6 188 6,402 130 Singapore 20.4 -955 15,921 195
1. "United Kingdom Islands, Caribbean" comprises British Antilles, British Virgin Islands, Cayman Islands,
Montserrat. 2. “Western Hemisphere, not elsewhere classified" refers to Anguilla, Antigua and Barbuda, Aruba, Bahamas, Cuba,
Dominica, French Islands (Caribbean), Grenada, Haiti, Jamaica, Netherlands Antilles, St. Kitts and Nevis, St. Lucia, St. Vincent and the Grenadines, Trinidad and Tobago, United Kingdom Islands (Atlantic).
3. Thousands of dollars per employee. 4. "Other Middle East" refers to Bahrain, Iran, Jordan, Kuwait, Lebanon, Oman, Qatar, Syria and Yemen. (D): refers to the suppression of data. Source: US Department of Commerce, Bureau of Economic Analysis, www.bea.doc.gov , downloaded on Sept. 23rd, 2005.

33
In Other Finance and Insurance, U.S. affiliates worldwide owned $6.6 million in assets
per employee while those in Switzerland owned assets of over $22 million per employee, those
in Bermuda, almost $28 million per employee, and those in “Other UK Islands,” over $60
million per employee. Worldwide, U.S. affiliates in this industry owned assets almost 100 times
their payrolls, but those in Switzerland had assets 175 times their payrolls and those in “Other
Western Hemisphere,” assets 300 to 400 times their payrolls (Table 9).
The data for the two finance sectors make it clear that the loading of assets on to U.S.
affiliates in Switzerland and the Caribbean is not simply a result of the industry composition of
investment in those countries, but represents a choice by parent companies in financial service
industries to attribute assets to these locations.
The assets producing the sales by U.S. affiliates, in countries where the ratio of assets to
labor inputs is particularly high, are not primarily physical assets, as can be seen from Table 10.
The worldwide ratio of total assets to net property, plant, and equipment in U.S. nonbank
affiliates was 5.6 in 1999, but the ratio in the Netherlands was almost 14, in Switzerland, 23, in
Bermuda, 27, and in UK Islands in the Caribbean, 34. Most of the assets of these asset-rich
affiliates were financial assets or intellectual property. It would be hard to define the location of
these assets, and if they are the basis for most of the output of these affiliates, one could say that
only statistical convention places that output in these affiliates’ host countries.
Table 11 displays the “profit-type return” relative to labor compensation, for those
affiliates that are not only nonbank, but also majority-owned for both 1999 and 2002. Profit-type
return “…measures profits before income taxes, and it excludes nonoperating items (such as
special charges and capital gains and losses) and income from equity investments.” (U.S.,
Bureau of Economic Analysis, 2004, p. M-19). These ratios are clearly related to the asset/labor

34
Table 9: Ratios of Total Assets to Other Input Measures: US Affiliates in Finance (except Depository Institutions) and Insurance, 1999
Ratios of Total Assets3 to Sales Net Income Employment3 Compensation of Employees
All countries 11.2 79 6,637 97 Canada (D) (D) (D) (D) Europe 15.0 103 11,131 121
Ireland 14.8 36 15,089 268 Netherlands (D) (D) (D) (D) Switzerland 18.2 89 22,222 175 United Kingdom 17.0 119 13,608 121
Latin America and Other Western Hemisphere 7.8 35 5,015 137
Central & South America 6.5 (D) 1,488 50
Other Western Hemisphere (D) (D) (D) 378 Bermuda 8.5 29 27,725 398 UK Islands, Caribbean1 18.5 72 63,540 304 Western Hemisphere, n.e.c.2 (D) (D) (D) (D)
Middle East (D) (D) (D) (D)
Asia Pacific (D) (D) 3,334 51
China (D) (D) 489~978 (D) Hong Kong (D) (D) 4,342 30 Singapore (D) (D) (D) (D)
1. "United Kingdom Islands, Caribbean" comprises British Antilles, British Virgin Islands, Cayman Islands,
Montserrat. 2. “Western Hemisphere, not elsewhere classified" refers to Anguilla, Antigua and Barbuda, Aruba, Bahamas, Cuba,
Dominica, French Islands (Caribbean), Grenada, Haiti, Jamaica, Netherlands Antilles, St. Kitts and Nevis, St. Lucia, St. Vincent and the Grenadines, Trinidad and Tobago, United Kingdom Islands (Atlantic).
3. Thousands of dollars per employee. (D): refers to the suppression of data. Source: US Department of Commerce, Bureau of Economic Analysis, www.bea.doc.gov , downloaded on Sept. 23rd, 2005.

35
Table 10: Ratio of Total Assets to Net Property, Plant and Equipment
by Nonbank Affiliates of Nonbank US Parents, 1999
Ratio of Total Assets to Net Property, Plant and
Equipment
All countries 5.65 Canada 4.22 Europe 7.44
Ireland 10.78 Netherlands 13.95 Switzerland 23.20 United Kingdom 8.59
Latin America and Other Western Hemisphere 4.66
Central & South America 3.11
Other Western Hemisphere 15.40 Barbados (D) Bermuda 27.57 United Kingdom Islands, Caribbean1 34.33 Western Hemisphere, n.e.c.2 4.04 Bermuda & Western Hemisphere, n.e.c.2 13.10
Middle East 2.19
Other Middle East3 1.49
Asia Pacific 4.56 China 2.90 Hong Kong 7.86 Singapore 7.02
1. "United Kingdom Islands, Caribbean" comprises British Antilles, British Virgin Islands, Cayman Islands,
Montserrat. 2. “Western Hemisphere, not elsewhere classified" refers to Anguilla, Antigua and Barbuda, Aruba, Bahamas, Cuba,
Dominica, French Islands (Caribbean), Grenada, Haiti, Jamaica, Netherlands Antilles, St. Kitts and Nevis, St. Lucia, St. Vincent and the Grenadines, Trinidad and Tobago, United Kingdom Islands (Atlantic).
3. "Other Middle East" refers to Bahrain, Iran, Jordan, Kuwait, Lebanon, Oman, Qatar, Syria and Yemen. (D): refers to the suppression of data.
Source: US Bureau of Economic Analysis (2004).

36
Table 11: Ratio of Profit-type Return to Compensation of Employees by Majority-owned Nonbank Affiliates of US Nonbank Parents
1999 2002
Ratio of Profit-type Return to Compensation of Employees
Ratio of Profit-type Return to Compensation of Employees
All countries 0.557 0.568
Canada 0.586 0.489 Europe 0.439 0.449
Ireland 3.964 5.720 Netherlands 0.793 0.590 Switzerland 0.867 0.991 United Kingdom 0.333 0.238
Latin America and Other Western Hemisphere 0.771 0.618
Central & South America 0.466 0.273
Other Western Hemisphere 6.161 6.231 Barbados 30.884 51.781 Bermuda 13.007 12.889
United Kingdom Islands, Caribbean1 4.249 2.074 Western Hemisphere, n.e.c.2 1.655 3.706 Bermuda & Western Hemisphere, n.e.c.2 6.714 7.735 Barbados & Western Hemisphere, n.e.c.2 4.798 6.904
Middle East 1.084 1.608
Other Middle East3 5.887 8.629
Asia Pacific 0.755 0.861 China 0.670 1.216 Hong Kong 0.898 0.898 Singapore 1.420 1.493
1. "United Kingdom Islands, Caribbean" comprises British Antilles, British Virgin Islands, Cayman Islands, Montserrat.
2. “Western Hemisphere, not elsewhere classified" refers to Anguilla, Antigua and Barbuda, Aruba, Bahamas, Cuba, Dominica, French Islands (Caribbean), Grenada, Haiti, Jamaica, Netherlands Antilles, St. Kitts and Nevis, St. Lucia, St. Vincent and the Grenadines, Trinidad and Tobago, United Kingdom Islands (Atlantic).
3. "Other Middle East" refers to Bahrain, Iran, Jordan, Kuwait, Lebanon, Oman, Qatar, Syria and Yemen. Source: 1. US Bureau of Economic Analysis (2004). 2. US Department of Commerce, Bureau of Economic Analysis, www.bea.doc.gov , downloaded on Sept. 23rd,
2005.

37
ratios of Table 7. While the worldwide ratios of “profit-type return” to payrolls were 56 and 57
per cent in the two years, those for Ireland were 400 and 572 per cent , and those for “Other
Western Hemisphere were over 600 per cent in both years. They were around 1300 per cent for
affiliates in Bermuda, 3000 to 5000 per cent for those in Barbados, and well over 1000 per cent
in UK Islands and other countries in the Caribbean area. The extremely high ratios of capital to
labor income are achieved by attributing large amounts of capital to the affiliates in these
countries.
In the case of one service imported into the United States, insurance services, data are
available for imports in recent years from all sources, not only U.S. affiliates (Table 12). U.S.
imports of insurance services increased rapidly between 2001 and 2003, by more than half. The
tiny islands of the Caribbean, containing a negligible fraction of the world’s population, were
responsible for over half of U.S. imports of insurance services in 2001 and almost half in 2003.
Extreme specialization is not impossible, but it is hard to think of what resources in these islands
are producing all these services.
While the allocation of financial assets to low tax countries is the most common distortion
of the location of production, and along with production, exports and imports, other intangible
assets are subject to similar manipulation and the creation of phantom flows of trade.. In 1997,
Microsoft made a major allocation of intellectual property to an Irish subsidiary, which collects
licensing fees from Microsoft sales to many other countries and, in the process, “…helps the
computer giant shave at least $500 million from its annual tax bill” (Wall Street Journal,
November 7, 2005, p. 1). The subsidiary has “…a thin roster of employees…” and the software
was mostly developed outside Ireland, but the subsidiary “…controls more than $16 billion in
Microsoft assets” (ibid.).

38
Table 12: US Payments for Imports of Insurance Services, 2001-2004 ($US, Millions)
2001 2002 2003 2004
All countries 16,706 22,150 26,561 29,882 Canada 343 554 501 644 Europe 7,121 11,915 13,541 12,051
Netherlands 110 142 166 39 Switzerland 1,232 2,316 2,601 3,104 United Kingdom 2,978 3,848 4,980 3,488
Latin America and Other Western Hemisphere 9,082 9,462 12,294 16,952
Other Western Hemisphere 9,032 9,383 12,242 16,880 Bermuda 7,167 7,499 10,215 12,319 Western Hemisphere, n.e.c.1 1,867 1,884 2,028 4,561
Africa 2 4 1 22 Middle East 4 3 5 4 Asia and Pacific 132 205 205 209
1. " Western Hemisphere, not elsewhere classified" refers to Anguilla, Antigua and Barbuda, Aruba, Bahamas,
Cuba, Dominica, French Islands (Caribbean), Grenada, Haiti, Jamaica, Netherlands Antilles, St. Kitts and Nevis, St. Lucia, St. Vincent and the Grenadines, Trinidad and Tobago, United Kingdom Islands (Atlantic).
Source: Borga and Mann (2004). Nephew, Koncz, Borga and Mann (2005)
39
Publicly available data do not report individual company transactions, but this one,
perhaps in combination with similar moves by other firms, made its mark in a number of places
in aggregate data. It is difficult to compare 1994 and 1999 BEA numbers by industry because of
the shift from the SIC to NAICS industry classifications, but this and similar transactions may
have figured in the more than tenfold growth over that period in the sales of U.S. affiliates in
Ireland classified as “Electronic and Other Electric Equipment” or “Services” in 1994 or as
“Computers and Electronic Products” or “Professional, Scientific and Technical Services” in
1999, from $2.5 billion to $26 billion (U.S. Bureau of Economic Analysis, 1998 and 2004).
There was a considerable growth in employment also, but only from 14 thousand to 36 thousand
(ibid.).
Ireland as a country reported a major growth in exports of services the year after
Microsoft’s move. Exports of “Other Services” jumped from $US 2.3 billion in 1997 to $US
11.6 billion in 1998, of which exports of Computer and Information Services (not reported
before 1998) were $US 5.3 billion (IMF, 2006). It appears that Ireland’s exports of “Other
Services” before 1998 was composed only of royalties and license fees, government services,
n.i.e., and “Other business services”. The fact that there was no decline in the last category in
1998, when reports for five new service exports were added, suggests that they were not included
in this category before that data, and were probably not estimated at all.
Software is not the only corporate asset subject to international shifting for tax purposes.
One news article on such shifts referred to “…patents on drugs, ownership of corporate logos,
techniques for manufacturing processes and other intellectual assets …” and quoted a tax lawyer
as calling such moves routine, “ ‘international tax planning 101’”. He added that “ ‘most of the
assets that are going to be relocated as part of a global repositioning are intellectual

40
property…that is where most of the profit is. When you buy a pair of sneakers for $250, it’s the
swoosh symbol, not the rubber’, you pay for”. (“Key Company Assets Moving Offshore,” New
York Times, Nov. 22, 2002).
Phantom flows are not confined to the services trade account, although they are more
important there than in goods trade. For example, trade statistics have long shown exports of
ships to Panama, Honduras, and Liberia, “flags of convenience,” which became the Pan-Hon-Lib
(or PHL) fleet. These ships were counted in trade statistics as exports to those countries because
the ships were registered there, but they may never have crossed the borders of the three
countries and were never owned by firms located there. The ships were owned “mainly by
residents of the United States, the United Kingdom, and the Continent” (Woolley, 1966, p.43).
The amounts of this trade were substantial. In the 1960s, Liberia was the only country of
the three to which exporters reported significant exports of ships, always less than $1 billion per
year, but by the 1990s, reported exports of ships to Liberia were running at $3 - 4 billion per
year, and exports to Panama were $8-9 billion per year (NBER- UN World Trade Data Base).
While exporting countries reported total exports of goods to Liberia of $13.6 billion
between 1982 and 1987, Liberia reported total imports of only $1.9 billion to the IMF (IMF
2006). Most of the difference was accounted for by $10.2 billion of exports of ships to Liberia
reported by exporting countries but never entered into Liberia’s balance of payments data,
presumably because the ships never entered Liberia and were never owned by residents of
Liberia. Panama had an even larger registered fleet that never crossed the country’s borders, to
judge by the trade data. Total exports to Panama reported by exporters amounted to $169.5
billion from 1984 through 2000, while goods imports reported by Panama to the IMF totaled

41
$82.8 billion over the same period. The difference was more than accounted for by $94.5 billion
in reported exports of ships, not recognized as imports by Panama.
These fleets created corresponding problems for the service accounts. According to
Karreman (1961), “The earnings and disbursements of vessels flying the flags of Panama,
Honduras, and Liberia are not reported at all by those countries, since they ‘do not consider the
vessels as part of their economy.’ Among reasons for registering ships under those flags… is
that those countries do not demand financial statements… and do not levy taxes on the
companies that own the ships. Another reason is that those three countries do not keep a close
watch on labor conditions prevailing on board those ships” (p. 27).
The Definition of Residence: What does the Current Account Balance Measure ?
The Review Committee for Balance of Payments Statistics (1965) suggested that
”balance of payments data are peculiarly elusive” because, “The basic criterion for a balance of
payments transaction is that it is between a domestic and a foreign ‘resident.’…The application
of this set of concepts to concrete situations may involve subtle distinctions, and it is often
difficult to determine residence even when all the facts are known….Distinctions based on the
balance of payments concept of residence have not ordinarily been important in the affairs of
business firms, governments, or households; the concept, therefore, is not normally reflected in
their records. The balance of payments statistician seeking data on international transactions
from these records finds himself asking questions that are likely to be new and alien to the
company’s or the agency’s normal way of thinking.” (pp. 16-17).
As the importance of intangible assets has grown, particularly for the United States, it
may no longer be true that questions of residence are new or alien to the thinking of companies,

42
but the way they have become familiar to companies is different from the way that economists
think of them. For companies, issues of residence, or the location of intangible assets, are
important as tools for minimizing taxes, and companies can manipulate the residence of assets in
ways that do not fit with economists’ concepts of trade and production.
What are the economist’s concepts of trade and the current balance? Meade (1951, p. 34)
defined exports as an element of “…demands for goods and services which directly or indirectly
cause a demand for factors of production (i.e. for the productive services of land, capital,
enterprise and work)…” whose incomes are recorded in the national income. Imports,
correspondingly, lead to a demand for “…the productive resources of other countries.”
If we interpret that criterion as requiring that exports use the factors of production
physically located in a country, several aspects of current practice appear to contradict it. An
example is the treatment of firms “…organized in the United States and controlled by U.S.
interests, but operating abroad” as U.S. residents (U.S. Department of Commerce, 1990, pp. 3-4).
The same is true of the treatment as domestic production, a source of exports, of production
“…undertaken by a resident even though the physical process takes place outside the economic
territory.” (IMF, 1993, p. 23.)
If the object in the balance of payments is not to measure the physical movement of
goods or services, and trade in services does not involve a change in ownership, what is the goal
of the measurement? Writings about the balance of trade, and particularly about the balance of
payments, have often had a whiff of mercantilism about them. That used to be especially clear in
the references to “favorable” or “unfavorable” balances. These terms have virtually disappeared,
but they reflected the traditional purpose of the calculations, which was to know whether a
country was gaining or losing gold. In an international regime aiming at stability of exchange
43
rates, the substitute was the question of demand for and supply of a country’s currency. One
reflection of that aim was the effort to define “autonomous” and “accommodating” transactions,
as in Meade (1951, pp. 11-16). In the United States, there was a search for the appropriate
measure of balance-of-payments deficits or surpluses, the need for which stemmed from the fact
that “Leading countries have established fixed parities for their currencies and have undertaken
to maintain exchange rates within prescribed margins of those parities” (Review Committee for
Balance of Payments Statistics, 1965, p. 2). That purpose too has become obsolete. The Bureau
of Economic Analysis, describing concepts underlying the balance of payments in 1990, does not
provide a purpose for the calculation, but defines it simply as “…a statistical summary of
international transactions…defined as the transfer of ownership of something that has an
economic value measurable in monetary terms from residents of one country to residents of
another” (U.S. Department of Commerce, 1990, p. xiii). The article explaining alternative
frameworks for the international accounts (Landefeld, Whichard, and Lowe, 1993) refers to the
“standard balance of payments” as providing “…indicators of returns to domestic versus foreign
factors of production…” (p. 51), echoing Meade’s description.
A more recent textbook defines a country’s current account balance as “…the change in
the value of its net claims on the rest of the world- the change in its net foreign assets” (Obstfeld
and Rogoff, 1996, p. 4). The issue of residence remains. An intangible asset has no real
geographical location; its only definite location is its ownership. A multinational corporate
owner can choose to assign the ownership of an intangible asset to an affiliate anywhere in the
world. By moving a piece of paper from one pocket to another, the firm changes the apparent
geographical location of an asset, of production from that asset, and the direction of trade flows
from its output. Production that had been taking place in the home country now takes place in

44
the country of assignment of the asset. The home country, or other former nominal location of
the asset, which had been credited with its output, is now reported to be importing that output.
Has anything really happened? Can we accept that there has been a change in the reality we are
trying to measure, or are we being fooled into thinking that some economic event has taken place
when it has not?
Since transfer of ownership from residents of one country to residents of another country
defines trade, the definition of residence is crucial. That definition gives rise to many of the
problems in measuring trade in services discussed above. The effects of the definition of
residence are broader than the balance of payments, extending to the measurement of national
income and product. If income and product are measured from the product, or final use side, the
definition of residence determines which transactions enter the balance of payments. If income
and product are measured from the income side, the definition of residence determines the
geographical allocation of net profits of firms operating in multiple locations.
The issue for income and product accounts is illustrated in the calculation of sub-national
income and product aggregates. In the United States, this has usually been done from the income
side, avoiding the need to measure exports and imports of states, for example. The problem is
then faced in the allocation of profits. In one of the earliest such attempts, for 1919 (Knauth,
1923), the issue gets short shrift, after a brief comment that “The corporate surplus in 1919…is a
difficult item to distribute among the states.” The solution proposed was to distribute it in
proportion to value added in manufacturing. That was intended to be a rough approximation to a
distribution by the location of production. A slightly later estimate (Leven, 1925) attempted to
distribute entrepreneurial and property income by the distribution of the recipients of the income.

45
The current BEA estimates of Gross State Product, most fully described in Friedenberg
and Beemiller (1997), are still based on the income side of the accounts, and therefore do not
have to estimate exports and imports to and from each state, but still suffer to some extent from
the uncertainty about the location of the output reflected in the nonwage part of value added.
However, the basic sources of data are available on an establishment basis for most industries,
and the BEA appears to believe that using establishment data at least reduces the ambiguity
about where the production corresponding to the value added takes place. The greater the
importance of production from intangible assets, the less one can learn from using establishment
data.
In the cases of international service trade based on intangible assets, if the assets
producing these services are exported to some countries by simply placing them on the books of
the affiliates incorporated there, what local resources are used in producing these services? What
is the flow of services from these exporters that is equivalent to the flow of goods measured in
the goods trade accounts? What would be the significance to the U.S. economy of a rise in the
deficit from these imaginary international flows?
If there are what appear to be large distortions in the service trade data, or extreme
flexibility in assigning production of services to locations, they raise questions about the
meaning and purpose of the balance of payments accounts. Procedures for measurement are
often justified by conformity with IMF manuals and the SNA, without much discussion of the
underlying purposes of the measurement. And they rarely discuss the implications, if any, of
moving from a world in which production and trade consist mostly of goods to a world in which
most production is in the form of services, and the implications of moving from a world in which
production within a firm is located in a firm’s home country to a world in which production

46
within a firm combines inputs located in many countries or worse, inputs with no definite
geographical location.
The issue here is not what tax havens and the shifting of assets do to home and host
country tax revenues. The focus is on the tiny tax havens because some of them have so little
production outside of tax avoidance activities that it is relatively clear what is going on there.
However, much the same problem in measuring flows of services must exist, more hidden, in
larger countries. The question is whether we are, by our ways of measuring, creating phantom
international flows of some services that may not be crossing international borders at all.
Services that are produced and consumed entirely within the United States without crossing
borders may appear to be imported into the United States and exported from some Caribbean
Island. What do we learn about the economy of the United States or of the “exporting country”
from observing these phantom flows?
Various ways have been suggested for incorporating production by foreign affiliates into
international accounts by producing accounts on what is referred to as an “ownership” rather
than a “residency” basis. While these accounts are not intended as replacements for the standard
balance of payments accounts, and some of them are intended for different purposes, such as
measuring the shares of world sales or production controlled by a country’s firms, they
sometimes do, in the process, escape from counting transactions that do not really take place by
combining the operations of parent firms with those of their foreign affiliates. Several papers
(Lipsey and Kravis, 1985, 1987, and 1992 and Blomström and Lipsey, 1989 and 1993) attempted
to measure and explain shares in world exports of firms based in the United States and Sweden,
combining the exports of parent firms with those of their foreign affiliates. Recalculations of the
payments balance along ownership, rather than geographical lines were suggested by DeAnne

47
Julius (1990), and by a National Research Council panel (National Research Council, Panel on
Foreign Trade Statistics, 1992) and carried out for the United States in Baldwin and Kimura
(1998) and for Japan in Kimura and Baldwin (1998). The Bureau of Economic Analysis now
regularly publishes an ownership-based current account for the United States, explained in
Landefeld, Whichard, and Lowe (1993). The latest of these is U.S. Bureau of Economic
Analysis (2006).
The common feature of these alternative measures is that they are based on the ownership
of the productive resources or of the firms in which production takes place, rather than the
location of the resources. In this way, they net out the effects of some of what I have described
as phantom transactions in the ownership-based accounts, although they do not remove them
from the standard accounts. For example, the transfer of intangible assets to a foreign affiliate
would, in the BEA ownership-based accounts, still reduce the service exports of the United
States, but that reduction would presumably be offset by an increase in the sales by foreign
affiliates, from which purchases by the affiliates from the United States and payments to foreign
factors of production would be subtracted. Similarly, increased purchases of insurance services
from re-insurance affiliates in the Caribbean would still appear in imports of services, but the
negative effect on the current balance would be offset, again, by increases in export sales by
foreign affiliates.
The calculations by Baldwin and Kimura are more focused on the ownership of
production, adding the production, or value added, by U.S. affiliates abroad to production in the
United States by U.S.-owned firms. They do not subtract the payments to foreign labor by U.S.
affiliates, as the BEA calculations do, since those payments are part of the value added under the
control of U.S. firms, even though they are payments for resources resident abroad. However,

48
this calculation washes out the effects of our “phantom” transactions, as the BEA calculation
does. The transfer of intangible assets to a U.S. affiliate overseas does not move the production
from that asset out of the U.S. firm, even though it moves it geographically.
Given the ease with which the nominal location of production, imports, and exports from
intangible assets can be manipulated, the path of these variables might be better represented by
consistently attributing them to parent companies, the ultimate beneficial owners, in BEA
terminology.
Summary and Conclusions
Trade in services is more difficult to define and measure than trade in goods, and as a
consequence, its size and growth are much less certain. A world total in recent years of a little
under $2,000 billion, is the reported value, approximately one quarter of world trade in goods.
The trend in the importance of services trade is even harder to guess, because the number of
services measured and the number of countries measuring service trade has increased, especially
since 1975. Despite those increases, there is only slight evidence of a rise in the importance of
service trade relative to goods trade.
Since the United States has been a leader in measuring service trade, the data are more
complete than those for the world. Service exports have recently been over 40 per cent of goods
exports, while service imports have been only about 20 per cent of goods imports, but service
imports have been growing much faster than service exports in the last five years. The current
large importance of services in U.S. exports is not unprecedented. Service exports were about 30
per cent of goods exports in the first three decades of the existence of the United States. They

49
fell to low levels (5 per cent or less of goods exports) at the end of the 19th Century and the
beginning of the 20th, and have been rising since then.
Relative to goods and services output, service exports and imports are much smaller than
goods exports and imports, especially the imports. Service exports and imports are about 5 per
cent of services output, while goods imports are over a third of goods output and goods exports
are over 20 per cent of goods output. Both goods and services exports are at historically high
levels relative to output, compared to the period since 1869, and the same is true for goods
imports, which have risen steadily since 1950 after a long secular decline from 1869 to World
War II. Changes in services imports relative to services output have been much smaller, and the
ratio for 2000-2005 is not very different from that for 1869-73.
The measures of service trade, because they are not anchored in any observation of
physical movement, are, much more than those of goods trade, determined by the definition of
residence, since residence, rather than an observed movement of a final product, determines what
is an export or import. The problem is illustrated by the case of trade in educational services,
because the determination that an ostensibly domestic transaction is an import or export rests on
a difference in residence between the provider and the acquirer of the service. A paradoxical
aspect of this definition is that, especially in the United States, much of the “exported”
educational service never leaves the United States because the recipients decide to become U.S.
residents. What would be necessary to close this gap between the service trade measure and
reality would be an account for flows of human capital which would show the service imported
into the United States in the form of human capital. An alternative would be to treat the
educational expenditure as an internal trade within the United States until the recipient crossed
the border to return home, if he or she did so, and then enter it into exports of services. A

50
drawback of this scheme is that it would not account for the re-import of previously exported
services when the recipient of a U.S. education returned to the United States at a later date.
The most serious problem for the measurement of service trade is the expanding use of
the placement of intangible assets by parent firms in low tax jurisdictions. Since the assets are
intangible, including financial assets, patents, trade marks, rights to designs, corporate logos,
they have no particular geographical location, and can be attributed by the parent company of a
multinational to any of its affiliates. The result is that the output and exports stemming from
these assets can also be attributed to geographical locations almost at will, subject to some
limited regulation by tax authorities, without any relation to the actual location of any physical
aspect of the production. A large part of service production, exports, and imports can begin to
consist of “phantom” production and trade that makes no use of factors of production actually
resident in the countries to which they are attributed. If that takes place to an important degree,
the measures of the current balance and national income and output begin to lose their meaning.
Some evidence of the effects of shifts in residence of assets is available for the United
States, because the data are most complete, but the same phenomena must affect the data for
other countries. Furthermore, they are not confined to service trade, but affect measures of
goods trade as well. The only solution that seems feasible is to consolidate the operations of
multinational parents and their affiliates in the data, attributing all operations to the parent
country, and counting as trade only transactions outside the multinational firm, between
segments of the firm and unaffiliated entities. The closest approximation to this is the
“ownership-based” accounts of the BEA, but these are not incorporated into the international
transactions accounts or national accounts in general. Perhaps it is time to take the ownership
accounts more seriously.

51
Appendix Appendix Table A: Service Exports and Imports as Percent of Goods Exports and Imports
22 Countriesa 30 Countriesb Year Exports Imports Exports Imports 1972 24.25 27.06 n.a. n.a. 1973 22.12 25.17 n.a. n.a. 1974 18.77 21.39 n.a. n.a. 1975 20.69 24.17 n.a. n.a. 1976 21.19 23.80 n.a. n.a. 1977 21.46 23.55 22.21 24.09 1978 22.21 24.20 22.93 24.89 1979 20.78 24.24 21.70 24.45 1980 20.13 23.81 21.36 24.05 1981 20.75 25.20 21.88 25.75 1982 23.13 26.60 23.46 26.42 1983 23.92 26.16 23.65 26.27 1984 23.24 24.48 22.68 24.91 1985 23.82 24.23 22.97 24.54 1986 25.32 24.79 23.86 25.56 1987 25.41 24.70 24.28 25.86 1988 24.21 24.19 23.38 25.85 1989 24.36 24.11 23.78 25.99 1990 25.72 25.73 25.22 27.38 1991 26.75 26.95 26.14 28.68 1992 28.12 27.48 27.28 29.60 1993 28.60 27.35 27.65 30.06 1994 27.52 25.98 26.19 28.07 1995 25.89 24.76 24.76 26.59 1996 26.61 25.34 25.52 26.98 1997 26.92 25.02 25.68 26.56 1998 27.90 25.31 26.67 27.01 1999 28.49 25.35 27.23 26.99 2000 26.87 24.07 26.18 25.50 2001 27.64 25.31 27.20 26.57 2002 28.87 25.84 27.68 27.03 2003 28.45 25.91 27.41 26.84
a. 22 countries include Australia, Austria, Barbados, Canada, Colombia, Dominican Rep., Germany,
Haiti, Israel, Italy, Jordan, Malta, Netherlands, New Zealand, Romania, Saudi Arabia, Singapore, South Africa, Sweden, United Kingdom, United States and Venezuela.
b. 30 countries include the 22 countries, plus Argentina, Belgium-Luxembourg, Brazil, Denmark,
Finland, France, India and Japan.
Source: IMF (2006).

52
Appendix Table B: Goods and Service Exports and Imports by Fixed Sets of Countries, 1972-2003 ($US, Billions)
22 Countriesa 30 Countriesb Goods Services Goods Services
Year Credit Debit Credit Debit Credit Debit Credit Debit 1972 215.9 210.2 52.3 56.9 n.a. n.a. n.a. n.a.1973 298.3 281.4 66.0 70.8 n.a. n.a. n.a. n.a.1974 426.4 403.5 80.0 86.3 n.a. n.a. n.a. n.a.1975 444.4 408.9 92.0 98.8 n.a. n.a. n.a. n.a.1976 494.0 472.9 104.7 112.6 n.a. n.a. n.a. n.a.1977 553.8 545.3 118.9 128.4 769.1 748.2 170.8 180.31978 642.2 636.6 142.7 154.1 898.4 870.3 206.0 216.61979 825.0 803.8 171.4 194.8 1,114.8 1,101.3 241.9 269.31980 1,008.3 957.6 202.9 228.0 1,352.8 1,328.5 288.9 319.51981 1,001.0 936.6 207.8 236.0 1,374.5 1,308.1 300.7 336.81982 914.3 884.7 211.5 235.3 1,259.2 1,231.0 295.3 325.21983 865.2 883.5 206.9 231.1 1,217.5 1,206.9 287.9 317.11984 906.6 974.2 210.7 238.5 1,290.7 1,304.4 292.8 325.01985 914.5 986.0 217.8 238.9 1,310.2 1,318.9 300.9 323.61986 1,019.8 1,096.2 258.2 271.8 1,486.7 1,465.0 354.8 374.41987 1,199.8 1,282.3 304.9 316.7 1,736.0 1,724.6 421.5 445.91988 1,386.4 1,447.1 335.6 350.1 2,002.5 1,956.0 468.1 505.71989 1,495.4 1,548.4 364.3 373.3 2,142.8 2,105.8 509.5 547.31990 1,728.8 1,754.4 444.6 451.4 2,454.9 2,403.0 619.2 657.91991 1,753.8 1,783.5 469.2 480.6 2,500.7 2,422.9 653.7 695.01992 1,848.7 1,900.5 519.9 522.3 2,658.4 2,557.3 725.2 757.01993 1,806.4 1,844.9 516.7 504.6 2,599.8 2,461.6 718.7 740.01994 2,029.8 2,072.2 558.6 538.4 2,926.4 2,792.7 766.3 784.01995 2,444.7 2,453.5 633.0 607.4 3,505.7 3,352.3 867.9 891.51996 2,568.6 2,548.3 683.6 645.7 3,610.5 3,479.8 921.4 938.91997 2,647.8 2,661.4 712.7 666.0 3,704.9 3,586.3 951.2 952.71998 2,616.7 2,727.0 730.2 690.2 3,658.8 3,621.2 975.8 978.21999 2,678.5 2,892.5 763.2 733.3 3,751.9 3,813.1 1,021.6 1,029.32000 2,930.8 3,219.4 787.5 774.8 4,082.2 4,246.1 1,068.8 1,082.72001 2,827.6 3,070.6 781.6 777.2 3,901.3 4,046.3 1,061.0 1,075.32002 2,879.1 3,152.9 831.3 814.9 3,998.0 4,115.7 1,106.8 1,112.62003 3,293.6 3,581.4 937.0 927.8 4,600.3 4,714.9 1,261.0 1,265.6World
(2003, 145 countries)
7,250.3 7,231.6 1,863.7 1,836.4 7,250.3 7,231.6 1,863.7 1,836.4
a. 22 countries include Australia, Austria, Barbados, Canada, Colombia, Dominican Rep., Germany, Haiti, Israel, Italy, Jordan, Malta, Netherlands, New Zealand, Romania, Saudi Arabia, Singapore, South Africa, Sweden, United Kingdom, United States and Venezuela.
b. 30 countries include the 22 countries, plus Argentina, Belgium-Luxembourg, Brazil, Denmark, Finland, France, India and Japan.
Source: IMF (2006)

53
Appendix Table C: U.S. Trade in Goods and Services, Decade Averages, 1790~1999 and Annually, 2000~2005 [Millions of USD]
Services Goods Year Exports Imports Exports Imports
1790~1799a 14.5 2.2 43.5 53.9 1800~1809 28.2 3.9 75.9 96.4 1810~1819 20.2 2.1 59.8 82.0 1820~1829b 12.4 2.3 69.7 74.1 1830~1839 13.0 3.9 98.7 118.0 1840~1849 18.4 5.8 118.0 113.8 1850~1859 24.8 26.3 231.6 277.1 1860~1869c, d 29.4 43.5 263.6 333.7 1870~1879 35.2 60.8 566.7 525.9 1880~1889 36.8 91.9 780.8 714.3 1890~1899 37.6 104.2 980.3 770.0 1900~1909e 36.8 209.6 1,705.1 1,157.7 1910~1919 251 642 4,255 2,304 1920~1929 530 869 5,151 4,034 1930~1939 398 659 2,710 2,261 1940~1949 2,288 2,375 11,655 4,997 1950~1959 2,850 5,381 14,765 11,831 1960~1969f 5,855 9,662 26,462 22,368 1960~1969 8,854 9,751 26,479 22,397 1970~1979 25,179 23,009 97,405 107,788 1980~1989 80,100 70,627 246,379 340,491 1990~1999 213,616 145,421 542,098 716,011
2000 299,490 225,348 771,994 1,224,408 2001 288,426 223,967 718,712 1,145,900 2002 294,854 233,737 682,422 1,164,720 2003 309,146 256,664 713,421 1,260,717 2004 343,912 296,105 807,536 1,472,926 2005p 379,604 321,578 892,619 1,674,261
Note: a: From 1790 to 1819, exports of services include only freight earnings; imports of services include only insurance earnings; exports of
goods include exports of merchandise and sales of ships. b. From 1820 to 1860, exports of services include freight earnings, port charges, and tourist expenditures; imports of services include
freight earnings of foreign ships, and tourist expenditures; exports of goods include exports of merchandise and sales of ships. c. Exports and imports of goods in 1860 Includes specie. d. From 1861 to 1900, exports of services are equal to total shipping income plus foreign tourist expenditures plus port outlays of
foreign passenger steamships; imports of services are equal to total shipping payments plus U.S. tourist expenditures. Exports of goods are the sum of exports of merchandise and the sales of ships.
e. From 1901 to 1970, exports of services are sums of transportation, travel, and other transactions; imports of services are sums of transportation, travel, direct military expenditures, and other transactions.
f. Data from 1960 to 1970 are available both from the Historical Statistics of U. S. and from the BEA website. Both of them are shown here for comparing. The first one is from Historical Statistics of U.S. and the second one is from BEA website.
p: preliminary
Source: 1790~1860: North (1960), Tables A-4, B-2, and B-3. 1861~1900: Simon (1960), Table 27.

54
1901~1959: U.S.Bureau of the Census (1975). 1960~2005, BEA website, http://www.bea.gov/bea/di1.htm (downloaded on March 14th, 2006)
Appendix Table D: U.S. Trade in and Output of Services, 1929~2005 % of Output
Year Exports
[$US, Millions] Imports
[$US, Millions] Output of Services1
[$US, Billions] Exports Imports 1869-1873 37 59 1.6 2.34 3.74 1872-1876 37 66 1.8 2.09 3.73 1877-1881 32 62 2.3 1.37 2.64 1882-1886 38 91 2.9 1.33 3.19 1887-1891 37 109 3.1 1.21 3.55 1892-1896 38 99 3.4 1.12 2.92 1897-1901 35 125 4.4 0.78 2.82 1902-1906 28 189 6.5 0.43 2.89 1907-1911 57 310 8.9 0.64 3.48 1912-1916 103 366 11.7 0.88 3.13 1917-1921 708 1,166 18.5 3.83 6.30 1922-1926 416 743 26.7 1.56 2.78 1927-1931 483 966 30.7 1.57 3.15 1931~1935 308 558 29.2 1.06 1.91 1936~1940 525 703 34.5 1.52 2.04 1941~1945 2,739 2,892 81.8 3.35 3.54 1946~1950 2,074 2,221 90.0 2.30 2.47 1951~1955 2,517 4,778 142.0 1.77 3.37 1956~1960a 3,594 6,985 194.0 1.85 3.60
1960a 6,290 7,674 217.9 2.89 3.52 1961~1965 7,450 8,371 267.0 2.79 3.14 1965~1970 11,334 11,935 390.5 2.90 3.06 1971~1975 20,424 18,897 638.9 3.20 2.96 1976~1980 36,617 32,516 1,072.7 3.41 3.03 1981~1985 66,013 58,567 1,807.1 3.65 3.24 1986~1990 114,238 97,920 2,700.8 4.23 3.63 1991~1995 189,402 127,252 3,711.1 5.10 3.43 1996~2000 268,161 185,127 4,831.7 5.55 3.83 2001~2005 323,188 266,410 6,413.1 5.04 4.15
Note: 1. Output of services are in current prices. a. Data of 1960 are available from both the U.S. Bureau of the Census (1975) and the BEA website. The one from the U.S. Bureau of Census
is used in calculating annual averages. p: trade statistics in 2005 are preliminary. Source: Trade 1869~1900: Five-year averages calculated from Simon (1960). Trade 1901~1931: Five-year averages calculated from U.S. Bureau of Census (1975), Table U 1-25, page 864~866. Trade 1929~1960: Five-year averages calculated from U.S. Bureau of Census (1975), Table U 1-25, page 864~866. Trade 1960~2005: Five-year averages calculated from BEA website, http://www.bea.gov/bea/di1.htm (downloaded on March 14th,
2006). Output of Services 1869~1931: U.S. Bureau of Census (1975), Table F 71-97, page 231. Output of Services 1929~2005: Five-year averages calculated from BEA website, http://www.bea.gov/bea/dn1.htm (downloaded on March
20th, 2006).

55
Appendix Table E: U.S. Trade in and Output of Goods1, 1929~2005 % of Output
Year Exports
[$US, Millions] Imports
[$US, Millions] Output of Goods
[$US, Billions] Exports Imports 1869-1873 438 545 4.2 10.45 13.01 1872-1876 544 583 4.6 11.89 12.75 1877-1881 768 540 5.5 14.10 9.90 1882-1886 764 698 6.8 11.29 10.31 1887-1891 802 804 7.1 11.23 11.25 1892-1896 900 780 7.4 12.22 10.60 1897-1901 1,298 774 9.3 14.02 8.36 1902-1906 1,657 1,131 13.1 12.69 8.67 1907-1911 2,002 1,467 16.8 11.92 8.74 1912-1916 3,322 1,949 21.4 15.50 9.10 1917-1921 6,958 3,612 42.0 16.59 8.61 1922-1926 4,574 3,905 45.7 10.01 8.54 1927-1931 4,400 3,617 48.2 9.13 7.51 1931~1935 2,108 1,840 33.1 6.37 5.56 1936~1940 3,351 2,601 47.1 7.12 5.53 1941~1945 11,817 4,360 92.7 12.75 4.71 1946~1950 12,708 6,910 139.3 9.12 4.96 1951~1955 13,491 10,974 184.0 7.33 5.96 1956~1960a 17,928 13,820 225.4 7.96 6.13
1960a 19,650 14,758 243.4 8.07 6.06 1961~1965 23,025 17,611 280.0 8.22 6.29 1965~1970 33,158 30,422 382.7 8.66 7.95 1971~1975 73,901 74,774 576.1 12.83 12.98 1976~1980 157,265 182,779 947.4 16.60 19.29 1981~1985 217,168 290,423 1,398.2 15.53 20.77 1986~1990 308,220 440,296 1,888.0 16.33 23.32 1991~1995 477,744 607,001 2,389.6 19.99 25.40 1996~2000 683,371 970,215 3,084.4 22.16 31.46 2001~2005p 762,942 1,343,705 3,614.5 21.11 37.18
Note: 1.Output of Goods refers to the final sales and are in current dollars. a. Data of 1960 are available from both the U.S. Bureau of the Census (1975) and the BEA website. The one from the U.S. Bureau of Census
is used in calculating annual averages. p: trade statistics in 2005 are preliminary. Source: Trade 1869~1900: Five-year averages calculated from Simon (1960). Trade 1901~1931: Five-year averages calculated from U.S. Bureau of Census (1975), Table U 1-25, page 864~866. Trade 1929~1960: Five-year averages calculated from U.S. Bureau of Census (1975), Table U 1-25, page 864~866. Trade 1960~2005: Five-year averages calculated from BEA website, http://www.bea.gov/bea/di1.htm (downloaded on March 14th,
2006). Output of Goods 1869~1931: U.S. Bureau of Census (1975), Table F 71-97, page 231.
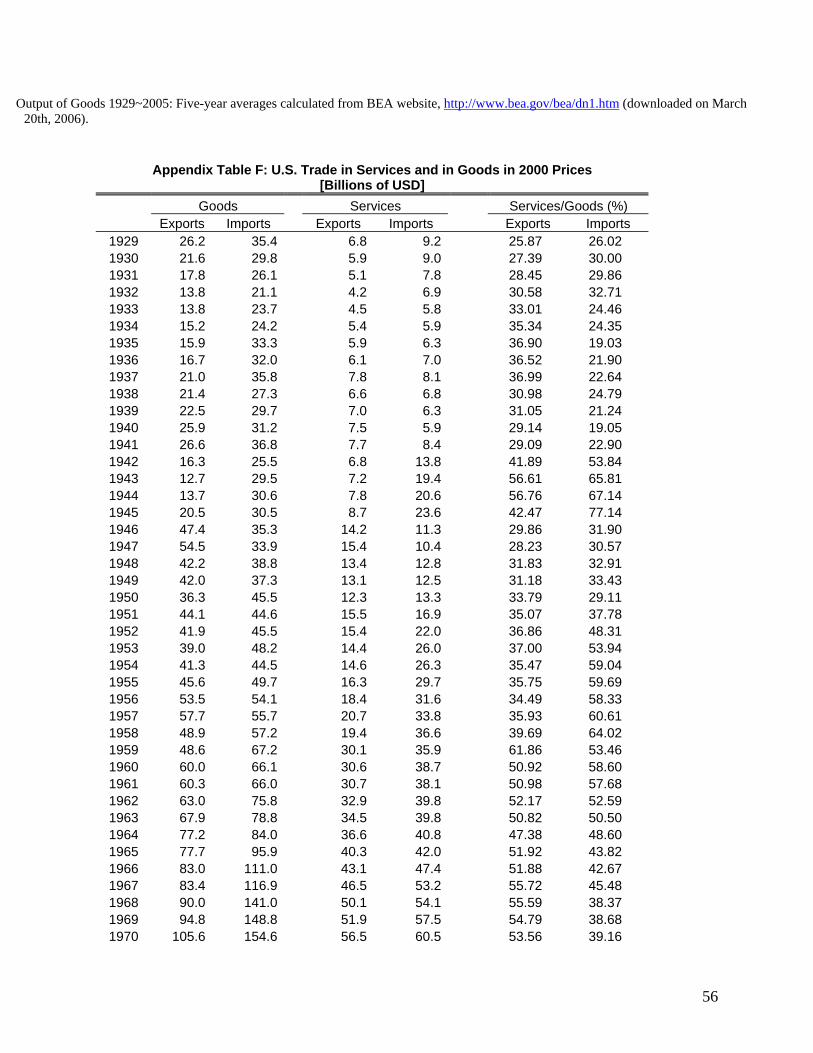
56
Output of Goods 1929~2005: Five-year averages calculated from BEA website, http://www.bea.gov/bea/dn1.htm (downloaded on March 20th, 2006).
Appendix Table F: U.S. Trade in Services and in Goods in 2000 Prices [Billions of USD]
Goods Services Services/Goods (%) Exports Imports Exports Imports Exports Imports 1929 26.2 35.4 6.8 9.2 25.87 26.02 1930 21.6 29.8 5.9 9.0 27.39 30.00 1931 17.8 26.1 5.1 7.8 28.45 29.86 1932 13.8 21.1 4.2 6.9 30.58 32.71 1933 13.8 23.7 4.5 5.8 33.01 24.46 1934 15.2 24.2 5.4 5.9 35.34 24.35 1935 15.9 33.3 5.9 6.3 36.90 19.03 1936 16.7 32.0 6.1 7.0 36.52 21.90 1937 21.0 35.8 7.8 8.1 36.99 22.64 1938 21.4 27.3 6.6 6.8 30.98 24.79 1939 22.5 29.7 7.0 6.3 31.05 21.24 1940 25.9 31.2 7.5 5.9 29.14 19.05 1941 26.6 36.8 7.7 8.4 29.09 22.90 1942 16.3 25.5 6.8 13.8 41.89 53.84 1943 12.7 29.5 7.2 19.4 56.61 65.81 1944 13.7 30.6 7.8 20.6 56.76 67.14 1945 20.5 30.5 8.7 23.6 42.47 77.14 1946 47.4 35.3 14.2 11.3 29.86 31.90 1947 54.5 33.9 15.4 10.4 28.23 30.57 1948 42.2 38.8 13.4 12.8 31.83 32.91 1949 42.0 37.3 13.1 12.5 31.18 33.43 1950 36.3 45.5 12.3 13.3 33.79 29.11 1951 44.1 44.6 15.5 16.9 35.07 37.78 1952 41.9 45.5 15.4 22.0 36.86 48.31 1953 39.0 48.2 14.4 26.0 37.00 53.94 1954 41.3 44.5 14.6 26.3 35.47 59.04 1955 45.6 49.7 16.3 29.7 35.75 59.69 1956 53.5 54.1 18.4 31.6 34.49 58.33 1957 57.7 55.7 20.7 33.8 35.93 60.61 1958 48.9 57.2 19.4 36.6 39.69 64.02 1959 48.6 67.2 30.1 35.9 61.86 53.46 1960 60.0 66.1 30.6 38.7 50.92 58.60 1961 60.3 66.0 30.7 38.1 50.98 57.68 1962 63.0 75.8 32.9 39.8 52.17 52.59 1963 67.9 78.8 34.5 39.8 50.82 50.50 1964 77.2 84.0 36.6 40.8 47.38 48.60 1965 77.7 95.9 40.3 42.0 51.92 43.82 1966 83.0 111.0 43.1 47.4 51.88 42.67 1967 83.4 116.9 46.5 53.2 55.72 45.48 1968 90.0 141.0 50.1 54.1 55.59 38.37 1969 94.8 148.8 51.9 57.5 54.79 38.68 1970 105.6 154.6 56.5 60.5 53.56 39.16

57
1971 105.2 167.5 60.9 58.8 57.92 35.10 1972 116.5 190.3 60.5 61.3 51.97 32.21 1973 143.2 203.8 64.8 59.2 45.25 29.07 1974 154.6 198.1 69.9 59.2 45.19 29.87
Goods Services Services/Goods (%) Exports Imports Exports Imports Exports Imports 1975 151.0 173.1 74.1 56.6 49.11 32.69 1976 158.2 212.3 76.3 60.5 48.27 28.50 1977 160.2 238.2 81.3 63.5 50.72 26.67 1978 178.1 259.5 88.1 68.1 49.44 26.22 1979 199.2 264.0 90.8 69.0 45.57 26.14 1980 222.9 244.4 96.4 67.5 43.26 27.60 1981 220.5 249.4 106.7 71.3 48.39 28.60 1982 200.6 243.2 103.7 75.1 51.73 30.90 1983 194.8 276.2 102.0 81.2 52.37 29.40 1984 210.2 343.0 111.1 101.6 52.86 29.61 1985 218.0 364.5 112.4 109.3 51.59 29.99 1986 229.1 401.8 128.9 110.7 56.25 27.54 1987 254.6 420.5 141.9 123.6 55.75 29.40 1988 302.5 437.5 154.8 127.8 51.15 29.21 1989 338.6 456.2 170.7 134.0 50.41 29.37 1990 367.1 469.7 188.6 142.7 51.38 30.38 1991 392.5 469.3 199.9 139.0 50.93 29.62 1992 421.8 513.1 210.8 135.5 49.98 26.40 1993 435.6 564.8 217.5 139.4 49.93 24.69 1994 477.9 640.0 231.1 147.3 48.36 23.02 1995 533.9 697.7 245.8 152.1 46.03 21.81 1996 581.1 762.7 263.5 160.5 45.35 21.04 1997 664.4 872.6 279.2 175.6 42.02 20.13 1998 679.3 974.5 287.2 195.6 42.28 20.08 1999 705.1 1,095.2 303.2 209.2 43.00 19.10 2000 784.3 1,243.5 311.9 232.3 39.77 18.68 2001 736.2 1,204.1 300.4 231.6 40.80 19.24 2002 707.0 1,248.2 306.0 236.5 43.28 18.95 2003 719.7 1,309.3 311.2 243.7 43.24 18.62 2004 783.5 1,452.8 334.1 267.1 42.64 18.39 2005 841.0 1,553.1 354.1 276.7 42.10 17.82
Source: BEA website: http://www.bea.gov/bea/dn1.htm (downloaded on May 3rd, 2006)

58
Appendix Table G: U.S. Trade in Goods and Output of Goods in 2000 Prices, 1929~2005 % of Output
Year Exports
[$US, Billions] Imports
[$US, Billions] Output of Goods
[$US, Billions] Exports Imports 1929 26.2 35.4 254.9 10.30 13.891930 21.6 29.8 232.0 9.29 12.861931 17.8 26.1 217.5 8.20 11.981932 13.8 21.1 188.2 7.34 11.191933 13.8 23.7 184.6 7.45 12.821934 15.2 24.2 206.6 7.34 11.721935 15.9 33.3 223.6 7.11 14.881936 16.7 32.0 258.2 6.48 12.411937 21.0 35.8 273.4 7.69 13.111938 21.4 27.3 265.1 8.06 10.301939 22.5 29.7 285.3 7.90 10.421940 25.9 31.2 310.4 8.34 10.051941 26.6 36.8 356.4 7.45 10.331942 16.3 25.5 389.3 4.19 6.561943 12.7 29.5 462.6 2.76 6.391944 13.7 30.6 493.7 2.77 6.211945 20.5 30.5 494.3 4.15 6.181946 47.4 35.3 488.5 9.71 7.221947 54.5 33.9 514.0 10.61 6.591948 42.2 38.8 508.7 8.30 7.631949 42.0 37.3 516.8 8.12 7.221950 36.3 45.5 539.4 6.72 8.441951 44.1 44.6 566.6 7.79 7.881952 41.9 45.5 583.2 7.18 7.811953 39.0 48.2 612.6 6.37 7.871954 41.3 44.5 611.1 6.75 7.281955 45.6 49.7 657.6 6.93 7.551956 53.5 54.1 672.9 7.95 8.041957 57.7 55.7 685.8 8.41 8.121958 48.9 57.2 658.3 7.44 8.701959 48.6 67.2 698.5 6.96 9.621960 60.0 66.1 721.1 8.32 9.161961 60.3 66.0 727.7 8.29 9.071962 63.0 75.8 766.2 8.22 9.891963 67.9 78.8 797.5 8.52 9.881964 77.2 84.0 853.5 9.05 9.851965 77.7 95.9 912.6 8.51 10.511966 83.0 111.0 979.6 8.48 11.341967 83.4 116.9 991.4 8.42 11.791968 90.0 141.0 1,035.7 8.69 13.621969 94.8 148.8 1,070.4 8.85 13.90

59
1970 105.6 154.6 1,082.5 9.75 14.281971 105.2 167.5 1,097.6 9.58 15.261972 116.5 190.3 1,171.6 9.94 16.251973 143.2 203.8 1,277.5 11.21 15.95
% of Output
Year Exports
[$US, Billions] Imports
[$US, Billions] Output of Goods
[$US, Billions] Exports Imports 1974 154.6 198.1 1,274.1 12.13 15.551975 151.0 173.1 1,288.0 11.72 13.441976 158.2 212.3 1,342.2 11.78 15.821977 160.2 238.2 1,398.0 11.46 17.041978 178.1 259.5 1,487.0 11.98 17.451979 199.2 264.0 1,564.7 12.73 16.871980 222.9 244.4 1,588.7 14.03 15.381981 220.5 249.4 1,610.1 13.69 15.491982 200.6 243.2 1,588.7 12.62 15.301983 194.8 276.2 1,643.5 11.85 16.801984 210.2 343.0 1,746.9 12.03 19.641985 218.0 364.5 1,837.0 11.86 19.841986 229.1 401.8 1,907.6 12.01 21.061987 254.6 420.5 1,964.9 12.95 21.401988 302.5 437.5 2,097.0 14.43 20.861989 338.6 456.2 2,202.2 15.38 20.721990 367.1 469.7 2,244.3 16.36 20.931991 392.5 469.3 2,228.8 17.61 21.061992 421.8 513.1 2,297.7 18.36 22.331993 435.6 564.8 2,380.3 18.30 23.731994 477.9 640.0 2,493.8 19.16 25.661995 533.9 697.7 2,614.9 20.42 26.681996 581.1 762.7 2,747.3 21.15 27.761997 664.4 872.6 2,904.5 22.88 30.041998 679.3 974.5 3,063.6 22.17 31.811999 705.1 1,095.2 3,246.4 21.72 33.742000 784.3 1,243.5 3,392.8 23.12 36.652001 736.2 1,204.1 3,421.9 21.52 35.192002 707.0 1,248.2 3,419.7 20.67 36.502003 719.7 1,309.3 3,531.2 20.38 37.082004 783.5 1,452.8 3,721.2 21.06 39.042005 841.0 1,553.1 3,932.6 21.39 39.49
Source: BEA website: http://www.bea.gov/bea/dn1.htm (downloaded on May 3rd, 2006)

60
Appendix Table H: U.S. Trade in Services and Output of Services in 2000 Prices, 1929~2005 % of Output
Year Exports
[$US, Billions] Imports
[$US, Billions] Output of Services
[$US, Billions] Exports Imports 1929 6.8 9.2 457.5 1.48 2.011930 5.9 9.0 452.8 1.30 1.981931 5.1 7.8 445.2 1.14 1.751932 4.2 6.9 423.4 1.00 1.631933 4.5 5.8 417.7 1.09 1.391934 5.4 5.9 441.5 1.21 1.341935 5.9 6.3 453.5 1.29 1.401936 6.1 7.0 479.9 1.27 1.461937 7.8 8.1 490.5 1.59 1.651938 6.6 6.8 495.4 1.34 1.371939 7.0 6.3 519.3 1.35 1.221940 7.5 5.9 542.2 1.39 1.101941 7.7 8.4 622.6 1.24 1.351942 6.8 13.8 890.0 0.77 1.551943 7.2 19.4 1182.2 0.61 1.641944 7.8 20.6 1350.0 0.58 1.521945 8.7 23.6 1321.7 0.66 1.781946 14.2 11.3 876.5 1.62 1.281947 15.4 10.4 831.5 1.85 1.251948 13.4 12.8 851.0 1.58 1.501949 13.1 12.5 885.6 1.48 1.411950 12.3 13.3 908.3 1.35 1.461951 15.5 16.9 1037.4 1.49 1.631952 15.4 22.0 1138.7 1.36 1.931953 14.4 26.0 1190.4 1.21 2.181954 14.6 26.3 1178.2 1.24 2.231955 16.3 29.7 1201.8 1.36 2.471956 18.4 31.6 1238.4 1.49 2.551957 20.7 33.8 1294.8 1.60 2.611958 19.4 36.6 1325.6 1.47 2.761959 30.1 35.9 1391.1 2.16 2.581960 30.6 38.7 1433.0 2.13 2.701961 30.7 38.1 1489.4 2.06 2.561962 32.9 39.8 1574.3 2.09 2.531963 34.5 39.8 1642.4 2.10 2.421964 36.6 40.8 1720.1 2.13 2.371965 40.3 42.0 1803.6 2.24 2.331966 43.1 47.4 1916.8 2.25 2.471967 46.5 53.2 2034.8 2.28 2.611968 50.1 54.1 2140.5 2.34 2.531969 51.9 57.5 2212.2 2.35 2.601970 56.5 60.5 2255.4 2.51 2.68

61
1971 60.9 58.8 2313.6 2.63 2.541972 60.5 61.3 2393.7 2.53 2.561973 64.8 59.2 2461.3 2.63 2.411974 69.9 59.2 2522.8 2.77 2.35
% of Output Year
Exports [$US, Billions]
Imports [$US, Billions]
Output of Services [$US, Billions] Exports Imports
1975 74.1 56.6 2612.1 2.84 2.171976 76.3 60.5 2676.9 2.85 2.261977 81.3 63.5 2770.5 2.93 2.291978 88.1 68.1 2874.9 3.06 2.371979 90.8 69.0 2943.3 3.08 2.341980 96.4 67.5 3004.2 3.21 2.251981 106.7 71.3 3062.5 3.48 2.331982 103.7 75.1 3120.0 3.33 2.411983 102.0 81.2 3251.0 3.14 2.501984 111.1 101.6 3341.1 3.33 3.041985 112.4 109.3 3520.8 3.19 3.101986 128.9 110.7 3671.0 3.51 3.011987 141.9 123.6 3797.3 3.74 3.251988 154.8 127.8 3930.9 3.94 3.251989 170.7 134.0 4049.5 4.21 3.311990 188.6 142.7 4170.0 4.52 3.421991 199.9 139.0 4251.2 4.70 3.271992 210.8 135.5 4373.7 4.82 3.101993 217.5 139.4 4457.6 4.88 3.131994 231.1 147.3 4558.3 5.07 3.231995 245.8 152.1 4654.7 5.28 3.271996 263.5 160.5 4765.6 5.53 3.371997 279.2 175.6 4901.2 5.70 3.581998 287.2 195.6 5057.5 5.68 3.871999 303.2 209.2 5245.1 5.78 3.992000 311.9 232.3 5425.6 5.75 4.282001 300.4 231.6 5553.2 5.41 4.172002 306.0 236.5 5693.4 5.37 4.152003 311.2 243.7 5820.7 5.35 4.192004 334.1 267.1 5979.6 5.59 4.472005 354.1 276.7 6139.0 5.77 4.51
Source: BEA website: http://www.bea.gov/bea/dn1.htm (downloaded on May 3rd, 2006)

62
Appendix Table I: Implicit Price Indexes for Goods and Services in U.S. Output, Exports, and Imports, 1929~2005, (2000=100)
Goods Services Output1 Exports Imports Output2 Exports Imports 1929 21.04 20.37 12.61 7.97 8.72 11.871930 20.04 18.23 10.40 7.79 8.72 11.361931 17.37 13.99 8.13 7.36 8.12 10.091932 15.10 12.06 6.38 6.76 7.29 8.551933 14.97 12.62 6.38 6.41 5.53 7.241934 16.42 14.76 7.28 6.40 6.03 8.071935 16.89 15.12 7.40 6.49 6.22 8.221936 16.89 15.49 7.95 6.62 6.83 8.661937 17.47 16.41 8.88 6.83 7.56 9.621938 16.87 15.19 7.96 6.89 8.59 9.931939 16.58 14.85 8.10 6.85 8.89 11.511940 16.79 15.93 8.65 6.86 10.24 12.251941 18.16 17.07 9.28 7.10 12.28 12.251942 20.25 20.78 10.75 7.27 14.44 13.691943 21.70 22.91 11.65 7.51 15.44 14.601944 22.12 26.24 12.44 7.74 16.63 15.031945 22.30 26.14 12.75 8.08 16.24 15.511946 23.97 24.80 14.36 9.41 16.89 16.941947 26.98 29.51 17.63 10.00 17.17 18.931948 28.54 31.41 19.47 10.45 16.98 19.601949 27.99 29.10 18.43 10.78 17.35 19.051950 28.00 28.14 19.94 10.99 17.52 19.091951 30.08 32.26 25.03 11.51 18.45 20.221952 30.52 32.12 23.80 11.88 19.50 20.261953 30.40 31.79 22.78 12.35 20.08 19.391954 30.39 31.34 23.27 12.73 19.86 19.341955 30.37 31.63 23.21 13.17 19.96 19.131956 31.21 32.83 23.66 13.64 20.22 19.391957 32.35 33.90 23.87 14.13 21.49 19.711958 33.12 33.53 22.63 14.60 21.34 19.301959 33.45 33.86 22.79 14.84 20.84 19.541960 33.75 34.08 23.03 15.20 21.57 19.681961 33.96 34.73 22.81 15.51 21.64 20.061962 34.19 34.46 22.27 15.86 22.39 20.321963 34.42 34.35 22.47 16.13 22.40 21.161964 34.69 34.58 23.08 16.53 22.69 21.341965 35.09 35.79 23.19 16.91 23.20 22.081966 35.82 37.01 23.72 17.49 23.63 22.641967 36.71 38.56 23.75 18.14 24.29 22.861968 38.00 39.16 24.07 19.03 25.26 23.301969 39.50 40.37 24.75 20.09 26.31 23.78

63
1970 41.10 42.19 26.43 21.37 26.81 24.621971 42.33 43.32 27.78 22.73 28.58 26.851972 43.31 44.47 29.91 24.01 31.47 28.191973 45.50 51.62 35.26 25.30 32.94 32.611974 49.40 65.32 52.76 27.39 36.74 38.78 Goods Services Output1 Exports Imports Output2 Exports Imports
1975 54.17 72.60 57.18 29.87 39.21 41.921976 56.65 74.46 58.71 32.00 41.58 43.821977 59.31 77.17 64.08 34.39 43.92 46.931978 62.89 81.62 68.36 36.86 47.10 51.201979 67.75 92.40 80.61 39.82 50.77 57.821980 72.51 101.28 101.71 44.02 57.02 67.101981 78.15 108.43 107.38 48.58 61.97 70.011982 81.33 107.19 103.04 52.35 65.73 70.061983 83.41 106.41 98.73 55.46 68.31 68.911984 84.96 107.33 98.05 58.60 69.06 67.731985 86.31 101.96 94.19 61.18 70.94 67.651986 86.52 98.62 92.08 63.35 73.34 75.251987 87.75 101.17 98.65 65.59 74.94 76.321988 89.89 107.69 103.35 68.32 76.45 80.111989 92.59 109.08 106.27 71.34 78.50 79.661990 95.41 108.03 108.18 74.67 82.54 85.681991 98.04 107.91 106.70 77.89 86.69 88.881992 98.62 106.19 106.20 80.77 88.86 91.261993 99.44 105.59 104.95 83.27 90.07 91.871994 100.24 106.72 105.76 85.59 91.21 93.461995 100.58 109.25 108.57 88.05 93.14 96.061996 101.05 106.41 105.87 90.50 94.95 98.051997 101.07 103.50 101.47 92.80 95.86 97.691998 100.29 100.22 95.33 94.71 95.77 95.551999 99.94 98.87 95.46 96.89 96.97 98.632000 100.00 100.00 100.00 100.00 100.00 100.002001 100.65 99.32 97.00 103.10 100.39 100.132002 100.32 98.66 95.29 105.94 100.76 101.882003 99.72 100.64 98.07 109.37 103.24 107.762004 100.17 104.41 102.97 112.98 106.44 113.012005 100.40 107.67 109.54 117.06 111.73 118.20
Note: 1. Output of goods include only final sales. 2. Includes government consumption expenditures, which are for services (such as education and national defense) produced by
government. In current dollars, these services are valued at their cost of production. Source: BEA website: http://www.bea.gov/bea/dn1.htm (downloaded on May 3rd, 2006)
64
References Baldwin, Robert E., and Fukunari Kimura (1998), “Measuring U.S. International Goods and
Services Transactions,” in Robert E. Baldwin, Robert E. Lipsey, and J. David
Richardson, Geography and Ownership as Bases for Economic Accounts, Studies in
Income and Wealth, Vol. 59, Chicago, University of Chicago Press, pp.9-48.
Blomström, Magnus, and Robert E. Lipsey, (1989), “The Export Performance of U.S. and
Swedish Multinationals,” Review of Income and Wealth, Vol. 35, September, pp. 245-
264.
__________________________________ (1993), “The Competitiveness of Countries and their
Multinational Firms,” in Lorraine Eden and Evan. H. Potter, Eds., Multinationals in the
Global Political Economy, London, Macmillan.
Borga, Maria, and Michael Mann (2004), “U.S. International Services: Cross-Border Trade in
2003 and Sales Through Affiliates in 2002,” Survey of Current Business, Vol. 84, No. 10,
Washington, D.C. Bureau of Economic Analysis, October, pp. 25-76.
Cutler, David M., and Ernst Berndt, Editors (2001), Medical Care Output and Productivity,
Studies in Income and Wealth, Vol. 62, Chicago and London, University of Chicago
Press.
Desai, Mihir A., C. Fritz Foley, and James R. Hines, Jr. (2003) “Chains of Ownership, Regional
Tax Competition, and Foreign Direct Investment,” in Heinz Hermann and Robert E.
Lipsey, Editors, Foreign Direct Investment in the Real and Financial Sector of Industrial
Countries, Berlin-Heidelberg, Springer-Verlag, pp.61-98.
Dreher, Axel, and Panu Poutvaara (2005), “Student Flows and Migration: An Empirical
Analysis,” Center for Economic Studies & Ifo Institute for Economic Research CESifo

65
Working Paper No. 1490 and Institute for the Study of Labor IZA , IZA Discussion Paper
No. 1612.
Eastern Caribbean Central Bank (2004), Balance of Payments for Year Ending December 2003,
Basseterre, St. Kitts.
Friedenberg, Howard L., and Richard M. Beemiller (1997), “Comprehensive Revision of Gross
State Product by Industry,” Survey of Current Business, Vol. 77, No. 6, June, pp. 15-41.
Griliches, Zvi (1992), Output Measurement in the Service Sectors, Studies in Income and
Wealth, Vol. 56, Chicago and London, University of Chicago Press.
Hines, James R., Jr. (2005), “Do Tax Havens Flourish?” in James M. Poterba, Editor, Tax Policy
and the Economy 19, Cambridge, MA, MIT Press, pp. 65-99.
International Monetary Fund (1991), International Financial Statistics Yearbook, Washington,
DC, International Monetary Fund.
_______________________ (1993), Balance of Payments Manual, 5th Edition, Washington, DC,
International Monetary Fund.
_______________________ (2004), Balance of Payments Statistics Yearbook, 2004, Part 1,
Country Tables, Washington, DC, International Monetary Fund.
_______________________ (2006), Balance of Payments Yearbook CD-ROM, Washington,
DC, International Monetary Fund.
Julius, DeAnne (1990), Global Companies and Public Policy: The Growing Challenge of Foreign
Direct Investment, New York, NY, Council on Foreign Relations Press.
Karreman,Herman F. (1961), Improving World Transportation Accounts, Technical Paper 15,
New York, N.Y., National Bureau of Economic Research.

66
Khatchadourian, Kelly, and Alice Wiesner (2006), “International Price Program’s (IPP’s)
Services Price Indexes,” Paper for CRIW Conference on International Service Flows,
Bethesda, MD, April 28-29.
Kimura, Fukunari, and Robert E. Baldwin (1998), “Applicability of a Nationality-Adjusted Net
Sales and Value-Added Framework: The Case of Japan,” in Robert E. Baldwin, Robert E.
Lipsey, and J. David Richardson, Editors, Geography and Ownership as Bases for
Economic Accounting, Studies in Income and Wealth, Vol. 59, Chicago, University
Press, pp. 49-82.
Knauth, Oswald W. (1923), Distribution of Income by State in 1919, New York, National
Bureau of Economic Research.
Landefeld, J. Steven, Obie G. Whichard, and Jeffrey H. Lowe (1993), “Alternative Frameworks
for U.S. International Transactions,” Survey of Current Business, Vol. 73, No. 12,
December, pp. 50-61.
Leven, Maurice (1925), Income in the Various States: Its Sources and Distribution in 1919,
1920, and 1921, New York, National Bureau of Economic Research.
Lipsey, Robert E., and Irving B. Kravis (1985), “The Competitive Position of U.S.
Manufacturing Firms,” Banca Nazionale del Lavoro Quarterly Review, 153, June, pp.
127-154.
_________________________ (1987), “The Competitiveness and Comparative Advantage of
U.S. Multinationals, 1957-84,” Banca Nazionale del Lavoro Quarterly Review, 161,
June, pp. 147-165.
_________________________ (1992), “Sources of Competitiveness of the United States and its
Multinational Firms,” Review of Economics and Statistics, Vol. 64, May, pp. 193-201.

67
Marshall, Alfred (1923), Money, Credit, and Commerce. Reprinted by Augustus M. Kelley,
New York, 1965.
Meade, J.E. (1951), The Theory of International Economic Policy: Vol. 1, The Balance of
Payments, London, Oxford University Press.
Mohammed, Saif Shah, and Jeffrey G. Williamson (2004), “Freight rates and productivity gains
in British tramp shipping 1869-1950,” Explorations in Economic History, Vol. 41, pp.
172-203.
National Research Council, Panel on Foreign Trade Statistics (1992), Behind the Numbers: U.S.
Trade in the World Economy, Edited by Anne Y. Kester, Washington, D.C., National
Academy Press.
National Science Foundation (1998a), International Mobility of Scientists and Engineers to the
United States—Brain Drain or Brain Circulation? Division of Science Resources Studies
Issue Brief, Washington, DC, Directorate for Social, Behavioral, and Economic
Sciences, June.
_______________________ (1998b), Statistical Profiles of Foreign Doctoral Recipients in
Science and Engineering: Plans to Stay in the United States, Washington, DC, Division
of Science Resources Studies, Directorate for Social, Behavioral, and Economic
Sciences, November
_______________________ (2006), Science and Engineering Indicators, 2006, Washington,
DC, Division of Science Resources Studies, Directorate for Social, Behavioral, and
Economic Sciences.
Nephew, Erin, Jennifer Koncz, Maria Borga, and Michael Mann (2005), “U.S. International
Services: Cross-Border Trade in 2004 and Sales Through Affiliates in 2003,” Survey of

68
Current Business, Vol. 85, No. 10, Washington, D.C., Bureau of Economic Analysis,
October, pp. 25-77.
North, Douglass C. (1958), “Ocean Freight Rates and Economic Development, 1750-1913,”
Journal of Economic History, December.
_______________. (1960), “The United States Balance of Payments, 1790-1860,” in Trends in
the America Economy in the Nineteenth Century, Studies in Income and Wealth, Vol. 24,
Princeton, Princeton University Press, pp. 573-627.
Obstfeld, Maurice, and Kenneth Rogoff (1996), Foundations of International Macroeconomics,
Cambridge, MA., and London, MIT Press,
OECD (2001), Trade in Goods and Services: Statistical Trends and Measurement Challenges, by
Andreas Lindner, Bill Cave, Lydia Deloumeaux, and Joscelyn Magdeleine, Statistics
Brief, No. 1, Paris, October.
Sauers, Renee M., and Kelly K. Pierce (2005), “U.S. International Transactions: First Quarter of
2005,” Survey of Current Business, Vol. 85, No. 7, July,pp. 72-121.
Simon, Matthew (1960), “The United States Balance of Payments, 1861-1900,” in Trends in the
American Economy in the Nineteenth Century, Studies in Income and Wealth, Vol. 24,
Princeton, Princeton University Press, pp. 629-711.
United Nations (2002), National Accounts Statistics: Main Aggregates and Detailed Tables,
2000, New York, United Nations.
_____________ (2004), International Merchandise Trade Statistics Compilers Manual,
Department of Economic and Social Affairs, Statistics Division, New York, United
Nations.

69
U.S. Bureau of the Census (1975), Historical Statistics of the United States, Colonial Times to
1970, Washington, DC, U.S. Government Printing Office.
U.S., Bureau of Economic Analysis (2004), U.S. Direct Investment Abroad: Final Results from
the 1999 Benchmark Survey, Washington, D.C. U.S. Government Printing Office, April.
_____________________________ (2006), “An Ownership-Based Framework of the U.S.
Current Account, 1993-2004,” Survey of Current Business, Vol. 86, No. 1, January, pp.
43-45.
U.S. Congress, Office of Technology Assessment (1986), Trade in Services: Exports and Foreign
Revenues-Special Report, OTA-ITE-318, Washington, D.C. U.S. Government Printing
Office, September.
U.S. Department of Commerce (1990), The Balance of Payments of the United States: Concepts,
Data Sources, and Estimating Procedures, Washington, DC, Bureau of Economic
Analysis, May.
U.S. Review Committee for Balance of Payments Statistics (1965), The Balance of Payments
Statistics of the United States: A Review and Appraisal, Report of the Review Committee
for Balance of Payments Statistics to the Bureau of the Budget, Washington, DC, April.
Whichard, Obie G., and Maria Borga (2002), “Selected Issues in the Measurement of U.S.
International Services,” Survey of Current Business, Vol. 82, No. 6, June, pp. 36-56.
Wilkins, Mira (1989), The History of Foreign Investment in the United States to 1914,
Cambridge, MA and London, Harvard University Press.
Woolley, Herbert B. (1966), Measuring Transactions Between World Areas, New York, National
Bureau of Economic Research.
Related Documents


